Automatic fruit recognition: A survey and new results ... SCI... · Automatic fruit recognition: A...
32
1 Pattern Recognition, 32 (10), pp. 1719-1736, 1999 Automatic fruit recognition: A survey and new results using Range/Attenuation images A.R. Jiménez 1 , A.K. Jain 2 , R. Ceres 1 and J.L. Pons 1 1 Instituto Automática Industrial (CSIC), 28500 Arganda del Rey, Madrid. Spain. 2 Department of Computer Science. Michigan State University, East Lansing (MI). USA. Antonio Ramón Jiménez Ruiz. Instituto de Automática Industrial. CSIC. Ctra. N-III Km. 22.8 La Poveda. 28500 Arganda del Rey. Madrid. Spain. Tel: 34-91-8711900 Fax: 34-91-8717050 e-mail: [email protected] http://www.iai.csic.es/lopsi
-
Upload
nguyenhuong -
Category
Documents
-
view
215 -
download
0
Transcript of Automatic fruit recognition: A survey and new results ... SCI... · Automatic fruit recognition: A...
1
Pattern Recognition, 32 (10), pp. 1719-1736, 1999
Automatic fruit recognition: A survey and new results using
Range/Attenuation images
A.R. Jiménez1, A.K. Jain
2, R. Ceres
1 and J.L. Pons
1
1 Instituto Automática Industrial (CSIC), 28500 Arganda del Rey, Madrid. Spain.
2 Department of Computer Science. Michigan State University, East Lansing (MI). USA.
Antonio Ramón Jiménez Ruiz.
Instituto de Automática Industrial. CSIC.
Ctra. N-III Km. 22.8 La Poveda.
28500 Arganda del Rey.
Madrid. Spain.
Tel: 34-91-8711900 Fax: 34-91-8717050
e-mail: [email protected]
http://www.iai.csic.es/lopsi
2
SUMMARY
A review of different vision systems to recognize fruits for automated harvesting is
presented. This survey of recent works in this field should be useful to researchers in this
interesting area. Current research proves the feasibility of practical implementations of these
computer vision systems for the analysis of agricultural scenes to locate natural objects under
difficult conditions. Some basic considerations about the distributions and characteristics of
the fruits in natural orange crops are discussed.
The research reported here explores the practical advantages of using a laser-rage
finder sensor as the main component of a 3-dimensional scanner. This sensor supplies two
sources of information, the range to the sensed surface and the attenuation occurred in the
round-trip travel. A model of the attenuation process is presented and used to restore images
and to derive additional information: reflectance, apparent reflectance, range precision and the
range standard deviation. The apparent reflectance image and the range image are used to
recognize the fruit by color and shape analysis algorithms. The information obtained with both
the methods is merged to find the final fruit position. The 3-dimensional information with its
precision, the size and the average reflectance of the image is the final information obtained
for every fruit. This information allows a selective harvesting to improve the quality of the
final product for the fresh fruit market.
Some experimental results are presented showing that approximately 74% of the green
fruits are detected and this correct location rate is improved as the amount of mature fruits in
the scene increases, reaching a 100% of correct detection over the visible fruits. No false
detections were found in the test images used. Future work could be directed to extract more
shape information from the range image to improve the detection results. The integration of
the recognition methods with the AGRIBOT harvesting system will be reported in future
publications.
3
ABSTRACT
An automatic fruit recognition system and a review of previous fruit detection work
are reported. The methodology presented is able to recognize spherical fruits in natural
conditions facing difficult situations: shadows, bright areas, occlusions and overlapping fruits.
The sensor used is a laser range-finder giving range/attenuation data of the sensed surface.
The recognition system uses a laser range-finder model and a dual color/shape analysis
algorithm to locate the fruit. The 3-dimensional position of the fruit, radius and the reflectance
are obtained after the recognition stages. Results for a set of artificial orange tree images and
real-time considerations are presented.
KEY WORDS
Range Images, Shape Recognition, Contour Extraction, Circular Hough Transform,
Agriculture.
INTRODUCTION
Automatic Vision Systems in Agriculture
The use of computers to analyze images (1)
has many potential applications for
automated agricultural tasks. But, the variability of the agricultural objects makes it very
difficult to adapt the existing industrial algorithms to the agricultural domain. The agricultural
systems must support this flexibility, and methods for including domain knowledge in
algorithms should be studied as a rational way to cope with this variability.
There are many processes in agriculture where decisions are made based on the
appearance of the product. Applications for grading the fruit by its quality, size or ripeness are
based on its appearance, as well as a decision on whether it is healthy or diseased. Humans are
easily able to perform intensive tasks like harvesting and pruning using basically the visual
sensory mechanism. This suggests that a system based on a visual sensor should be able to
emulate the interpretation process of the human visual recognition system.
The current areas of image analysis research in agriculture can be classified into two
main groups: Research tools and Decision-making (Fig.1) (2)
. The first group of image analysis
systems includes applications like plant growth monitoring, morphometry of new cultivars or
biological cell counts. This type of tool allows a researcher to efficiently gather the data
automatically. The user monitors the performance of the system and can intervene when the
system misinterprets an image. These image processing tools also allow features to be
measured automatically which would be too time-consuming to do manually. The second
group of image analysis systems must provide information to guide the mechanical
equipment. Such systems support two different groups of applications, Grading and
Guidance. The use of image processing for grading is being applied to many products,
including oranges, potatoes, apples, carrots, green peppers, tomatoes and peaches. The grading
may be for size and shape, color, or the presence of defects. Current guidance research
includes harvesting oranges, tomatoes, mushrooms, apples, melons and cucumbers. The
guidance research also focuses its attention on navigating robot vehicles using machine vision
strategies or other simple sensors in order to obtain autonomous mobile capabilities.
4
The techniques used in the above applications are successful under the constrained
conditions for which they were designed, but the algorithms are not directly usable in other
applications. In principle, computers are flexible because they can be re-programmed, but in
practice it is difficult to modify the machine vision algorithms to run for a slightly different
application because of the assumptions made to achieve robustness and speed for a specific
application (3)
.
Robotic Harvesting
The automatic harvesting of citrus has been done entirely by hand and the cost of this
labor fluctuates around 25% (4)
, 30% (5)
and 33% (6)
of the total production costs. So, an
efficient robotic system could reduce the production costs significantly and this is one of the
reasons why the use of an automated robotic system for harvesting is so attractive. The other
reason is to improve the quality of the fruit that would make the product more competitive.
The configuration of the trees significantly alters the percentage of visible fruits in the
tree. For tree row configurations, with a hedge appearance, the visibility of the fruit can reach
75%-80% of the actual number of fruits (4)
, which is much better than the 40%-50% of
visibility for conventional plantings. So, a reconfiguration of the crops should be considered
in order to reach the degree of profitability expected when automating a harvesting task.
There are several techniques used for the harvesting of fruits which are not appropriate
for the fresh fruit market due to the damage caused to the fruit during its collection. These
techniques include the shaking of tree limbs or tree trunks, oscillating forced-air removers and
the complementary chemical treatment. Fruits are usually bruised when striking limbs during
the landing. So, there is a need for a non-aggressive method to perform the harvesting of fruits
as delicately as possible. The manual picking is the most delicate way to perform the
harvesting, but it is expensive and time consuming.
The use of robots to pick tree fruits was first proposed by Schertz and Brown (7)
in a
review of mechanical citrus harvesting systems. The basic concepts of robotic harvesting were
established in this paper. One of these concepts was the line-of-sight approach to fruit picking.
This consists of the following three steps: 1) to visually locate the fruit with an optical sensor,
2) to guide the fruit detachment device along the line of sight to the fruit, and 3) to actuate the
device when the fruit is contacted. A robotic system based on the Schertz approach consisting
of a simple robotic arm, a B/W TV camera and a control computer was built for the harvesting
of apples (8)
. The TV camera was used to locate the fruit attached to an artificial canopy. The
control computer directed the robot arm along the line-of-sight to the targeted fruit until a
contact was made by a mechanical whisker. No detachment device was implemented.
D’Esnon and Rabatel (9)
presented the first version of the apple picking robot, known
as MAGALI. The robot consisted of a hollow tube mounted in a vertical support frame.
Attached to the end of the tube was a rotating cup end-effector used to detach a fruit from a
simulated apple tree canopy. The hollow tube could slide in and out, rotate left and right, and
move up and down the support frame. A B/W camera was attached to the support frame to
detect the fruit. When the fruit was detected, the tube was aligned with the fruit. The tube
would extend out until a contact with the fruit was detected by a reflectance sensor in the end-
effector. The cup would rotate behind, cutting the stem and allowing the detached fruit to roll
down the hollow tube into a collection bin.
Other extensive research has been directed at using robots for a variety of agricultural
harvesting tasks: grapes (10)
(11)
, asparagus (12)
, cucumbers (13)
, mushrooms (14)
and apples (15)
.
5
Kawamura investigated the harvesting of tomatoes and used a stereoscopic vision system to
obtain the 3-dimensional location (16)
.
A second version of the MAGALI robot was constructed in 1986 (17)
. The new design
included a spherical manipulator, a camera at the center of the rotation axes and a vacuum
grasper. MAGALI is a hydraulically actuated vehicle, self-propelled and totally self-guided in
the pathways by four ultrasonic telemeters.
An Italian company, AID Catania, designed and built a prototype of a citrus harvesting
autonomous robot with a single arm, driven by a vision system which was operated both in the
laboratory and in the orange grove (5)
(18)
. This robot has a cylindrical coordinate electrical
driven arm which supports a goal-oriented smart end-effector. The end-effector is made of a
mobile helix and a fixed cylinder. An infrared proximity sensor indicates that the orange is at
the right distance. Approximately 65% of the located fruits were successfully detached. The
authors also presented their plans to develop a multi-arm robot for automatic picking of
oranges, but no more references were found about this research.
Harrell presents the design of a citrus picking robot CPR (19)
. The robot consists of a
single arm with a spherical coordinate system whose joints are actuated by servo hydraulic
drives. The rotating-lip picking mechanism (PM) includes, in a small cavity at the end of the
arm, a CCD video camera, an ultrasonic ranging transducer to provide distance information to
objects in front of the PM, light sources and the rotating lip to cut the stem of the fruit.
The Japanese company, Kubota (20)
developed a fruit-picking robot which uses a
mobile platform to approximate a small four degrees-of-freedom manipulator to the
detachment area. The gripper had a mobile vacuum pad to capture the fruit and to direct it
towards a cutting device, an optical proximity sensor, a stroboscope light and a color camera,
with everything protected by a fork-shaped cover.
The Spanish-French CITRUS project to harvest oranges, includes an agronomical
study, the development of a visual system to locate the fruit, the design and control of a
harvesting arm , the integration of the grasping and cutting device and the field test (3)
. There
are two versions of the robot: one with cylindrical coordinate system and a more sophisticated
version with spherical coordinates. This second version is the same robot used in the second
design of the MAGALI fruit harvester. The grasping method used is based on a vacuum
sucker and to detach the fruit, a spinning movement is used.
For the harvesting of apples, the AUFO robot was developed at the Central Enterprise
for the Organization of Agriculture and Food Industry (15)
. This robot was designed to use 6
arms with a movement in a vertical plane due to the use of only two horizontal axes per arm.
To sweep the whole volume of the tree, the robot platform is moved around the tree by small
angular shifts. The position of the apples is computed by a triangulation technique using two
color cameras.
The harvesting of melons was studied and a prototype harvester was constructed to
selectively harvest these fruits (21)
(22)
(23)
. The system consists of a robot with a Cartesian
manipulator mounted on a frame moved by a tractor. The robot vision system is used to locate
the melons and to guide the attaching device toward the fruit.
Stepanov presents a review of different robotic systems developed in Russia under
different projects (24)
. The MAVR-1 is an autonomous grape robot, the MOP-1 is a vegetable
harvesting robot to harvest melons, pumpkins and cabbage and the MIIP-1 is a fruit picking
robot to collect oranges and apples.
6
The AGRIBOT is a Spanish project (25)
to harvest fruits with the help of a human
operator who has the main responsibility of the fruit detection task. The operator using a
joystick moves a laser pointer until the laser spot is in the middle of the fruit. The 3-
dimensional coordinates are recorded and the parallelogram manipulator is controlled toward
the fruit. A gripper system based on a pneumatic attaching device and an optical proximity
sensor is used to detach the fruit.
Nowadays, the harvesting of agricultural products is limited to crops which ripen at the
same time and which do not need individual or delicate treatment (26)
. Selective harvesting
could increase the efficiency of production, and improve the fruit quality.
Fruit Detection Review
One major difficulty in developing machinery to selectively harvest fruits is to
determine the location, size and ripeness of individual fruits. These specifications are needed
to guide a mechanical arm towards the object. The computer vision strategies used to
recognize a fruit rely on four basic features which characterize the object: intensity, color,
shape and texture. In the following paragraphs, a review of different approaches is presented.
This review is sorted chronologically in order to understand the evolution of research in this
area.
Schertz and Brown suggested that the location of fruits might be accomplished by
photometric information, specifically by using the light reflectance differences between leaves
and fruits in the visible or infrared portion of the electromagnetic spectrum (7)
. Gaffney
determined that "Valencia" oranges could be sorted by color using a single wavelength band
of reflected light at 660 nm (27)
. This technique was capable of distinguishing between normal
orange, light orange and green fruits.
The first computer vision system for detecting apples consisted of a B/W camera and
an optical red filter, and used the intensity data to perform the analysis (8)
. In the first step, a
thresholding is done to obtain a binary image. This binary image is smoothed to eliminate
noise and irrelevant details in the image. Finally, for each of the segments, the difference
between the lengths of the horizontal and vertical extrema are computed. So, a roundness
measure is obtained as well as the centroid and radius values. Then, the density of the region
is computed by placing a window, whose size is determined by the mean value of the extrema,
on the centroid. If the density of the region is found to be greater than a preset threshold, the
region is accepted as an apple.
Grand D'Esnon developed a vision system, for the MAGALI robot, to detect apples
using a color camera (17)
. An analog signal processing system was able to select points of a
given color within the image. But, this vision system required a protective covering to get a
dark background. In the second version of this system, three color cameras were used with
different optical filters. A more detailed description of this new version is given by Rabatel (28)
. The vision system is based on the analysis of three spectrum bands chosen after a spectro-
photometric study in the visible and close infra-red bands. The three color CCD cameras and
the three different filters (950, 650 and 550 nm) are used to obtain three intensity images.
Some ratio features (with reference to the image filtered at 950nm) are used to decide which
pixels belong to a fruit or to a leaf. After a preliminary study based on the spectral properties
of the apple tree’s leaves and the apples (Golden Delicious (yellow-green), Red Delicious and
Granny Smith (green)), it was possible to recognize even the green mature apples. The
extension of this work to other varieties of apples or fruit trees involves individual spectral
7
studies for each recognition problem. No quantitative data is presented but the authors declare
that not all the fruits are recognized and there are failures in the detection. Using a similar
technique, the harvesting of tomatoes with machine vision was investigated by Kawamura (29)
.
Whitaker presents a system to recognize and locate green tomatoes in a natural setting
(6). An intensity image with 256 gray levels is used. The analysis is not based on the intensity
level, but uses shape information. The Circular Hough Transform (CHT) is applied to a binary
edge and direction images. The results obtained are very sensitive to the user-specified
threshold value, and the best results for a 99% threshold value are 68% correct detection and
42% false detection. The contour of the leaves is one of the major problems, since the analysis
algorithm interprets them as possible fruits. The authors recognized that, at that time, the
algorithm was computationally intensive on a serial processor and can not be performed in
real time.
The AID robot vision system was implemented to recognize oranges by preprocessing
the color image with an electronic filter and locating the fruits by recognizing distributions of
the orientation of maximum gradients (5)
. A color camera with an artificial lighting is used. An
analog electronic filter enhances the image and during digitization, 6 bits are used to codify
the pixel value which is proportional to the closeness of the actual pixel hue to a preset
reference hue. With this pseudo-gray image, a gradient image and a direction image are
computed using the Sobel operator. Finally, the scene interpretation is done through searching
for a match with an object model previously stored. This gradient direction template is moved
step by step throughout the direction image. Approximately 70% of the visually recognizable
fruits were detected. This was one of the first studies that attempted to recognize spherical
forms in the image, in this case through the orientation of gradients. This technique was also
used, together with a method of segmentation by region growing and a search for spherical
patterns (30)
.
Slaughter and Harrel (31)
introduced a method to locate mature oranges based on color
images. This system uses the Hue and Saturation components of each pixel obtained using a
color camera and artificial lighting. So, there is a two-dimensional feature space and two
thresholds are employed based on the maximum and minimum values for the saturation and
the hue components. This leads to a linear classifier that can be displayed as a square region in
the feature plane. Approximately 75% of the pixels were correctly classified. This algorithm
(in software) took 2.5 seconds/image and the authors suggested a hardware implementation to
increase the performance.
Sites (32)
presents a system to recognize ripe apples and peaches. This intensity-based
method uses a B/W camera and color filters (630 to 670 nm) to increase the contrast between
the fruits and the background. Artificial light is used and most of the images are recorded
under night operation. The whole method can be divided into five step: 1) thresholding based
on a constant 37% value, 2) smoothing by a binary filter, 3) segmentation by an 8-neighbor
connected component labeling, 4) feature extraction (area, perimeter, compactness,
elongation), and finally 5) classification by a linear decision function or a nearest-neighbor
method. Classification results around 89%-90% are obtained working at night and for mature
fruits. During the day, an 84% classification accuracy is declared and at least 20% of false
detections. Analysis of the preliminary tests resulted in the selection of a 4.5 mm2/pixel field
of view resolution, which was able to provide the necessary geometric details.
Slaughter and Harrel (33)
extended their earlier study by using the RGB components
recorded by a color camera as features and a traditional Bayesian classifier method to segment
the fruit pixels from the background pixels. So, each pixel has three components (R,G,B) and
8
each of them is classified as belonging to a fruit or to the background. No artificial lighting or
optical filters are used. The tests show that 75% of the pixels are correctly classified. Harrel
et al. (34)
present a method to estimate the size and position of the fruit region which contained
an initial valid pixel.
Texture can also be used to segment objects of interest from the background. Some
fruits have textures different from their leaves, some are smooth while others are rough.
Texture analysis has been used and might be a way to locate some specific fruits (35)
.
The European Eureka Project CITRUS ROBOT, involving both “Instituto Valenciano
de Investigaciones Agrarias” (Valencia, Spain) and CEMAGREF (Montpellier, France),
investigated the robotic harvesting of oranges (4)
. Several techniques for the vision system
were developed, but none of them was able to recognize non-mature fruits. Three
methodologies were used. In the first one, a B/W camera in conjunction with a red filter
(630nm) and two synchronized flashlights were employed to obtain a uniformly illuminated
scene which is as much independent as possible of the environmental conditions. With the use
of a fast thresholding algorithm, 80% of the visible fruits were detected but a high rate of
failures was found. In the second approach, two B/W cameras instead of one, and two red and
green filters (630 nm and 560 nm) for each camera were utilized. Computing the ratio
between the gray levels of both the images, the threshold method works and is independent of
the luminosity level (the two flashlights are also used here). Approximately 80% of the fruits
were successfully detected and approximately 10% were false detections. Finally, in the third
experiment, they used a color camera without artificial illumination. Each pixel with its three
RGB components is considered a pattern and a Bayesian classifier is used, similar to the
method presented by Slaughter and Harrel (33)
(34)
. Success and the failure rates of
approximately 90% and 5%, respectively, for the visible fruits were reported. Theses results
were not completely satisfactory since these performance indices are only valid for mature
fruits and the three vision systems presented do not cope with green oranges.
A vision system for the harvesting of melons has been investigated under a close
collaborative research between the Purdue University (USA) and The Volcani Center (Israel).
In the first attempt (36)
, a B/W camera is used to obtain intensity images of the melon crop.
The vision technique is divided into two steps. First, there is an analysis step to identify the
melon and its position and size; this first stage performs an image enhancement, a
thresholding, a parameter extraction and hypothesis generation. Shape and texture parameters
in the neighborhood of the hypothesized position are computed to obtain the final candidates.
The second stage performs a knowledge-directed evaluation using rules which allow to avoid
noisy detections and to eliminate multiple occurrences. If the second step is not employed,
approximately 89% of success and relatively high rates of false detections are found, but when
using the knowledge-based rules, 84% and 10% rates are obtained, respectively.
The AUFO project, for the harvesting of apples, includes a stereo vision system that
uses two color cameras separated by a certain distance and having a converging position (15)
.
Firstly, there is a segmentation of both images based on a threshold value. The regions
obtained are grouped and the mean position per region obtained. For all the possible pairs of
segments between both images, the three-dimensional position is computed. The technique
used to compute the position is a simple triangulation algorithm divided in two steps. The first
step gives the X-Y position using the projection on the X-Y horizontal plane and the second
step computes the heights or Z coordinates from each camera viewpoint. If the difference
between this heights is lower than 40 mm, then an object is considered to be present. Only
41% of the visual fruits are detected correctly and some false detections appear.
9
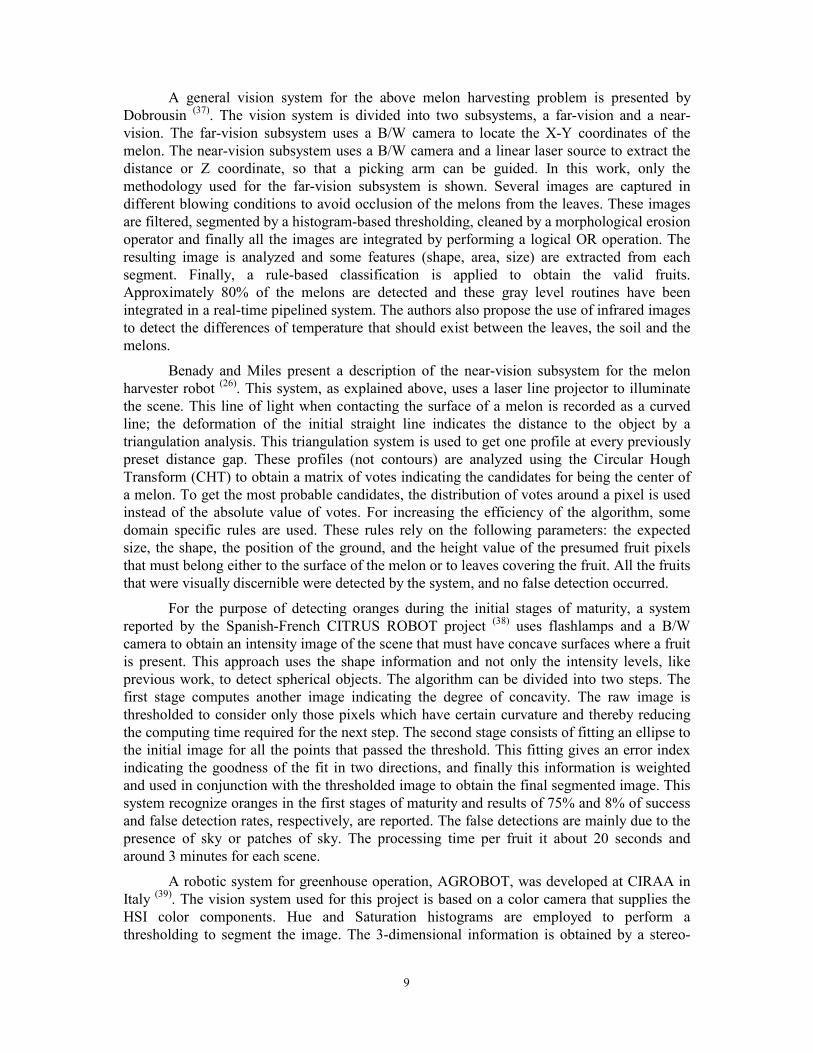
A general vision system for the above melon harvesting problem is presented by
Dobrousin (37)
. The vision system is divided into two subsystems, a far-vision and a near-
vision. The far-vision subsystem uses a B/W camera to locate the X-Y coordinates of the
melon. The near-vision subsystem uses a B/W camera and a linear laser source to extract the
distance or Z coordinate, so that a picking arm can be guided. In this work, only the
methodology used for the far-vision subsystem is shown. Several images are captured in
different blowing conditions to avoid occlusion of the melons from the leaves. These images
are filtered, segmented by a histogram-based thresholding, cleaned by a morphological erosion
operator and finally all the images are integrated by performing a logical OR operation. The
resulting image is analyzed and some features (shape, area, size) are extracted from each
segment. Finally, a rule-based classification is applied to obtain the valid fruits.
Approximately 80% of the melons are detected and these gray level routines have been
integrated in a real-time pipelined system. The authors also propose the use of infrared images
to detect the differences of temperature that should exist between the leaves, the soil and the
melons.
Benady and Miles present a description of the near-vision subsystem for the melon
harvester robot (26)
. This system, as explained above, uses a laser line projector to illuminate
the scene. This line of light when contacting the surface of a melon is recorded as a curved
line; the deformation of the initial straight line indicates the distance to the object by a
triangulation analysis. This triangulation system is used to get one profile at every previously
preset distance gap. These profiles (not contours) are analyzed using the Circular Hough
Transform (CHT) to obtain a matrix of votes indicating the candidates for being the center of
a melon. To get the most probable candidates, the distribution of votes around a pixel is used
instead of the absolute value of votes. For increasing the efficiency of the algorithm, some
domain specific rules are used. These rules rely on the following parameters: the expected
size, the shape, the position of the ground, and the height value of the presumed fruit pixels
that must belong either to the surface of the melon or to leaves covering the fruit. All the fruits
that were visually discernible were detected by the system, and no false detection occurred.
For the purpose of detecting oranges during the initial stages of maturity, a system
reported by the Spanish-French CITRUS ROBOT project (38)
uses flashlamps and a B/W
camera to obtain an intensity image of the scene that must have concave surfaces where a fruit
is present. This approach uses the shape information and not only the intensity levels, like
previous work, to detect spherical objects. The algorithm can be divided into two steps. The
first stage computes another image indicating the degree of concavity. The raw image is
thresholded to consider only those pixels which have certain curvature and thereby reducing
the computing time required for the next step. The second stage consists of fitting an ellipse to
the initial image for all the points that passed the threshold. This fitting gives an error index
indicating the goodness of the fit in two directions, and finally this information is weighted
and used in conjunction with the thresholded image to obtain the final segmented image. This
system recognize oranges in the first stages of maturity and results of 75% and 8% of success
and false detection rates, respectively, are reported. The false detections are mainly due to the
presence of sky or patches of sky. The processing time per fruit it about 20 seconds and
around 3 minutes for each scene.
A robotic system for greenhouse operation, AGROBOT, was developed at CIRAA in
Italy (39)
. The vision system used for this project is based on a color camera that supplies the
HSI color components. Hue and Saturation histograms are employed to perform a
thresholding to segment the image. The 3-dimensional information is obtained by a stereo-
10
matching of two different images of the same scene. About 90% of the ripe tomatoes are
detected and the most frequent errors are due to occlusions.
There is a study for the recognition of partial circular shapes which was tested for the
detection of broken biscuits in sorting applications (40)
. In this work also, the technique is
applied to the recognition of oranges in a tree using a color camera. Since the oranges are
mature and the leaves are green, the image has enough contrast to apply an edge detection
procedure and a contour image is obtained. The technique presented can be divided in two
steps: an initial segmentation of contours obtaining groups of pixels with constant curvature,
and a second step of contour segment grouping to obtain circle candidates and their
parameters (radius, center and ratio of visible contour). The method works very well when a
good contour image is obtained, like in the biscuit application, but there are serious problems
for the detection of fruits since the contour due to the occlusion of an orange by another
orange or by a leaf generates false candidates.
A major problem in segmenting intensity or gray level images lies in the selection of
the threshold value that distinguishes an object from the background (41)
. This value depends
on the illumination of the scene and there is no a priori knowledge about it because the
illumination conditions can vary randomly. For instance, a fruit in the sun appears ten times
brighter than a leaf in the sun, a fruit in the shade appears four times dimmer than the leaf in
the sun.
Most of the above vision systems give the 2-dimensional position of the fruits. The
third dimension about fruit location is usually obtained by moving the gripping device
throughout the line-of-sight until the presence of the fruit is detected. This detection is
performed using different sensors like touch sensors (8)(17)
or ultrasonic sensors (31)
(33)
(34)
.
Some approaches use stereoscopic vision to indirectly compute the position of the fruit (16)
(15)
(39)
. The use of a sensor which directly gives the 3-dimensional information reduces the
computing time required to perform a stereoscopic matching or simplify the task of directing
the robot arm towards the fruit. In this sense, the only approach using a 3-D measurement
system was presented for the harvesting of melons (26)
, but it was necessary to use a traditional
camera-based stage to obtain the X-Y coordinates due to the small field of view of the 3-D
sensor.
OBJECTIVES
The main objective of this research is to develop an image analysis system capable of
locating near-spherical fruits (oranges, apples, peaches) in natural tree scenes while meeting
the following requirements:
1) The system should be able to recognize and locate both ripe and close-to-leaf-color fruits
(green fruits).
2) The method should be applicable in situations where certain areas of the fruit are not
visible due to partial occlusion by leaves or by overlapping fruits.
3) The system should be robust enough for operating in the presence of difficult conditions
like bright sun reflections, shadows, variable lighting conditions, night operation and
small noisy patches of sky in the background.
4) The system output must supply the 3-dimensional position, the approximate size of the
fruit and an index indicating the degree of ripeness of the fruit. This information allows a
robot harvester to perform selective harvesting.

11
5) The algorithms must operate in real-time on a general purpose sequential processor with
the support of special image processing boards. A processing time of 1 second per fruit is
considered to be acceptable.
METHODOLOGY
A general data flow of the fruit recognition system is given in Figure 2. The natural
scene is sensed and digitized by a three-dimensional scanner. This sensor which will be
described in the next section, gives the spherical coordinates of each scene point as well as a
value indicating the attenuation of the laser energy due mainly to the distance, the surface type
and orientation of the sensed surface. So, for each full scan, four digital images are obtained.
Two images represent the azimuth and elevation angles (AZ(x,y) and EL(x,y)), the distance or
range is included in RANG(x,y) and the attenuation is in ATTE(x,y). As can be seen, no natural
lighting shadows appear since an active sensor is used and the laser beam is, in this case, the
light source.
After the above image extraction, an image processing and generation process is
carried out. An image enhancement technique is applied to the RANG(x,y) and ATTE(x,y) to
increase the quality of these images. But the most interesting aspect is based on the sensor
model previously computed using a set of different kinds of surfaces at different distances and
orientations. This model allows us to know the reflectance of the surface, which only depends
on the type of surface, but not on the distance and orientation of the sensor with respect to the
sensed objects. So, the reflectance image REFL(x,y) theoretically give us an image whose
pixel values depend only on the energy absorbing ability of the object surface. This image
could be used as an ideal one, but the need for computing the surface normal with high
precision at each pixel, leads to a noisy image when non-soft surfaces are present.
The same model permits to obtain another image AREF(x,y) (apparent reflectance),
which does not require the estimation of the surface normal. This image is similar to an
intensity image obtained with a TV-camera using a red filter and also utilizing a high power
lighting system placed along the axis of the camera. But, our AREF(x,y) image has an
advantage over the former image; based on the scene knowledge, distances to valid sensed
points are known, and so high value pixels can be rejected if they are outside this range. With
this knowledge-based image transformation, AREF(x,y) is not perturbed by patches of sky,
objects far away or points belonging to the soil. So, the AREF(x,y) image can only be
compared with images obtained after a classification has been done to distinguish between the
objects and the background, using color TV-cameras and artificial illumination. Finally, we
can conclude that the AREF(x,y) image has a quality at least as good as the best TV-images
which we have been able to obtain.
The image analysis process uses three input images RANG(x,y), ATTE(x,y) and
REFL(x,y) to detect the position of the fruit (Pos(x,y)), its approximate radius (Rad), the
distance from the origin of the 3-D scanner to the center of the fruit (Dist), and the mean
reflectance (Refl) of that fruit than can be used to determine its degree of ripeness.
This information allows us to perform a selective harvesting based on the size and the
ripeness of the fruits. So, only the desired type of fruit is selected to be detached. The final
information supplied to the AGRIBOT robot control system is the (X,Y,Z) Cartesian
coordinates of the center of the fruit and the localization accuracy expected.
The 3-D Sensor.
12
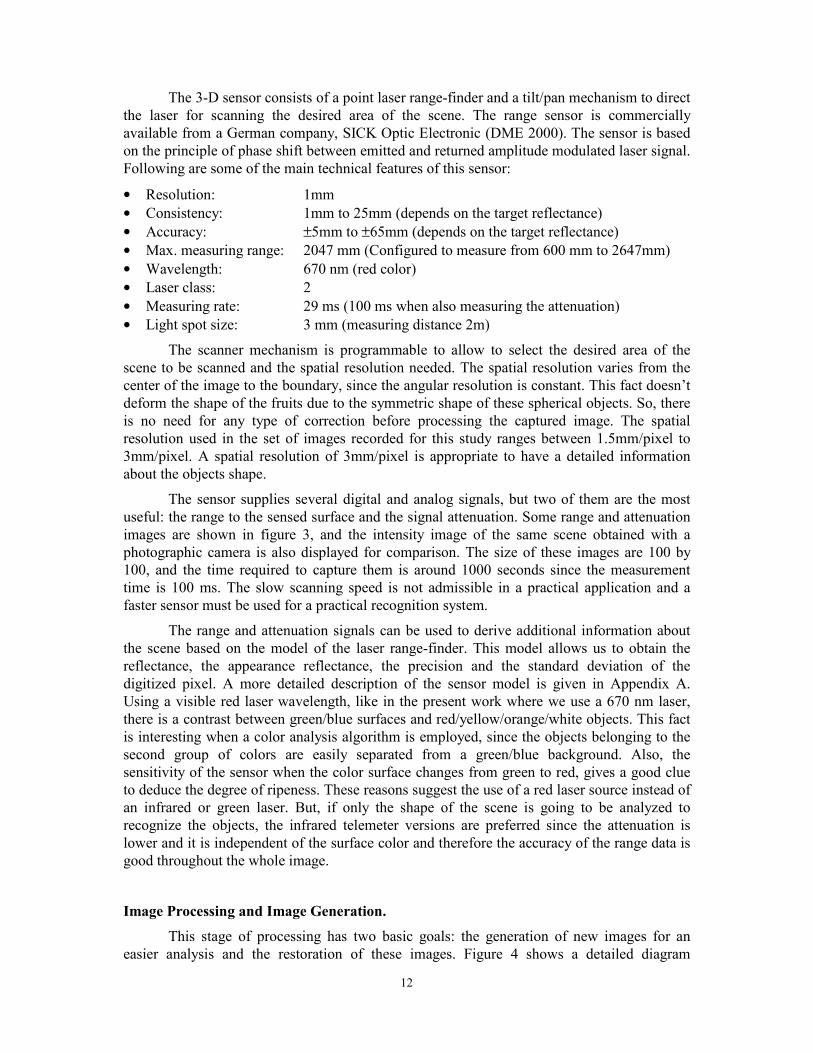
The 3-D sensor consists of a point laser range-finder and a tilt/pan mechanism to direct
the laser for scanning the desired area of the scene. The range sensor is commercially
available from a German company, SICK Optic Electronic (DME 2000). The sensor is based
on the principle of phase shift between emitted and returned amplitude modulated laser signal.
Following are some of the main technical features of this sensor:
• Resolution: 1mm
• Consistency: 1mm to 25mm (depends on the target reflectance)
• Accuracy: ±5mm to ±65mm (depends on the target reflectance)
• Max. measuring range: 2047 mm (Configured to measure from 600 mm to 2647mm)
• Wavelength: 670 nm (red color)
• Laser class: 2
• Measuring rate: 29 ms (100 ms when also measuring the attenuation)
• Light spot size: 3 mm (measuring distance 2m)
The scanner mechanism is programmable to allow to select the desired area of the
scene to be scanned and the spatial resolution needed. The spatial resolution varies from the
center of the image to the boundary, since the angular resolution is constant. This fact doesn’t
deform the shape of the fruits due to the symmetric shape of these spherical objects. So, there
is no need for any type of correction before processing the captured image. The spatial
resolution used in the set of images recorded for this study ranges between 1.5mm/pixel to
3mm/pixel. A spatial resolution of 3mm/pixel is appropriate to have a detailed information
about the objects shape.
The sensor supplies several digital and analog signals, but two of them are the most
useful: the range to the sensed surface and the signal attenuation. Some range and attenuation
images are shown in figure 3, and the intensity image of the same scene obtained with a
photographic camera is also displayed for comparison. The size of these images are 100 by
100, and the time required to capture them is around 1000 seconds since the measurement
time is 100 ms. The slow scanning speed is not admissible in a practical application and a
faster sensor must be used for a practical recognition system.
The range and attenuation signals can be used to derive additional information about
the scene based on the model of the laser range-finder. This model allows us to obtain the
reflectance, the appearance reflectance, the precision and the standard deviation of the
digitized pixel. A more detailed description of the sensor model is given in Appendix A.
Using a visible red laser wavelength, like in the present work where we use a 670 nm laser,
there is a contrast between green/blue surfaces and red/yellow/orange/white objects. This fact
is interesting when a color analysis algorithm is employed, since the objects belonging to the
second group of colors are easily separated from a green/blue background. Also, the
sensitivity of the sensor when the color surface changes from green to red, gives a good clue
to deduce the degree of ripeness. These reasons suggest the use of a red laser source instead of
an infrared or green laser. But, if only the shape of the scene is going to be analyzed to
recognize the objects, the infrared telemeter versions are preferred since the attenuation is
lower and it is independent of the surface color and therefore the accuracy of the range data is
good throughout the whole image.
Image Processing and Image Generation.
This stage of processing has two basic goals: the generation of new images for an
easier analysis and the restoration of these images. Figure 4 shows a detailed diagram
13
indicating the flow of information and the transformation process. Most of the algorithms are
based on the model of the laser range-finder illustrated in Appendix A.
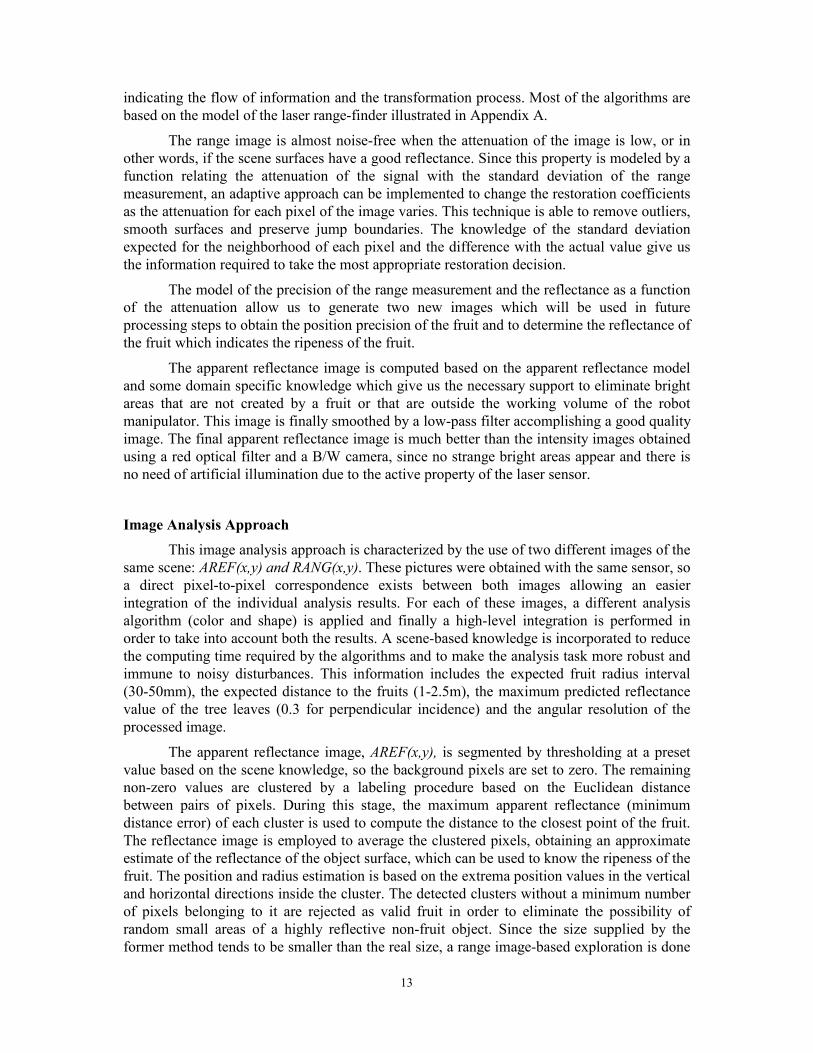
The range image is almost noise-free when the attenuation of the image is low, or in
other words, if the scene surfaces have a good reflectance. Since this property is modeled by a
function relating the attenuation of the signal with the standard deviation of the range
measurement, an adaptive approach can be implemented to change the restoration coefficients
as the attenuation for each pixel of the image varies. This technique is able to remove outliers,
smooth surfaces and preserve jump boundaries. The knowledge of the standard deviation
expected for the neighborhood of each pixel and the difference with the actual value give us
the information required to take the most appropriate restoration decision.
The model of the precision of the range measurement and the reflectance as a function
of the attenuation allow us to generate two new images which will be used in future
processing steps to obtain the position precision of the fruit and to determine the reflectance of
the fruit which indicates the ripeness of the fruit.
The apparent reflectance image is computed based on the apparent reflectance model
and some domain specific knowledge which give us the necessary support to eliminate bright
areas that are not created by a fruit or that are outside the working volume of the robot
manipulator. This image is finally smoothed by a low-pass filter accomplishing a good quality
image. The final apparent reflectance image is much better than the intensity images obtained
using a red optical filter and a B/W camera, since no strange bright areas appear and there is
no need of artificial illumination due to the active property of the laser sensor.
Image Analysis Approach
This image analysis approach is characterized by the use of two different images of the
same scene: AREF(x,y) and RANG(x,y). These pictures were obtained with the same sensor, so
a direct pixel-to-pixel correspondence exists between both images allowing an easier
integration of the individual analysis results. For each of these images, a different analysis
algorithm (color and shape) is applied and finally a high-level integration is performed in
order to take into account both the results. A scene-based knowledge is incorporated to reduce
the computing time required by the algorithms and to make the analysis task more robust and
immune to noisy disturbances. This information includes the expected fruit radius interval
(30-50mm), the expected distance to the fruits (1-2.5m), the maximum predicted reflectance
value of the tree leaves (0.3 for perpendicular incidence) and the angular resolution of the
processed image.
The apparent reflectance image, AREF(x,y), is segmented by thresholding at a preset
value based on the scene knowledge, so the background pixels are set to zero. The remaining
non-zero values are clustered by a labeling procedure based on the Euclidean distance
between pairs of pixels. During this stage, the maximum apparent reflectance (minimum
distance error) of each cluster is used to compute the distance to the closest point of the fruit.
The reflectance image is employed to average the clustered pixels, obtaining an approximate
estimate of the reflectance of the object surface, which can be used to know the ripeness of the
fruit. The position and radius estimation is based on the extrema position values in the vertical
and horizontal directions inside the cluster. The detected clusters without a minimum number
of pixels belonging to it are rejected as valid fruit in order to eliminate the possibility of
random small areas of a highly reflective non-fruit object. Since the size supplied by the
former method tends to be smaller than the real size, a range image-based exploration is done

14
starting from the previously computed radius value. Once the final radius is calculated, this
value is added to the previous distance to the fruit’s surface to obtain the distance to the fruit
center. Finally, a rule-based rejection algorithm is applied to reduce the chance of false
detection. This rule is based on the range image and states that no pixels can be found inside
the area of the candidate fruit, with range values greater than the estimated distance to the fruit
center. If some candidate violates this rule then it is not considered a fruit candidate anymore.
The previous algorithm based on the apparent reflectance image and also on the range
image which refines the results, basically only detects mature fruits. Such fruits are
characterized by an apparent reflectance of 0.3 or higher. This method is not time consuming
and allows a quick detection of the three-dimensional fruit position, its size and the ripeness
of the fruit based on the reflectance value.
A more time-consuming method is based on the shape of the fruits detected in the
range image (RANG(x,y)). A special pseudo-edge detection algorithm is applied to detect steep
slopes corresponding to proximity regions to the boundaries of the fruit, but rejecting the step
boundaries which mainly belong to leaf-to-leaf transitions. Basically, a gradient map and a
direction map are computed, but instead of thresholding the image looking for the highest
values of the gradient, a sandwich thresholding is used based on the values whose selection is
explained in appendix B. This edge extraction method gives a set of pixels which is employed
to perform a specially designed Circular Hough Transform (CHT).
The Hough Transform is a well-known method for extracting shape information from
edge images (42)
(43)
(44)
(45)
(46)
. The circular version identifies the center and radius of probable
arcs or circular edges. The use of the edge image as well as the direction of the gradient allows
us to perform this transform more efficiently in time and more robustly against false
detections. One of the major problems of this method is the selection of the threshold value to
distinguish between a good candidate to be a circle center and an insufficiently voted
candidate. We select the highest voted pixels until a 1% percentage of the total pixels is
reached, and a later clustering technique groups the votes to highlight the stronger candidates
whose votes could have been spread over a certain area due to the non-perfect spherical shape
of the fruits. This spreading of the votes due to the imperfect shape of the fruits could cause a
high density of pixels with medium votes but none of them with enough value to be
considered a valid candidate after the thresholding. If a low enough threshold value is chosen,
the medium voted pixels are considered, and if a posterior clustering technique is applied
summing all the votes for each pixel inside a cluster, the imperfect spherical shape of the
fruits is overcome and a robust system is obtained.
This CHT not only manages a matrix of accumulators or matrix of votes, it also
accumulates, for each pixel in the image, the average distance and reflectance of the
surrounding pixels which vote for each pixel. This information allows a quick computation of
the distance to the center of the fruit and an estimation of the reflectance of the surface of the
object which will be used to calculate the ripeness. Appendix C shows some corrections to the
distance to the center of the fruit, which are needed, due to the special features of the edge
extraction stage, in order to obtain more accuracy in the distance measurements.
The clustering algorithm is similar to the one used in the processing of the apparent
reflectance image, but is adapted to manage several images of votes for each radius tested and
the distance and reflectance vote matrix. In this clustering process, the final radius, distance
and reflectance are estimated taking into account the pixels belonging to each cluster. Clusters
without a sufficient number of votes are rejected to eliminate the appearance of random

15
clusters because of the low initial threshold values. Finally, as in the color analysis process,
the same rule-based rejection algorithm is applied to reduce the chance of false detections.
The results obtained by the color and shape analysis methods are integrated in order to
obtain a final result with the contributions of both methods, resulting in a higher amount of
correct detections, but without spurious detections produced when the same fruit is recognized
by both the methodologies. In this case the position, radius and distance information provided
by shape analysis is considered more precise and the reflectance is supplied by the result
obtained from the color analysis method.
Figure 6 shows some intermediate images, for two tree scenes, obtained using color
(left side) and shape (right side) analysis. The four images displayed for the color analysis are
from top to bottom: the AREF(x,y) image, the thresholded image, the result of clustering and
the detected fruits overlaid on the AREF(x,y) image. The five images displayed for the shape
analysis are from top to bottom: RANG(x,y) image, a binary version of the gradient image after
the two-limit thresholding, the matrix of votes for one of the radius tested, the matrix of votes
after the clustering and the detected fruits overlaid on the RANG(x,y) image. The objects
detected are integrated and superimposed over the photographic version of the tree scene.
Some position shifts occur due to the non-perfect pixel-to-pixel correspondence between these
images that were recorded with different sensors and from slightly distinct observation angles.
Both the images in figure 6 include four fruits. In the left image the citrus are mature
and in the right image the citrus are green. Since the color of the images in the right scene is
green, the color analysis did not detect any fruit, but we can notice the existence of some
specular reflection in the middle of the fruit that is finally rejected because of the small size of
the clusters. Three fruits are found in the right scene with the shape analysis, so one fruit is not
detected. Looking at the vote image after the clustering, four candidates are present but one of
them is a false detection, but fortunately the rule-based rejection step eliminates the false
detection.
RESULTS AND DISCUSSION
Experimental Results
A set of 15 images were captured by scanning an artificial orange tree, containing a
total of 38 oranges. This test set of images is not exhaustive considering the number of fruits,
but contains the most typical configurations of occlusion and overlapping that are frequently
found in a real fruit scene. The test set includes about 58% of mature fruits and about 42% of
green oranges.
The color analysis method is able to recognize everyone of the mature fruits but
obviously none of the green fruits are detected due to their similarity with the color of the tree
leaves. False detections, possibly appearing because of the presence of bright objects,
branches or background, are not found showing the robustness supplied by the AREF(x,y)
image and the rejection stages (size-clustering-based and rule-based rejections).
The shape analysis method recognizes mature fruits as well as green fruits, but
presents difficulties for detecting the fruit when less than 30% of its contour is not visible.
This fact leads to some error in detection of the fruits, but like in the color method, no false
detections are found due to the robustness supplied by the rejection stages. Table 2 shows the
detection results. The overall classification results show that approximately 87% of the visible
fruits (to a human) are detected and no false detections were found. These results do not mean
16
that the system is free of false detections; some false detections could occur under certain
circumstances but its probability is very low. The recognition system performance (in our
case, 87%) varies with the percentage of green fruits; the overall correct detection results
ranges from 74% for a set of only green fruits to 100% for orange, red or yellow color fruits.
A specular reflection is detected in the center of the fruit even for the green variety.
This information could be used to increase the performance of the system (some tests indicate
90% for only green fruits) but it imposes some constraints about the fruit surface or skin to be
detected and reduces the general spherical object applicability to only shiny spherical objects.
For this reason, the specular information was not taken into account in the recognition stages.
Real-Time Considerations
The algorithms have been executed on a Pentium-90Mhz processor without special
image processing hardware. The software was written in Matlab code and the Matlab
interpreter was used to execute the algorithms spending an average of 10 seconds to recognize
each fruit. The software was not compiled to generate a faster code, so the timings reported
can be improved to cope with the requirements of a real-time application. An average
processing time of 1 second/fruit is expected using compiled programs and an image
processing board.
The use of the color and shape analysis proceeds as two sequential stages instead of
two parallel stages. An additional step to remove the objects detected by the color stage, can
improve the speed of detection since the input image to the shape analysis becomes simpler.
The shape analysis is approximately 10 times slower than the color analysis, and its
processing time depends on the number of edge pixels in the input image forwarded to the
Circular Hough Transfrom process. The complexity of the CHT is proportional to the number
of edge pixels. This sequential configuration can lead to a system with reduced processing
times for images with mature fruits.
Future Work
Future work should be focused on the improvement of the shape recognition stage so
that it is able to detect more number of spherical objects. This way, the overall location
performance wouldn’t depend on the maturity stage of the fruit. To fulfill this requirement, the
range image should not only be analyzed by its contour shape, but by profile shape or by the
curvature of the surfaces. This additional analysis could improve the correct detection rates to
a hypothetical maximum limit of 95% of the visible fruits, but its real-time achievement
should be studied.
The compiled version of the recognition and location system will have to be integrated
in the AGRIBOT robot to allow the system to locate fruits in an automatic mode. As it was
explained, this system was originally designed to locate the fruits manually. Now, the system
could work automatically and only the non-detected fruits could be pointed manually if the
additional labor costs, due to the manual operation, are considered advisable.
There is a need for performing a ripeness study to correlate the reflectance information
obtained for each fruit with its ripeness. This study should supply a set of tables or functions,
one for each type of fruit or variety considered, relating the reflectance value with the ripe
classification.

17
ACKNOWLEDGEMENTS
This research was done at the PRIP laboratory of the Computer Science Department at
Michigan State University and was sponsored by the Spanish National Programme PN93
(CICYT-TAP93-0583).
APPENDIX
Appendix A: The Laser Range-Finder Model
The main goal of this section is to derive a mathematical expression which is able to
model the behavior of the laser range-finder when the operational conditions change. The
attenuation signal supplied by the sensor must depend on the distance r to the object, the
reflectance properties of the target surface and the angle θ between the laser optical axis and
the normal to the target surface.
Let ρd denote the diffuse reflectance coefficient which is the ratio between the
reflected diffuse radiant flux and the incident radiant flux Fi (3.4*10-3
w ). The values of this
coefficient ranges from 0 for a black surface to 1 for an ideal white surface. ρd depends on the
wavelength of the light, but in our case a fixed wavelength, 670nm, will be utilized.
The diffuse reflected radiant intensity Id (w/srad) depends on the incident radiant flux
Fi, the diffuse reflectance coefficient ρd , and the incident angle θ. Using the cosine Lambert
Law, the following expression is found:
Id =Fi
dπρ θcos (1)
The fraction of the received laser signal which passes throughout the optical system of
the sensor is denoted by α. The α value range from 0 to 1 for ideal optics. Theoretically, this
value must be a constant, but for our sensor the transmission rate changes when the distance to
the sensor varies.
( ) ( )[ ]α r a atan a r= 1 2
2
(2)
The area of the optical surface for the signal reception is represented by Ar (908 mm2).
The solid angle Ω captured by the sensor is equal to AR/r2 . The radiant flux captured by the
laser range-finder is a function of Id , r and Ω . The following equation expresses this
relationship:
F IA F
rc d
R i d= =
α
α
π
ρ θΩ
cos2 (3)
Finally, Atte, the signal supplied by the sensor on a decibel unit scale, can be modeled
in the following way:
AtteF
F
F
r A F
r
i
c
i
R i d
=
=
20 2010 10
2
log log( ) cosα
π
ρ θ (4)
18
( )[ ]Atte
r
a a a r AR d
=
20 10
2
1 2
2log
tan cos
π
ρ θ (5)
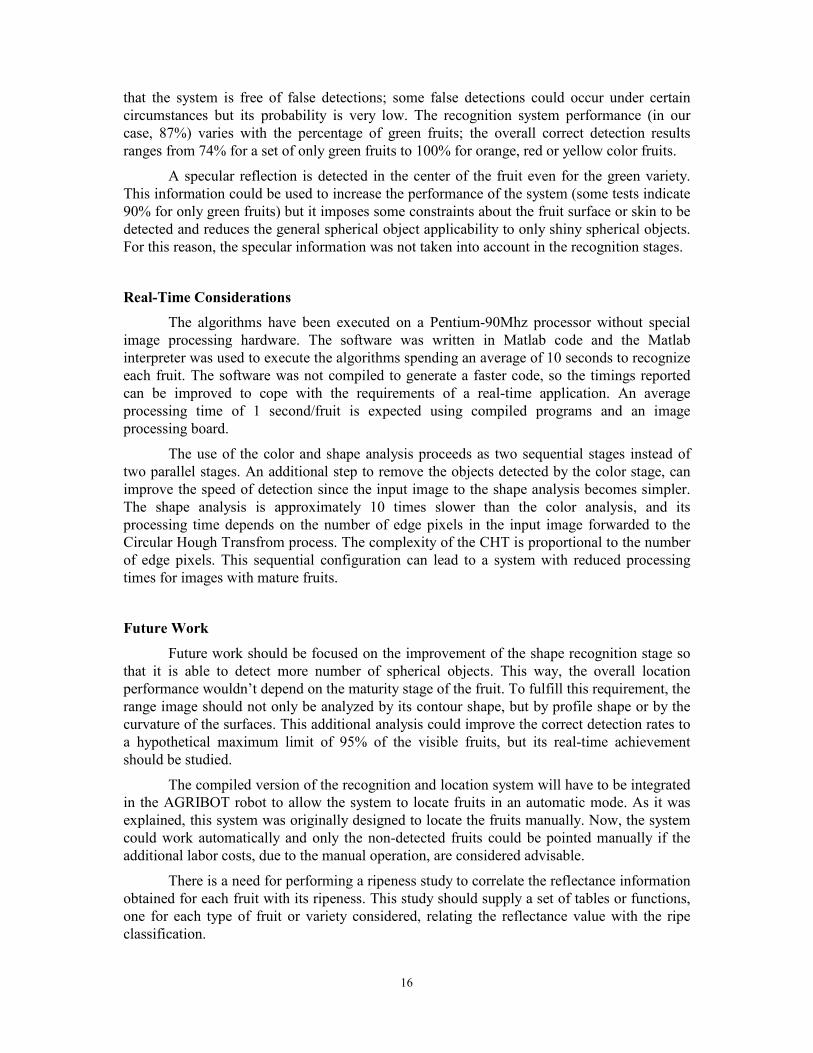
This model is directly employed to obtain the following equation to compute the
diffuse reflectance coefficient.
( )[ ]ρ
π
θd
R
Atte
r
a a a r A=
2
1 2
22010tan cos( )
(6)
To compute the reflectance coefficient, it is necessary to know the distance r , the
signal attenuation Atte, and the angle θ. The first two parameters are obtained directly by the
sensor, but for computing θ there is a need for analyzing the range image and produce a
surface normal image. Due to error in computing surface normals, we obtain noisy reflectance
images.
If the term related to θ is placed on the left side of the equation (6), the apparent
reflectance is obtained, which is much easier to calculate.
( )[ ]ρ θ
πd
R
Atte
r
a a a r Acos( )
tan=
2
1 2
22010
(7)
In a previous work (47)
, the following dependencies between the signal to noise ratio,
SNR, and the captured radiant flux, Fc,, are exhibited.
( )SNR
T
hcF
r A F T
hc rc
R i d= =
ηλ α ηλ
π
ρ θcos2
12
(8)
where:
h = Planck constant.
c = speed of light = 3*108 m/seg
λ = Laser beam wavelength = 0.67 µm
η = Photocatode quantic efficiency.
Taking into account that the standard deviation and the precision of the range
measurements are inversely proportional to the SNR, the next two expressions allow us to
estimate these parameters.
( ) ( )σr
Aten= ⋅ +−145 10 10 0 55 0 054. .. (9)
( ) ( )Pr ..
ecisionAten= ⋅ +−138 10 10 86 0 062
(10)
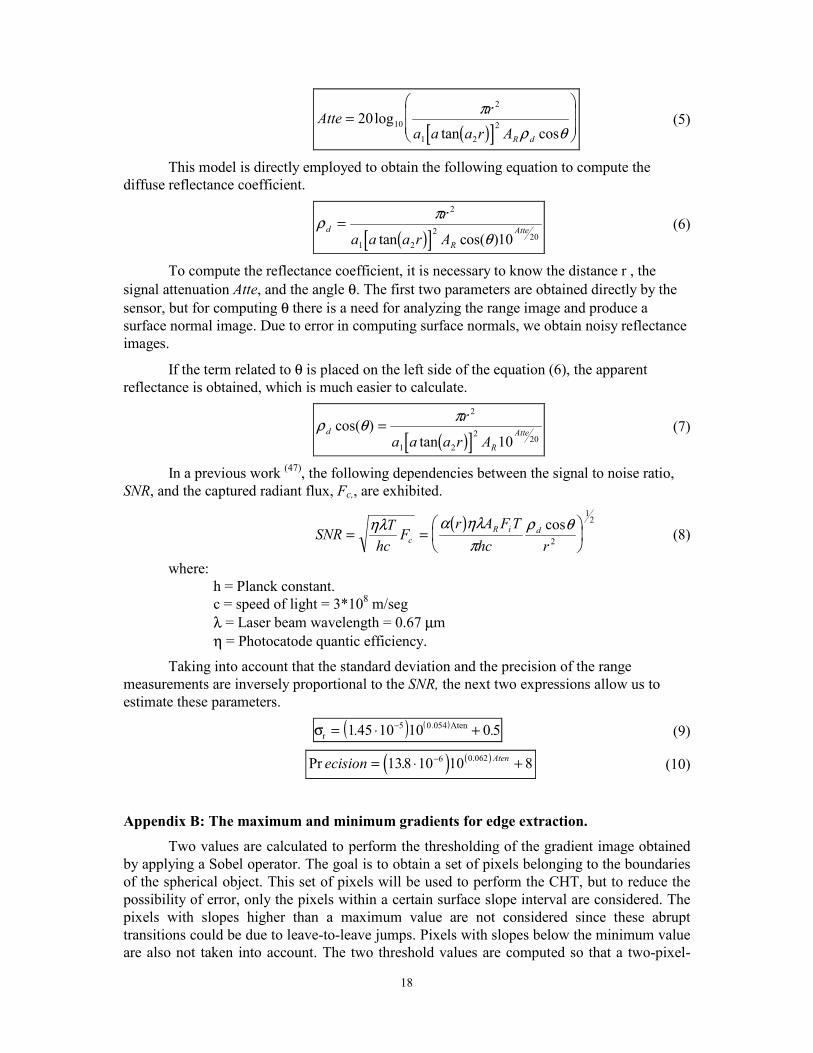
Appendix B: The maximum and minimum gradients for edge extraction.
Two values are calculated to perform the thresholding of the gradient image obtained
by applying a Sobel operator. The goal is to obtain a set of pixels belonging to the boundaries
of the spherical object. This set of pixels will be used to perform the CHT, but to reduce the
possibility of error, only the pixels within a certain surface slope interval are considered. The
pixels with slopes higher than a maximum value are not considered since these abrupt
transitions could be due to leave-to-leave jumps. Pixels with slopes below the minimum value
are also not taken into account. The two threshold values are computed so that a two-pixel-
19
wide ring is always obtained when spherical objects exist. The outermost pixel of the contour
of the sphere is not considered for getting rid of the step edge which could be a source of
undesired edges.
If N is the number of pixels existing in the radius of a sphere, then we obtain the following
relationship: y N x= −2 2 for a spherical object. To obtain the slope function, y is derived
with respect to x obtaining:
dy
dx
x
N x=
−
−2 2 (11)
And the gradients for the pixels N-1 and N-3 are:
( )Gradient
dy
dx
N
N Nx N
_ max = =−
− −= −12 2
1
1 (12)
( )Gradient
dy
dx
N
N Nx N
_ min = =−
− −= −32 2
3
3
(13)
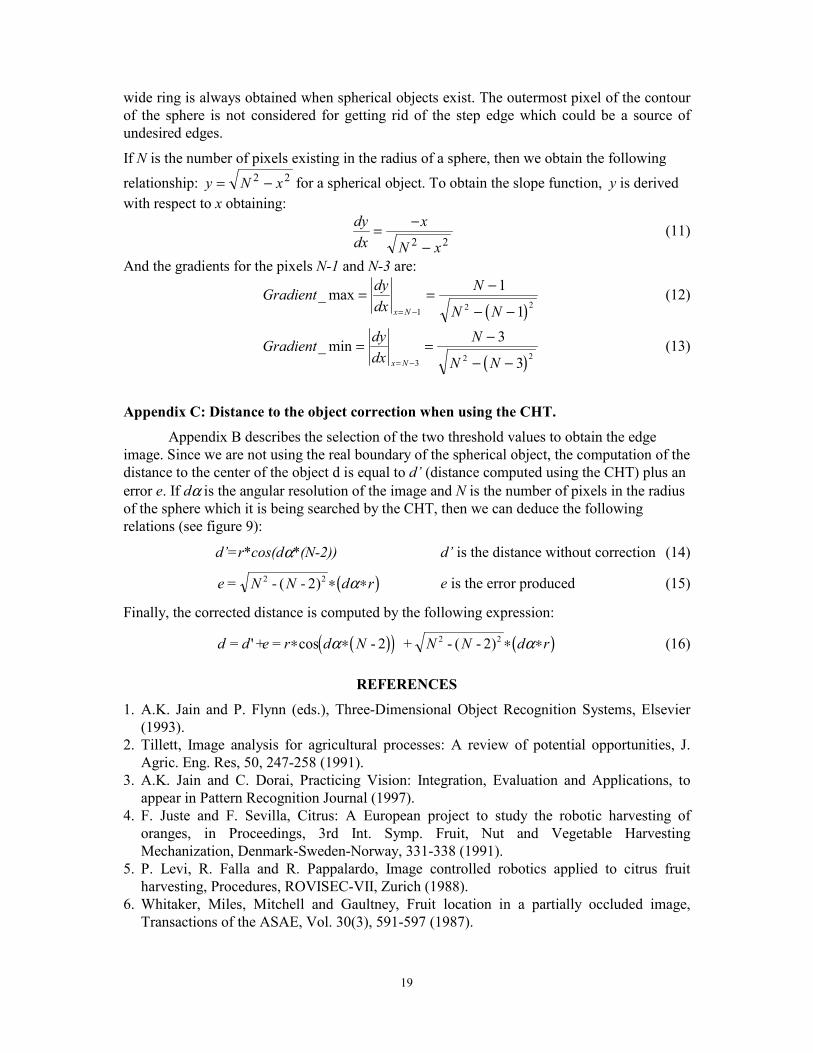
Appendix C: Distance to the object correction when using the CHT.
Appendix B describes the selection of the two threshold values to obtain the edge
image. Since we are not using the real boundary of the spherical object, the computation of the
distance to the center of the object d is equal to d’ (distance computed using the CHT) plus an
error e. If dα is the angular resolution of the image and N is the number of pixels in the radius
of the sphere which it is being searched by the CHT, then we can deduce the following
relations (see figure 9):
d’=r*cos(dα*(N-2)) d’ is the distance without correction (14)
( )e N N d r= - ( - )2 22 ∗ ∗α e is the error produced (15)
Finally, the corrected distance is computed by the following expression:
( )( ) ( )d d e r d N N N d r= ' + = - + - ( - )∗ ∗ ∗ ∗cos α α2 22 2 (16)
REFERENCES
1. A.K. Jain and P. Flynn (eds.), Three-Dimensional Object Recognition Systems, Elsevier
(1993).
2. Tillett, Image analysis for agricultural processes: A review of potential opportunities, J.
Agric. Eng. Res, 50, 247-258 (1991).
3. A.K. Jain and C. Dorai, Practicing Vision: Integration, Evaluation and Applications, to
appear in Pattern Recognition Journal (1997).
4. F. Juste and F. Sevilla, Citrus: A European project to study the robotic harvesting of
oranges, in Proceedings, 3rd Int. Symp. Fruit, Nut and Vegetable Harvesting
Mechanization, Denmark-Sweden-Norway, 331-338 (1991).
5. P. Levi, R. Falla and R. Pappalardo, Image controlled robotics applied to citrus fruit
harvesting, Procedures, ROVISEC-VII, Zurich (1988).
6. Whitaker, Miles, Mitchell and Gaultney, Fruit location in a partially occluded image,
Transactions of the ASAE, Vol. 30(3), 591-597 (1987).
20
7. C.E. Schert and G. K. Brown, Basic considerations in mechanizing citrus harvest,
Transactions of the ASAE, 343-346 (1968).
8. E. Parrish and A.K. Goksel, Pictorial pattern recognition applied to fruit harvesting,
Transactions of the ASAE, 20, 822-827 (1977).
9. A. Grand D’Esnon, Robot harvesting of apples, Proceedings of AgrMation I, ASAE and
SME, St. Joseph, Michigan, 210-214 (1984).
10.F. Sevilla, F. Sittichareonchai, J.M. Fatou, A. Constans, A. Brons and A. Davenel, A robot
to harvest grape: a feasibility study, ASAE Paper No. 89-7084, St. Joseph, MI 49085
(1989).
11.F. Sevilla and P. Baylou, The principles of robotics in agriculture and Horticulture,
Progress in Agricultural Physics and Engineering, C.A.B. International, Bedford, U.K.,
119-147 (1991).
12.D.S. Humburg and J.F. Reid, Field performance for machine vision for selective harvesting
of asparagus, Applied Eng. in Agriculture, 2(1), 2-5 (1986).
13.K. Amaha, H. Shono and T. Takakura, A harvesting robot of cucumber fruits, ASAE Paper
No. 89-7053, St. Joseph, MI, 49085 (1989).
14.R. Tillet, Initial development of a mechatronic mushroom harvester, Proceedings, Int.
Conf. “Mechatronics: Designing Intelligent Machines”, 12-13 Sept., Institution of
Mechanical Engineers, Cambridge, 109-114 (1990).
15.L. Kassay, Hungarian robotic apple harvester, ASAE Paper No. 92-7042, Charlotte, North
Carolina, June 21-24 (1992).
16.N. Kawamura, N. Kiyoshi, F. Tasteshi and U. Motonobu, Study of fruit harvesting robot
and its application on others works, Proceedings, Int. Symp. on Agricultural Mech and Int.
Coop. in High Tech. Era, Japanese Society of Agricultural Machinery (1987).
17.A. Grand D'Esnon, G. Rabatel and R.Pellenc, Magali: A self-propelled robot to pick
apples, ASAE paper No. 87-1037, St. Joseph, MI 49085-9659 (1987).
18.E. Blandini, First approaches to robot utilisation for automatic citrus harvesting, Land and
Water Use, Dodd&Grace (eds.), Balkema, Rotterdam (1989).
19.R.C. Harrel, P.D. Adsit, T.A. Pool and R.Hoffman, The Florida robotic grove-lab, ASAE
Paper No. 88-1578, (1988).
20.Hayashi and Ueda, Orange harvesting robot, Kubota Co., Sakai, Japan (Mimeo.) (1991).
21.M. Benady, Y. Edan, A. Hetzroni and G. E. Miles, Design of a field crops robotic machine,
ASAE Paper No. 91-7028, St. Joseph, MI 49085 (1991).
22.Y. Edan and G.E. Miles, Design of an agricultural robot for harvesting melons,
Transactions of the ASAE, 36(2), 593-603 (1993).
23.Y. Edan, Design of an autonomous agricultural robot, Applied Intelligent, 5, 41-50 (1995).
24.V. Stepanov et al., Mobile and manipulation robots for agriculture, Fourth Workshop on
Robotics in Agriculture & the Food Industry, IARP, Toulouse, 137-143 (1995).
25.R. Ceres , J.L. Pons, A.R. Jiménez, J.M. Martín and L. Calderón, Agribot: A robot for
aided fruit harvesting, AGENG96, 2 (1996).
26.M. Benady and G. E. Miles, Locating melons for robotic harvesting using structured light,
ASAE Paper No.:92-7021 (1992).
27.J.J. Gaffney, Reflectance properties of citrus fruit, Transactions of the ASAE 16(2), 310-
314 (1969).
28.G. Rabatel, A vision system for Magali, the fruit picking robot, Int. Conf. Agricultural
Engineering, AGENG88 Paper 88293, Paris (1988).
29.N. Kawamura and Namikawa, Robots in agriculture, Advanced Robotics, 3, 311-320
(1989).
21
30.K.C. Cox, G.C. Roman, W.E. Ball and A.F. Laine, Rapid search for spherical objects in
aerial photographs, IEEE Conference Computer Vision and Pattern Recognition, 905-909
(1988).
31.D. Slaughter and R. C. Harrel, Color Vision in Robotic Fruit Harvesting, Transactions of
the ASAE, Vol.30(4), 1144-1148 (1987).
32.Sites and Dewilche, Computer vision to locate fruit on a tree, Transactions of the ASAE,
Vol.31(1), 257-263 (1988).
33.D. Slaughter and R. C. Harrel, Discriminating fruit for robotic harvest using color in
natural outdoor scenes, Transactions of the ASAE, Vol.32(2), 757-763 (1989).
34.R.C. Harrel, D. Slaughter and P.D. Adsit, A fruit-Tracking system for robotic harvesting,
Machine Vision and Applications, 2, 69-80 (1989).
35.W. Qiu and S.A. Shearer, Maturity assessment of broccoli using the discrete Fourier
transform, ASAE Paper No. 91-7005, St. Joseph, MI (1991).
36.M. Cardenas-Weber, A. Hetzroni and G.E. Miles, Machine vision to locate melons and
guide robotic harvesting, ASAE Paper No. 91-7006 (1991).
37.Y. Dobrusin, Y. Edan et al., Real-time image processing for robotic melon harvesting,
ASAE Paper No. 92-3515 (1992).
38.F. Plá, F. Juste and F. Ferri, Feature extraction of spherical objects in image analysis: an
application to robotic citrus harvesting, Computers and Electronics in Agriculture, 8,
Elsevier, 57-72 (1993).
39.F. Buemi, M. Massa and G. Sandini, AGROBOT: a robotic system for greenhouse
operations, Fourth Workshop on Robotics in Agriculture & the Food Industry, IARP,
Toulouse, 172-184 (1995).
40.F. Plá, Recognition of partial circular shapes from segmented contours, Computer Vision
and Image Understanding, Vol.63(2), 334-343 (1996).
41.O. Trier and A.K. Jain, Goal-directed evaluation of binarization Methods, IEEE Trans.
PAMI, 17, 1191-1201, Dec. 1995).
42.R.O. Duda and P.E. Hart, Use of the Hough transformation to detect lines and curves in
pictures, Communications of the ACM, Vol.15, 11-15 (1972).
43.C. Kimme, D.H. Ballard and J. Sklansky, Finding circles by an array of accumulator,
Communications of the ACM, 18, 120-122 (1975).
44.D. H. Ballard, Generalizing the Hough Transform to detect arbitrary shapes, IEEE
Computer Society Press, Computer Vision: Principles, 183-194 (1991).
45.J. Illingworth and J.Kittler, A survey of the Hough transform, Computer Vision, Graphics
and Image Processing, 44, 87-116 (1988).
46.J. Illingworth, J. Kittler and J. Princen, Shape detection using the adaptive Hough
transform, NATO ASI Series, Vol.42, Sensors devices and Systems for Robotics, 119-142
(1988).
47.D. Nitzan, A.E. Brain and R.O. Duda, The measurement and use of registered reflectance
and range data in scene analysis, Proc. IEEE, Vol.65, 206-220 (1977)
22
BIOGRAPHIES
Antonio R. Jiménez graduated in Physics, Computer Science branch (Universidad
Complutense of Madrid, June 1991). From 1991 to 1993, he worked in industrial laser
applications at CETEMA (Technological Center of Madrid), Spain. From 1994, he is working
towards a Ph. D. degree as a research assistant at the Instituto de Automática Industrial, CSIC,
Spain. His current research interests include computer vision applications, pattern recognition,
range images, shape-based image analysis and automatic harvesting.
Anil K. Jain received a BTech degree in 1969 from the Indian Institute of
Technology, Kanpur, and the MS and PhD degrees in electrical engineering from Ohio State
University, in 1970 and 1973, respectively. He joined the faculty of Michigan State University
in 1974, where he currently holds the rank of University Distinguished Professor in the
Department of Computer Science. Dr. Jain served as program director of the Intelligent
Systems Program at the National Science Foundations (1980-1981), and has held visiting
appointments at Delft Technical University, Holland, Norwegian Computing Center, Oslo,
and Tata Research Development and Design Center, Pune, India. Dr. Jain has published a
number of papers on the following topics: statistical pattern recognition, exploratory pattern
analysis, neural networks, Markov random fields, texture analysis, interpretation of range
images, and 3D object recognition. He received the best paper awards in 1987 and 1991, and
received certificates for outstanding contributions in 1976, 1979, and 1992 from the Pattern
Recognition Society. Dr. Jain served as the editor-in-chief of the IEEE Transactions on Pattern
Analysis and Machine Intelligence (1991-1994), and currently serves on the editorial boards
of Pattern Recognition Journal, Pattern Recognition Letters, Journal of Mathematics Imaging,
Journal of Applied Intelligence, and IEEE Transactions on Neural Networks.
Ramón Ceres graduated in Physics (electronic) from Universidad Complutense of
Madrid in 1971 and received the doctoral degree in 1978. After a first stay, for one year, in the
LAAS-CNRS in Toulouse (France), has been working at the Instituto de Automática
Industrial (IAI), dependent of the Spanish national council for science research; with a period
in 1990-91 of permanence in a electronic company (Autelec) as R&D director. Since the
beginning, Dr Ceres has developed research activities on sensor systems applied to different
fields such as continuous process control, machine tool, agriculture, robotics and disable
people. On these topics has more than seventy papers and congress communications, having
several patents in industrial exploitation. At present Dr Ceres is the Spanish delegate for the
IMT (Brite-Euram) Committee and Deputy Scientific Director of the IAI.
José L. Pons graduated as Mechanical Engineering (Universidad de Navarra, April
1992). He received a M. Sc. degree in Information Technologies for Production (Universidad
Politécnica de Madrid, January 1995). He received the Ph. D. degree in physics sciences from
the Complutense University of Madrid, December 1996. Dr. Pons is currently at the Instituto
de Automática Industrial, CSIC, where has been working from 1993. His current research
interests include non-traditional sensor-actuation technologies, development of new
technologies and miniature applications.

23
I. Research Tools
II. Decision Making
A. Guidance
1. Harvesting
2. Guiding machinery
B. Grading
Figure 1. Image Analysis Applications in Agriculture

24
Manipulator
System
Laser Range-finder
Image Processing
and
Image Generation
Image
Analysis
data
EL(x,y)
AZ(x,y)
PREC(x,y)
Refl(rang,θ,atte)Aref(rang,atte)
Std_d(atte)
Prec(atte)
detected fruits
(POS(x,y),DIST,RAD,REFL)
PREC(x,y)
EL(x,y)
AZ(x,y)
Fruits to be detached:
(Pos(X,Y,Z),Prec(X,Y,Z))
REFL(x,y) AREF(x,y)RANG(x,y)
RANG(x,y)
ATTE(x,y)
Image Extraction
3-D position and
Precision generator
Range-finder Model
Model
generation
Scene Knowledge
Harvest type
on-line
off-line
Figure 2. General Data Flow Diagram of the fruit detection process

25
Photograph of the scene Range images Attenuation images
Figure 3. Some examples of range and attenuation images for two different artificial orange
tree scenes. At the top, from left to right: scene with 4 mature oranges; the range image and
the attenuation image. At the bottom, another sequence for a scene with 4 green oranges.

26
Image Processing
and
Image Generation
Refl(Rang,θ,Atte)Aref(Rang,Atte)
Std_d(Atte)
Prec(Atte)
STD_D(x,y)
RANG’(x,y)
RANG(x,y)
ATTE(x,y) ATTE(x,y)ATTE(x,y)
REFL(x,y)AREF(x,y)PREC(x,y) RANG’(x,y)
ATTE(x,y)RANG(x,y)
Range-finder Model
Scene
Know-
ledge
Model-Based
Reflectance
Adaptive
Restoration
Noise
Removal
Model-based
Apparent
Reflectance
Model-based
Standard
Deviation
Model-Based
Precision
Figure 4. Data flow diagram of the image processing and image generation process. At the top
are actual input images (RANG(x,y), ATTE(x,y)) and at the bottom, the output images
(PREC(x,y), RANG’(x,y), AREF(x,y), REFL(x,y)).
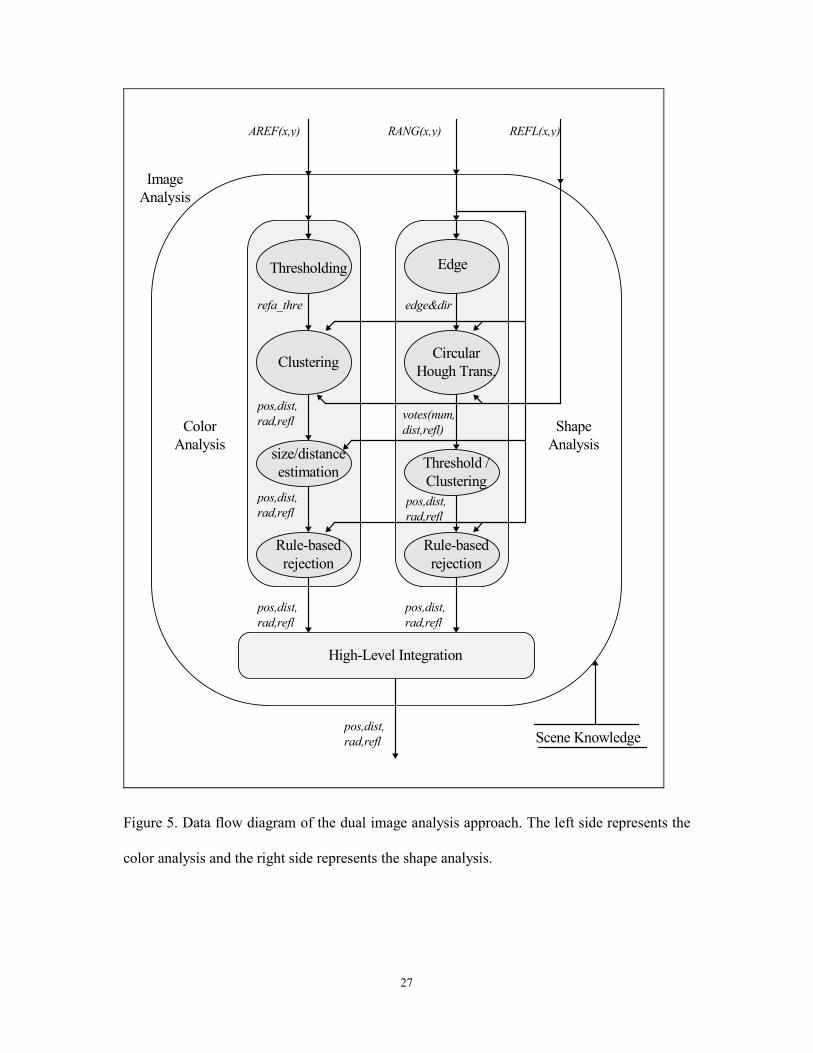
27
pos,dist,
rad,refl
High-Level Integration
Color
Analysis
Shape
Analysis
Image
Analysis
REFL(x,y)AREF(x,y)
votes(num,
dist,refl)
edge&dirrefa_thre
pos,dist,
rad,refl
pos,dist,
rad,refl
pos,dist,
rad,refl
pos,dist,
rad,refl
pos,dist,
rad,refl
RANG(x,y)
Scene Knowledge
Thresholding Edge
Clustering
Threshold /
Clustering
size/distance
estimation
Circular
Hough Trans.
Rule-based
rejection
Rule-based
rejection
Figure 5. Data flow diagram of the dual image analysis approach. The left side represents the
color analysis and the right side represents the shape analysis.

28
Figure 6. Some intermediate images during the image analysis process. At the top-left and
top-right, two photographs are shown. Each of these images is processed by the color and
shape analysis and the final results are displayed by overlapping circumferences with the
computed radius.

29
Laser
range-finder
ρd
θ
surface normal
r
Figure 7. The angle θ between the surface normal and the laser axis is necesary to obtain the
reflectance of the surface.
N
minimun
slope
maximun
slope
Y
X
Figure 8. The two slope limits depicted, produce a two-bit-wide edge ring when a sphere is
present.

30
N-2
Laser
range-finder
dα*(N-2)
e
d’
d
Y
r
X
Figure 9. Drawing showing the parameters related in the correction of the distance to the
center of the spherical fruit.

31
Research
reference
Type of fruit Sensor and
accessories 1
Detection method applied 2 Detects
green
fruit
Success / False
detection rates 3
[8] Apples B/W+F Intensity (Thr+FE+RC) No N.R.
[17] Apples Color Color (Thr) No N.R.
[17] [28] Apples 3 Color+3 F Color (Ratio+Thr) Yes 50% / ≠0%
[6] Tomatoes B/W Shape (Edge+CHT) Yes 68% / 42%
[5] Oranges Color+F+L Shape (Gradient+Matching) No 70% / N.R.
[31] Oranges Color+L Color (Hue&Sat+LC) No 75% / N.R.
[32] Apples and
Peaches
B/W+F+L Intensity (Thr+FE+LC) No 84% /20%
[33] [34] Oranges Color Color (RGB+BC) No 75% / N.R.
[4] Oranges B/W+F+2L Intensity (Thr) No 80% / High%
[4] Oranges 2 B/W+2F+2L Intensity (Ratio+Thr) No 80% / 10%
[4] Oranges Color Color (RGB+BC) No 90% / 3-5%
[36] Melons B/W Intensity (Thr+FE+RC) No 84% / 10%
[15] Apples 2Color Color(Thr+Stereo) No 41% / N.R.
[37] Melons B/W+Blower Intensity (Thr+FE+RC) No 80% / N.R.%
[21] Melons Laser&B/W+
Blower
Shape (Profile+CHT+RC) Yes 100% / 0%
[38] Oranges B/W+L Shape (Concv+Thr&Fitting) Yes 75% / 8%
[39] Tomatoes Color Color (Hue&Sat+Thr) No 90% / N.R%
1(B/W=Black/White camera, Color=Color camera, F=Filter, L=Artificial lighting)
2(Thr=Thresholding, FE=Feature extraction, LC=Linear classifier, BC=Bayesian classifier, RC=Rule-based
classifier, RGB=Red-Green-Blue feature space, Hue&Sat=Hue-Saturation feature space, CHT=Circular
Hough Transform, Gradient=Gradient image, Concav=Concavity image, Profile=Profile image)
3(N.R.=Not Reported)
Table 1. Summary of the most important vision systems for agricultural harvesting. No food
inspection systems are included.

32
Analysis method Partial success / failure rate Final success / failure rate
Color 58% / 0%
Shape 74% / 0%
Table 2. Recognition results for the test set of mature and green oranges with different
degrees of occlusion.
87% / 0%


![AUTOMATIC LICENSE PLATE RECOGNITION [ALPR]-A … · sent to the System. ... Automatic License Plate Recognition (ALPR) can be useful ... Automatic License Plate Recognition (ALPR)](https://static.fdocuments.in/doc/165x107/5b3d8ea67f8b9a0e628e414f/automatic-license-plate-recognition-alpr-a-sent-to-the-system-automatic.jpg)