Automatic Characterisation of the Pronunciation of Non ...Automatic Characterisation of the...
25
Automatic Characterisation of the Pronunciation of Non-native English Speakers using Phone Distance Features K. Kyriakopoulos, M.J.F. Gales, K.M. Knill SLaTE 2017
Transcript of Automatic Characterisation of the Pronunciation of Non ...Automatic Characterisation of the...

Automatic Characterisation of the Pronunciation of Non-native English Speakers using Phone Distance FeaturesK. Kyriakopoulos, M.J.F. Gales, K.M. Knill
SLaTE 2017

Automatic Pronunciation Assessment and Feedback
• Motivation is CALL/CAPT
• Features:
• Matched to specific aspects of proficiency
• Used for both grading and feedback
• Indicative of how wrong you are AND how you are wrong
FeedbackFeedback

Two Concepts of Bad Pronunciation
• Pronunciation: Rendering of a word as a series of phones
1. Bad pronunciation as individual lexical errors:
e.g. subtle:
/s/ / / /t/ / / /l/ => /s/ / / ʌ ə ʌ /b/ /t/ / / /l/ (insertion error)ə
VS.
2. Bad pronunciation as general property of how one speaks
e.g. Spanish speaker confusing /b/ and /v/
French speaker rendering all /r/ as [χ]

Two Concepts of Bad Pronunciation
• Pronunciation: Rendering of a word as a series of phones
1. Bad pronunciation as individual lexical errors:
e.g. subtle:
/s/ / / /t/ / / /l/ => /s/ / / /b/ / / /l/ (insertion error)ʌ ə ʌ ə
VS.
2. Bad pronunciation as general property of how one speaks
e.g. Spanish speaker confusing /b/ and /v/
French speaker rendering all /r/ as [χ]

Hypothesis: Pronunciation Learning Path
• Features should be able to predict:
1. English speaking proficiency (automarking)
2. Speaker’s L1
• L1 prediction accuracy should decrease with increased proficiency
L1sIdeally:

Key Constraints
• Spontaneous speech
• No native models with identical text
• ASR word (and phone) error rate
• Only have native speaker lexicon (broad not narrow transcription)
e.g. riot : / / /a/ / / / / /t/ and / / /a/ / / / / / / => /r/ /a/ / / / / /t/ɹ ɪ ə ɾ ɪ ə ʔ ɪ ə
• Variability in speaker attributes

Phone Distance Features
• Each phone characterised relative to others
• Independence to speaker attributes
• Train model for speaker’s pronunciation of each phone
• Calculate distance between each pair of models

Phone Distance Features
• 47 English phones
• 1081 distances
• Gaussian model for phone predicts PLP features :
• Distance metric is symmetric K-L divergence:
•
+ ]

Data: BULATS Speaking Test
• BUsiness Language Testing Service (BULATS) Spoken English Test

Data: Training and Testing Sets
• 21 L1s
• Balanced gender and proficiency levels
• Varying numbers of speaker per L1
• EVL1 with more L1s to test L1 classification
• EVL2 with expert assigned grades to test score prediction
Table: Nos. of speakers for select L1s

Data: Training and Testing Sets
• 21 L1s
• Balanced gender and proficiency levels
• Varying numbers of speaker per L1
• Spanish speakers from 3 countries
Table: Nos. of speakers for Spanish speaking countries

Experimental Setup: ASR
• Acoustic model: Hybrid-Si DNN-HMM
• Language model: N-gram
• Trained on separate set of BULATS Gujarati L1 speakers
• Evaluated using word error rate (WER) and phone error rate (PER)
Correct: Today I ran so far /t/ / / /d/ /e/ / / /a / /r/ /æ/ /n/ /s/ / / /f/ ə ɪ ɪ əʊ/a/
Recognised: Today Iran sofa /t/ / / /d/ /e/ / / /a / /r/ /æ/ /n/ /s/ / / /f/ / / ə ɪ ɪ əʊ ə

Experimental Setup: ASR
• Acoustic model: Hybrid-Si DNN-HMM
• Language model: N-gram
• Trained on separate set of BULATS Gujarati L1 speakers
• Evaluated using word error rate (WER) and phone error rate (PER)
Correct: Today I ran so far /t/ / / /d/ /e/ / / /a/ / / /r/ /æ/ /n/ /s/ / / / / ə ɪ ɪ ə ʊ/f/ /a/
Recognised: Today Iran sofa /t/ / / /d/ /e/ / / /a/ / / /r/ /æ/ /n/ /s/ / / / / /f/ /ə ɪ ɪ ə ʊ ə/
WER: 80% PER: 6.67%
Experimental Setup: ASR
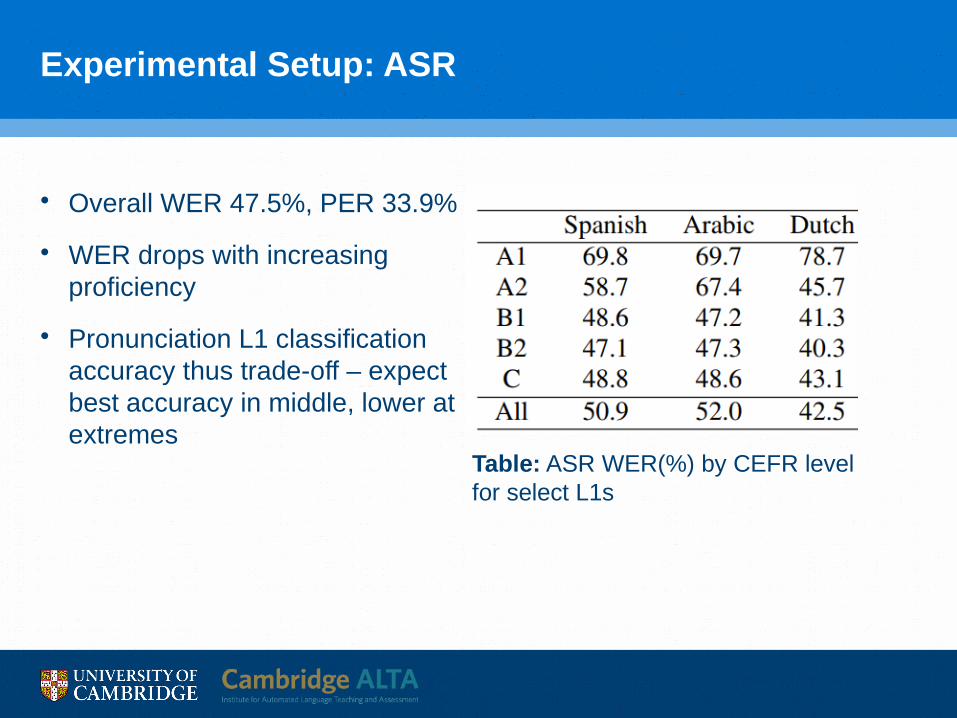
• Overall WER 47.5%, PER 33.9%
• WER drops with increasing proficiency
• Pronunciation L1 classification accuracy thus trade-off – expect best accuracy in middle, lower at extremes
Table: ASR WER(%) by CEFR level for select L1s

Experimental Setup: Automarking
• State of the art DNN
• Trained to minimise MSE for score prediction
• Evaluated using MSE and PCC
• Baseline fluency, vocabulary and simple prosody feature set
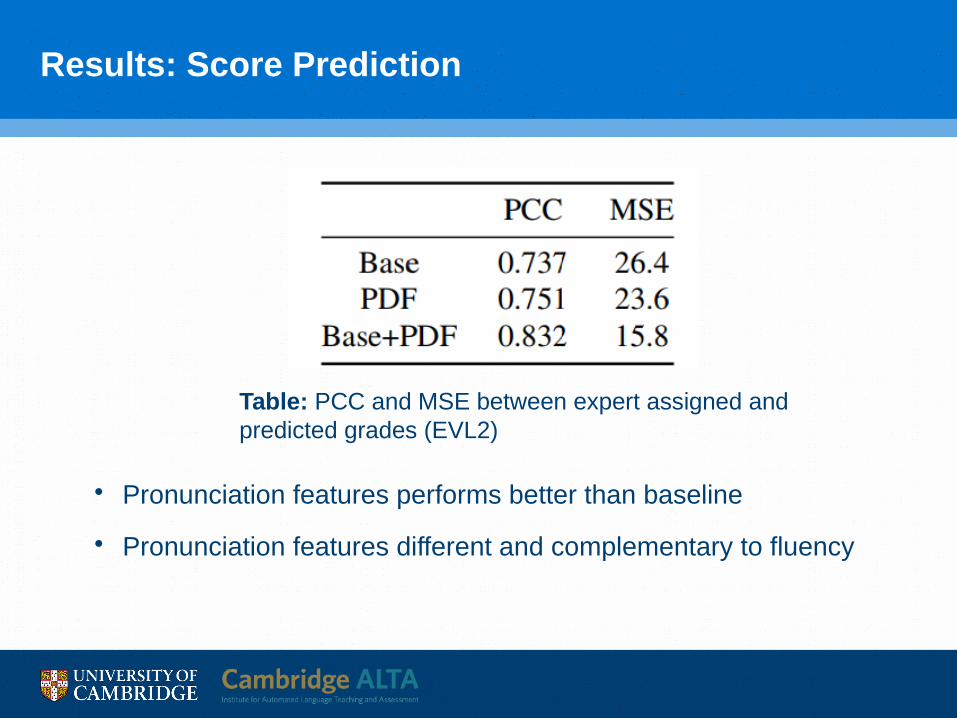
Results: Score Prediction
• Pronunciation features performs better than baseline
• Pronunciation features different and complementary to fluency
Table: PCC and MSE between expert assigned and predicted grades (EVL2)

Experimental Setup: L1 classification
• Same DNN configuration
• Replace output layer with softmax closed-task classification layer
• Trained for minimum cross entropy
• Evaluated using % Accuracy
• Same baseline fluency, vocabulary and simple prosody feature set

Results: L1 classification
• Phone Distance Features better than baseline
• Baseline not complementary to Phone Distance Features
Table: Accuracy of 21-way L1 classifier

Results: L1 classification
• Classifier seems biased to common training data speakers
Table: L1 classifier accuracy for select L1s

Results: L1 classification Error Analysis
• L1s most commonly confused with L1s of similar language group
• Identifiable groups: Romance, North Indian & South Indian

Results: Country of origin classification
• Spanish speakers accurately classified between Spaniards, Mexicans and Columbians
Table: Country of origin classifier accuracy

Results: Classification Accuracy by Grade
• PDF accuracy increases then decreases as expected
Figure: L1 AccuraciesA1 A2 B1 B2 C1 C2
50%
55%
60%
65%
70%
75%
80%
85%
90%
95%
100%
A1 A2 B1 B2 C1 C250%
55%
60%
65%
70%
75%
80%
85%
90%
95%
100%
Figure: Country Accuracies

Conclusions
• Phone distance features indicative of:
• Proficiency
• Source accent (defined by L1 and country of origin)
• Proficient speakers’ source accents are harder to distinguish using PDFs than intermediate speakers
• Features are sensitive to ASR performance

Any questions?

Variational Autoencoder Projections of Features