Automatic Causal Discovery - Carnegie Mellon School of …tom/10-702/causal2.pdf · ·...
64
1 Automatic Causal Discovery Richard Scheines Peter Spirtes, Clark Glymour Dept. of Philosophy & CALD Carnegie Mellon
Transcript of Automatic Causal Discovery - Carnegie Mellon School of …tom/10-702/causal2.pdf · ·...

1
Automatic Causal Discovery
Richard Scheines
Peter Spirtes, Clark Glymour
Dept. of Philosophy & CALD
Carnegie Mellon

2
Outline
1. Motivation
2. Representation
3. Discovery
4. Using Regression for Causal Discovery

3
1. Motivation
Non-experimental Evidence
Typical Predictive Questions
• Can we predict aggressiveness from Day Care
• Can we predict crime rates from abortion rates 20 years ago
Causal Questions:
• Does attending Day Care cause Aggression?
• Does abortion reduce crime?
Day Care Aggressivenes
John
Mary
A lot
None
A lot
A little

4
Causal Estimation
Manipulated Probability P(Y | X set= x, Z=z)
from
Unmanipulated Probability P(Y | X = x, Z=z)
When and how can we use non-experimental data to tell us about the effect of an intervention?
5
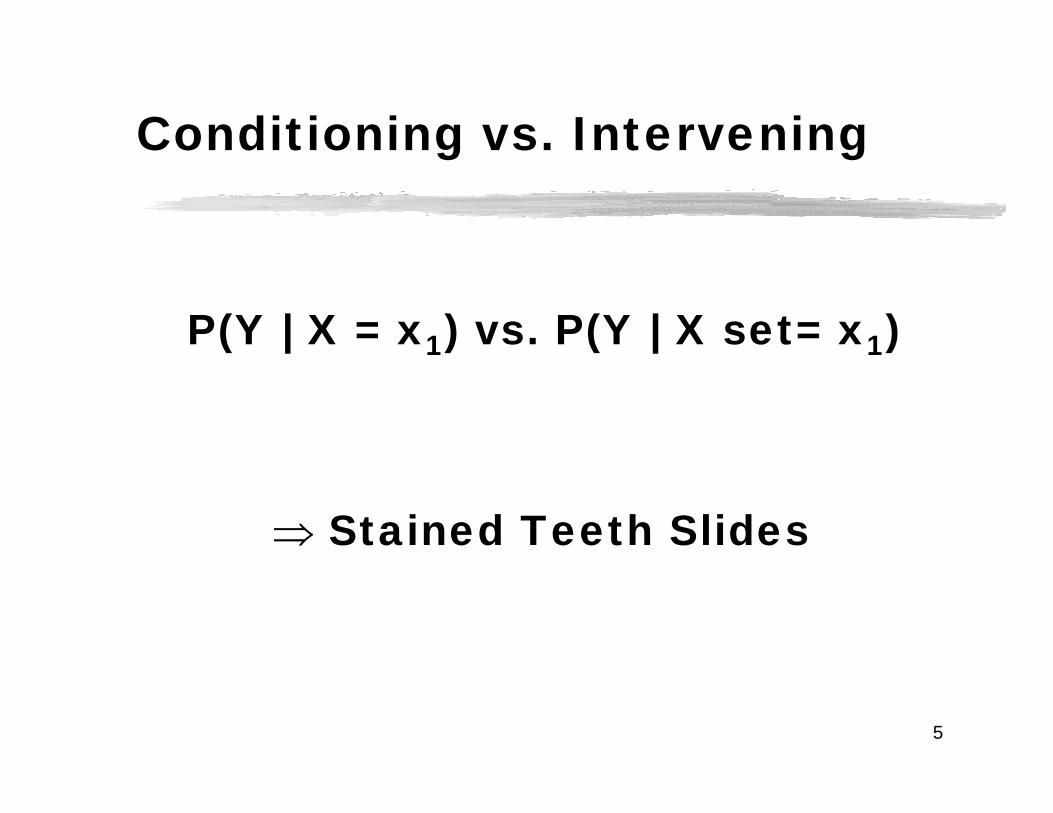
Conditioning vs. Intervening
P(Y | X = x1) vs. P(Y | X set= x1)
⇒ Stained Teeth Slides

6
2. Representation
1. Representing causal structure, and connecting it
to probability
2. Modeling Interventions

7
Causation & Association
X is a cause of Y iff
∃ x1 ≠ x2 P(Y | X set= x1) ≠ P(Y | X set= x2)
X and Y are associated iff
∃ x1 ≠ x2 P(Y | X = x1) ≠ P(Y | X = x2)
8
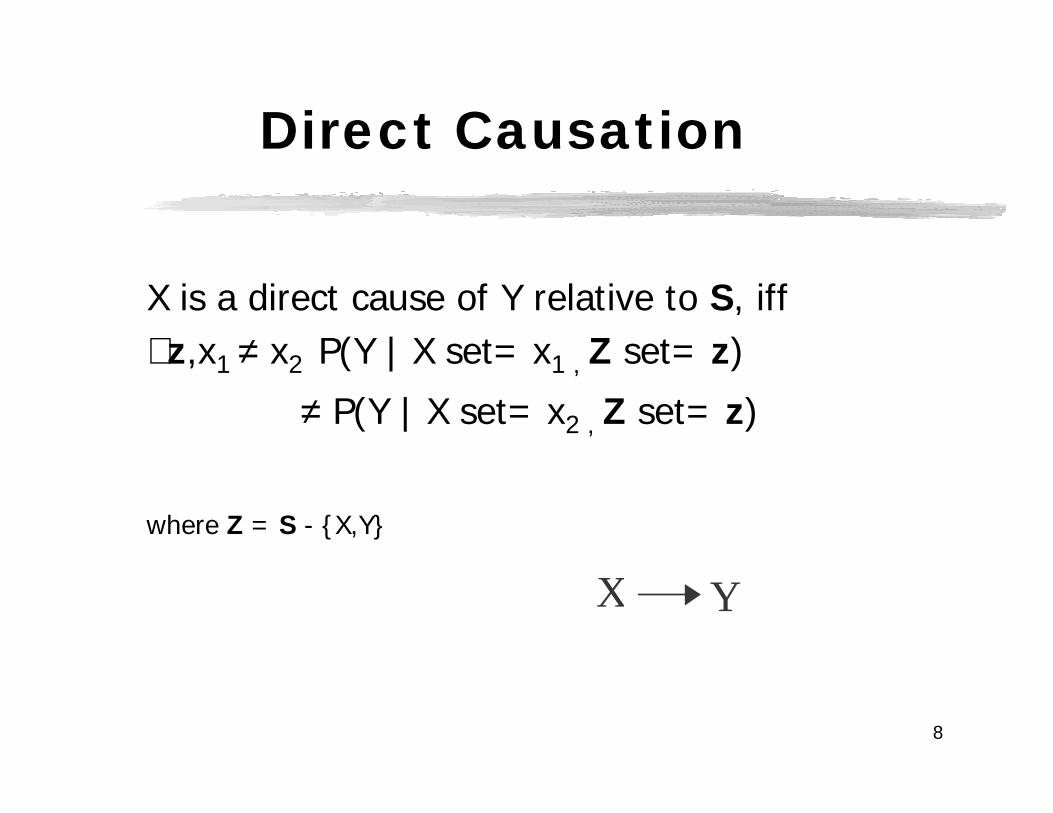
Direct Causation
X is a direct cause of Y relative to S, iff ∃ z,x1 ≠ x2 P(Y | X set= x1 , Z set= z)
≠ P(Y | X set= x2 , Z set= z)
where Z = S - {X,Y}
X Y
9
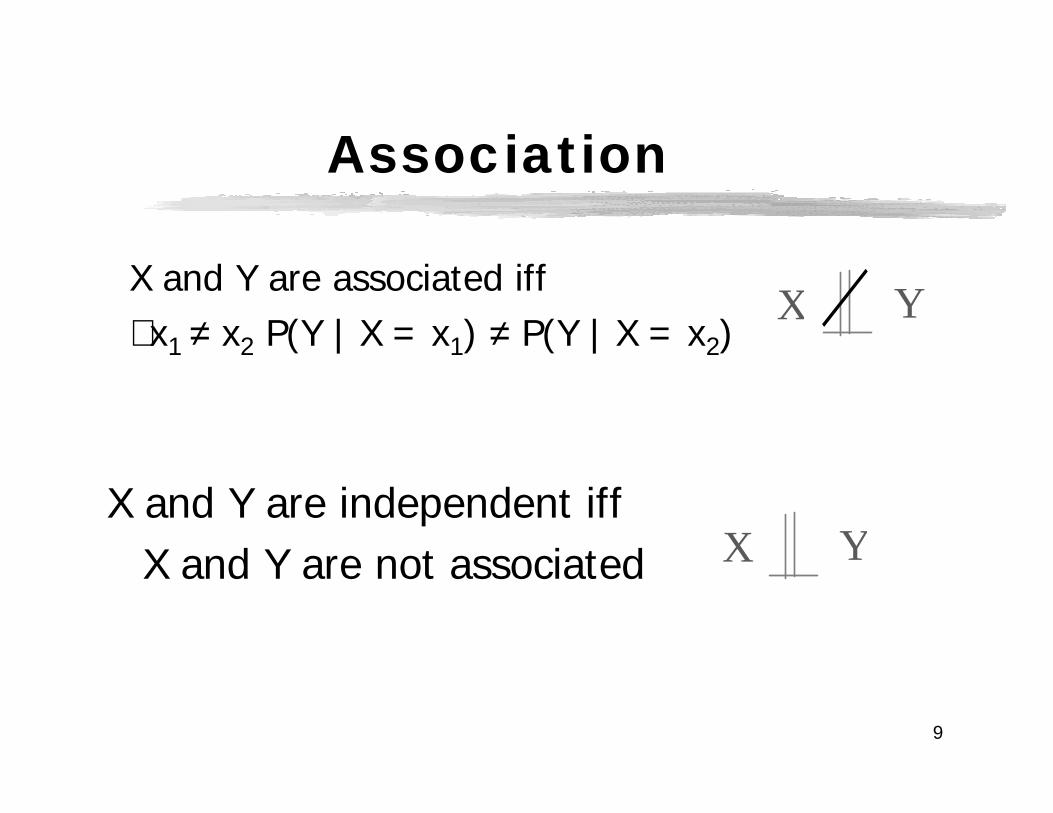
Association
X and Y are associated iff ∃ x1 ≠ x2 P(Y | X = x1) ≠ P(Y | X = x2)
X Y
X YX and Y are independent iff
X and Y are not associated

10
Causal Graphs
Causal Graph G = {V,E} Each edge X → Y represents a direct causal claim:
X is a direct cause of Y relative to V
MatchStruck
MatchTip
Temperature
MatchLights
11
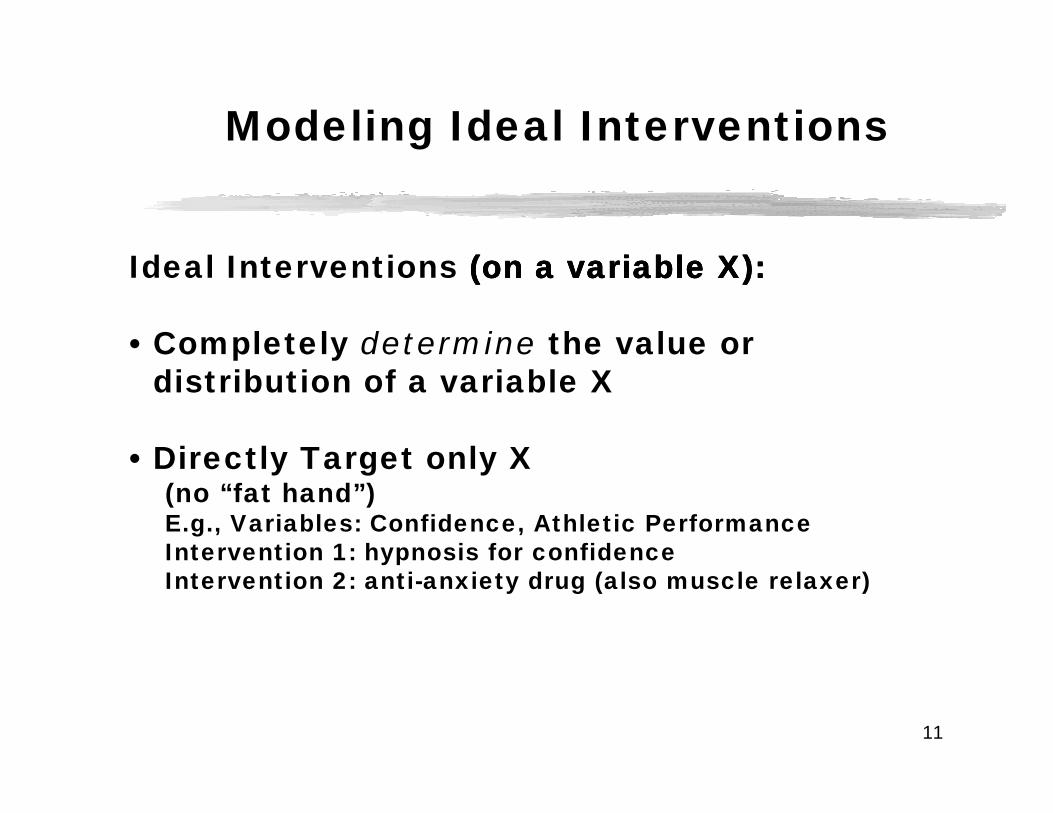
Modeling Ideal Interventions
Ideal Interventions (on a variable X):(on a variable X):(on a variable X):(on a variable X):
• Completely determine the value or distribution of a variable X
• Directly Target only X (no “fat hand”)E.g., Variables: Confidence, Athletic PerformanceIntervention 1: hypnosis for confidenceIntervention 2: anti-anxiety drug (also muscle relaxer)

12
Teeth
StainsSmoking
Pre-experimental SystemPost
Modeling Ideal Interventions
Interventions on the Effect

13
Modeling Ideal Interventions
Teeth
StainsSmoking
Pre-experimental SystemPost
Interventions on the Cause

14
Interventions & Causal Graphs
• Model an ideal intervention by adding an “intervention” variable outside the original system
• Erase all arrows pointing into the variable intervened upon
Exp Inf Rash
Intervene to change Inf
Post-intervention graph?Pre-intervention graph
Exp Inf Rash
I
15
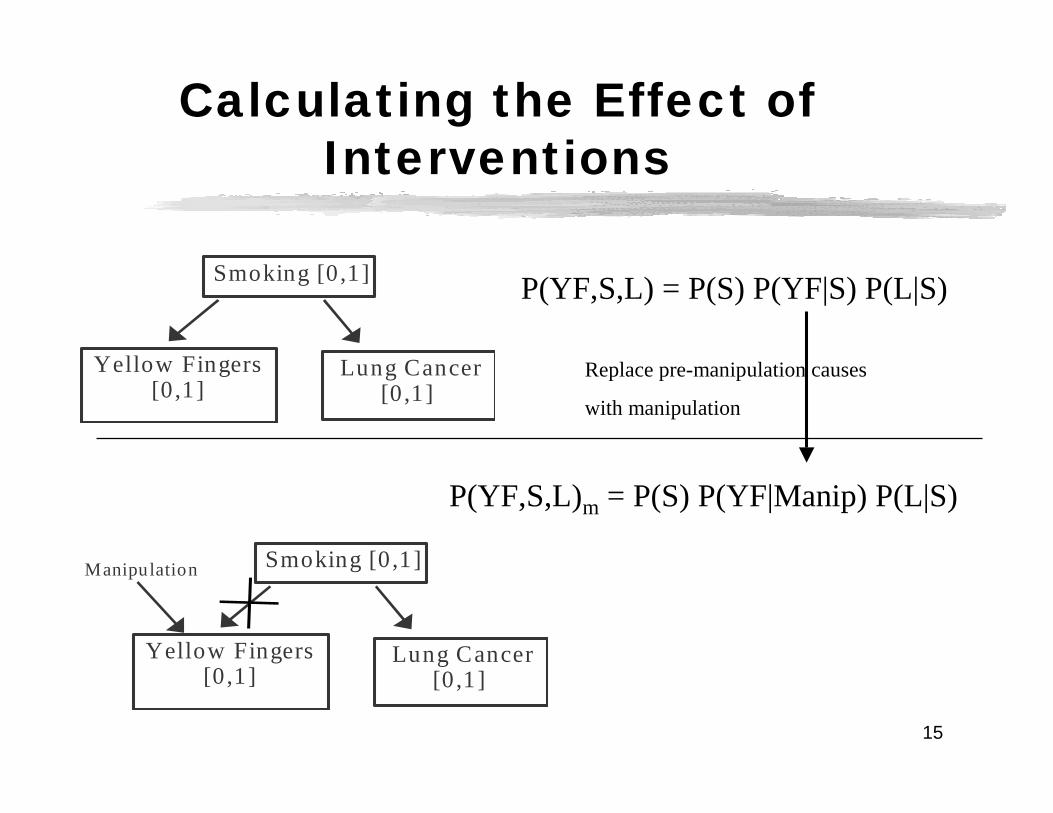
Calculating the Effect of Interventions
Smoking [0,1]
Lung Cancer[0,1]
Yellow Fingers[0,1]
P(YF,S,L) = P(S) P(YF|S) P(L|S)
P(YF,S,L)m = P(S) P(YF|Manip) P(L|S)
Smoking [0,1]
Lung Cancer[0,1]
Yellow Fingers[0,1]
Manipulation
Replace pre-manipulation causes
with manipulation

16
Calculating the Effect of Interventions
Smoking [0,1]
Lung Cancer[0,1]
Yellow Fingers[0,1]
P(YF,S,L) = P(S) P(YF|S) P(L|S)
P(YF,S,L) = P(S) P(YF|Manip) P(L|S)
Smoking [0,1]
Lung Cancer[0,1]
Yellow Fingers[0,1]
Manipulation
P(L|YF)
P(L| YF set by Manip)ProbabilityCalculus
ProbabilityCalculus

17
Causal Structure
StatisticalPredictions
The Markov Condition
Causal Graphs
ZYX
Independence
X _||_ Z | Y
i.e.,
P(X | Y) = P(X | Y, Z)
Markov Condition

18
Causal Markov Axiom
In a Causal Graph G, each variable V is
independent of its non-effects, conditional on its direct causes
in every probability distribution that G can parameterize (generate)

19
Causal Graphs ⇒Independence
Acyclic causal graphs: d-separation ⇔ Causal Markov axiom
Cyclic Causal graphs:• Linear structural equation models : d-separation, not
Causal Markov• For some discrete variable models: d-separation, not
Causal Markov• Non-linear cyclic SEMs : neither

20
Causal Structure ⇒ Statistical Data
X3 | X2X1
X2 X3X1
Causal MarkovAxiom(D-separation)
Independence
AcyclicCausal Graph

21
Causal DiscoveryStatistical Data ⇒ Causal Structure
X3 | X2X1
X2 X3X1
Causal Markov Axiom(D-separation)
Independence
Equivalence Class ofCausal Graphs
X2 X3X1
X2 X3X1
DiscoveryAlgorithm
Background Knowledge
e.g., X2 before X3

22
Equivalence Classes
• D-separation equivalence• D-separation equivalence over a set O• Distributional equivalence• Distributional equivalence over a set O
Two causal models M1 and M2 are distributionally equivalentiff for any parameterization θ1 of M1, there is a parameterization θ2 of M2 such that M1(θ1) = M2(θ2), and vice versa.

23
Equivalence Classes
For example, interpreted as SEM models
M1 and M2 : d-separation equivalent & distributionally equivalentM3 and M4 : d-separation equivalent & not distributionally equivalent
X1 X2
Μ1
X1 X2
ε1
Μ2
ε2
β12 β21X1 X2
Μ3
ε'2ε'1
X3
ε'3
X1 X2
ε2ε1
X3
ε3 Τ3
Τ1
Τ2
Μ4

24
D-separation Equivalence Over a set XXXX
Let X = {X1,X2,X3}, then Ga and Gb
1) are not d-separation equivalent, but
2) are d-separation equivalent over X
X3
T1
X2X1
X3
X2X1 T2
Ga Gb

25
D-separation Equivalence
D-separation Equivalence Theorem (Verma and Pearl, 1988)
Two acyclic graphs over the same set of variables are d-separation equivalent iff they have: • the same adjacencies• the same unshielded colliders

26
Representations ofD-separation Equivalence Classes
We want the representations to:
• Characterize the Independence Relations Entailed by the Equivalence Class
• Represent causal features that are shared by every member of the equivalence class

27
Patterns & PAGs
• Patterns (Verma and Pearl, 1990): graphical representation of an acyclic d-separation equivalence - no latent variables.
• PAGs: (Richardson 1994) graphical representation of an equivalence class includinglatent variable models and sample selection biasthat are d-separation equivalent over a set of measured variables X

28
Patterns
X2X1
X2X1
X2X1
X4X3
X2X1
Possible Edges Example

29
Patterns: What the Edges Mean
X2X1
X2X1X1 → X2 in some members of theequivalence class, and X2 → X1 inothers.
X1 → X2 (X1 is a cause of X2) inevery member of the equivalenceclass.
X2X1X1 and X2 are not adjacent in any
member of the equivalence class

30
Patterns
X2
X4X3
X1
D-separation Equivalence Class
DAG
??????

31
Patterns
X2
X4X3
X1
X2
X4X3
Represents
Pattern
X1 X2
X4X3
X1

32
Patterns
X2 X3X1
Not
Represents
Pattern
X2 X3X1
X2 X3X1
X2 X3X1
X2 X3X1
Not all boolean combinations of orientations ofunoriented pattern adjacencies occur in the equivalenceclass.

33
PAGs: Partial Ancestral Graphs
X2X1
X2X1
X2X1
X2 There is a latent commoncause of X1 and X2
No set d-separates X2 and X1
X1 is a cause of X2
X2 is not an ancestor of X1
X1
X2X1 X1 and X2 are not adjacent
What PAG edges mean.

34
PAGs: Partial Ancestral Graph
X 2
X 3
X 1
X 2
X 3
Represents
PAG
X 1 X 2
X 3
X 1
X 2
X 3
T1
X 1
X 2
X 3
X 1
etc.
T1
T1 T2

35
Search Difficulties
z The number of graphs is super-exponential in the number of observed variables (if there are no hidden variables) or infinite (if there are hidden variables)
z Because some graphs are equivalent, can only predict those effects that are the same for every member of equivalence classy Can resolve this problem by outputting equivalence
classes

36
What Isn’t Possible
z Given just data, and the Causal Markov and Causal Faithfulness Assumptions:y Can’t get probability of an effect being within
a given range without assuming a prior distribution over the graphs and parameters

37
What Is Possible
z Given just data, and the Causal Markov and Causal Faithfulness Assumptions:y There are procedures which are
asymptotically correct in predicting effects (or saying “don’t know”)
38
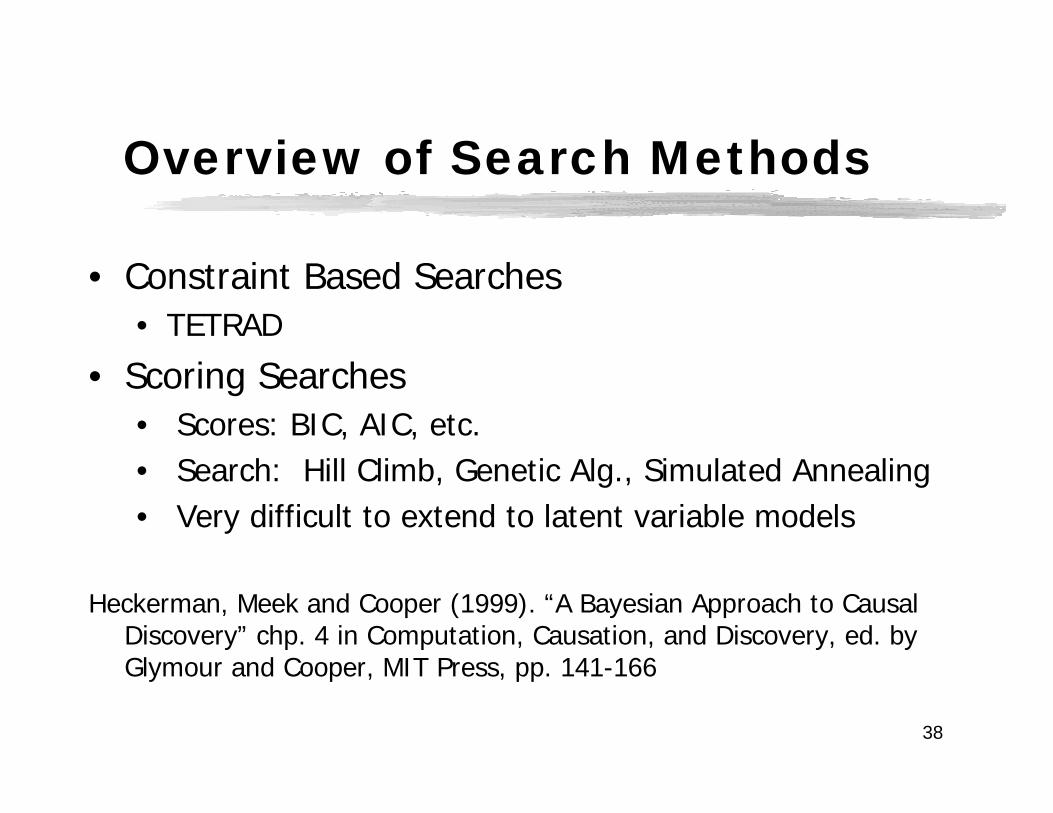
Overview of Search Methods
• Constraint Based Searches• TETRAD
• Scoring Searches• Scores: BIC, AIC, etc.• Search: Hill Climb, Genetic Alg., Simulated Annealing• Very difficult to extend to latent variable models
Heckerman, Meek and Cooper (1999). “A Bayesian Approach to Causal Discovery” chp. 4 in Computation, Causation, and Discovery, ed. byGlymour and Cooper, MIT Press, pp. 141-166

39
Constraint-based Search
• Construct graph that most closely implies conditional independence relations found in sample
• Doesn’t allow for comparing how much better one model is than another
• It is important not to test all of the possible conditional independence relations due to speed and accuracy considerations – FCI search selects subset of independence relations to test

40
Constraint-based Search
• Can trade off informativeness versus speed, without affecting correctness
• Can be applied to distributions where tests of conditional independence are known, but scores aren’t
• Can be applied to hidden variable models (and selection bias models)
• Is asymptotically correct

41
Search for Patterns
Adjacency:
•X and Y are adjacent if they are dependent conditional onall subsets that don’t include X and Y
•X and Y are not adjacent if they are independentconditional on any subset that doesn’t include X and Y

42
Search
X4X3
X2
X1Independencies entailed???

43
Search
X4X3
X2
X1Independencies entailed
X1 _||_ X2
X1_||_ X4 | X3
X2_||_ X4 | X3

44
X1
X2
X3 X4
CausalGraph
Independcies
Begin with:
X1
X2
X3 X4
X1 X2
X1 X4 {X3}
X2 X4 {X3}
Search: Adjacency

45
X1
X2
X3 X4
CausalGraph
Independcies
Begin with:
From
X1
X2
X3 X4
X1 X2
X1 X4 {X3}
X2 X4 {X3}
X1
X2
X3 X4
X1
X2
X3 X4
X1
X2
X3 X4
From
From
X1 X2
X1 X4 {X3}
X2 X4 {X3}

46
Search: Orientation in Patterns
X Y Z
X Z | YX Z | Y
Before OrientationY Unshielded
Collider Non-collider
X Y Z
X Y Z
X Y Z
X Y Z
X Y Z
47
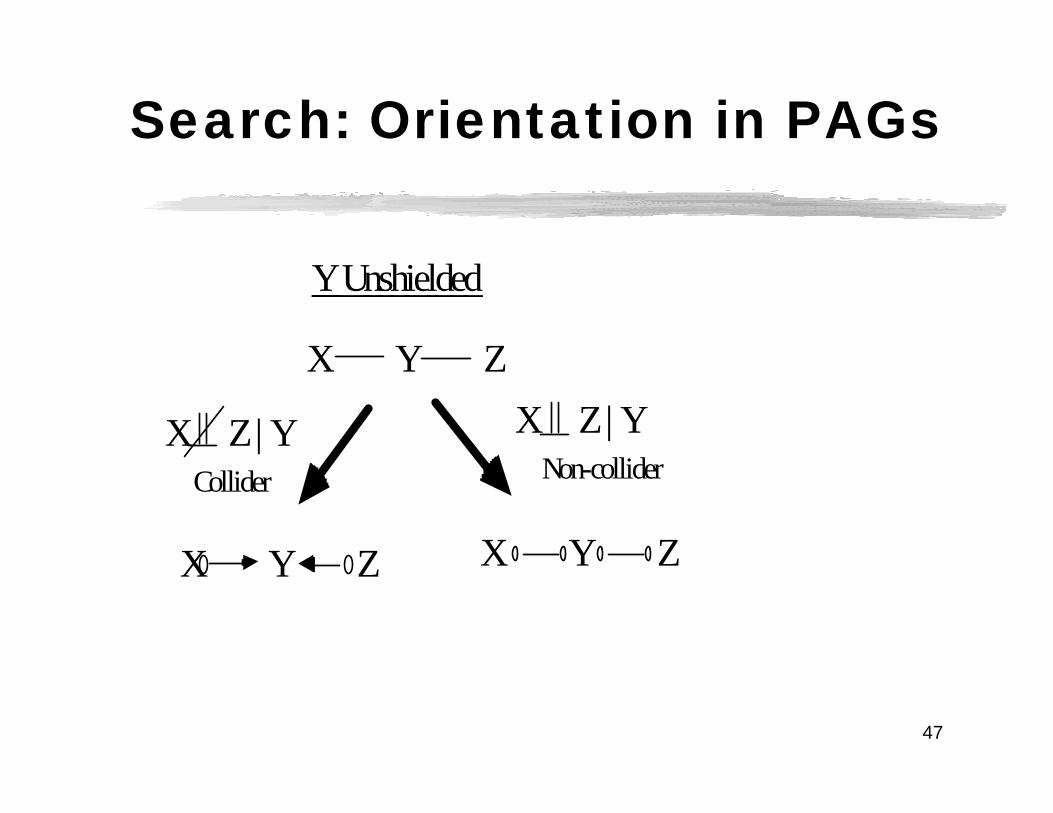
Search: Orientation in PAGs
X Y Z
X Z| YX Z| Y
YUnshielded
Collider Non-collider
X Y Z X Y Z
48
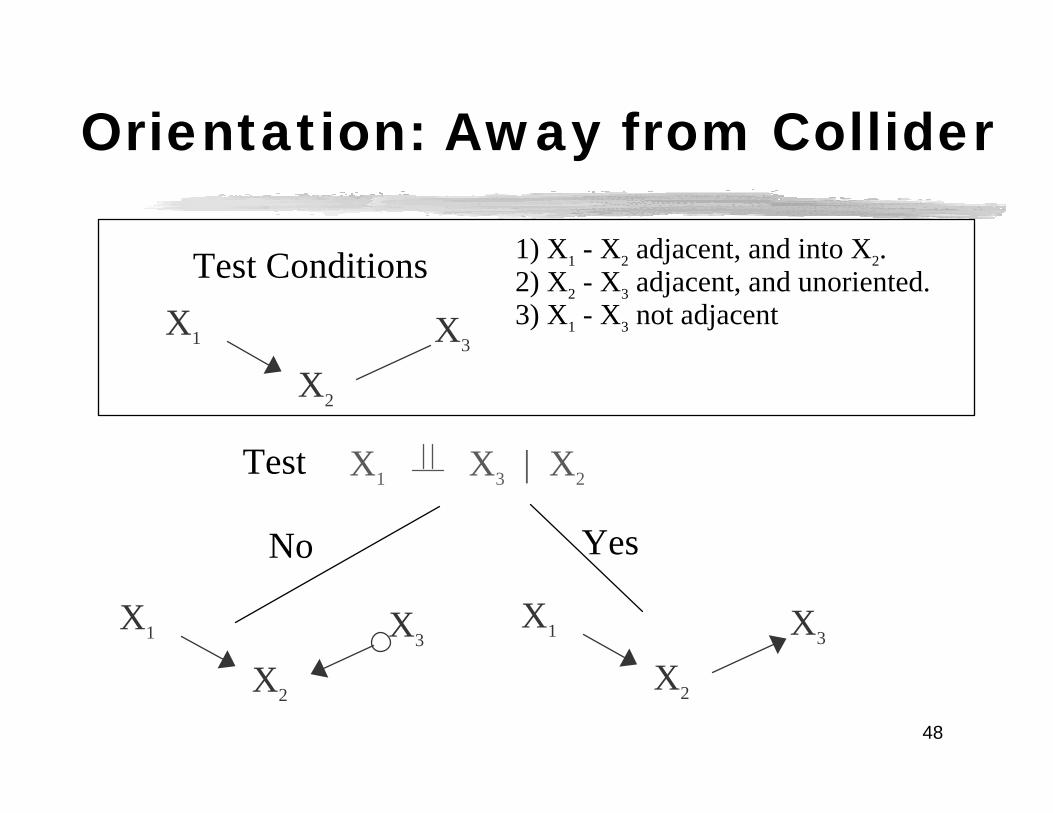
Orientation: Away from Collider
X3
X2
X1
X1 X3 | X2
1) X1 - X2 adjacent, and into X2.2) X2 - X3 adjacent, and unoriented.3) X1 - X3 not adjacent
No Yes
X3
X2
X1 X3
X2
X1
Test
Test Conditions

49
Search: Orientation
X 4X 3
X 2
X 1
X 4X 3
X 2
X 1
X 4X 3
X 2
X 1
X 4X 3
X 2
X 1
X 4X 3
X 2
X 1
P A GP a tte rn
X 4X 3
X 2
X 1
X1 || X2
X1 || X4 | X3
X2 || X4 | X3
After OrientationPhase

50
Knowing when we know enough to calculate the effect of Interventions
Observation: IQ _||_ LeadBackground Knowledge: Lead prior to IQ
Exposure toLead
IQExposure toLead
IQ
SES
Exposure toLead
IQ
PAG
P(IQ | Lead) ≠ P(IQ | Lead set=) P(IQ | Lead) = P(IQ | Lead set=)

51
Knowing when we know enough to calculate the effect of Interventions
Observation: All pairs associatedLead _||_ Grades | IQ
Background Lead prior to IQ priorKnowledge to Grades
Exposure toLead
IQ Grades
PAG
P(IQ | Lead) ≠ P(IQ | Lead set=)
P(Grades | IQ) = P(Grades | IQ set=)
Exposure toLead
IQ
SES
GradesExposure to
LeadIQ Grades
P(IQ | Lead) = P(IQ | Lead set=)
P(Grades | IQ) = P(Grades | IQ set=)

52
Knowing when we know enough to calculate the effect of Interventions
• Causal graph known
• Features of causal graph known
• Prediction algorithm (SGS - 1993)
• Data tell us when we know enough –i.e., we know when we don’t know
53
4. Problems with UsingRegession for Causal
Inference

54
Regression to estimate Causal Influence
• Let V = {X,Y,T}, where
- Y : measured outcome
- measured regressors: X = {X1, X2, …, Xn}- latent common causes of pairs in X U Y: T = {T1, …, Tk}
• Let the true causal model over V be a Structural Equation Model in which each V ∈ V is a linear combination of its direct causes and independent, Gaussian noise.
55
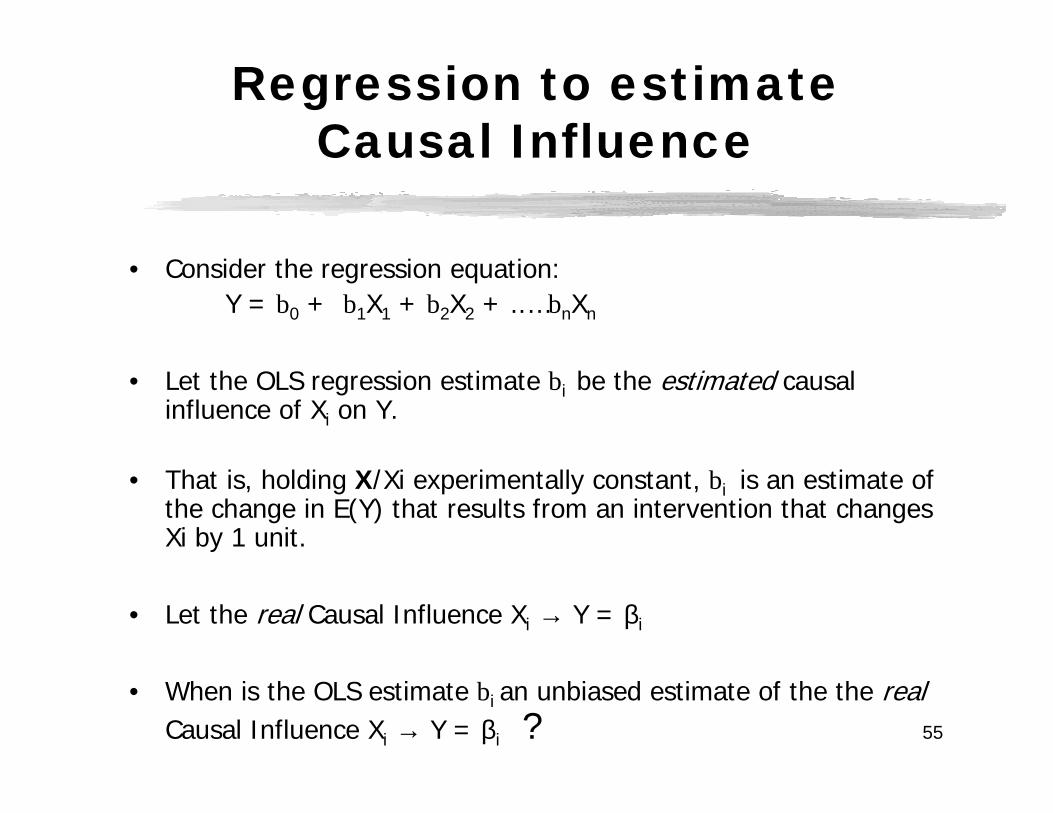
Regression to estimate Causal Influence
• Consider the regression equation:Y = b0 + b1X1 + b2X2 + ..…bnXn
• Let the OLS regression estimate bi be the estimated causal influence of Xi on Y.
• That is, holding X/Xi experimentally constant, bi is an estimate of the change in E(Y) that results from an intervention that changesXi by 1 unit.
• Let the real Causal Influence Xi → Y = βi
• When is the OLS estimate bi an unbiased estimate of the the realCausal Influence Xi → Y = βi ?

56
Regression vs. PAGs to estimate Qualitative Causal Influence
• bi = 0 ⇔ Xi _||_ Y | X/Xi
• Xi - Y not adjacent in PAG over X U Y ⇔ ∃ S ⊆⊆⊆⊆ X/Xi, Xi _||_ Y | S
• So for any SEM over V in which• Xi _||_ Y | X/Xi and
• ∃ S ⊂⊂⊂⊂ X/Xi, Xi _||_ Y | S
PAG is superior to regression wrt errors of commission

57
Regression Example
X2
Y
X3X1
T1
True Model
T2
X2
Y
X3X1
PAG
b1
b2
b3
≠ 0 !
≠ 0 X
≠ 0 X

58
Regression Bias
If• Xi is d-separated from Y conditional on X/Xi
in the true graph after removing Xi → Y, and • X contains no descendant of Y, then:
bi is an unbiased estimate of βi
See “Using Path Diagrams ….”

59
Regression Bias Theorem
If T = ∅ , and X prior to Y, then
bi is an unbiased estimate of βi

60
Tetrad 4 Demo
www.phil.cmu.edu/projects/tetrad

61
Applications
• Genetic Regulatory Networks• Pneumonia• Photosynthesis• Lead - IQ • College Retention• Corn Exports
• Rock Classification• Spartina Grass• College Plans• Political Exclusion• Satellite Calibration• Naval Readiness

Projects: Extending the Class of Models Covered
1) Feedback systems
2) Conservation, or equilibrium systems
3) Parameterizing discrete latent variablemodels

Projects: Search Strategies
1) Genetic Algorithms, Simulated Annealing
2) Automatic Discretization
3) Scoring Searches among Latent Variable Models
4) Latent Clustering & Scale Construction (Ricardo Silva)

64
References
• Causation, Prediction, and Search, 2nd Edition, (2000), by P. Spirtes, C. Glymour, and R. Scheines ( MIT Press)
• Causality: Models, Reasoning, and Inference, (2000), Judea Pearl, Cambridge Univ. Press
• Computation, Causation, & Discovery (1999), edited by C. Glymour and G. Cooper, MIT Press
• Causality in Crisis?, (1997) V. McKim and S. Turner (eds.), Univ. of Notre Dame Press.
• TETRAD IV: www.phil.cmu.edu/projects/tetrad
• Web Course on Causal and Statistical Reasoning : www.phil.cmu.edu/projects/csr/