Automated SAG Mill Speed Control Using On-contact ... · Automated SAG Mill Speed Control Using...
10
Automated SAG Mill Speed Control Using On-contact Vibration Sensors Karl Gugel, Director Digital Control Lab & Professor University of Florida, [email protected] Juan Carlos Rodriguez, Process Control, Gold Corp Minera Peñasquito, México, [email protected] Luis J. Gutiérrez, Automation Specialist, TotalMetric, Chile, [email protected] Abstract A low power vibration sensor with an RF link has been placed directly on a SAG mill shell to measure the rock and ball impact energy occurring at the liners in real-time. Fast Fourier Transforms (FFTs) are then performed on the shell to accurately determine the vibration energy content and shape of the toe primary grinding region. From this new information, a signal called Liner Damage Level (LDL) has been created to automatically adjust the mill speed when high LDL measurements (metal on metal) occur. This paper presents the system components, new expert system rules required and results from a recent installation that reduces liner wear while maintaining normal production numbers at Gold Corp Peñasquito on two 2265 TPH SAG mills. Additional vibration sensors were also positioned at fixed points on the inlet and discharge ends of the mill to yield two real-time volumetric fill levels along with another fill level measurement taken from the mill shell. Examples of these results have been documented in a previous SAG mill conference paper 1 and may be presented at MineExpo, time permitting. However this paper primarily focuses on the new LDL signal integration with the mine's control room fuzzy logic expert system and the preliminary results obtained from this new technology. Process Description The Gold Corp Peñasquito mine is located in the northeast corner of the Zacatecas State in Mexico. The mine site area is approximately 200 km northeast of the city of Zacatecas and it consist of two open pit mines, one concentrator plant with two grinding lines, two rougher banks (one for each grinding line) and two cleaner flotation stages. The design basis for the ore processing facility is 120,000 dry metric tons per day (DTPY) or 40,296,000 dry metric tons per year with an operating basis of 92% availability. In 2015, the Peñasquito mine produced a record high gold production of 860,300 ounces. However gold production for 2016 is expected to decrease between 520,000 and 580,000 ounces as a result of mining lower-grade material in a new section of the pit. Additionally in 2016, silver production is expected to be 22 - 24 million ounces; zinc 375 - 400 million pounds and lead 145 - 155 million pounds 2 . Based on the 2015 production results, the Peñasquito mine is therefore Mexico's largest gold producer, consisting of two open pits that contain gold, silver, lead and zinc: Peñasco and Chile Colorado. The mineral extraction process design consists of primary metal recovery for gold and secondary recovery goals for silver, lead and zinc. The first processing stage of the mineral is the grinding area
Transcript of Automated SAG Mill Speed Control Using On-contact ... · Automated SAG Mill Speed Control Using...

Automated SAG Mill Speed Control Using On-contact Vibration Sensors
Karl Gugel, Director Digital Control Lab & Professor University of Florida,
Juan Carlos Rodriguez, Process Control, Gold Corp Minera Peñasquito, México, [email protected]
Luis J. Gutiérrez, Automation Specialist, TotalMetric, Chile,
Abstract A low power vibration sensor with an RF link has been placed directly on a SAG mill shell to measure the rock and ball impact energy occurring at the liners in real-time. Fast Fourier Transforms (FFTs) are then performed on the shell to accurately determine the vibration energy content and shape of the toe primary grinding region. From this new information, a signal called Liner Damage Level (LDL) has been created to automatically adjust the mill speed when high LDL measurements (metal on metal) occur. This paper presents the system components, new expert system rules required and results from a recent installation that reduces liner wear while maintaining normal production numbers at Gold Corp Peñasquito on two 2265 TPH SAG mills. Additional vibration sensors were also positioned at fixed points on the inlet and discharge ends of the mill to yield two real-time volumetric fill levels along with another fill level measurement taken from the mill shell. Examples of these results have been documented in a previous SAG mill conference paper1 and may be presented at MineExpo, time permitting. However this paper primarily focuses on the new LDL signal integration with the mine's control room fuzzy logic expert system and the preliminary results obtained from this new technology. Process Description The Gold Corp Peñasquito mine is located in the northeast corner of the Zacatecas State in Mexico. The mine site area is approximately 200 km northeast of the city of Zacatecas and it consist of two open pit mines, one concentrator plant with two grinding lines, two rougher banks (one for each grinding line) and two cleaner flotation stages. The design basis for the ore processing facility is 120,000 dry metric tons per day (DTPY) or 40,296,000 dry metric tons per year with an operating basis of 92% availability. In 2015, the Peñasquito mine produced a record high gold production of 860,300 ounces. However gold production for 2016 is expected to decrease between 520,000 and 580,000 ounces as a result of mining lower-grade material in a new section of the pit. Additionally in 2016, silver production is expected to be 22 - 24 million ounces; zinc 375 - 400 million pounds and lead 145 - 155 million pounds2. Based on the 2015 production results, the Peñasquito mine is therefore Mexico's largest gold producer, consisting of two open pits that contain gold, silver, lead and zinc: Peñasco and Chile Colorado. The mineral extraction process design consists of primary metal recovery for gold and secondary recovery goals for silver, lead and zinc. The first processing stage of the mineral is the grinding area

whose purpose is to condition the mineral to an appropriate size and characteristic for further processing in the flotation area. To accomplish this, the ore is ground to a final specific product size using a Semi-Autogenous (SAG) mill in a primary grinding circuit that then feeds a secondary grinding circuit containing a ball mill. There are two lines consisting of this SAG - ball mill combination where the SAGs are denoted as SAG1 and SAG2. Note: Each SAG mill is operated in a closed circuit manner in conjunction with a typical trommel screen and pebble crushing circuit. The ball mills are also operated in a closed circuit employing two hydrocyclone separators. The specifications for SAG1 and SAG2 are shown in Table 1.
Size, [m (ft) (EGL) ] 11.6 x 6.1 / (38 x 20) Operation: closed circuit w/screen classification and pebble crusher circulating load, [%]
23%
Percent of critical speed, operating range, [%] 73% Ball loading, operating, [% v/v] 12-15% Ball loading, max, [% v/v] 20% Mill power transmission loss, estimated, [%] 5% Feed slurry percent solids, [%] 65% New feed rate operating average, [DTPH] 2265DTPH Maximum motor power, [kW] 19.000 kW
Table 1. General Characteristics of SAG1 and SAG2 Process Control The two main variables for controlling the SAG mills are feed and speed. Feed is presently controlled automatically via an expert system that adjusts the amount according to readings taken off of multiple bearing pressure load cells on each mill. Speed control was initially desired to be controlled via a primary variable from a sound measuring system consisting of an array of microphones designed to measure noise and ball impact. However the microphone array based system was abandoned for the following reasons: 1. The system was difficult to properly calibrate and remain tuned. 2. The output information was difficult for the control room operators to understand and use. 3. The operator confidence in the unit was low due to lack of signal correlation with other typical control room process parameters. i.e. mill power and bearing pressure. 4. System maintenance was complex and time consuming. i.e. the microphones required constant cleaning and alignment to yield a clean signal unaffected by other surrounding equipment. Therefore the SAG mill speed could not be controlled using the microphone based signal and instead was manually controlled/set by the control room operator. Thus operation/speed of the mill could and would change significantly based on a particular operator running the mill and their overall level of mill operation experience and skill. Hence it was decided to try vibration control on a 60 day trial with the MillSlicer vibration measurement system on SAG1 in mid 2015. The goal being to bring in some new information both for the expert system and operator to use to optimize the mill speed and further understand the real-time operating conditions inside the mill.
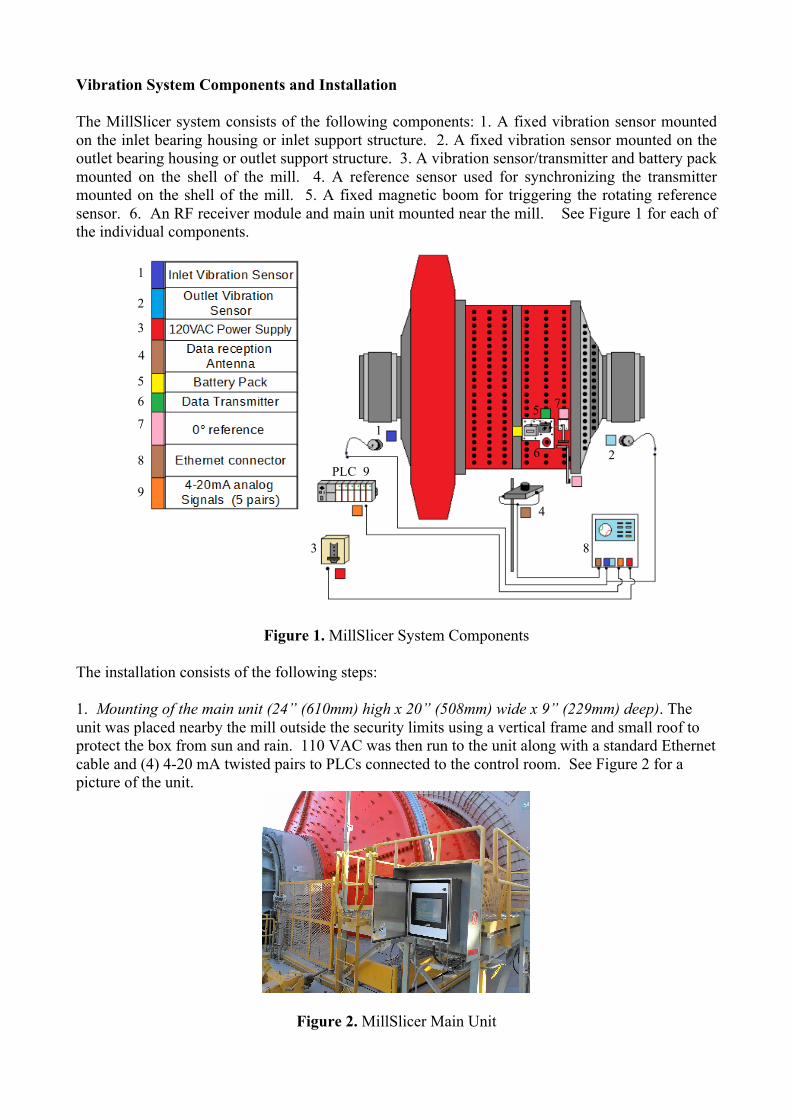
Vibration System Components and Installation The MillSlicer system consists of the following components: 1. A fixed vibration sensor mounted on the inlet bearing housing or inlet support structure. 2. A fixed vibration sensor mounted on the outlet bearing housing or outlet support structure. 3. A vibration sensor/transmitter and battery pack mounted on the shell of the mill. 4. A reference sensor used for synchronizing the transmitter mounted on the shell of the mill. 5. A fixed magnetic boom for triggering the rotating reference sensor. 6. An RF receiver module and main unit mounted near the mill. See Figure 1 for each of the individual components.
Figure 1. MillSlicer System Components
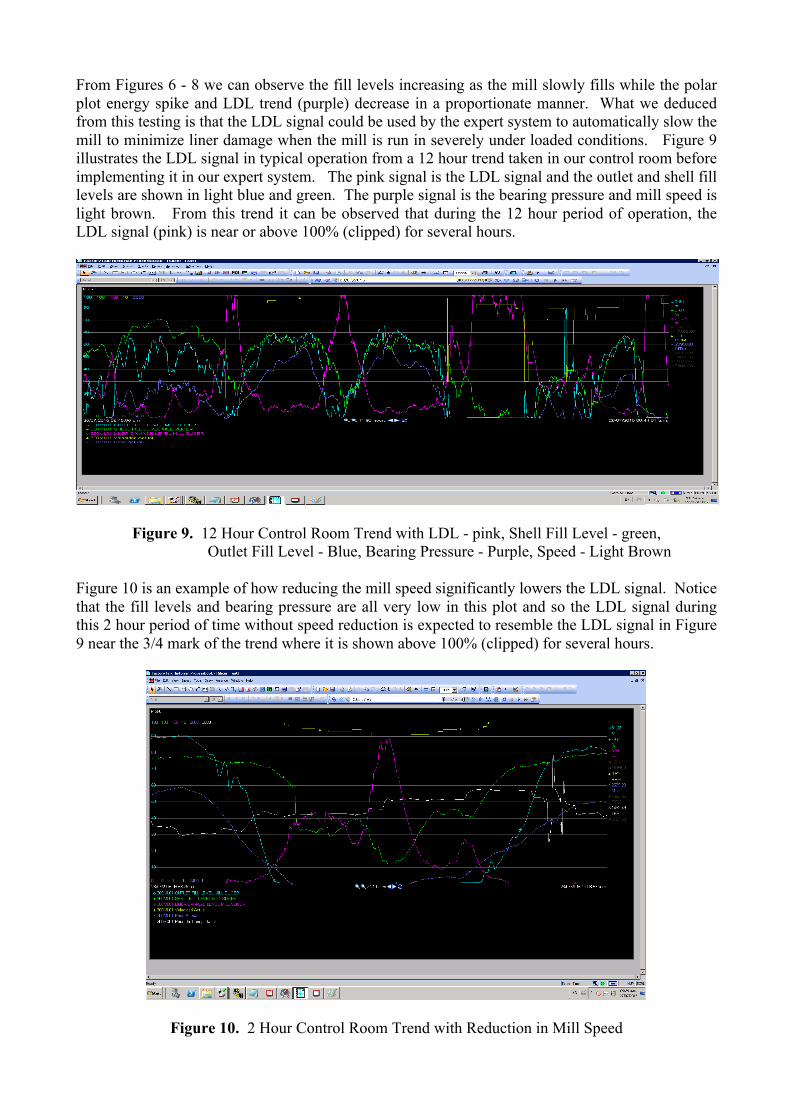
The installation consists of the following steps: 1. Mounting of the main unit (24” (610mm) high x 20” (508mm) wide x 9” (229mm) deep). The unit was placed nearby the mill outside the security limits using a vertical frame and small roof to protect the box from sun and rain. 110 VAC was then run to the unit along with a standard Ethernet cable and (4) 4-20 mA twisted pairs to PLCs connected to the control room. See Figure 2 for a picture of the unit.
Figure 2. MillSlicer Main Unit
1
1
2
2
3
3
4
4
5 5
6
6
7
7
8
8
PLC 9
9

2. Mounting of the fixed sensors. Vibration sensors are mounted at both the inlet and outlet support structures and are used to indicate the real-time volumetric fill level at each end of the mill. In Peñasquito the sensors were installed on the inlet and outlet bearing support structure as illustrated in Figure 3. Each sensor contains a magnetic mount such that it can be quickly and easily affixed to any magnetic surface.
Figure 3. Fixed Sensor Installation 3. Shell Sensor/RF Transmitter, Battery Pack and Reference Sensor Installation. The shell sensor/radio transmitter, battery pack and magnetic sensor used to detect the zero (0°) degree reference were installed during regularly scheduled mill maintenance. All the components have high strength magnetic bases such that all components are quickly and firmly mounted to the mill shell with no risk of detachment when the mill is rotating. These components can be seen in Fig. 4.
Figure 4. Battery Pack, Transmitter/Sensor and Reference Sensor (left to right)

4. Magnetic Boom Alignment. A magnetic boom is used to trigger the reference sensor on the mill every rotation of the mill. Figure 5 shows the reference sensor mounted on the mill (left) and fixed position magnetic boom (right). Note: The gap between the magnetic boom and reference sensor must be approximately 2 cm when the sensor passes under the magnetic tip of the boom.
Figure 5. Reference Sensor and Fixed Magnetic Tipped Boom 5. RF Receiver Installation. The RF receiver was placed on a pole nearby the magnetic tipped boom because data is transmitted every revolution just after the reference sensor passes the magnetic boom tip. A pair of cables are run between the receiver and main unit to facilitate data communication and power. All shell sampled signals are updated every mill revolution and this information along with the fixed sensors is available for viewing on the main unit (via the Ethernet connection to the control room) and through (4) 4-20 mA signal outputs to PLCs. Operational Trends & Benefits The benefits of MillSlicer for enhancing mill operation are both significant and important because they provide detailed information that an operator can use to gain a deeper understanding of the current operational status of the SAG mill. Information that was previously inaccessible and hidden now becomes visible and useful for both the operator and expert system. This new information consists of three volumetric fill levels derived from the inlet, outlet and shell vibration sensors as well as a new polar plot that illustrates the shoulder and toe positions of the internal mill ball trajectory. The shell sensor created 360 degree vibration polar plot profile is also used to generate a new signal called Liner Damage Level (LDL). LDL represents a real-time indication of the amount of energy being transferred (banged) to the internal liners by the ball strikes. Note: Both the toe position and LDL signal are also available as 4-20 mA outputs for PLC reading. For the initial installation, we viewed the new signals on the main unit via Remote Desktop in the control room. We found them to correlate well with the other process variables and they yielded new helpful information that will now be discussed. Figures 6 - 8 are examples of trends observed on the main unit over a 1.5 hour period of time when the mill was slowly being filled. The polar plot on the top left of each window plots the ball strike energy increasing towards the center of the

polar plot. When the mill is empty (Figure 6), one observes a very large spike in the polar plots that gradually decreases as the ball strike energy decreases with the mill becoming more full (Figure 8). The yellow line on each trend is the computed toe angle (90 to 180 degrees) while red, blue and green signals correspond to the three fill level signals derived from the inlet, outlet and shell sensors. The purple signal is the Liner Damage Level (LDL) that is initially 100% in Figure 6 and near 0% by the end of Figure 8. Figure 6. MillSlicer Polar Plot, Fill Levels & LDL Signals at 02:10 pm (start-up)
Figure 7. MillSlicer Polar Plot, Fill Levels & LDL Signals at 02:30 pm Figure 8. MillSlicer Polar Plot, Fill Levels & LDL Signals at 02:50 pm
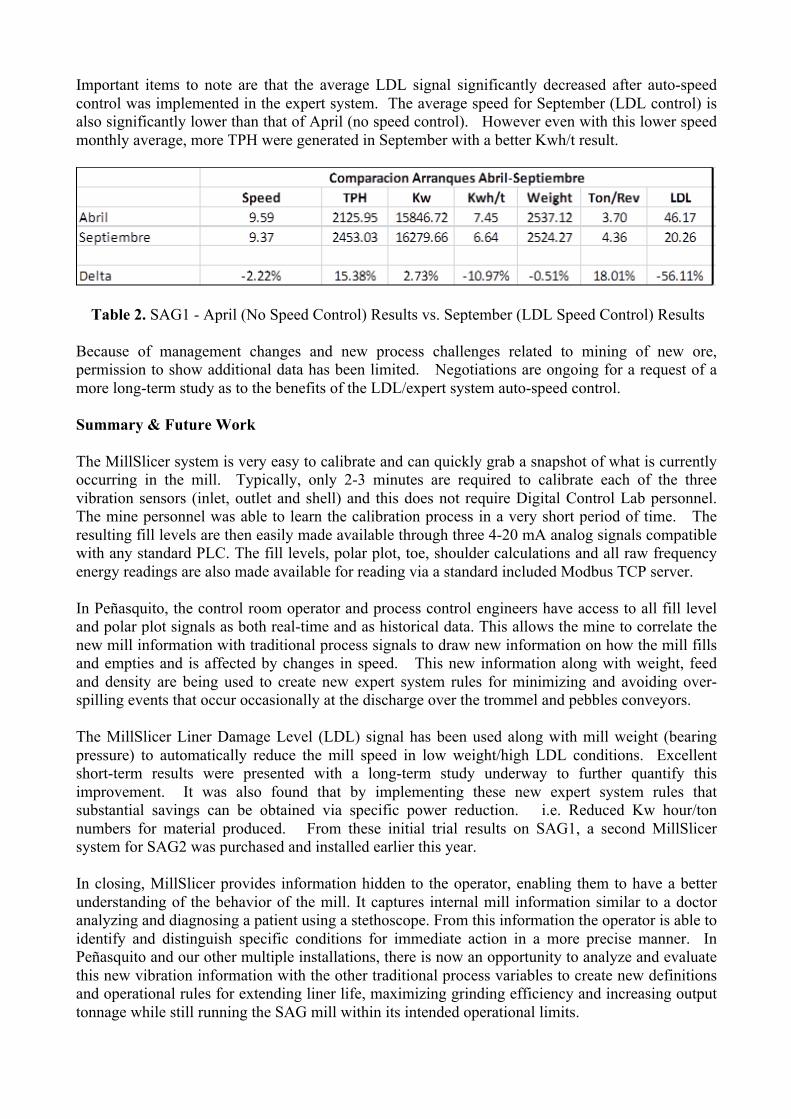
From Figures 6 - 8 we can observe the fill levels increasing as the mill slowly fills while the polar plot energy spike and LDL trend (purple) decrease in a proportionate manner. What we deduced from this testing is that the LDL signal could be used by the expert system to automatically slow the mill to minimize liner damage when the mill is run in severely under loaded conditions. Figure 9 illustrates the LDL signal in typical operation from a 12 hour trend taken in our control room before implementing it in our expert system. The pink signal is the LDL signal and the outlet and shell fill levels are shown in light blue and green. The purple signal is the bearing pressure and mill speed is light brown. From this trend it can be observed that during the 12 hour period of operation, the LDL signal (pink) is near or above 100% (clipped) for several hours.
! Figure 9. 12 Hour Control Room Trend with LDL - pink, Shell Fill Level - green, Outlet Fill Level - Blue, Bearing Pressure - Purple, Speed - Light Brown Figure 10 is an example of how reducing the mill speed significantly lowers the LDL signal. Notice that the fill levels and bearing pressure are all very low in this plot and so the LDL signal during this 2 hour period of time without speed reduction is expected to resemble the LDL signal in Figure 9 near the 3/4 mark of the trend where it is shown above 100% (clipped) for several hours.
!
Figure 10. 2 Hour Control Room Trend with Reduction in Mill Speed

Expert System LDL Integration & Results Automatic speed control was implemented using both the LDL signal and bearing pressure that the mine calls "mill weight". GC Peñasquito calls the bearing pressure combination a weight because it is derived from multiple bearing pressure signals in a vector summation manner where the magnitude of a particular component is dependent on the sensor vector direction. Thus if the summed bearing pressure or "weight" is low and LDL is high, the expert system was programmed to slow down the mill in a gradual manner. The specifics for this new expert system fuzzy control are now shown below: 1. The MillSlicer LDL fuzzy signal control is broken down into three clusters with centers {17%, 40%, 60%}. 2. If the weight < 2500 AND Density > 55% then the LDL signal is measured and allowed to reduce the speed. i.e. High condition: LDL > 35, Mid condition 15< LDL <35, Low condition LDL < 20. For a high condition, the speed is reduced proportionally from 0.05 to 0.1 RPMs every 4 minutes. 3. If the weight begins to increase above 2550, the speed should be incrementally increased even if LDL is in a high condition. For a graphical representation of the above rules and additional detail, see Figure 11.
!
Figure 11. Fuzzy Logic Speed Control Matrix - LDL vs. Weight (Bearing Pressure) The preliminary results comparing LDL mill speed control versus no speed control are now presented in Table 2. For both the end of March and August 2015, shutdowns on SAG1 were scheduled for new liner installation. Table 2 therefore shows the monthly data taken immediately after each shutdown. April (Abril) has no automatic speed control while September (Septiembre) shows the results of the new LDL speed control expert system implementation.
Important items to note are that the average LDL signal significantly decreased after auto-speed control was implemented in the expert system. The average speed for September (LDL control) is also significantly lower than that of April (no speed control). However even with this lower speed monthly average, more TPH were generated in September with a better Kwh/t result.
Table 2. SAG1 - April (No Speed Control) Results vs. September (LDL Speed Control) Results Because of management changes and new process challenges related to mining of new ore, permission to show additional data has been limited. Negotiations are ongoing for a request of a more long-term study as to the benefits of the LDL/expert system auto-speed control. Summary & Future Work The MillSlicer system is very easy to calibrate and can quickly grab a snapshot of what is currently occurring in the mill. Typically, only 2-3 minutes are required to calibrate each of the three vibration sensors (inlet, outlet and shell) and this does not require Digital Control Lab personnel. The mine personnel was able to learn the calibration process in a very short period of time. The resulting fill levels are then easily made available through three 4-20 mA analog signals compatible with any standard PLC. The fill levels, polar plot, toe, shoulder calculations and all raw frequency energy readings are also made available for reading via a standard included Modbus TCP server. In Peñasquito, the control room operator and process control engineers have access to all fill level and polar plot signals as both real-time and as historical data. This allows the mine to correlate the new mill information with traditional process signals to draw new information on how the mill fills and empties and is affected by changes in speed. This new information along with weight, feed and density are being used to create new expert system rules for minimizing and avoiding over-spilling events that occur occasionally at the discharge over the trommel and pebbles conveyors. The MillSlicer Liner Damage Level (LDL) signal has been used along with mill weight (bearing pressure) to automatically reduce the mill speed in low weight/high LDL conditions. Excellent short-term results were presented with a long-term study underway to further quantify this improvement. It was also found that by implementing these new expert system rules that substantial savings can be obtained via specific power reduction. i.e. Reduced Kw hour/ton numbers for material produced. From these initial trial results on SAG1, a second MillSlicer system for SAG2 was purchased and installed earlier this year. In closing, MillSlicer provides information hidden to the operator, enabling them to have a better understanding of the behavior of the mill. It captures internal mill information similar to a doctor analyzing and diagnosing a patient using a stethoscope. From this information the operator is able to identify and distinguish specific conditions for immediate action in a more precise manner. In Peñasquito and our other multiple installations, there is now an opportunity to analyze and evaluate this new vibration information with the other traditional process variables to create new definitions and operational rules for extending liner life, maximizing grinding efficiency and increasing output tonnage while still running the SAG mill within its intended operational limits.

References 1. "Optimal SAG Mill Control Using Vibration & Digital Signal Processing Techniques" by K. Gugel, Sixth International Conference on Semi-autogenous & High Pressure Grinding Technology Proceedings, SAG Conference 2015, Vancouver, September 2015. 2. Public information published in the corporate WEB Page of Goldcorp, http://www.goldcorp.com /English /Unrivalled-Assets/Mines-and-Projects/Latin-America/Operations/Penasquito/Overview-and-Operating-Highlights/default.aspx.