Automated M&V of Transactive Energy Systems, Load Shape ...€¦ · Lawrence Berkeley National...
11
December 10-11, 2014, Portland, Oregon GridWise ® Architecture Council Mary Ann Piette Lawrence Berkeley National Laboratory Automated M&V of Transactive Energy Systems, Load Shape Analysis and Consumer Engagement
Transcript of Automated M&V of Transactive Energy Systems, Load Shape ...€¦ · Lawrence Berkeley National...

December 10-11, 2014, Portland, Oregon
GridWise® Architecture Council
Mary Ann Piette
Lawrence Berkeley National Laboratory
Automated M&V of Transactive Energy Systems,
Load Shape Analysis and Consumer Engagement

2
Introduction Transactive Networks needs ability to predict electric load
• Predict baseline load for short time intervals
• Predict baseline load for long time intervals EE savings
• Operate buildings more efficiently (lighting and HVAC) for
saving energy and $
• Improve Fault Detection and Diagnostics - find and fix
operational problems

3
Baseline and Load Shape M&V Tools
o Time-of-week indicator variables, αi
o Piecewise linear temperature dependence, βj
o New innovation to more heavily weight
more recent data for DR vs EE event
When building is in occupied mode:
When the building is in unoccupied mode:
ˆ L o(ti,T(ti)) = a i + b jTc, j (ti)j=1
6
å [Mathieu, Price, Kiliccote, and Piette, 2011.
IEEE Transactions on Smart Grid
3
L̂u(ti,T(ti )) =ai + buT(ti )

4
Customer Facing Applications • Analysis of building’s its ability to “shut down” at night
• Analysis of elec data in conjunction with weather to evaluate HVAC
operations
• Analysis of elec data in conjunction with interval water usage data to
determine load shape issues
• Analysis of elec and weather to determine if building’s HVAC system
is behaving properly
http://www.cs.berkeley.edu/~stevedh/smap2/

5
Comparing Day and Night Energy (1 of 2)
Average electric load during "operating hours" and "non-operating hours" on
each day of week, for a library. Width of bar proportional to # of hr ; height is kW.

6
Comparing Day and Night Energy Use (2 of 2)
Average load during “operating “and “non-operating hours” each day of
week, for a building that includes a homeless shelter

7
24x7 Operational Problem- Diagnosed
with Internal Water Data

8
Small Office – Heat Pump Problem
15-min elec load as function of time (black) w/ baseline prediction (blue)

9
Volttron Agent Publically Available
Load shape agent available in Volttron
http://gridoptics.pnnl.gov/VOLTTRON/
https://github.com/VOLTTRON/volttron/tree/2.x/Agents/BaselineAgent
10
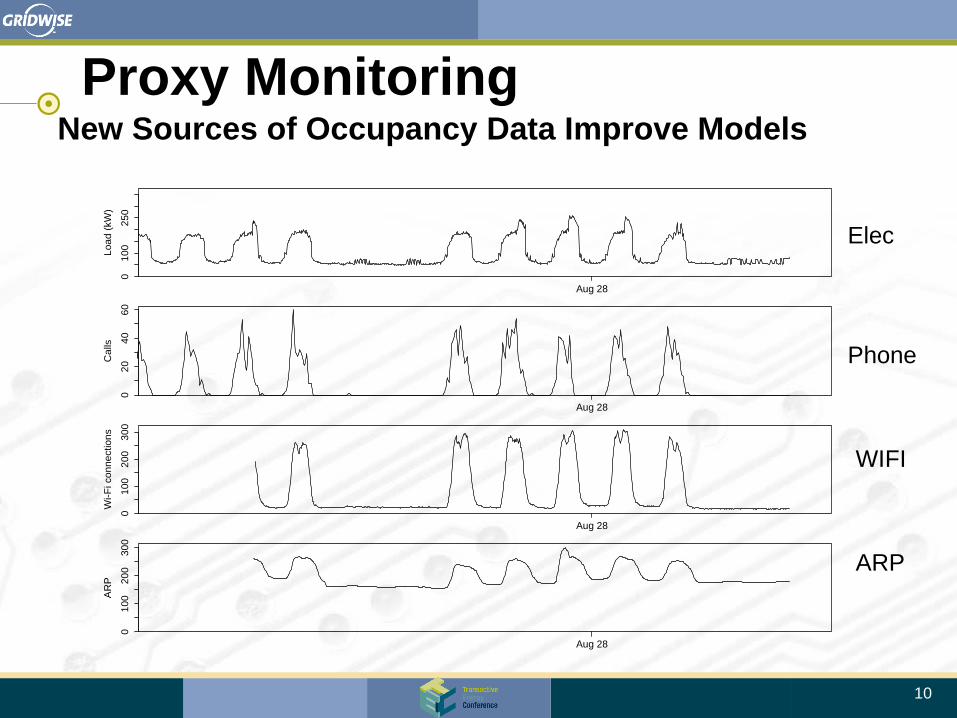
Proxy Monitoring New Sources of Occupancy Data Improve Models
Aug 28
01
00
25
0
Lo
ad
(kW
)
Aug 28
02
04
06
0
Ca
lls
Aug 28
01
00
20
03
00
Wi-
Fi co
nn
ectio
ns
Aug 28
01
00
20
03
00
AR
P
Elec
Phone
WIFI
ARP

11
Summary
• New tools for automated M&V of long term and
short term transactions and fault diagnostics
• Addition of occupancy data will enhance,
control, M&V and prediction of grid
transactions
• New business models and customer
engagement for most value
• New opportunities for
transactive energy systems
and new value to
customers