
Automated Detection and Forecasting of COVID-19 using Deep ...
20
1 Automated Detection and Forecasting of COVID-19 using Deep Learning Techniques: A Review Afshin Shoeibi, Marjane Khodatars, Roohallah Alizadehsani, Member, IEEE, Navid Ghassemi, Mahboobeh Jafari, Parisa Moridian, Ali Khadem, Delaram Sadeghi, Sadiq Hussain, Assef Zare, Zahra Alizadeh Sani, Javad Bazeli and Fahime Khozeimeh, Abbas Khosravi, Member, IEEE, Saeid Nahavandi, Fellow, IEEE, U. Rajendra Acharya, Senior Member, IEEE, Peng Shi, Fellow, IEEE Abstract—Coronavirus, or COVID-19, is a hazardous disease that has endangered the health of many people around the world by directly affecting the lungs. COVID-19 is a medium-sized, coated virus with a single-stranded RNA. This virus has one of the largest RNA genomes and is approximately 120 nm. The X-Ray and computed tomography (CT) imaging modalities are widely used to obtain a fast and accurate medical diagnosis. Identifying COVID-19 from these medical images is extremely challenging as it is time-consuming, demanding, and prone to human errors. Hence, artificial intelligence (AI) methodologies can be used to obtain consistent high performance. Among the AI methodologies, deep learning (DL) networks have gained much popularity compared to traditional machine learning (ML) methods. Unlike ML techniques, all stages of feature extraction, feature selection, and classification are accomplished automatically in DL models. In this paper, a complete survey of studies on the application of DL techniques for COVID-19 diagnostic and automated segmentation of lungs is discussed, concentrating on works that used X-Ray and CT images. Additionally, a review of papers on the forecasting of coronavirus prevalence in different parts of the world with DL techniques is presented. Lastly, the challenges faced in the automated detection of COVID-19 using DL techniques and directions for future research are discussed. A. Shoeibi and N. Ghassemi are with the Faculty of Electrical Engineering, Biomedical Data Acquisition Lab (BDAL), K. N. Toosi University of Tech- nology, Tehran, Iran, and the Computer Engineering Department, Ferdowsi University of Mashhad, Mashhad, Iran. M. Khodatars and D. Sadeghi are with the Dept. of Medical Engineering, Mashhad Branch, Islamic Azad University, Mashhad, Iran. R. Alizadehsani, A. Khosravi and S. Nahavandi. are with the Institute for Intelligent Systems Research and Innovation (IISRI), Deakin University, Victoria 3217, Australia. (Corresponding author: Abbas Khosravi, email: [email protected]). M. Jafari is with Electrical and Computer Engineering Faculty, Semnan University, Semnan, Iran. P. Moridian is with the Faculty of Engineering, Science and Research Branch, Islamic Azad University, Tehran, Iran. A. Khadem is with the Faculty of Electrical Engineering, K. N. Toosi University of Technology, Tehran, Iran. Sadiq Hussain is System Administrator at Dibrugarh University, Assam, India, 786004. A. Zare is with Faculty of Electrical Engineering, Gonabad Branch, Islamic Azad University, Gonabad, Iran. Z. Alizadeh Sani is with Rajaie Cardiovascular Medical and Research Center, and Iran University of Medical Sciences, Tehran, Iran. F. Khozeimeh is with Faculty of Medicine, Mashhad University of Medical Sciences, Mashhad, Iran. U. R. Acharya is with the Dept. of Electronics and Computer Engineering, Ngee Ann Polytechnic, Singapore 599489, Singapore, the Dept. of Biomedical Informatics and Medical Engineering, Asia University, Taichung, Taiwan, and the Dept. of Biomedical Engineering, School of Science and Technology, Singapore University of Social Sciences, Singapore. P. Shi is with the School of Electrical and Electronic Engineering, Univer- sity of Adelaide, Adelaide, SA 5005, Australia. Index Terms—COVID-19, Diagnosis, Deep Learning, Classifi- cation, Segmentation, Forecasting. I. I NTRODUCTION The novel COVID-19 virus came to light in December 2019 in Wuhan Province, China, where it originated from animals and quickly spread around the world [1]. The easiest way to transmit COVID-19 is through the air and physical contact, such as hand contact with an infected person [2]. The virus inserts itself into the lung cells through the respiratory system and replicates there, destroying these cells [3]. COVID-19 comprises an RNA and is very difficult to diagnose and treat due to its mutation characteristics [4]. The most common symptoms of COVID-19 include fever, cough, and shortness of breath, dizziness, headache, and muscle aches [5]. The virus is so perilous and can provoke the death of people with weakened immune systems [6]. Infectious disease specialists and physicians around the world are working to discover a treatment for the disease. COVID-19 is currently the leading cause of death for thousands of countries worldwide, including the USA, Spain, Italy, China, the United Kingdom, Iran, and others. Figure 1 exhibits the latest number of infected people worldwide due to COVID-19. The detection of COVID-19 is crucially significant and vital in its early stages. Various methods have been proposed to diagnose COVID-19, containing a variety of medical imaging techniques, blood tests (CBCs), and PCR. According to the WHO, all diagnoses of corona disease must be confirmed by reverse-transcription polymerase chain reaction (RT-PCR) [7]. However, testing with RT-PCR is highly time-consuming, and this issue is risky for people with COVID-19. Hence, first, medical imaging is carried out for the primary detection of COVID-19, then the RT-PCR test is performed to aid the physicians in making final accurate detection. Two medical imaging techniques, X-ray and CT-scan, are employed to diagnose COVID-19 [8], [9]. X-ray modality is the first procedure to diagnose COVID- 19, which has the advantage of being inexpensive and low-risk from radiation hazards to human health [10], [11]. In the X- ray method, detecting COVID-19 is a relatively complicated task. In these images, the radiologist must attentively recognize the white spots that contain water and pus, which is very pro- longed and problematic. A radiologist or specialist doctor may also mistakenly diagnose other diseases, such as pulmonary tuberculosis, as COVID-19 [12]. arXiv:2007.10785v3 [cs.LG] 27 Jul 2020
Transcript of Automated Detection and Forecasting of COVID-19 using Deep ...

1
Automated Detection and Forecasting of COVID-19using Deep Learning Techniques: A Review
Afshin Shoeibi, Marjane Khodatars, Roohallah Alizadehsani, Member, IEEE, Navid Ghassemi, Mahboobeh Jafari,Parisa Moridian, Ali Khadem, Delaram Sadeghi, Sadiq Hussain, Assef Zare, Zahra Alizadeh Sani, Javad Bazeli
and Fahime Khozeimeh, Abbas Khosravi, Member, IEEE, Saeid Nahavandi, Fellow, IEEE,U. Rajendra Acharya, Senior Member, IEEE, Peng Shi, Fellow, IEEE
Abstract—Coronavirus, or COVID-19, is a hazardous diseasethat has endangered the health of many people around the worldby directly affecting the lungs. COVID-19 is a medium-sized,coated virus with a single-stranded RNA. This virus has one ofthe largest RNA genomes and is approximately 120 nm. TheX-Ray and computed tomography (CT) imaging modalities arewidely used to obtain a fast and accurate medical diagnosis.Identifying COVID-19 from these medical images is extremelychallenging as it is time-consuming, demanding, and prone tohuman errors. Hence, artificial intelligence (AI) methodologiescan be used to obtain consistent high performance. Amongthe AI methodologies, deep learning (DL) networks havegained much popularity compared to traditional machinelearning (ML) methods. Unlike ML techniques, all stagesof feature extraction, feature selection, and classification areaccomplished automatically in DL models. In this paper, acomplete survey of studies on the application of DL techniquesfor COVID-19 diagnostic and automated segmentation of lungsis discussed, concentrating on works that used X-Ray and CTimages. Additionally, a review of papers on the forecasting ofcoronavirus prevalence in different parts of the world withDL techniques is presented. Lastly, the challenges faced in theautomated detection of COVID-19 using DL techniques anddirections for future research are discussed.
A. Shoeibi and N. Ghassemi are with the Faculty of Electrical Engineering,Biomedical Data Acquisition Lab (BDAL), K. N. Toosi University of Tech-nology, Tehran, Iran, and the Computer Engineering Department, FerdowsiUniversity of Mashhad, Mashhad, Iran.
M. Khodatars and D. Sadeghi are with the Dept. of Medical Engineering,Mashhad Branch, Islamic Azad University, Mashhad, Iran.
R. Alizadehsani, A. Khosravi and S. Nahavandi. are with the Institutefor Intelligent Systems Research and Innovation (IISRI), Deakin University,Victoria 3217, Australia. (Corresponding author: Abbas Khosravi, email:[email protected]).
M. Jafari is with Electrical and Computer Engineering Faculty, SemnanUniversity, Semnan, Iran.
P. Moridian is with the Faculty of Engineering, Science and ResearchBranch, Islamic Azad University, Tehran, Iran.
A. Khadem is with the Faculty of Electrical Engineering, K. N. ToosiUniversity of Technology, Tehran, Iran.
Sadiq Hussain is System Administrator at Dibrugarh University, Assam,India, 786004.
A. Zare is with Faculty of Electrical Engineering, Gonabad Branch, IslamicAzad University, Gonabad, Iran.
Z. Alizadeh Sani is with Rajaie Cardiovascular Medical and ResearchCenter, and Iran University of Medical Sciences, Tehran, Iran.
F. Khozeimeh is with Faculty of Medicine, Mashhad University of MedicalSciences, Mashhad, Iran.
U. R. Acharya is with the Dept. of Electronics and Computer Engineering,Ngee Ann Polytechnic, Singapore 599489, Singapore, the Dept. of BiomedicalInformatics and Medical Engineering, Asia University, Taichung, Taiwan, andthe Dept. of Biomedical Engineering, School of Science and Technology,Singapore University of Social Sciences, Singapore.
P. Shi is with the School of Electrical and Electronic Engineering, Univer-sity of Adelaide, Adelaide, SA 5005, Australia.
Index Terms—COVID-19, Diagnosis, Deep Learning, Classifi-cation, Segmentation, Forecasting.
I. INTRODUCTION
The novel COVID-19 virus came to light in December 2019in Wuhan Province, China, where it originated from animalsand quickly spread around the world [1]. The easiest way totransmit COVID-19 is through the air and physical contact,such as hand contact with an infected person [2]. The virusinserts itself into the lung cells through the respiratory systemand replicates there, destroying these cells [3]. COVID-19comprises an RNA and is very difficult to diagnose and treatdue to its mutation characteristics [4]. The most commonsymptoms of COVID-19 include fever, cough, and shortnessof breath, dizziness, headache, and muscle aches [5]. Thevirus is so perilous and can provoke the death of people withweakened immune systems [6]. Infectious disease specialistsand physicians around the world are working to discover atreatment for the disease. COVID-19 is currently the leadingcause of death for thousands of countries worldwide, includingthe USA, Spain, Italy, China, the United Kingdom, Iran, andothers. Figure 1 exhibits the latest number of infected peopleworldwide due to COVID-19.
The detection of COVID-19 is crucially significant and vitalin its early stages. Various methods have been proposed todiagnose COVID-19, containing a variety of medical imagingtechniques, blood tests (CBCs), and PCR. According to theWHO, all diagnoses of corona disease must be confirmed byreverse-transcription polymerase chain reaction (RT-PCR) [7].However, testing with RT-PCR is highly time-consuming, andthis issue is risky for people with COVID-19. Hence, first,medical imaging is carried out for the primary detection ofCOVID-19, then the RT-PCR test is performed to aid thephysicians in making final accurate detection. Two medicalimaging techniques, X-ray and CT-scan, are employed todiagnose COVID-19 [8], [9].
X-ray modality is the first procedure to diagnose COVID-19, which has the advantage of being inexpensive and low-riskfrom radiation hazards to human health [10], [11]. In the X-ray method, detecting COVID-19 is a relatively complicatedtask. In these images, the radiologist must attentively recognizethe white spots that contain water and pus, which is very pro-longed and problematic. A radiologist or specialist doctor mayalso mistakenly diagnose other diseases, such as pulmonarytuberculosis, as COVID-19 [12].
arX
iv:2
007.
1078
5v3
[cs
.LG
] 2
7 Ju
l 202
0

2
Fig. 1: Detailed statistics of COVID-19 infected people world-wide [13].
The X-ray procedure has a high error rate; hence CT imagescan be used for more precise detection [14]. Nevertheless,these CT images are far more expensive than X-rays forpatients [15]. At the time of CT-scan recording, several slicesare provided from each person suspected of COVID-19. Thelarge volume of CT-Scan images calls for a high workload onphysicians and radiologists to diagnose COVID-19.
In recent years, applications of artificial intelligence inmedicine have led to a variety of studies aiming to diagnosevaried diseases, including brain tumors from MR images [16],[17], multiple types of brain disorders such from EEG [18],[19], breast cancer from mammographic images [20], [21]and pulmonary diseases such as Covid-19 from X-Ray [22]and CT-Scan [23]. In the last decade, Deep Learning (DL),a branch of machine learning, has changed the expectationsin many applications of artificial intelligence in data process-ing by reaching human-level accuracies [24] in many tasks,including medical image analysis [25].
In this paper, an overview of COVID-19 diagnostic ap-proaches utilizing DL networks is presented. Section II ex-plains the search strategy, and various DL models developedfor COVID-19 detection are described in Section III. SectionIV of the DL techniques used for the detection, segmentation,and prediction of COVID-19 patients. Section V discusses thereviewed papers on diagnosis, segmentation, and prediction ofCOVID-19 patients. Challenges in diagnosing, segmentation,and prediction of COVID-19 patients are provided in SectionVI. Finally, the summary and future work are delineated inSection VII.
II. SEARCH STRATEGY
In this study, valid databases, including IEEE Xplore, Sci-enceDirect, SpringerLink, ACM, and ArXiv, have been usedto search for Covid-19 papers. Moreover, a more detailedGoogle Scholar search is employed. The articles are selectedusing the keywords COVID-19, Corona Virus, Deep Learning,Segmentation, and Forecasting. The latest selection of papersis done with the mentioned keywords on July 11th, 2020.Figure 2 indicates the number of papers published or indexedby COVID-19 using DL techniques using various databases.
Fig. 2: Number of papers published on COVID-19 using DLtechniques.
III. DEEP LEARNING TECHNIQUES FOR COVID-19DETECTION
Traditional machine learning and DL are the two significantbranches of AI, but DL is essentially a more advanced versionof traditional machine learning (ML). Various DL networkshave been extensively used to diagnose the COVID-19 accu-rately using many public databases.
DL architectures, namely convolutional neural networks(CNNs), recurrent neural networks (RNNs), Autoencoders(AEs), deep belief networks (DBNs), generative adversarialnetworks (GANs), and hybrid networks such as CNN-RNNand CNN-AE have been developed for automated detectionof COVID-19. Figure 3 exhibits the subcategories of DLnetworks.
IV. COMPUTER AIDED DIAGNOSIS SYSTEM (CADS) FORCOVID-19 DETECTION
Many CADS have been developed using DL methods usingX-ray and CT images. Two types of systems: (i) classificationand (ii) segmentation using DL methods have been developed.In classification-based CADS, the main objective is to identifyCOVID-19 patients, which involves the process of extractingfeatures, selecting features, and classifying using deep layers.The second type, CAD, is for the segmentation of X-Rayand CT-Scan images of each infected person with COVID-19. Segmentation implies dividing images into meaningfulareas and is of particular notability in medicine. Manual seg-mentation of medical images takes much time; thus, applyingmachine learning models is crucially paramount. Among themost important segmentation models, the various types offuzzy clustering methods [26], [27] and DL procedures suchas U-Net [28] can be expressed. In the CADS, with thesegmentation approach, patients’ CT-Scan images and theirmanual segments labeled by doctors are fed to the DL network.Then, during the training process, the DL network is trainedon manual segments to segment raw input images. Finally,in deep network output, segmented images are presentedwith segmentation accuracy. The components of DL-basedCADS for COVID-19 detection are shown in Figure 4. In

3
Fig. 3: Illustration of various DL methods used for COVID-19 detection.
Fig. 4: Block diagram for COVID-19 detection using DLtechnique.
TABLE I: Public databases used for COVID-19 detection.Dataset Modality Link
J. P. Cohens GitHub [29] X-ray and CT https://github.com/ieee8023/covid-chestxray-datasetEuropean Society of Radiology X-ray and CT https://www.eurorad.org/advanced-search?search=COVID
SIRM X-ray and CT https://www.sirm.org/category/senza-categoria/covid-19BSTI X-ray and CT https://www.bsti.org.uk/covid-19-resources
UCSD-AI4H [30] CT https://github.com/UCSD-AI4H/COVID-CTMedSeg CT http://medicalsegmentation.com/covid19Kaggle X-ray and CT https://www.kaggle.com/datasets?search=covid
Point-of-Care Ultrasound(POCUS) [31]
Lung UltrasoundImages and Videos
https://github.com/jannisborn/covid19 pocus ultrasound
Actualmed COVID-19 ChestX-ray Dataset Initiative X-ray https://github.com/agchung/Actualmed-COVID-chestxray-dataset
COVID-19 Chest X-rayDataset Initiative
X-ray https://github.com/agchung/Figure1-COVID-chestxray-dataset
Georgia State UniversitysPanacea Lab [32]
Twitter ChatterDataset https://github.com/thepanacealab/covid19 twitter
Twitter COVID19 CXR dataset X-ray https://twitter.com/ChestImagingCOVID-19 [33] CT https://github.com/KevinHuRunWen/COVID-19COVIDx [34] X-ray https://github.com/lindawangg/COVID-Net
the following section, we will first mention the important dataavailable for COVID-19. Then, the DL methods exploited inthe research are introduced.
A. Public Databases used for COVID-19 Detection and Fore-casting
Various public databases (X-ray and CT images) availablefor the detection and prediction of COVID-19 are listed inTable I. Also, the databases used to predict the corona spreadin leading countries of the world are shown in Table II.
B. Deep Learning Methods
DL networks developed for classification, segmentation,and prediction of COVID-19 disease will be analyzed in thissection. Various applied DL architectures are discussed brieflyin the following sections.
1) Classification Models: Various DL methods presentedfor the automated detection of COVID-19 are discussed inthis section. 2D CNN, AlexNet, Visual Geometry Group(VGG) network, GoogLeNet, DenseNet, XceptionNet, Mo-bileNet, SqueezeNet, Inception-ResNet, CapsNet, NasNet-mobile, ShuffleNet, EfficientNet, and Generative AdversarialNetworks (GAN) have been used for the automated detectionof COVID-19 patients using X-ray and CT images.
TABLE II: Public COVID-19 forecasting databases used forforecasting.
Dataset Modality LinkChina CDC Weekly Daily Number of Cases in China http://weekly.chinacdc.cn/news/TrackingtheEpidemic.htm
The Ministry of Health and FamilyWelfare (Government of India)
Daily Number of Cases in India https://www.mohfw.gov.in
Johns Hopkins University Tracking COVID-19 Spread https://systems.jhu.eduWHO COVID-19 Dashboard Global Statistics https://covid19.who.int
U.S. CDC Daily Number of Cases in U.S.https://www.cdc.gov/coronavirus/2019-ncov/cases-updates/cases-in-us.html
https://www.cdc.gov/coronavirus/2019-ncov/covid-data/data-visualization.htmWorldometer Global Collection https://www.worldometers.info/coronavirus
Open Source COVID-19 Global Collection http://open-source-covid-19.weileizeng.comPainel Coronavrus Daily Number of Cases in Brazil https://covid.saude.gov.br
GOV.UK Daily Number of Cases in UK https://coronavirus.data.gov.uk
Ministero della Salute Daily Number of Cases in Italyhttp://www.salute.gov.it/portale/nuovocoronavirus/
homeNuovoCoronavirus.jsp?lingua=english
Ministry of health Daily Number of Cases in Spainhttps://www.mscbs.gob.es/profesionales/saludPublica/ccayes/alertasActual/
nCov-China/situacionActual.htmhttps://cnecovid.isciii.es/covid19
Fig. 5: Typical 2D-CNN architecture used for COVID-19detection.
STANDARD 2D-CNNThe primary issue in training the deep models is the
concern of overfitting that occurs from the gap between thelimited number of training samples and a large number oflearnable parameters. Convolutional networks try to overcomethis by using convolutional layers. CNNs require minimalpre-processing by considering the 2-dimensional (2D) imagesas input, and hence it is designed to retain and utilize thestructural information among neighboring pixels or voxels.A differentiable function is utilized to transform one volumeof actions by each layer to the other as it is a sequence oflayers structurally. Figure 6 represents the architecture fora usual computer vision job that comprises of three neurallayers: convolutional, pooling, and fully connected layers. Theconvolutional layers are usually combined with the poolinglayers, and their output is fed to the fully connected layers[35]. Also, a variety of methods like dropout and batchnormalization help these networks to learn better [35].
ALEXNET
As the first famous deep learning network, Alexnet is stillthe center of attention in many studies. Figure 6 depicts thearchitecture of AlexNet. In this network, two new perspectivesdropout, and local response normalization (LRN) are usedto help the network learn better. Dropout is applied in twoFC layers employed in the end. On the other hand, LRN,

4
Fig. 6: A typical AlexNet architecture used for COVID-19detection.
Fig. 7: A typical VGG architecture used for COVID-19detection.
utilized in convolutional layers, can be employed in twodifferent ways: Firstly, applying single channel or featuremaps, where the same feature map normalizes depending onthe neighborhood values and selects the NN patch. Secondly,LRN can be exploited across the channels or feature maps[36], [37].
VGGNET
The VGG architecture comprised of a few convolutionallayers, each of that utilizes the ReLU activation function. Forclassification, this network uses a softmax classifier in the finallayer of the model. Filter size for convolutional layers is pickedequal to 3x3, with a stride of 2 in VGG-E. VGG-11, VGG-16,and VGG-19 are three variants of the VGG-E model that have11, 16, and 19 layers correspondingly. All variants of VGG-E architecture end with three FC layers. Nevertheless, thenumbers of convolution layers are different; VGG-19 contains16 convolution layers, VGG-16 has 13 convolution layers,and VGG-11 has eight convolution layers. Figure 7 depictsthe building block of the VGG network used for COVID-19detection [36], [38].
GOOGLENET
Different receptive fields, generated by various kernel sizes,form Inception layers, which are incorporated in this model.Operations generated by these receptive fields records sparsecorrelation patterns in the novel feature map stack [36]. Figure8 describes the initial concept of the inception layer. A stackof inception layers is utilized by GoogLeNet to enhancerecognition accuracy, as shown in Figure 9. The differencebetween the final inception layer and the nave inception layeris the inclusion of 1x1 convolution kernels, which performsa dimensionality reduction, consequently reducing the com-putational cost. Another idea in GooGLeNet is the gradientinjection, which aims to overcome the gradient vanishing
Fig. 8: Naive version of inception layer.
Fig. 9: Inception layer with dimension reduction.
problem. GoogLeNet comprises of a total of 22 layers that isgreater than any previous network. However, GoogLeNet usesmuch fewer parameters compared to its predecessors VGG orAlexNet [36], [39].
RESNET
The Residual Network (ResNet) is created with variousnumbers of layers; 1202,152, 101, 50, and 34. ResNet50 isone of the popular variants containing 49 convolution layersand 1 FC layer at the end of it. The total number of MACsand weights are 3.9M and 25.5M, respectively [36], [40],[41]. Figure 10 shows a typical ResNet architecture used forCOVID-19 detection.
DENSENET
The DenseNet that comprised of densely connected CNNlayers, in a dense block [36], [43] with the outputs ofeach layer are connected with all descendant layers. Due tothe dense connectivity between the layers, it is termed asDenseNet. Network parameters are reduced dramatically byefficient utilization of feature reuse. DenseNet comprises ofvarious transition blocks and dense blocks that are situated inbetween two adjacent dense blocks. Figure 11 describes theconceptual diagram of a dense block [36].
XCEPTIONNET
The Xception architecture is based on Inception V3. TheXception architecture is a linear stack of depth-wise separableconvolution layers with residual connections. The networkentails 36 layers of convolution organized in 14 modules, all ofwhich contain linear residual connections around them, exceptfor the first and last modules. Utilizing residual connectionsin Xception architecture will lead to faster convergence andsuperior final performance [44].
MOBILENET
The novel model called MobileNets is aimed to be used

5
Fig. 10: A typical ResNet architecture used for COVID-19detection [42].
Fig. 11: A 4-layer dense block with growth rate of k=3 usedfor COVID-19 detection [36].
in mobile and embedded machine vision applications [45].The main layers exploited in this architecture are knownas depthwise separable convolution. The depthwise separableconvolution consists of two layers: depthwise convolution,and pointwise convolution. The depthwise convolution is usedto apply a single filter to each input channel (input depth).Then the pointwise convolution, simple 1x1 convolution, isemployed to create a linear combination of depthwise layeroutputs. After both of these layers, a ReLU and batch normal-ization (BN) are placed (Figure 12) [46].
SQUEEZENET
Using three architectural design strategies, this structurehas introduced a fire module [47]. The module consists ofa squeeze-convolution layer that has only 1x1 filters, fol-lowed by an expansion layer that has a set of 1x1 and 3x3convolution filters. With slight modification and optimizationin the original SqueezeNet architecture, two other architec-tures, SqueezeNet with simple bypass and SqueezeNet withcomplex bypass, were also demonstrated. By benchmarkingthe SqueezeNet architecture on the ImageNet database andcomparing its results with the AlexNet architecture, it wasfound that the SqueezeNet accuracy is at the AlexNet level,but the 50X has a lower parameter, and the model size is lessthan 0.5MB [47].
INCEPTION-RESNET
In 2016, Szegedy et al. proposed the idea of integratingInception architecture with residual connections, meaning thatthe filter concatenation stage in Inception architecture wouldbe replaced by residual connections [41]. The idea led to a newarchitecture called Inception-ResNet, which has two versions,V1 and V2. At the same time, another architecture namedInception V4 was introduced, in which reduction blocks wereexploited. These blocks are modified versions of Inception
Fig. 12: Left: standard CNN layer with BN and ReLU. Right:Depth-wise separable convolutions with depth-wise and Point-wise layers followed by BN and ReLU.
modules. Finally, it was perceived that introducing residualconnections to Inception architecture significantly improvestraining speed. Also, both of these architectures have outper-formed than previous architects [41].
CAPSNET
With advancements of CNNs and new structures, they havereached high accuracies on many tasks. However, one of thedeficiencies of CNN models is when they face samples drownfrom a dataset with a different orientation than a trainingdataset. To address this, CapsNet was proposed. The centralidea behind this network is to create a network that implicitlyperforms an operation similar to inverse graphics; i.e., it triesto find graphical shapes in an image. The building block ofthis structure is capsules, which try to determine whether anobject is presented at a given location and find its instantiation.With the help of these capsules, CapsNet performs better thanits prior models in many tasks and specifically in cases wheretwo classes have a considerable overlap [48].
NASNET-MOBILE
In a try to find a method to learn architecture directly fromdata instead of handly designing it [49], NASNet was created.First, the best normal convolution cell and the reductionconvolution cell are found in NASNet’s search space byapplying the RNN controller, on a small dataset. The RNNcontroller then stacks multiple copies of these cells withvarious parameters to acquire NASNet architecture. A newregularization technique called ScheduledDropPath has alsobeen stated, which dramatically meliorate the generalizabilityof NASNet models. The architectures obtained on the COCOobject detection database have also been evaluated in all cases,showing that the architectures could achieve state-of-the-artperformance [49].
SHUFFLENET
ShuffleNet is specially designed for mobile devices withminimal computing power [50], [51]. This architecture em-ploys two operations, pointwise group convolution and channelshuffle, to maintain the network’s accuracy while reducingthe computational cost. ShuffleNet architecture embraces aconvolution layer, two pooling layers, a stack of ShuffleNetunits that are structured in three stages, and finally, an FClayer. Although ShuffleNet is designed for small models, it still

6
Fig. 13: A typical ShuffleNet for COVID-19 detection [52].
Fig. 14: A Simple GAN architecture.
surpasses MobileNet (lower computation cost, higher trainingspeed). Figure 13 shows a general form of ShuffleNet usedfor COVID-19 detection.
EFFICIENTNETThe fundamental building block in EfficientNet was to
overcome the MBConv mobile bottleneck. The EfficientNetarchitecture developed using the compound scaling method,which led to the EfficientNet-B0 to B7. It is found that thisarchitecture has fewer parameters of 8.4x and a faster runningtime of 6.1x [53].
2) Generative Adversarial Networks (GAN): A primaryproblem in training deep models is limits in dataset size. Usinggenerative models for data augmentation is one solution tothis issue. Due to the high quality of generated data, GANshave attracted attention in the medical imaging community[54]. The basic idea in training a GAN is a simple minimaxgame, in which one network tries to distinguish between realdata and generates one, and the other tries to create dataundistinguishable by the first network [55], therefor creatingimages similar to real data. Figure 14 shows a simple ganarchitecture.
3) Segmentation Models: In this section, various DL mod-els developed to segment the lung region to detect the COVID-19 patients accurately are discussed. FCN network, SegNet,U-Net, and Res2Net DL models are widely used for thesegmentation of lungs and are briefly discussed below.
FULLY CONVOLUTIONAL NETWORK (FCN)In this model, popular networks have transformed entirely
convolutional models by replacing FC layers with convolutionlayers to capture output as a local map. These maps are up-sampled using the introduced method, which uses a backwardconvolution with stride size f, capable of learning. At the endof the network, there is a 1x1 convolution layer that yields thecorresponding pixel label as the output. The exiting stride in
Fig. 15: A typical FCN architecture used for segmentation oflung in COVID-19 patients.
Fig. 16: A typical SegNet architecture used to segment lungin COVID-19 patients [58].
the deconvolution stage constraints the output detail quantityof this layer. To address this issue and enhance the qualityof the result, several skip connections have been added to thenetwork from the lower layers to the end layer [56]. Figure15 shows a general form of FCN used for the segmentationof lung in COVID-19 patients.
SEGNET
Generally, in segmentation techniques, a network created forclassification is chosen, and the FC layers of that network areremoved; the resulting network is called the encoder network.Then a decoder is created to transform these low-resolutionmaps to the original resolution. In SegNet [57], the decoderis created such that for each down-sampling layer in theencoding section, an up-sampling layer is positioned in thedecoder. These layers, unlike the deconvolution layers of FCNnetworks, are not capable of learning, and the values are placedat the locations from which the corresponding max-poolinglayer is extracted, and the rest of the output cells becomezero. Figure 16 shows a general form of SegNet used for thesegmentation of lung in COVID-19patients.
U-NET
The U-Net network [59], like SegNet, consists of theidentical numbers of pooling and up-sampling layers, but thenetwork utilizes trainable deconvolution layers. Also, in thisnetwork, there is a corresponding skip connection betweenthe up-sampling and down-sampling layers. Figure 17 shows

7
Fig. 17: A typical U-Net architecture used to segment the lungin COVID-19 patients [60].
a general form of U-Net architecture used to segment the lungin COVID-19 patients.
RES2NET
In the Res2Net module, after the 1*1 convolution, thefeature maps are divided into several subsets, then passedthrough a set of 3*3 filters. Their outputs are concatenatedtogether and then go through the 1*1 convolution [61]. Theset of this process is residually structured. For that reason,it is named as Res2Net module. This module introduces anew control parameter called the scale dimension (the numberof feature groups in the Res2Net block); with an increase ofscale, features with richer receptive field sizes are learned bythe model. The Res2Net module is capable of integrating withmodern modules such as cardinality dimension and squeezeand excitation (SE). It can also be integrated easily with state-of-the-art models, such as ResNet, ResNeXt, DLA, Big-LittleNet, which are called Res2Net, Res2NeXt, Res2Net-DLA, andbLRes2Net-50, respectively [61].
4) Forecasting Models: RECURRENT NEURAL NET-WORK(RNN)
A feed-forward neural network is extended to create RNN,aiming to capture the long term dependencies and featuresfrom the sequential and time-series data. The most commonlyused RNN is the long-short term memory (LSTM), whichcomposed of a memory cell Ct, a forget cell ft, the inputgate it, and output gate ot (figure 18(a)). These gates makethe decision that which information needs to be rememberedor discarded from the memory cell and also organizes theactivation signals from different sources.
LSTM decides whether to keep or remove the memory byusing these gates, unlike vanilla RNN, LSTM can preserve thepotential long term dependencies of a feature, which is learnedfrom the input sequential data. One LSTM variant is GatedRecurrent Unit (GRU) [62], which integrates the forget andinput gates into a single update gate and combines the memorycell state and the hidden state into one state (figure 18(b)).Update gate makes a decision on the amount of informationto be added or discarded, and the reset gate decides on howmuch earlier information is to be forgotten. This techniquemakes GRU simpler than LSTM.
AUTOENCODERS (AES)
Fig. 18: Architecture of LSTM (a) and GRU (b). In the figurea, the yellow, green and blue represent output gate, input gateand forget gate respectively. In the figure b, the yellow andblue represent the update and reset gate respectively. Biasesare not shown to keep the figure simple [35].
Fig. 19: Diagram of Autoencoder.
Autoencoder (AE) is a neural network method with com-petent data encoding and decoding strategies used for unsu-pervised feature learning [35]. The primary purpose of AEis usually to learn and representation of data (encoding), aswell as dimensionality reduction of data, fusion, compression,and many more [63], [64]. The AE models comprised of twophases: encoder and decoder. The input samples are mappedtypically to a lower-dimensional space with beneficial featurerepresentation in the encoding part. Reverse processing isapplied in the decoding phase to revert data to its originalspace, trying to create data from lower space representation.Figure 19 depicts the conceptual diagram of AE with encodingand decoding phases.

8
TABLE III: Summary of state-of-art DL techniques used for the automated detection of COVID-19 patients.
Work Dataset Modalities Number of Cases Preprocessing DNN toolbox DNNNumber of
Layers Classifier Post Processing K-FoldPerformanceCriteria (%)
[65] COVIDx X-ray45 COVID-19, 1203 Normal, 931 Bacterial Pneumonia,
660 Viral Pneumonia PatientsData Augmentation (DA),
Rescaling, NormalizingFastai Library
COVID-ResNet(ResNet-50)
ModifiedVersion Softmax NA NA
Acc=96.23Sen=100Pre=100
F1-Score=100
[66]Combination of
Different Datasets X-ray 50 COVID-19, 50 Normal Images Rescaling NA ResNet50ModifiedVersion Softmax NA 5
Acc=98Recall=96Spe=100
[67]Combination of
Different DatasetsX-ray,
CT-Scan85 COVID-19 X-ray, 203 COVID-19 CT-scan, 85
Normal X-ray, 153 Normal CT-scanCropping, resizing NA AlexNet
ModifiedVersion Softmax NA NA
Acc=98Sen=100Spe=96
[68] Cohens GitHub X-ray 25 COVID-19, 25 Normal Cases RescalingKeras with Tensor-
Flow2 Backend
COVIDX-Net StandardVersion Softmax NA NA
Acc=90(VGG19, Pre=83
DenseNet201) F1-Score=91
[69]Combination of
Different Datasets X-ray 70 COVID-19 subjects, 1008 Pneumonia Subjects Rescaling, DA NA ResNet-18Standard
Version + 8 Sigmoid Grad-CAM NASen=96
Spe=70.65AUC=95.18
[70] COVIDx X-ray266 COVID-19 Patient Cases, 8,066 Normal Patient
Cases, 5,538 Non-COVID19 Pneumonia Patient CasesDA
Keras with Tensor-Flow Backend COVID-Net 87 Softmax
Explainability-DrivenAudit (GSInquire Method)
NAAcc=93.3Sen=91
PPV=98.9
[71] COVIDx X-ray 76 COVID-19, 1583 Normal, 4290 Pneumonia Cases DA, RGB format, Normalizing MATLAB COVIDiagnosis-NetStandardVersion
Decision-MakingSystem
Class ActivationMapping Visualization NA
Acc=98.3Spe=99.13
F1-Score=98.3
[72]Combination of
Different Datasets X-ray68 COVID-19, 1583 Normal, 2786 Bacterial Pneumonia,
1504 Viral Pneumonia ImagesResizing, Standardizing, DA Keras ResNet50-V2
ModifiedVersion Softmax
saliency Maps Visualization,Different Gradient Methods
NAPredictive
Entropy=99.68BALD=88.73
[73] Combination of X-ray 295 COVID-19, 65 Normal, 98 Pneumonia Images Fuzzy Color Method, Image MATLAB MobileNetV2 Standard SMO, SVM Social Mimic Optimization 5 Acc=99.27Different Datasets Stacking Technique SqueezeNet Version Method
[74] Clinical CT-Scan 368 COVID-19 Patients, 127 Patients with Other PneumoniaSegmentation, Rescaling,
Multi-view FusionKeras ResNet50
ModifiedVersion Dense Layer NA NA
Acc=76Sen=81.1Spe=61.5
[75]Combination of
Different Datasets X-ray127 COVID-19, 500 No-Findings
and 500 Pneumonia ImagesNA NA DarkCovidNet (CNN) 39 Linear
Interpretation of HeatmapsResults of the DarkCovidNet
Model by anExpert Radiologist
5
2-classes:Acc=98.08Spe=95.3Sen=95.13Pre=98.03
F1-Score=96.513 classes:
Acc=87.02Spe=92.18Sen=85.35Pre=89.96
F1-Score=87.37
[76] Clinical CT-Scan 108 COVID-19, 86 Non-COVID-19 Patients Different Methods NAResNet-101,
XceptionStandardVersion Softmax NA NA
Sen=98.04Spe=100
Acc=99.02
[77]Combination of
Different Datasets X-ray 105 COVID-19 ,11 SARS, 80 Normal SamplesDA, Histogram, Feature Extraction
using AlexNet, PCA, K-meansMATLAB DeTraC (ResNet18)
StandardVersion Softmax Composition Phase NA
Acc=95.12Sen=97.91Spe=91.87
[78] RYDLS-20 X-ray90 COVID-19, 10 MERS, 11 SARS, 10 Varicella,
12 Streptococcus, 11 Pneumocystis SamplesDifferent Features, Early Fusion, Late
Fusion, Different Resampling AlgorithmsNA Inception-V3
StandardVersion
MLP Friedman StatisticalTest for Ranking NA
F1-Score=83.33Clus-HMC F1-Score=88.89Framework
[79] Pneumonia Dataset X-ray 624 Images in 2 Categories: Normal and Pneumonia GAN MATLAB ResNet18StandardVersion Softmax NA NA
Acc=99Pre=98.97
F1-Score=98.97
[80] SIRM Dataset CT-Scan 53 Infected CT Images Two Different Patch Datasets NAVGG-16, GoogleNet
and ResNet-50(Feature Extraction)
StandardVersion SVM NA NA
Acc=98.27Sen=98.93Spe=97.60Pre=97.63
F1-Score=98.28
[81] COVIDx X-ray NA NA NA COVID-CAPS 9 Capsule Layer NA NAAcc=95.7Sen=90
Spe=95.8
[82]Combination of
Different Datasets X-ray284 Covid-19, 310 Normal, 330 Pneumonia Bacterial,
327 Pneumonia Viral ImagesRescaling
Keras with Tensor-Flow Backend CoroNet
ModifiedVersion Softmax NA NA
Acc=89.5Pre=97
F1-Score=98
[83] Kaggle X-ray 5,863 X-Ray Images in Two Classes Normal and Rescaling Keras with Tensor- DenseNet169StandardVersion Softmax NA NA Avg Acc=95.72Pneumonia, 145 Chest X-ray Images of COVID-19 Flow Backend
[84] COVIDx X-ray 13; 800 Images from 13; 645 Individuals Intensity Normalization, DA Keras with Tensor- EfficientNet B3 50 Softmax Activation Map NA Acc=93.9Flow Backend Visualization Sen=96.8
[42]3 Different
COVIDx Datasets X-ray Different Number of Cases Different MethodsKeras with Tensor-
Flow Backend DenseNet-161ModifiedVersion Softmax
Grad-CAM, Grad-CAM++,LRP Visualizations
5Pre=94
Recall=95F1-Score=94.5
[85] UCSD-AI4H CT-Scan 349 COVID-19 Images, 397 Non-COVID-19 Images GAN, Rescaling, Cropping NADECAPS
ArchitectureProposedMethod
HAMs Peekaboo Strategy NA
Acc=87.6Pre=84.3Spe=85.2
F1-Score=87.1

9
[86]Combination of
Different Datasets X-ray99 COVID-19 Cases From the COVID19 ChestX-ray Dataset, 207 Images From Both Dataset Balancing dataset, DA Keras
GSA-DenseNet121-COVID-19
ModifiedVersion Softmax NA NA
Acc=98Pre=98
F1-Score=98
[87] COVID-Xray- X-ray 536 COVID-19 Images, 5000 Non-COVID19 DA, Down Sampling PyTorch SqueezeNet Standard Softmax NA NA Sen=97.55k Dataset Version Spec=97.8
[88]Combination of
Different Datasets X-ray 207 COVID-19 Images, 5,863 Non-COVID-19 Images DA NA DenseNet-161ModifiedVersion Softmax NA NA
Acc=99Pre=100
F1-Score=99
[89]Combination of
Different Datasets X-ray239 COVID-19 cases, 1,000 Bacterial or Viral Pneumonia
Cases, 1,000 Healthy PeopleDA Keras.
DCSLFramework
ModifiedVersion Softmax T-SNE 5
Acc=97.01Pre=97
Sen=97.09F1-Score=96.98
[90]Combination of
Different Datasets X-ray 108 COVID-19, 515 Other Pneumonia, 453 Normal
Class Balancing Methods, BinaryThresholding, Adaptive Total
Variation MethodNA NASNetLarge
ModifiedVersion Softmax
CAM and LIMETechniques NA
Acc=98Pre=88Spe=95
F1-Score=89
[91] Combination of X-ray 225 COVID-19 Images, 108,948 Frontal View DA Keras with Tensor- CN 12 FCMLP Grad-CAM 5 Acc=95.3Different Datasets Images From 32,717 Unique Patients Flow Backend
[92]Combination of
Different Datasets X-ray180 COVID-19 Images, 6054 Pneumonia,
8851 NormalNA Keras
Concatenation of ModifiedVersion Softmax NA 5 Acc=99.56Xception and
ResNet50V2
[93]Combination of
Different Datasets X-ray NA Different Methods PyTorch COVID-DAModifiedVersion NA Grad-CAM NA
F1-Score=92.98Pre=98.15AUC=98.5
[94]Combination of
Different Datasets X-ray NACropping, CLAHE Method, Resizing,
DANA CovIDNet 15 Softmax NA NA
Acc=98.4Sen=100
Spe=96.97
[95] Different Datasets X-ray
Dataset A (1579 Normal and 4429 Diseased),Dataset B (4245 Pneumonia and 1763 Non-Pneumonia),Dataset C (184 COVID-19 and 5824 Non-COVID19),
Dataset D (1579 Normal, 4245 Pneumonia, and184 COVID-19)
DA, Oversampling NA 3 ResNet18ModifiedVersion
EnsembleModels NA 5
Acc=95.5MCC=89.6
Pre=94Recall=100
F1-Score=96.6
[96] Clinical CT-Scan88 COVID-19 Patients, 100 Bacteria Pneumonia
Patients, 86 Healthy PersonsDifferent Methods OpenCV
DRE-Net(ResNet-50Backbone)
ModifiedVersion Aggregation Visualization NA
Acc=94AUC=99Pre=96
F1-Score=94
[97] Clinical CT-Scan1495 Patients of COVID-19 and 1027 Patients of
Community Acquired Pneumonia (CAP)Segmentation using VBNet,
Feature ExtractionNA AFS-DF
ProposedArchitecture
Ensemble thePredicted
ValueNA 5
Acc=91.79Sen=93.05Spe=89.95
AUC=96.35
[98]Combination of
Different DatasetsX-Ray,
CT-Scan200 of COVID-19, 200 Healthy, 200 Bacterial
Pneumonia 200 Viral PneumoniaNA Caffe ResNet101
StandardVersion Softmax NA 10
Acc=98.75Spe=97.50Sen=100
Pre=96.43
[99] Cohens GitHubX-ray,
CT-Scan4 ARDS, 101 COVID-19, 2 No finding,
2 Pneumocystis-Pneumonia, 11 SARS, 6 Streptococcus
DA, Different Features,Feature Merging,
Data Over-Samplingusing SMOTE
NASAE (Feature
Reduction)6 SVM NA NA
Acc=71.92Sen=68.91Spe=93.91Pre=69.89
F1-Score=69.13
[100] Clinical CT-Scan 44 COVID-19, 55 Typical Viral Pneumonia ROIs Extraction Visual Inspection NA M-InceptionModifiedVersion
CombinedDecisionTree andAdaboost
NA NA
Acc=82.9Sen=81Spe=84
AUC=90F1-Score=77
[101]Combination of
Different Datasets X-ray 314 COVID-19Segmentation using UNet, Keras with Tensor-
Flow Backend VGG16StandardVersion Softmax GradCAM NA Acc=99.26Standard Preprocessing,
WeaklyLabeled DA
[102] Clinical CT-Scan 109 COVID-19, 201 Non-COVID-19Standard Preprocessing, Generating
NA CovidCTNet 19 Softmax NA NAAcc=90
Pseudo-Infection Anomalies Sen=83using BCDU-Net Spe=92.85
[103] Kaggle Data X-ray 150 COVID-19 Filtering, Segmentation using NA CNN 11 Softmax NA NA Acc=93Repository Thresholding
[52]Combination of
Different Datasets CT-Scan 521 COVID-19, 521 Non-COVID-19 DA, Random Cropping Operation NACNN with Standard
VersionLinearLayer NA NA
Acc=91.21ShuffleNetV2 as Sen=90.52
the backbone Spe=91.58
[104] COVIDx X-ray 99 COVID-19, 18529 Non-COVID-19 DA PyTorchCoroNet (TFEN+ CIN modules)
2 IndependentFPAE +
ResNet18Softmax
Perturbation-based Algo-rithms for Generating
Attribution MapsNA
Acc=93.50Sen=90
Pre=93.63F1-Score=93.51
[105] Different Datasets CT-Scan 349 COVID-19, 397 Non-COVID-19 DA, Self-Trans Method PyTorch DenseNet-169StandardVersion Softmax Grad-CAM NA
Acc=86F1-Score=85
AUC=94
[106] Clinical CT-Scan 3389 COVID-19, 1593 Non-COVID-19
Standard Preprocessing, VB-NetToolkit for Segmentation
and Lung Mask GenerationPyTorch
3D ResNet34Models with the
OnlineAttention Module
ModifiedVersion
EnsembleLearning Grad-CAM 5
Acc=87.5Sen=86.9Spe=90.1
AUC=94.4F1-Score=82.0
[107] COVIDx X-ray 238 COVID-19, 14896 Non-COVID-19 DA TensorFlow DenseNet-121ModifiedVersion Softmax Grad-CAM 10
Acc=96.4Pre=96
Recall=96F1-Score=96

10
[108] Clinical CT-Scan 146 COVID-19, 149 Non-COVID-19 DA PyTorch DenseNetStandardVersion Softmax CAM NA
Acc=92Sen=97Spe=87
F1-Score=93
[109]Combination of
Different Datasets X-ray 158 COVID-19, 158 Non-COVID-19 NA MATLAB ResNet50StandardVersion SVM NA NA
Acc=95.38Sen=97.29Spe=93.47
[110] Clinical CT-Scan 219 COVID-19, 399 Non-COVID-19 Preprocessing Based on HU Values NA ResNet18 29Noisy-or
NA NAAcc=86.7
Bayesian Pre=81.3Function F1-Score=83.9
[111]Combination of
Different Datasets X-ray 455 COVID-19 Images, 2109 Non-COVID-19 Images Rescaling, DAKeras with Tensor-
Flow Backend MobileNet V2ModifiedVersion NA NA 10
Acc=99.18Sen=97.36Spe=99.42
[112]Combination of
Different Datasets X-ray 403 COVID-19 Images, 721 Non-COVID-19 ImagesResizing, Normalizing, DA using
CovidGAN Based AC-GANKeras VGG16
StandardVersion Softmax PCA Visualization NA
Acc=95Sen=90Spe=97
[113]Combination of
Different DatasetsX-ray,
CT-scan6087 images (2780 Bacterial Pneumonia, 1724 Coronavirus
(1493 Viral Pneumonia, 231 Covid19), 1583 Normal)Intensity Normalization,
CLAHE Method, DA, ResizingKeras with Tensor-
Flow BackendInceptionResNetV2
StandardVersion MLP NA 5
Acc=92.18Sen=92.11Spec=96.06Pre=92.38
F1-Score=92.07
[114]Combination of
Different Datasets X-ray69 COVID-19 Images, 79 Normal, 79 Pneumonia
Bacterial, 79 Pneumonia VirusesDA using GAN MATLAB GoogLeNet
StandardVersion Softmax NA NA
Acc=100Pre=100
F1-Score=100
[115] Combination of CT-Scan 1118 COVID-19 Images, 96 Pneumonia Images, Different Methods MATLAB CNN (Feature 12 LSTM NA NA Acc=99.68Different Datasets 107 Healthy Images Extraction)
[116]Combination of
Different Datasets X-ray
135 chest X-rays of COVID-19 and 320 Chest
DA NAResnet50,VGG16,
Small CNN
ModifiedVersion
SnapshotEnsemble of21 Models
NA 10Acc=91.24AUC=94
X-rays of Viral and Bacterial PneumoniaUnseen Data Consisting of 33 COVID-19 Data
Cases, and 218 Pneumonia Cases
[117]Combination of
Different Datasets X-ray224 Covid-19 cases, 504 Healthy Cases,
400 Bacteria, 314 Viral PneumoniaResizing NA MobileNet
ModifiedVersion NA NA NA
Acc=96.78Sen=98.66Spe=96.46
[118]Combination of
Different Datasets X-ray219 COVID-19 Images, 1341 Normal Lung Images,
1345 Viral Pneumonia ImagesManually editing, Reshaping,
DAPyTorch
CheXNet ModifiedVersion Sigmoid
Heatmaps Generationusing LRP
NAAcc=98.3
(DenseNet121 Pre=98.3Backbone) F1-score=98.3
[119] Different Datasets X-ray 49 COVID-19 Images, 88,079 Non-COVID-19 Images Standard Preprocessing TorchXRayVi- DenseNet Modified Sigmoid, t-SNE, Saliency Maps NA MAE=1.14sion Library Version LR
[120]Combination of
Different Datasets X-ray190 COVID-19, 1345 Viral Pneumonia,and 1341 Normal Chest X-ray Images
Resizing, Normalization, DA MATLAB SqueezeNetModifiedVersion Softmax NA 5
Acc=98.3Sen=96.7Spe=100Pre=100
[121]COVID-CT-
Dataset CT-Scan 345 COVID-19, 397 Non COVID-19Resizing, DA using CGAN,
NormalizingTensorFlow ResNet50
ModifiedVersion Softmax NA NA
Acc=82.91Sen=80.85Spe=91.43
[122]Combination of
Different Datasets X-ray180 COVID-19 cases, 6054 Pneumonia Cases,
8851 Normal CasesDA Keras
Concatenationof the Xception
and ResNet50V2
ModifiedVersion Softmax NA 5 Acc=91.4
[123] Kaggle X-ray 70 COVID-19 and 80 Normal Images Resizing, DA NAVGG16,VGG19
ModifiedVersion Softmax NA NA
Acc=97Sen=100Spe=94
[124]Combination of
Different Datasets X-ray 215 COVID-19, 6045 CAP, 8851 Normal Images DA PyTorchDifferent
PreTrain DeepNetworks
ModifiedVersion Softmax NA NA
Ensemble ofModels:
Acc=89.4F1-Score=64
[125] Combination of X-ray 69 COVID-19, 79 Normal, 79 Pneumonia Bacterial, Resizing, Neutrosophic Image MATLAB GoogLeNet Standard Softmax NA NA Acc=73.12Different Datasets 79 Pneumonia Virus Images Domain Conversion, Normalizing Version
[126]Combination of
Different DatasetsX-ray,
CT-scan117 X-ray and 20 CT Scan of COVID-19,
117 Healthy X-ray Images, 20 Healthy CT Scan ImagesResizing, Normalizing
Keras with Tensor-Flow Backend DenseNet121
StandardVersion
BaggingTree
Web-BasedApplication 10
Acc=99Pre=96
F1-Score=96
[127] Combination of X-ray 181 COVID-19 Images, 364 Healthy Images Normalizing, Resizing NA VGG-19 Modified Softmax NA NA Acc=96.3Different Datasets Version
[128] Clinical CT-Scan 151 COVID-19 Patient, 498 Non-COVID-19 Patient Resizing, Padding, DA NA 3D-CNN 15 SoftmaxVisual Interpretation
NA AUC=70by Two ExperiencedRadiologists
[129]Public Datasets
& Private Datasets CT-Scan1,684 COVID-19 Patient, 1,055 Pneumonia,
914 Normal PatientsResizing NA Inception V1
ModifiedVersion Softmax
Interpretation by 610
Acc=95.78AUC=99.4Radiologists, t-SNE
Method
[130]Combination of
Different Datasets CT-Scan413 COVID-19 Images and 439 Normal or Pneumonia
Infected Patients ImagesResNet50 (Feature
Extraction)NA CNN 14 Softmax NA 10
Acc=93.01Spe=94.77Sen=91.45Pre=95.18
[131]Combination of
Different Datasets X-ray 142 COVID-19 Images, 142 Normal Images Resizing, DA NANCOVnet(VGG-16)
ModifiedVersion Softmax NA NA
Acc=97.62Sen=97.62Spe=78.57
[132]Combination of
Different Datasets X-ray326 COVID 19 Images, 984 Non-COVID-19
Images
Manual Annotation, Data Balancingand Augmentation Strategies,
Normalizing, ResizingNA
CNN withYOLO
Predictor54
Tensor ofPrediction
(ToP)NA 5
Acc=97.40Spe=99.056Sen=85.15
[133]Combination of
Different Datasets X-ray250 COVID-19, 2,753 Other Pulmonary
Diseases, 3,520 Healthy ImagesResizing, DA NA VGG-16
ModifiedVersion Softmax Grad-CAM NA
Acc=97Sen=87Spe=94

11
[134]Combination of
Different Datasets X-ray 179 COVID-19, 179 Pneumonia, 179 Normal Images Create a Noisy Snapshot Dataset PyTorchDenseNet-121, Modified/
NA t-SNE, GRAD-CAM NAAcc=84.3
AUROC=94ShuffleNetV2, StandardMobileNetV2 Versions
[135]Another
Reference CT-Scan 73 Patients with COVID-19MODE Algorithm for
Hyper-Parameter TuningMATLAB CNN 7 NA NA 20
Acc=92F1-Score=90
Sen=90Spe=90
[136]Clinical
(3 Datasets) X-ray
1583 Normal, 1493 Non-COVID Viral Pneumonia,2780 Bacterial Pneumonia Images
Reshaping to Different Resolutions,Normalizing
NAStacked Multi-
ResolutionCovXNet
DifferentNumber of
Layers
Stackingusing
Meta-LearnerGrad-CAM 5
Acc=97.4Spe=94.7
F1-score=97.1Recall=97.8
Pre=96.3AUC=96.9
305 COVID 19 Images
305 COVID-19,305 Normal, 305 Viral,305 Bacterial Pneumonia Images
[137] Clinical CT-Scan98 COVID-19 Patients, 103 Non-COVID-19
PatientsVisual Inspection
GoogleColaboratory
BigBiGAN NA Linear Classifier NA NAAUC=97.2
Sen=92Spe=91
[138]Combination of
Different Datasets X-ray162 COVID-19 Images, 2003 Healthy, 4280 Viral
and Bacterial Pneumonia, 400 TuberculosisResizing, Normalizing NA
TruncatedInceptionNet V3
ModifiedVersion Softmax
Activation MapsGeneration
10
Acc=98.77Sen=95Spe=99Pre=99
F1-score=97
[139]UCSD-AI4H
Datasets CT-Scan349 Patients with Confirmed COVID
and 397 Healthy Subjects Resizing, NormalizingKeras with Tensor-
Flow Backed DenseNet121 Standard Version Nu-SVMWeb based CAD
Implementation withFlask RESTful
10
Acc=90.61Recall=90.80
Pre=89.76F1-Score=90.13
[140] Different Datasets X-ray219 COVID-19, 1341 Normal, 1345 Viral
Pneumonia ImagesResizing, Normalizing, DA
PyTorch,DenseNet-201
ModifiedVersion Sigmoid LRP NA
Acc=99.4Keras with Tensor- Pre=99.5
Flow Backend F1-Score=99.4
[141] Different Datasets X-ray536 COVID-19 Images, 619 Viral Pneumonia,
and 668 Normal ImagesWhite Balance Algorithm, CLAHE,
Normalizing, ResizingKeras with Tensor-
Flow Backend COVIDLite 38 Softmaxt-SNE,S Maps,
Grad-CAM, LIME5
Binary Acc=99.58Multi-ClassAcc=96.43
[142]Combination of
Different Datasets X-ray236 COVID-19 Images, 500 Healthy, 250 ViralPneumonia, 250 Bacterial Pneumonia Images
Resizing, Zero-Padding, PercentileCropping, Intensity Normalization
PyTorch DenseNet161StandardVersion Sigmoid
Occlusion, Saliency,
5Pre=86.4
Recall=84.5F1-score=85.4
Input X Gradient,Guided Backpropagation,
Integrated Gradients,DeepLIFT
[143] Combination of X-ray X-rays of 327 Patients Resizing, DA, Normalizing NA VGG16 Modified Softmax NA 5 Acc=84.1Different Datasets Version
[144] COVIDx X-ray183 COVID-19 Images, 5551 Pneumonia
Images, 8066 Normal ImagesNA NA
COVIDNet-CXR StandardVersion NA UAPs using FGSM NA
Acc=92.6Avg Acc=94.4Small and COVID-
Net-CXR Large
[145]Combination of
Different Datasets X-ray127 COVID-19 Images, 127 Pneumonia
Images, 127 Healthy ImagesNA MATLAB ResNet50
StandardVersion SVM NA NA
Acc=95.33Sen=95.33
F1-Score=95.34
[146]Combination of
Different Datasets X-ray738 Images of COVID-19, 5000 Normal,
4600 Images of CAPDA, Normalization, Resizing,
CLAHE, BEASFNA CNN 8 NA Grad-CAM, LIME NA
Acc=98.68AUC=99.84F1-Score=94
[147] Clinical CT-Scan
79 Patients with COVID-19, 100 Patientswith Common Pneumonia, 130 People
without Pneumonia.DA PyTorch AD3D-MIL
ProposedMethod
BernouliDistribution CAM 5
Acc=97.9AUC=99
F1-Score=97.9Pre=97.9
Recall=97.9
TABLE IV: Summary of DL segmentation methods used for COVID-19 detection.
Work Dataset Modalities Number of Cases Preprocessing DNN toolbox DNNNumber of
Layers Classifier Post Processing K-FoldPerformanceCriteria (%)
[148]Different Clinical
Datasets CT-Scan 157 International PatientsDetect and Measure Nodules, Lung Crop
using U-net, DANA ResNet50 Standard
Corona ScoreComputation
Grad-Cam,3D Visualization
NAAUC=99.6Sen=98.2Spe=92.2
[149] Clinical CT-Scan 549 COVID-19 Patients HITL Strategy NA VB-Net 8 Block NAQuantitative Metrics
MeasurementsNA
DSC=91.6Mean POIEstimationError=0.3
[150]Combination of
Different Datasets CT-Scan 610 COVID-19 Images, 695 Non-COVID-19 Images Resizing, DA PyTorchDenseNet-169+ ASPP Layer Standard NA NA NA
F1-score=84.6AUC=94.8
Acc=83
[151]Combination of
Different DatasetsX-ray andCT-Scan
1,341 Normal Samples, 3,875 Pneumonia Samples,
Resizing, DA, NABLA-3Network for ROI Detection
TensorFlowIRRCNN
Model 7 Softmax NA NA
X-ray:Acc=84.67
420 CT-Scan samples where 247 Normal Samples,178 COVID-19 Samples
704 Chest X-ray Images with Corresponding Masks, CT:267 CT-Scan Samples with Corresponding Masks Acc=98.78
[152] Different Datasets CT-Scan 110 Axial CT-Scan Images From 60 Patients Resizing, Grey Scaling (GL), DA NAResidual
Attention U-Net9 ResNeXt
blocks+14 Layers Sigmoid Visualization 10Acc=89Pre=95
DSC=94
[153] Different Datasets CT-Scan Different Number of CasesLung Segmentation using U-net with
a VGG-16 Based Encoder, DANA ResNet50 Standard Sigmoid
GradCam, Combine theNA
AUC=99.4Fine Grain Maps to Create 3D Sen=94Localization Maps, K-Means Spec=98
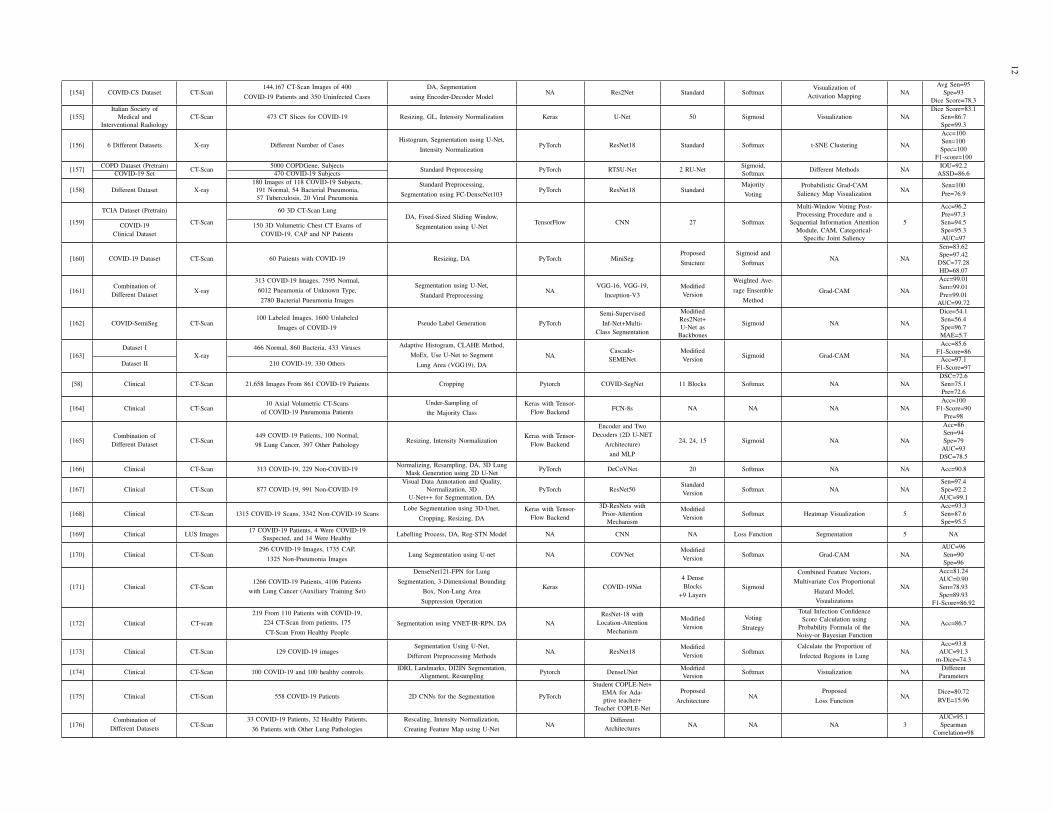
12
[154] COVID-CS Dataset CT-Scan144,167 CT-Scan Images of 400
COVID-19 Patients and 350 Uninfected CasesDA, Segmentation
using Encoder-Decoder ModelNA Res2Net Standard Softmax
Visualization ofActivation Mapping NA
Avg Sen=95Spe=93
Dice Score=78.3
[155]Italian Society of
CT-Scan 473 CT Slices for COVID-19 Resizing, GL, Intensity Normalization Keras U-Net 50 Sigmoid Visualization NADice Score=83.1
Medical and Sen=86.7Interventional Radiology Spe=99.3
[156] 6 Different Datasets X-ray Different Number of CasesHistogram, Segmentation using U-Net,
Intensity NormalizationPyTorch ResNet18 Standard Softmax t-SNE Clustering NA
Acc=100Sen=100Spec=100
F1-score=100
[157] COPD Dataset (Pretrain) CT-Scan 5000 COPDGene, Subjects Standard Preprocessing PyTorch RTSU-Net 2 RU-Net Sigmoid, Different Methods NA IOU=92.2COVID-19 Set 470 COVID-19 Subjects Softmax ASSD=86.6
[158] Different Dataset X-ray180 Images of 118 COVID-19 Subjects, Standard Preprocessing,
Segmentation using FC-DenseNet103PyTorch ResNet18 Standard
MajorityVoting
Probabilistic Grad-CAMSaliency Map Visualization NA
Sen=100Pre=76.9191 Normal, 54 Bacterial Pneumonia,
57 Tuberculosis, 20 Viral Pneumonia
[159]
TCIA Dataset (Pretrain)
CT-Scan
60 3D CT-Scan LungDA, Fixed-Sized Sliding Window,
Segmentation using U-NetTensorFlow CNN 27 Softmax
Multi-Window Voting Post-
5
Acc=96.2Processing Procedure and a Pre=97.3
COVID-19Clinical Dataset
150 3D Volumetric Chest CT Exams ofCOVID-19, CAP and NP Patients
Sequential Information Attention Sen=94.5Module, CAM, Categorical- Spe=95.3
Specific Joint Saliency AUC=97
[160] COVID-19 Dataset CT-Scan 60 Patients with COVID-19 Resizing, DA PyTorch MiniSegProposedStructure
Sigmoid andSoftmax
NA NA
Sen=83.62Spe=97.42DSC=77.28HD=68.07
[161]Combination of
Different Dataset X-ray
313 COVID-19 Images, 7595 Normal,6012 Pneumonia of Unknown Type,2780 Bacterial Pneumonia Images
Segmentation using U-Net,Standard Preprocessing
NAVGG-16, VGG-19,
Inception-V3ModifiedVersion
Weighted Ave-rage Ensemble
MethodGrad-CAM NA
Acc=99.01Sen=99.01Pre=99.01
AUC=99.72
[162] COVID-SemiSeg CT-Scan100 Labeled Images, 1600 Unlabeled
Images of COVID-19Pseudo Label Generation PyTorch
Semi-SupervisedInf-Net+Multi-
Class Segmentation
Modified
Sigmoid NA NA
Dice=54.1Res2Net+ Sen=56.4U-Net as Spe=96.7
Backbones MAE=5.7
[163]Dataset I
X-ray466 Normal, 860 Bacteria, 433 Viruses Adaptive Histogram, CLAHE Method,
MoEx, Use U-Net to SegmentLung Area (VGG19), DA
NACascade-SEMENet
ModifiedVersion Sigmoid Grad-CAM NA
Acc=85.6F1-Score=86
Dataset II 210 COVID-19, 330 Others Acc=97.1F1-Score=97
[58] Clinical CT-Scan 21,658 Images From 861 COVID-19 Patients Cropping Pytorch COVID-SegNet 11 Blocks Softmax NA NADSC=72.6Sen=75.1Pre=72.6
[164] Clinical CT-Scan10 Axial Volumetric CT-Scans
of COVID-19 Pneumonia PatientsUnder-Sampling ofthe Majority Class
Keras with Tensor-Flow Backend FCN-8s NA NA NA NA
Acc=100F1-Score=90
Pre=98
[165]Combination of
Different Dataset CT-Scan449 COVID-19 Patients, 100 Normal,98 Lung Cancer, 397 Other Pathology
Resizing, Intensity NormalizationKeras with Tensor-
Flow Backend
Encoder and TwoDecoders (2D U-NET
Architecture)and MLP
24, 24, 15 Sigmoid NA NA
Acc=86Sen=94Spe=79
AUC=93DSC=78.5
[166] Clinical CT-Scan 313 COVID-19, 229 Non-COVID-19 Normalizing, Resampling, DA, 3D Lung PyTorch DeCoVNet 20 Softmax NA NA Acc=90.8Mask Generation using 2D U-Net
[167] Clinical CT-Scan 877 COVID-19, 991 Non-COVID-19Visual Data Annotation and Quality,
PyTorch ResNet50StandardVersion Softmax NA NA
Sen=97.4Normalization, 3D Spe=92.2
U-Net++ for Segmentation, DA AUC=99.1
[168] Clinical CT-Scan 1315 COVID-19 Scans, 3342 Non-COVID-19 ScansLobe Segmentation using 3D-Unet,
Cropping, Resizing, DAKeras with Tensor-
Flow Backend
3D-ResNets with ModifiedVersion Softmax Heatmap Visualization 5
Acc=93.3Prior-Attention Sen=87.6
Mechanism Spe=95.5
[169] Clinical LUS Images 17 COVID-19 Patients, 4 Were COVID-19 Labelling Process, DA, Reg-STN Model NA CNN NA Loss Function Segmentation 5 NASuspected, and 14 Were Healthy
[170] Clinical CT-Scan296 COVID-19 Images, 1735 CAP,
1325 Non-Pneumonia ImagesLung Segmentation using U-net NA COVNet
ModifiedVersion Softmax Grad-CAM NA
AUC=96Sen=90Spe=96
[171] Clinical CT-Scan1266 COVID-19 Patients, 4106 Patients
with Lung Cancer (Auxiliary Training Set)
DenseNet121-FPN for LungSegmentation, 3-Dimensional Bounding
Box, Non-Lung AreaSuppression Operation
Keras COVID-19Net4 DenseBlocks
+9 LayersSigmoid
Combined Feature Vectors,Multivariate Cox Proportional
Hazard Model,Visualizations
NA
Acc=81.24AUC=0.90Sen=78.93Spe=89.93
F1-Score=86.92
[172] Clinical CT-scan
219 From 110 Patients with COVID-19,224 CT-Scan from patients, 175CT-Scan From Healthy People
Segmentation using VNET-IR-RPN, DA NAResNet-18 with
Location-AttentionMechanism
ModifiedVersion
VotingStrategy
Total Infection Confidence
NA Acc=86.7Score Calculation usingProbability Formula of the
Noisy-or Bayesian Function
[173] Clinical CT-Scan 129 COVID-19 imagesSegmentation Using U-Net,
Different Preprocessing MethodsNA ResNet18
ModifiedVersion Softmax
Calculate the Proportion ofInfected Regions in Lung
NAAcc=93.8AUC=91.3
m-Dice=74.3
[174] Clinical CT-Scan 100 COVID-19 and 100 healthy controls lDRL Landmarks, DI2IN Segmentation, Pytorch DenseUNet Modified Softmax Visualization NA DifferentAlignment, Resampling Version Parameters
[175] Clinical CT-Scan 558 COVID-19 Patients 2D CNNs for the Segmentation PyTorch
Student COPLE-Net+Proposed
ArchitectureNA
ProposedLoss Function
NADice=80.72RVE=15.96
EMA for Ada-ptive teacher+
Teacher COPLE-Net
[176]Combination of
Different Datasets CT-Scan33 COVID-19 Patients, 32 Healthy Patients,
36 Patients with Other Lung PathologiesRescaling, Intensity Normalization,Creating Feature Map using U-Net
NADifferent
Architectures NA NA NA 3AUC=95.1Spearman
Correlation=98

13
Fig. 20: Total number of investigations conducted in the fieldof classification, segmentation, and prediction of COVID-19patients using DL techniques.
V. DISCUSSION
The main focus of this work is to select the best DLmodels employed to detect, segment the lungs, and predictthe COVID-19 patients using DL techniques. The summaryof works done on classification, segmentation, and predictionare presented in Tables III, IV, and V, respectively. Figure20 depicts the total number of investigations conducted in thefield of classification, segmentation, and prediction of COVID-19 using DL models. It can be noted from the figure that mostworks have been done on the detection of COVID-19 patients,and the least works are done on the forecasting due to shortageof available public databases.
The X-ray and CT images have been used to developclassification and segmentation DL models. Figure 21 showsthe total number of times each modality is used in reviewedstudies. It can be observed that most of the researchers haveused X-ray images. This may be due to cheaper registrationfees, and the fact that slice selection is not needed. Also,very few researches have used combined modalities of X-rayand CT images due to the absence of such a comprehensivedatabase.
Various DL models developed for the automated detectionof COVID-19 patients is shown in Figure 22. It can be notedfrom the figure that; different types of convolutional networkshave been commonly used. Also, for the automated segmen-tation of lungs, various types of U-Net are more common.
Nowadays, a variety of toolboxes have been used to imple-ment DL models. The number of toolboxes used for automateddetection of COVID-19 by researches is shown in Figure 23.It can be noted that Keras toolbox is the most widely used forautomated detection of COVID-19 patients; this is due to itssimplicity and also availability of pre-trained models in thislibrary, which are widely used by researchers.
The last part of this study is devoted to the classificationalgorithms developed using DL architectures. The softmaxis most employed for automated detection of COVID-19patients (Tables III to V). Figure 24 shows the number of
Fig. 21: Number of datasets used for COVID-19 detection andprediction based on the published papers using DL methods.
Fig. 22: Number of DL architectures used for COVID-19detection and prediction based on published papers.
various classification algorithms used for automated detectionof COVID-19 patients using DL techniques.
VI. CHALLENGES
With the rapid growth and spread of COVID-19 globally,researchers have confronted many serious challenges in de-signing and implementing CADS to diagnose and predictthe disease. The most significant challenges associated withCOVID-19 are data availability, DL networks architecturefixing, and hardware resources. Lack of availability of a hugepublic database comprising X-ray and CT images is the firstchallenge. Due to the limited number of patient data, many re-searchers have used pre-trained networks such as GoogLeNetand AlexNet. Nevertheless, the number of studies conductedon forecasting is limited as it requires a vast database.
One of the problems of employing pre-trained networks isthat these models are often trained on the ImageNet database,which is entirely different from medical images. Hence, im-plementing efficient CADS to accurately and swiftly diagnoseCOVID-19 from X-Ray or CT images is still a challengingwork. Physicians are not just convinced with X-ray or CT-scanimages of patients to accurately diagnose COVID-19; they

14
TABLE V: Summary of DL models developed for the forecasting spread of COVID-19.
Work Dataset Preprocessing DNNToolbox DNN Number
of layers K-Fold PostProcessing
PerformanceCriteria
[177] Johns Hopkins University and Canadian Health Authority WT, ADF test NA LSTM 3 NA NA RMSE=45.70Acc=92.67%
[178] Surging News Network (a Media Outlet) and WHO Reshaping NA CNN 7 NA NA MAE=102.943RMSE=109.439
[179] Google Trends Website NA Keras with Tensor-Flow Backend LSTM 3 10 NA RMSE=27.187
[180] India Government NA MATLAB LSTM NA NA NA Curves
[181] Times Series Dataset of COVID-19 Confirmed Cases for Tunisia and ChinaGrid Search Technique,Sliding Window (SW) NA Stacked Ensemble
Meta-Learners
DNN: 5LSTM:5CNN: 7
NAAugmentedPrediction
Acc=99%RMSE=2,396
[182] Cumulative and New Confirmed Cases of Covid-19 in All of China and 31 Provinces/Cities in Mainland and Three Other Regions (Hong Kong, Macau and Taiwan) Windowing, Normalizing NA Modified Auto-
Encoders (MAE) 3 5 k-Means Curves
[183]COVID-19 Confirmed Data from Iran Ministry of Health and Medical
Education, IRNA, ISNA Sources in Provincial Level and National LevelNA TensorFlow LSTM NA NA NA Curves
[184] Combined of Local Trend Data and Weather DataFeature Selection using
OLS Regression, NetworkHyper-Parameters Search
NA LSTM 3 NAFuzzy Rule-Based Risk
Categorization
RMSE=2300.8Acc=78%
Curves[185] WHO and Johns Hopkins University Datasets Normalizing NA LSTM 4 NA RMSLE Curves
[186] Johns Hopkins University, Lockdown dates of Countries DatasetsWindowing, Normalization,Proposed Improved Method
NA LSTM 4 NA NA Curves
[187]John Hopkins University,
Oxford COVID-19 Government Response Tracker
Feature Selection, SpatiallyWeighted Adjacency Matrix
Computation, Reshaping to 3D TensorNA
Variational LSTM-Autoencoder with Self-Attention Mechanism
3 Blocks NA NA Curves
[188]TheMinistry of Health and Family Welfare
(Government of India)Linear Weighted Moving Average
TechniqueKeras with Tensor-
Flow Backend Bi-LSTM 3 NA NA MAPE LessThan 3%
Fig. 23: Number of DL tools used for COVID-19 detectionand prediction based on the published papers.
Fig. 24: Illustration of number of various classifier algorithmsused in DL networks for automated detection of COVID-19patients.
may use both modalities simultaneously. However, completeand comprehensive databases of the X-ray and CT-scan hybridmodalities for CADS research and implementation have notbeen provided for researchers’ in the machine learning scope.For this reason, researchers combine different X-ray and
CT-Scan datasets from various datasets, which may disruptnetwork training. Yielding the combined X-Ray and CT-Scandatasets pave the path to help quickly identify COVID-19alongside DL networks. The third challenge in the data sectionis the non-reporting of phenotypic information, such as ageand gender. The utilization of this information can amend andenhance the performance of DL algorithms.
Table IV summarizes the DL-based segmentation algorithmsaimed at identifying areas suspected of corona in the X-rayand CT-scan images. One of the obstacles with databases is theabsence of manual or ground truths for COVID-19 image seg-mentation areas. Therefore, many researchers have delineatedthese areas with the help of radiologists and trained the modelssuch as U-Net, which is time-consuming. Consequently, thepresence of dedicated databases of segmented images willhelp to get the best performing model. Also, it becomes easyto compare the performances with other authors who haveworked on the same images.
In order to predict the prevalence of corona using DL meth-ods, the nature of the COVID-19 is still relatively unknown,and the probability of mutation is a big issue. Therefore, topredict the prevalence of the disease, many factors like theaverage age of the society, policies to impede the spread ofthe disease by countries, climatic conditions, and infection ofneighbor/friend/family member.
Lack of access to appropriate hardware resources is anotherchallenge. Implementing DL architectures in CADS for coronadiagnosis demands strong hardware resources, which unfortu-nately is not ordinarily accessible for many researchers. Al-though tools such as Google Colab have partially obviated thisproblem, employing these tools in real medical applications isstill challenging. For this reason, in most studies, researchershave not provided practical CADS systems such as web orWindows software to detect COVID-19.
VII. CONCLUSION AND FUTURE WORKS
COVID-19 is an emerging pandemic disease that, in a shortperiod of time, can severely endanger the health of manypeople throughout the world. It directly affects the lung cells,and if not accurately diagnosed early, can cause irreversibledamage, including death. The disease is accurately detected bythe specialists using X-ray or CT images together with PCR
15
results. The PCR results indicate the type of lung disease,such as pulmonary tuberculosis, instead of COVID-19. In thisstudy, a comprehensive review of the accomplished studies ofCOVID-19 diagnosis was carried out using DL networks. Thepublic databases available to diagnose and predict COVID-19 are presented. The state-of-art DL techniques employedfor the diagnosis, segmentation, and forecasting of the spreadof COVID-19 are presented in Tables III, IV, V, respectively.One of the challenges to develop a robust and accurate COVID19 diagnosis system is the availability of an extensive publicdatabase. We strongly feel that, with more public databases,better DL models can be developed by researchers to detectand predict the COVID19 accurately. Hence, this will help todevelop the best performing model. We feel that data fusionmodels can help to improve the performance of diagnosis andprediction. The features extracted from the ML and DL modelscan be fused to develop an accurate model.
Also, developing the accurate segmentation model is chal-lenging as it involves delineating the lungs by the experts.Having an accurate ground truth is another challenge.
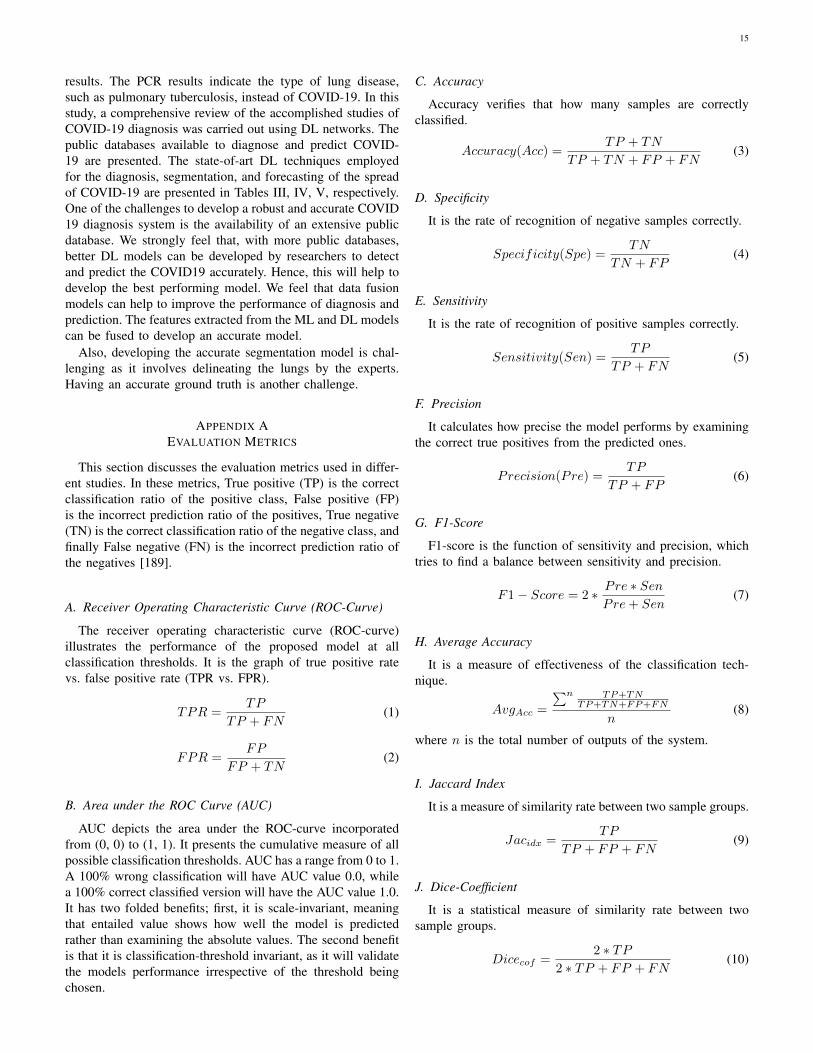
APPENDIX AEVALUATION METRICS
This section discusses the evaluation metrics used in differ-ent studies. In these metrics, True positive (TP) is the correctclassification ratio of the positive class, False positive (FP)is the incorrect prediction ratio of the positives, True negative(TN) is the correct classification ratio of the negative class, andfinally False negative (FN) is the incorrect prediction ratio ofthe negatives [189].
A. Receiver Operating Characteristic Curve (ROC-Curve)
The receiver operating characteristic curve (ROC-curve)illustrates the performance of the proposed model at allclassification thresholds. It is the graph of true positive ratevs. false positive rate (TPR vs. FPR).
TPR =TP
TP + FN(1)
FPR =FP
FP + TN(2)
B. Area under the ROC Curve (AUC)
AUC depicts the area under the ROC-curve incorporatedfrom (0, 0) to (1, 1). It presents the cumulative measure of allpossible classification thresholds. AUC has a range from 0 to 1.A 100% wrong classification will have AUC value 0.0, whilea 100% correct classified version will have the AUC value 1.0.It has two folded benefits; first, it is scale-invariant, meaningthat entailed value shows how well the model is predictedrather than examining the absolute values. The second benefitis that it is classification-threshold invariant, as it will validatethe models performance irrespective of the threshold beingchosen.
C. Accuracy
Accuracy verifies that how many samples are correctlyclassified.
Accuracy(Acc) =TP + TN
TP + TN + FP + FN(3)
D. Specificity
It is the rate of recognition of negative samples correctly.
Specificity(Spe) =TN
TN + FP(4)
E. Sensitivity
It is the rate of recognition of positive samples correctly.
Sensitivity(Sen) =TP
TP + FN(5)
F. Precision
It calculates how precise the model performs by examiningthe correct true positives from the predicted ones.
Precision(Pre) =TP
TP + FP(6)
G. F1-Score
F1-score is the function of sensitivity and precision, whichtries to find a balance between sensitivity and precision.
F1− Score = 2 ∗ Pre ∗ SenPre+ Sen
(7)
H. Average Accuracy
It is a measure of effectiveness of the classification tech-nique.
AvgAcc =
∑n TP+TNTP+TN+FP+FN
n(8)
where n is the total number of outputs of the system.
I. Jaccard Index
It is a measure of similarity rate between two sample groups.
Jacidx =TP
TP + FP + FN(9)
J. Dice-Coefficient
It is a statistical measure of similarity rate between twosample groups.
Dicecof =2 ∗ TP
2 ∗ TP + FP + FN(10)

16
REFERENCES
[1] J. F.-W. Chan, S. Yuan, K.-H. Kok, K. K.-W. To, H. Chu, J. Yang,F. Xing, J. Liu, C. C.-Y. Yip, R. W.-S. Poon et al., “A familial clusterof pneumonia associated with the 2019 novel coronavirus indicatingperson-to-person transmission: a study of a family cluster,” The Lancet,vol. 395, no. 10223, pp. 514–523, 2020.
[2] X. Peng, X. Xu, Y. Li, L. Cheng, X. Zhou, and B. Ren, “Transmissionroutes of 2019-ncov and controls in dental practice,” InternationalJournal of Oral Science, vol. 12, no. 1, pp. 1–6, 2020.
[3] S. Tian, W. Hu, L. Niu, H. Liu, H. Xu, and S.-Y. Xiao, “Pulmonarypathology of early phase 2019 novel coronavirus (covid-19) pneumoniain two patients with lung cancer,” Journal of Thoracic Oncology, 2020.
[4] T. C. Lan, M. F. Allan, L. Malsick, S. Khandwala, S. S. Nyeo,M. Bathe, A. Griffiths, and S. Rouskin, “Structure of the full sars-cov-2 rna genome in infected cells,” bioRxiv, 2020.
[5] M. S. Razai, K. Doerholt, S. Ladhani, and P. Oakeshott, “Coronavirusdisease 2019 (covid-19): a guide for uk gps,” BMJ, vol. 368, 2020.
[6] A. Remuzzi and G. Remuzzi, “Covid-19 and italy: what next?” TheLancet, 2020.
[7] C. Sohrabi, Z. Alsafi, N. ONeill, M. Khan, A. Kerwan, A. Al-Jabir,C. Iosifidis, and R. Agha, “World health organization declares globalemergency: A review of the 2019 novel coronavirus (covid-19),”International Journal of Surgery, 2020.
[8] A. E. Hassanien, L. N. Mahdy, K. A. Ezzat, H. H. Elmousalami,and H. A. Ella, “Automatic x-ray covid-19 lung image classificationsystem based on multi-level thresholding and support vector machine,”medRxiv, 2020.
[9] S. Kadry, V. Rajinikanth, S. Rho, N. S. M. Raja, V. S. Rao, andK. P. Thanaraj, “Development of a machine-learning system to clas-sify lung ct scan images into normal/covid-19 class,” arXiv preprintarXiv:2004.13122, 2020.
[10] W. H. Self, D. M. Courtney, C. D. McNaughton, R. G. Wunderink, andJ. A. Kline, “High discordance of chest x-ray and computed tomogra-phy for detection of pulmonary opacities in ed patients: implications fordiagnosing pneumonia,” The American journal of emergency medicine,vol. 31, no. 2, pp. 401–405, 2013.
[11] G. D. Rubin, C. J. Ryerson, L. B. Haramati, N. Sverzellati, J. P. Kanne,S. Raoof, N. W. Schluger, A. Volpi, J.-J. Yim, I. B. Martin et al.,“The role of chest imaging in patient management during the covid-19 pandemic: a multinational consensus statement from the fleischnersociety,” Chest, 2020.
[12] L. Orioli, M. P. Hermans, J.-P. Thissen, D. Maiter, B. Vandeleene, andJ.-C. Yombi, “Covid-19 in diabetic patients: related risks and specificsof management,” in Annales D’endocrinologie. Elsevier, 2020.
[13] “https://www.ecdc.europa.eu/en/geographical-distribution-2019-ncov-cases,” https://www.ecdc.europa.eu/en/geographical-distribution-2019-ncov-cases, 2020.
[14] R. Alizadehsani, M. Behjati, Z. Roshanzamir, S. Hussain, N. Abedini,F. Hasanzadeh, A. Khosravi, A. Shoeibi, M. Roshanzamir, P. Morad-nejad et al., “Risk factors prediction, clinical outcomes, and mortalityof covid-19 patients,” medRxiv, 2020.
[15] L. J. Kroft, L. van der Velden, I. H. Giron, J. J. Roelofs, A. de Roos,and J. Geleijns, “Added value of ultra–low-dose computed tomogra-phy, dose equivalent to chest x-ray radiography, for diagnosing chestpathology,” Journal of thoracic imaging, vol. 34, no. 3, p. 179, 2019.
[16] N. Ghassemi, A. Shoeibi, and M. Rouhani, “Deep neural networkwith generative adversarial networks pre-training for brain tumorclassification based on mr images,” Biomedical Signal Processing andControl, vol. 57, p. 101678, 2020.
[17] M. Talo, O. Yildirim, U. B. Baloglu, G. Aydin, and U. R. Acharya,“Convolutional neural networks for multi-class brain disease detectionusing mri images,” Computerized Medical Imaging and Graphics,vol. 78, p. 101673, 2019.
[18] N. Ghassemi, A. Shoeibi, M. Rouhani, and H. Hosseini-Nejad, “Epilep-tic seizures detection in eeg signals using tqwt and ensemble learning,”in 2019 9th International Conference on Computer and KnowledgeEngineering (ICCKE). IEEE, 2019, pp. 403–408.
[19] U. R. Acharya, S. L. Oh, Y. Hagiwara, J. H. Tan, and H. Adeli, “Deepconvolutional neural network for the automated detection and diagnosisof seizure using eeg signals,” Computers in biology and medicine, vol.100, pp. 270–278, 2018.
[20] M. Mohammadpoor, A. Shoeibi, H. Zare, and H. Shojaee, “A hierarchi-cal classification method for breast tumor detection,” Iranian Journalof Medical Physics, vol. 13, no. 4, pp. 261–268, 2016.
[21] D. Arefan, A. A. Mohamed, W. A. Berg, M. L. Zuley, J. H. Sumkin,and S. Wu, “Deep learning modeling using normal mammograms forpredicting breast cancer risk,” Medical physics, vol. 47, no. 1, pp. 110–118, 2020.
[22] A. Z. Khuzani, M. Heidari, and S. A. Shariati, “Covid-classifier: Anautomated machine learning model to assist in the diagnosis of covid-19 infection in chest x-ray images,” medRxiv, 2020.
[23] X. Mei, H.-C. Lee, K.-y. Diao, M. Huang, B. Lin, C. Liu, Z. Xie,Y. Ma, P. M. Robson, M. Chung et al., “Artificial intelligence–enabledrapid diagnosis of patients with covid-19,” Nature Medicine, pp. 1–5,2020.
[24] A. Esteva, B. Kuprel, R. A. Novoa, J. Ko, S. M. Swetter, H. M. Blau,and S. Thrun, “Dermatologist-level classification of skin cancer withdeep neural networks,” nature, vol. 542, no. 7639, pp. 115–118, 2017.
[25] M. A. Mazurowski, M. Buda, A. Saha, and M. R. Bashir, “Deeplearning in radiology: An overview of the concepts and a survey ofthe state of the art with focus on mri,” Journal of magnetic resonanceimaging, vol. 49, no. 4, pp. 939–954, 2019.
[26] T. M. Tuan, T. T. Ngan, C. N. Giap et al., “Semisupervised fuzzyclustering methods for x-ray image segmentation,” in Handbook ofData Science Approaches for Biomedical Engineering. Elsevier, 2020,pp. 251–289.
[27] A. Shoeibi, N. Ghassemi, H. Hosseini-Nejad, and M. Rouhani, “Anefficient brain mr images segmentation hardware using kernel fuzzyc-means,” in 2019 26th National and 4th International Iranian Con-ference on Biomedical Engineering (ICBME). IEEE, 2019, pp. 93–99.
[28] O. Ronneberger, P. Fischer, and T. Brox, “U-net: Convolutional net-works for biomedical image segmentation,” in International Confer-ence on Medical image computing and computer-assisted intervention.Springer, 2015, pp. 234–241.
[29] J. P. Cohen, P. Morrison, L. Dao, K. Roth, T. Q. Duong,and M. Ghassemi, “Covid-19 image data collection: Prospectivepredictions are the future,” arXiv 2006.11988, 2020. [Online].Available: https://github.com/ieee8023/covid-chestxray-dataset
[30] J. Zhao, Y. Zhang, X. He, and P. Xie, “Covid-ct-dataset: a ct scandataset about covid-19,” arXiv preprint arXiv:2003.13865, 2020.
[31] J. Born, G. Brandle, M. Cossio, M. Disdier, J. Goulet, J. Roulin,and N. Wiedemann, “Pocovid-net: Automatic detection of covid-19from a new lung ultrasound imaging dataset (pocus),” arXiv preprintarXiv:2004.12084, 2020.
[32] J. M. Banda, R. Tekumalla, G. Wang, J. Yu, T. Liu, Y. Ding,and G. Chowell, “A large-scale covid-19 twitter chatter dataset foropen scientific research–an international collaboration,” arXiv preprintarXiv:2004.03688, 2020.
[33] R. Hu, G. Ruan, S. Xiang, M. Huang, Q. Liang, and J. Li, “Automateddiagnosis of covid-19 using deep learning and data augmentation onchest ct,” medRxiv, 2020.
[34] Z. Q. L. Linda Wang and A. Wong, “Covid-net: A tailored deepconvolutional neural network design for detection of covid-19 casesfrom chest radiography images,” 2020.
[35] L. Zhang, M. Wang, M. Liu, and D. Zhang, “A survey on deep learn-ing for neuroimaging-based brain disorder analysis,” arXiv preprintarXiv:2005.04573, 2020.
[36] M. Z. Alom, T. M. Taha, C. Yakopcic, S. Westberg, P. Sidike, M. S.Nasrin, B. C. Van Esesn, A. A. S. Awwal, and V. K. Asari, “Thehistory began from alexnet: A comprehensive survey on deep learningapproaches,” arXiv preprint arXiv:1803.01164, 2018.
[37] A. Krizhevsky, I. Sutskever, and G. E. Hinton, “Imagenet classificationwith deep convolutional neural networks,” in Advances in neuralinformation processing systems, 2012, pp. 1097–1105.
[38] K. Simonyan and A. Zisserman, “Very deep convolutional networks forlarge-scale image recognition,” arXiv preprint arXiv:1409.1556, 2014.
[39] C. Szegedy, W. Liu, Y. Jia, P. Sermanet, S. Reed, D. Anguelov,D. Erhan, V. Vanhoucke, and A. Rabinovich, “Going deeper withconvolutions,” in Proceedings of the IEEE conference on computervision and pattern recognition, 2015, pp. 1–9.
[40] K. He, X. Zhang, S. Ren, and J. Sun, “Identity mappings in deep resid-ual networks,” in European conference on computer vision. Springer,2016, pp. 630–645.
[41] C. Szegedy, S. Ioffe, V. Vanhoucke, and A. A. Alemi, “Inception-v4,inception-resnet and the impact of residual connections on learning,”in Thirty-first AAAI conference on artificial intelligence, 2017.
[42] M. Karim, T. Dohmen, D. Rebholz-Schuhmann, S. Decker, M. Cochez,O. Beyan et al., “Deepcovidexplainer: Explainable covid-19 predictionsbased on chest x-ray images,” arXiv preprint arXiv:2004.04582, 2020.
[43] G. Huang, Z. Liu, L. Van Der Maaten, and K. Q. Weinberger,“Densely connected convolutional networks,” in Proceedings of the

17
IEEE conference on computer vision and pattern recognition, 2017,pp. 4700–4708.
[44] F. Chollet, “Xception: Deep learning with depthwise separable convo-lutions,” in Proceedings of the IEEE conference on computer visionand pattern recognition, 2017, pp. 1251–1258.
[45] A. G. Howard, M. Zhu, B. Chen, D. Kalenichenko, W. Wang,T. Weyand, M. Andreetto, and H. Adam, “Mobilenets: Efficient convo-lutional neural networks for mobile vision applications,” arXiv preprintarXiv:1704.04861, 2017.
[46] M. Sandler, A. Howard, M. Zhu, A. Zhmoginov, and L.-C. Chen, “Mo-bilenetv2: Inverted residuals and linear bottlenecks,” in Proceedings ofthe IEEE conference on computer vision and pattern recognition, 2018,pp. 4510–4520.
[47] F. N. Iandola, S. Han, M. W. Moskewicz, K. Ashraf, W. J. Dally,and K. Keutzer, “Squeezenet: Alexnet-level accuracy with 50x fewerparameters and¡ 0.5 mb model size,” arXiv preprint arXiv:1602.07360,2016.
[48] S. Sabour, N. Frosst, and G. E. Hinton, “Dynamic routing betweencapsules,” in Advances in neural information processing systems, 2017,pp. 3856–3866.
[49] B. Zoph, V. Vasudevan, J. Shlens, and Q. V. Le, “Learning transferablearchitectures for scalable image recognition,” in Proceedings of theIEEE conference on computer vision and pattern recognition, 2018,pp. 8697–8710.
[50] X. Zhang, X. Zhou, M. Lin, and J. Sun, “Shufflenet: An extremely effi-cient convolutional neural network for mobile devices,” in Proceedingsof the IEEE conference on computer vision and pattern recognition,2018, pp. 6848–6856.
[51] N. Ma, X. Zhang, H.-T. Zheng, and J. Sun, “Shufflenet v2: Practicalguidelines for efficient cnn architecture design,” in Proceedings of theEuropean conference on computer vision (ECCV), 2018, pp. 116–131.
[52] R. Hu, G. Ruan, S. Xiang, M. Huang, Q. Liang, and J. Li, “Automateddiagnosis of covid-19 using deep learning and data augmentation onchest ct,” medRxiv, 2020.
[53] M. Tan and Q. V. Le, “Efficientnet: Rethinking model scaling for con-volutional neural networks,” arXiv preprint arXiv:1905.11946, 2019.
[54] X. Yi, E. Walia, and P. Babyn, “Generative adversarial network inmedical imaging: A review,” Medical image analysis, vol. 58, p.101552, 2019.
[55] I. Goodfellow, J. Pouget-Abadie, M. Mirza, B. Xu, D. Warde-Farley,S. Ozair, A. Courville, and Y. Bengio, “Generative adversarial nets,” inAdvances in neural information processing systems, 2014, pp. 2672–2680.
[56] J. Long, E. Shelhamer, and T. Darrell, “Fully convolutional networksfor semantic segmentation,” in Proceedings of the IEEE conference oncomputer vision and pattern recognition, 2015, pp. 3431–3440.
[57] V. Badrinarayanan, A. Kendall, and R. Cipolla, “Segnet: A deep con-volutional encoder-decoder architecture for image segmentation,” IEEEtransactions on pattern analysis and machine intelligence, vol. 39,no. 12, pp. 2481–2495, 2017.
[58] Q. Yan, B. Wang, D. Gong, C. Luo, W. Zhao, J. Shen, Q. Shi,S. Jin, L. Zhang, and Z. You, “Covid-19 chest ct image segmentation–a deep convolutional neural network solution,” arXiv preprintarXiv:2004.10987, 2020.
[59] O. Ronneberger, P. Fischer, and T. Brox, “U-net: Convolutional net-works for biomedical image segmentation,” in International Confer-ence on Medical image computing and computer-assisted intervention.Springer, 2015, pp. 234–241.
[60] T. Zhou, S. Canu, and S. Ruan, “An automatic covid-19 ct segmentationnetwork using spatial and channel attention mechanism.” arXiv preprintarXiv:2004.06673, 2020.
[61] S. Gao, M.-M. Cheng, K. Zhao, X.-Y. Zhang, M.-H. Yang, andP. H. Torr, “Res2net: A new multi-scale backbone architecture,” IEEEtransactions on pattern analysis and machine intelligence, 2019.
[62] J. Chung, C. Gulcehre, K. Cho, and Y. Bengio, “Empirical evaluation ofgated recurrent neural networks on sequence modeling,” arXiv preprintarXiv:1412.3555, 2014.
[63] P. Baldi, “Autoencoders, unsupervised learning, and deep architec-tures,” in Proceedings of ICML workshop on unsupervised and transferlearning, 2012, pp. 37–49.
[64] I. Tolstikhin, O. Bousquet, S. Gelly, and B. Schoelkopf, “Wassersteinauto-encoders,” arXiv preprint arXiv:1711.01558, 2017.
[65] M. Farooq and A. Hafeez, “Covid-resnet: A deep learning frame-work for screening of covid19 from radiographs,” arXiv preprintarXiv:2003.14395, 2020.
[66] A. Narin, C. Kaya, and Z. Pamuk, “Automatic detection of coronavirusdisease (covid-19) using x-ray images and deep convolutional neuralnetworks,” arXiv preprint arXiv:2003.10849, 2020.
[67] H. S. Maghdid, A. T. Asaad, K. Z. Ghafoor, A. S. Sadiq, and M. K.Khan, “Diagnosing covid-19 pneumonia from x-ray and ct imagesusing deep learning and transfer learning algorithms,” arXiv preprintarXiv:2004.00038, 2020.
[68] E. E.-D. Hemdan, M. A. Shouman, and M. E. Karar, “Covidx-net: Aframework of deep learning classifiers to diagnose covid-19 in x-rayimages,” arXiv preprint arXiv:2003.11055, 2020.
[69] J. Zhang, Y. Xie, Y. Li, C. Shen, and Y. Xia, “Covid-19 screeningon chest x-ray images using deep learning based anomaly detection,”arXiv preprint arXiv:2003.12338, 2020.
[70] L. Wang and A. Wong, “Covid-net: A tailored deep convolutionalneural network design for detection of covid-19 cases from chest x-rayimages,” arXiv preprint arXiv:2003.09871, 2020.
[71] F. Ucar and D. Korkmaz, “Covidiagnosis-net: Deep bayes-squeezenetbased diagnostic of the coronavirus disease 2019 (covid-19) from x-rayimages,” Medical Hypotheses, p. 109761, 2020.
[72] B. Ghoshal and A. Tucker, “Estimating uncertainty and interpretabilityin deep learning for coronavirus (covid-19) detection,” arXiv preprintarXiv:2003.10769, 2020.
[73] M. Togacar, B. Ergen, and Z. Comert, “Covid-19 detection using deeplearning models to exploit social mimic optimization and structuredchest x-ray images using fuzzy color and stacking approaches,” Com-puters in Biology and Medicine, p. 103805, 2020.
[74] X. Wu, H. Hui, M. Niu, L. Li, L. Wang, B. He, X. Yang, L. Li,H. Li, J. Tian et al., “Deep learning-based multi-view fusion modelfor screening 2019 novel coronavirus pneumonia: a multicentre study,”European Journal of Radiology, p. 109041, 2020.
[75] T. Ozturk, M. Talo, E. A. Yildirim, U. B. Baloglu, O. Yildirim,and U. R. Acharya, “Automated detection of covid-19 cases usingdeep neural networks with x-ray images,” Computers in Biology andMedicine, p. 103792, 2020.
[76] A. A. Ardakani, A. R. Kanafi, U. R. Acharya, N. Khadem, andA. Mohammadi, “Application of deep learning technique to managecovid-19 in routine clinical practice using ct images: Results of 10convolutional neural networks,” Computers in Biology and Medicine,p. 103795, 2020.
[77] A. Abbas, M. M. Abdelsamea, and M. M. Gaber, “Classification ofcovid-19 in chest x-ray images using detrac deep convolutional neuralnetwork,” arXiv preprint arXiv:2003.13815, 2020.
[78] R. M. Pereira, D. Bertolini, L. O. Teixeira, C. N. Silla Jr, and Y. M.Costa, “Covid-19 identification in chest x-ray images on flat andhierarchical classification scenarios,” Computer Methods and Programsin Biomedicine, p. 105532, 2020.
[79] N. E. M. Khalifa, M. H. N. Taha, A. E. Hassanien, and S. Elghamrawy,“Detection of coronavirus (covid-19) associated pneumonia based ongenerative adversarial networks and a fine-tuned deep transfer learningmodel using chest x-ray dataset,” arXiv preprint arXiv:2004.01184,2020.
[80] U. Ozkaya, S. Ozturk, and M. Barstugan, “Coronavirus (covid-19)classification using deep features fusion and ranking technique,” arXivpreprint arXiv:2004.03698, 2020.
[81] P. Afshar, S. Heidarian, F. Naderkhani, A. Oikonomou, K. N. Pla-taniotis, and A. Mohammadi, “Covid-caps: A capsule network-basedframework for identification of covid-19 cases from x-ray images,”arXiv preprint arXiv:2004.02696, 2020.
[82] A. I. Khan, J. L. Shah, and M. M. Bhat, “Coronet: A deep neuralnetwork for detection and diagnosis of covid-19 from chest x-rayimages,” Computer Methods and Programs in Biomedicine, p. 105581,2020.
[83] K. Hammoudi, H. Benhabiles, M. Melkemi, F. Dornaika, I. Arganda-Carreras, D. Collard, and A. Scherpereel, “Deep learning on chest x-rayimages to detect and evaluate pneumonia cases at the era of covid-19,”arXiv preprint arXiv:2004.03399, 2020.
[84] E. Luz, P. L. Silva, R. Silva, and G. Moreira, “Towards an efficientdeep learning model for covid-19 patterns detection in x-ray images,”arXiv preprint arXiv:2004.05717, 2020.
[85] A. Mobiny, P. A. Cicalese, S. Zare, P. Yuan, M. Abavisani, C. C.Wu, J. Ahuja, P. M. de Groot, and H. Van Nguyen, “Radiologist-level covid-19 detection using ct scans with detail-oriented capsulenetworks,” arXiv preprint arXiv:2004.07407, 2020.
[86] D. Ezzat, H. A. Ella et al., “Gsa-densenet121-covid-19: a hybriddeep learning architecture for the diagnosis of covid-19 diseasebased on gravitational search optimization algorithm,” arXiv preprintarXiv:2004.05084, 2020.

18
[87] S. Minaee, R. Kafieh, M. Sonka, S. Yazdani, and G. J. Soufi, “Deep-covid: Predicting covid-19 from chest x-ray images using deep transferlearning,” arXiv preprint arXiv:2004.09363, 2020.
[88] J. de Moura, L. Ramos, P. L. Vidal, M. Cruz, L. Abelairas, E. Castro,J. Novo, and M. Ortega, “Deep convolutional approaches for theanalysis of covid-19 using chest x-ray images from portable devices,”medRxiv, 2020.
[89] T. Li, Z. Han, B. Wei, Y. Zheng, Y. Hong, and J. Cong, “Robustscreening of covid-19 from chest x-ray via discriminative cost-sensitivelearning,” arXiv preprint arXiv:2004.12592, 2020.
[90] N. S. Punn and S. Agarwal, “Automated diagnosis of covid-19 withlimited posteroanterior chest x-ray images using fine-tuned deep neuralnetworks,” arXiv preprint arXiv:2004.11676, 2020.
[91] S. Basu and S. Mitra, “Deep learning for screening covid-19 usingchest x-ray images,” arXiv preprint arXiv:2004.10507, 2020.
[92] M. Rahimzadeh and A. Attar, “A new modified deep convolutionalneural network for detecting covid-19 from x-ray images,” arXivpreprint arXiv:2004.08052, 2020.
[93] Y. Zhang, S. Niu, Z. Qiu, Y. Wei, P. Zhao, J. Yao, J. Huang, Q. Wu, andM. Tan, “Covid-da: Deep domain adaptation from typical pneumoniato covid-19,” arXiv preprint arXiv:2005.01577, 2020.
[94] M. Ramadhan, A. Faza, L. Lubis, R. Yunus, T. Salamah, D. Handayani,I. Lestariningsih, A. Resa, C. Alam, P. Prajitno et al., “Fast and accuratedetection of covid-19-related pneumonia from chest x-ray images withnovel deep learning model,” arXiv preprint arXiv:2005.04562, 2020.
[95] S. Misra, S. Jeon, S. Lee, R. Managuli, and C. Kim, “Multi-channeltransfer learning of chest x-ray images for screening of covid-19,” arXivpreprint arXiv:2005.05576, 2020.
[96] Y. Song, S. Zheng, L. Li, X. Zhang, X. Zhang, Z. Huang, J. Chen,H. Zhao, Y. Jie, R. Wang et al., “Deep learning enables accuratediagnosis of novel coronavirus (covid-19) with ct images,” medRxiv,2020.
[97] L. Sun, Z. Mo, F. Yan, L. Xia, F. Shan, Z. Ding, W. Shao,F. Shi, H. Yuan, H. Jiang et al., “Adaptive feature selection guideddeep forest for covid-19 classification with chest ct,” arXiv preprintarXiv:2005.03264, 2020.
[98] I. Razzak, S. Naz, A. Rehman, A. Khan, and A. Zaib, “Improving coro-navirus (covid-19) diagnosis using deep transfer learning,” medRxiv,2020.
[99] S. Ozturk, U. Ozkaya, and M. Barstugan, “Classification of coronavirusimages using shrunken features,” medRxiv, 2020.
[100] S. Wang, B. Kang, J. Ma, X. Zeng, M. Xiao, J. Guo, M. Cai, J. Yang,Y. Li, X. Meng et al., “A deep learning algorithm using ct images toscreen for corona virus disease (covid-19),” MedRxiv, 2020.
[101] S. Rajaraman and S. Antani, “Training deep learning algorithms withweakly labeled pneumonia chest x-ray data for covid-19 detection,”medRxiv, 2020.
[102] T. Javaheri, M. Homayounfar, Z. Amoozgar, R. Reiazi, F. Homay-ounieh, E. Abbas, A. Laali, A. R. Radmard, M. H. Gharib, S. A. J.Mousavi et al., “Covidctnet: An open-source deep learning approachto identify covid-19 using ct image,” arXiv preprint arXiv:2005.03059,2020.
[103] M. Jamil, I. Hussain et al., “Automatic detection of covid-19 infectionfrom chest x-ray using deep learning,” medRxiv, 2020.
[104] S. Khobahi, C. Agarwal, and M. Soltanalian, “Coronet: A deep networkarchitecture for semi-supervised task-based identification of covid-19from chest x-ray images,” medRxiv, 2020.
[105] X. He, X. Yang, S. Zhang, J. Zhao, Y. Zhang, E. Xing, and P. Xie,“Sample-efficient deep learning for covid-19 diagnosis based on ctscans,” medRxiv, 2020.
[106] X. Ouyang, J. Huo, L. Xia, F. Shan, J. Liu, Z. Mo, F. Yan, Z. Ding,Q. Yang, B. Song et al., “Dual-sampling attention network for diagnosisof covid-19 from community acquired pneumonia,” IEEE Transactionson Medical Imaging, 2020.
[107] L. Sarker, M. Islam, T. Hannan, and A. Zakaria, “Covid-densenet:A deep learning architecture to detect covid-19 from chest radiologyimages,” Preprints, 2020.
[108] S. Yang, L. Jiang, Z. Cao, L. Wang, J. Cao, R. Feng, Z. Zhang,X. Xue, Y. Shi, and F. Shan, “Deep learning for detecting corona virusdisease 2019 (covid-19) on high-resolution computed tomography: apilot study,” Annals of Translational Medicine, vol. 8, no. 7, 2020.
[109] P. K. Sethy and S. K. Behera, “Detection of coronavirus disease (covid-19) based on deep features,” Preprints, vol. 2020030300, p. 2020, 2020.
[110] C. Butt, J. Gill, D. Chun, and B. A. Babu, “Deep learning systemto screen coronavirus disease 2019 pneumonia,” Applied Intelligence,p. 1, 2020.
[111] I. D. Apostolopoulos, S. I. Aznaouridis, and M. A. Tzani, “Extractingpossibly representative covid-19 biomarkers from x-ray images withdeep learning approach and image data related to pulmonary diseases,”Journal of Medical and Biological Engineering, p. 1, 2020.
[112] A. Waheed, M. Goyal, D. Gupta, A. Khanna, F. Al-Turjman, and P. R.Pinheiro, “Covidgan: Data augmentation using auxiliary classifier ganfor improved covid-19 detection,” IEEE Access, vol. 8, pp. 91 916–91 923, 2020.
[113] K. Elasnaoui and Y. Chawki, “Using x-ray images and deep learning forautomated detection of coronavirus disease,” Journal of BiomolecularStructure and Dynamics, no. just-accepted, pp. 1–22, 2020.
[114] M. Loey, F. Smarandache, and N. E. M Khalifa, “Within the lack ofchest covid-19 x-ray dataset: A novel detection model based on ganand deep transfer learning,” Symmetry, vol. 12, no. 4, p. 651, 2020.
[115] A. M. Hasan, M. M. AL-Jawad, H. A. Jalab, H. Shaiba, R. W. Ibrahim,and A. R. AL-Shamasneh, “Classification of covid-19 coronavirus,pneumonia and healthy lungs in ct scans using q-deformed entropyand deep learning features,” Entropy, vol. 22, no. 5, p. 517, 2020.
[116] L. O. Hall, R. Paul, D. B. Goldgof, and G. M. Goldgof, “Finding covid-19 from chest x-rays using deep learning on a small dataset,” arXivpreprint arXiv:2004.02060, 2020.
[117] I. D. Apostolopoulos and T. A. Mpesiana, “Covid-19: automatic detec-tion from x-ray images utilizing transfer learning with convolutionalneural networks,” Physical and Engineering Sciences in Medicine, p. 1,2020.
[118] P. R. Bassi and R. Attux, “A deep convolutional neural net-work for covid-19 detection using chest x-rays,” arXiv preprintarXiv:2005.01578, 2020.
[119] J. P. Cohen, L. Dao, P. Morrison, K. Roth, Y. Bengio, B. Shen,A. Abbasi, M. Hoshmand-Kochi, M. Ghassemi, H. Li et al., “Predictingcovid-19 pneumonia severity on chest x-ray with deep learning,” arXivpreprint arXiv:2005.11856, 2020.
[120] M. E. Chowdhury, T. Rahman, A. Khandakar, R. Mazhar, M. A. Kadir,Z. B. Mahbub, K. R. Islam, M. S. Khan, A. Iqbal, N. Al-Emadiet al., “Can ai help in screening viral and covid-19 pneumonia?” arXivpreprint arXiv:2003.13145, 2020.
[121] M. Loey, G. Manogaran, and N. E. M. Khalifa, “A deep transferlearning model with classical data augmentation and cgan to detectcovid-19 from chest ct radiography digital images,” 2020.
[122] M. Rahimzadeh and A. Attar, “A modified deep convolutional neuralnetwork for detecting covid-19 and pneumonia from chest x-ray imagesbased on the concatenation of xception and resnet50v2,” Informaticsin Medicine Unlocked, p. 100360, 2020.
[123] N. Bansal and S. Sridhar, “Classification of x-ray images for detectingcovid-19 using deep transfer learning,” 2020.
[124] B. D. Goodwin, C. Jaskolski, C. Zhong, and H. Asmani, “Intra-modelvariability in covid-19 classification using chest x-ray images,” arXivpreprint arXiv:2005.02167, 2020.
[125] N. E. M. Khalifa, F. Smarandache, and M. Loey, “A study of theneutrosophic set significance on deep transfer learning models: Anexperimental case on a limited covid-19 chest x-ray dataset,” Preprints,2020.
[126] S. H. Kassani, P. H. Kassasni, M. J. Wesolowski, K. A. Schneider,and R. Deters, “Automatic detection of coronavirus disease (covid-19)in x-ray and ct images: A machine learning-based approach,” arXivpreprint arXiv:2004.10641, 2020.
[127] S. Vaid, R. Kalantar, and M. Bhandari, “Deep learning covid-19detection bias: accuracy through artificial intelligence,” InternationalOrthopaedics, p. 1, 2020.
[128] J. Pu, J. Leader, A. Bandos, J. Shi, P. Du, J. Yu, B. Yang, S. Ke,Y. Guo, J. B. Field et al., “Any unique image biomarkers associatedwith covid-19?” European Radiology, p. 1, 2020.
[129] K. Yang, X. Liu, Y. Yang, X. Liao, R. Wang, X. Zeng, Y. Wang,M. Zhang, and T. Zhang, “End-to-end covid-19 screening with 3d deeplearning on chest computed tomography,” 2020.
[130] Y. Pathak, P. K. Shukla, A. Tiwari, S. Stalin, S. Singh, and P. K.Shukla, “Deep transfer learning based classification model for covid-19 disease,” IRBM, 2020.
[131] H. Panwar, P. Gupta, M. K. Siddiqui, R. Morales-Menendez, andV. Singh, “Application of deep learning for fast detection of covid-19 in x-rays using ncovnet,” Chaos, Solitons & Fractals, p. 109944,2020.
[132] M. A. Al-antari, C.-H. Hua, and S. Lee, “Fast deep learning computer-aided diagnosis against the novel covid-19 pandemic from digital chestx-ray images,” 2020.

19
[133] L. Brunese, F. Mercaldo, A. Reginelli, and A. Santone, “Explainabledeep learning for pulmonary disease and coronavirus covid-19 detec-tion from x-rays,” Computer Methods and Programs in Biomedicine,p. 105608, 2020.
[134] X. Li, C. Li, and D. Zhu, “Covid-mobilexpert: On-device covid-19 screening using snapshots of chest x-ray,” arXiv preprintarXiv:2004.03042, 2020.
[135] D. Singh, V. Kumar, and M. Kaur, “Classification of covid-19 patientsfrom chest ct images using multi-objective differential evolution–based convolutional neural networks,” European Journal of ClinicalMicrobiology & Infectious Diseases, pp. 1–11, 2020.
[136] T. Mahmud, M. A. Rahman, and S. A. Fattah, “Covxnet: A multi-dilation convolutional neural network for automatic covid-19 and otherpneumonia detection from chest x-ray images with transferable multi-receptive feature optimization,” Computers in Biology and Medicine,p. 103869, 2020.
[137] J. Song, H. Wang, Y. Liu, W. Wu, G. Dai, Z. Wu, P. Zhu, W. Zhang,K. W. Yeom, and K. Deng, “End-to-end automatic differentiation ofthe coronavirus disease 2019 (covid-19) from viral pneumonia basedon chest ct,” European journal of nuclear medicine and molecularimaging, pp. 1–9, 2020.
[138] D. Das, K. Santosh, and U. Pal, “Truncated inception net: Covid-19 outbreak screening using chest x-rays,” Physical and engineeringsciences in medicine, pp. 1–11, 2020.
[139] A. Saeedi, M. Saeedi, and A. Maghsoudi, “A novel and reliable deeplearning web-based tool to detect covid-19 infection form chest ct-scan,” arXiv preprint arXiv:2006.14419, 2020.
[140] P. R. Bassi and R. Attux, “A deep convolutional neural net-work for covid-19 detection using chest x-rays,” arXiv preprintarXiv:2005.01578, 2020.
[141] M. Siddhartha and A. Santra, “Covidlite: A depth-wise separable deepneural network with white balance and clahe for detection of covid-19,”arXiv preprint arXiv:2006.13873, 2020.
[142] S. Chatterjee, F. Saad, C. Sarasaen, S. Ghosh, R. Khatun, P. Radeva,G. Rose, S. Stober, O. Speck, and A. Nurnberger, “Exploration ofinterpretability techniques for deep covid-19 classification using chestx-ray images,” arXiv preprint arXiv:2006.02570, 2020.
[143] P. G. Moutounet-Cartan, “Deep convolutional neural networks todiagnose covid-19 and other pneumonia diseases from posteroanteriorchest x-rays,” arXiv preprint arXiv:2005.00845, 2020.
[144] H. Hirano, K. Koga, and K. Takemoto, “Vulnerability of deep neuralnetworks for detecting covid-19 cases from chest x-ray images touniversal adversarial attacks,” arXiv preprint arXiv:2005.11061, 2020.
[145] P. K. Sethy, S. K. Behera, P. K. Ratha, and P. Biswas, “Detectionof coronavirus disease (covid-19) based on deep features and supportvector machine.”
[146] A. Haghanifar, M. M. Majdabadi, and S. Ko, “Covid-cxnet: Detectingcovid-19 in frontal chest x-ray images using deep learning,” arXivpreprint arXiv:2006.13807, 2020.
[147] G. Wang, X. Liu, C. Li, Z. Xu, J. Ruan, H. Zhu, T. Meng, K. Li,N. Huang, and S. Zhang, “A noise-robust framework for automaticsegmentation of covid-19 pneumonia lesions from ct images,” IEEETransactions on Medical Imaging, 2020.
[148] O. Gozes, M. Frid-Adar, H. Greenspan, P. D. Browning, H. Zhang,W. Ji, A. Bernheim, and E. Siegel, “Rapid ai development cycle for thecoronavirus (covid-19) pandemic: Initial results for automated detection& patient monitoring using deep learning ct image analysis,” arXivpreprint arXiv:2003.05037, 2020.
[149] F. Shan, Y. Gao, J. Wang, W. Shi, N. Shi, M. Han, Z. Xue, andY. Shi, “Lung infection quantification of covid-19 in ct images withdeep learning,” arXiv preprint arXiv:2003.04655, 2020.
[150] J. Zhao, Y. Zhang, X. He, and P. Xie, “Covid-ct-dataset: a ct scandataset about covid-19,” arXiv preprint arXiv:2003.13865, 2020.
[151] M. Z. Alom, M. Rahman, M. S. Nasrin, T. M. Taha, and V. K.Asari, “Covid mtnet: Covid-19 detection with multi-task deep learningapproaches,” arXiv preprint arXiv:2004.03747, 2020.
[152] X. Chen, L. Yao, and Y. Zhang, “Residual attention u-net for automatedmulti-class segmentation of covid-19 chest ct images,” arXiv preprintarXiv:2004.05645, 2020.
[153] O. Gozes, M. Frid-Adar, N. Sagie, H. Zhang, W. Ji, and H. Greenspan,“Coronavirus detection and analysis on chest ct with deep learning,”arXiv preprint arXiv:2004.02640, 2020.
[154] Y.-H. Wu, S.-H. Gao, J. Mei, J. Xu, D.-P. Fan, C.-W. Zhao, and M.-M. Cheng, “Jcs: An explainable covid-19 diagnosis system by jointclassification and segmentation,” arXiv preprint arXiv:2004.07054,2020.
[155] T. Zhou, S. Canu, and S. Ruan, “An automatic covid-19 ct seg-mentation based on u-net with attention mechanism,” arXiv preprintarXiv:2004.06673, 2020.
[156] E. Tartaglione, C. A. Barbano, C. Berzovini, M. Calandri, andM. Grangetto, “Unveiling covid-19 from chest x-ray with deep learn-ing: a hurdles race with small data,” arXiv preprint arXiv:2004.05405,2020.
[157] W. Xie, C. Jacobs, J.-P. Charbonnier, and B. van Ginneken, “Relationalmodeling for robust and efficient pulmonary lobe segmentation in ctscans,” IEEE Transactions on Medical Imaging, 2020.
[158] Y. Oh, S. Park, and J. C. Ye, “Deep learning covid-19 features oncxr using limited training data sets,” IEEE Transactions on MedicalImaging, 2020.
[159] S. Hu, Y. Gao, Z. Niu, Y. Jiang, L. Li, X. Xiao, M. Wang, E. F. Fang,W. Menpes-Smith, J. Xia et al., “Weakly supervised deep learning forcovid-19 infection detection and classification from ct images,” IEEEAccess, 2020.
[160] Y. Qiu, Y. Liu, and J. Xu, “Miniseg: An extremely minimum networkfor efficient covid-19 segmentation,” arXiv preprint arXiv:2004.09750,2020.
[161] S. Rajaraman, J. Siegelman, P. O. Alderson, L. S. Folio, L. R. Folio, andS. K. Antani, “Iteratively pruned deep learning ensembles for covid-19detection in chest x-rays,” arXiv preprint arXiv:2004.08379, 2020.
[162] D.-P. Fan, T. Zhou, G.-P. Ji, Y. Zhou, G. Chen, H. Fu, J. Shen, andL. Shao, “Inf-net: Automatic covid-19 lung infection segmentationfrom ct images,” IEEE Transactions on Medical Imaging, 2020.
[163] D. Lv, W. Qi, Y. Li, L. Sun, and Y. Wang, “A cascade network for de-tecting covid-19 using chest x-rays,” arXiv preprint arXiv:2005.01468,2020.
[164] A. Voulodimos, E. Protopapadakis, I. Katsamenis, A. Doulamis, andN. Doulamis, “Deep learning models for covid-19 infected area seg-mentation in ct images,” medRxiv, 2020.
[165] A. Amyar, R. Modzelewski, and S. Ruan, “Multi-task deep learningbased ct imaging analysis for covid-19: Classification and segmenta-tion,” medRxiv, 2020.
[166] C. Zheng, X. Deng, Q. Fu, Q. Zhou, J. Feng, H. Ma, W. Liu, andX. Wang, “Deep learning-based detection for covid-19 from chest ctusing weak label,” medRxiv, 2020.
[167] S. Jin, B. Wang, H. Xu, C. Luo, L. Wei, W. Zhao, X. Hou, W. Ma,Z. Xu, Z. Zheng et al., “Ai-assisted ct imaging analysis for covid-19screening: Building and deploying a medical ai system in four weeks,”medRxiv, 2020.
[168] J. Wang, Y. Bao, Y. Wen, H. Lu, H. Luo, Y. Xiang, X. Li, C. Liu,and D. Qian, “Prior-attention residual learning for more discriminativecovid-19 screening in ct images,” IEEE Transactions on MedicalImaging, 2020.
[169] S. Roy, W. Menapace, S. Oei, B. Luijten, E. Fini, C. Saltori, I. Huijben,N. Chennakeshava, F. Mento, A. Sentelli et al., “Deep learning forclassification and localization of covid-19 markers in point-of-care lungultrasound,” IEEE Transactions on Medical Imaging, 2020.
[170] L. Li, L. Qin, Z. Xu, Y. Yin, X. Wang, B. Kong, J. Bai, Y. Lu,Z. Fang, Q. Song et al., “Artificial intelligence distinguishes covid-19 from community acquired pneumonia on chest ct,” Radiology, p.200905, 2020.
[171] S. Wang, Y. Zha, W. Li, Q. Wu, X. Li, M. Niu, M. Wang, X. Qiu,H. Li, H. Yu et al., “A fully automatic deep learning system for covid-19 diagnostic and prognostic analysis,” European Respiratory Journal,2020.
[172] C. Butt, J. Gill, D. Chun, and B. A. Babu, “Deep learning systemto screen coronavirus disease 2019 pneumonia,” Applied Intelligence,p. 1, 2020.
[173] W. Wu, Y. Shi, X. Li, Y. Zhou, P. Du, S. Lv, T. Liang, and J. Sheng,“Deep learning to estimate the physical proportion of infected regionof lung for covid-19 pneumonia with ct image set,” arXiv preprintarXiv:2006.05018, 2020.
[174] S. Chaganti, A. Balachandran, G. Chabin, S. Cohen, T. Flohr,B. Georgescu, P. Grenier, S. Grbic, S. Liu, F. Mellot et al., “Quan-tification of tomographic patterns associated with covid-19 from chestct,” arXiv preprint arXiv:2004.01279, 2020.
[175] Z. Han, B. Wei, Y. Hong, T. Li, J. Cong, X. Zhu, H. Wei, and W. Zhang,“Accurate screening of covid-19 using attention based deep 3d multipleinstance learning,” IEEE Transactions on Medical Imaging, 2020.
[176] M. Goncharov, M. Pisov, A. Shevtsov, B. Shirokikh, A. Kurmukov,I. Blokhin, V. Chernina, A. Solovev, V. Gombolevskiy, S. Moro-zov et al., “Ct-based covid-19 triage: Deep multitask learning im-proves joint identification and severity quantification,” arXiv preprintarXiv:2006.01441, 2020.

20
[177] V. K. R. Chimmula and L. Zhang, “Time series forecasting of covid-19 transmission in canada using lstm networks,” Chaos, Solitons &Fractals, p. 109864, 2020.
[178] C.-J. Huang and P.-H. Kuo, “Multiple-input deep convolutional neuralnetwork model for short-term photovoltaic power forecasting,” IEEEAccess, vol. 7, pp. 74 822–74 834, 2019.
[179] S. M. Ayyoubzadeh, S. M. Ayyoubzadeh, H. Zahedi, M. Ahmadi, andS. R. N. Kalhori, “Predicting covid-19 incidence through analysis ofgoogle trends data in iran: data mining and deep learning pilot study,”JMIR Public Health and Surveillance, vol. 6, no. 2, p. e18828, 2020.
[180] A. Tomar and N. Gupta, “Prediction for the spread of covid-19 inindia and effectiveness of preventive measures,” Science of The TotalEnvironment, p. 138762, 2020.
[181] N. B. Yahia, M. D. Kandara, and N. B. B. Saoud, “Deep ensemblelearning method to forecast covid-19 outbreak,” 2020.
[182] Z. Hu, Q. Ge, L. Jin, and M. Xiong, “Artificial intelligence forecastingof covid-19 in china,” arXiv preprint arXiv:2002.07112, 2020.
[183] M. Azarafza, M. Azarafza, and J. Tanha, “Covid-19 infection forecast-ing based on deep learning in iran,” medRxiv, 2020.
[184] R. Pal, A. A. Sekh, S. Kar, and D. K. Prasad, “Neural networkbased country wise risk prediction of covid-19,” arXiv preprintarXiv:2004.00959, 2020.
[185] L. R. Kolozsvari, T. Berczes, A. Hajdu, R. Gesztelyi, A. TIba, I. Varga,G. J. Szollosi, S. Harsanyi, S. Garboczy, and J. Zsuga, “Predicting theepidemic curve of the coronavirus (sars-cov-2) disease (covid-19) usingartificial intelligence,” medRxiv, 2020.
[186] B. Yan, X. Tang, B. Liu, J. Wang, Y. Zhou, G. Zheng, Q. Zou,Y. Lu, and W. Tu, “An improved method of covid-19 case fitting andprediction based on lstm,” arXiv preprint arXiv:2005.03446, 2020.
[187] M. R. Ibrahim, J. Haworth, A. Lipani, N. Aslam, T. Cheng, andN. Christie, “Variational-lstm autoencoder to forecast the spread ofcoronavirus across the globe,” medRxiv, 2020.
[188] P. Arora, H. Kumar, and B. K. Panigrahi, “Prediction and analysis ofcovid-19 positive cases using deep learning models: A descriptive casestudy of india,” Chaos, Solitons & Fractals, p. 110017, 2020.
[189] K. Munir, H. Elahi, A. Ayub, F. Frezza, and A. Rizzi, “Cancer diagnosisusing deep learning: a bibliographic review,” Cancers, vol. 11, no. 9,p. 1235, 2019.


![Forecasting using R - Rob J. Hyndman · Forecasting using R Box-Cox transformations 12. Automated Box-Cox transformations (BoxCox.lambda (elec)) ## [1] 0.2654076 This attempts to](https://static.fdocuments.in/doc/165x107/60acaadd2a416c65a226ae6a/forecasting-using-r-rob-j-hyndman-forecasting-using-r-box-cox-transformations.jpg)

