
Automated Bio-Medical Diagnostic Collection System … Ma… · Automated Bio-Medical Diagnostic...
136
Automated Bio-Medical Diagnostic Collection System UCF Senior Design 1 2 December 2013 Group 12: Jesse Easterling Jimmy Nguyen Jonathan Adams Zachary Levy
Transcript of Automated Bio-Medical Diagnostic Collection System … Ma… · Automated Bio-Medical Diagnostic...

Automated Bio-Medical Diagnostic Collection System
UCF Senior Design 1
2 December 2013
Group 12: Jesse Easterling
Jimmy Nguyen
Jonathan Adams
Zachary Levy

P a g e | i
Table of Contents Table of Contents .............................................................................................................................. i
1 Executive Summery ....................................................................................................................... 1
2 Project Description........................................................................................................................ 2
2.1 Motivation.............................................................................................................................. 2
2.2 Objectives and Goals .............................................................................................................. 3
2.3 Project Requirements and Specifications .............................................................................. 7
2.3.1 System Enclosure ............................................................................................................ 7
2.3.1.1 Exterior ..................................................................................................................... 7
2.3.1.2 Interior ..................................................................................................................... 7
2.3.2 Test Tubes ....................................................................................................................... 7
2.3.3 Interactive Display .......................................................................................................... 7
2.3.4 Dispensing Unit ............................................................................................................... 7
2.3.4.1 Test Tube Dispenser “Boot” ..................................................................................... 7
2.3.4.2 Dispensing “Pacman” Roller .................................................................................... 9
2.3.4.3 Scanning Chute ........................................................................................................ 9
2.3.4.4 Dispensing Sensors .................................................................................................. 9
2.3.5 Dispensing Chute “Tongue” ............................................................................................ 9
2.3.6 Bag Dispenser .................................................................................................................. 9
2.3.6.1 Collection Chute “Collector” .................................................................................... 9
2.3.7 Sample Collection Unit “Holder” .................................................................................. 10
2.3.8 Environmental Control .................................................................................................. 10
2.3.9 CPU ................................................................................................................................ 10
2.3.10 Power Supply .............................................................................................................. 10
3 Research Related to Project Definition ....................................................................................... 10
3.1 Existing Similar Projects and Products ................................................................................. 10
3.1.1 Medbox ......................................................................................................................... 10
3.1.2 Vending Machines ......................................................................................................... 11

P a g e | ii
3.1.3 ATM ............................................................................................................................... 12
3.2 Medical Standards and Requirements ................................................................................. 12
3.2.1 Test Tube Specifications ............................................................................................... 12
3.2.2 Specimen Collection Methods ...................................................................................... 12
3.2.3 Specimen Shipping Requirements ................................................................................ 13
3.3 Universal Labeling System ................................................................................................... 13
3.3.1 Code Format.................................................................................................................. 14
3.3.2 Numbering Scheme ....................................................................................................... 14
3.4 Relevant Hardware .............................................................................................................. 14
3.4.1 Barcode Scanner ........................................................................................................... 14
3.4.1 Touchscreen .................................................................................................................. 15
3.4.2 Motors Types and Control ............................................................................................ 16
3.4.2.1 Dispenser Wheel ................................................................................................... 17
3.4.2.2 Roller ..................................................................................................................... 19
3.4.3 Power Supply ................................................................................................................ 19
3.4.4 Microcontrollers ........................................................................................................... 21
3.4.5 CPU ................................................................................................................................ 21
3.5 Relevant Software ................................................................................................................ 22
3.5.1 Software Requirements ................................................................................................ 22
3.5.2 User Identification ........................................................................................................ 23
3.5.1 Database Information ................................................................................................... 24
3.5.2 Graphical User Interface Options.................................................................................. 25
3.5.3 Development Environment ........................................................................................... 27
3.5.4 Qt Creator ..................................................................................................................... 27
3.5.4.1 QGraphicsView ....................................................................................................... 28
3.5.5 Serial Communications ................................................................................................. 31
3.5.6 Licensing ........................................................................................................................ 32
3.5.7 Embedded Software ..................................................................................................... 33
3.6 Strategic Components .......................................................................................................... 33
3.6.1 System Enclosure .......................................................................................................... 34
3.6.2 Dispensing and Collecting ............................................................................................. 34
P a g e | iii
3.6.3 Bag Dispenser ................................................................................................................ 34
3.6.4 Environmental Control .................................................................................................. 36
3.6.4.1 Vapor Compression Refrigeration ......................................................................... 37
3.6.4.2 Thermoelectric ....................................................................................................... 39
3.6.4.3 Temperature Sensors ............................................................................................. 39
3.6.5 Dynamic Component Control ....................................................................................... 41
4 Project Hardware and Software Design Detail ........................................................................... 42
4.1 Hardware ............................................................................................................................. 42
4.1.1 System Enclosure .......................................................................................................... 42
4.1.2 Motor and Sensor Control ............................................................................................ 43
4.1.3 User Interface ............................................................................................................... 43
4.1.4 Dispenser ...................................................................................................................... 44
4.1.4.1 Order of Operations ............................................................................................... 45
4.1.4.2 Test Tube Dispenser “Boot” ................................................................................... 46
4.1.4.3 Dispensing Roller.................................................................................................... 48
4.1.4.4 Dispensing Chute ................................................................................................... 48
4.1.4.5 Dispenser Barcode Scanner ................................................................................... 49
4.1.4.6 Dispensing Motors ................................................................................................. 49
4.1.4.7 Dispenser Sensors .................................................................................................. 54
4.1.5 Bag Dispenser ................................................................................................................ 55
4.1.5.1 Lock ........................................................................................................................ 55
4.1.5.2 Bag Supply Sensor .................................................................................................. 58
4.1.6 Collector ........................................................................................................................ 59
4.1.6.1 Order of Operations ............................................................................................... 59
4.1.7 Holder ........................................................................................................................... 61
4.1.7.1 Temperature Control ............................................................................................. 61
4.1.7.2 Cooling Unit............................................................................................................ 63
4.1.8 Microcontroller ............................................................................................................. 64

P a g e | iv
4.1.8.1 Microcontroller and Circuit Board Design ............................................................. 64
4.1.8.2 Choosing a Microcontroller ................................................................................... 64
4.1.8.3 Microcontroller Circuit Design ............................................................................... 65
4.1.9 PCB Design .................................................................................................................... 73
4.1.10 CPU .............................................................................................................................. 76
4.1.11 Power Supply .............................................................................................................. 77
4.2 Software ............................................................................................................................... 78
4.2.1 Requirements ................................................................................................................ 78
4.2.2 Operating System Software .......................................................................................... 79
4.2.3 Application Software ..................................................................................................... 80
4.2.4 Management Software ................................................................................................. 82
4.2.5 Serial Communications ................................................................................................. 83
4.2.6 Database ....................................................................................................................... 86
4.2.7 Payment Processing ...................................................................................................... 88
4.2.8 Embedded Software ..................................................................................................... 88
4.2.9 Laboratory Portal .......................................................................................................... 90
5 Design Summary of Hardware and Software .............................................................................. 90
6 Prototype Construction............................................................................................................. 100
6.1 Parts Acquisition ................................................................................................................ 100
6.1.1 System Enclosure ........................................................................................................ 100
6.1.2 Dispenser System Components .................................................................................. 100
6.1.3 Printed Circuit Board (PCB) ......................................................................................... 101
6.1.4 Collector ...................................................................................................................... 101
6.1.5 Bag Dispenser .............................................................................................................. 102
6.1.6 Holder ......................................................................................................................... 102
6.1.6.1 Temperature Control ........................................................................................... 102
6.1.6.2 Cooling Unit.......................................................................................................... 103
6.2 Final Coding Structure ........................................................................................................ 104
6.2.1 Operating System Software Structure ........................................................................ 104
6.2.2 Embedded Software Structure ................................................................................... 105

P a g e | v
6.2.3 Laboratory Portal ........................................................................................................ 105
7 Project Prototype Testing ......................................................................................................... 105
7.1 Hardware Testing Environment ......................................................................................... 105
7.2 Hardware Specific Testing .................................................................................................. 106
7.2.1 Dispenser .................................................................................................................... 106
7.2.1.1 Test Tube Dispensing (Boot) ................................................................................ 106
7.2.1.2 Dispensing “Pacman” Roller ................................................................................ 107
7.2.1.3 Boot Capacity and Dispensing Sensor .................................................................. 107
7.2.1.4 Scanner Roller ...................................................................................................... 108
7.2.1.5 Barcode Scanner .................................................................................................. 108
7.2.1.6 Tilting Dispensing Chute ...................................................................................... 108
7.2.2 Collector ...................................................................................................................... 109
7.2.3 Bag Dispenser .............................................................................................................. 109
7.2.4 Hatch Lock ................................................................................................................... 110
7.2.5 Bag Sensor ................................................................................................................... 111
7.2.6 Holder Test Procedures ............................................................................................... 112
7.3 Software Testing Environment .......................................................................................... 115
7.4 Software Specific Testing ................................................................................................... 115
7.4.1 Application Software Testing ...................................................................................... 116
7.4.2 Barcode Reading Software Testing ............................................................................. 116
7.4.3 Magnetic Card Reading Software Testing ................................................................... 116
7.4.4 Embedded Software Testing ....................................................................................... 117
7.4.5 Laboratory Portal Software Testing ............................................................................ 117
7.4.6 Serial Communication Testing .................................................................................... 117
7.4.7 Database Software Testing ......................................................................................... 118
8 Administrative Content ............................................................................................................. 118
8.1 Milestone Discussion ......................................................................................................... 118
8.2 Budget and Finances .......................................................................................................... 121
9 Appendix A ................................................................................................................................ 122
9.1 Works Cited ........................................................................................................................ 122

P a g e | vi
9.2 Table of Tables ................................................................................................................... 126
9.3 Table of Figures .................................................................................................................. 126

P a g e | 1
1 Executive Summery
Currently, bio-medical diagnostic tests (blood, saliva, urine etc.) require visiting a doctor’s office, which generally results in time consumption and high medical rates; additionally, the test/s and corresponding results are generally desired to be kept private, which may lead to potential patients not taking the tests due to the feeling of their privacy being invaded even by their doctor. The main motivation for the Doc Box is to provide a means of taking a bio-medical diagnostic test that is quick, cheap, and convenient while maintaining confidentiality.
Due to the complexity of biomedical testing, the Doc Box itself will not be performing any of the tests. Instead, the Doc Box shall be a system that collects the samples to be sent to a lab for testing. Such an intermediary system can be applied for a variety of biomedical tests. To meet the requirement of convenience, it is desired that the system be accessible in public places, similar to vending machines and ATMs. Since the system will be in such a public environment, not all biomedical tests can be collected sanitarily (blood and urine samples, for instance). Taking such factors into consideration, the Doc Box is initially designed to collect samples for saliva testing. With saliva testing, the samples must adhere to specific medical regulations for storage between the depositing of the samples and the testing at the laboratory.
The Doc Box will contain multiple subsystems which will collectively store contact information for the patient in a database, dispense collection test tubes, collect test tubes with saliva, and store the samples in an appropriate environment while awaiting pickup. These subsystems will require the implementation of embedded, control, communication, and power systems. One significant milestone to the overall system design is the interface between microcontrollers and motors in order to dispense discrete amount of test tubes. Additionally, since the target audience is the general public, the system interface will be user friendly and easy to navigate.
Administratively, the research, design, and testing phases of the Doc Box each have fixed milestones in order to reach the project deadline with a significantly tested system that reliably performs each specified function. Although the project has a rather dynamic initial budget due to the system enclosure and user interface, the projected budget will constantly be monitored so as to keep an efficient yet effective system development.
The overall goals of the Doc Box project are to develop effective administrative management and technical design, the result being an easy to use device to deliver to the public for easier access for biomedical testing. With such ease for testing, vitamin deficiencies, diseases, and conditions can be more easily detected and consequently taken care of, resulting in a healthier culture.
P a g e | 2
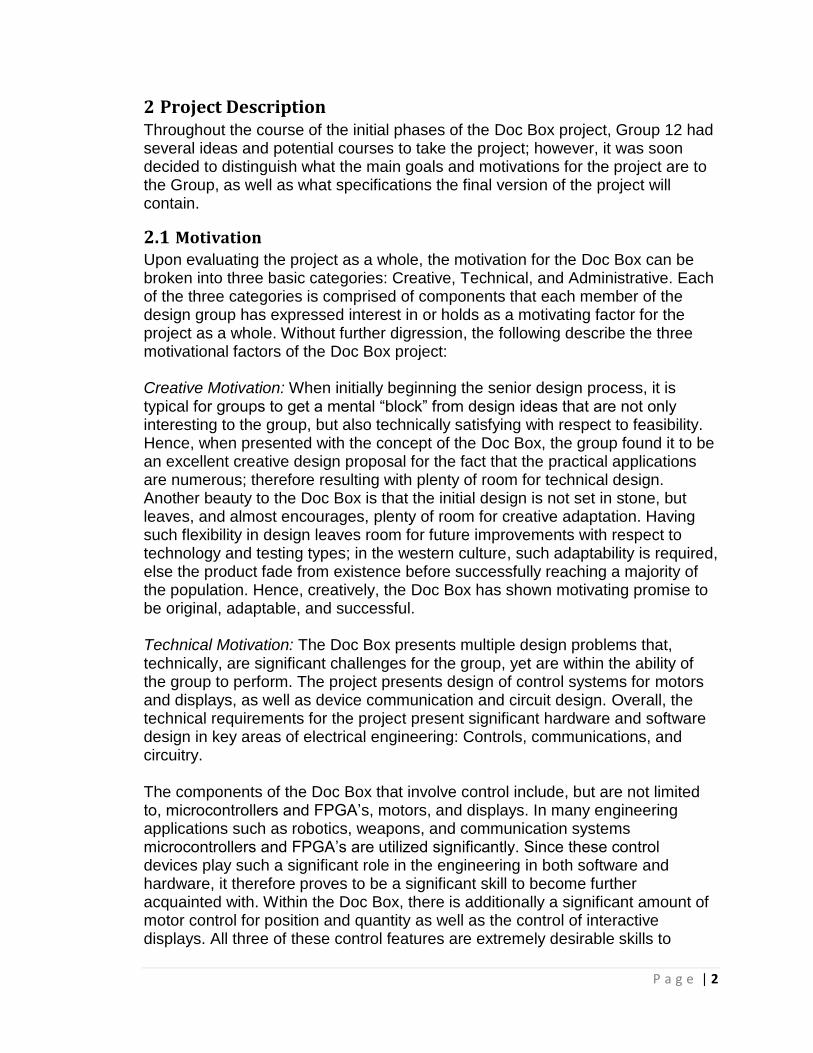
2 Project Description Throughout the course of the initial phases of the Doc Box project, Group 12 had several ideas and potential courses to take the project; however, it was soon decided to distinguish what the main goals and motivations for the project are to the Group, as well as what specifications the final version of the project will contain.
2.1 Motivation
Upon evaluating the project as a whole, the motivation for the Doc Box can be broken into three basic categories: Creative, Technical, and Administrative. Each of the three categories is comprised of components that each member of the design group has expressed interest in or holds as a motivating factor for the project as a whole. Without further digression, the following describe the three motivational factors of the Doc Box project:
Creative Motivation: When initially beginning the senior design process, it is typical for groups to get a mental “block” from design ideas that are not only interesting to the group, but also technically satisfying with respect to feasibility. Hence, when presented with the concept of the Doc Box, the group found it to be an excellent creative design proposal for the fact that the practical applications are numerous; therefore resulting with plenty of room for technical design. Another beauty to the Doc Box is that the initial design is not set in stone, but leaves, and almost encourages, plenty of room for creative adaptation. Having such flexibility in design leaves room for future improvements with respect to technology and testing types; in the western culture, such adaptability is required, else the product fade from existence before successfully reaching a majority of the population. Hence, creatively, the Doc Box has shown motivating promise to be original, adaptable, and successful.
Technical Motivation: The Doc Box presents multiple design problems that, technically, are significant challenges for the group, yet are within the ability of the group to perform. The project presents design of control systems for motors and displays, as well as device communication and circuit design. Overall, the technical requirements for the project present significant hardware and software design in key areas of electrical engineering: Controls, communications, and circuitry. The components of the Doc Box that involve control include, but are not limited to, microcontrollers and FPGA’s, motors, and displays. In many engineering applications such as robotics, weapons, and communication systems microcontrollers and FPGA’s are utilized significantly. Since these control devices play such a significant role in the engineering in both software and hardware, it therefore proves to be a significant skill to become further acquainted with. Within the Doc Box, there is additionally a significant amount of motor control for position and quantity as well as the control of interactive displays. All three of these control features are extremely desirable skills to

P a g e | 3
become better acquainted with for the purpose of becoming better-rounded engineers. A final motivating factor on the technical side of this project is the challenge of printed circuit board (PCB) and power systems design. In any electronic device, the conversion and regulation of power to the device is crucial, and is therefore from the Electrical Engineering perspective, is beneficial knowledge to have. Administrative Motivation: Although generally overlooked, the administrative side of Engineering is extremely important for the wellbeing of the project, and (in the context of the engineering industry) the company. Administrative qualities that are prevalent within this project include time management, budgeting, task delegation, and very importantly, effective communication between group members and affiliates. Each of these characteristics are vital to the success of the Doc Box project, and are excellent practices for every engineer to have in order to have a broader understanding of working with a group on projects of various sizes. In many design scenarios, a time frame deadline is set, and it is therefore critical for the time spent on different sections of the project is managed considerably. With respect to the Doc Box design project, a milestone chart was compiled in order to keep the project on a consistently progressing status. Similarly, the budgeting of the expenses of the project is not only important for the initial design and prototyping stage, but is good to consider for future mass production. Administratively, the management of the time and money of this product are extremely crucial to the success of the project, for without meeting the milestones the project can lag, and the effect on time can therefore result in an effect on money. Lastly, effective delegation of roles and tasks among a design group is also important; without considering the strengths and weaknesses of each member, the effective working of the group to meet the project milestones can be extremely difficult. Delegation of roles can also fall under the category of effective communication throughout the group as well, which is the last, yet very important qualitative skill that this design group desires to develop. These four administrative characteristics serve as the main motivating factors to the group, for without them, the success of the project would plummet exponentially.
2.2 Objectives and Goals
The overall goal of this project is to provide an affordable, anonymous, and autonomous service that will offer the user personal biomedical testing for various conditions and deficiencies. As a parallel objective, we wish to learn more about control systems, embedded processors and other technology that will supplement our education in electrical engineering.

P a g e | 4
In order to meet the needs of the consumer, we must first define, in detail, the system feature set. This will allow for a structured design that will maintain a certain scale and will manage expectations. Our system will be broken in the 5 following subsystems: Screen Interface, Dispenser, Collector, Holder, and Power Supply. We will define the roles as well as the educational goals associated with each subsystem.
The majority of user frustration when dealing with autonomous vendors is associated with the screen interface. For our system, we want our users to have a natural, logical, as well as efficient encounter with the system when entering information and choosing a service. We will design a simplified set of instructions and a streamlined screen flow to minimize time spent at the kiosk. Along with the simple layout, we will employ the use of a surface acoustic wave touch screen. This will allow simplified user input as well as give us experience in touch integration.
Once the user has entered their information and has paid the nominal fee, the dispenser will release a certain number of test tubes to an intermediate bay within the kiosk. At this point, there will be an internal barcode scanner that will link the code on each test tube to the current user’s account information. The dispenser subsystem will then release the test tube(s) to the user for pick up. A sanitary re-sealable plastic bag will be vended along with the empty test tubes. The dispenser design will be one of the biggest challenges of this project. We wish to gain experience with motor control systems as well as embedded processor design through this subsystem.
The user will return to the kiosk once they have collected their saliva sample(s) in the test tube(s). They will scan one test tube via the external barcode scanner which identifies the account of the user returning the sample. A door will then open allowing the user to drop off their sample provided it is sealed in a sanitary plastic bag. This part of the process will be handled by the collector subsystem and involves embedded software as well as sensor design.
At this point, the user has completed their interaction with the system and will wait for the test results from this point. Their sample now resides in a sanitary container within the system’s enclosure awaiting pickup by a shipping courier. However, there is more to this holding area than simply containing samples. Once the bin reaches capacity, an embedded sensor will alert the main CPU to halt further sales until the bin has been emptied. This subsystem we call the holder. This subsystem will monitor the temperature of the bin area and control an air conditioning system to keep the samples at a medically regulated temperature. We hope to gain experience with component datasheets and specifications in selecting the best sensors for our application.
The final subsystem, which will play a major role in operation, is the power supply. We will have multiple components that will have various power requirements which will make the design more complex. We expect to hone our

P a g e | 5
skills in the design of voltage regulators, transformers, and electric power systems in general through the design of this subsystem.
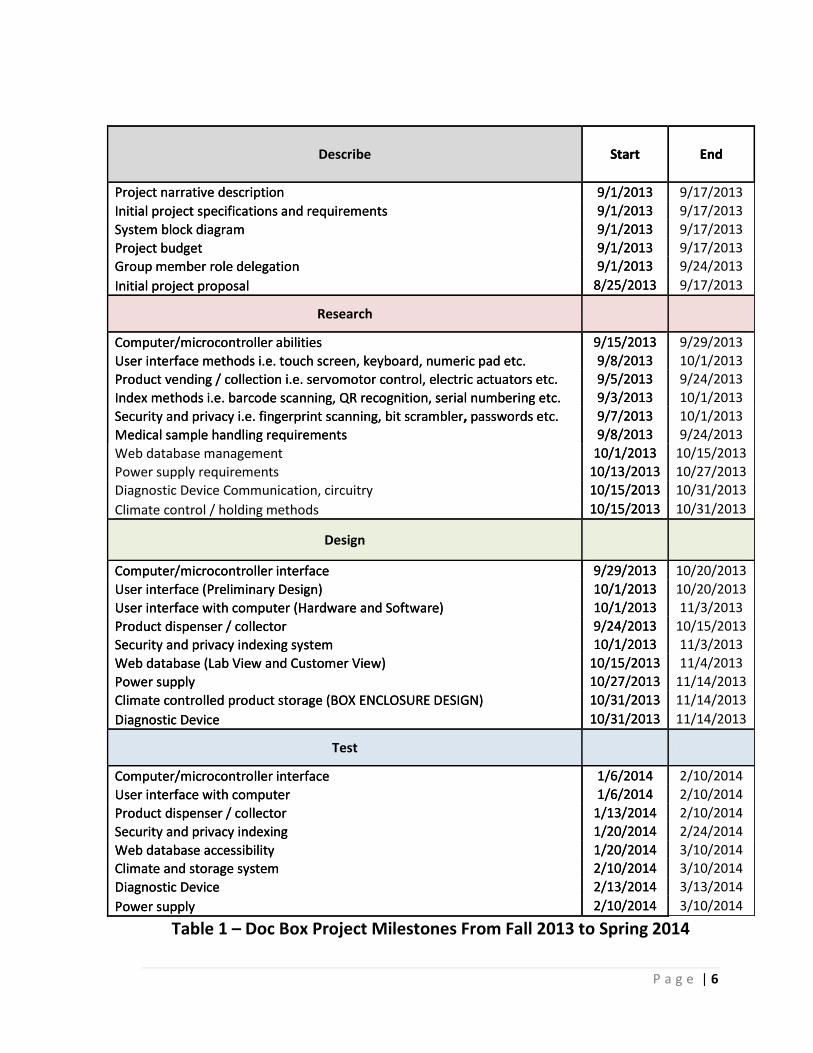
It will be crucial to be able to track the progress of the system design and assembly of the subsystems while maintaining a high quality of work. In order to set the milestone expectations, we will refer to the progress chart shown in
Table 1 – Doc Box Project Milestones From Fall 2013 to Spring 2014
the following page.
P a g e | 6
Table 1 – Doc Box Project Milestones From Fall 2013 to Spring 2014
Describe Start End
Project narrative description 9/1/2013 9/17/2013
Initial project specifications and requirements 9/1/2013 9/17/2013
System block diagram 9/1/2013 9/17/2013
Project budget 9/1/2013 9/17/2013
Group member role delegation 9/1/2013 9/24/2013
Initial project proposal 8/25/2013 9/17/2013
Research
Computer/microcontroller abilities 9/15/2013 9/29/2013
User interface methods i.e. touch screen, keyboard, numeric pad etc. 9/8/2013 10/1/2013
Product vending / collection i.e. servomotor control, electric actuators etc. 9/5/2013 9/24/2013
Index methods i.e. barcode scanning, QR recognition, serial numbering etc. 9/3/2013 10/1/2013
Security and privacy i.e. fingerprint scanning, bit scrambler, passwords etc. 9/7/2013 10/1/2013
Medical sample handling requirements 9/8/2013 9/24/2013
Web database management 10/1/2013 10/15/2013
Power supply requirements 10/13/2013 10/27/2013
Diagnostic Device Communication, circuitry 10/15/2013 10/31/2013
Climate control / holding methods 10/15/2013 10/31/2013
Design
Computer/microcontroller interface 9/29/2013 10/20/2013
User interface (Preliminary Design) 10/1/2013 10/20/2013
User interface with computer (Hardware and Software) 10/1/2013 11/3/2013
Product dispenser / collector 9/24/2013 10/15/2013
Security and privacy indexing system 10/1/2013 11/3/2013
Web database (Lab View and Customer View) 10/15/2013 11/4/2013
Power supply 10/27/2013 11/14/2013
Climate controlled product storage (BOX ENCLOSURE DESIGN) 10/31/2013 11/14/2013
Diagnostic Device 10/31/2013 11/14/2013
Test
Computer/microcontroller interface 1/6/2014 2/10/2014
User interface with computer 1/6/2014 2/10/2014
Product dispenser / collector 1/13/2014 2/10/2014
Security and privacy indexing 1/20/2014 2/24/2014
Web database accessibility 1/20/2014 3/10/2014
Climate and storage system 2/10/2014 3/10/2014
Diagnostic Device 2/13/2014 3/13/2014
Power supply 2/10/2014 3/10/2014
P a g e | 7
2.3 Project Requirements and Specifications
In a broad view, the Doc Box project has a wide amount of feature possibilities such as the shape of the unit, potential vitamin and/or medication dispensing depending on test results, mobile application support, or even a system diagnostic device for quick maintenance checkup. Given such flexibility in initial design, Group 12 is hereby defining the top-level requirements and specifications of the system in order to establish the initial Doc Box system, which is shown in Figure 1 (including the role delegations of each of the members of Group 12).
2.3.1 System Enclosure
2.3.1.1 Exterior The initial Doc Box enclosure shall meet the dimensions of 18”x18”x54”. The box frame and plating shall additionally be durable, tamper-proof, and weatherproof. The upper third of the front face shall be angled to remove third party visibility of the user interface. The exterior paneling shall have three sections cut out for the interactive display, card reader, test tube dispensing/collecting door, sealed bag dispenser, and barcode scanner. Additionally, the rear of the enclosure shall have a secure door that enables easy access for test tube stocking/pickup and
device maintenance. The Exterior design diagrams are as shown in Figure 19.
2.3.1.2 Interior
The interior of the system shall contain sufficient shelving to support the dispensing unit with corresponding motors as well as the exterior barcode scanner; additionally, the interior shall be insulated for keeping environmental conditions cool.
2.3.2 Test Tubes
Each test tube shall meet the dimensions specified by the testing laboratory (current size of 2.25” long and diameter of 0.5”) and have an individual barcode specific to that test tube.
2.3.3 Interactive Display
For effective user interaction, a 15” capacitive touchscreen display shall be placed on the angled front face of the system enclosure. The display shall be of industrial quality so as to withstand public use with great reliability
2.3.4 Dispensing Unit
2.3.4.1 Test Tube Dispenser “Boot”
The “boot” shall consist of a gravity-fed container that shall hold a required 1000 (2.25” long and diameter of 0.5”) test tubes; the container shall be designed in

P a g e | 8
such a way so as to deliver all test tubes to a single dispensing slot at the bottom of the boot, with minimal likelihood of test tube jamming; an additional design feature of the chute shall be an easy access panel in order to refill the boot when test tube levels are low.
Figure 1 – Doc Box Top Level System Block Diagram
CPUResearch
MicrocontrollerResearch
Touchscreen Interface
Research
Serial Bus
USB
System Block DiagramLegend
Responsible Member Abbreviations
Jesse T.T. – Test Tube
Jimmy
Jon
Zach
Collector I/O
I/O Bus
Web DatabaseResearch
T.T. Collector
Solenoid Lock (Front Face
Collector Door)
Capacity SensorRecieve Status
T.T. Holder
Temp. SensorResearch
A/C ControllerResearch
A/C Control
Temp. Status
Web InterfaceResearch
Card ReaderResearch
Dispenser I/O
Bag Dispenser
Solenoid Lock (Front Face
Collector Door)
Capacity SensorResearchCapacity Status
T.T. Dispenser
Dispensing Roller
Research
Barcode ScannerResearch
Test Tube Cartridge (“Boot”)Research
Scanning RollerResearch
Dispensing Chute
Research
Dispensing Sensor
Research
Roller Control
Dispense Status
Scan Status
Roller Control
Motor Control
USB
P a g e | 9
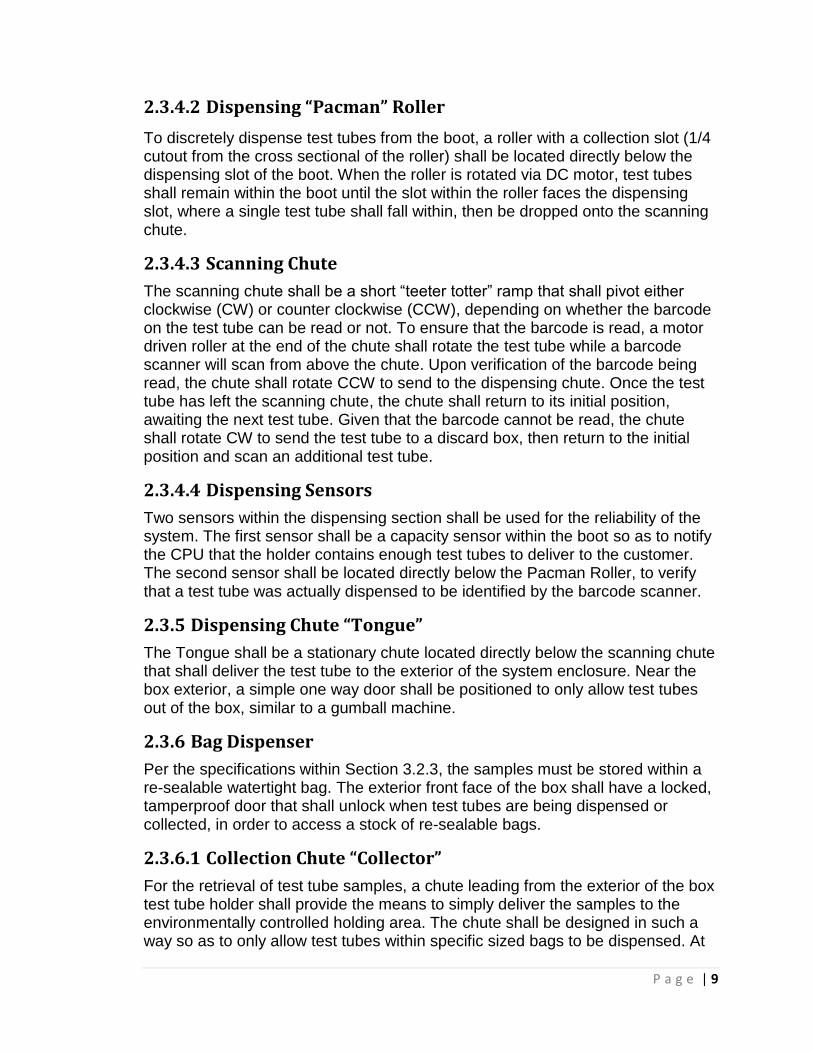
2.3.4.2 Dispensing “Pacman” Roller
To discretely dispense test tubes from the boot, a roller with a collection slot (1/4 cutout from the cross sectional of the roller) shall be located directly below the dispensing slot of the boot. When the roller is rotated via DC motor, test tubes shall remain within the boot until the slot within the roller faces the dispensing slot, where a single test tube shall fall within, then be dropped onto the scanning chute.
2.3.4.3 Scanning Chute
The scanning chute shall be a short “teeter totter” ramp that shall pivot either clockwise (CW) or counter clockwise (CCW), depending on whether the barcode on the test tube can be read or not. To ensure that the barcode is read, a motor driven roller at the end of the chute shall rotate the test tube while a barcode scanner will scan from above the chute. Upon verification of the barcode being read, the chute shall rotate CCW to send to the dispensing chute. Once the test tube has left the scanning chute, the chute shall return to its initial position, awaiting the next test tube. Given that the barcode cannot be read, the chute shall rotate CW to send the test tube to a discard box, then return to the initial position and scan an additional test tube.
2.3.4.4 Dispensing Sensors
Two sensors within the dispensing section shall be used for the reliability of the system. The first sensor shall be a capacity sensor within the boot so as to notify the CPU that the holder contains enough test tubes to deliver to the customer. The second sensor shall be located directly below the Pacman Roller, to verify that a test tube was actually dispensed to be identified by the barcode scanner.
2.3.5 Dispensing Chute “Tongue”
The Tongue shall be a stationary chute located directly below the scanning chute that shall deliver the test tube to the exterior of the system enclosure. Near the box exterior, a simple one way door shall be positioned to only allow test tubes out of the box, similar to a gumball machine.
2.3.6 Bag Dispenser
Per the specifications within Section 3.2.3, the samples must be stored within a re-sealable watertight bag. The exterior front face of the box shall have a locked, tamperproof door that shall unlock when test tubes are being dispensed or collected, in order to access a stock of re-sealable bags.
2.3.6.1 Collection Chute “Collector”
For the retrieval of test tube samples, a chute leading from the exterior of the box test tube holder shall provide the means to simply deliver the samples to the environmentally controlled holding area. The chute shall be designed in such a way so as to only allow test tubes within specific sized bags to be dispensed. At

P a g e | 10
the Holder end of the chute, a sensor shall both verify that the holder is not full as well as that the sample was dispensed into the holder.
2.3.7 Sample Collection Unit “Holder”
Upon validating test tube barcodes and the tongue entering collection position, the samples shall be collected within the Sample Collection Unit (“Holder”). The Holder shall fit within the interior dimensions of system enclosure, and be able to hold 1000 samples within a re-sealable bag.
2.3.8 Environmental Control
Per the sample storage specifications listed in Section 3.1, the temperature of the interior of the box must remain within the specified range. The temperature shall be regulated by a compact air conditioning unit that shall monitor the temperature periodically.
2.3.9 CPU The Doc Box shall use a computer tower that runs the basic Windows operating system. The CPU will need additional USB ports for the attachment of other box components.
2.3.10 Power Supply
Due to the wide variety of system components, the power supply to device shall be able to meet the requirements for the low voltage controllers, the CPU, scanners, display, and any additional components. Surge protection as well as noise decoupling shall also be requirements for the system power supply. The entire power assembly shall obtain its input from a general U.S. wall socket (120 V, 60 Hz).
3 Research Related to Project Definition
3.1 Existing Similar Projects and Products Since no known existing product serves the same exact function, the concept of the Doc Box is truly unique and original. Though there are no existing designs to solely base our project off of, there are similar products that are worth researching.
3.1.1 Medbox
Most similar to our project concept is the Medbox MDS or “Medicine Storage Machine”. The Medbox is a vending machine-like system that dispenses prescription medication to authorized personnel. Like the Doc Box, the Medbox boasts security in terms of contents and patient identification. As such, the Medbox utilizes biometric identification (fingerprint sample) in combination with registration card scanning to access its contents. This provides the system the ability to track and restrict usage as well as monitor activity. Patient information is

P a g e | 11
also kept on site as the software is self-supportive and requires no internet access. Furthermore, the sensitive drugs are stored in a climate controlled environment and are dispensed in various doses within standard pharmaceutical vials. [1]
3.1.2 Vending Machines
Vending machines can be found virtually everywhere and offer a multitude of possible products that can be vended. From sodas and snacks to electronics and pizza’s, there seems to be a vending machine for anything that can be sold. The Doc Box is similar to a vending machine in that it will automatically dispense a test tube for sample containment in exchange for monetary payment. However, the Doc Box differs in that it also takes in objects (tubes) and stores them for daily pick up. In all typical vending machines, there must be a way to access the storage area. This is usually a secure door or panel that only a courier or technician can get into for restocking and/or maintenance. Also, if the product in the vending machine is to be stored at a low temperature, a cooling unit is often installed. Since the samples are to be stored in a temperature controlled environment, a small cooling unit similar to those in vending machines may be used. In many vending machines, products are dispensed using motor assemblies controlled by some type of control board. The Doc Box, like most vending machines, the Doc Box will incorporate safety and anti-vandalism features such as no access delivery openings and ground fault detection circuits. Refrigerated vending machines consume 5 more times more
electricity than a typical home refrigerator – 7 to16 hWh/day/machine [2]. Figure 2 depicts energy consumption be vending machine components. As shown, the
compressor draws the most energy followed by lighting. The compressor is the heart of the cooling system and is where energy is put into. Section 3.6.4.1 will explain in detail the working of the compressor and the cooling system.
Figure 2 - Energy Consumption of Vending Machine Components [2]

P a g e | 12
3.1.3 ATM
Automated Teller Machines (ATM) are known to be convenient and secure with intuitive displays and inputs and tamper-proof enclosures. With advancing technology and increasing computing demands, ATM’s have also been transitioning away from dedicated microcontrollers and integrated circuits to that of hardware architecture akin to personal computers. This is what is desired for the Doc Box.
3.2 Medical Standards and Requirements
Due to the fact that this project involves the handling of biomedical specimens, it is therefore established that the project adhere to both the national and testing facility medical regulations. The regulations for the handling and storage of each of the samples as specified by the Centers for Disease Control (CDC) diagnostic specimen packing document. [3]
3.2.1 Test Tube Specifications
The test tube size and dimensions are regulated by the specimen testing facility, yet must stay within the size of 500 millilitres [3]; additionally, per the CDC specimen packing document, the primary specimen containers (i.e. test tubes) “…must have positive closures, such as a screw-on cap. The primary receptacle may be glass, metal or plastic…” The test tubes that shall be used have the dimensions of 2.25” long and diameter of 0.5”.
The test tubes must also contain labels that specify the time, date, and name associated with the sample. Traditional methods for labeling the test tubes is by manually writing the information on a sticker label and affixing the label to the test tube; however, since one of the goals of the Doc Box project is to make the collection process as simple as possible, other labeling methods such as barcoding have been sought out, and are being considered for use.
3.2.2 Specimen Collection Methods
With respect to saliva collection, there are various methods in which the patient may deposit a specimen. The most popular methods according to Salimetrics, a saliva research support company, two common methods are drooling and swabbing. Swabbing, as described by the title, is simply swabbing a portion of saliva from key areas of the mouth; although this method may be easier, it does not tend to be as accurate, due to higher potential of swabbing plaque and other bacteria instead of the actual saliva. Hence, drooling is the more preferred option, at least for Salimetrics. Drooling is generally performed with the assistance of a straw-like attachment to the test tube since they are generally rather small; however, just the test tube itself can suffice for specimen depositing. Specimen collection by drool is also more beneficial due to the higher likelihood of depositing saliva that contains a more evenly balanced representation of the contents throughout the body. [4] From this basic overview, it can be easily seen why the testing facilities utilize the drooling technique for saliva testing.

P a g e | 13
3.2.3 Specimen Shipping Requirements
It is important to understand the shipping requirements before the system is designed. According to the Code of Federal Regulations (CFR), an infectious substance is a “Material known or reasonably expected to contain a pathogen. A pathogen is a microorganism (including bacteria, viruses, rickettsiae, parasites, fungi) or other agent that can cause disease in humans or animals.” [5]. Any substance that meets this criteria falls into sub-category A or B. Category A is defined as “An infectious substance in a form capable of causing permanent disability or life-threatening or fatal disease in otherwise healthy humans or animals when exposure to it occurs.” Category B, on the other hand, is “An infectious substance that is not in a form generally capable of causing permanent disability or life-threatening or fatal disease…” In order to ship any specimen from these categories, a special identification number (UN3373 for category B, UN2814 for category A) must be applied to the outer packaging and special packing is required. However, there are a few exceptions that allow shipment of saliva without the need for a specific HAZMAT ID. The CRF states that if a human sample is not for the diagnosis of an infectious disease but for routine tests such as cholesterol, pregnancy, blood glucose, cancer biopsies etc., the sample is considered a non-infectious substance. The protocol for shipping non-infectious clinical samples is defined by the individual courier, in this case, UPS. Since the samples to be shipped will travel by air, UPS mandates that the packaging of all non-infectious samples adhere to International Air Transport Association (IATA) protocol PI 650. This requires three levels of sealant: a primary leak-proof receptacle(s), a secondary leak-proof package and a rigid outer packaging [5]. The test tubes represent the primary container and will be held in a secondary container that is watertight (in other words, a re-sealable bag. This method is identical to shipment protocol of Category B infectious substances. For the purposes of this system, the tests conducted will be classified as Category B substances in order to allow routine and low risk pathogen testing. Since the Doc Box is meant to be the “middle man” between the patient and the testing facility, it must only need to provide the basic handling requirements of providing the test tube, re-sealable bag, and a suitable storage temperature. Since the Doc Box will remain stationary, the rigid box requirement will be met for simple collection purposes, but is not required. Once the delivery service picks up the specimens from the Doc Box, the service will store the samples in their own boxes and moderate the environmental conditions.
3.3 Universal Labeling System
In order to keep track of each customer's saliva samples from box to lab, a method of indexing must be used. A unique ID will be assigned to each test tube and associated with the user’s account upon payment. One way to assign a number to a test tube is by the use of a label printer. However, peel and stick

P a g e | 14
labeling requires more action on the user’s end, increases error probability, and requires more maintenance. Stocking the system with pre-labeled test tubes and automatically scanning the numbers is the simplest solution for the user. Therefore, a code must be used that can be quickly and accurately translated to the digital world.
3.3.1 Code Format
Since an internal scan will identify each outgoing vial, it is important to determine the most efficient, accurate, and logistically feasible code format. The first option is to use a 1-dimensional bar code known as a Universal Product Code or UPC. There are several standards within the UPC line including but not limited to UPC-A, UPC-E, and UPC-128 [6].
There are also 2-dimensional codes which can hold mountains of information over 1-dimensional barcodes. A few common formats are known as QR-Code, Maxicode, and Data Matrix [6]. These formats are great for storing sufficient data but require a flat surface for scanning. Since the sample vials are small cylindrical tubes, a 1-dimensional barcode will work best.
From the UPC standard formats available, the UPC-128 code supports the largest number of unique ID numbers. Also, UPC-128 supports all ASCII characters as well as numbers. This makes our numbering scheme orderly and logical.
3.3.2 Numbering Scheme
The ID number system must be able to accommodate the future expansion of DOCBOX kiosks. Also, there must be a customer ID large enough for each kiosk so that no two customers can get switched. For this system, the UPC-128 will be implemented to encode format “DB#0001_00000001” in hexadecimal. The first four numbers after the # symbol represent the kiosk number and the last eight digits represent the customer ID. Starting with all zeros, there are over 4.2 Billion possible ID numbers for each kiosk and over 65,500 possible kiosks as seen in the expressions below. During manufacturing, the test tubes will have the barcodes printed on the side in an incremental fashion and each test tube will belong to a specific kiosk. These test tubes can be labeled and sent from the manufacturer to an authorized Doc Box personnel in numerical increments of 1000. For obvious reasons, careful inventory must be taken with each refill so keep track of the number system.
164 = 65,536 𝑢𝑛𝑖𝑞𝑢𝑒 𝑘𝑖𝑜𝑠𝑘𝑠 168 ≈ 4.29 𝐵𝑖𝑙𝑙𝑖𝑜𝑛 𝐼𝐷 𝑛𝑢𝑚𝑏𝑒𝑟𝑠 𝑝𝑒𝑟 𝑘𝑖𝑜𝑠𝑘
3.4 Relevant Hardware
3.4.1 Barcode Scanner
There are 2 places in the system where an analog device will be needed to translate the coded index on each test tube. The first place in the system

P a g e | 15
hierarchy is the internal scanner. A test tube is first dispensed and stopped at this location until the scanner makes a valid read on the barcode etched on the side. The other place a barcode scanner is needed is at the laboratory facility. The technician will need a barcode scanner in order to retrieve the contact information provided by the user from the web database. There are primarily 2 types of barcode scanning methods: CCD optical and laser scanning. CCD (Charge Coupled Device) scanners convert optical, ambient light reflected from the barcode into a voltage pattern across the sensor [7]. This type of recognition requires a significant amount of available ambient light. This type of scanner could work in a laboratory environment but since our internal scanner is going to be in a dark area, another option must be explored. A laser based scanner focuses a laser beam onto the barcode and detects the returned light via photodiodes [8]. Since the transmitted laser light is modulated, the internal digital signal processor is able to block unwanted light signals and only process the desired information. This type of barcode scanner will be used for the internal scanning solution.
3.4.1 Touchscreen
There are multiple options when considering using a touchscreen. The technology varies widely so the application must be considered when selecting the appropriate type of touchscreen technology. The Doc Box requires a responsive, accurate, and durable touchscreen. Current technologies include capacitive, surface acoustic wave (SAW), infrared, and resistive touchscreens. Each option carries its own attributes that make it suitable for different applications.
Capacitive touchscreens offer very fast response time which makes them suitable for applications involving features like drag and drop. Thick glass can protect these screens from dirt, dust, condensation, liquid spills, and cleaning solutions. This protective layer also makes these screens resistant to scratches and abrasion. Cost for these screens can be high and integration is not always the easiest.
Surface acoustic wave touchscreens are moderately priced and are moderately complex to integrate. SAW touchscreens are useful for applications that require excellent touch performance without compromising aesthetics. The downside of SAW technology is the adverse effects from moisture, surface contaminants, and changes in temperature. This technology is great for controlled environment applications.
Infrared technology has the benefits of withstanding severe environments, adjusting to changing light conditions, vandal and abrasion resistant, and is sealable against contaminants. Infrared costs about the same amount as SAW and provides simple integration. Infrared does not rely on pressure so there is no activation or sensitivity pressure. These features make infrared touchscreens useful for indoor/outdoor kiosks, ATMs, and process control systems.

P a g e | 16
The last option is resistive technology. Resistive touchscreens are known for their durability and long product life. They are resistive to contamination and maintain accuracy in high-use environments. Resistive touchscreens also tend to be more affordable than the other choices. One downside is a higher transmissivity distortion due to the coatings on the surface. Resistive touchscreens are used in POS, industrial, medical, and even the RedBox® systems. This proven performance makes resistive a great choice for the Doc Box system.
3.4.2 Motors Types and Control
Since the systems functionality depends on the incorporation of multiple moving parts, careful consideration must be taken in choosing the appropriate motors. There are three places in the system where a specific motor will operate and these are found exclusively in the dispenser subsystem. In choosing a motor for each part of this subsystem, the mechanical requirements such as torque, rotational speed and direction as well as electrical control needs must be evaluated. Once the requirements are defined for each location, a specific type of motor can be assigned. The various types of motors available will have various advantages and drawbacks with respect to each application. There are three types of motors that will be considered for this subsystem: Brushed DC, Brushless DC, and Stepper motors. A brushed DC motor, as shown in Figure 3 can operate without an electronic driver and runs freely when power is applied. This is beneficial because it can be switched on and off with a single pin of data. The direction of its rotation depends on the current flow direction. The speed of its rotor has a linear dependency to its armature voltage which makes speed control simple. A drawback to a brushed DC motor is the fact that the electrical contact of the rotor (commutator) rotates in contact with the fixed brushes. This can causes sparking and electrical noise.
Figure 3 – Brushed DC Motor Fundamentals [9]
Figure from publication "Brushed DC Motor Fundamentals" Author: Reston Condit, Microchip Technology Inc.

P a g e | 17
Motors such as the brushless DC and stepper motors utilize electrical commutation rather than brush contact. This allows for virtually noiseless operation. These motors consist of an array of stator windings and permanent magnets which allow for discrete rotation increments. Unlike brushed DC motors, brushless motor control requires more than a single control line. In order to turn the rotor, a precisely timed sequence of pulses will energize the windings. These motors require a controller capable of pulse width modulation output. There are many configurations of brushless DC and stepper motors but the common forms of the two are depicted in Figure 4 and Figure 5.
Figure 4 – Stepping Sequence for Stepper Motors [9]
Figure 5 – Hall Effect Sensor [10]
3.4.2.1 Dispenser Wheel
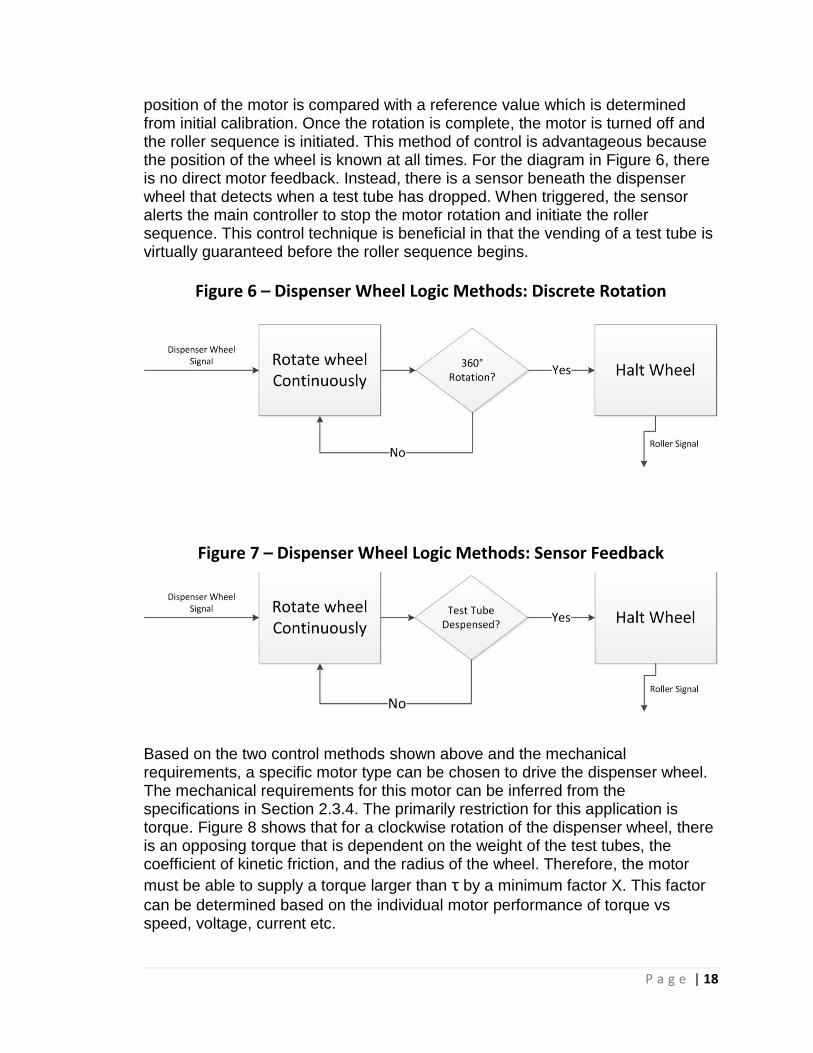
In the order of operations, the dispenser wheel is the first moving component that will require a motor. The dispenser wheel is a solid cylinder with a notch that allows one test tube from the gravity feeder to drop down upon each rotational pass. Since the dispenser wheel only needs to rotate in one direction at a constant speed, the control requirements are significantly reduced. Figure 4 and Figure 5 show two control logic diagrams which could be implemented when a “dispenser wheel” command is given. For the diagram in Figure 4, the current
P a g e | 18
position of the motor is compared with a reference value which is determined from initial calibration. Once the rotation is complete, the motor is turned off and the roller sequence is initiated. This method of control is advantageous because the position of the wheel is known at all times. For the diagram in Figure 6, there is no direct motor feedback. Instead, there is a sensor beneath the dispenser wheel that detects when a test tube has dropped. When triggered, the sensor alerts the main controller to stop the motor rotation and initiate the roller sequence. This control technique is beneficial in that the vending of a test tube is virtually guaranteed before the roller sequence begins.
Figure 6 – Dispenser Wheel Logic Methods: Discrete Rotation
Figure 7 – Dispenser Wheel Logic Methods: Sensor Feedback
Based on the two control methods shown above and the mechanical requirements, a specific motor type can be chosen to drive the dispenser wheel. The mechanical requirements for this motor can be inferred from the specifications in Section 2.3.4. The primarily restriction for this application is torque. Figure 8 shows that for a clockwise rotation of the dispenser wheel, there is an opposing torque that is dependent on the weight of the test tubes, the coefficient of kinetic friction, and the radius of the wheel. Therefore, the motor
must be able to supply a torque larger than τ by a minimum factor X. This factor
can be determined based on the individual motor performance of torque vs speed, voltage, current etc.

P a g e | 19
Figure 8 – Dispenser Wheel Dynamics
3.4.2.2 Roller
After a test tube is released from the holder, it rolls to a wheel that will rotate the tube so that the barcode can be scanned. This motor can be controlled in the same fashion as the dispenser wheel except that the feedback comes though the CPU by way of serial interface. The CPU alerts the embedded control system when a valid scan has been made.
3.4.3 Power Supply
As previously specified, the Doc Box will receive its power from the standard North American 120 volt(rms), 60hz AC mains electricity. This is the same power that is supplied to common homes and businesses throughout the US. The National Electrical Manufacturers Association, or “NEMA”, have standardized AC power plugs for mains electricity so, as such, a NEMA L5 connector will be used to supply the mains electricity to the Doc Box. NEMA L5 connectors are common among many devices and feature 2 parallel contact blades with a ground blade. At a rated 15A at 125V, this connector should be sufficient enough to supply the needed power. The connection to main will be made through a common NEMA 5 outlet – possibly to a ground fault circuit interrupter receptacle (GFCI). According to the Occupational Safety and Health Administration (OSHA), “The ground-fault circuit interrupter, or GFCI, is a fast-acting circuit breaker designed to shut off electric power in the event of a ground-fault within as little as 1/40 of a second.” This device is used to protect persons from potentially fatal electric shock by

P a g e | 20
comparing current coming out of the receptacle to current coming in. If the current differs by about 5 milliamps, the GFCI will break the circuit quickly preventing any harmful shock due to the ground fault. Also available are GFCI on cables which protects the cord and devices connected to them. [11] Since this project contains multiple sensitive components, great care must be taken when designing a system to deliver power to such devices. A DC power supply will convert the AC power signal to a regulated DC voltage. Then a circuit will be designed to attenuate the power supply output from an estimated 3-24V to rated operating voltages of the multiple components. The holder may be on its own power supply due to high power draw from the cooling devices and to ensure the samples will be preserved if the first power supply fails. Figure 9 is a rudimentary diagram of the power supply system. To protect from overcurrent that may cause damage to the power supply or other components, a fuse or circuit breaker or current limiting circuit will have to be utilized. Expected to draw the most power are the display and holder so the power supply will be rated to those components once they are specified. That being said, the power supply shall be one of the last components to be specified whether it is purchased or created.
Figure 9 - Power Supply Diagram
Aside from power output and overload protection, other factors in choosing a power supply for the Doc Box include size and operating temperature. However, looking at existing power supplies for purchase in the 24VDC range, these factors should not be a problem. Proper testing of enclosure temperature and

P a g e | 21
heat dissipation of the power supply’s heat sink will still be employed especially if the Doc Box will be used outdoors. As mentioned before, the DC power supply will need to convert AC voltage into usable DC voltage. However, if the power supply is unregulated, the output voltage of the supply will vary depending on fluctuations of AC supply voltage and load on the output. Since multiple loads will tied in parallel to a power bus, it may be desirable for our application to have the voltage resistant to change through a linear regulator - this is called a linear regulated power supply. Another type of power supply uses a switching regulator called a switched-mode power supply. These supplies are more complex than linear regulators but yield better efficiency and smaller size. In fact, many home electronics use switched-mode power supplies such as cell phone chargers and personal computers. However, despite their advantages, the supplies may produce more noise due to the switching.
3.4.4 Microcontrollers
The use of an embedded processor in conjunction with a full CPU has several advantages. For example, the main system program can be simplified by outsourcing trivial tasks to a microcontroller though a communication line. Also, the systems power efficiency can be increased because of the low power nature of embedded processors. Many even implement a “sleep mode” when not in service until a communication interrupt occurs. There are several factors to consider in choosing an embedded microcontroller such as processing power, I/O capabilities, number of I/O, and communication. These specifications can be determined by outlining the tasks it needs to perform and the hardware that will be interfaced. At this point, a specific part cannot be chosen until interface circuits are defined.
3.4.5 CPU
The central processing unit contains all the software and data necessary to run the Doc Box system. There are different options available when considering the purchase of a CPU. The choices are narrowed by the conditions defined in the project definition section.
A mini PC is explored as a choice due to its small physical size and dimensions. Mini PCs generally do not have the most impressive specifications but still function as a regular desktop PC. This is an attractive option because the CPU would not take up much space inside the box and be very cost effective. However, utilizing lower grade hardware may not be the best option to provide a friendly and usable customer interface.
Another option is a touch panel PC like those used in industrial human interface applications. These provide a display and CPU packaged together that mounts into the system saving valuable space. This product area provides resistance to

P a g e | 22
harsh environments such as a factory or railway control center. The necessary I/O ports are plentiful on these devices as they are designed to integrate with many systems. The downside of this product is the cost. Touch panel PCs may offer more than what is needed in a kiosk design.
A regular desktop PC that will fit in the allotted space is a very good option. A desktop PC provides the appropriate I/O ports, storage, memory, and functionality to meet the needs of the project. This also provides a level of expandability that the previous two options do not. A desktop allows easy access to update software as well as hardware. Development of the Doc Box software takes place on a desktop PC so testing and implementing can take place all on one unit.
3.5 Relevant Software
3.5.1 Software Requirements
Identifying the requirements of a new software product is vital for success in the marketplace. Before the Doc Box software can be fully development there must be a complete understanding of all the requirements the system must adhere to. Concerns such as who will be using the software, how will it be developed, what technologies are necessary, and how will it be maintained are among a few of the topics addressed in the following sections. Before looking into the development of the software the reason the project is commissioned must be addressed.
The stakeholders, or sponsors, own the original idea so it makes sense to understand what they are looking for in a final design before beginning production. Meeting with the sponsors has been crucial in identifying the requirements for the Doc Box software. The requirements began as very abstract guidelines that assisted in developing an original proposal for our team to acquire the project. It has been identified that the stakeholders require an easy to use system that is visually stimulating and attractive. The software must maintain a high level of security to protect the customer’s information. The system must also be robust and adaptable to allow modification as medical diagnostic technology changes.
Graphic design is a very important role in the success of any product; this is no different for the Doc Box. The screen has an eye catching animation that plays in a loop as potential customers pass by. This may be in a drug store, gym, or school campus. Wherever the Doc Box is located it will need to grab the attention of a wide variety of people from all different demographics. Research into what type of visual aids and colors are best suited for this will be discussed in a later section. Once a customer approaches the kiosk the looping visual aid will smoothly transition to a friendly environment the customer can interact with. As the user interacts with the system the interface will clearly display choices that
P a g e | 23
can be selected. Visual aids are used to help the user identify what they are looking for.
Avoiding a security threat is crucial in the success of the Doc Box because the target audience is the general public. Any security problems will surely lead to negative marketing for the product. Security will be treated with the utmost priority in the design.
3.5.2 User Identification
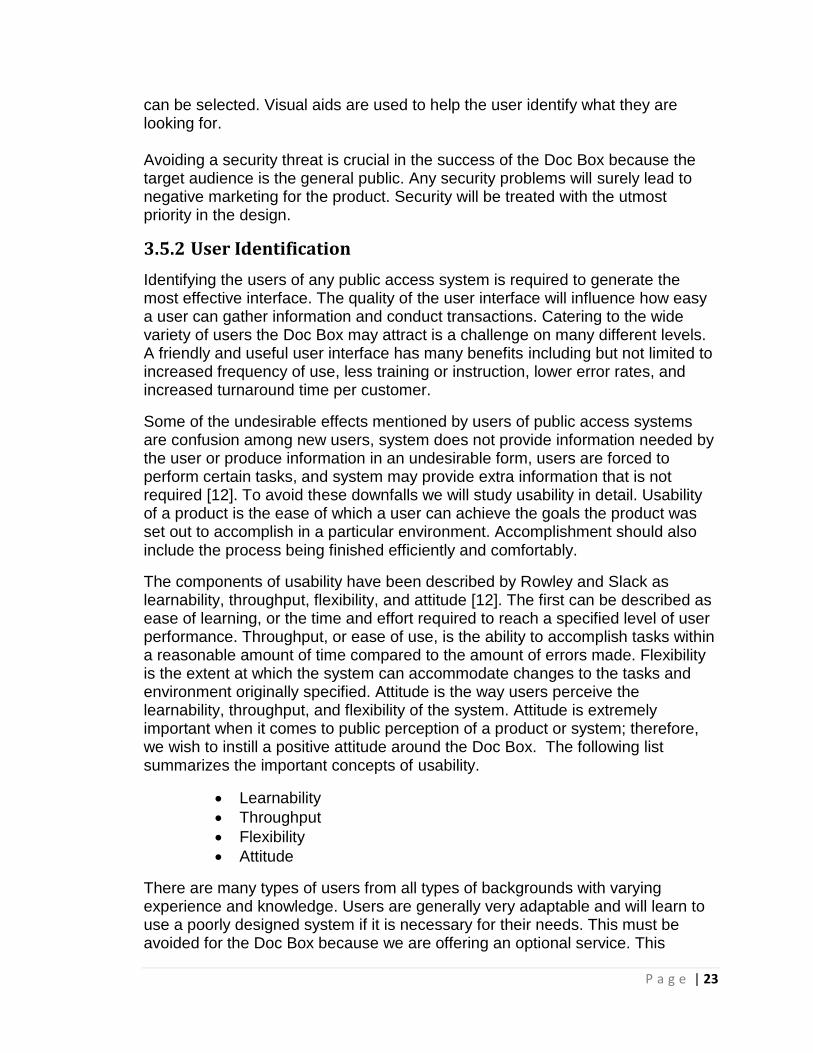
Identifying the users of any public access system is required to generate the most effective interface. The quality of the user interface will influence how easy a user can gather information and conduct transactions. Catering to the wide variety of users the Doc Box may attract is a challenge on many different levels. A friendly and useful user interface has many benefits including but not limited to increased frequency of use, less training or instruction, lower error rates, and increased turnaround time per customer.
Some of the undesirable effects mentioned by users of public access systems are confusion among new users, system does not provide information needed by the user or produce information in an undesirable form, users are forced to perform certain tasks, and system may provide extra information that is not required [12]. To avoid these downfalls we will study usability in detail. Usability of a product is the ease of which a user can achieve the goals the product was set out to accomplish in a particular environment. Accomplishment should also include the process being finished efficiently and comfortably.
The components of usability have been described by Rowley and Slack as learnability, throughput, flexibility, and attitude [12]. The first can be described as ease of learning, or the time and effort required to reach a specified level of user performance. Throughput, or ease of use, is the ability to accomplish tasks within a reasonable amount of time compared to the amount of errors made. Flexibility is the extent at which the system can accommodate changes to the tasks and environment originally specified. Attitude is the way users perceive the learnability, throughput, and flexibility of the system. Attitude is extremely important when it comes to public perception of a product or system; therefore, we wish to instill a positive attitude around the Doc Box. The following list summarizes the important concepts of usability.
Learnability
Throughput
Flexibility
Attitude
There are many types of users from all types of backgrounds with varying experience and knowledge. Users are generally very adaptable and will learn to use a poorly designed system if it is necessary for their needs. This must be avoided for the Doc Box because we are offering an optional service. This

P a g e | 24
service is not necessarily essential to the survival or well-being of most users. When the system is not intuitive to use people are discouraged from coming back. Users will likely share their experience with their family and friends resulting in a negative attitude about Doc Box as mentioned above.
A simple graphic can be used to display the variety of users we wish to accommodate. There are three categories which are experience, frequency, and age. A user will fall into a different spot on the scale in each category. Figure 10 demonstrates the flexibility that must be accomplished for the Doc Box.
Figure 10 - Range of Users
The last group of users that has not been mentioned yet are those with special needs. Doc Box’s goal is to accommodate all users, so this includes people who are hearing or visually impaired. Audio output can be provided to assist those who cannot see the touch screen. Audio commands paired with a touch keypad can allow a visually impaired user to navigate the system effectively.
Overall, we see the need for a robust, intuitive, and usable system that all types of users can use. Everyone from first time users to regular customers, children to adults, and beginners to technology experts will have the ability to learn and enjoy the Doc Box interface. The goal of Doc Box is to keep it simple while providing an informative and detailed interface that provides as much or as little information the user requires before embarking on their first transaction.
3.5.1 Database Information
The Doc Box will require a database to manage the client’s information. A second database will be used to store all the available testing information that will allow users to quickly search for available tests. The core information that will be kept in the client database will be an identification number, tests received, and contact information. The goal of the database is to allow the laboratory access to the clients contact information. This information will be used to send out customer results from the laboratory.
Novice
Occasional
Child
Expert
Frequent
Adult

P a g e | 25
The resource available that is most commonly used for database management is MySQL (“My S-Q-L”). MySQL is a widely used open-source relational database management system. MySQL does not ship with tools to manage the data contained within the databases. The resource available to create and modify databases is the command line utility. However, Oracle actively develops a front-end tool known as MySQL Workbench. This tool gives the ability to build database structures, backup data, and work with records. This tool is freely available for use by anyone. There is also a proprietary standard edition that is available which extends and improves the features given in the free edition.
The Doc Box tests vary in complexity and size. Test range from a few results to hundreds of results. By storing which items can be tested by which test in a database they can easily be displayed to the user. User will also be able to search for items they may wish to test. Searching the database will provide results for which test is needed to meet the customers need. This way we can provide the most accurate information to aid the customer in purchasing the right tests.
3.5.2 Graphical User Interface Options
The motivation for this section is to explore the different options available for creating an appealing, eye-catching, and high-end user interface for the Doc Box. The framework used to develop the Doc Box software needs to be quick and responsive, have natural animations, provide visual cues rather than long textual descriptions, and be visually stimulating to look at. Below is a description of the toolkits explored before deciding which will be most useful for the development of the Doc Box software.
According to GTK.org, GTK+ (Graphics Toolkit), or the GIMP Toolkit, is a multiplatform toolkit for creating graphical user interfaces. Offering a complete set of widgets, GTK+ is suitable for projects ranging from small one-off tools to complete application suites [13]. GTK+ offers the benefits of having been developed for over a decade, which means it delivers a high level of stability. GTK+ collection of windows, dialogs, and widgets boast a native feel that adapts to different platforms including Linux, Windows 32 and 64-bit, and Mac OS X. The project is protected by a Lesser General Public License (LPGL) so it can be used by anyone, even for proprietary software. While GTK+ is designed to be lightweight and efficient it does have its drawbacks. Basic free-drawing and image manipulation is available; however, the framework is pixel-level based so building a semi-complex application requires significant effort by the programmer. This also means animations and transition have to be implemented from scratch which is not suitable for the short development time available for the Doc Box. The second deciding factor was that GTK does not support 3D in any way.
The Open Graphics Library (OpenGL) was also explored as an available option. OpenGL is the most widely adopted 2D and 3D graphics application programming interface (API) in the industry. It is already used in a wide variety of computer applications. OpenGL also is protected by a LPGL license which

P a g e | 26
makes it a viable option. The downside of trying to create a graphical user interface (GUI) with OpenGL is that every frame or button should be a set of triangles projected in 2D on a plane. Input is complicated because a buffer analysis or vector selection would be necessary. It was determined that OpenGL would not be useful for the basis of creating the interface but can be implemented alongside other graphics libraries to create sleek and attractive scenes.
Another UI framework that has been explored and ultimately decided on is known as Qt (“cute” or “cue-tee”). According to the Qt-project, Qt is a cross-platform application and UI framework for developers using C++ or QML [14]. Qt is developed as and open source project but can also be used under commercial terms. The licensing details are discussed in the section titled ‘licensing’. Qt offers a vast collection of windows, dialogs, and widgets that are useful and eye-catching. Qt sets itself apart from the other available options in a few different ways. First, the IDE that comes with Qt, known as Qt Creator, is tailored to the needs of Qt developers. It focuses on providing features that help new users get up and running fast, this is something we are looking for because of the short development time allotted for the Doc Box. The second deciding factor is a feature called ‘signals and slots’ that Qt implements. A signal is emitted when a particular event occurs- a button press, timeout, or basically any event you can think of. A slot is a function that is called when a particular signal is emitted. The power in this method is derived from the ability to interconnect multiple signaling objects together with multiple slot objects. A signal can trigger multiple slots, from multiple objects. Figure 11 demonstrates the ability to connect multiple objects.
Figure 11 - Signals and Slots
Object 1
Signal 1
Signal 2
Object 2
Signal 1
Slot 1
Slot 2
Object 3
Signal 1
Slot 1
Object 4
Slot 1
Slot 2
Slot 3

P a g e | 27
3.5.3 Development Environment
Software can be developed by carrying out each process manually. The process involves writing code in a text editor, then using a compiler such as GCC or make to compile and build the executable. There are many details involved in compiling a program manually that must be considered. A very experienced and quality software programmer can face frustrating issues when going this route. There is another option available to computer programmers to develop their software, an integrated development environment (IDE).
An IDE is a software application itself that facilitates the programmer. Usually any given IDE consists of a source code editor, build automation tools, and a debugger, at the minimum. There are numerous amounts of other tools available in different IDEs. Some IDEs contain a compiler while others use an external compiler such as GCC or Mingw32. An interpreter, which directly executes or performs scripts without compiling into machine language, is also included in most IDEs.
The idea behind an IDE is to maximize the programmer’s productivity by providing an integrated set of tools that work well together while maintaining a similar look and feel. Bringing all the tools necessary together is the central goal of any given IDE. One of the most useful functions of an IDE is to parse the code as the programmer is writing it to give immediate feedback about syntax errors. This allows a programmer to increase efficiency as well as learn new languages much quicker. The debugger is very useful because it allows the programmer to view memory, variables, and other useful information to determine where a programmer is malfunctioning.
3.5.4 Qt Creator
Here we will discuss the advantages and usefulness of Qt Creator. First of all, Qt Creator is the integrated development environment (IDE) that allows a developer to create an application utilizing the Qt libraries. Qt Creator is cross-platform IDE that is tailored to Qt developers. It allows users to get up and running in a minimal amount of time, but also provides a feature rich environment for experienced developers. This is advantageous for the Doc Box software because an initial application can be developed, then more advanced features added along the way of development.
Qt Creator has an advanced code editor that supports C++ and QML. QML is short for Qt Meta Language which is a JavaScript based declarative language for designing a user interface. QML is similar to XML in its goal of simplicity and human readability. Although QML is very useful, the Doc Box will be developed in the C++ language. Qt Creator has rapid code navigation tools, advanced code completion, context sensitive help, and parenthesis matching. All of these tools allow for rapid development.

P a g e | 28
A visual debugger is another tool Qt Creator offers that aids in finding errors. The debugger can handle interrupt program execution, has the ability to step through code line-by-line or instruction-by-instruction, set breakpoints, examine stack contents, and view local and global variables.
Qt Creator also offers an integrated GUI layout and forms builder for C++ projects. This feature allows developers to rapidly design and build widgets and dialogs using on-screen forms. These forms are fully-functional and can be previewed immediately to ensure that they will look and feel exactly as designed. Having the ability to immediately preview forms gives the developer the opportunity to generate the application very quickly.
3.5.4.1 QGraphicsView
The most important class that will be implemented for the development of the Doc Box user interface (UI) is called a QGraphicsView class. The QGraphicsView is a QWidget. The power in using this class for the application is the QGraphicsView can be used as the entire main window. This allows for an entirely customized look and feel containing completely customized items. Developing using a traditional form will give the feel of a desktop application which is undesirable. Many mobile applications are developed using the QGraphicsView as a main window giving the wide variety and smooth feel we are all accustomed to. The Doc Box UI needs to provide a rich and easy to use environment that more and more people are becoming used to. Users are familiar with using the many mobile applications on their smart phones every day. We will take advantage of this ‘free’ training that users already have to implement the design, providing the highest level of usability. The following QGraphicsView information can be found at the Qt project website [15].
To implement a QGraphicsView we must first create a QGraphicsScene. Qt uses a powerful method that is referred to as the “model-view” method. The QGraphicsView is the “view”, while the QGraphicsScene is the “model” for the graphics view. More clearly, the view shows the scene while the scene contains all the items that are viewed on-screen. The scene contains all the items. These items are created as a QGraphicsItem. Figure 12 helps explain this framework.

P a g e | 29
Figure 12 - QGraphicsView
The graphics view is extremely robust in that it can implement many features. The graphics view handles transformations of the scene like zooming, rotation, and translation. The view is the parent class, handling a high level of detail over every item in the scene. For example, the view handles all events that take place in the scene. When an event occurs, like a key press, mouse press, or mouse movement, the view accepts this event and then propagates these events to the individual items involved. This happens by translating any input event into a QGraphicsSceneEvent, which is all handled by the view. Another feature the view provides is unsurpassed support for OpenGL. OpenGL provides the possibility for eye-catching 2D and 3D graphics to be displayed on screen. The last major feature the view provides to the ability to automatically map coordinates between the view and the scene, or vice-versa. This will be discussed further in the next paragraph.
The model-view method is useful here because it allows all the individual components of the application to have its own set of local coordinates. The view has integer coordinates that start at (0, 0) in the top left of the view, and then extending along the positive x-axis (to the right) and the positive y-axis (downward). The scene then has its own set of coordinates inside the view which are not relative to the view; they are local to the scene. Each individual item inside the scene also has its own set of local coordinates. Therefore, if a rotation or any other transformation is applied to an item it takes place about its own coordinates. Another way of visualizing the usefulness of this method is realizing that the center of a (100 x 100) box is always going to be at (50, 50), no matter what transformation has taken place. Figure 13 shows each component containing its own coordinate system.
QGraphicsView
QGraphicsScene
eQGraphicsItem
QGraphicsView
QGraphicsScene
QGraphicsItem
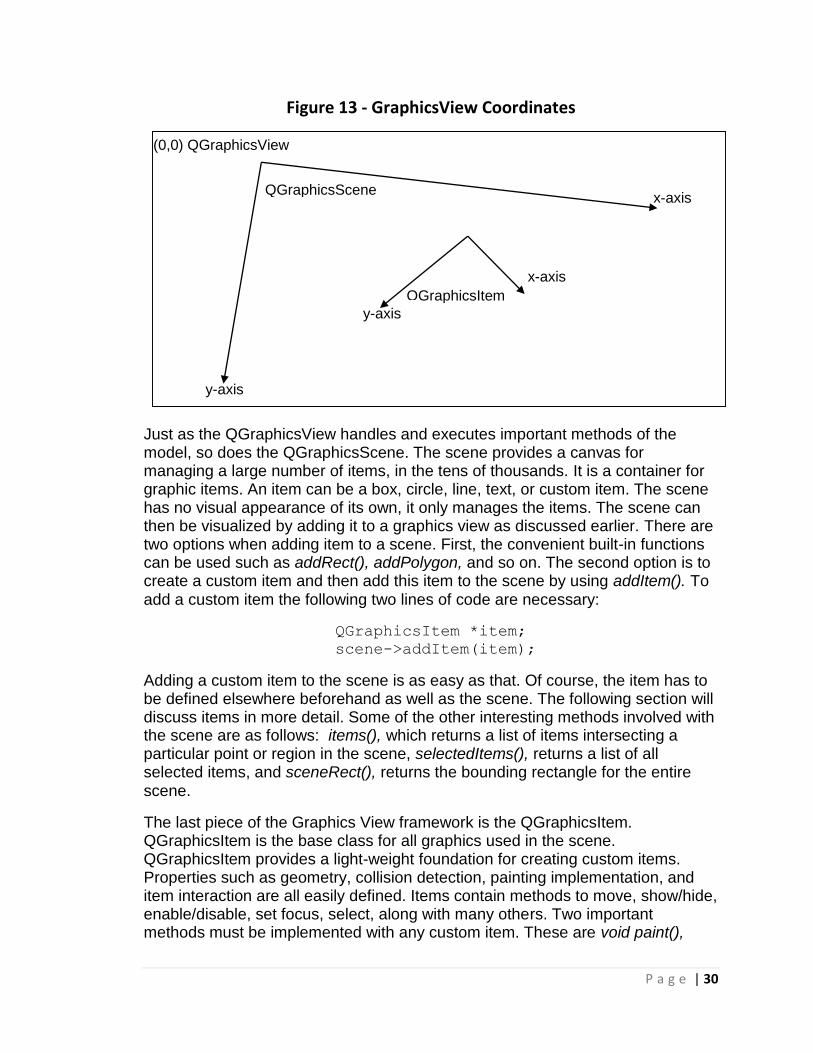
P a g e | 30
Figure 13 - GraphicsView Coordinates
Just as the QGraphicsView handles and executes important methods of the model, so does the QGraphicsScene. The scene provides a canvas for managing a large number of items, in the tens of thousands. It is a container for graphic items. An item can be a box, circle, line, text, or custom item. The scene has no visual appearance of its own, it only manages the items. The scene can then be visualized by adding it to a graphics view as discussed earlier. There are two options when adding item to a scene. First, the convenient built-in functions can be used such as addRect(), addPolygon, and so on. The second option is to create a custom item and then add this item to the scene by using addItem(). To add a custom item the following two lines of code are necessary:
QGraphicsItem *item;
scene->addItem(item);
Adding a custom item to the scene is as easy as that. Of course, the item has to be defined elsewhere beforehand as well as the scene. The following section will discuss items in more detail. Some of the other interesting methods involved with the scene are as follows: items(), which returns a list of items intersecting a particular point or region in the scene, selectedItems(), returns a list of all selected items, and sceneRect(), returns the bounding rectangle for the entire scene.
The last piece of the Graphics View framework is the QGraphicsItem. QGraphicsItem is the base class for all graphics used in the scene. QGraphicsItem provides a light-weight foundation for creating custom items. Properties such as geometry, collision detection, painting implementation, and item interaction are all easily defined. Items contain methods to move, show/hide, enable/disable, set focus, select, along with many others. Two important methods must be implemented with any custom item. These are void paint(),
QGraphicsScene
y-axis
x-axis
(0,0) QGraphicsView
QGraphicsItem
y-axis
x-axis

P a g e | 31
which paints the item in local coordinates, and QRectF boundingRect(), which returns the outer bounding shape of an item. An important property of items is the z-value. The z-axis value is used to determine the depth the item is placed on the scene, an item with a z value of 1 will be at the top of the scene. Items can also be grouped using QGraphicsItemGroup. This is an invisible item that provides a grouping for other items. If the parent object is removed all the child objects in the group are also removed.
When working with items we usually want to have the ability to alter or transform the items. Some of the more common transformations are rotate, scale, shear, and translate. Qt provides pre-defined functions for these common translations, this save time and effort by avoiding having to define a transformation matrix and implementing it yourself. Transformations are done about the z-axis by default, but can be done about a non z-axis to get an interesting perspective transform. To create a transformation a transformation object is first created, then properties are applied to the object, and then the transform object is applied to an item. Following is an example of a simple transformation that scales and rotates an item.
t = Qtransform();
t.scale(1.5, 1.5);
t.rotate(45, Qt::ZAxis);
item->setTransform(t);
The above code snippet creates a transformation object, t. Then applies a 150% scale in both the x-axis and y-axis. Also, a 45 degree rotation property is added about the z-axis. Finally, the transformation is applied to the item titled ‘item’. Transformations have properties that can be used to add more customization.
Anchors can be used to allow a transformation to take place about a particular point like the cursor location. Another feature arises when you may not want a certain item to transform. For example, if the scene is zooming in you may not wish for the toolbar in the application to remain the same. Flags can be set using item->setFlag(QGraphicsItem::ItemIgnoreTransformations) to prevent the transformation from being applied to this item.
3.5.5 Serial Communications The Doc Box must integrate a powerful user interface with multiple hardware components to accomplish the functions it is designed to do. The communication between the main central processing unit (CPU) and the microcontroller is critical. The microcontroller will control the processes such as vending and receiving. User input will control when particular hardware components are activated. There must be a reliable line of communication to ensure all the devices operate when they are supposed to.
A serial protocol will be used to accomplish this task. The microcontroller is used to process the received control signals. The module on the microcontroller used

P a g e | 32
(MSP430) is called a Universal Serial Communication Interface (USCI). This module can be used to implement multiple serial communication modes with the same hardware. For the Doc Box we will be using the Universal Asynchronous Receive Transmit (UART) mode. The specific USCI module that will implement UART on the MSP430 is the USCI_A module. Texas Instruments provides details about this mode in the MSP430 user guide [16]:
7- or 8-bit data with odd, even, or non-parity
Independent transmit and receive shift registers
Separate transmit and receive buffer registers
LSB-first or MSB-first data transmit and receive
Built-in idle line protocols
Receiver start-edge detection for auto-wake up from LPMx modes
Programmable baud rate
Status flags for error detection and suppression
Status flags for address detection
Independent interrupt capability for receive and transmit
This system will be utilized to receive and transmit serial data over a serial cable. The above feature set makes this module ideal for the Doc Box implementation. It may seem as though the CPU only needs to transmit data while the microcontroller receives. However, it will be necessary to receive and transmit data from both ends. The reason for this is to check for errors. The CPU will need to know when an action has taken place or not. Figure 14 shows a typical serial data protocol.
Figure 14 – Serial Data Protocol
3.5.6 Licensing
The Doc Box user interface and supporting software requires a rich development environment for realizing the necessary functionality. To accomplish this goal the software is developed using a cross-platform application and UI framework known as Qt, pronounced “cute” or “cue-tee” depending on the language being spoken. From here on we will refer to the framework as just ‘Qt’. Qt has been developed by Nokia’s Qt Development Framework division which acquired it from a Norwegian company known as Trolltech, who was the original developers of Qt. Since the acquisition Nokia has sold Qt’s commercial licensing and professional services to Digia.
Stop Bit 8 Data Bits
BIT 0 BIT 1 BIT 2 BIT 5 BIT 4 BIT 3 BIT 7 BIT 6
Start Bit
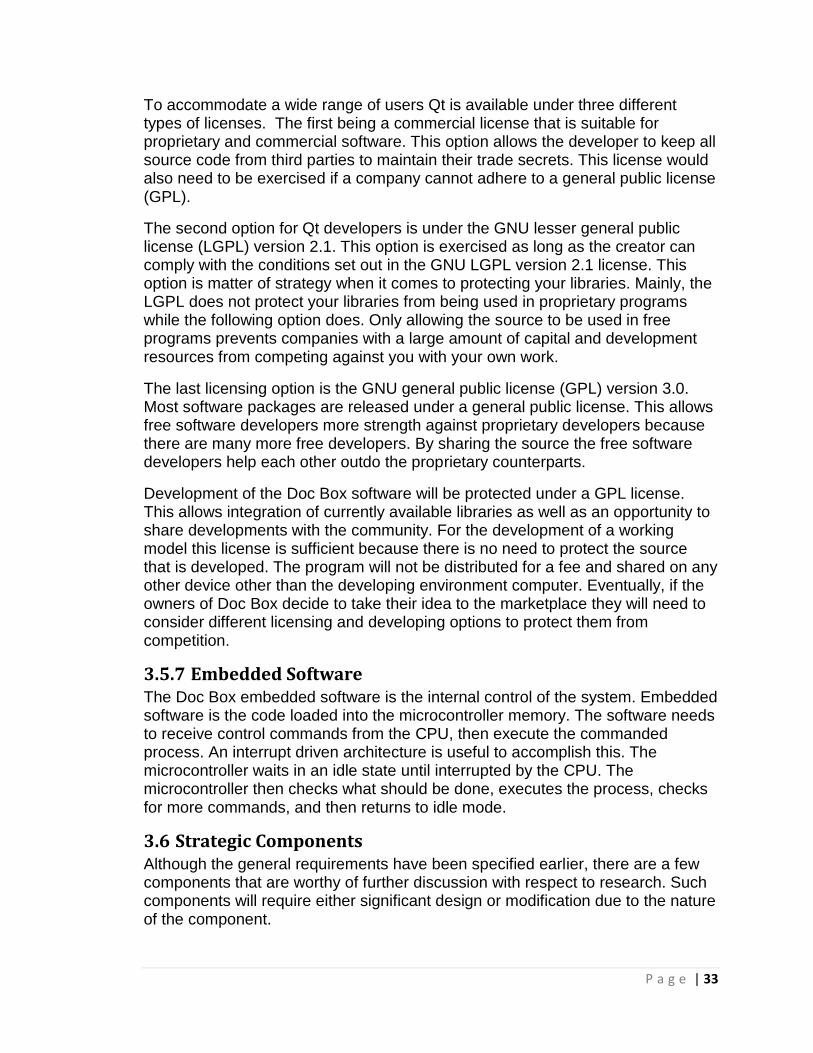
P a g e | 33
To accommodate a wide range of users Qt is available under three different types of licenses. The first being a commercial license that is suitable for proprietary and commercial software. This option allows the developer to keep all source code from third parties to maintain their trade secrets. This license would also need to be exercised if a company cannot adhere to a general public license (GPL).
The second option for Qt developers is under the GNU lesser general public license (LGPL) version 2.1. This option is exercised as long as the creator can comply with the conditions set out in the GNU LGPL version 2.1 license. This option is matter of strategy when it comes to protecting your libraries. Mainly, the LGPL does not protect your libraries from being used in proprietary programs while the following option does. Only allowing the source to be used in free programs prevents companies with a large amount of capital and development resources from competing against you with your own work.
The last licensing option is the GNU general public license (GPL) version 3.0. Most software packages are released under a general public license. This allows free software developers more strength against proprietary developers because there are many more free developers. By sharing the source the free software developers help each other outdo the proprietary counterparts.
Development of the Doc Box software will be protected under a GPL license. This allows integration of currently available libraries as well as an opportunity to share developments with the community. For the development of a working model this license is sufficient because there is no need to protect the source that is developed. The program will not be distributed for a fee and shared on any other device other than the developing environment computer. Eventually, if the owners of Doc Box decide to take their idea to the marketplace they will need to consider different licensing and developing options to protect them from competition.
3.5.7 Embedded Software The Doc Box embedded software is the internal control of the system. Embedded software is the code loaded into the microcontroller memory. The software needs to receive control commands from the CPU, then execute the commanded process. An interrupt driven architecture is useful to accomplish this. The microcontroller waits in an idle state until interrupted by the CPU. The microcontroller then checks what should be done, executes the process, checks for more commands, and then returns to idle mode.
3.6 Strategic Components Although the general requirements have been specified earlier, there are a few components that are worthy of further discussion with respect to research. Such components will require either significant design or modification due to the nature of the component.

P a g e | 34
3.6.1 System Enclosure
As discussed in Section 2.3.1, the system enclosure needs to be durable and secure from any tampering with the device. Although similar devices such as ATM’s and dispensing machines meet the initial security and dimension requirements, the factor of system components placement on the interior and exterior of the box are extremely prevalent. The touchscreen display, for example, is planned to be larger than most ATM displays; therefore, if an ATM were to be utilized, a larger cutout from the box would have to be made, which may not be beneficial considering the high strength material used for the enclosure. An additional factor of potential design patent infringement with using an existing box design is another reason for presenting a new box design for the Doc Box.
For the reasons mentioned, the project group decided to utilize a custom box design. The design plays a strategic component within the entire product for the obvious fact that it is what holds all of the system components. The placement of components both on the interior and the exterior of the box will play a very strategic role with respect to material cost, visual appeal, and ease of maintenance. These factors, and others, will all be taken into consideration when designing the system enclosure, so as to utilize maximum efficiency and quality in the final product.
3.6.2 Dispensing and Collecting
Since dispensing and collecting of test tubes is the main function of the Doc Box, the design of the dispensing and collecting components shall be a vital part of the system. Although there already exists test tube dispensing devices, most either require too much space, are too expensive, or both. Therefore, Group 12 has decided to design the dispensing unit, so as to effectively fit the unit within the compact space of the box. The strategy behind the design must involve the size and method of storing hundreds of test tubes as well as measuring the number of test tubes remaining; additionally, the ability to dispense discrete numbers of test tubes, effectively scan each test tube, and deliver each to the Tongue are strategic design problems that have been posed. The collection of test tubes shall be a much simpler of a design, with the main features being the ability for only the test tubes in plastic bags to be received and a sensor to detect such.
3.6.3 Bag Dispenser
In keeping with the specimen shipping requirements previously described in section 3.2.3, the Doc Box will have to dispense a watertight, re-sealable plastic bag in which the sample vial(s) will be placed in. It is important for the bag to be dispensed along with the vials as samples that are not in compliance may not be tested. The dispensing mechanism must be accurate as to reliably dispense the correct number of bags per number of samples – too little would result in untestable samples and too many would create a mess of unused plastic bags in addition to increase costs of replacing the wasted bags. In order to minimize

P a g e | 35
these errors, optical sensors will be utilized to monitor the number of dispensed bags and adjust accordingly by communicating to the CPU. In researching methods of dispensing, the most attractive to the Doc Box application are friction feed mechanisms. Friction feed machines use rollers that are driven by rotating cylinders to dispense from a stack of flat objects one at a time. This is used in numerous applications but probably most commonly recognized in home inkjet printers to move paper from a stack through the printer. Just about anything can be friction fed as long as they’re flat. The re-sealable bags will be the size of a business card and just as flat with nothing in it so it shall be able to pass through a feeder. The feeder’s motor control that drives the rollers may be controlled by the microcontroller which will be programmed to feed a certain amount of bags based on the number of tests ordered into a collection point where the user will be able to receive them. Although heavily mechanical, it may be easier to design and build a friction feeder than to find one for purchase as market friction feeders are generally specialized and expensive. Another method in dispensing a bag to the user is by keeping the bags in a locked compartment which would only be accessible when granted by the CPU (after a vial has been dispensed for instance). This option may be much easier and reliable as there are less moving parts but trusts the user to not steal or tamper with the bags. The bag compartment will have an access door that is normally sealed by a deadbolt lock that will be able to extend and retract given an electric signal. A linear solenoid converts electrical current into mechanical actuation and may be able to extend and retract a bolt. Solenoids consists of a ferromagnetic plunger within a current carrying coil that, once energized, creates a magnetic field that induces a pushing or pulling force on the plunger. Once de-energized, a spring attached to one end of the plunger pushes or pulls the plunger to their resting point depending on what type of linear solenoid is used. Pull type linear solenoids (Figure 15) are normally extended and retracts once energized (push type solenoids operate conversely).
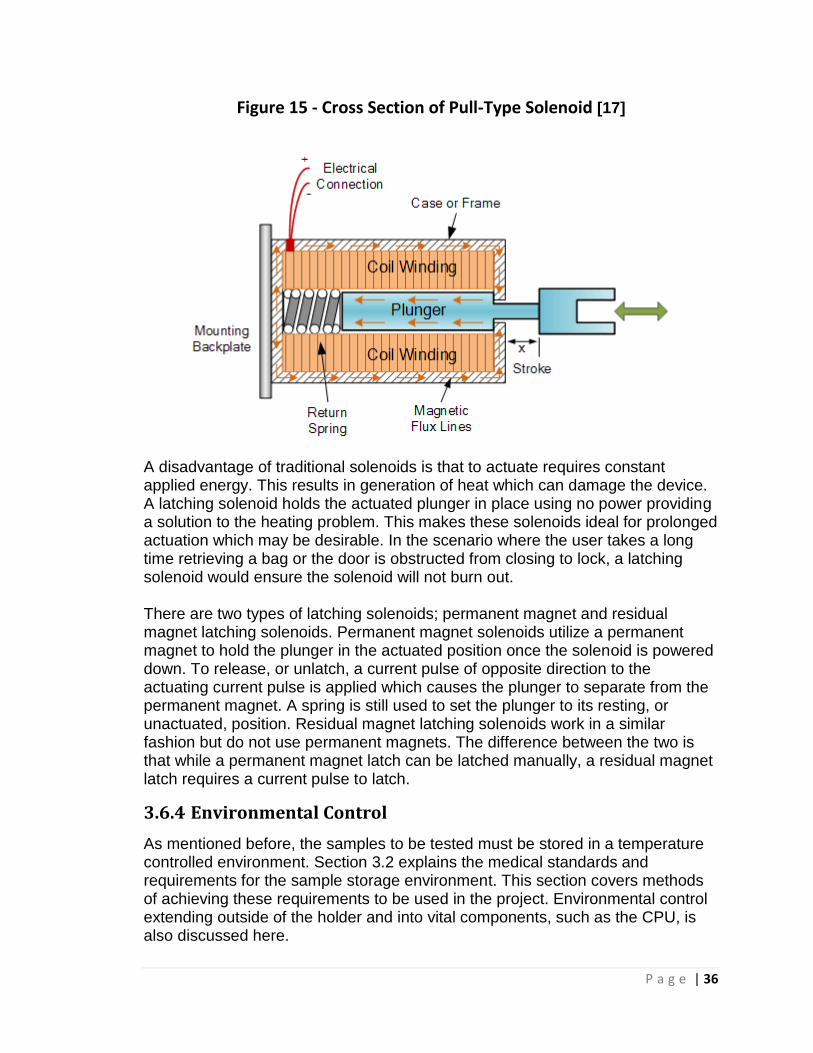
P a g e | 36
Figure 15 - Cross Section of Pull-Type Solenoid [17]
A disadvantage of traditional solenoids is that to actuate requires constant applied energy. This results in generation of heat which can damage the device. A latching solenoid holds the actuated plunger in place using no power providing a solution to the heating problem. This makes these solenoids ideal for prolonged actuation which may be desirable. In the scenario where the user takes a long time retrieving a bag or the door is obstructed from closing to lock, a latching solenoid would ensure the solenoid will not burn out. There are two types of latching solenoids; permanent magnet and residual magnet latching solenoids. Permanent magnet solenoids utilize a permanent magnet to hold the plunger in the actuated position once the solenoid is powered down. To release, or unlatch, a current pulse of opposite direction to the actuating current pulse is applied which causes the plunger to separate from the permanent magnet. A spring is still used to set the plunger to its resting, or unactuated, position. Residual magnet latching solenoids work in a similar fashion but do not use permanent magnets. The difference between the two is that while a permanent magnet latch can be latched manually, a residual magnet latch requires a current pulse to latch.
3.6.4 Environmental Control
As mentioned before, the samples to be tested must be stored in a temperature controlled environment. Section 3.2 explains the medical standards and requirements for the sample storage environment. This section covers methods of achieving these requirements to be used in the project. Environmental control extending outside of the holder and into vital components, such as the CPU, is also discussed here.
P a g e | 37
3.6.4.1 Vapor Compression Refrigeration
Vapor-compression refrigeration is a natural choice in keeping the samples at the required temperature. This method is widespread and is commonly used in home refrigeration and air conditioners due to its relatively high efficiency and low costs. This method uses a refrigerant liquid to absorb heat from a cool area and expel it elsewhere through the laws of thermodynamics. However this method requires multiple parts including a compressor and evaporator which can be space consuming. Refer to Figure 16 [18] for diagram of the vapor-compression cycle. The heart of the system is the compressor and is where work is put into. The refrigerant is pumped into the evaporator where heat is absorbed (cool area) and is taken into the condenser (hot area) where the heat is expelled.
Figure 16 – The Vapor Compression Cycle [18]
A type of vapor-compression refrigeration is the inverter control refrigeration. Typical refrigeration methods employ a fixed frequency compressor to cool an area. The temperature is controlled by running the compressor when temperature is too high and turns the compressor off when temperature is in between a suitable range. However, since the frequency is fixed, the compressor runs at full speed when powered on. By using a variable frequency compressor and an appropriately designed controller, a given temperature can be reached by running the compressor at a high speed and maintained by running at a low constant speed. This constant low speed as opposed to the intermittent operation of the fixed frequency compressor is more efficient as it reduces energy consumption and audible noise while maintaining a more accurate temperature. Numerical simulation shows that this kind of operation can lead to energy savings of up to 30% [19]. Table 2 [20] is a table comparing energy consumption

P a g e | 38
of a fixed frequency compression refrigerator/freezer and a variable frequency one.
Table 2 – Comparison of Energy Consumption of Fixed & Variable Compression Refrigerators/ Freezers [20]
Most compressors utilize AC motors. In order to vary the speed of an AC motor, the frequency of the input must be varied. To do this, a variable frequency drive (VFD) is used. These devices take in a three phase voltage input where it is rectified and converted to DC. The DC signal is then inverted back to AC and outputted as a pulse width modulated (PWM) signal with a frequency defined by the operator via a controller.
Figure 17 [21] is a schematic of a VFD. To vary the PWM signal, the timing of
closing the switches (transistors) is controlled.
Figure 17 – VFD Schematic [21]

P a g e | 39
3.6.4.2 Thermoelectric
Thermoelectric cooling makes use of the Peltier Effect and is another option in controlling the holder environment. Advantages of this over vapor-compression are that it has no moving refrigerant, space saving, and is voltage or current
controlled (thus a higher degree of temperature accuracy). Table 3 [22] shows
alternatives to vapor compression technology. We see that the efficiency of vapor compression is far greater than thermoelectric. Though not as efficient, the advantages of thermoelectric may outweigh the disadvantages in the Doc Box application.
Table 3 – Alternatives to Vapor Compression Technology [22]
In regards to cooling the CPU, a system of thermo controlled fans may be sufficient enough. Similarly, personal computers commonly use a combination of fans and heat sinks to cool their CPU’s. However, fans do not provide cool air but simply circulates cooler air from the outside environment into the enclosure in order to cool components. Often heat that is dissipated from the CPU’s heat sink is then circulated out of the enclosure by another fan. A Peltier module (thermoelectric) is an alternative way to cool the CPU especially if the outside air temperature is above the CPU operating temperature.
3.6.4.3 Temperature Sensors
In any case, temperature monitoring is imperative in this project. Therefore, temperature sensors in combination with respective cooling methods will be implemented in multiple systems in order to maintain required temperatures. There are two main types of temperature sensors to choose from – contact and noncontact. As the name implies, contact temperature sensors physically touch the object they are to measure and non-contact temperature sensors measure thermal radiation of heat sources from a distance. Types of contact temperature sensors include thermocouples, thermistors and resistance temperature detectors.

P a g e | 40
Thermocouples make use of the Beck effect to measure differences in temperature dependent voltages which it then converts into a temperature reading (as high as 2750C and low as -250C) [23]. These are popular due to being inexpensive, durable, rapid response time, and they do not require a battery. However, substantial conditioning is necessary to convert the thermocouple voltage into a usable temperature reading. Since the voltage generated by the thermocouple is small and nonlinear, it is difficult to transform the signal into an accurate temperature reading [24]. Thermistors are also inexpensive, durable and are made of semi conductive material whose resistivity is sensitive to temperature. Depending on the type of thermistor (+k or –k), resistance of these materials increase or decrease with increasing temperature. This change is predictable and is how thermistors are able to measure temperature. Often, thermistors are also used as current limiters and overcurrent protectors. However compared to thermocouples and resistance temperature detectors, thermistors have the narrowest measuring range, lowest stability and linearity, and are highly sensitive. On the upside, they are the least expensive and provide a robust signal [25]. Resistance temperature detectors or RTDs are sensors with a resistor whose value changes nearly linearly with temperature change (-200C to 850C). These are known to be more accurate than thermocouples and are stable but have a
smaller temperature range [23]. Figure 18 shows the resistance versus
temperature relationship of a 100 ohm RTD. As shown, the relationship appears very linear but in actuality is slightly curved. However, in the small temperature range that the Doc Box will be operating in, one can assume a linear relationship.

P a g e | 41
Figure 18 – RTD Resistance Vs Temperature [26]
Infrared sensors are the main non-contact sensor. These sensors pick up infrared radiation signals generated from heat and convert them into electric signals which are then computed as a temperature. Typically, infrared sensors are used when the temperature of the object to be measured are too far or dangerous for contact sensor usage. With a large range of measure (-70C to 1000C) [23] and more complex technology, infrared is expectedly more expensive. In choosing a temperature sensor for the Doc Box application, reliability and accuracy are key factors. A resistance temperature detector may be a good choice due its wide range and accuracy. However an infrared sensor would be able to monitor a wide area of the chamber and may be a better choice. Testing of the resistance temperature detector in the chamber would be conducted to conclude if whether this sensor would be sufficient. For cooling of the CPU a thermocouple or thermistor hooked up to a voltage or current switch controlling a fan to air cool the device may suffice. Also available for purchase are CPU cooling units that are used in personal computers.
3.6.5 Dynamic Component Control
With respect to the dynamic hardware, several control methods can be taken to efficiently run the entire system. The two main considerations for the hardware control are microcontrollers and Field Programmable Gate Arrays (FPGA’s). An entire computer system is not being considered due to the desire to keep the system in the fastest possible working conditions, in other words: to leave the
P a g e | 42
majority of the dynamic component processing to external devices (microcontrollers and FPGA’s). The main strategy will be in choosing which type of device to use preceded by the model that will provide the fastest control while maintaining accuracy. Since FPGAs are used for the purpose of faster responses based off of logical circuitry, the initial strategy would be to use an FPGA for the control of the dispensing and collecting unit; whereas a microcontroller would be used for the control of the air conditioning unit. These factors, and many others, are taken into consideration for the controller design, which will be further discussed in Section 4.1.2.
4 Project Hardware and Software Design Detail
The Doc Box system as a whole requires much design with respect to both hardware and software. Throughout this section, the design of the several components that cause the system to function as a whole is written in detail.
4.1 Hardware
4.1.1 System Enclosure
The Doc Box system enclosure shall be robust, able to withhold industrial use, a visually appealing. As mentioned in Section 2.3.1, the exterior of the box shall meet the dimensions of 20”x20”x54”, with an angled top face for the user interface to fit within the 18”x18” cutout. Two additional cutouts of the top frame shall be used for the dispensing and collecting chutes. These dimensions are depicted in Figure 19. The front faces of the enclosure shall be able to open for maintenance purposes; this shall be done by two hinged faces on the bottom of the interface panel, and on the left edge of the dispensing/collecting face of the enclosure.

P a g e | 43
Figure 19 – Doc Box System Enclosure
4.1.2 Motor and Sensor Control
Since the Doc Box system contains multiple motors to control, Group 12 decided to utilize a Texas Instruments MSP430 microcontroller to process the main control signals for each of the motors, as well as the respective feedback sensors.
4.1.3 User Interface
The following display unit is used for the Doc Box user interface. This is a product from Elo Touch Systems that provides display and touch response functionality in one encapsulated unit. The Elo Touch Systems 1541L has a convenient, space-saving design that makes it perfect for a kiosk application. With permission from Elo Touch Systems the 1541L is shown below in Figure 20.

P a g e | 44
Figure 20 - Elo Touch Systems 1541L [27]
The 1541L features an injection molded bezel with a virtually invisible water-resistant seal, making it a great choice to withstand the rigors of public use. The display panel is LCD type that is high quality and LED backlit providing a high resolution with less power consumption. The touchscreen technology is AccuTouch 5-wire Resistive. The display has a wide viewing angle of 170° x
130°. Table 4 provides a detailed specification for the 1541L touch system.
Table 4 - 1541L Touch System Specifications
Model 1541L
Display 15.6"
Aspect Ratio 16:9, Active matrix TFT LCD
Dimensions 14.8" x 8.7" x 1.8"
Optimal Resolution 1366 x 768
Colors 16.7 million
Response Time 16 msec
Video Format DVI/Analog VGA
Power Supply +12VDC
Weight 6.5 lb
Temperature 0°C to 40°C
Humidity 20%-80%
4.1.4 Dispenser
In the overall view, the dispensing unit plays a pivotal role for the entire system. The following are the specifications toward the hardware design of the dispensing unit.

P a g e | 45
4.1.4.1 Order of Operations
To further understand the design of the dispensing unit, the top level order of
operations of the unit is specified below and further depicted in Figure 21
1. Dispensing roller rotates to dispense single test tube onto dispensing chute.
2. Roller rotates test tube to expose barcode that is read by the
barcode scanner.
3. (a) Barcode scanner returns a positive scan of test tube: Rotate dispensing chute counter clockwise to drop test tube onto the tongue which will deliver the test tube to the front access door (“hatch”). (b) Barcode scanner cannot obtain positive scan of test tube after 10 seconds: Rotate dispensing chute clockwise to drop test tube into discard box.
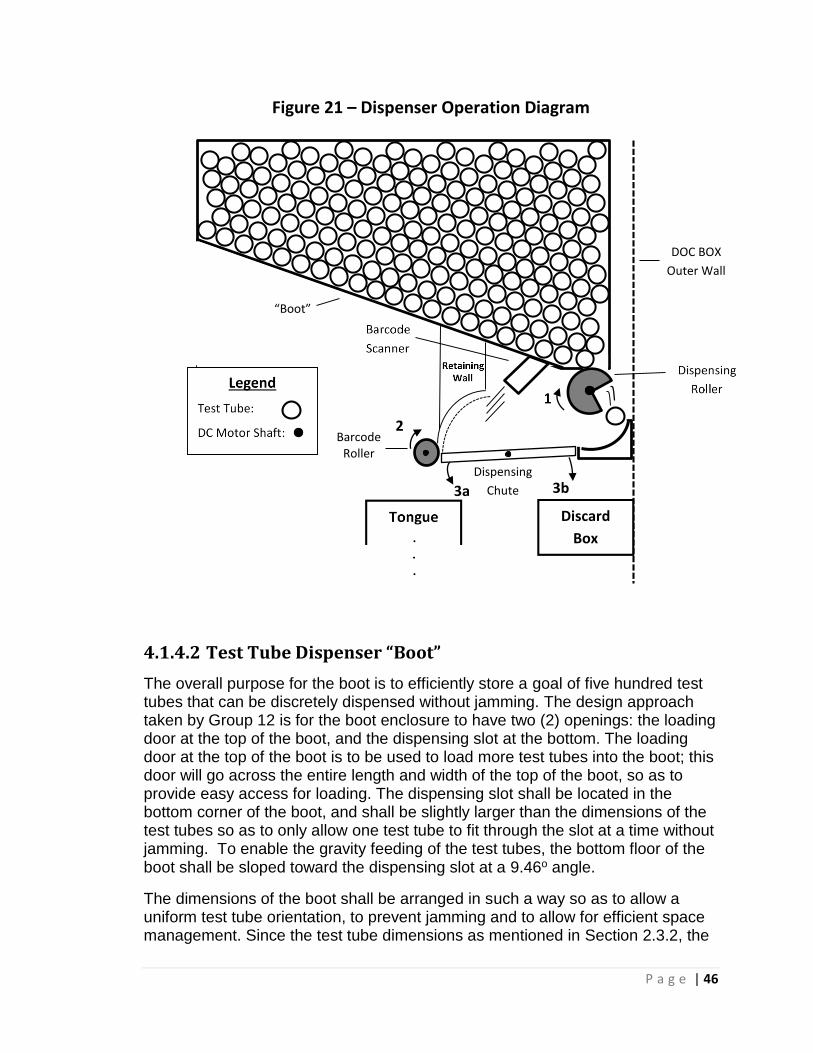
P a g e | 46
Figure 21 – Dispenser Operation Diagram
“Boot”
Barcode Roller
DOC BOX
Outer Wall
2
3a
Dispensing
Chute 3b
Discard
Box
4.1.4.2 Test Tube Dispenser “Boot”
The overall purpose for the boot is to efficiently store a goal of five hundred test tubes that can be discretely dispensed without jamming. The design approach taken by Group 12 is for the boot enclosure to have two (2) openings: the loading door at the top of the boot, and the dispensing slot at the bottom. The loading door at the top of the boot is to be used to load more test tubes into the boot; this door will go across the entire length and width of the top of the boot, so as to provide easy access for loading. The dispensing slot shall be located in the bottom corner of the boot, and shall be slightly larger than the dimensions of the test tubes so as to only allow one test tube to fit through the slot at a time without jamming. To enable the gravity feeding of the test tubes, the bottom floor of the boot shall be sloped toward the dispensing slot at a 9.46o angle.
The dimensions of the boot shall be arranged in such a way so as to allow a uniform test tube orientation, to prevent jamming and to allow for efficient space management. Since the test tube dimensions as mentioned in Section 2.3.2, the

P a g e | 47
width of the boot shall therefore adhere to the length dimensions of 2.25” of the test tubes. So as to meet the required maximum of five hundred test tubes, the length of the boot shall adhere to the length of the Doc Box enclosure (20”). Given the length parameter of the boot, as well as the diameter of the test tubes, the height dimensions of the boot can be found in order to meet the required test tube amount.
Since the width of the boot shall simply accommodate the length of one test tube, the problem of finding the total number of test tubes can be reduced to the cross section of the boot, looking only at the length and height. The calculation shall be looking at a cross section that does not include the angled bottom of the boot. Figure 22 shows the cross sectional view of the boot that is analyzed to obtain the required height of the boot to allow a 1000 test tube capacity.
Figure 22 – Boot Dimensions
H
L
H’ …
d
With the following definitions of each of the parameters, in inches, in Figure 22,
the cross sectional area of the boot is found:
L = 18” H’ = 3” d = 0.5”
𝐴 = 𝐿(𝐻 − 𝐻′) + 𝑑(𝐻′) +1
2(𝐿 − 𝑑)𝐻′ ( 1 )
A = 18H – 26.25
Since the total cross sectional area of the boot needs to contain the required
1000 cross sectional test tube areas, the boot height can be found as follows:
𝐴
𝜋 (1
2𝑑)
2 = 1000 ( 2 )
H = 12.37 12.5”

P a g e | 48
Since the test tube length is 2.25”, the width of the boot shall therefore be set at 2.3”. The final design dimensions of the boot shall therefore be 18” x 2.3” x 12.5”
on its highest side, and 18” x 2.3” x 9.5” on its shortest side. Table 5 lists the final
dimensions of the boot (dimensions in inches):
Table 5 – Boot Dimensions
Length (L) Width Height (H) Height (H’)18 Exit Width
18” 2.25” 12.5” 3” 0.5”
The boot shall be made from sheet metal so as to maintain durability, and be held within the interior brackets of the Doc Box enclosure so as to be removable for refilling while consistently lining up with the dispensing roller.
4.1.4.3 Dispensing Roller
Located directly beneath the exit slot of the boot, the dispensing roller shall
provide the means for discretely dispensing test tubes. As depicted in Figure 21,
the cross sectional depiction of the dispensing roller shall depict ¾ of a pie chart. The 90o cutout from the roller shall be the correct size for a single test tube to fall in to when the cutout is facing vertically upward; hence allow a single test tube to be dispensed by the time the roller spins 180o. Therefore, in order to provide enough space to collect a single test tube, the radius of the roller must at least be a minimum of 1.25 times the diameter of the test tube. Additionally, so as to prevent the potential sliding/popping out of the test tube before leaving the boot, the Dispensing Roller shall be either made from or contain a material that provides a tacky surface.
The roller shall be moved by means of the motor described in Section 4.1.4.6.
4.1.4.4 Dispensing Chute
Within this section, the Dispensing Chute shall additionally be referred to as the “Chute.”
The dispensing chute shall be located directly below the dispensing roller and shall act as a means for the dispensed test tubes to roll to the internal barcode scanner. The Chute shall be pivoted by a low torque motor on the initial landing end, and shall have a resting angle of 1.8 degrees below horizontal, which shall provide a ¼ inch vertical drop. The length of the dispensing chute shall be eight (8) inches, and shall end at Barcode Roller. Additionally, directly below the dispensing roller, the Chute shall have a contact switch that shall act as a means to verify that a test tube has been dispensed. These dimensions are shown in
Table 6.

P a g e | 49
Table 6 – Dispensing Chute Specifications
Length Chute Width System Width Height Lowering Angle
8” 2.3” 2.5” 0.25” 1.8o
The Barcode Roller is the second section of the dispensing chute, which shall rotate towards the dispensing chute when the test tube dispense verification switch is triggered. The barcode roller shall continue to roll until the barcode scanner retrieves the barcode from the test tube. The barcode roller shall have a 0.25 inch radius, and shall have a containing barrier directly above in order to prevent test tubes to pop over the roller.
Upon rolling the test tube, two possible outcomes may happen: the barcode is read, or the barcode is not read (due to manufacturing discrepancy). Therefore, the dispensing chute shall have a bidirectional pivoting function in which the test tube shall either be dispensed or discarded. Upon receiving the barcode verification signal, the dispensing chute motor shall pivot the chute down (counter clockwise) 4 degrees (0.56” vertical drop) so as to allow the test tube to be delivered to the tongue for customer retrieval. After completing the pivot, the dispensing chute shall pause for 0.5 seconds before returning to its initial position. Upon receiving the test tube faulty signal, the dispensing chute motor shall pivot the chute up (clockwise) 4 degrees so as to all the test tube to be
discarded in a bin. The layout for the dispensing chute can be seen in Figure 21,
and the control circuitry and software for the chute and roller motors can be seen in Section 4.1.2.
4.1.4.5 Dispenser Barcode Scanner
To provide a fast, yet accurate reading of the barcodes on the test tubes, the barcode scanner shall be capable of reading barcodes within the range of 0.25” to 2.25”.
4.1.4.6 Dispensing Motors
The motors used for the dispensing chute, dispensing wheel, and dispensing roller shall all be controlled by their own motors. All three components shall be driven by a Sayama 12SM-AT3 12 volt, 58 max RPM, DC brushed motor, as mentioned in Section 6.1. Due to the large voltage with respect to the microcontroller, each motor shall be driven by a motor control circuit that shall provide the means to supply the required voltage to rotate each motor in the required orientation and RPM. For both the dispensing and barcode scanning rollers, the driver circuits shall be variable so as to adjust the RPM of the roller shows the feedback voltage regulation circuit that shall supply to required voltage to the motors when turned on by the microcontroller switching circuit shown in Figure 24Error! Reference source not found..
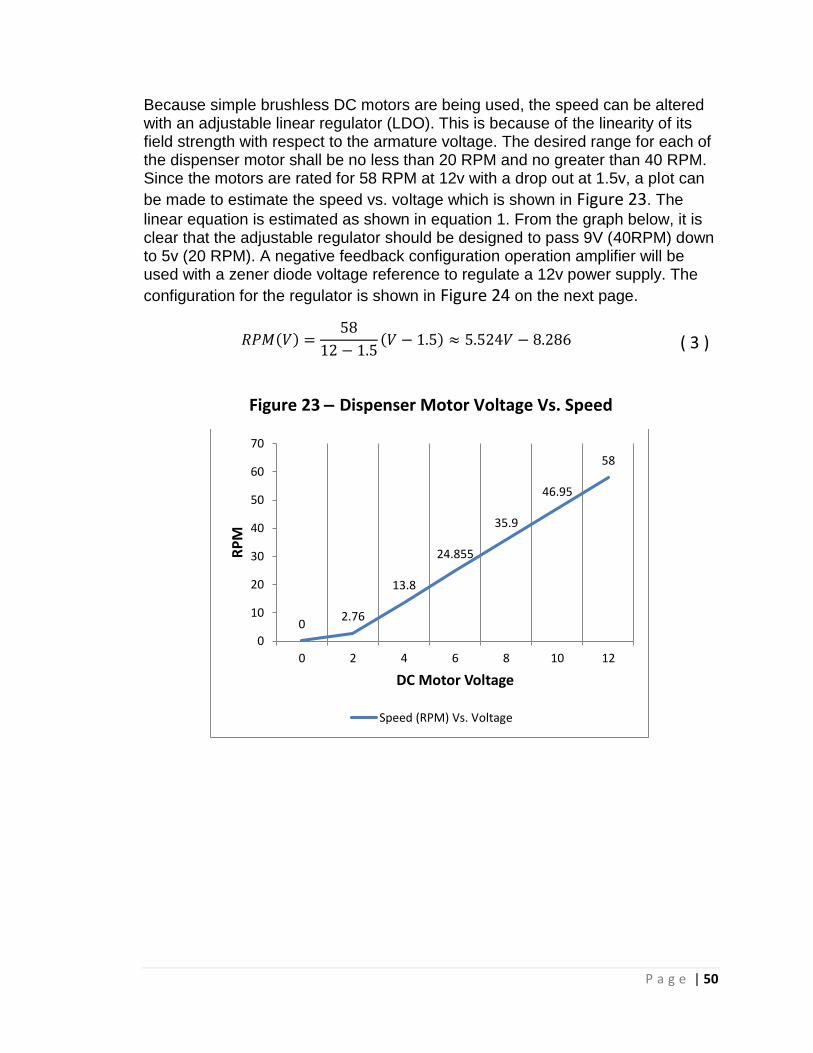
P a g e | 50
Because simple brushless DC motors are being used, the speed can be altered with an adjustable linear regulator (LDO). This is because of the linearity of its field strength with respect to the armature voltage. The desired range for each of the dispenser motor shall be no less than 20 RPM and no greater than 40 RPM. Since the motors are rated for 58 RPM at 12v with a drop out at 1.5v, a plot can
be made to estimate the speed vs. voltage which is shown in Figure 23. The
linear equation is estimated as shown in equation 1. From the graph below, it is clear that the adjustable regulator should be designed to pass 9V (40RPM) down to 5v (20 RPM). A negative feedback configuration operation amplifier will be used with a zener diode voltage reference to regulate a 12v power supply. The
configuration for the regulator is shown in Figure 24 on the next page.
𝑅𝑃𝑀(𝑉) =58
12 − 1.5(𝑉 − 1.5) ≈ 5.524𝑉 − 8.286 ( 3 )
Figure 23 – Dispenser Motor Voltage Vs. Speed
02.76
13.8
24.855
35.9
46.95
58
0
10
20
30
40
50
60
70
0 2 4 6 8 10 12
RP
M
DC Motor Voltage
Speed (RPM) Vs. Voltage

P a g e | 51
Figu
re 2
4 -
Ad
just
able
Lin
ear
Re
gula
tor
Sch
em
atic

P a g e | 52
As shown above, the op amp determines the current into the base of the Darlington pair. If the output voltage seen through the resistor divider network of R5 and Rv rises above the reference voltage, the amplified error restricts the current flow to the output load until equilibrium is reached. In order to set the voltage reference value, the zener diode must be reverse biased to the breakdown point with a sufficient current for stability. According to the Fairchild datasheet, the 1N4733A holds a steady 5.1v reverse bias when Iz = 49mA [28]. In order to provide this current, a 141Ω resistor Rz is placed between the 12v power supply and the cathode. Since the typical input bias current to the non-inverting terminal of the op amp is in the order of pA, the current through the
zener diode is given as: 𝑰𝒛 ≈𝟏𝟐−𝟓.𝟏
𝟏𝟒𝟏≈ 𝟒𝟗 𝒎𝑨. The output voltage is directly
determined by the voltage divider circuit composed of Rv and R5. Rv is a 10kΩ potentiometer which can be changed to adjust the output voltage. The output voltage expression is given in equation.
𝑉𝑟𝑒𝑓 = 𝑉𝑜
𝑅5
(𝑅5 + 𝑅𝑣) → 𝑉𝑜 = 𝑉𝑟𝑒𝑓 (
𝑅5 + 𝑅𝑣
𝑅5) ( 4 )
For the upper limit of 9V on the output, Rv is set to its maximum level of 10kΩ and equation (2) yields equation (3).
𝑽𝒐(𝒎𝒂𝒙) = 9 = 5.1 (𝑹𝟓 + 10𝐾Ω
𝑹𝟓) → 𝑅5 ≈ 13𝐾Ω ( 5 )
If the potentiometer is turned all the way down to zero, the output is driven to the reference voltage. This effect is shown in equation (4).
𝑽𝒐(𝒎𝒊𝒏) = 5.1 (𝑹𝟓 + 0Ω
𝑹𝟓) → 𝑽𝒐(𝒎𝒊𝒏) = 5.1 𝑉 ( 6 )
With the adjustable power supply designed, a control stage need to be built to
interface with the microcontroller board. This design is shown in Figure 25.
When the system signals for a motor rotation, the output stage of the microcontroller sends a signal sufficient to activate an opto-coupler. This allows current to flow from the regulator to R2 which biases the base of Q3. This is a Toshiba N-Channel MOSFET model number SSM6N36FE which can allow 100mA of current from drain to source with Vgs at 1.8V. [29] With the MOSFET on, the current can flow through the 600Ω motor coil to ground. The motor will rotate continuously and at a constant speed until the control signal goes low. When the motor is switched off, the electric field produced by the coil windings creates a reverse voltage as it collapses. The snubbing diode D1 acts to shunt

P a g e | 53
any back EMF from causing harm to the components. The complete list of
components used in this circuit are shown in Table 7.
Figure 25 – Dispenser Motor Driver Switching Circuit
Table 7 – Component Specifications for Motor Driver Switch Circuit
Component Motor R2 Rc Diode D1 MOSFET Q3 Opto-
Coupler
Value Sayama
12SM-AT3 500Ω 1KΩ 1N4446 SSM6N36FE MCT6
Unlike the two motors used for the dispensing and scanning rollers, the
dispensing chute shall be able to tilt both clockwise and counter clockwise; hence
a the circuit shown in
Figure 26 (with component values specified in Table 9), which utilizes a ST
Microelectronics L298 Dual Bridge Motor Driver, that will allow the state of the
motor to be changed by the two logic pins (pin 5 and 7). The enable input for the
L298 is located on pin 6, and, for component efficiency/durability, shall not be
permanently enabled, but enabled by the microcontroller. Therefore, a total of
three I/O pins to connect to the microcontroller shall be required. Table 8 shows
the truth table for the logic pins, and the corresponding motor state, given that
the enable input is high. For this circuit, the high signal shall be the same as for
the dispenser driver circuit (5V), and the low being 0v.

P a g e | 54
Table 8 – L298 Logic Input Truth Table (High = 5 v ; Low = 0v)
Dir 1 (Pin 5) Dir 2 (Pin 7) Motor State
High Low Clockwise
Low High Counter Clockwise
Low Low Hold
High High Hold
Figure 26 – Tilt Motor Driver Circuit
Tilt Motor
9 8 4
1
2
3
MSP I/O
MSP I/O
7
6
5
L298Dual Bridge Motor Driver
Vss Vs
C C
MSP I/O
Table 9 – Component Specifications for Tilt Motor Circuit
Component C (F) R (Ω) Re (Ω)
Value 0.1x10⁻⁶ 1 x10³ 2x10³
Pin 1 2 3 4 5 6 7 8 9
Function Sense +Vmotor -Vmotor Vs = Vmotor Dir1 Enable Dir2 Ground Vlogic
4.1.4.7 Dispenser Sensors Within the dispenser, there is one specific style of sensor used for two different applications. The sensor is an optical sensor that utilizes a Vertical Cavity Surface Emitting Laser (VCSEL) to turn on a phototransistor; changes in the state of the transistor current shall be sensed by the microcontroller. The components used for the photo detection are the OPV332 VCSEL which typically emits a laser light of wavelength 860nm and the OFT-5301 Phototransistor, which has a spectral sensitivity of 80% for the range of wavelengths from 700nm to 1000nm. These two elements are both used within the photo sensor circuit
shown in Figure 27, with each element described in Table 10.

P a g e | 55
Figure 27 – Photo Detection Circuit
Table 10 – Component Specification for Detection Circuit
Component R1 R2 Laser Diode Phototransistor
Value/Model 500Ω 2.5x10³ Ω OPV332 OFT-5301
Effective Wavelength -- -- 860nm 700nm – 1000nm
The resistor values chosen are based off of the current-voltage specifications for
the OPV332 and OFT-5301. The OPV332 has a typical forward current of 7mA
and maximum forward voltage of 2.2V; similarly, the OFT-5301 holds a collector-
emitter saturation voltage of 0.3V at a current of 2mA.
The detection circuit in Figure 27 is used for both the boot capacity sensor, so as
to detect when the number of stored test tubes is below minimum amount. The detection of the capacity shall be when the laser enables the OFT-5301, which shall alert the microcontroller, which shall alert the CPU, which shall send a maintenance request to a cloud. Similarly, the same circuit shall be used for a test tube dispense verification, in which the laser light shall always be in contact with the OFT-5301, the beam shall be directly below the dispensing wheel. When a test tube is dispensed, the light beam shall be broken, which shall then be interpreted by the microcontroller as a successful dispensing of a test tube.
These configurations can be seen in the dispenser diagram in Figure 21.
4.1.5 Bag Dispenser
The bag dispenser subsystem consists of multiple circuits that will be explained in this section. While highly mechanically functional in design, these aspects, though important, will only be touched on since the focus of this project is on the electrical components of the system.
4.1.5.1 Lock
The plastic bags are stored in a compartment secured by a locked hatch. The lock is made of a steel bolt that sits within a catch when the hatch is closed and is able to actuate out of the catch via a linear pull type solenoid allowing the

P a g e | 56
hatch door to open freely (refer to Figure 50 for an illustration). This solenoid
when not powered is normally extended and is electrically controlled by the microcontroller – a logical “1” (high) will be assigned to the actuating, or unlocking, operation and a logical “0” (low) will be associated to the extended armature, or locked, position. After a test tube has been dispensed and the saliva sample is ready to be returned, the user will be prompted by the interface to input the command to unlock the dispenser hatch in order to retrieve a bag. The microcontroller will be programmed to send a 1- signal to the solenoid that will unlock the hatch for 20-30 seconds – long enough for one to procure a bag from the compartment (testing will be conducted to gauge an appropriate time limit which is subjective). Figure 28 illustrates the circuit that will drive the solenoid. The 0-3.3 volt source is the signal from the microcontroller. When driven high to 3.3 volts, the NPN bipolar transistor is “switched” on and allows current to flow through the collector terminal which powers the solenoid (represented by R3). The voltage supplied to the solenoid is based on the collector voltage (V1) and is very close to its value. An LED is placed in parallel with the solenoid and will indicate when the door is unlocked (on). Since the solenoid is essentially an inductor, the diode D1 in series with the LED aids in the function as a flywheel diode in order to dissipate power and protect the transistor from residual energy stored in the solenoid which can be damaging. After the hatch has been unlocked for the allotted time, the user will be prompted with the option to continue the service process or request more time to obtain a bag. If more time is requested, the solenoid will actuate and the hatch will be unlocked for an additional 15-20 seconds. This process will repeat until the continue option is selected. The flow diagram shown
in Figure 29 illustrates this process.
Figure 28 - Locking Circuit
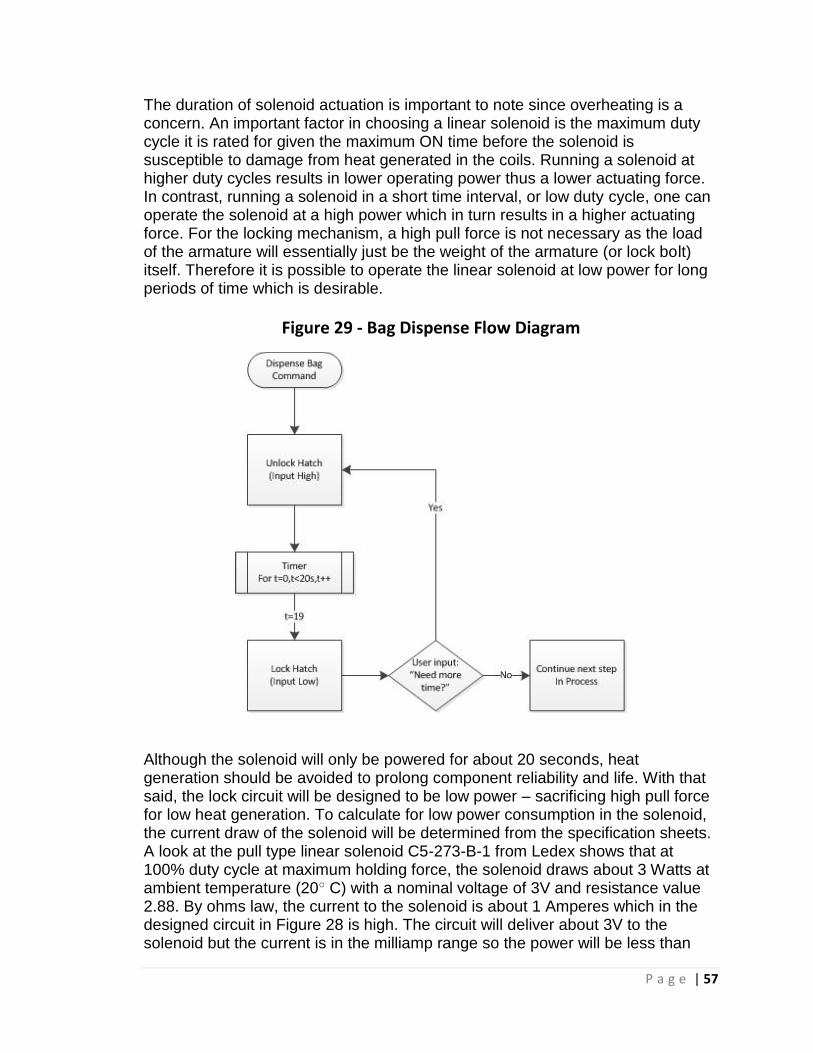
P a g e | 57
The duration of solenoid actuation is important to note since overheating is a concern. An important factor in choosing a linear solenoid is the maximum duty cycle it is rated for given the maximum ON time before the solenoid is susceptible to damage from heat generated in the coils. Running a solenoid at higher duty cycles results in lower operating power thus a lower actuating force. In contrast, running a solenoid in a short time interval, or low duty cycle, one can operate the solenoid at a high power which in turn results in a higher actuating force. For the locking mechanism, a high pull force is not necessary as the load of the armature will essentially just be the weight of the armature (or lock bolt) itself. Therefore it is possible to operate the linear solenoid at low power for long periods of time which is desirable.
Figure 29 - Bag Dispense Flow Diagram
Although the solenoid will only be powered for about 20 seconds, heat generation should be avoided to prolong component reliability and life. With that said, the lock circuit will be designed to be low power – sacrificing high pull force for low heat generation. To calculate for low power consumption in the solenoid, the current draw of the solenoid will be determined from the specification sheets. A look at the pull type linear solenoid C5-273-B-1 from Ledex shows that at 100% duty cycle at maximum holding force, the solenoid draws about 3 Watts at ambient temperature (20 C) with a nominal voltage of 3V and resistance value 2.88. By ohms law, the current to the solenoid is about 1 Amperes which in the designed circuit in Figure 28 is high. The circuit will deliver about 3V to the solenoid but the current is in the milliamp range so the power will be less than
P a g e | 58
3W. Testing of the solenoid will be conducted to determine if the power delivered is sufficient enough to actuate the bolt. If not, the circuit design must be tweaked to increase the current delivered to the load. A Darlington transistor may be used to amplify the current.
4.1.5.2 Bag Supply Sensor
The bag supply will be monitored by a system that measures the position of a mechanical actuation (spring loaded plate). For a visual of this system, refer to Figure 52. As bags are taken out of the dispenser, the spring loaded plate slowly advances - pushing the stack of bags towards the opening of the compartment. An extending rib attached to the spring plate will travel along the underside of the dispenser and physically trip strategically placed momentary - normally open switches as the plate advances. The dispensing track is estimated to be about 11 inches (279.4mm) long having one switch placed 1.65 inches from the stop plate and another switch placed underneath the stop plate at the 11 inch mark. These switches indicate when the bag supply is at 15% and when the supply is completely depleted, respectively. Figure 30 illustrates a designed filter for the supply sensor. Switch 1 corresponds to the 15% supply sensor and switch 2 corresponds to the empty supply sensor. At the end of service, the microcontroller will send a 3.3V pulse to the circuit depicted in Figure 30 as V2. As the supply runs low, switch S1 is closed and the NPN BJT is turned on delivering current to R3 and R4. The collector voltage is divided among the two resistors and output Vo =R3*V1/(R3+R4). If R3 equals R4, the output voltage is roughly half of the collector supply voltage. Once the bag supply is completely depleted, switch S2 is closed and shorts R4. Thus the supply voltage is no longer divided and appears entirely on output Vo. The output is connected to a pin on the microcontroller where the analog signal is converted to a digital value. The microcontroller then computes the read in voltage value and compares it to a programmed value that corresponds to either low bag supply voltage (when S1 is closed) or no bags remain voltage (when S1 and S2 is closed).

P a g e | 59
Figure 30 - Bag Supply Sensor Circuit
If S1 is open indicating bag supply is in good standing, the read in voltage is close to zero - less than low bag supply voltage. Therefore no flags are raised and operation runs as normal. If the voltage is above the low supply voltage Vlo but under the empty supply voltage Vemp, low bag supply is flagged. Finally, if the voltage is at or above V0, the empty bag supply is flagged and any operation is ceased thereafter.
4.1.6 Collector Once a user has deposited their saliva sample into a provided test tube, the next step is to return it to Doc Box where it will await authorized transportation to the testing facility. The subsystem which handles this return process is called the collector.
4.1.6.1 Order of Operations
In order to visualize the role of the collector, a high level order of operations is
listed below and further depicted in Figure 31.
1. Pull-out doors for the return chute and bag dispenser unlock.
2. The internal return sensor scans the bottom of the chute and
notifies the system when a return is made.
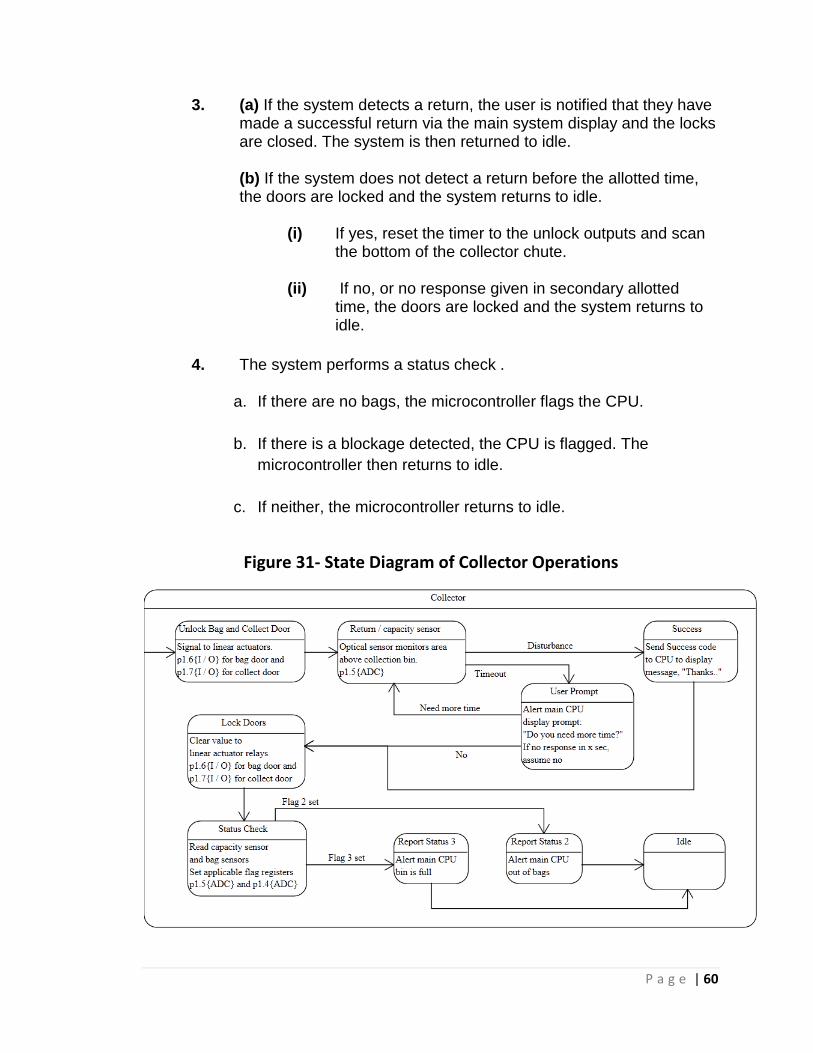
P a g e | 60
3. (a) If the system detects a return, the user is notified that they have made a successful return via the main system display and the locks are closed. The system is then returned to idle. (b) If the system does not detect a return before the allotted time, the doors are locked and the system returns to idle.
(i) If yes, reset the timer to the unlock outputs and scan the bottom of the collector chute.
(ii) If no, or no response given in secondary allotted time, the doors are locked and the system returns to idle.
4. The system performs a status check .
a. If there are no bags, the microcontroller flags the CPU.
b. If there is a blockage detected, the CPU is flagged. The
microcontroller then returns to idle.
c. If neither, the microcontroller returns to idle.
Figure 31- State Diagram of Collector Operations
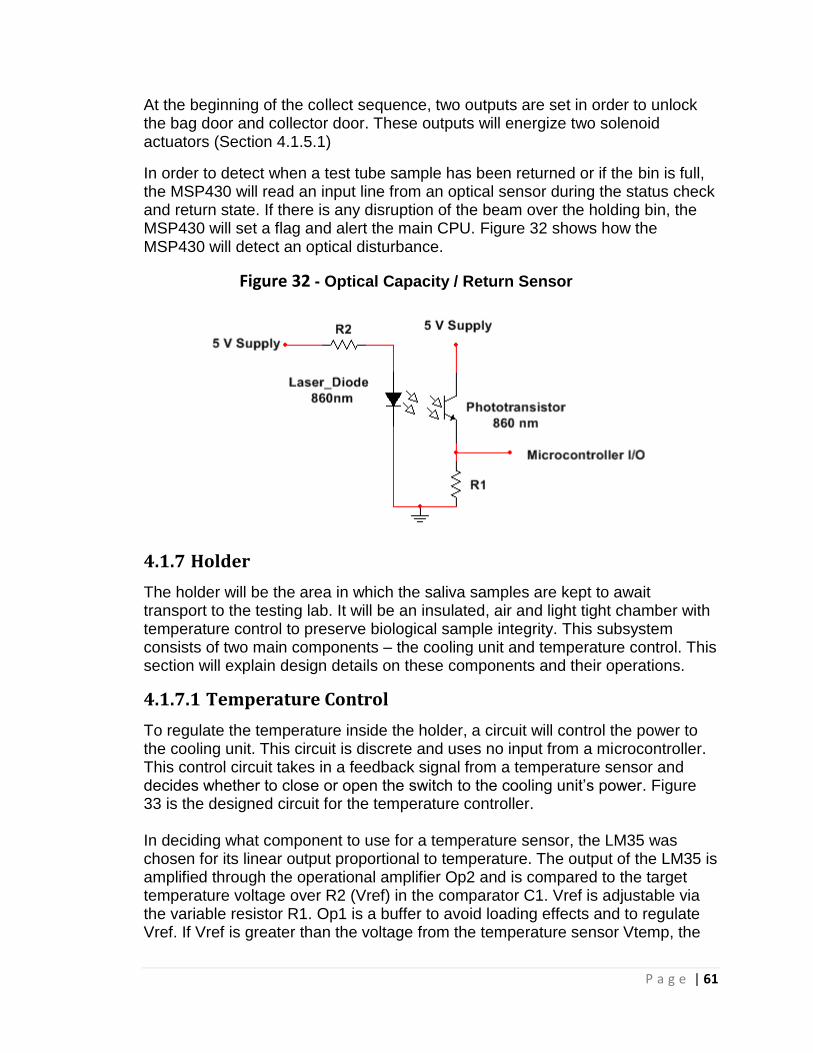
P a g e | 61
At the beginning of the collect sequence, two outputs are set in order to unlock the bag door and collector door. These outputs will energize two solenoid actuators (Section 4.1.5.1)
In order to detect when a test tube sample has been returned or if the bin is full, the MSP430 will read an input line from an optical sensor during the status check and return state. If there is any disruption of the beam over the holding bin, the MSP430 will set a flag and alert the main CPU. Figure 32 shows how the MSP430 will detect an optical disturbance.
Figure 32 - Optical Capacity / Return Sensor
4.1.7 Holder
The holder will be the area in which the saliva samples are kept to await transport to the testing lab. It will be an insulated, air and light tight chamber with temperature control to preserve biological sample integrity. This subsystem consists of two main components – the cooling unit and temperature control. This section will explain design details on these components and their operations.
4.1.7.1 Temperature Control
To regulate the temperature inside the holder, a circuit will control the power to the cooling unit. This circuit is discrete and uses no input from a microcontroller. This control circuit takes in a feedback signal from a temperature sensor and decides whether to close or open the switch to the cooling unit’s power. Figure 33 is the designed circuit for the temperature controller. In deciding what component to use for a temperature sensor, the LM35 was chosen for its linear output proportional to temperature. The output of the LM35 is amplified through the operational amplifier Op2 and is compared to the target temperature voltage over R2 (Vref) in the comparator C1. Vref is adjustable via the variable resistor R1. Op1 is a buffer to avoid loading effects and to regulate Vref. If Vref is greater than the voltage from the temperature sensor Vtemp, the
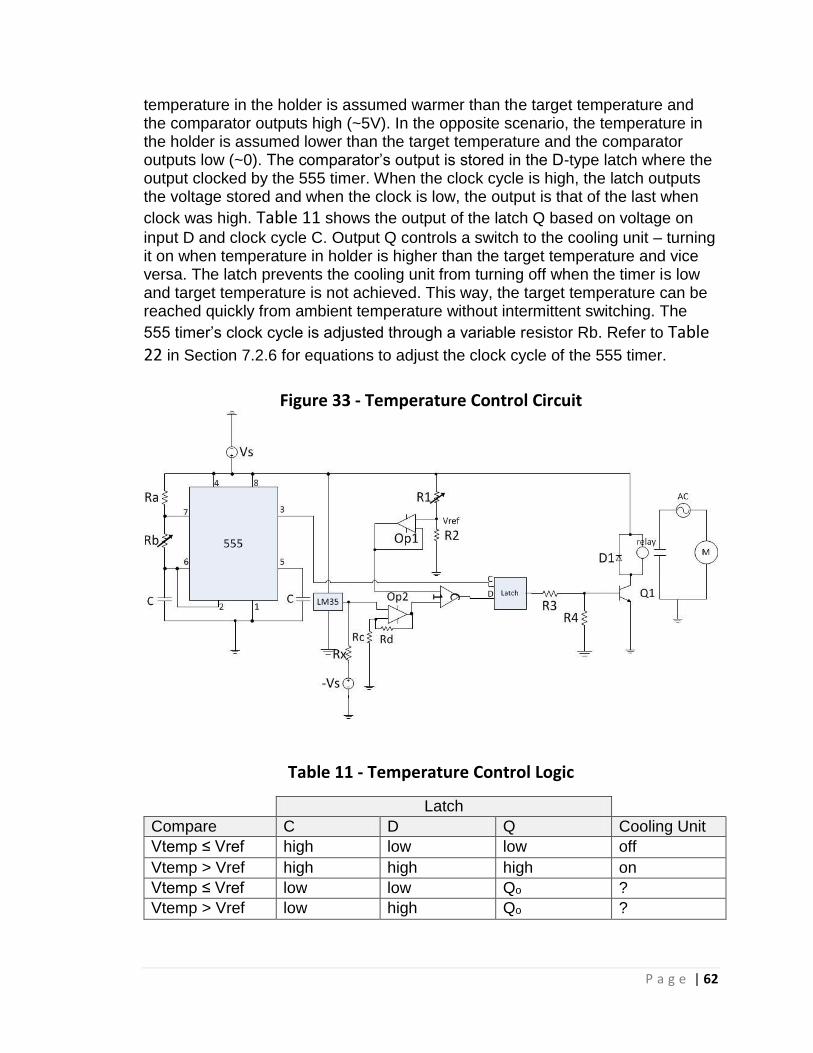
P a g e | 62
temperature in the holder is assumed warmer than the target temperature and the comparator outputs high (~5V). In the opposite scenario, the temperature in the holder is assumed lower than the target temperature and the comparator outputs low (~0). The comparator’s output is stored in the D-type latch where the output clocked by the 555 timer. When the clock cycle is high, the latch outputs the voltage stored and when the clock is low, the output is that of the last when
clock was high. Table 11 shows the output of the latch Q based on voltage on
input D and clock cycle C. Output Q controls a switch to the cooling unit – turning it on when temperature in holder is higher than the target temperature and vice versa. The latch prevents the cooling unit from turning off when the timer is low and target temperature is not achieved. This way, the target temperature can be reached quickly from ambient temperature without intermittent switching. The
555 timer’s clock cycle is adjusted through a variable resistor Rb. Refer to Table 22 in Section 7.2.6 for equations to adjust the clock cycle of the 555 timer.
Figure 33 - Temperature Control Circuit
Table 11 - Temperature Control Logic
Latch
Compare C D Q Cooling Unit
Vtemp ≤ Vref high low low off
Vtemp > Vref high high high on
Vtemp ≤ Vref low low Qo ?
Vtemp > Vref low high Qo ?

P a g e | 63
4.1.7.2 Cooling Unit
The cooling unit will be that to a small home refrigerator. It will consist of a compressor to pump refrigerant liquid through series of tubes that allow the refrigerant to absorb heat in one place and expel it in another. The temperature controller will signal this cooling unit to either turn on when temperature is outside the desired range or turn off when the temperature is in the target range. The objective for the cooling unit is to have enough cooling capacity to able to cool the holder to the target temperature in a reasonable amount of time and be rugged enough to withstand intermittent switching. Another important factor to note is the current draw of the cooling unit – more specifically the compressor motor. To size for the compressor, the area it has to cool is observed. The cooling area will be about 20in x 20in x 54in or about 21600 cubic inches of space the cooling unit has to cool. This is the size of a small miniature refrigerator so a similar compressor of a mini-fridge will be used. A goal for this compressor is to be reliable and not have to be serviced often. There are a couple types of compressors available on the market but the most attractive option for the Doc Box application is the hermetic type compressor which is commonly found in home refrigerators. A hermetic compressor houses the compressing mechanisms and the driving motor in the same unit. This prevents leakage of oils and refrigerant but sacrifices the ability to be opened and serviced. The compressor will be AC powered by the mains at 115V-120V. Based on the spec sheet of the compressor chosen, circuitry will be designed to ensure the compressor is receiving proper power. Also, a GFCI on the cable to the mains power will be considered to protect against potentially dangerous ground faults as this device draws the most power. It is desired to specify a compressor that will have enough cooling capacity to cool the holding area from room temperature of about 70°F to the target temperature of about 38°F in less than 5 minutes running at full capacity. The compressor may also feature thermal protection in which if the compressor is running too long and reaches a threshold temperature, the compressor motor will shut off until the compressor is at operational temperature again. If not included, a thermal circuit breaker will be used in order to protect the motor. This is in case of the event in which the temperature sensor fails or the access door of the holder is accidently left open which would cause the compressor to run continuously. Though the temperature control will have circuitry to prevent the motor to run if the temperature sensor reads zero, any way to protect the compressor will be employed as it is an expensive component to replace.

P a g e | 64
4.1.8 Microcontroller
4.1.8.1 Microcontroller and Circuit Board Design
The microcontroller selected will interface to the test tube dispenser, collector, and bag dispenser subsystems as well as the main CPU. In this section, a microcontroller is chosen based on the system hardware specifications and the embedded circuit boards are designed.
4.1.8.2 Choosing a Microcontroller
With the hardware details described, a microcontroller can be chosen that will accommodate the necessary I/O, analog to digital conversions, and serial
protocol. Table 12 shows the peripheral hardware that will connect to the
microcontroller and the requirements for each interface. Based on the requirements shown below, the Texas Instruments mixed-signal microcontroller MSP430G2553 28-pin package has been selected. This allows an addition 8 I/O should the design need modification.
Table 12 - Microcontroller Requirements
Component I/O Function(s) Pins Needed
Dispenser Wheel Motor General Output 1
Vend Sensor Analog to Digital
Conversion 1
Roller Motor General Output 1
Scan Enable Relay General Output 1
Tilt Motor General Output 3
Bag Unlock Solenoid General Output 1
Collector Unlock Solenoid
General Output 1
Bag Quantity Sensor Analog to Digital
Conversion 1
Test Tube Quantity Sensor
Analog to Digital Conversion
1
Return / Capacity Sensor
Analog to Digital Conversion
1
RS-232 Serial Interface Line Driver
Universal Serial Communication Interface
2
Total Number of General I/O Pins: 8

P a g e | 65
Total Number of Analog to Digital Capable Pins: 4
Total Number of Serial Communication Pins: 2
Total I/O: 14
4.1.8.3 Microcontroller Circuit Design
The MSP430 will be connected with the components that drive the I/O and serial interface as well as the power supply and noise filters. However, before all of the components are connected, the power needs must first be analyzed. Each part has a finite range of operation parameters such as input/output current, input/output voltage, transient load ratings, frequency response, voltage surge performance etc. Considering these restraints will allow the appropriate power components to be selected. The microcontroller requires the most precision with regard to electrical interfacing therefore its specifications are examined first. Table 13 outlines the critical electrical parameters of the MSP430. From the data shown below, an initial power diagram is created as shown in Figure 34.
Table 13 - MSP430G2553 Electrical Characteristics [30]
Description Min. Typical Max. Unit
Supply voltage for full operation: Vcc 2.2 3.6 V
Supply voltage: Vss 0 V
System clock frequency when Vcc = 3
14 MHz
Absolute max voltage applied at Vcc to Vss
-0.3 to
4.1 V
Absolute max voltage applied at any pin
-0.3 to
Vcc+0.3 V
Analog input voltage: Vax 0 Vcc V
High level output voltage: VOH when IOH(max) = -6 mA and Vcc = 3
Vcc-0.3 V
Low level output voltage: VOL when IOL(max) = 6 mA and Vcc = 3
Vss+0.3 V
Max total current for all outputs to hold voltage drop Vcc-0.3 and
Vss+0.3 49 mA
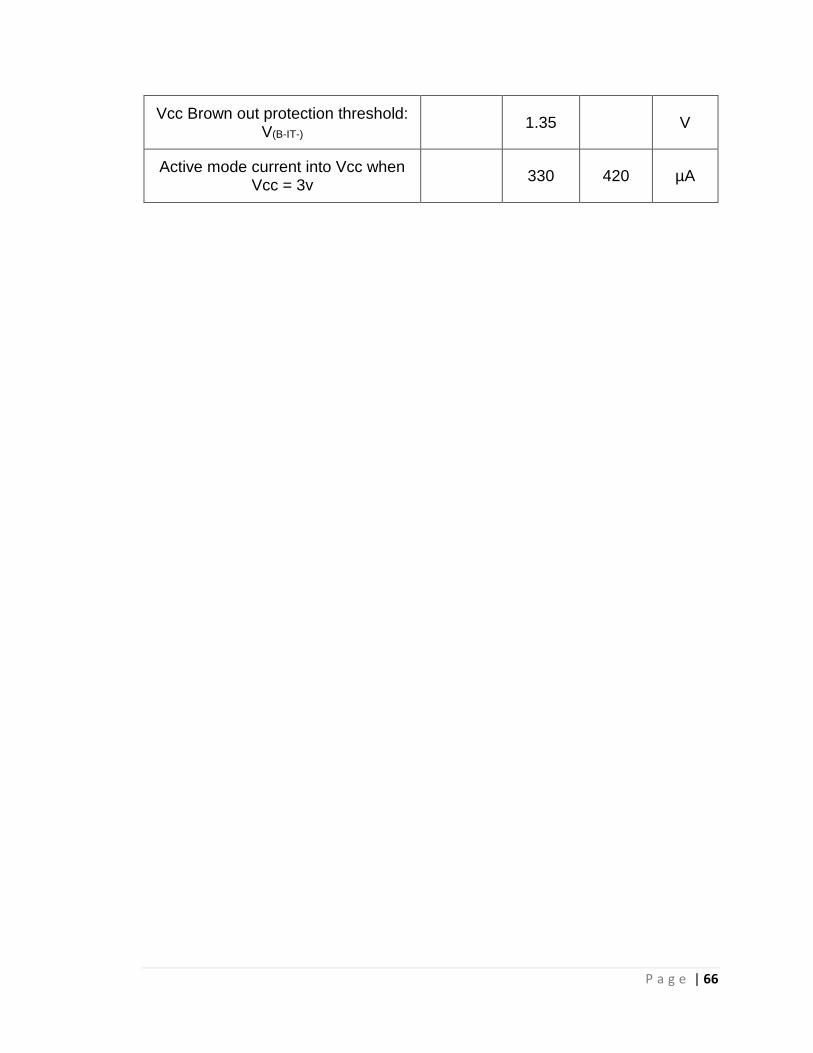
P a g e | 66
Vcc Brown out protection threshold: V(B-IT-)
1.35 V
Active mode current into Vcc when Vcc = 3v
330 420 µA
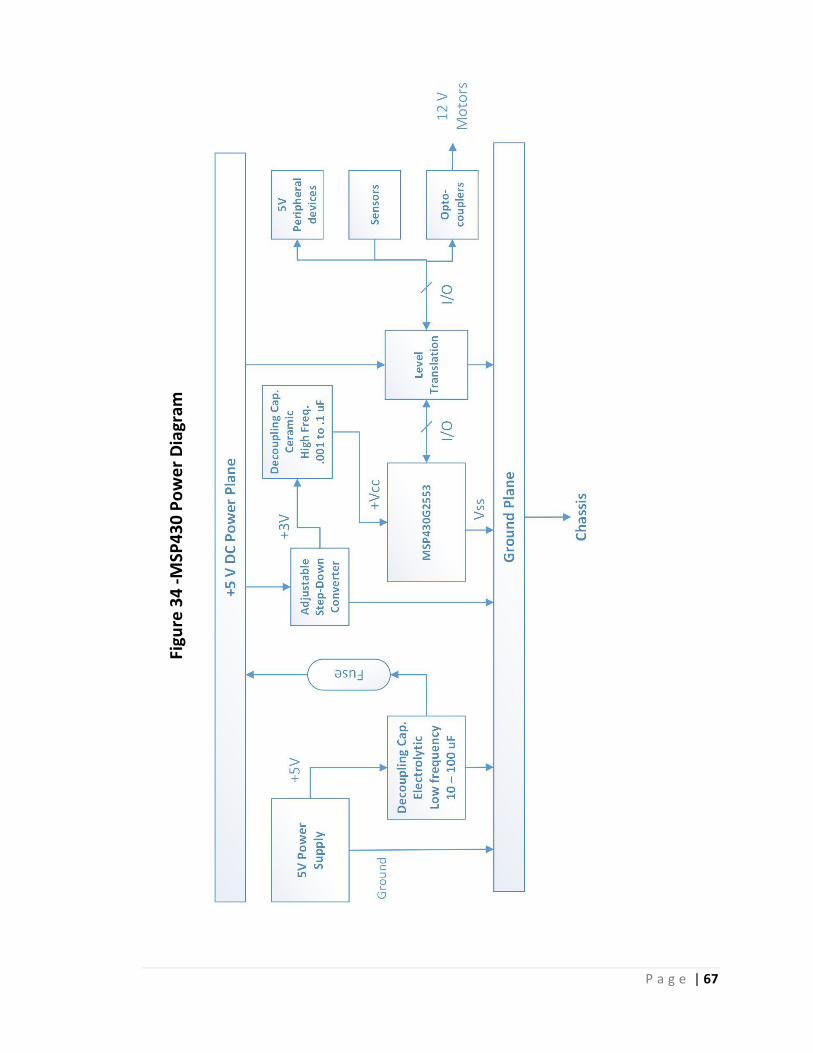
P a g e | 67
Figu
re 3
4 -
MSP
43
0 P
ow
er
Dia
gram

P a g e | 68
In order to provide smooth power to the circuit, a decoupling capacitor will be used to supply voltage should there be a sudden drop in power. The capacitor
value can be determined from the equation 𝐼 = 𝐶𝑑𝑉
𝑑𝑡 which can be written as 𝐶 =
𝐼𝑑𝑡
𝑑𝑉. In this equation, I is the maximum current draw, dt is the rise time, and dV is
the maximum allowed voltage ripple. For dV = 10mV, dt = 1µs, and I = 1A, the capacitance C = 100µF. To power the MSP430, a 60% efficient regulator will take in 5v from the board power and output 3v. Since 60% efficiency pushes the limit of linear regulators, the Texas Instruments TPS6200 adjustable step-down converter will be used. The chip configuration is shown in Figure 35.
Figure 35 - Adjustable Step-Down Converter Configuration
The voltage out of pin SW is a square wave with peak amplitude determined by the resistor divider network and the internal feedback regulation voltage (Vf). The signal then passes through a low pass filter in order to provide the DC output
voltage. The output is set by equation (7)
𝑉0 = 𝑉𝑓 (𝑅1
𝑅2+ 1) (7)
According to the datasheet, Vf = 0.5V. The desired output can be calculated as
shown in Equation (8).
3 = 0.5 (𝑅1
𝑅2+ 1) → 5 =
𝑅1
𝑅2 → 𝑅1 = 5𝑅2. (8)
If the output voltage deviates from the set value, the error adjusts the duty cycle by PWM. The output voltage ripple can be minimized by choosing appropriate
values for L1 and C2. Figure 36 shows the inductor current as a function of time
TPS6200

P a g e | 69
and duty cycle. The ripple voltage 𝛥𝑉𝐶2 across the capacitor C2 is determined by the ripple current in the inductor 𝛥𝑖𝐿1 minus the DC current load. An expression
can be made to relate 𝛥𝑖𝐿1 and 𝛥𝑉𝐶2 as shown in Equation (24) and Equation (9).
𝑉𝐿1(𝑡) = 𝑉𝑖𝑛 − 𝑉𝑜 = 𝐿𝑑𝑖𝐿1(𝑡)
𝑑𝑡 → ∫ 𝑖𝐿1(𝑡)𝑑𝑡
𝑖𝑡
𝑖0
= (10)
∫ (𝑉𝑖𝑛 − 𝑉𝑜
𝐿) 𝑑𝑡 → 𝑖𝐿1(𝑡) =
𝑉𝑖𝑛 − 𝑉𝑜
𝐿
𝑡
0
𝑡 + 𝑖0. (11)
If 𝑖0 represents the minimum inductor current, the total change in current can be expressed as the peak current minus 𝑖0. This expression is found in Equation
(12).
𝛥𝑖𝐿1 = 𝑖𝐿1(𝐷𝑢𝑡𝑦 𝐶𝑦𝑐𝑙𝑒 ∗ 𝑇𝑠) − 𝑖0 → 𝛥𝑖𝐿1 = (𝑉𝑖𝑛 − 𝑉𝑜
𝐿𝑓𝑠) ∗ 𝐷𝑢𝑡𝑦 𝐶𝑦𝑐𝑙𝑒 (13)
Figure 36 - Inductor Current vs. Time
The capacitor C2 acts as a low impedance path to ground for this ripple current and passes most of the DC component to the load. The ripple voltage can be
found by applying the capacitor charge equation 𝑄 = 𝐶 ∗ 𝑉 and the total charge theorem. Figure 37 shows that the current through the capacitor only contains the alternating component of the inductor current such that 𝑖𝐶2(𝑡) = 𝑖𝐿1(𝑡) − 𝐼𝐷𝐶 .
The expression for 𝛥𝑉 is found in Equation (14) and Equation (15)

P a g e | 70
𝐶 ∗ 𝛥𝑉 = 𝑄, 𝑞 =𝛥𝑖𝐿1
2∗
𝑇𝑠
2∗
1
2 → 𝛥𝑉 =
𝛥𝑖𝐿1
8𝐶2 ∗ 𝑓𝑠. (16)
From here, the output ripple voltage can be expressed in terms of the input voltage, desired output voltage, inductance, switching frequency, duty cycle and capacitance as follows:
𝛥𝑉 =(𝑉𝑖 − 𝑉0) ∗ 𝐷𝑢𝑡𝑦 𝐶𝑦𝑐𝑙𝑒
𝐿 ∗ 𝑓𝑠 ∗ 8𝐶2 ∗ 𝑓𝑠 (17)
Figure 37 - Capacitor Current vs. Time
With the equations derived, values can be picked for L1, C1, C2, R1, R2 and RL.
The output voltage is set to 3v by 𝑅1 = 25𝑘Ω and 𝑅2 = 5𝑘Ω which results in a
duty cycle of: 𝐷 =𝑉𝑜
𝑉𝑖𝑛𝑥 100% = 60%. If RL is set to 20Ω, and the input resistance
of the MSP430 is >10MΩ then there will be approximately ≈ 3
20= 150 𝑚𝐴 of DC
current draw from Vo. This is assuming the majority of the current dissipated
through the RL since the MSP430 will only consume about 𝑛𝑜𝑚+𝑚𝑎𝑥
2≈ 375 µ𝐴 on
average. According to the datasheet for the TPS6200, the ripple current 𝛥𝑖𝐿1 should be around 20% of the DC load current which is about 30 𝑚𝐴 peak-to-peak. The expression for 𝛥𝑖𝐿1 can be rearranged to find 𝐿1 as shown in Equation
(18).
𝐿1 = (𝑉𝑖𝑛 − 𝑉𝑜
𝛥𝑖𝐿1 ∗ 𝑓𝑠∗ 𝐷𝑢𝑡𝑦 𝐶𝑦𝑐𝑙𝑒) = (
5 − 3
0.03 ∗ 1𝑀𝐻𝑧∗ 0.6) = 40µ𝐻 (19)
Now the last parameter needed to calculate the output voltage ripple is capacitor C2. According to the datasheet, a good output voltage ripple is 1% of the steady-
state. For an output of 3v, 𝛥𝑉𝑂 ≈ 30 𝑚𝑉𝑝𝑝. Referring to Equation (20), the value
for C2 can be found as shown in Equation (21).
0

P a g e | 71
𝐶2 =(𝑉𝑖 − 𝑉0) ∗ 𝐷𝑢𝑡𝑦 𝐶𝑦𝑐𝑙𝑒
𝐿 ∗ 𝑓𝑠 ∗ 8𝛥𝑉 ∗ 𝑓𝑠
=(5 − 3) ∗ 0.6
0.00004 ∗ 1𝑀𝐻𝑧 ∗ 8 ∗ 0.03 ∗ 1𝑀𝐻𝑧 = 0.125µ𝐹 (22)
With the MSP430 properly powered, the peripheral devices can be connected. There are 8 pins on the chip that are designated for driving an output. Because the MSP430 is current limited to 6mA per pin and will be interfacing with higher voltage components, a level translator will be deigned to drive the higher power outputs. Figure 38 on the next page shows a 2.7v to 5v general purpose level shifter. The principle concept is using NPN transistor switching to drive a positive logic scheme with a very small input signal. When the base of Q1 is driven high to the point of saturation, the base voltage of Q2 drops below the turn on voltage and drives Q2 into cut-off mode. This causes the output of V02 to go to Vcc. If Q1 is driven low, the base of Q2 is saturated and causes V02 to drive low. The base resistor value Rb1 allows only a few µA of current draw from the MSP430.
Figure 38 – General Purpose Output Buffer / Level Shifter
The pins that will be controlling the 12V motors, a special form of this circuit will be implemented as shown in Figure 39. This device allows for separation of the ground planes between the clean logic power and the noisy brushed motor power. This decoupling method is preventative against unpredictable embedded software malfunction. This opto-coupler is defined in the Dispenser Motor section. When Q1 is driven on, Q2 is off. This causes a voltage division across the LED side of the opto-coupler. The resistance and forward voltage drop have been considered to ensure 20mA of current flow through the LED.
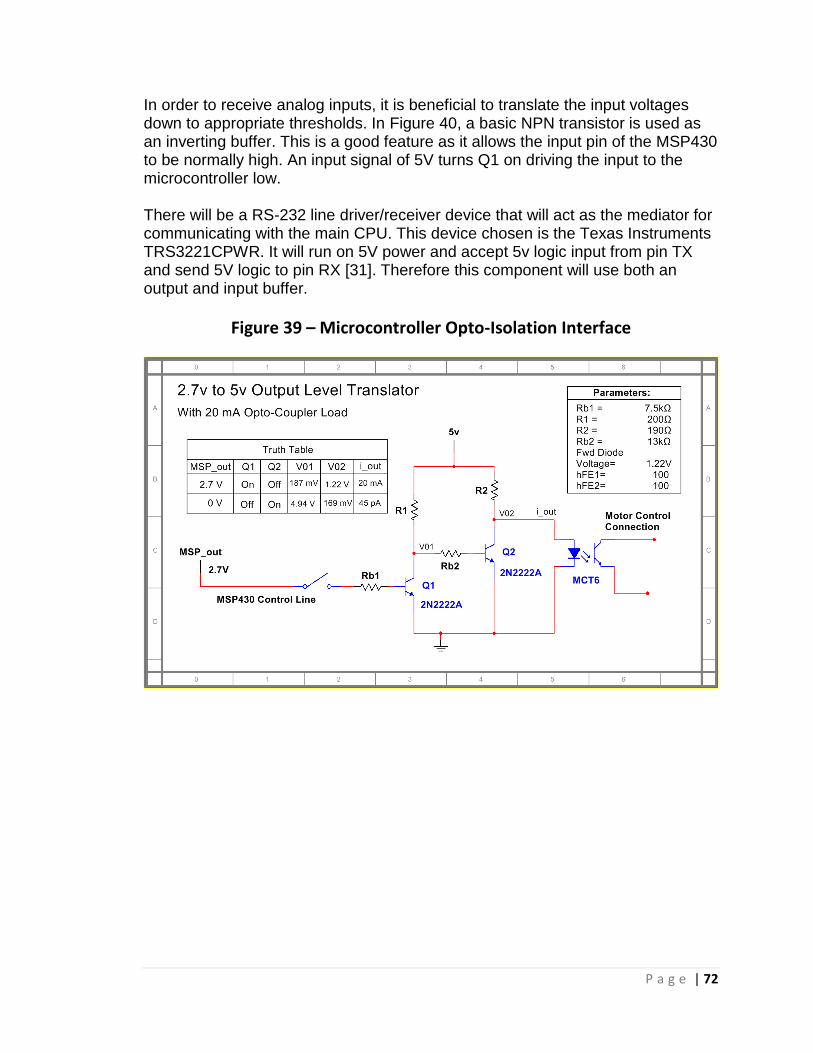
P a g e | 72
In order to receive analog inputs, it is beneficial to translate the input voltages down to appropriate thresholds. In Figure 40, a basic NPN transistor is used as an inverting buffer. This is a good feature as it allows the input pin of the MSP430 to be normally high. An input signal of 5V turns Q1 on driving the input to the microcontroller low. There will be a RS-232 line driver/receiver device that will act as the mediator for communicating with the main CPU. This device chosen is the Texas Instruments TRS3221CPWR. It will run on 5V power and accept 5v logic input from pin TX and send 5V logic to pin RX [31]. Therefore this component will use both an output and input buffer.
Figure 39 – Microcontroller Opto-Isolation Interface

P a g e | 73
Figure 40 – Microcontroller 5v to 3v Input Buffer
4.1.9 PCB Design
As discussed earlier in Section 4.1, there is specific circuitry required for the microcontroller, switches, and motors; although the development environment for such circuits will utilize breadboards and other means of being able to tweak circuitry, the final design shall have a Printed Circuit Board (PCB). The purpose of the PCB shall be mainly for greater reliability, in that each of the leads are isolated from each other, and each of the circuit components shall be firmly soldered to board for a longer lasting quality.
The design of the PCB was compiled using Computer-Aided Design (CAD) software. The formulating of PCB’s presents multiple design challenges such as: trace width, trace spacing, layers, component packages, and component placement. These few considerations are by far not all that present a challenge in the design; however, they shall be discussed about most in the design detail.
Trace Width: The main consideration with trace width is to be able to effectively provide the correct amount of copper to supply a given amount of current. Since the maximum current required for the components on the circuit shall be for the motor drivers, this current shall therefore be the limiting factor. Since the motors specified in Section 4.1.4.6 require greater than 130mA but less than 170mA, the design for the board utilized traces greater than 10 mils but less than 16 mils. With such trace thickness, the traces of the dispenser PCB shall sufficiently

P a g e | 74
support the required current draw of the motors, sensors, and controllers without causing any melting or burning.
Trace Spacing: With respect to the trace spacing, considerations of electromagnetic interference/coupling are taken into account by the CAD software to minimize the likelihood of unwanted electrical interference from other traces or components on the board. For the given current requirements, the software used allots space on either size of the trace that is of equal thickness of the trace as “neutral zone.” Hence, in the context of the dispenser PCB, the minimal trace spacing shall be 20 mils.
Layers: An especially useful feature of PCB’s is the ability to have multiple isolated layers on the board that can have interaction due to vias (holes to a specific layer). As is customary in most PCB designs, the Dispenser PCB shall contain two power planes (one for the motor drivers and one for the controller power) as well as one ground plane. The dispenser PCB shall therefore contain two layers, the top that contains an encompassing ground plane, and the bottom, which is split into the two power planes. The benefits to having an entire ground and power plane in the PCB design versus a bus or single point is to decrease any potential noise discrepancy between any points on the PCB; additionally, a plane allows multiple components to easily access the value (i.e. power or ground) without having to come up with trace paths.
Component Packages: As should be suspected, many components come in different variants, which can include packaging. The main features of packaging that are considered with PCB design are the lead connection types, and the package size. The main versions of lead connection are either pin or surface mount. For the majority of the components used in the PCB design, surface mounting will be used; this is to encourage less vias in the PCB, as well has reduce the size since surface mounted packages generally are smaller than pin packages. It is noted that for the design-testing phase of the project, pin variants of the surface mounted components shall be utilized so as to provide a simpler way to connect to a development breadboard.
Component Placement: Last, but certainly not least, is the component placement. The location of each of the components has an effect on the PCB design for the reasons of electromagnetic interference, current draw, and board size. Determining the placement of each component can be done with respect to the centrality of the component (it is used often by many other components) as well as the physical size. For the dispenser PCB, centralized components include the MSP430 microcontroller, TL084 Quad-Operational Amplifier IC, and the MCT6S Dual-Optocoupler IC. These components are “centralized” due to the fact of their multiple pins that are utilized by various sections throughout the PCB. As can be
seen in Figure 41, the Motor Driver section of the PCB consists of three
regulation sections that are about the “centralized” TL084 that supplies an amplifier for each of the circuits. In addition to the centralization, components should be placed in such a way so as to provide the shortest trace path with

P a g e | 75
minimal changes in direction, so as to discourage noise and power dissipation effects.
Taking into consideration the five challenges previously discussed, the circuits within Section 4.1.4 were then utilized to compose the initial Dispenser Motor Control and Sensor I/O PCB shown in Figure 41. Within the design, the board is split into two main sections: the regulation circuits for the three dispensing motors and the microcontroller and sensor I/O circuits; additionally, each section has its own power plane in the second layer of the board.
With each of these factors considered in the design of the Printed Circuit board for the dispenser unit of the Doc Box, the preliminary PCB design shown in
Figure 41 is expected to successfully perform the tasks of controlling the three
motors for dispensing (Dispensing “Pacman” Roller, Scanning Roller, and the Tiling Dispensing Chute). It is noted that the design is a first generation design.

P a g e | 76
Figure 41 – Dispenser Printed Circuit Board Preliminary Design
4.1.10 CPU
A regular desktop PC is a perfect choice to meet the needs of the Doc Box. The PC chosen contains all the necessary hardware to integrate the subsystems together. Many desktop PCs contain the necessary hardware so cost was the driving factor in the choice. A refurbished Gateway AMD dual-core Processor PC is chosen for the job. Table 14 describes the specifications for the unit.
Mo
tor
Drive
r/Sen
sor I/O

P a g e | 77
Table 14 - PC Specifications
Brand Gateway
Model SX2110G-UW308 (DT.GDYAA.001)
Processor AMD Dual Core E1-1200 1.4GHz
Hard Drive 500GB SATA 7200RPM
Graphics AMD Radeon HD 7310
Power Supply 220W
Operating System Windows 8
Video Ports 1 VGA, 1 HDMI
USB 6 x USB 2.0
Expansion PCI
Many desktop PCs do not contain serial ports anymore. A simple serial port card can be inserted into the PCI expansion slot to provide serial ports to the computer. Serial ports are necessary for exchanging data between the PC and microcontroller. A Rosewill dual serial port PCI card is used to provide this functionality. Refer to materials list (part# RC-301) to view specifications.
4.1.11 Power Supply
The power supply is the last but certainly not least of the components necessary for the Doc Box. Before choosing power supplies, the voltage and current draw of each system must be taken into account. Once this is done the power supplies are chosen with the appropriate output voltage and current based on the system they are powering.
A power supply outputting insufficient voltage or current can cause any system to behave unpredictably and ultimately fail. Therefore it is imperative that loading of the power supplies are carefully calculated - adding components or systems in parallel to a power supply might give desired voltage potential for the circuit, but may also overload the supply causing it to overheat and subsequent damage.
While keeping such factors in mind, the Doc Box will be using AC-DC enclosed switching power supplies. These power supplies are chosen for being low profile and energy efficient. Many supplies also come with hiccup protection from overloading and overvoltage. Hiccup protection resets the power supply once the fault has been cleared which in a case of a power surge would allow the Doc Box to remain on without service. This is highly desirable as the Doc Box is to be as low maintenance as possible.
Another factor in picking a power supply is deciding the amount of outputs. If it is possible, fewer amounts of power supplies with multiple outputs would be more desirable than implementing multiple single output models. This is for saving space and eliminating variables of possible malfunctions – fewer components

P a g e | 78
means easier troubleshooting. Again, though multiple outputs are attractive, overloading is an issue.
In looking at current models of power supplies, many offer the voltage that is demanded by the Doc Box components with relatively high amperage (~3A - 8A) and at a reasonably low cost. It is strategically wise to not dive into choosing a power supply at this point, but instead to test systems in the prototyping phase to determine exact values and base decisions thereafter.
4.2 Software
4.2.1 Requirements
The Doc Box system consists of three core software sections operating system software (OSS), embedded software, and laboratory data retrieval (LDR) application. Together these units make up the entire Doc Box software system.
Each of the three units connects together using different communication protocols. The OSS is connected to the embedded software via a universal asynchronous receive transmit bus. This allows back and forth serial communication between the two units. Both of these units are contained within the field kiosk. The UI also contains a background process that manages and updates a database instance. Therefore, the OSS has read and write access to the database. The OSS and embedded software are contained in each Doc Box unit that is placed in the field. These two units communicate locally, whereas the OSS also makes a remote connection to the server hosting the database. The LDR application located at a remote location has read access to the database. This ensures the testing center cannot change or modify user data eliminating a security threat due to non-Doc Box employees and technicians. Figure 42 explains the importance and implementation of each application.

P a g e | 79
Figure 42- Software System Overview
4.2.2 Operating System Software
The main CPU, just like a desktop pc, must have an operating system which is the basic set of tools that allows the computer to identify its hardware and run its applications. The Doc Box utilizes a Microsoft Windows operating system to build upon. Added to the operating system is management software to handle task such as remote connectivity, serial communication, tamper-proofing, and application software. These components make up the main CPU stack. Figure 43 illustrates the Doc Box software stack.
Operating System
Software
Embedded Software
Laboratory Data
Retrieval
Server
Databas

P a g e | 80
Figure 43 - System Software Stack
4.2.3 Application Software
To understand the design of the Doc Box application a state flow diagram is constructed. The diagram is useful to visualize all the possible states the user may encounter when interacting with the APP. The diagram shows a clear path for the user to navigate through the system. There are three root menu options: Return, New Test, and How It Works. Each of these options guides the user through a series of states that allows them to complete the corresponding task.
The New Test functionality is the logical starting point so this is examined first. The first form that is displayed to the user contains the most popular panel test highlighted for ease of access. An option to display all tests can be chosen from here. Selecting a test displays the detailed information along with an option for adding the selected test to the cart or returning to the all tests form. Upon selection, the user is prompted to check out or add more tests. If checkout is chosen, a shopping cart is displayed to allow reviewing of the impending transaction. Here the user ensures the appropriate selections have been made before entering the payment process. Upon finishing and verifying payment the appropriate amount of sample containers are dispensed to the user. The user will also input a valid email address to identify their account upon return.
When the Return option is selected the return process is initiated. First the user is prompted to input the same email address that was used when the order was made. The system verifies the email entered and displays a review of the clients purchase. Here they are asked if a new sample bag is required before the samples are returned to the machine. The return slot is unlocked and opened to receive the samples from the user. If the system verifies a sample has been returned the task is complete and the user is notified they will receive their results in 24-48 hours.
Computer Hardware
Operating System
Application Software
Management Software
Database Access
Serial Comm
Tamper-Proofing

P a g e | 81
The third option is the information center. Most people will not have encountered a Doc Box before. The How it Works section informs the user about the details of the system. Here they can learn and become more informed of what types of resources are available to them. Figure 44 outlines the application flow.
Figure 44 – Application Flow
Ad
d O
pti
on
s
Return Review
New Bag Request
Return Slot Open
Sample
Received
More Time Request
Return Home
Add More
Options?
Checkout
Review
Email Input
Payment
Zip Code
Verification
Dispensing/
Return
Information
Ret
urn
Hom
e/ C
lear
Ch
eckou
t
Cancel
Information
Screen
Popular Test/
Sort Options
All
Tests
Test-X
Description/ Email Input
Regulation
Return Test New Test
How it Works
Customer Not
Found

P a g e | 82
The application flow describes the way the software flows from a user’s standpoint; however, the code operates in a relatively different manner. A Qt application has an event loop structure. The goal of this structure is to be able to respond to changes in the state of data models.
In event-driven programs, the GUI view needs to respond to the changes in the data model to display the most up to date information, or view. Objects within the application are frequently sending messages to one another, which makes tracing through the program nearly impossible by hand. The model may change, and then it may have to pass the new data to multiple views for display.
The Doc Box application creates objects, connects them, and then tells the program to execute. Once the event loop is running the objects can send information to each other in a variety of different ways. The key to the Doc Box implementation is the ability for a custom widget, such as a customized button widget, to send QEvents to other QObjects in response to user input (touch screen press). The widgets can also respond to events such as repainting or resizing.
It is important to understand that the event loop does not handle events, they are delivered directly to the object involved. There are three categories of events: spontaneous events, posted events, and sent events. Spontaneous events are generated by the window system. They are placed in a system queue and processed one after another. Posted events are generated by Qt or the application. These events are queued by Qt and processed by the event loop for distribution. Sent events are also generated by Qt or the application, but are sent directly to the target object. The advantage of sending events rather than posting is immediate handling of the event by the effected objects. Although, Qt does not have time to compress the event.
While the event loop is running, as long as the application is open, objects can transmit information to one another through the use of signals and slots. An example is the ability to read/write data through the use of a single serial communication object from multiple different windows. The read/write methods are initialized as slots. Another object emits a signal triggering the slot. The signal can come from one or many different objects. The signal must be connected to the slot before the action will take place. This is done as so:
connect(Object1, signal1, Object2, slot1)
The above single line code snippet is enough to provide the powerful functionality of signals and slots. The Doc Box application takes advantage of this feature extensively.
4.2.4 Management Software
The Doc Box application is the software the user interacts with and sees when operating the kiosk. Other applications are necessary to provide the functionality

P a g e | 83
necessary and preventing certain functionalities from being accessible. This is where the management software comes into place.
To protect the system from electronic attacks that may be possible if a user were to exit the Doc Box application and gain control of the operating system another application is used. Inteset™ Systems provides an application called Secure Lockdown™. This small application can be configured to only allow one application to be accessible on a computer. The standard Windows desktop is removed as well as the task bar, toolbars, shortcuts, and windows. The chosen application will run full-screen not allowing the user to exit or gain access to the system whatsoever. This utility is perfect for kiosk type applications
Remote maintenance access is a feature that is desirable but is not planned for the original Doc Box. Having this feature allows remote restarts and updates to save time and money by not deploying a technician. This accessibility is part of the management software and will be part of future versions.
4.2.5 Serial Communications
The Doc Box relies on a serial communication scheme to issue and control commands from the central processing unit. When a signal is emitted the microcontroller unit receives this signal and processes the command. Upon processing, the unit executes the requested actions while the CPU waits for completion. The micro-control unit sends a signal back to the CPU to signal completion. When a task was not completed the respective error code is sent instead.
The CPU side of the communication line is handled by the operating system software and the Doc Box application. This is where commands are initiated by the user interface. The central Doc Box software contains a class for opening, setting, writing/reading, and closing the serial communication link. Figure 45 outlines the serial communication class.

P a g e | 84
Figure 45 - Serial Communication Class
The internal microcontroller handles the other end of the communication link. Data is transmitted from the CPU then processed in the microcontroller. The microcontroller contains a universal asynchronous receive transmit (UART) module that is used for the communication. To configure the microcontroller module (USCI_A) for UART mode the microcontroller is initialized with the following settings. First the control registers are initialized and used to place the UART in a software reset. Then the baud rate and modulation control are set. The status register is set to disable echoing. Finally, control register 1 (UCA0CTL1-Bit0) is changed to take the UART out of software reset. This begins operation. Table 15 shows the register configuration.
SerialCommunication
serialCommunication()
~serialCommunication()
readData()
writeData() QSerialPort
enum BaudRate
enum DataBits
enum FlowControl
enum Parity
enum StopBits
close()
open(QIODevice::mode)
portName()
setBaudRate(baudrate)
setDataBits(databits)
setFlowControl(flow)
setParity(parity)
setPortName(&name)
setStopBits(stopbits)
QIODevice
enum OpenModeFlag
errorString()
readAll()
readyRead()
write(&bytearray)
QSerialPortInfo
availablePorts()
isBusy()
portName()
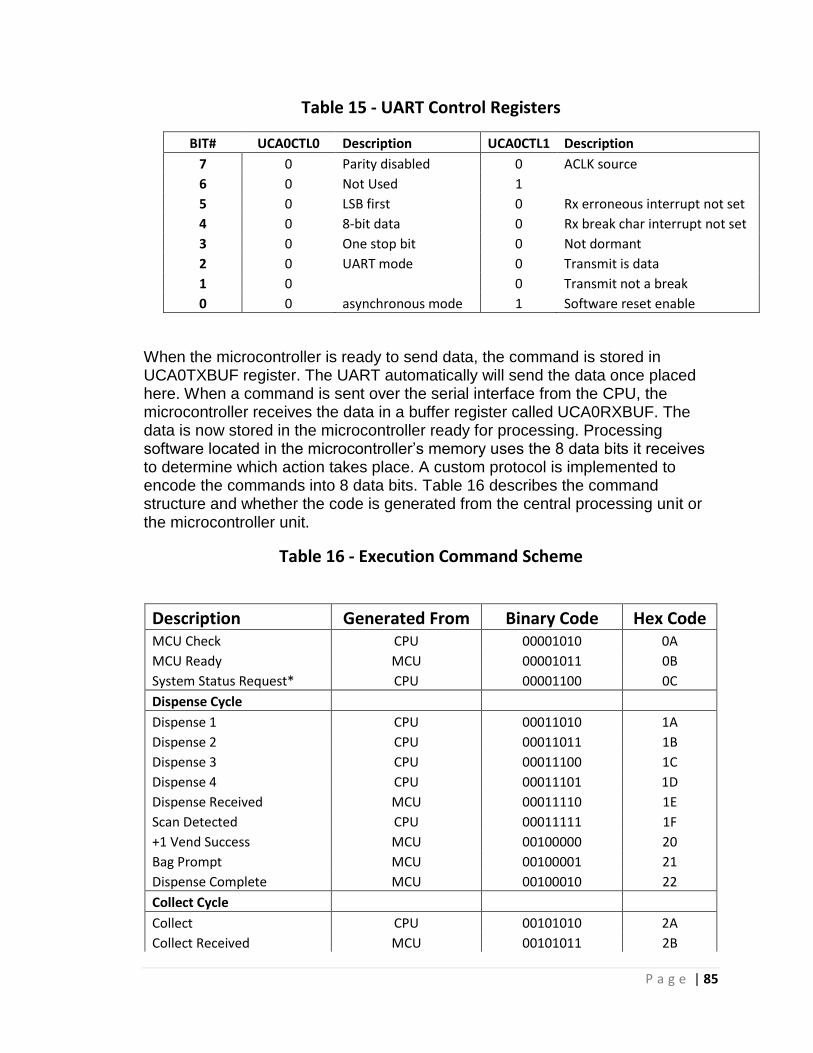
P a g e | 85
Table 15 - UART Control Registers
BIT# UCA0CTL0 Description UCA0CTL1 Description
7 0 Parity disabled 0 ACLK source
6 0 Not Used 1
5 0 LSB first 0 Rx erroneous interrupt not set
4 0 8-bit data 0 Rx break char interrupt not set
3 0 One stop bit 0 Not dormant
2 0 UART mode 0 Transmit is data
1 0 0 Transmit not a break
0 0 asynchronous mode 1 Software reset enable
When the microcontroller is ready to send data, the command is stored in UCA0TXBUF register. The UART automatically will send the data once placed here. When a command is sent over the serial interface from the CPU, the microcontroller receives the data in a buffer register called UCA0RXBUF. The data is now stored in the microcontroller ready for processing. Processing software located in the microcontroller’s memory uses the 8 data bits it receives to determine which action takes place. A custom protocol is implemented to encode the commands into 8 data bits. Table 16 describes the command structure and whether the code is generated from the central processing unit or the microcontroller unit.
Table 16 - Execution Command Scheme
Description Generated From Binary Code Hex Code MCU Check CPU 00001010 0A
MCU Ready MCU 00001011 0B
System Status Request* CPU 00001100 0C
Dispense Cycle
Dispense 1 CPU 00011010 1A
Dispense 2 CPU 00011011 1B
Dispense 3 CPU 00011100 1C
Dispense 4 CPU 00011101 1D
Dispense Received MCU 00011110 1E
Scan Detected CPU 00011111 1F
+1 Vend Success MCU 00100000 20
Bag Prompt MCU 00100001 21
Dispense Complete MCU 00100010 22
Collect Cycle
Collect CPU 00101010 2A
Collect Received MCU 00101011 2B

P a g e | 86
A special command is reserved for the system status. The CPU can request the system status at any time to receive a special bit stream that contains information about the status of the system. Each bit of the 8 data bits is a flag corresponding to a different system property. Table 17 outlines the system status bit pattern.
Table 17 - System Status
4.2.6 Database
Client data is retrieved from both the Doc Box application and the laboratory portal. The Doc Box application has read and write access to the database while the lab portal is only given read access. To allow access from multiple locations the data is made available on a server. The web hosting service providing database services for the Doc Box is Amazon Web Services (AWS). AWS offers a relational database service (RDS) that manages a database instance on their server. Amazon RDS makes it easy setup, operate, and scale a relational database in the cloud. Amazon RDS also provides easy access to MySQL to facilitate compatibility with existing code, applications, and tools. This ensures easy connections to the data stored in the cloud from the Doc Box units and the LDR application.
To retrieve data from the cloud a connection is made from the Doc Box application. The following class diagram outlines the methods necessary to establish this connection. Different access identifiers are used when accessing from the Doc Box application or from the lab portal to prevent unauthorized access as discussed above. Figure 46 indicates the methods used to query the data through the establish connection.
Success MCU 00101100 2C
Collect Complete MCU 00101101 2D
Errors
Dispense Error MCU 00111010 3A
Scan Error MCU 00111011 3B
Scan Error Handled CPU 00111100 3C
Dispense Error Handled CPU 00111101 3D
BIT# *System Status
BIT0 Bags Available
BIT1 Low Bag Alert
BIT2 Out of Bags
BIT3 Bin Capacity Reached
BIT4 Test Tube Quantity Low
BIT5 x
BIT6 x
BIT7 x

P a g e | 87
Figure 46 - Database Classes
The following code explains how a connection is made to the database, and then a query is requested and processed. First, the connection is made by creating a QSqlDatabase object, then setting the connection parameters. Previously, the username and password are given access from the web host service. Once the connection parameters are established, the connection is opened.
QSqlDatabase db = QSqlDatabase::addDatabase(“MySql”);
db.setHostName(“…endpoint address…”);
db.setDataBaseName(“test”);
db.setUserName(“user”);
db.setPassword(“password”);
bool ok = db.open();
Once the database has been opened a query can be made and processed using the following example. The QSqlQuery class passes a SQL query statement through the connection. The query will return a record which can be parsed using value(). The example retrieves all customers from a particular date and moves through each value returned in the record using next().
QSqlQuery query(“SELECT customers FROM date”);
while(query.next())
QString customer = query.value(0).toString();
doSomething(customer)
QSqlDatabse
QSqlDatabase()
~QSqlDatabase()
+addDatabase(&type)
close()
databaseName()
isOpen()
lastError()
open()
primaryIndex()
record()
setDatabaseName(&name)
setHostName(&host)
setPassword(&password)
setUserName(&name)
tables()
QSqlQuery
QSqlQuery(&query)
~QSqlQuery()
first()
last()
next()
previous()
record()
seek()
setForwardOnly()

P a g e | 88
4.2.7 Payment Processing
The Doc Box requires credit card processing before dispensing the purchased sample tubes. A gateway account is set up with a company like Flagship Merchant Services or Authorize.net. The chosen gateway account is PCI DSS Compliant to ensure the gateway meets the payment card industry data security standard. The connection used to process payment has a secure socket layer (SSL) to protect transactions. A merchant account is setup through the gateway service.
The process involved starts when the customer pays. Authorization is check by sending the transactional data through the gateway service to the merchant bank’s processor, who, in turn, routes the transaction to the cardholder’s bank. The cardholder’s bank either approves or denies the transaction and passes the information back to the credit card processor, who, in turn, passes the information to the cardholder and the merchant. From here the purchased goods are delivered upon approval. The customer’s bank will send the required funds to the credit card processing network, who forwards the funds to the merchant’s bank.
The first generation Doc Box prototype uses a magnetic authorization card to simulate credit card payment. Utilizing a magnetic card reader allows the prototype to simulate the action of paying by credit card. The data on the card is read and processed in the UI for verification. This action is a valid method because the unit will be used for display and promotional purposes.
4.2.8 Embedded Software
The embedded microcontroller is programmed to execute the functions of the Doc Box system. The microcontroller controls the various motors and sensors that are used to perform the actions of dispensing and vending of test tubes, as well as collection. Figure 47 outlines the details of the embedded software.

P a g e | 89
Figure 47 - Embedded Software Details
The structure of the software begins with an initialization procedure. Here the input/output ports, peripheral modules, and variables are configured. During initialization the watchdog timer must be configured along with the load capacitance for the external low-frequency crystal. After initialization the microcontroller enters low power mode and waits for an interrupt.
The software architecture is interrupt driven. A receive interrupt is generated from the universal asynchronous receive transmit module when data is ready to be received into the buffer. Once this data is read the interrupt flag is cleared. This provides the ability for the microcontroller to wake up when a command is sent form the CPU. Inside the interrupt service routine (ISR) the command is read and the appropriate flag is set. The code returns to the main loop and checks which flag has been set. The appropriate block of code is then executed. Before the code is executed the flag is cleared to avoid an infinite loop of checking and
Interrupt Generated
Begin
Initialization
Idle Mode
Interrupt Service
Routine (UART)
Check Command
Set Flag
Return from
interrupt
Execute
Dispense
Execute
Collect
Execute
Status
N
N
N
Dispens
Collect
Status
Y
Y
Y

P a g e | 90
executing. When the operation is done executing the flags are checked again, if no flags are set the system returns to idle mode. The microcontroller is now ready to receive the next command.
4.2.9 Laboratory Portal
The last part of the Doc Box software system is an application issued to the sample testing laboratory. The laboratory portal is a tool that provides fast, simple, and secure access to client information. The current method used in a laboratory is to input client information manually when the samples are received. The Doc Box streamlines this process by allowing the testing center to automatically obtain the clients information through scanning the sample tubes with a barcode scanner.
As long as the laboratory is logged into the application as a verified user the application queries the client database using the barcode scanned. The client information is then automatically retrieved from the database. This application is written in C++ using Qt Creator for development.
5 Design Summary of Hardware and Software
The Doc Box, like many dispensing devices, is a very diverse system that requires design in not only electrical systems, but also software and mechanical systems. Despite the diversity in design, Group 12 will be focusing more on the electrical and software design of the system, so as to meet the desired goals of more understanding of embedded systems, circuit design, and motor control systems. The top-level hardware design of the Doc Box can be broken into four main sections: The system enclosure, dispenser, collector, and holder. With respect to the software, the top-level design can be broken into four main sections: application software, embedded software, lab portal, and database. Each of these hardware and software top-level systems is further broken down into smaller subsystems that fully perform the task of each system. The top-level
block diagram of the Doc Box is as show in Figure 1. It can additionally be seen
within the block diagram that each subsystem has a specifically delegated component for each of the four group members of Group 12. In addition to the
system block diagram, Figure 48 and Figure 49 shall assist in showing the
physical placement of each of the subsystems within the Doc Box enclosure.
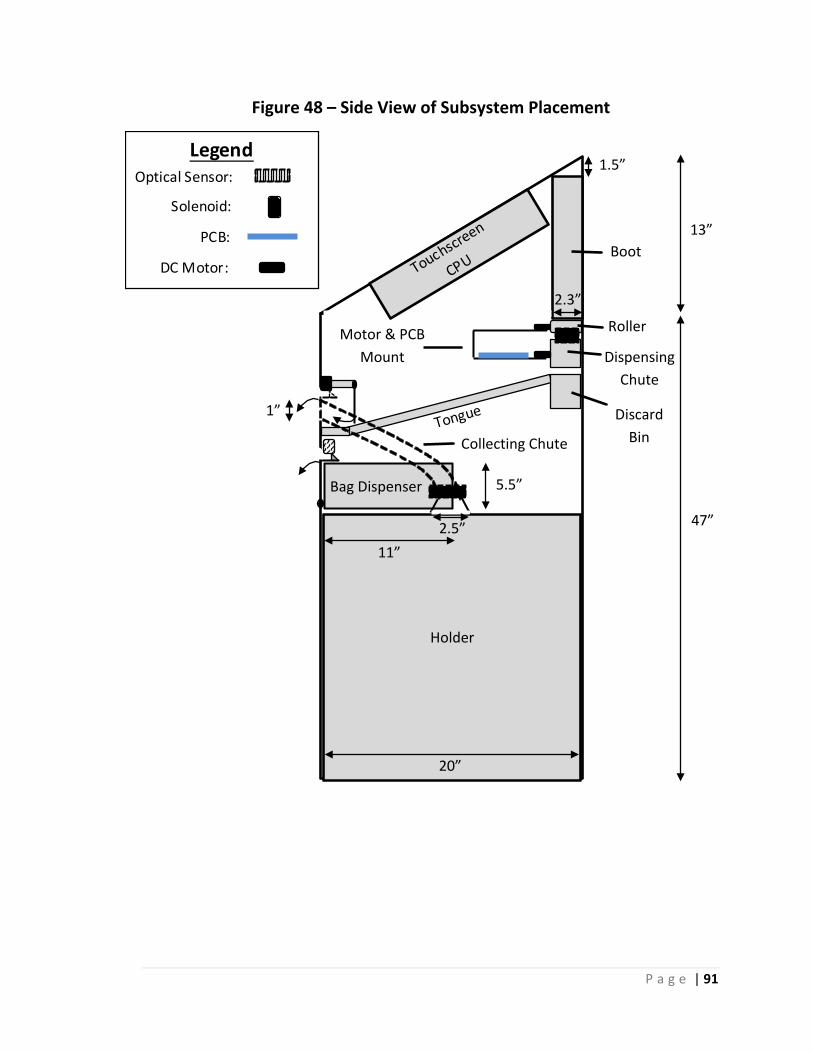
P a g e | 91
Figure 48 – Side View of Subsystem Placement
13”
47”
1.5”
2.3”
1”
11”
2.5”
Holder
BagDispenser 5.5”
Tongue Discard
Bin
Dispensing
Chute
Roller
BootTouchsc
reen
CPU
Motor&PCB
Mount
20”
LegendOpticalSensor:
Solenoid:
PCB:
DCMotor:
CollectingChute

P a g e | 92
Figure 49 – Top View of Subsystem Placement
8
20
”
1
4
7
5
6
Legend
1. Test Tube Dispenser “Boot”
2. Dispensing Chute & Discard Bin
3. Dispensing “Pacman” Roller
4. Motor & PCB Mount
5. Tongue
6. Bag Dispenser
7. Dispensing Chute
8. Holder
3 2
20”
With the placement of the internal components of the system being established, the order of the operations shall be specified. The first interaction that the user shall have with the Doc Box shall be with the touchscreen display.
Upon receiving the dispense signal from the CPU, the MSP430 microcontroller shall begin the dispensing sequence which shall consist of the following sequence: Dispense test tube, scan test tube barcode for indexing, deliver test tube to customer view the Delivery Chute (or “Tongue”). In order to be able to deliver a large quantity of tests tubes, the test tube holder “boot” shall be required to hold a minimum of 1000 test tubes so as to reduce the likelihood of a test tube shortage. Additionally, the dimensions of the boot shall be in such a configuration that is capable of compactly storing the required 1000 test tubes while minimizing all likelihood of jamming while feeding to the single exit slot at the bottom corner of the boot.
The test tube dispensing wheel shall be located directly below the dispensing slot of the boot, and shall be driven by a DC motor that is controlled by the microcontroller. The design goal for all of the dispenser motor applications is to use the microcontroller to simply enable and disable the DC motors without use of pulse width modulation. In order for the low voltage microcontroller to drive the voltage that is four times greater than that for the controller, a driver circuit that is enabled by the controller must supply the power to the motor. Group 12 decided to utilize an optocoupler that simply enables a transistor by a light in order to switch the regulated voltage to the motors. At the exiting end of the dispensing wheel, a sensitive laser detection circuit shall be used so as to give a rough estimate of the progress of each group. Additionally, one of these optical sensors

P a g e | 93
shall be used to check the capacity of the boot. Each sensor shall be directly hooked in to the microcontroller.
After dispensing, the test tubes shall then roll down the dispensing chute to the scanner roller than shall also be enabled by a dc motor identical to that used for the dispensing roller. The fate of the test tube, whether discarded or vended to the costumer, is dependent on the success of the barcode reader reading the test tubes. Due to the fact that the dispensing motor is to be double sided, the motor shall utilize a driver IC to assist in the polarity change of the motor so as to change direction. The component chosen is the L298, which allows for simple motor driving control given a few inputs are supplied.
For the initial development of the Doc Box, the students shall assemble many of the motor driver circuits for the device within a breadboard so as to allow easier recovery from mess-ups. However, after development, the desire for a more reliable board shall be present, in which Group 12 plans to design a custom printed circuit board from a professional manufacture. The design of the PCB shall be completed using CAD software such as Eagle. Considerations such as the layers, trace width, trace positioning, component packages and mounts are just a few parameters that must be met while designing a PCB.
With respect to the layers of the PCB, there are a few considerations to be taken into detail, such as the number of components and the placement of such on the actual board, as well as the current consumption of the components of the board. The layers shall be made and coated with different materials so as to provide a greater means of insulation of the layers traces from outside interference that can especially be caused by the electromagnetic interference from other traces or components of relatively high current. This leads to the width of the traces within each layer of the board. Once the maximum current draw of the circuitry of the board, the trace widths may be determined. The entire motor driver and switcher circuit for the motors are all to be incorporated with the same PCB that shall be able to perform the tasks specified.
The Doc Box consists of multiple subsystems. Each subsystem can be summarized individually to provide more detail, and then summarized as a whole to understand how the entire system integrates and functions smoothly together. With the dispensing system already mentioned, the bag dispenser will follow next.
After much consideration it was decided that in order to reduce complexity and chance of system error of the project, a friction feeder solution to dispense a bag will not be used in this iteration of the Doc Box. Instead, a locking door mechanism will be employed in which a compartment containing the plastic bags are only accessible to the user once the CPU confirms the user is valid. The user will then be asked to manually retrieve a plastic bag from the compartment to put the saliva sample vial into and return the package into the return slot.

P a g e | 94
The access door hatch must be secure but easy to open and lock/unlock. It will be bottom hinged and spring loaded to be normally closed when no force to open it is applied to it. The hatch will have a triangular catch mechanism resembling that inside a bedroom door so that the hatch can close while the lock is engaged. This will ensure the hatch is always closed when not in use to prevent theft and tampering. The plunger, or “armature,” of the solenoid will actuate in and out of a hole in a solid lip attached to the body of the Doc Box. The hatch door will catch on this armature when the lock is engaged (or when no power delivered to the solenoid) – effectively locking the hatch door closed. When the door is closed and the lock engaged, the catch will not allow outward movement of the door while a lip attached to the door from being pushed inwards. The hatch door lock
detail is illustrated in Figure 50.
Figure 50 - Lock Detail
The hatch will be normally locked via a pull type solenoid when not in use. When the hatch is to be unlocked, the microcontroller will send a signal to the solenoid to actuate which will pull the armature to a point above the catch of the door allowing it to be opened freely. An LED of some sort placed above the hatch and notification on the display will indicate that the lock has been disengaged and a bag can be collected. The microcontroller will be programmed to keep the solenoid actuated for a certain amount of time so the user may have a chance of opening the door. After that amount of time has expired, the lock will re-engage and the display will prompt the user asking “do you need more time?” The user will either input “yes” or “no” where if “yes” is selected, the door will again unlock for the set amount of time and if “no” is selected, the door will remain locked and the process of service is continued. By intermittingly locking the door this way, the solenoid will have time to cool since they are prone to generating heat when energized which can be damaging.

P a g e | 95
In choosing a linear solenoid, it is desired to have it be low power since holding force is not needed to be very high in this application - the load on the armature will only be the weight of the steel bolt and possibly an elastic band used to prevent the armature from falling out of the solenoid. The stroke, or how far the armature travels into the body of the solenoid, must also be long enough to clear the door catch. A return spring can alter the stroke length to an extent. Furthermore, since the lock shall be actuated for short periods of time, an intermittent duty solenoid will suffice and also provide a smaller body than continuous duty solenoids thus saving space. To further protect from heating damage, a heat-sink may be attached to the solenoid body. The bag dispenser will resemble a napkin dispenser one would find in a restaurant. Bags will be stacked side by side with a spring loaded plate pushing the stack towards the hatch entry. A stop plate will prevent the bags from spewing out of the dispenser. Here it is desired to have a system to sense when the supply of bags are about to be depleted. The spring plate will run on a track and have a rib extending from underneath. This rib will move with the spring plate along the track and will trip a momentary limit switch at an appropriate point (about 85% of track length) indicating the bag supply is low. The limit switch will have a lever-roller actuator which will allow the spring plate to continue to traverse the track when activated. Once the spring plate touches the stop plate, another carefully placed limit switch will trip indicating that no bags are left in the dispenser and will notify the CPU accordingly. If no bags are available, service will cease thereafter as the bags are needed for acceptable testing. Figure 51 shows a conceptual illustration of the sensor.
Figure 51 - Detail of Sensor
Since the bags are very thin, it is expected to be able to store anywhere between 700-1000 bags at full capacity in the dispenser. The reason simple limit switches were used as a position sensor to monitor bag supply is that due to the great amount of bags in the dispenser, it is expected for the supply to last a fairly long

P a g e | 96
time thus movement of the spring plate will be very slow. Therefore, it is not necessary for sophisticated sensors such as optical sensors or linear motion potentiometers to track position. By using the design described in this section, power draw is lower and operation is more reliable than optical sensors and linear positioning sensors due to its simplicity.
The reason a linear solenoid is used as opposed to a motor or linear actuator is similar. The simple application did not need a more complex device to be realized. To disengage the lock, a full on or off operation was needed opposed to a carefully controlled input. The result is a reliable and low power circuit which is desirable. A rotary solenoid, though more space efficient, was not chosen due to worry of the armature not engaging the locking pocket – there is a possibility of the armature getting wedged on the catch when the door is closing as the armature re-engages the lock, this is shown in Figure 52.
Figure 52 - Concept Illustration of System
The holder unit, which is the area where the saliva samples are collected once they are returned to the Doc Box, is the next subsystem. Here the samples are kept under temperature controlled conditions in order to preserve the biological data until they are to be picked up for testing. The unit consists of a refrigeration system for cooling and a circuit to monitor and control temperature. Since this area is to remain at a cool temperature, the walls will be insulated and air tight while being readily accessible in order for couriers to collect the samples daily.

P a g e | 97
In researching methods to control temperature in a refrigerated environment, an attractive option was the inverter controlled compressor motor. By controlling the speed of the compressor motor it is possible to maintain a more accurate and constant temperature with a higher efficiency than traditional refrigeration systems. However, in order to do this, either a special motor built with such speed control built in or a variable frequency drive must be used (other methods are possible, but these are the most feasible for the Doc Box application.) These special compressors are very expensive and not widely available while VFD’s are also expensive and designing one from scratch would be complex and time consuming. Therefore, in the fabrication of the Doc Box prototype, we forego the variable speed compressors for a traditional method of refrigeration. Information on variable speed compressors will be left in this document for possible future iterations of the Doc Box. A circuit is designed to control the switching of the refrigerator compressor. A temperature sensor is placed within the cooling area and is used as the feedback signal to the control circuit. The feedback signal will then be compared to a set voltage (reference signal) that correlates to the target temperature and the resultant output will control the switching of the compressor power. If the feedback signal is higher than the reference signal, the area is assumed to be warmer than the target temperature and the compressor will be switched on to start cooling. Conversely, when the target temperature is reached, the compressor switches off until the temperature drifts away from the target and the compressor switches on again. This is traditionally how general refrigerators work. However, problems with this design arise if the control system is too tight resulting in the compressor motor repeatedly switching on and off in a short amount of time due to system temperature fluctuating above and below the target temperature. To combat this, pulse frequency can be decreased and hysteresis can be designed into the circuit. Reducing pulse frequency means the circuit will check the temperature less frequently as temperature is expected not to change dramatically. Also, designing hysteresis into the circuit would allow a range of acceptable target temperatures for system to operate in. Figure 53 illustrates a block diagram of the system.
Figure 53 - Block Diagram of Temperature Control
P a g e | 98
The goal of the refrigeration system is to be completely independent of the other subsystems. In other words, the microcontroller that is controlling the other subsystems will not have any connection to the temperature control circuit as it will compose entirely of discrete parts. This will save precious pin space on the microcontroller that can be used for another subsystem. Also, if the microcontroller were to fail for any reason, the samples would still be preserved. With no processor the circuit should be robust enough to be reliable and accurate. The cooling will be through a traditional vapor-compression refrigeration unit. The compressor’s motor is usually an AC induction motor that compresses refrigerant into a high pressure high temperature gas. The gas is turned into liquid through a series of coils called the condenser where the hot air is expelled. This condenser will be placed outside the cooling area - possibly outside the Doc Box enclosure fitted with a proper heat sink to dissipate the heat. The high pressure low temperature liquid is then turned into a mixture of liquid and vapor through an expansion valve and is run through another set of coils called the evaporator where a low power DC fan circulates air over. Heat in the air is absorbed by the refrigerant in the evaporator leaving the air cool and the cycle is repeated. This evaporator will be exposed to the inside of the sample containment area. Refer to diagram in Figure 16 for illustration of the vapor compression cycle. The software system is summarized by reflecting on the initial goals and constraints the stakeholders require. The software accomplishes the requirements laid out previously in a secure, reliable, and compatible way. The components of the software are restated here for convenience. Refer to Figure 42 for a graphical view. The software stack is built upon the operating system. The operating system provides a foundation for other applications as well as a custom screensaver. The management software is loaded and initialized by the operating system to configure the PC with a kiosk look and feel, as well as provide a layer of security. The management software loads the Doc Box application and ensures it is the only application capable of operating on the machine. The Doc Box application runs continuously providing the public with access to private and affordable saliva testing.
The laboratory portal provides the testing laboratory with access to the web host where the database containing customer contact information is stored. The portal fetches the customer contact information after the user scans a barcode. The application must be logged into with a registered Doc Box account to keep customers information secure. Once retrieved, the client contact information is easily copied into the laboratory’s existing management software. This completes the software cycle for the Doc Box system.
Embedded software is loaded into the microcontroller’s memory in order to process all of the requests made by the CPU. The MSP430G2553 28-pin package microcontroller will be used. The block diagram in Figure 54 outlines the highest level of peripheral control that the MSP430 will service. The architecture

P a g e | 99
of the embedded software is interrupt driven. An interrupt is registered when the universal asynchronous receive transmit module data has left one of its buffers. The microcontroller checks the command, exits the interrupt service routine, then executes the appropriate function. Some of the peripherals in Figure 54 are used for output type execution, while others are used as input for providing feedback to the CPU.
Figure 54 - MSP430 Peripheral Control
The entire system comes together at the point of user interaction, the touch
system. The touch and display system is integrated into the box in a secure
manor that provides an astounding visual element for the user to view and
interact with the Doc Box. The display connects to the CPU through a standard
DVI connection. The touch response is received through a standard serial or usb
connection.
Starting from the inside of the Doc Box, the dispensing system was summarized,
then the holding system, as well as the bag dispenser, then the embedded and

P a g e | 100
operating system software, and finally the touch system. These subsystems
come together to create the entire Doc Box system.
6 Prototype Construction
6.1 Parts Acquisition
In the prototyping processes of the Doc Box system, all of the components were considered and picked out to meet the requirements of the system, to the best of the knowledge of the members of Group 12.
6.1.1 System Enclosure
The enclosure to the system is different in small features such as height and exterior and interior component placement, especially for the purpose of avoiding legal conflict with existing designs. Due to the nature of Group 12’s goal to focus on the electrical design of the system, the mechanical and structural design of the enclosure has been left for the outsourced manufacturer of the box design, which is shown in Figure 19 and further specified in Section 4.1.1.
6.1.2 Dispenser System Components
As is described in Section 4.1.4, the dispenser unit within the Doc Box system is comprised of a unique system of operations that shall require the unit to essentially be built “from scratch.” The purely mechanical components of the system shall mainly be acquired from other devices with similar components; an example is for the scanner roller, which can simply be a roller from a printer or similar application device. Additionally, components such as the test tube holder “Boot” will be made by either Group 12 or an outsourced manufacturer for building the system enclosure, due to the nature of the specific dimensions that are atypical. For the initial prototyping process, a roller directly from a printer, obtained through a gadgets resale store, and a Boot made custom from the enclosure manufacturer can be utilized for proof of concept; such a device can easily be obtained through a manufacturer given that the Doc Box enters into large-scale production. With respect to the electromechanical and pure electrical devices, such as motors, wires, laser diodes and phototransistors, such devices may be obtained from a variety of different electronic stores, both online and physically. For the Doc Box project, the main resource for electrical devices shall be from online electrical equipment distributors. Although Group 12 desires to keep the overall cost of the project to a minimum; the quality of each component must be suitable to produce a system that functions with high reliability. Based off of these guidelines, each component shall be chosen to meet both the affordability and reliability aspects of the project. An example of such a situation is for the DC motor that shall be used for the rollers and tilt chute is the Sayama Brushless DC Motor obtained from All Electronics online electronics distributor. The component

P a g e | 101
has a low cost in comparison with other distributors, yet is made from above average material; such is how to meet the middle requirement of quality with decent price. The parts required for the dispenser system can be seen in their respective circuits in Section 4.1.4, the complete listing of the components can be seen in Table 18.
Table 18 – Dispenser Parts Listing
Description Price Quantity Manufacturer Manufacturer Part Number
Vendor
58 RPM Brushless DC Motor
12.95 3 Sayama 12SM-AT3 All Electronics
Dual Phototransistor Optocoupler
0.662 1 Fairchild MCT62 NEWARK
Dual N Channel Small Signal MOS FET
0.55 1 Toshiba SSM6N36FE Digikey
Power Switching Diode 0.1 2 Fairchild 1N914 Mouser Electronics
High Speed Switching BJT
0.7 4 NTE Electronics
2N2222A NEWARK
20kΩ Potentiometer 0.46 3 Piher PT10LV10-203A2020
Mouser Electronics
5.1v Zener Diode 0.23 2 Fairchild 1N4733A Mouser Electronics
Quad JFET Operational Amplifier
0.59 1 ST Microelectronic
TL084CD Mouser Electronics
Dual Bridge Motor Driver IC
4.67 1 ST Microelectronic
L298N Mouser Electronics
Phototransistor (860nm)
0.22 2 Multicomp OFT-5301 NEWARK
850nm Laser Diode 5.52 2 Optek Technology
OPV332 NEWARK
3.3V Voltage Regulator 1.93 1 Texas Instruments
LM2937ES-3.3/NOPB
Mouser Electronics
6.1.3 Printed Circuit Board (PCB)
The printed circuit board/s of the Doc Box system are crucial to the success of the system, therefore Group 12 elected to utilize one of the many Printed Circuit Board manufacturing companies to produce the designed PCB for the Dispenser and Collector. Group 12 has decided to use 4PCB.com as the manufacturer for the circuit boards. The total cost for the PCB shall be determined once the final design is completed and quoted by the manufacturer.
6.1.4 Collector
Since the collector utilizes the movement sensors and the solenoid doors, the electrical components of the collector shall be obtained from the same sources as both the test tube and bag dispensers. Concerning the actual chute, the material shall be obtained from either a local hardware store (i.e. system enclosure manufacture) or from other similar resources.

P a g e | 102
6.1.5 Bag Dispenser
The bag dispenser subsystems key components consist of the locking mechanism and the position sensor. In this section, reasons why key parts were chosen and important aspects to note of these parts will be explained in detail. The locking mechanism for the bag dispensing hatch is operated by a simple actuation of a steel bolt via a linear solenoid. This solenoid is to be a pull type in which the armature (steel bolt) will be pulled into the solenoid’s body when supplied current. Section 4.1.5 goes into detail on how the solenoid works and its function in the Doc Box. The C5-273-B-1 from Ledex is an open C frame pull type solenoid chosen for this application. The open C frame allows the solenoid to be easily air cooled and installed. According to the datasheet the solenoid is able to be run continuously at 3W is so desired. However, if desired to run at a higher power and therefore stronger holding force, at 6W the maximum on time is about 2.5 minutes – more than enough time for the user to retrieve a bag. The flexibility of this solenoid is attractive for this application and is why this part was chosen. The positioning sensor indicating that the bag dispenser is depleted of its supply is a limit switch that is activated when the spring plate of the dispenser is above it. It will be strategically place at the end of the dispenser track so that the spring plate will trip the sensor when the end is reached. For this sensor, the D2SW-01L2MS mini SPDT roller switch was chosen. This switch is momentary activated when the armature is actuated and deactivated when the armature is at rest. At rest, the switch is normally open and the armature allows the spring plate rib to glide along it via a roller. Once the thickest part of the rib reaches the roller arm, the switch activates the sensor circuit. The roller arm allows the spring plate to easily move along its track. The momentary activation allows the sensor to reset when the dispenser supply is replenished with more bags.
6.1.6 Holder
The holder has two main components – the cooling unit and the temperature control. This section is an overview of key parts in this subsystem.
6.1.6.1 Temperature Control
The temperature control circuit is described in section 4.1.7.1. The circuit revolves around the temperature sensor which sends a feedback signal proportional to the temperature in the cooling area. It was important for this sensor to be accurate and its output linear for this circuit to operate correctly. Chosen for the sensor is the LM35 temperature sensor from Texas Instruments© which is a “centigrade precision temperature sensor.” According to the product datasheet, these sensors output a voltage that is linearly proportional to the Centigrade temperature with an accuracy of +/- 0.5°C. Typical accuracy is rated even lower at about +/- 0.2°C to 0.3°C. Temperature range is rated for -55°C to
P a g e | 103
150° which is well within our expected range of 0°C to 26.7°C. All this considering, this sensor is a natural choice for our application. Compared to other sensors reviewed, this sensor was found to be the most accurate and reliable. The LM555 is a popular timer device known for its accuracy, stability, and the ability to be customizable. This part was chosen to produce a time delay to prevent the compressor motor from rapidly switching on and off over a short period of time which can reduce the compressors life cycle. The LM555 is able to produce timings with adjustable duty cycles from microseconds to hours based on the values of two resistors and a capacitor (these equations can be found in Table 22). The 555 timer was chosen for its precision and ease of use. In choosing a comparator, the TL311 single low power differential comparator from TI© was chosen. This device takes in a 5V supply voltage Vcc like the other components in the system so no voltage regulator is needed. In addition to being low power, this IC is space saving and inexpensive. According to the product data sheet, the input range is 0V to Vcc. Although the input range encompasses the input of temperature voltage, the voltage signal from the sensor may need to be amplified to avoid inaccuracies due to noise. The max output of the comparator is Vcc+.3 which is also acceptable for the input of the next device – the latched. Without a latch to keep the compressor running when the temperature is not in range, the compressor will turn on and off with the time delay cycle of the 555 timer. This is not desirable as this may double the time necessary to cool the holder to the target temperature. For the Doc Box, the SN74LVC1G373DBVR single D-type latch from TI© was chosen. This latch requires a 5V supply voltage which can be tapped from the +5V bus in the circuit. According to the data sheet, the input ranges from -0.5V to 6.5V which encompasses the range of the comparator output.
6.1.6.2 Cooling Unit
In searching for a compact cooling system unit, little results arose. Vending machine cooling units are available but may be too specialized to be used in our application as many come built in temperature controls. Another option is to purchase a refrigerator condensing unit and an appropriate evaporator or repurpose a used miniature refrigerator to fit into the Doc Box. At the moment, the less expensive among these options will be chosen for prototyping purposes - a used refrigerator. However, this issue will be discussed with the Doc Box sponsors in choosing an appropriate cooling unit for Doc Box manufacturing. With that said, a mini refrigerator is easily obtainable and virtually any will suffice. Price for this part will be estimated between $0-$100.
P a g e | 104
6.2 Final Coding Structure
Each section of the Doc Box software has been defined in the previous section. An organizational structure brings all these components together. The final coding structure provides an overview of how each component comes together to create the Doc Box system. To start, everything is built upon the operating system.
6.2.1 Operating System Software Structure
The operating system provides the basic functionality to run the application software, provides the necessary external component drivers, and runs the management software. The operating system is altered to display a custom screensaver that contains attractive graphics and advertisements. The boot animations for the operating system are also altered to provide a custom look and feel in case the general public is viewing when a reboot takes place. The Windows operating system is set up to auto-start the necessary applications the Doc Box requires. This includes local database software, Secure Lockdown, and the Doc Box application.
The Doc Box application is a proprietarily develop software package so is not included inside this document. What is discussed is the general layout of the software. The components have already been discussed in the previous section. Here it is shown the details of the components and how they integrate together. The application begins with a main window class that displays the beginning screen to the users. Each page the users encounter thereafter is a dialog window. The main window remains in place while the dialog is opened above it. Each dialog is in charge of destroying the previous displayed dialog if necessary. Some dialogs remain in tacked because the user has the option of returning to the previous dialog; in this case the dialog destroys itself. This explains how navigation takes place from page to page in the application. The main window and each dialog are responsible for displaying their respective widgets and paint features.
In the background, the logic for opening the serial port connection with the microcontroller takes place. The serial port class contains methods for reading and writing data. These features must be accessible from more than one form (and related class) throughout the application. To do this, Qt’s signals and slots method is used as discussed in the research section previously. This allows the necessary classes to contain signals that can be connected to slots in the serial port class. The slots can be regarded as functions that read or write. The powerful features here is that many signals can be connected to each slot providing the functionality the application desires. Other features such as payment, database accessing, and barcode reading are accomplished in a similar manner. Each feature is contained in its own class to separate functionalities and provide an easier debugging environment.
P a g e | 105
The most important part of this structure is the concept of separating business logic and user interface. The code that provides the functionality to the Doc Box is kept separate from the code that provides the user interface. Keeping these concepts separate makes it easier for designers to upgrade the user interface in future versions while maintaining the functionality of the original version.
6.2.2 Embedded Software Structure
The structure of the embedded software is described in the design detail Section 4.2.8. To execute this structure the code is developed with a simple interrupt driven architecture to ensure communication with the overall system. This approach ensures the core architecture of the embedded software integrates with the entire Doc Box system before adding all the appropriate features.
6.2.3 Laboratory Portal
The laboratory portal application is much simpler in design than the Doc Box application. In fact, the laboratory portal uses the blocks already created for the Doc Box application. The major changes take place in the user interface design. This is easily accomplished because of the way the software is structured as discussed above. The laboratory portal application is also based off a main window. The main window is a simple interface that allows the user to read in a barcode number and view the associated information. This all takes place in the main window. A feature to add the contact information to the clipboard for easy copying and pasting into the local laboratory software is available. The logic for barcode scanning and database access is derived from the Doc Box application.
7 Project Prototype Testing
Upon assembling each subsystem design, each section is to undergo a specific series of tests so as to detect any design flaws that shall result in compensatory redesign of the system/component. The testing of the subsystems shall be broken into hardware and software testing, and further broken down into the respective subsystems within those classifications. The environment of each test shall be recorded in order to set a standard point of reference to expect the same results; this testing environment shall closely resemble the ideal environment that the Doc Box system shall operate in.
7.1 Hardware Testing Environment
Due to the required environmental specifications for the samples to be stored in the Doc Box itself shall contain two different environments for the hardware components to function within: the cooled environment of the Collector/Holder in the lower section of the enclosure, and the ambient environment of the Dispenser/CPU portion of the enclosure (Refer to Section 4.1.1 for enclosure diagram). The majority of the hardware (Dispenser, solenoids, CPU,

P a g e | 106
microcontroller, etc.) shall all be within the non-cooled section of the enclosure. As is the case with all electrical systems, each component shall be dissipating heat, the main contributors being the CPU and touchscreen, which shall be running continuously. Based off of the operating ambient temperature ratings for the upper enclosure components, the maximum temperature shall be no larger than 80oC; similarly, all of the components for the cooled lower section of the enclosure all can operate at a low of 0oC, which shall not be attained within the Doc Box.
Therefore, with these factors taken into consideration, the testing environment for all upper enclosure components shall be in an ambient temperature above room temperature (25-40oC).
7.2 Hardware Specific Testing
7.2.1 Dispenser
With respect to the Dispenser hardware components, specific subsystems of the Dispenser shall be tested for functionality and reliability. The functionality testing of each subsystem shall be to verify that first, the system works, and second, that it works with the desired parameters. Many of the components have a large parameter range (max load current, heat dissipation, line impedance, etc.) that may allow for erroneous design parameters to allow the system to function for a period of time, until the incorrect parameter causes a system fault. Which leads to reliability, which more specifically means the correct system functionality over an extended period of time. Per the temperature specifications discussed in Section 7.1, the dispenser hardware specific tests shall be in accordance with Table 19.
Each component shall be tested on five (5) separate events that must pass as functional for a minimum of three out of the five events without call for redesign; similarly, the each component must pass three out of the five events to be classified as functionally reliable.
7.2.1.1 Test Tube Dispensing (Boot)
Referring to Figure 21, it can be seen that the test tubes inside the boot are
gravity fed to the dispensing “Pacman” roller. Due to the nature of all items funneling within a container to the opening, there stands a potential for the test tubes to jam at the dispensing slot of the boot. Although the Boot has been designed in such a way so as to prohibit jamming, the possibility still remains.
For the Boot to pass as functional, the system shall not jam for a minimum of ten (10) consecutive successful dispenses of test tubes at a Pacman RPM of 30. For the Boot to pass as reliable, the system shall not jam for a minimum of thirty (30) consecutive successful dispenses of test tubes at the same Pacman RPM.
These test cases are summarized and shown in Table 19.
P a g e | 107
7.2.1.2 Dispensing “Pacman” Roller
The Pacman Roller rotates at a specified rate of 30 RPM, is rotated based off of the enable signal from the microcontroller, and halted when the Dispense Sensor detects a dispensed test tube. So as to avoid erroneous dispensing of test tubes, the Pacman Roller must be able to come to a full stop within 0.25 seconds (0.125 rotations) of the microcontroller enable signal going low.
For the Pacman to pass as functional, the roller must not dispense any test tubes after the Dispense Sensor returns a positive dispense and before the next dispense signal is sent from the microcontroller. For the Pacman to pass as reliable, the Roller must meet the requirements for functionality and return to within 0.25 revolutions of its original starting position that shall be signified by a timing mark on the Boot and Pacman.
These test cases shall be performed on five separate events, are shown within
Table 19.
7.2.1.3 Boot Capacity and Dispensing Sensor
As discussed in Section 4.1.4.7, an optical sensing circuit shall be utilized in order to detect whether the boot is almost out of test tubes given; an additional optical sensing circuit shall be used in order to determine the whether a test tube has been dispensed from the Pacman Roller. The laser diode and corresponding phototransistor shall be firmly mounted so as to maintain a straight line of sight between the two. The OFT-5301 phototransistor is highly sensitive, with a rise and fall time of 15 microseconds, respectively; therefore, given that the dispensing sensor is constantly at active high during the dispensing process, a test tube breaking the phototransistors connection to the laser diodes beam shall easily be detected.
For the test tube dispensing optical detection to pass as functional, the laser diode beam must remain in constant contact with the OFT-5301 unless momentarily broken by a dispensed test tube; upon being broken and reconnected, the microcontroller I/O pin shall detect at least one (1) optical trigger. The dispensing optical detection sensor shall pass as reliable if the sensor meets the requirements for functionality, with the difference being that the microcontroller I/O pin registers only one (1) optical trigger for each test tube dispensed. This process shall be tested for five (5) consecutively dispensed test tubes.
The optical sensor design shall additionally be used for the Boot capacity sensor, and shall similarly be verified for functionality and reliability. The Capacity sensor shall pass as both functional and reliable given that the laser diode beam only connects with the phototransistor when all test tube obstructions are cleared from the direct line of sight, and the microcontroller I/O remains high.

P a g e | 108
These test cases shall be performed on five separate events, and are shown
within Table 19.
7.2.1.4 Scanner Roller
To provide the dispensed test tube the ability to rotate to allow the identifying barcode to be read by the barcode scanner, the scanner roller must continue to rotate until either the test tube is dispensed to the tongue, or discarded. For the Scanner Roller to pass as functional, the roller shall rotate for five (5) consecutive successfully read barcoded test tubes on the first time. For the Roller to pass a Reliable, the roller shall successfully rotate and stop for five (5) consecutive successfully read barcoded test tubes after one (1) timeout reset.
These test cases shall be performed on five separate events, and are shown
within Table 19.
7.2.1.5 Barcode Scanner
The barcode scanner shall be utilized to read the barcodes of each dispensed test tube before leaving the system enclosure. For the scanner to pass as functional the untainted barcodes of ten (10) consecutive test tubes must be read; for the scanner shall pass as reliable, the barcodes of twenty (20) consecutive test tubes must be read.
These test cases shall be performed on five separate events, and are shown within Table 19.
7.2.1.6 Tilting Dispensing Chute
Similar to the Pacman Roller, an identical DC motor that shall rotate at a rate of 30 RPM drives the Dispensing Chute; additionally, the motor contains no feedback sensor, but is moved based off of the time of enabled power to the motor. The tilting motor holds the ability to rotate bi-directionally, which shall add in another factor of the reliability of the motor positioning.
For the Dispensing Chute to pass as functional, the chute shall be able to tilt towards the Tongue when the barcode scanner registers a positive barcode scan, wait two (2) seconds, and return to the idle position a minimum of 5 consecutive trials. If the barcode scanner does not register a positive barcode three consecutive times, the chute shall rotate towards the discard bin, wait two (2) seconds, and return to the idle position a minimum of 5 consecutive trials. For the Chute to pass as reliable the chute shall meet the same requirements for functionality, just with a minimum number of 10 trials.
These test cases shall be performed on five separate events, are shown within
Table 19.

P a g e | 109
Table 19 – Dispenser Hardware Specific Testing (Each Set of Trials Repeated 5 times)
Component Functionality Requirements
Min. Consecutive Functional
Trials
Reliability Requirements
Min. Consecutive
Reliable Trials
Boot No Jam w/ Pacman at 30RPM
10 No Jam w/ Pacman at 30 RPM
30
Capacity Sensor Laser is obstructed until tubes are below min.
1 Laser is obstructed until tubes are below min.
1
Pacman Dispense only one (1) test tube
1 Meet functionality and reset within .25 rotations of initial position
1
Dispense Sensor Laser in contact with OFT-5301 and at least one (1) trigger detected
5 Meet functionality and only sense one (1) trigger per test tube
5
Scanner Roller Rotate until untainted barcodes read
5 Meet functionality but after one (1) reset
5
Barcode Scanner
Successfully read untainted barcodes
10 Successfully read untainted barcodes
20
Dispense Chute Positive barcode: Tilt to tongue, then return to idle. Negative barcode: Tilt toward discard, then return to idle.
5 Meet functionality 10
7.2.2 Collector
The testing of the collector shall consist of 10 consecutive trials of dispensing test tubes which shall entail the solenoid unlocking the front door and the return sensor successfully registering each sample deposit.
7.2.3 Bag Dispenser
The bag dispenser subsystem consists of two main parts - the bag supply’s hatch lock and the bag sensor. The hatch lock receives its command signal from the microprocessor but may be simulated with a 3V power supply. To ensure these systems are working as they should, the following testing procedures shall be conducted to troubleshoot the systems. All power sources should be powered off before connecting and removing components. Also, before doing any work on any circuits, discharge any potential static build up by touching a nearby metal object to prevent damage components. Measure resistor values with a

P a g e | 110
multimeter and make sure all components connections are correct and match the circuit diagrams. Also check continuity of wires with the multimeter and replace any broken wires.
7.2.4 Hatch Lock
1. Apply a 6 V signal to the solenoid and check if the armature actuates into the solenoid body. Test the hold of the armature by slightly tugging on it (the hold should be quite strong).
2. Once proper solenoid action is confirmed, disconnect the power and ensure see the armature returns to the extended position.
3. Connect the solenoid to the hatch lock switching circuit and connect Vcc to a solenoid terminal and to the switching circuit. The input of the circuit is connected to the msp430 output pin or a 5V test supply source. Double check the circuit and power on Vcc.
4. Apply an input to the circuit through the microcontroller or test supply for 20 seconds. If input is through microcontroller, record time duration of actuation.
5. Observe the solenoid and confirm the bolt actuates. The bolt should stay engaged for as long as the input signal is high. Check the pulling force again by tugging on the solenoid armature. Switch off the input and allow the bolt to return to locked position.
6. Repeat steps 4 and 5 at least 3 - 12 times in succession allowing little time for solenoid to cool in between cycles. Note the heat generated from the solenoid and repeatability of the solenoid – does the solenoid show signs of wear or loss of actuation action?
Note that using a 5V test supply is for circuit testing only. Once installed into the Doc Box, the locking circuit will receive its input signal from the microcontroller. The test supply is simply used to simulate the microcontroller signal to the input. Therefore, before installing into the Doc Box, this system must be tested using the programmed microcontroller. For troubleshooting, refer to Table 20.
Table 20 - Hatch Lock Troubleshooting Guide
Troubleshooting Guide – Hatch Lock.
Function Issue Explanation/Fix
Solenoid – Actuating Action
Armature/Bolt does not actuate or if holding force is very weak.
Check the input source output, supply voltage, and connections to the solenoid. If source output is correct and there are no connection problems, solenoid may be damaged and should be replaced.
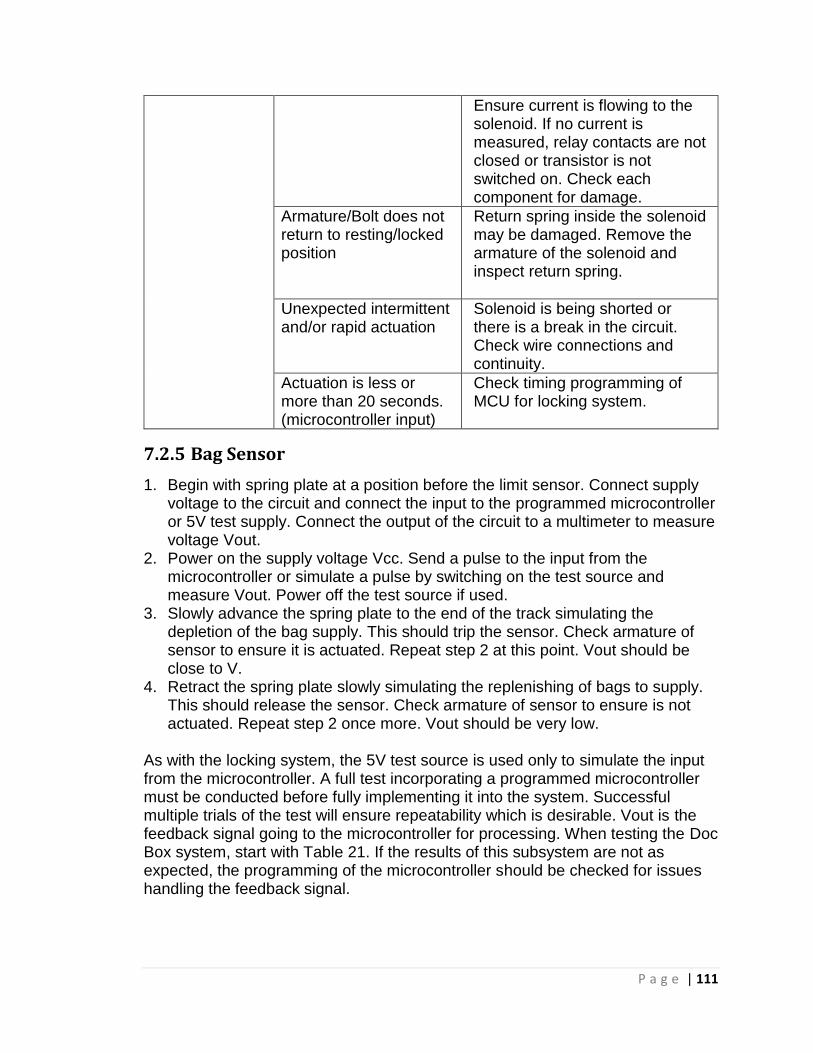
P a g e | 111
Ensure current is flowing to the solenoid. If no current is measured, relay contacts are not closed or transistor is not switched on. Check each component for damage.
Armature/Bolt does not return to resting/locked position
Return spring inside the solenoid may be damaged. Remove the armature of the solenoid and inspect return spring.
Unexpected intermittent and/or rapid actuation
Solenoid is being shorted or there is a break in the circuit. Check wire connections and continuity.
Actuation is less or more than 20 seconds. (microcontroller input)
Check timing programming of MCU for locking system.
7.2.5 Bag Sensor
1. Begin with spring plate at a position before the limit sensor. Connect supply voltage to the circuit and connect the input to the programmed microcontroller or 5V test supply. Connect the output of the circuit to a multimeter to measure voltage Vout.
2. Power on the supply voltage Vcc. Send a pulse to the input from the microcontroller or simulate a pulse by switching on the test source and measure Vout. Power off the test source if used.
3. Slowly advance the spring plate to the end of the track simulating the depletion of the bag supply. This should trip the sensor. Check armature of sensor to ensure it is actuated. Repeat step 2 at this point. Vout should be close to V.
4. Retract the spring plate slowly simulating the replenishing of bags to supply. This should release the sensor. Check armature of sensor to ensure is not actuated. Repeat step 2 once more. Vout should be very low.
As with the locking system, the 5V test source is used only to simulate the input from the microcontroller. A full test incorporating a programmed microcontroller must be conducted before fully implementing it into the system. Successful multiple trials of the test will ensure repeatability which is desirable. Vout is the feedback signal going to the microcontroller for processing. When testing the Doc Box system, start with Table 21. If the results of this subsystem are not as expected, the programming of the microcontroller should be checked for issues handling the feedback signal.

P a g e | 112
Table 21 - Bag Sensor Troubleshooting Guide
Troubleshooting Guide – Bag Sensor
Function Issue Explanation/Fix
Sensor Circuit Output Vout is not ~ 0V when sensor is not activated
Transistor is being switched on. Check if input source is outputting current.
Output Vout is not ~ 5V when sensor is activated
Current is being drawn elsewhere. Possible short. Check connections and resistor values.
Sensor Actuation
Sensor not being activated
Adjust position of sensor closer to the spring plate extension rib.
Sensor stays activated Sensor is too close to the dispenser. Adjust position and check that the sensor body does not move when armature is actuated.
7.2.6 Holder Test Procedures
The holder’s temperature control must be tuned to best maintain a constant temperature in the cooling area. Since we do not know how fast the cooling unit can reduce temperature for the space given, this will have to be tested. Once it is known how fast the cooling unit can bring down the temperature, the temperature control can be adjusted to control how often the temperature is checked inside the holder and the cooling unit being turned on accordingly. This section will describe the steps taken to test the cooling unit’s cooling ability and the tuning of the temperature control. Additionally, Table 23 provides a troubleshooting guide for the testing of the system. The temperature control circuit in Figure 33 will also be referenced. 1. With the temperature controller disconnected to the cooling unit, power on the
cooling unit to begin cooling the holder area starting to ambient temperature. Observe and record this starting temperature and the temperature change over time every minute thereafter until the temperature inside the holder reaches 3°C or 38°F. Temperature can be measured with a thermometer probe or through the built in temperature sensor used in the temperature control. Measure the temperature through the sensor by measuring the voltage across its output going into the temperature control. This voltage is linearly proportional to the centigrade temperature meaning at 25°C the resultant voltage is 250mV. The voltage – temperature relation is seen
graphically in Figure 55.

P a g e | 113
Figure 55 – LM35 Voltage Temperature Relation
2. The target temperature is set by adjusting R1. The resultant voltage Vref over
R2 corresponds to the target temperature. This voltage can be calculated by equation (1). Note that this desired voltage should not exceed 5V.
𝑉𝑟𝑒𝑓 = (𝑡𝑒𝑚𝑝𝑒𝑟𝑎𝑡𝑢𝑟𝑒 (°𝐶)
100) (
𝑅𝑑
𝑅𝑐+ 1) (23)
The values for R1 and R2 can be obtained from equation (2) with (1).
𝑉𝑟𝑒𝑓 = 𝑉𝑠 (𝑅2
𝑅1 + 𝑅2)
(24)
3. Once the temperature’s rate of change is determined, adjust the clock cycle
by adjusting Rb. The equations for the 555 timer are given in Table 22 (found from product datasheet [32]) The low time of the cycle should be as long as it takes for the temperature to change 1°C or 2°C around target temperature.
4. Figure 56 is a schematic of the LM555 for astable operation.
-250
-200
-150
-100
-50
0
50
100
150
200
250
-25 -20 -15 -10 -5 0 5 10 15 20 25
Ou
tpu
t (m
V)
Temperature (°C)
LM35 Voltage Temperature Relation

P a g e | 114
Figure 56 - LM555 Schematic Astable Operation
Table 22 - Cycle Timing Equations of LM555
LM555 Timing Equations
High Time 𝑡1 = 0.693(𝑅𝑎 + 𝑅𝑏)𝐶
Low Time 𝑡2 = 0.693(𝑅𝑎)𝐶
Period 𝑇 = 0.693(𝑅𝑎 + 2𝑅𝑏)𝐶
Frequency 𝑓 =
1.44
(𝑅𝑎 + 2𝑅𝑏)𝐶
Duty Cycle 𝐷 =
𝑅𝑏
(𝑅𝑎 + 2𝑅𝑏)
5. After temperature controller is tuned, test the cooling unit with the
temperature controller. Observe peak low temperature and the length of time it takes for the holder to shut off indicating target is reached. If peak low temperature is below 3°C, the 555 timer cycle may be too long or the target temperature is not adjusted correctly. If so, repeat steps 2 to 3 until satisfactory settle time is achieved.

P a g e | 115
Table 23 – Holder Troubleshooting Guide
Troubleshooting Guide – Holder
Function Issue Explanation/Fix
Temperature Control.
Cooling unit does not switch on.
Vref not properly set. Refer to step 2 from testing procedure to set Vref. Vtemp (from temperature sensor) is not outputting a voltage. Inspect the circuit and ensure a voltage appears from Op2 into the comparator. Check output of comparator.
Cooling unit does not switch off
Cooling unit stays on/off too long. Temperature swing is too high.
The timer cycle is set too high. Refer to step 3 in testing procedure to tune the 555 timer. Easy way to change cycle time is to change the value of C.
Cooling Unit Compressor is running but holder is not getting cooler.
Check for air leaks on the enclosure and refrigerant leaks on the compressor. If compressor is leaking refrigerant/ oil, compressor should be replaced. Inspect air circulating fan. Warmer air must contact the evaporator for area to cool. If fan does not turn on when cooling, test fan motor and/or circuit.
7.3 Software Testing Environment
Test procedures for identifying and verifying the Doc Box software system are laid out in the following sections. Testing is performed in a controlled environment with data collection to verify the results. Testing takes place during the entire development process on the development machine. Final testing takes place on the actual hardware before and after installation inside the Doc Box.
7.4 Software Specific Testing
Testing of the system starts with testing each subsystem individually. Once each component is tested and working, a well-organized test procedure is followed to find flaws in the system before production. The three software subsystems
P a g e | 116
involved are the operating system software (OSS), embedded software, and the laboratory portal application (LPA).
7.4.1 Application Software Testing
The Doc Box application requires extensive testing to eliminate any malfunctions in the field. The UI is the interface that connects the customer to the functionality of the machine; therefore, the UI must work as planned. Testing of the software involves multiple levels of testing to realize a successful platform.
The most important testing involves allowing test users to interact with the UI. Test users are chosen to reflect all different ages and technical backgrounds. By not being familiar with the path the software should take, the customer will click all sorts of different areas that the designers may not try. This provides a better variety of actions that a user may try when approaching the Doc Box. Different technical backgrounds provide feedback into the usability of the system. After each user has spent some time navigating the UI they are asked to fill out a short survey that provides the designers with immediate feedback that can be integrated into the final design.
Another aspect of the UI to be tested is the functionality of the system. To test the UI’s ability to complete the actions requested by the user sample runs will be taken. The process of request and vend is repeated over and over again to ensure repetitive use does not jam the system.
Logging is an important process in the testing phase. The application software is capable of logging all events that take place in the system. This provides detailed data about the events and what time these events take place. This data allows for precise adjustments to be made throughout the system.
7.4.2 Barcode Reading Software Testing The barcode reading software only requires minimal testing to ensure a capture is made every time a sample tube is present. The barcode reading system is tested using a system maintenance tool (SMT) that allows direct control over all properties of the Doc Box hardware and software. The SMT is used to trigger the barcode reader in repetition and at varying intervals to test that the system always capture a reading when requested.
7.4.3 Magnetic Card Reading Software Testing
The magnetic card reader used for processing payment is tested in a similar manner as the barcode reader. Test swipes are done at regular and varying interval while the SMT captures the data. This method tests that the device is working properly. Test swipes are also done during different frames of the UI to make sure the reader only accepts a value at the right time. Testing this is crucial to make sure random swipes do not affect the UI.

P a g e | 117
7.4.4 Embedded Software Testing
Extensive testing takes place on the embedded software. Since the embedded software is the internal control of the Doc Box system it must always function as according to plan. If the embedded software malfunctions the entire system is compromised and will have to shut down. To avoid this, a detailed plan of testing is laid out in the following section.
The embedded software is created using Code Composer Studio 5.5.0 (CCS). CCS provides useful debugging tools to observe code execution. The register view window allows the register file to be observed. The entire block of code on the microcontroller memory is stepped through while observing the register file to look for any mistakes that could cause undesired operation. A memory viewing tool is also available that is observed the same way the register viewer is. The memory is observed to look for any incomplete tasks that could place the unit at a security risk.
Before any portion of the embedded software, and all the inputs and outputs associated with it, are implemented inside the system each component is individually tested. Each subsystem is configured in the laboratory on prototyping equipment to test its functionality. Once each system is tested and verified a complete prototype system is configured. With the complete system configured the SMT tool is introduced. Using the SMT, every procedure that the Doc Box does can be executed without the use of the UI. Observing each procedure execute and completes correctly ensures the system works properly.
With the functionality in place the embedded software system can be connected to the UI for further testing. The idea of this test procedure is build the unit up in individual components, testing along the way, then combine them with more testing. Every procedure previously tested is again tested using the UI rather than the SMT. This is the final level of testing for the embedded software. When the unit executes dispense and retrieval procedures through instructions from the UI the system is complete.
7.4.5 Laboratory Portal Software Testing
The laboratory portal application (LPA) is tested by installing it in multiple remote locations. Each location is chosen to have a different operating system with different hardware. This tests that the LPA will work on different PCs since each laboratory location may be using different computers. The application is also tested on different network connections. This is useful to ensure a connection to the database can be made from through a variety of connection types and speeds.
7.4.6 Serial Communication Testing
The serial communication system is the link between the Doc Box application and the microcontroller. This link is vital for the operation of the Doc Box. The communication link is tested by passing every possible piece of data that the

P a g e | 118
system may use and looking for bit errors. The link is observed using an oscilloscope is view and verify the data being passed is in fact the data requested. The Tx and Rx pins are observed using two channels of the oscilloscope. The waveforms generated are logged and compared to the data sent to look for errors.
7.4.7 Database Software Testing
The database system is managed by Amazon Web Services which is a reputable and reliable host. The testing involved here is to flood the database with as many users as possible to see if the data is handled properly and none is lost. The database is set up to handle more users than the Doc Box expects and is also scalable to expand if necessary. MySql Workbench 6.0 is an application that allows configuration, development, and testing of the database. This software is used extensively to manage and test the integrity of the database.
8 Administrative Content
8.1 Milestone Discussion
At the beginning of the project, Group 12 laid out a plan list of project milestones to be completed within the two semesters of the project. shows the layout of the milestones. Throughout the course of the first semester of the Doc Box project, the deadlines and many definitions of milestones changed from what was originally established. Nevertheless, many of the milestones specified in 2.2 were successfully completed, which can be verified by comparing the shown milestones with the entire Doc Box system.
It is noted that the specific dates laid down within the milestones did indeed act as motivational landmarks for the project as a whole; however, the several dates only seemed to cause slight confusion over what exactly needed to get completed. The main helpful component of the milestone chart is the segregation of each of the groups into the description, research, test and design phases. Such an addition to the chart improved the effective performance of the groups’ mindset, so as to understand what to be thinking about in the present as well as the future. Examples of specific significant milestones of Group 12 are:
Creating the design group: Although it has been stated that there are many important hardware and software components of the Doc Box system, the entire planning of the system, and the future implementation of the building phase, has, and will, only be possible through a cooperative team environment. With this in consideration, it is first of all noted that the formation of Senior Design Group 12 is a significant milestone for the Doc Box project, for without the group, the project would likely not exist.
Project Definition and Sponsor Interaction: Once the group was formed, another milestone was to initially all agree on a project to spend the next school year
P a g e | 119
working together on. After hearing the initial proposal of the Doc Box, Group 12 unanimously agreed to take up the project, for the fact of seeing the great potential that there is not only in gaining more electrical engineering experience, but also to produce a product that can potentially change the society that here today. Additionally, the meeting of the sponsors of the project (Doc Box Inc.) was a strong milestone of the group, due to the fact of obtaining a strong communicational relationship between the design group and the sponsor that shall hopefully lead to a project that satisfies the requirements given by the sponsor. After meeting with the sponsor, the definitions of the project were a lot clearer, and therefore led to a more clearly defined research for the project.
Research of Subsystem Requirements: After defining the project, the design group was able to begin with composing initial design plans, so as to invoke a mindset of what to research for result in more detailed design of the project components. The research of the initial design ideas is an extremely important part of any technical design, for the fact of checking the validity of the design, or even possibly finding more effective solutions. Consequently, not all of the initial designs remained past the initial research stage, however, they did act as productive stepping stones toward the final design for the fall.
Dispenser and Software Interface Design: Until now, the milestones have been in a very broad sense, but after the researching milestone was completed, the design of the subsystems began, and one particularly important subsystem was designed: the Dispenser. The Dispenser underwent multiple design revisions, and most likely will continue to be revised, but plays a very important role in the overall system. Therefore, upon receiving the final fall design of the dispenser, a large milestone of the Doc Box was achieved. Additionally, the software for the control of the system via the microcontroller and CPU reached an important milestone upon determining the method of serial communication between the two
Final Fall Proposal Documentation: After completing this document, the final milestone of the fall was achieved. With the achievement of this document, the group was able to better understand the entire system, being able to describe it in significant detail to be carried out in the following semester.
Overall, Group 12 seemed to only deviate from the predicted deadline dates for a small amount of time; however, the main goal of researching, and designing proved to stay true throughout the initial semester, and hopefully should be carried out into the spring.
The following table is the Gantt chart of the milestone predictions for Group 12. The corresponding table of these milestones can be seen in Section 2.2.

P a g e | 120
/14
/'
8
13
10 /3
/' 13
1
1 /2
2/' 1
3
1 /1
1/' 1
4
3 /2
/' 14
4
/21
/' 1
4
Des
crib
e
Pro
ject
nar
rati
ve d
escr
ipti
on
In
itia
l pro
ject
sp
ecif
icat
ion
s re
qir
emen
ts
Syst
em b
lock
dia
gram
P
roje
ct b
ud
get
Gro
up
mem
ber
ro
le d
eleg
atio
n
Init
ial p
roje
ct p
rop
osa
l R
esea
rch
C
om
pu
ter/
mic
roco
ntr
olle
r ab
iliti
es
Use
r in
terf
ace
met
ho
ds
Pro
du
ct v
end
ing
/ co
llect
ion
In
dex
met
ho
ds
Secu
rity
an
d p
riva
cy
Med
ical
sam
ple
han
dlin
g re
qu
irem
ents
W
eb d
atab
ase
man
agem
ent
Po
wer
su
pp
ly r
equ
irem
ents
D
iagn
ost
ic D
evic
e C
om
mu
nic
atio
n, c
ircu
itry
C
limat
e co
ntr
ol /
ho
ldin
g m
eth
od
s
Des
ign
C
om
pu
ter/
mic
roco
ntr
olle
r in
terf
ace
U
ser
inte
rfac
e
Use
r in
terf
ace
wit
h c
om
pu
ter
Pro
du
ct d
isp
ense
r /
colle
cto
r
Secu
rity
an
d p
riva
cy in
dex
ing
syst
em
Web
dat
abas
e
Po
wer
su
pp
ly
Clim
ate
con
tro
lled
pro
du
ct s
tora
ge
Dia
gno
stic
Dev
ice
Te
st
Co
mp
ute
r/m
icro
con
tro
ller
inte
rfac
e
Use
r in
terf
ace
wit
h c
om
pu
ter
Pro
du
ct d
isp
ense
r /
colle
cto
r
Secu
rity
an
d p
riva
cy in
dex
ing
W
eb d
atab
ase
acce
ssib
ility
C
limat
e an
d s
tora
ge s
yste
m
Dia
gno
stic
Dev
ice
P
ow
er s
up
ply
Figu
re 5
7 –
Mile
sto
ne
Gan
tt C
har
t
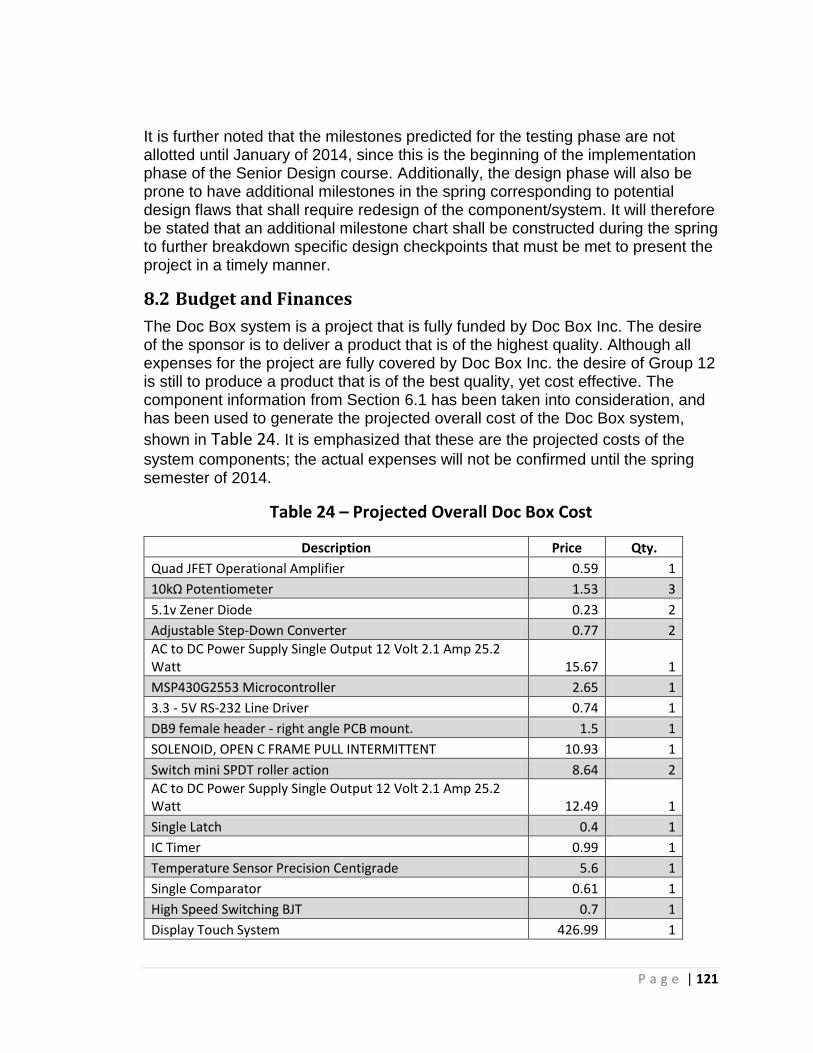
P a g e | 121
It is further noted that the milestones predicted for the testing phase are not allotted until January of 2014, since this is the beginning of the implementation phase of the Senior Design course. Additionally, the design phase will also be prone to have additional milestones in the spring corresponding to potential design flaws that shall require redesign of the component/system. It will therefore be stated that an additional milestone chart shall be constructed during the spring to further breakdown specific design checkpoints that must be met to present the project in a timely manner.
8.2 Budget and Finances
The Doc Box system is a project that is fully funded by Doc Box Inc. The desire of the sponsor is to deliver a product that is of the highest quality. Although all expenses for the project are fully covered by Doc Box Inc. the desire of Group 12 is still to produce a product that is of the best quality, yet cost effective. The component information from Section 6.1 has been taken into consideration, and has been used to generate the projected overall cost of the Doc Box system,
shown in Table 24. It is emphasized that these are the projected costs of the
system components; the actual expenses will not be confirmed until the spring semester of 2014.
Table 24 – Projected Overall Doc Box Cost
Description Price Qty.
Quad JFET Operational Amplifier 0.59 1
10kΩ Potentiometer 1.53 3
5.1v Zener Diode 0.23 2
Adjustable Step-Down Converter 0.77 2
AC to DC Power Supply Single Output 12 Volt 2.1 Amp 25.2 Watt 15.67 1
MSP430G2553 Microcontroller 2.65 1
3.3 - 5V RS-232 Line Driver 0.74 1
DB9 female header - right angle PCB mount. 1.5 1
SOLENOID, OPEN C FRAME PULL INTERMITTENT 10.93 1
Switch mini SPDT roller action 8.64 2
AC to DC Power Supply Single Output 12 Volt 2.1 Amp 25.2 Watt 12.49 1
Single Latch 0.4 1
IC Timer 0.99 1
Temperature Sensor Precision Centigrade 5.6 1
Single Comparator 0.61 1
High Speed Switching BJT 0.7 1
Display Touch System 426.99 1
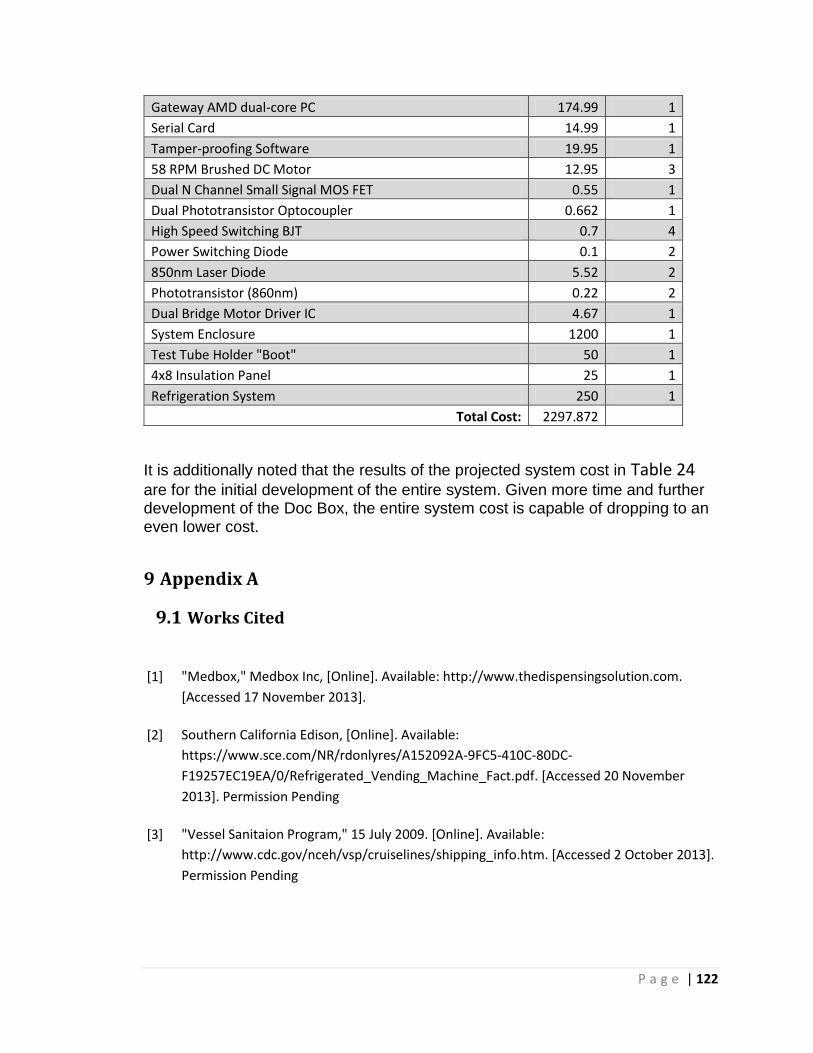
P a g e | 122
Gateway AMD dual-core PC 174.99 1
Serial Card 14.99 1
Tamper-proofing Software 19.95 1
58 RPM Brushed DC Motor 12.95 3
Dual N Channel Small Signal MOS FET 0.55 1
Dual Phototransistor Optocoupler 0.662 1
High Speed Switching BJT 0.7 4
Power Switching Diode 0.1 2
850nm Laser Diode 5.52 2
Phototransistor (860nm) 0.22 2
Dual Bridge Motor Driver IC 4.67 1
System Enclosure 1200 1
Test Tube Holder "Boot" 50 1
4x8 Insulation Panel 25 1
Refrigeration System 250 1
Total Cost: 2297.872
It is additionally noted that the results of the projected system cost in Table 24
are for the initial development of the entire system. Given more time and further development of the Doc Box, the entire system cost is capable of dropping to an even lower cost.
9 Appendix A
9.1 Works Cited
[1] "Medbox," Medbox Inc, [Online]. Available: http://www.thedispensingsolution.com.
[Accessed 17 November 2013].
[2] Southern California Edison, [Online]. Available:
https://www.sce.com/NR/rdonlyres/A152092A-9FC5-410C-80DC-
F19257EC19EA/0/Refrigerated_Vending_Machine_Fact.pdf. [Accessed 20 November
2013]. Permission Pending
[3] "Vessel Sanitaion Program," 15 July 2009. [Online]. Available:
http://www.cdc.gov/nceh/vsp/cruiselines/shipping_info.htm. [Accessed 2 October 2013].
Permission Pending

P a g e | 123
[4] "Salimetrics Literature," 2012. [Online]. Available: http://www.salimetrics.com/literature.
[Accessed 5 September 2013]. Permission Pending
[5] "CODE OF FEDERAL REGULATIONS (ANNUAL EDITION)," 1 October 2012. [Online].
Available:
http://www.gpo.gov/fdsys/browse/collectionCfr.action?selectedYearFrom=2012&go=Go.
[Accessed 15 November 2013]. Permission Pending
[6] "GS1 General Specifications," 2013 July 2013. [Online]. Available:
http://www.gs1.org/genspecs. [Accessed 3 November 2013]. Permission Pending
[7] "Enhancing Barcode Scanner Design," [Online]. Available:
http://www.silabs.com/products/mcu/Pages/barcode-scanner-design-using-a-32-bit-
microcontroller.aspx. [Accessed 5 November 2013]. Permission Pending
[8] "Barcode Scanning," 2007. [Online]. Available: http://ap.motorolasolutions.com/kr/msi-
retail/docs/msi/T_MotorolaRetailVerticalssiteresourcesWhitepapersLaser_Scan_Digital_I
mage_WP_New.pdf. [Accessed 7 November 2013]. Permission Pending
[9] "Stepper Motors," 25 July 2007. [Online]. Available:
http://www.allaboutcircuits.com/vol_2/chpt_13/5.html. [Accessed 13 November 2013].
Permission Pending
[10] "Brushless DC Motor," 25 July 2007. [Online]. Available:
http://www.allaboutcircuits.com/vol_2/chpt_13/6.html. [Accessed 9 November 2013].
Permission Pending
[11] Occupational Safety and Health Administration, "Ground-Fault Circuit Interrupters
(GFCI)," [Online]. Available:
https://www.osha.gov/SLTC/etools/construction/electrical_incidents/gfci.html.
[Accessed 20 November 2013].
[12] J. Rowley and F. Slack, Designing Public Access Systems, Brookfield: Gower Publishing
Limited, 1998. Permission Pending
[13] "The GTK+ Project," 2007-2012. [Online]. Available: http://www.gtk.org/. [Accessed 28
October 2013]. Permission Pending
[14] "Qt Project," 2013. [Online]. Available: http://qt-project.org/. [Accessed 28 October
2013]. Permission Pending

P a g e | 124
[15] "Qt-Project Graphics View Famework," 2013. [Online]. Available: http://qt-
project.org/doc/qt-4.8/graphicsview.html. [Accessed 30 October 2013]. Permission
Pending
[16] "Texas Instuments," July 2013. [Online]. Available:
http://www.ti.com/general/docs/lit/getliterature.tsp?literatureNumber=slau144j&fileTy
pe=pdf. [Accessed 30 October 2013]. Permission Pending
[17] S. Wayne, "Basic Electronics Tutorial," 11 2013. [Online]. Available:
http://www.electronics-tutorials.ws/io/io29.gif. [Accessed 20 October 2013]. Permission
Pending
[18] Humboldt State University, "Vapor Compression Refrigeration System," [Online].
Available: http://www.humboldt.edu/engineering/resources/equipment-
handbook/refrig. [Accessed 15 November 2013]. Permission Pending
[19] P. Binneberg, E. Kraus and H. Quack, "Reduction In Power Consumption Of Household
Refrigerators By Using Variable Speed Compressors," 2002. [Online]. Available:
http://docs.lib.purdue.edu/cgi/viewcontent.cgi?article=1614&context=iracc. [Accessed
23 Nov 2013]. Permission Pending
[20] W. R. Chang, D. Y. Liu, S. G. Chen and N. Y. Wu, "The Components and Control Methods
for Implementation of Inverter-Controlled Refrigerators/Freezers," 2004. [Online].
Available: http://docs.lib.purdue.edu/cgi/viewcontent.cgi?article=1695&context=iracc.
[Accessed 12 November 2013]. Permission Pending
[21] VFDs.com, "What is a Variable Frequency Drive?," [Online]. Available:
http://www.vfds.com/what-is-a-vfd. [Accessed 15 November 2013]. Permission Pending
[22] D. Brown, N. Fernandez, J. Dirks and T. Stout, "The Prospects of Alternatives to Vapor
Compression Technology for Space Cooling and Food Refrigeration Applications," March
2010. [Online]. Available:
http://www.pnl.gov/main/publications/external/technical_reports/pnnl-19259.pdf.
[Accessed 16 November 2013]. Permission Pending
[23] C. Mathas, "Temperature Sensors - The Basics," [Online]. Available:
http://www.digikey.com/us/en/techzone/sensors/resources/articles/temperature-
sensors-the-basics.html. [Accessed 12 November 2013].
[24] M. Duff and J. Towey, "Two Ways to Measure Temperature Using Thermocouples Feature
Simplicity, Accuracy, and Flexibility," Analog Devices Inc, October 2010. [Online].

P a g e | 125
Available: http://www.analog.com/library/analogDialogue/archives/44-
10/thermocouple.html. [Accessed 16 November 2013]. Permission Pending
[25] "Temperature tutorial: Thermocouple vs. RTD vs. thermistor," 19 April 2007. [Online].
Available:
http://www.controleng.com/index.php?id=483&cHash=081010&tx_ttnews[tt_news]=59
28. [Accessed 15 November 2013].
[26] National Instruments, "Working with Thermistors and RTD," National Instruments,
[Online]. Available: http://www.ni.com/white-paper/2948/en/. [Accessed 17 November
2013]. Permission Pending
[27] "1541L 15-inch LCD Open-Frame Touchmonitor," 2013. [Online]. Available:
http://www.elotouch.com/products/lcds/1541L/default.asp. [Accessed 20 November
2013]. Permission Pending
[28] "1N4733A," April 2009. [Online]. Available:
http://www.fairchildsemi.com/pf/1N/1N4733A.html. [Accessed 1 November 2013].
Permission Pending
[29] "SSM6N36FE," 26 February 2008. [Online]. Available: http://www.digikey.com/product-
detail/en/SSM6N36FE,LM%28T/SSM6N36FELM%28TCT-ND/2257814. [Accessed 7
November 2013]. Permission Pending
[30] "MSP430G2553IPW20," May 20213. [Online]. Available:
http://www.digikey.com/product-detail/en/MSP430G2553IPW20/296-33465-5-
ND/2695695. [Accessed 2 November 2013]. Permission Pending
[31] "TRS3221CPWR," 14 July 2007. [Online]. Available: http://www.digikey.com/product-
detail/en/TRS3221CPWR/296-25017-2-ND/1908930. [Accessed 12 November 2013].
Permission Pending
[32] "LM555," 21 March 2013. [Online]. Available: http://www.ti.com/product/lm555.
[Accessed 11 November 2013]. Permission Pending
[33] B. Bobman, "Who Is Abraham Lincoln," 5 January 2013. [Online]. Available:
http://www.gotquestions.org/whoisabrahamlincoln. [Accessed 30 11 2013].

P a g e | 126
9.2 Table of Tables
Table 1 – Doc Box Project Milestones From Fall 2013 to Spring 2014 ............................................ 6
Table 2 – Comparison of Energy Consumption of Fixed & Variable Compression Refrigerators/
Freezers [20] .................................................................................................................................. 38
Table 3 – Alternatives to Vapor Compression Technology [22] .................................................... 39
Table 4 - 1541L Touch System Specifications ................................................................................ 44
Table 5 – Boot Dimensions ............................................................................................................ 48
Table 6 – Dispensing Chute Specifications ..................................................................................... 49
Table 7 – Component Specifications for Motor Driver Switch Circuit ........................................... 53
Table 8 – L298 Logic Input Truth Table .......................................................................................... 54
Table 9 – Component Specifications for Tilt Motor Circuit ........................................................... 54
Table 10 – Component Specification for Detection Circuit ........................................................... 55
Table 11 - Temperature Control Logic ........................................................................................... 62
Table 12 - Microcontroller Requirements ..................................................................................... 64
Table 13 - MSP430G2553 Electrical Characteristics [30] ............................................................... 65
Table 14 - PC Specifications ........................................................................................................... 77
Table 15 - UART Control Registers ................................................................................................. 85
Table 16 - Execution Command Scheme ....................................................................................... 85
Table 17 - System Status ................................................................................................................ 86
Table 18 – Dispenser Parts Listing ............................................................................................... 101
Table 19 – Dispenser Hardware Specific Testing ......................................................................... 109
Table 20 - Hatch Lock Troubleshooting Guide ............................................................................. 110
Table 21 - Bag Sensor Troubleshooting Guide ............................................................................. 112
Table 22 - Cycle Timing Equations of LM555 ............................................................................... 114
Table 23 – Holder Troubleshooting Guide ................................................................................... 115
Table 24 – Projected Overall Doc Box Cost .................................................................................. 121
9.3 Table of Figures
Figure 1 – Doc Box Top Level System Block Diagram ...................................................................... 8
Figure 2 - Energy Consumption of Vending Machine Components [2] ......................................... 11
Figure 3 – Brushed DC Motor Fundamentals ................................................................................. 16
Figure 4 – Stepping Sequence for Stepper Motors [9] .................................................................. 17
Figure 5 – Hall Effect Sensor [10] ................................................................................................... 17
Figure 6 – Dispenser Wheel Logic Methods: Discrete Rotation .................................................... 18
Figure 7 – Dispenser Wheel Logic Methods: Sensor Feedback ..................................................... 18
Figure 8 – Dispenser Wheel Dynamics ........................................................................................... 19
Figure 9 - Power Supply Diagram .................................................................................................. 20
Figure 10 - Range of Users ............................................................................................................. 24
Figure 11 - Signals and Slots ........................................................................................................... 26
Figure 12 - QGraphicsView ............................................................................................................ 29

P a g e | 127
Figure 13 - GraphicsView Coordinates ........................................................................................... 30
Figure 14 – Serial Data Protocol ..................................................................................................... 32
Figure 15 - Cross Section of Pull-Type Solenoid [17] ..................................................................... 36
Figure 16 – The Vapor Compression Cycle [18] ............................................................................. 37
Figure 17 – VFD Schematic [21] ..................................................................................................... 38
Figure 18 – RTD Resistance Vs Temperature [26] ......................................................................... 41
Figure 19 – Doc Box System Enclosure .......................................................................................... 43
Figure 20 - Elo Touch Systems 1541L [27] ..................................................................................... 44
Figure 21 – Dispenser Operation Diagram ..................................................................................... 46
Figure 22 – Boot Dimensions ......................................................................................................... 47
Figure 23 – Dispenser Motor Voltage Vs. Speed ........................................................................... 50
Figure 24 - Adjustable Linear Regulator Schematic ....................................................................... 51
Figure 25 – Dispenser Motor Driver Switching Circuit ................................................................... 53
Figure 26 – Tilt Motor Driver Circuit .............................................................................................. 54
Figure 27 – Photo Detection Circuit ............................................................................................... 55
Figure 28 - Locking Circuit .............................................................................................................. 56
Figure 29 - Bag Dispense Flow Diagram ......................................................................................... 57
Figure 30 - Bag Supply Sensor Circuit ............................................................................................ 59
Figure 31- State Diagram of Collector Operations ......................................................................... 60
Figure 32 - Optical Capacity / Return Sensor ........................................................................... 61
Figure 33 - Temperature Control Circuit ........................................................................................ 62
Figure 34 -MSP430 Power Diagram ............................................................................................... 67
Figure 35 - Adjustable Step-Down Converter Configuration................................................... 68
Figure 36 - Inductor Current vs. Time ............................................................................................ 69
Figure 37 - Capacitor Current vs. Time .......................................................................................... 70
Figure 38 – General Purpose Output Buffer / Level Shifter ........................................................... 71
Figure 39 – Microcontroller Opto-Isolation Interface ................................................................... 72
Figure 40 – Microcontroller 5v to 3v Input Buffer ........................................................................ 73
Figure 41 – Dispenser Printed Circuit Board Preliminary Design ................................................... 76
Figure 42- Software System Overview ........................................................................................... 79
Figure 43 - System Software Stack ................................................................................................. 80
Figure 44 – Application Flow .......................................................................................................... 81
Figure 45 - Serial Communication Class ......................................................................................... 84
Figure 46 - Database Classes .......................................................................................................... 87
Figure 47 - Embedded Software Details ........................................................................................ 89
Figure 48 – Side View of Subsystem Placement ............................................................................ 91
Figure 49 – Top View of Subsystem Placement ............................................................................. 92
Figure 50 - Lock Detail .................................................................................................................... 94
Figure 51 - Detail of Sensor ............................................................................................................ 95
Figure 52 - Concept Illustration of System ..................................................................................... 96
Figure 53 - Block Diagram of Temperature Control ....................................................................... 97
Figure 54 - MSP430 Peripheral Control ......................................................................................... 99

P a g e | 128
Figure 55 – LM35 Voltage Temperature Relation ........................................................................ 113
Figure 56 - LM555 Schematic Astable Operation ........................................................................ 114
Figure 57 – Milestone Gantt Chart .............................................................................................. 120
9.4 Permissions

P a g e | 129