Automate and Preserve Electromechanical Relay Investment Part …€¦ · Automate and Preserve...
83
January 20 – 23, 2009 Welcome to NovaTech Automate and Preserve Electromechanical Relay Investment Part 4 of 4: Using the Bitronics® 70 Series to Improve Power Quality Paul Grabowski
Transcript of Automate and Preserve Electromechanical Relay Investment Part …€¦ · Automate and Preserve...

January 20 – 23, 2009
Welcome to NovaTech
Automate and PreserveElectromechanical Relay Investment
Part 4 of 4:Using the Bitronics® 70 Series to Improve Power Quality
Paul Grabowski

January 20 – 23, 2009
About the Author
Paul Grabowski implemented automation in over 100substations during his 29-year career with PennsylvaniaPower and Light. More recently, Paul spent five yearsas a US protection application engineer for AREVA T&D.He is now a Senior Application Engineer for theBitronics product lines. Paul is a registered ProfessionalEngineer in the State of Pennsylvania.

January 20 – 23, 2009
Introduction

January 20 – 23, 2009
Meeting Automation Requirements
• Technology
• Microprocessor based technology provides a solution
• Two alternatives
1) Install microprocessor based relays
- Replace electromechanical relays
OR
2) Install microprocessor based recording and monitoring IEDs
- Such as the Bitronics 70 Series
- Allows retention of electromechanical relay scheme
Realize substantial cost savings

January 20 – 23, 2009
Some Typical Automation Goals
1) Fault Analysis and Recording
2) Improve Local Monitoring and Control
3) Improve Remote Monitoring and Control
4) Monitor Power Quality
5) Provide Protective Function Setting Groups and Backup ProtectiveFeatures
January 20 – 23, 2009
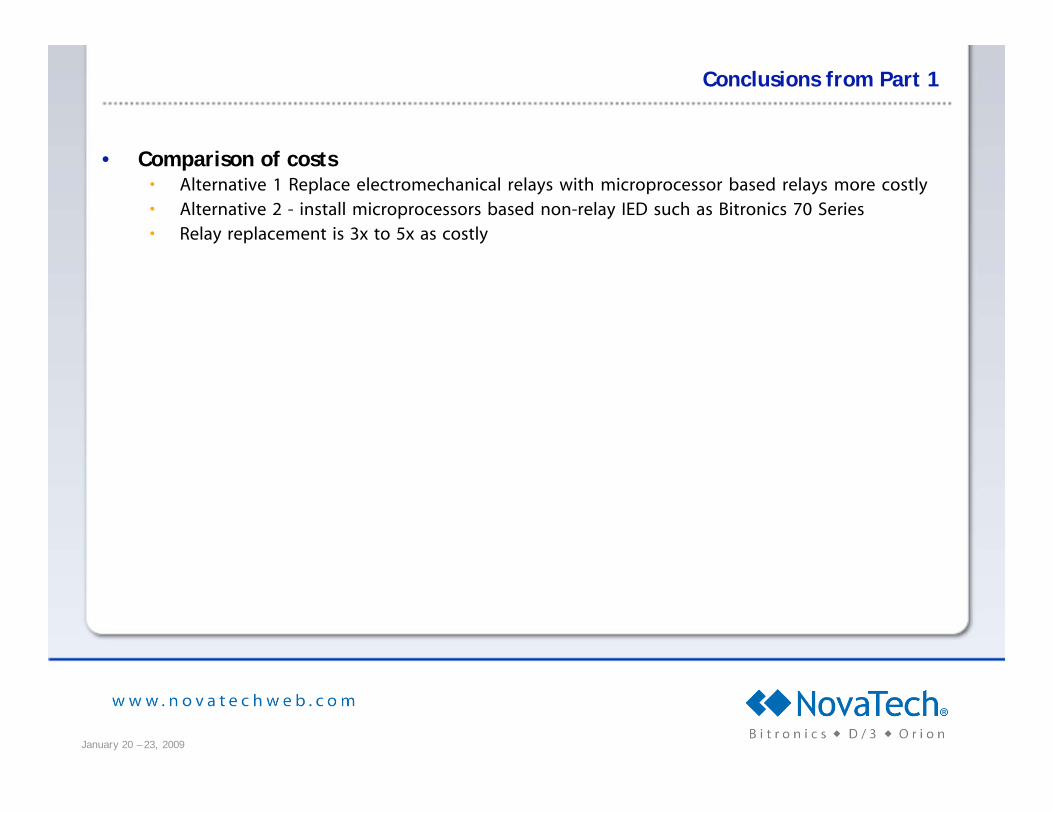
Conclusions from Part 1
• Comparison of costs• Alternative 1 Replace electromechanical relays with microprocessor based relays more costly• Alternative 2 - install microprocessors based non-relay IED such as Bitronics 70 Series• Relay replacement is 3x to 5x as costly

January 20 – 23, 2009
Improvements to Power Quality
using monitoring and recording IEDs

January 20 – 23, 2009
Improvements using Monitoring and Recording IEDs
• Electromechanical relay scheme vs. power quality
• No power quality monitoring available
• Difficulty in finding and correcting problems
• Improvements using monitoring and recording IEDs
• Identify problems
• Determine the source
• Take corrective action
• Improve efficiency reduce costs
• Reduce complaints

January 20 – 23, 2009
Power Quality Issues
• Power quality implies many things to different people• Power provider• Consumer• Regulators
• Focus on power quality issues from the power provider’s viewpoint, 5examples
1) Maintain System Voltage Levels
2) Monitor Voltage Flicker
3) Monitor Harmonic distortion
4) Transformer k-factor
5) Reduce cost of doing business

January 20 – 23, 2009
Example 1
Maintain System Voltage Levels

January 20 – 23, 2009
Unregulated Power System
• Power system with no tap changers or capacitor banks
Vs V
Equivalent Circuit

January 20 – 23, 2009
Unregulated Power System - Equivalent Circuit
• Vs is fixed
• Customer voltage level proportional to
• System impedance
• Load Magnitude

January 20 – 23, 2009
Unregulated power system - customer voltages
Load
CustomerVoltage
Time ofday12 M 12 M12 Noon6 AM 6 PM
• Load fluctuates during the day
• Consequence, voltage at customer point of delivery varies with load
• i.e. With time of day
• Plot of Customer voltage and load over a 24 hour period

January 20 – 23, 2009
Unregulated power system – acceptable voltage levels
CustomerLoad
CustomerVoltage
Time ofday12 M 12 M12 Noon6 AM 6 PM
Acceptablevoltagerange
• Power system voltages must be maintained within a certain range
• Required for customer equipment to operate properly
• Usually mandated by PUC
• Plot of Customer voltage and load
• With acceptable voltage levels

January 20 – 23, 2009
Maintaining Acceptable System Voltage Levels
• Acceptable voltage levels maintained using some form of voltagesupport
• Voltage support
• Load tap changers on transformers
• Capacitor banks
Load Tap
Changers
Capacitor
Banks

January 20 – 23, 2009
Voltage Support
• Usually automated
• Control devices can overridden by remote (supervisory) control
Cap Bank 1
Cap Bank 2
Transformer 1
Transformer 2Customers
Tap ChangerController
Cap BankController
Remote (supervisory)override
Add and remove
capacitors according
to voltage levels
Scheduled
for time of
day operation
Schedule during peak
hours

January 20 – 23, 2009
Tap 2
Effect of automated voltage support
CustomerLoad
CustomerVoltage
Time ofday12 M 12 M12 Noon6 AM 6 PM
Acceptablevoltagerange
SystemVoltage
Time ofday12 M 12 M12 Noon6 AM 6 PM
62kV
64kV
67kV
Tap 5
Tap 2
Tap 9
Cap 1on
Cap 1off
Tap 9
Tap 5Voltageschedule

January 20 – 23, 2009
What can go wrong?
• Transformer taps• Tap changer not following schedule• Transformer taps mismatched
• Capacitor bank scheme• Failed cans• Capacitor bank turning on or off incorrectly
• Use monitoring and recording IED such as 70 series to detect• Displays can show data locally• Recorders can document problems• Remote (Supervisory) monitoring and control• Have tap changer/capacitor controllers read and act on data from 70 series

January 20 – 23, 2009
Tap Changer not Following Schedule
• The taps should change at specified times• Analyze with 70 Series Trend and Disturbance recorders• The voltage changes seen should match the schedule
Transformer 1
Transformer 2
Tap ChangerController
BusVoltage
Schedule
70 Trend
kV
kV
Time
Time
Trouble!!

January 20 – 23, 2009
Transformer taps mismatched
• When designed, the transformers will have matching taps documented• E.G. Transformer #1 tap #5 = Transformer #2 Tap #5• This may not always be the case
• The taps should match on all the transformers• Different taps result in VARs circulating between transformers
Transformer 1
Transformer 2
Tap ChangerController
VARsTap 5
Tap 2
HighcirculatingVAR flow
Local Display
Remote(Supervisory)
Data
Use in tapchangercontroller
70 Series

January 20 – 23, 2009
Tap Changer not Following Schedule
• Tap position monitoring
Transformer 1
Transformer 2
Tap ChangerController
Tappositions
Tappositions
SupervisoryStatus from 70
Series
DNP Points
BI:4 Tr1 Tap#6
BI:5 Tr2 Tap#7
Trouble!!
Tap positions monitored usingDigital I/O or Transducer inputs

January 20 – 23, 2009
Capacitor Bank Failed Elements
• Capacitor bank construction
• Many capacitive elements in parallel with a relatively low voltage rating
• Connect many of these parallel groups in series to achieve the desired voltagelevel
Vrelay
Bus
• Failed can detection
• Usual way to determine if elements failis with voltage relay at center point inbank
• Failures on both sides of tap pointcancel out
• Reduces sensitivity

January 20 – 23, 2009
Capacitor Bank Failed Elements, cont’d
• 70 Series has impedance measurements
• Use impedance measurement to detect failure
• Use measurements when new to establish base impedance
• When can fails, impedance change indicates can failure
Bus
Z = V/I

January 20 – 23, 2009
Capacitor Bank Failed Can Example

January 20 – 23, 2009
Capacitor Bank Failed Can Example, cont’d

January 20 – 23, 2009
Capacitor Bank Controller not Following Schedule
• Cap bank should only auto close during peak hours
• Verification• Cap amps in the 70 Series trend record• Status of cap bank CB for remote (supervisory) monitoring and
in records
Cap bankamps
Cap in autoschedule
70 Trend
In
amps
Time
Time
Cap Bank 1
Cap Bank 2
Customers
Cap BankController
Add and removecapacitors according to
voltage levels
Schedule during peakhours
Automode
Out
Cap should not beon here

January 20 – 23, 2009
Example 2
Voltage Flicker

January 20 – 23, 2009
Voltage Flicker

January 20 – 23, 2009
Voltage Flicker, cont’d
• Voltage flicker
• Repetitive voltage dip on a power system
• Objectionable?
• When the magnitude and frequency of occurrence becomeexcessive as perceived by a person
• Subjective, depends on individual
January 20 – 23, 2009
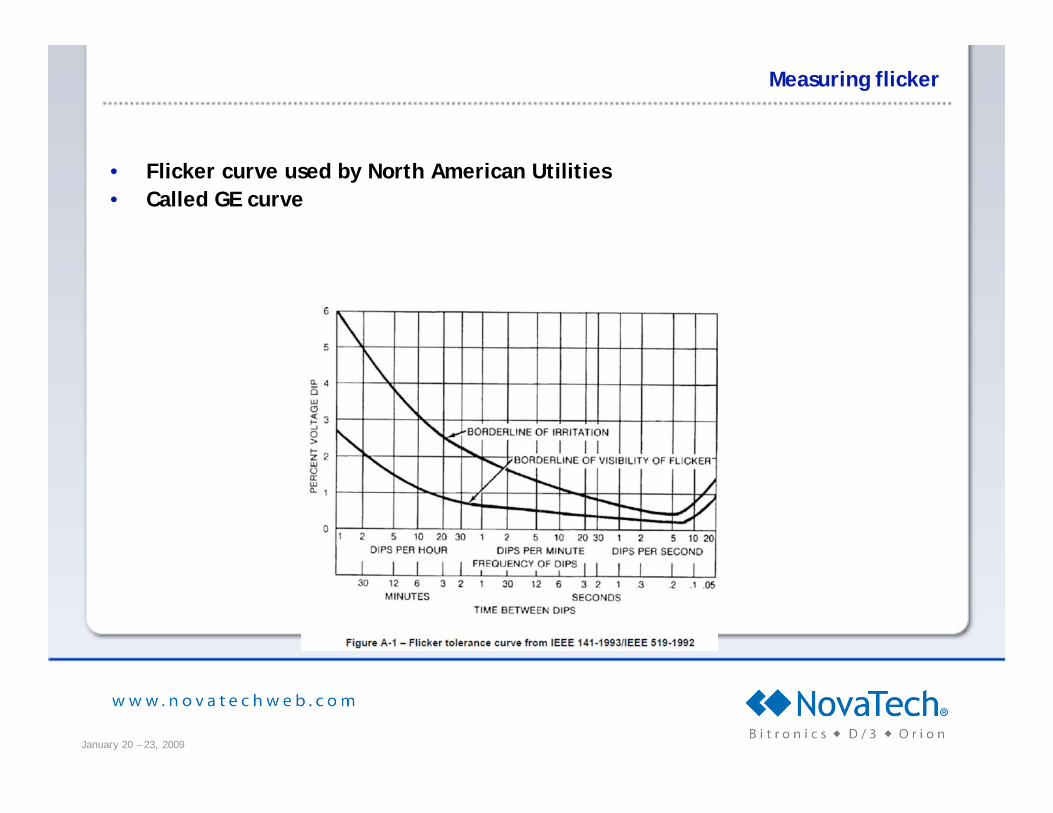
Measuring flicker
• Flicker curve used by North American Utilities
• Called GE curve

January 20 – 23, 2009
Voltage Flicker Standards
• IEEE P1453/D9, June 2004
• Attempts to measure and deal with flicker has resulted in this Standard beingadopted
• IEC 61000-4-15 was adopted and approved for use in IEEE Recommended Practice1453
• Don’t use previous curves as per IEEE P1453 D9

January 20 – 23, 2009
Voltage flicker standards, cont’d
• IEEE P1453 D9 recommends table A-1 in standard• Uses IEC 61000-4-15 to calculate irritation curve
• Shown on graph below

January 20 – 23, 2009
Voltage Flicker Standards, cont’d
• Two statistical quantities have been defined to measure flicker
• Pst and Plt
• Pst – Perception short term
• A measure of the short term perception obtained for one 10-minute interval
• Calculation details in standard
• Use individual sources with a short duty cycle
• Plt – Perception long term
• A measure of long-term perception of flicker obtained for a 2-hour period.
• Calculated from the average of consecutive Pst values
• Use for sources with long & variable duty cycle and multiple sources
• Refer to IEEE P1453/D9, June 2004

January 20 – 23, 2009
Perception values for irritation
Pst = 1.00 per unit
Pst >= 1.00 per unit
Plt >= 1.00 per unit
A problem exists when

January 20 – 23, 2009
Voltage Flicker - Causes
• Processes that draw large repetitive currents
• Large motor loads• Motors from 100 hp to 1000 hp and larger• Frequent starts or operation near stall• Types of loads
• Rock crushers• Recycling plants• Ski resorts
• Welding operations
• Others

January 20 – 23, 2009
Voltage Flicker – Contributing factors
• Dependent on where the flicker producing load occurs in the power system
Generation &Transmission
Sub-Transmission
Distribution
Vs
Equivalent Circuit

January 20 – 23, 2009
Voltage Flicker – Contributing factors, cont’d
• Equivalent circuit
1. Change in voltage from process
Total system impedance Zsystem
Magnitude of inrush current I
= Vs – V = Vs – ( I * Zsystem)V
Proportional toV
Is seen by Customers on supply line to processV
VsV
Other Customers
Customer with flicker
producing process
I
2.
3.

January 20 – 23, 2009
Voltage Flicker – Improvements
• Monitoring and recording IED such as Bitronics 70 series has features todetect and measure voltage flicker
• Measurements in the 70 Series
• Voltage and current
• Voltage flicker measurements
• Based on the standard
• Pst
• Plt

January 20 – 23, 2009
Voltage Flicker – Improvements
• Use the measurements
• In Trend recorder for continuous monitoring
• To trigger Disturbance and Waveform records (more detailed analysis)
• In user configurable Supervisory points lists
• To cross trigger other IEDs
January 20 – 23, 2009
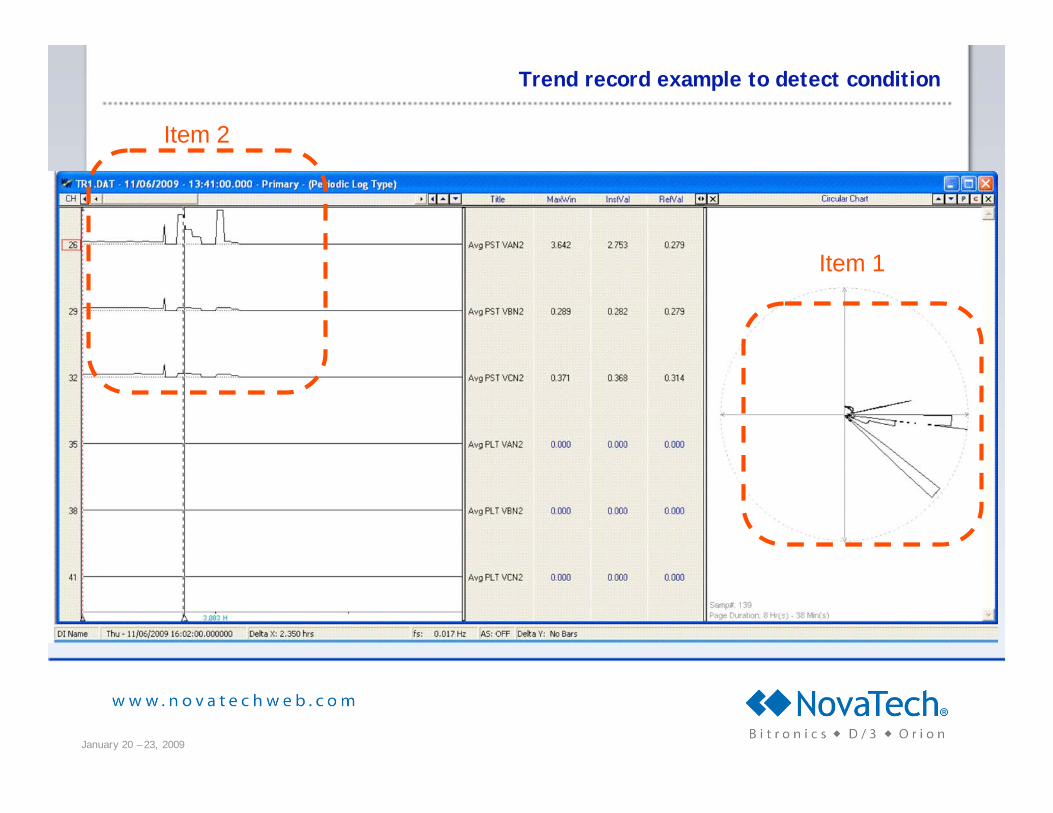
Trend record example to detect condition
Item 1
Item 2

January 20 – 23, 2009
Trend record example to detect condition
Avg PST VAN2 = 3.642
Avg PST VBN2 = 0.289
Avg PST VCN2 = 0.371
Avg PLT VAN2 = 0.000
Avg PLT VBN2 = 0.000
Avg PLT VCN2 = 0.000

January 20 – 23, 2009
Example 3
Harmonic Distortion

January 20 – 23, 2009
Basic Concepts
• Loads on an ac system
• Linear
• Non-linear
• Linear load
• Current is proportional to the voltage and impedance
• Current follows envelope of the voltage waveform
• Examples
• Resistive heaters
• Incandescent lamps V
I

January 20 – 23, 2009
Basic Concepts, cont’d
• Non-Linear load
• Current is not with the voltage during each half cycle
• Current and voltage have non-sinusoidal waveforms
• Non-linear load examples
• Variable Frequency Drives
• Switching mode power supplies
• Battery Chargers
• Electronic ballasts
• Induction furnacesV
I

January 20 – 23, 2009
Harmonics - Effect on Transformers
• Increased losses in the iron core
• Eddy losses and hysteresis
• Proportional to I2 and f2
• Results in excessive heating
• Results of excessive heating
• Transformer failure
• Requires transformer with a higher rating
• More costly
• Requires De-rating existing transformers
• Next example, transformer k-factor for transformer de-rating is discussed

January 20 – 23, 2009
Harmonics – Effect on Motors
• Increased losses in the iron core• Eddy losses and hysteresis• Proportional to I2 and f2
• Results in excessive heating
• Torsional oscillation on the motor shaft• Excessive vibration• Vibration near natural frequency of the motor can damage motor

January 20 – 23, 2009
Harmonics – Effect on Capacitors
• Typically designed to operate at 110% of rated voltage and 135%of their KVAR ratings.
• Capacitive reactance is inversely proportional to frequency
• They act as a sink to harmonics on the power system
• Results in overloading the capacitor bank
• Greater chance of exceeding design values causing failure

January 20 – 23, 2009
Harmonics – Effect on system
Industrial customerinjecting harmonics
Generation/Transmission
systems
Residentialcustomers
• Harmonic effects seen by all customers on line
• How many devices can be adversely affected?
• Symptom – increasing equipment failures for no apparent reason –harmonics?????
Commercial landother industrials
DistributionCap Banks
How many motorsand transformers?
How many?
January 20 – 23, 2009
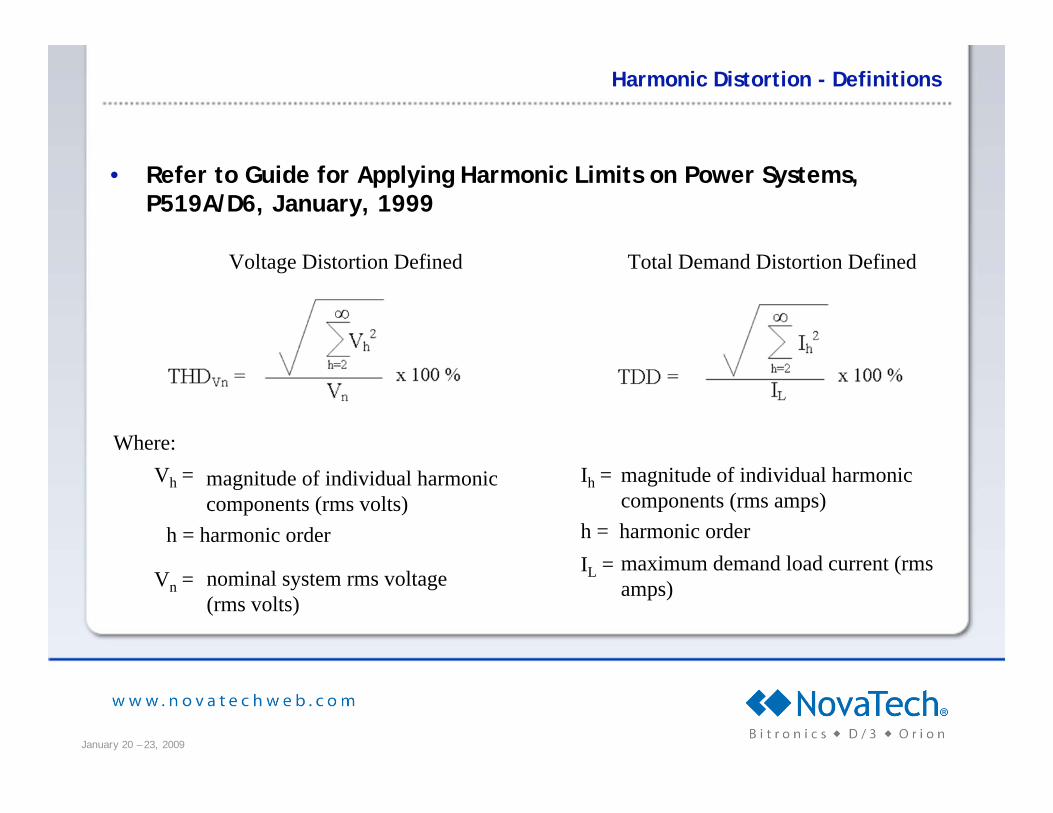
Harmonic Distortion - Definitions
• Refer to Guide for Applying Harmonic Limits on Power Systems,P519A/D6, January, 1999
Where:
magnitude of individual harmonic
components (rms volts)
h = harmonic order
nominal system rms voltage
(rms volts)
Vh =
Vn =
magnitude of individual harmonic
components (rms amps)
h = harmonic order
maximum demand load current (rms
amps)
Ih =
IL =
Voltage Distortion Defined Total Demand Distortion Defined

January 20 – 23, 2009
Responsibilities
• The Guide for Applying Harmonic Limits
• Specifies responsibilities for utilities and utility customers regarding harmonics
• Utility customers
• Focus on load, use TDD
• Recommended TDD limits are provided
• Utilities
• Focus on voltage, use THD
• The THD should be less than 5%

January 20 – 23, 2009
Harmonics – Improvements
• Monitoring and recording IED such as Bitronics 70 series has features tomonitor harmonics
• Measurements
• Voltage Distortion (THD)
• Also has even and odd THD
• Current distortion (THD and TDD)
• Also has even and odd THD and TDD
• All harmonic RMS voltages from 0 to 63rd
• All harmonic RMS currents from 0 to 63rd
• Phase angles for all of the above

January 20 – 23, 2009
THD Measurements in the 70 Series
• The following compares the THD calculations in the 70 series compared to theguide.
IEEE Guide 70 Series

January 20 – 23, 2009
THD Measurements in the 70 Series
• The following compares the THD calculations in the 70 series compared to theguide.
70 Series
January 20 – 23, 2009
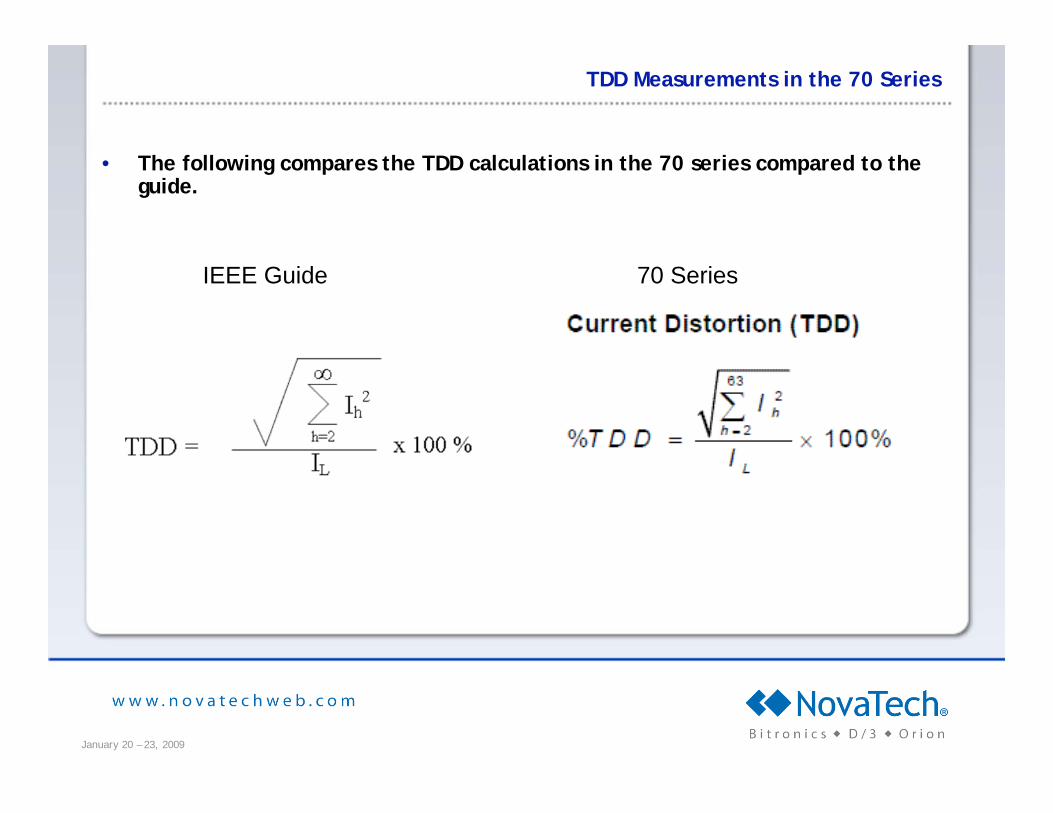
TDD Measurements in the 70 Series
• The following compares the TDD calculations in the 70 series compared to theguide.
IEEE Guide 70 Series

January 20 – 23, 2009
Harmonics – Using the 70 Series Measurements
• In Trend recorder for continuous monitoring
• To trigger Disturbance and Waveform records (more detailed analysis)
• In user configurable Supervisory points lists
• To cross trigger other IEDs

January 20 – 23, 2009
Trend record example to detect condition

January 20 – 23, 2009
Trend record example to detect condition, line graph

January 20 – 23, 2009
Trend record example to detect condition, circular graph

January 20 – 23, 2009
Waveform record example to zero in on condition

January 20 – 23, 2009
Example 4
Transformer k-Factor

January 20 – 23, 2009
Effect of harmonics on transformer operation
• Transformers subjected to harmonics• Experience increased losses due to harmonics• Result in additional heating as compared to 60Hz rating
• Consequence of heating due to harmonics• Transformer must be de-rated• Or, higher rated transformer must be installed
• Covered in detail ANSI/IEE standards• C57.110-1986• IEEE recommended practice for establishing transformer capability when supplying
non-sinusoidal load currents

January 20 – 23, 2009
fh2
x PEC-R (pu)
Heating effect of Harmonics
• From ANSI/IEEE Standard C57.110-1986
Imax (pu) =PLL-R (pu)
Imax (pu) = maximum permissible rms non-sinusoidal load current (pu)
Where
PLL-R (pu) = load loss density under rated conditions
PEC-R (pu) = winding eddy current loss under rated conditions
1 +fh
2 * h2
fh = harmonic current distribution factor for harmonic h
h = harmonic number
(pu) = per unit of rated rms load current

January 20 – 23, 2009
Application
• Monitoring and recording IEDs such as 70 series have capability tomeasure effects
• 70 series details• Measures k-factor• The k-factor is defined as follows
Where h = harmonic number (1 through 63)
Ih = magnitude of the hth harmonic (1st through 63rd)

January 20 – 23, 2009
Comparing 70 series calculation with standard
fh2
x PEC-R (pu)
Imax (pu) =PLL-R (pu)
1 +fh
2 * h2

January 20 – 23, 2009
• No total or 3 phase k-factor
• Measured for each of the three phases of current and the neutral
• K – factor Amps A
• K – factor Amps B
• K – factor Amps C
• K – factor Amps N
• K-factor is a ratio of amps/amps on a per phase basis
• It does not indicate actual load
• k-factor is harmonic dependent and not load dependent
Notes on the k-Factor in the 70 Series

January 20 – 23, 2009
Accessing k-factor from the 70 Series Recorders
• Waveform record for transformer inrush shown below

January 20 – 23, 2009
Accessing k-factor from the 70 Series Recorders, cont’d
• Graph of harmonics for transformer inrush• A phase current shown
January 20 – 23, 2009
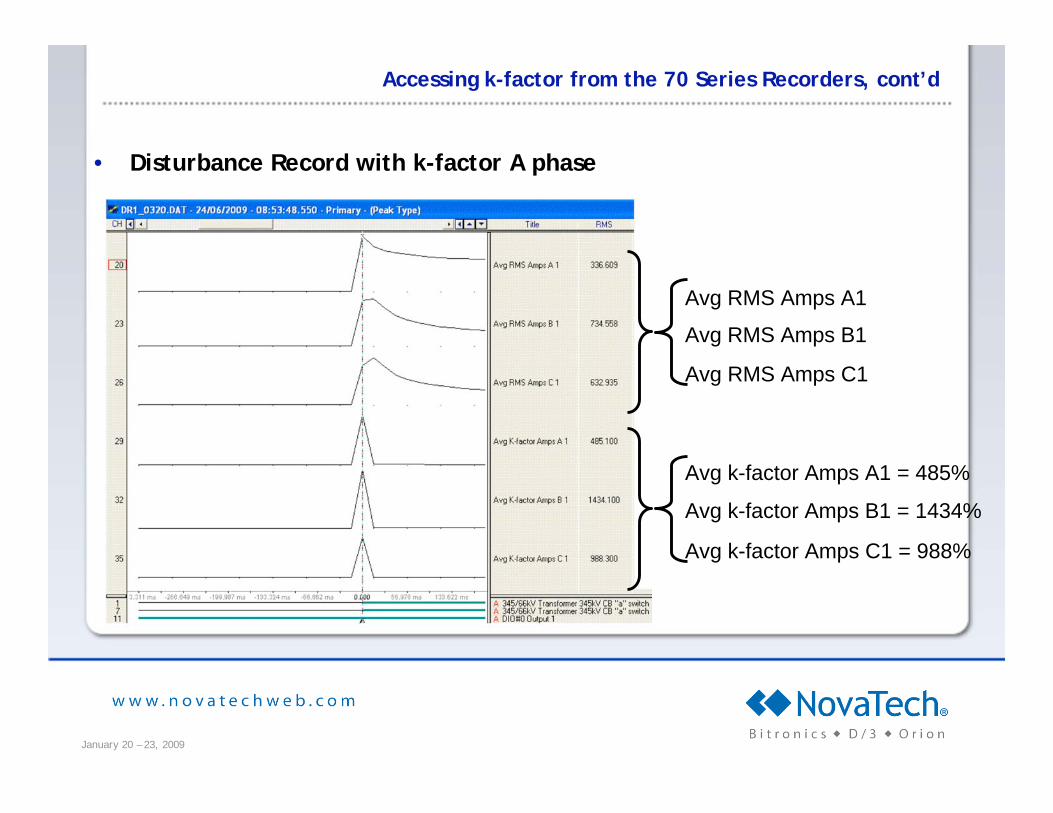
Accessing k-factor from the 70 Series Recorders, cont’d
• Disturbance Record with k-factor A phase
Avg k-factor Amps A1 = 485%
Avg k-factor Amps B1 = 1434%
Avg k-factor Amps C1 = 988%
Avg RMS Amps A1
Avg RMS Amps B1
Avg RMS Amps C1

January 20 – 23, 2009
Accessing k-factor from the 70 Series Recorders, cont’d
• Disturbance Record with k-factor A phase
Avg k-factor Amps A1 = 4.85
Avg k-factor Amps B1 = 14.34
Avg k-factor Amps C1 = 9.88
Avg RMS Amps A1
Avg RMS Amps B1
Avg RMS Amps C1
In decimal format ( % / 100)

January 20 – 23, 2009
Accessing k-factor from the 70 Series Protocols
• Measurement available in DNP, Modbus, IEC61850
• Read from Supervisory or control system
• DNP mapping shown

January 20 – 23, 2009
Example 5
Reduce cost of doing business

January 20 – 23, 2009
Typical Power System
CustomerLoad
Generation BillingMeter

January 20 – 23, 2009
System Losses
• Power delivered to customer is less than that generated
Customer
Load
Generation
Power In Power Out
Billing
Meter
I2* R losses
Power In = Power Out + I2 * R Losses

January 20 – 23, 2009
Cost of doing business
• Total cost to generate power cannot be recovered
Customer
Load
Generation
Power In Power Out
Billing
Meter
I2* R losses
Power In = Power Out + I2 * R Losses
$$ generated power = $$ Power to customer + $$ I2 * R losses
Cost of doing businessRecoverable

January 20 – 23, 2009
Lagging power factor loads increase I2R Losses
• For a fixed kW demand,• line current is proportional to lagging power factor
• Line losses increase with lagging power factor• Losses vary exponentially as I2
• Cost that cannot be recovered
Customer
Load
Generation
Power In Power Out
Billing
Meter
I2* R losses
Power In = Power Out + I2 * R Losses
January 20 – 23, 2009
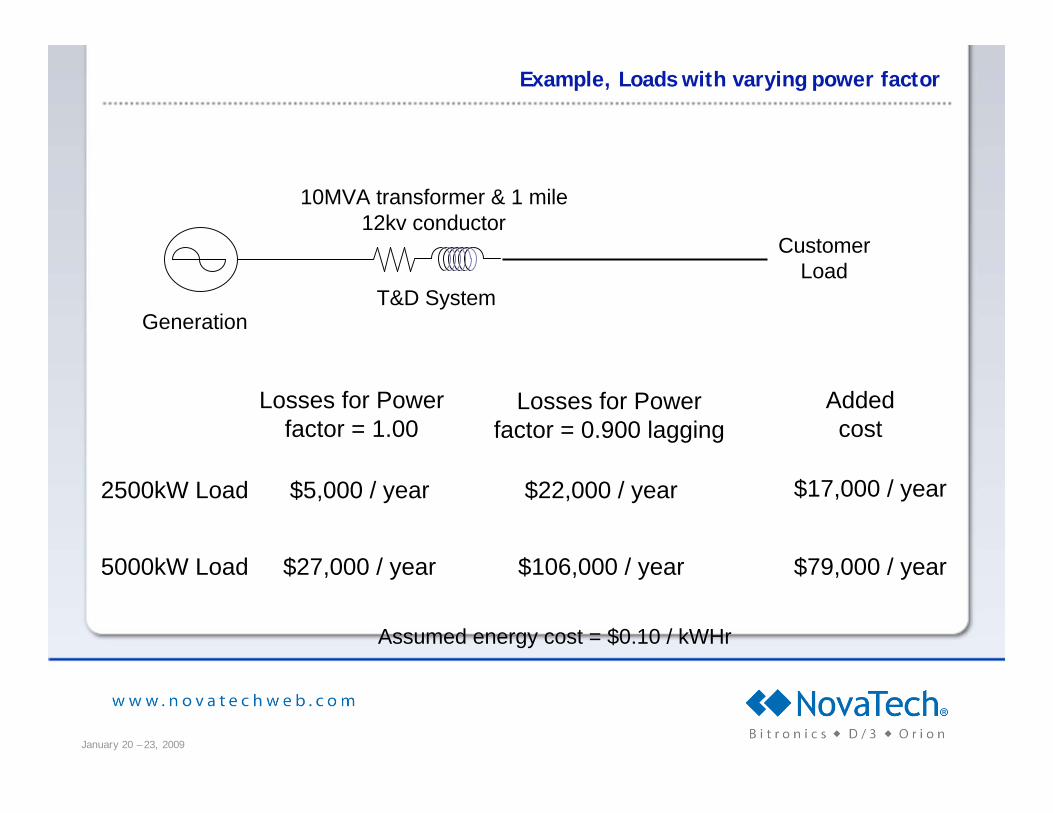
Example, Loads with varying power factor
CustomerLoad
GenerationT&D System
10MVA transformer & 1 mile12kv conductor
Losses for Powerfactor = 1.00
Losses for Powerfactor = 0.900 lagging
2500kW Load $5,000 / year $22,000 / year
5000kW Load $27,000 / year $106,000 / year
Assumed energy cost = $0.10 / kWHr
Addedcost
$17,000 / year
$79,000 / year

January 20 – 23, 2009
Reactive support for lagging loads
• Power lines with large amounts of lagging power factor load increasecosts
• Doubling the kW load for a given power factor increases costsdramatically
• I2 * R losses vary as square of current flow• Cost of losses proportional to I2
• Reduce losses by improving power factor
• May take one of two forms• Utility provides cap banks• Large customers required to meet minimum power factor requirements

January 20 – 23, 2009
Improvements with Monitoring and Recording IEDs
• Monitoring and recording IEDs such as the 70 series
• Allow monitoring of power factor and kVAR flows
• Establish a base line for a proper operating system
• Provide indication that something is wrong via remote (Supervisory)monitoring and local metering
• Failure of utility cap banks
• Indicate a customer has added substantial lagging power factor load
• Indicate a customer’s VAR compensation has failed

January 20 – 23, 2009
Conclusions

January 20 – 23, 2009
Conclusions
• Electromechanical relay schemes
• Provide adequate protection
• Lacks remote monitoring and control features required and desired
• Improving power quality monitoring can be provided by Bitronics 70
Series monitoring and recording IED
• Allows retention of the Electromechanical relays
• Helps to identify problems
• Allows monitoring effectiveness of the solution
• Reduce customer complaints
• Reduce PUC reviews and fines
• Reduce operating costs

January 20 – 23, 2009
Don’t forget
• This presentation focuses on using the 70 series to improve powerquality monitoring
• This is only part of the automation picture
• In addition, you get• Fault recording and monitoring• Improved local monitoring and control• Improved remote monitoring and control

January 20 – 23, 2009
Where do I find these Webinar Presentations
• They are available on the NovaTech web site.

January 20 – 23, 2009
Part Four of Four
Using the Bitronics 70 Series
to Improve Power Quality Monitoring
The End