Autofluorescent Proteins for Intravital - Tsien
11
Chemistry & Biology Article Autofluorescent Proteins with Excitation in the Optical Window for Intravital Imaging in Mammals Michael Z. Lin, 1,5,6 Michael R. McKeown, 1,5 Ho-Leung Ng, 4 Todd A. Aguilera, 1 Nathan C. Shaner, 1,7 Robert E. Campbell, 1,8 Stephen R. Adams, 1 Larry A. Gross, 1 Wendy Ma, 4 Tom Alber, 4 and Roger Y. Tsien 1,2,3, * 1 Department of Pharmacology 2 Howard Hughes Medical Institute 3 Department of Chemistry and Biochemistry University of California, San Diego, 9500 Gilman Drive, La Jolla, CA 92093, USA 4 Department of Molecular and Cell Biology, University of California, Berkeley, 356 Stanley Hall, Berkeley, CA 94720, USA 5 These authors contributed equally to this work 6 Present address: Department of Pediatrics and Department of Bioengineering, Stanford University, Palo Alto, CA 94305, USA 7 Present address: Monterey Bay Aquarium Research Institute, 7700 Sandholdt Road, Moss Landing, CA 95039, USA 8 Present address: Department of Chemistry, University of Alberta, Edmonton, Alberta T6G 2G2, Canada *Correspondence: [email protected] DOI 10.1016/j.chembiol.2009.10.009 SUMMARY Fluorescent proteins have become valuable tools for biomedical research as protein tags, reporters of gene expression, biosensor components, and cell lineage tracers. However, applications of fluorescent proteins for deep tissue imaging in whole mammals have been constrained by the opacity of tissues to excitation light below 600 nm, because of absorbance by hemoglobin. Fluorescent proteins that excite effi- ciently in the ‘‘optical window’’ above 600 nm are therefore highly desirable. We report here the evolu- tion of far-red fluorescent proteins with peak excita- tion at 600 nm or above. The brightest one of these, Neptune, performs well in imaging deep tissues in living mice. The crystal structure of Neptune reveals a novel mechanism for red-shifting involving the acquisition of a new hydrogen bond with the acylimine region of the chromophore. INTRODUCTION Mammalian tissues are opaque to most wavelengths of visible light due to the strong absorption by hemoglobin of wavelengths below 600 nm (Stamatas et al., 2006). Between 600 nm and 1200 nm, where infrared absorption by water molecules begins, there exists an ‘‘optical window’’ in which tissue is relatively trans- parent to light (Tromberg et al., 2000). While many fluorescent proteins emit in the optical window, none have been found or developed to excite maximally in the optical window (Shcherbo et al., 2009). The fluorescent protein with the most red-shifted emission spectrum is the dsRed derivative mPlum, with excita- tion and emission peaks at 590 nm and 649 nm (Wang et al., 2004). The protein with the most red-shifted excitation peak wavelength is the closely related mRaspberry (Wang et al., 2004), with excitation and emission peaks at 598 nm and 625 nm, but mRaspberry excitation drops off quickly with increasing wavelength, reaching 10% of peak excitation at 630 nm. The eqFP578 derivatives Katushka, mKate, and mKate2 have been proposed for use in whole-animal imaging based on their intrinsic brightness (Shcherbo et al., 2007, 2009), but they are neither the most red-shifted in excitation (at 588 nm) nor in emis- sion (at 635 nm). An ideal fluorescent protein for imaging in mammals would combine the best characteristics of the above proteins and be further red-shifted to allow excitation in the optical window. Excitation wavelength tuning in fluorescent proteins is deter- mined by the covalent structure of the chromophore and influ- enced by hydrogen bonding and electronic interactions of the chromophore with nearby chemical groups (Remington, 2006). The chromophore of autocatalytic fluorescent proteins such as jellyfish green fluorescent protein (GFP) is composed of phenol and imidazolinone rings derived from autocatalytic modifications of a Tyr residue and the backbone atoms of adjacent residues. The two aromatic rings are linked by an methylidene bridge to create an extended conjugated p orbital system (Ormo et al., 1996). In most red fluorescent proteins (RFPs), including dsRed from the corallimorph Discosoma and eqFP611 from the sea anemone Entacmaea, oxidation of the N-Ca bond immediately N-terminal to the chromophore allows conjugation to extend through the acylimine group formed by the resulting imine and the carbonyl oxygen of the preceding amino acid (Gross et al., 2000; Petersen et al., 2003), leading to the dramatic bathochro- mic shift of RFPs relative to GFP. Notably, the RFP variants mOr- ange and zFP538 contain covalent modifications of this common RFP chromophore that remove the terminal carbonyl group and correspondingly exhibit blue-shifted excitation and emission spectra. In mOrange, a threonine hydroxyl group attacks the carbonyl to create a hemiacetal (Shu et al., 2006), while in zFP538 a reaction of a lysine amino group with the acylimine results in the formation of a new imine-containing ring (Reming- ton et al., 2005). Side chains near but not inherent to the chromophore also influence fluorescent protein spectra. This was first demon- strated in GFP with the mutation of Thr-203, located above the phenol ring, to Tyr to create a p-p stacking interaction. The re- sulting yellow fluorescent protein exhibited red-shifted excitation and emission spectra, as would be expected from the greater Chemistry & Biology 16, 1169–1179, November 25, 2009 ª2009 Elsevier Ltd All rights reserved 1169
Transcript of Autofluorescent Proteins for Intravital - Tsien
Chemistry & Biology
Article
Autofluorescent Proteins with Excitation in theOptical Window for Intravital Imaging in MammalsMichael Z. Lin,1,5,6 Michael R. McKeown,1,5 Ho-Leung Ng,4 Todd A. Aguilera,1 Nathan C. Shaner,1,7 Robert E. Campbell,1,8
Stephen R. Adams,1 Larry A. Gross,1 Wendy Ma,4 Tom Alber,4 and Roger Y. Tsien1,2,3,*1Department of Pharmacology2Howard Hughes Medical Institute3Department of Chemistry and Biochemistry
University of California, San Diego, 9500 Gilman Drive, La Jolla, CA 92093, USA4Department of Molecular and Cell Biology, University of California, Berkeley, 356 Stanley Hall, Berkeley, CA 94720, USA5These authors contributed equally to this work6Present address: Department of Pediatrics and Department of Bioengineering, Stanford University, Palo Alto, CA 94305, USA7Present address: Monterey Bay Aquarium Research Institute, 7700 Sandholdt Road, Moss Landing, CA 95039, USA8Present address: Department of Chemistry, University of Alberta, Edmonton, Alberta T6G 2G2, Canada
*Correspondence: [email protected] 10.1016/j.chembiol.2009.10.009
SUMMARY
Fluorescent proteins have become valuable tools forbiomedical research as protein tags, reporters ofgene expression, biosensor components, and celllineage tracers. However, applications of fluorescentproteins for deep tissue imaging in whole mammalshave been constrained by the opacity of tissues toexcitation light below 600 nm, because of absorbanceby hemoglobin. Fluorescent proteins that excite effi-ciently in the ‘‘optical window’’ above 600 nm aretherefore highly desirable. We report here the evolu-tion of far-red fluorescent proteins with peak excita-tion at 600 nm or above. The brightest one of these,Neptune, performs well in imaging deep tissues inliving mice. The crystal structure of Neptune revealsa novel mechanism for red-shifting involving theacquisition of a new hydrogen bond with the acylimineregion of the chromophore.
INTRODUCTION
Mammalian tissues are opaque to most wavelengths of visible
light due to the strong absorption by hemoglobin of wavelengths
below 600 nm (Stamatas et al., 2006). Between 600 nm and 1200
nm, where infrared absorption by water molecules begins, there
exists an ‘‘optical window’’ in which tissue is relatively trans-
parent to light (Tromberg et al., 2000). While many fluorescent
proteins emit in the optical window, none have been found or
developed to excite maximally in the optical window (Shcherbo
et al., 2009). The fluorescent protein with the most red-shifted
emission spectrum is the dsRed derivative mPlum, with excita-
tion and emission peaks at 590 nm and 649 nm (Wang et al.,
2004). The protein with the most red-shifted excitation peak
wavelength is the closely related mRaspberry (Wang et al.,
2004), with excitation and emission peaks at 598 nm and 625
nm, but mRaspberry excitation drops off quickly with increasing
wavelength, reaching 10% of peak excitation at 630 nm. The
Chemistry & Biology 16, 1169–11
eqFP578 derivatives Katushka, mKate, and mKate2 have been
proposed for use in whole-animal imaging based on their
intrinsic brightness (Shcherbo et al., 2007, 2009), but they are
neither the most red-shifted in excitation (at 588 nm) nor in emis-
sion (at 635 nm). An ideal fluorescent protein for imaging in
mammals would combine the best characteristics of the above
proteins and be further red-shifted to allow excitation in the
optical window.
Excitation wavelength tuning in fluorescent proteins is deter-
mined by the covalent structure of the chromophore and influ-
enced by hydrogen bonding and electronic interactions of the
chromophore with nearby chemical groups (Remington, 2006).
The chromophore of autocatalytic fluorescent proteins such as
jellyfish green fluorescent protein (GFP) is composed of phenol
and imidazolinone rings derived from autocatalytic modifications
of a Tyr residue and the backbone atoms of adjacent residues.
The two aromatic rings are linked by an methylidene bridge to
create an extended conjugated p orbital system (Ormo et al.,
1996). In most red fluorescent proteins (RFPs), including dsRed
from the corallimorph Discosoma and eqFP611 from the sea
anemone Entacmaea, oxidation of the N-Ca bond immediately
N-terminal to the chromophore allows conjugation to extend
through the acylimine group formed by the resulting imine and
the carbonyl oxygen of the preceding amino acid (Gross et al.,
2000; Petersen et al., 2003), leading to the dramatic bathochro-
mic shift of RFPs relative to GFP. Notably, the RFP variants mOr-
ange and zFP538 contain covalent modifications of this common
RFP chromophore that remove the terminal carbonyl group and
correspondingly exhibit blue-shifted excitation and emission
spectra. In mOrange, a threonine hydroxyl group attacks the
carbonyl to create a hemiacetal (Shu et al., 2006), while in
zFP538 a reaction of a lysine amino group with the acylimine
results in the formation of a new imine-containing ring (Reming-
ton et al., 2005).
Side chains near but not inherent to the chromophore also
influence fluorescent protein spectra. This was first demon-
strated in GFP with the mutation of Thr-203, located above the
phenol ring, to Tyr to create a p-p stacking interaction. The re-
sulting yellow fluorescent protein exhibited red-shifted excitation
and emission spectra, as would be expected from the greater
79, November 25, 2009 ª2009 Elsevier Ltd All rights reserved 1169
Chemistry & Biology
Fluorescent Proteins with Far-Red Excitation
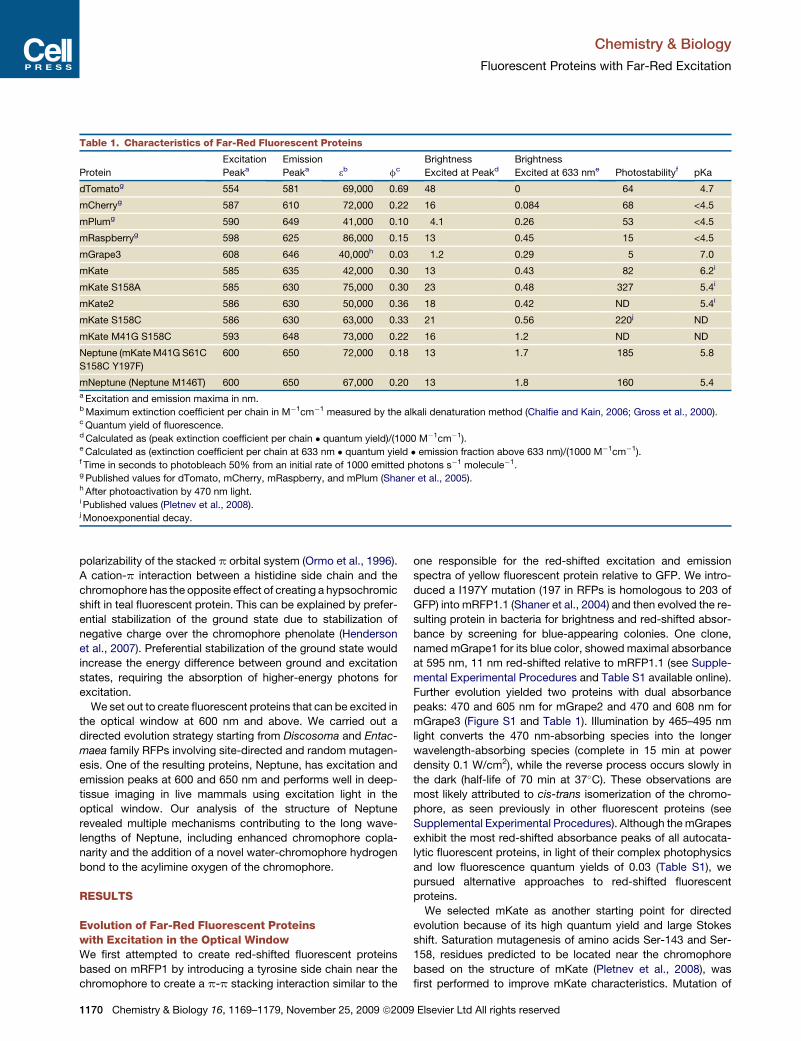
Table 1. Characteristics of Far-Red Fluorescent Proteins
Protein
Excitation
Peaka
Emission
Peaka 3b fc
Brightness
Excited at Peakd
Brightness
Excited at 633 nme Photostabilityf pKa
dTomatog 554 581 69,000 0.69 48 0 64 4.7
mCherryg 587 610 72,000 0.22 16 0.084 68 <4.5
mPlumg 590 649 41,000 0.10 4.1 0.26 53 <4.5
mRaspberryg 598 625 86,000 0.15 13 0.45 15 <4.5
mGrape3 608 646 40,000h 0.03 1.2 0.29 5 7.0
mKate 585 635 42,000 0.30 13 0.43 82 6.2i
mKate S158A 585 630 75,000 0.30 23 0.48 327 5.4i
mKate2 586 630 50,000 0.36 18 0.42 ND 5.4i
mKate S158C 586 630 63,000 0.33 21 0.56 220j ND
mKate M41G S158C 593 648 73,000 0.22 16 1.2 ND ND
Neptune (mKate M41G S61C
S158C Y197F)
600 650 72,000 0.18 13 1.7 185 5.8
mNeptune (Neptune M146T) 600 650 67,000 0.20 13 1.8 160 5.4a Excitation and emission maxima in nm.b Maximum extinction coefficient per chain in M�1cm�1 measured by the alkali denaturation method (Chalfie and Kain, 2006; Gross et al., 2000).c Quantum yield of fluorescence.d Calculated as (peak extinction coefficient per chain � quantum yield)/(1000 M�1cm�1).e Calculated as (extinction coefficient per chain at 633 nm � quantum yield � emission fraction above 633 nm)/(1000 M�1cm�1).f Time in seconds to photobleach 50% from an initial rate of 1000 emitted photons s�1 molecule�1.g Published values for dTomato, mCherry, mRaspberry, and mPlum (Shaner et al., 2005).h After photoactivation by 470 nm light.i Published values (Pletnev et al., 2008).j Monoexponential decay.
polarizability of the stacked p orbital system (Ormo et al., 1996).
A cation-p interaction between a histidine side chain and the
chromophore has the opposite effect of creating a hypsochromic
shift in teal fluorescent protein. This can be explained by prefer-
ential stabilization of the ground state due to stabilization of
negative charge over the chromophore phenolate (Henderson
et al., 2007). Preferential stabilization of the ground state would
increase the energy difference between ground and excitation
states, requiring the absorption of higher-energy photons for
excitation.
We set out to create fluorescent proteins that can be excited in
the optical window at 600 nm and above. We carried out a
directed evolution strategy starting from Discosoma and Entac-
maea family RFPs involving site-directed and random mutagen-
esis. One of the resulting proteins, Neptune, has excitation and
emission peaks at 600 and 650 nm and performs well in deep-
tissue imaging in live mammals using excitation light in the
optical window. Our analysis of the structure of Neptune
revealed multiple mechanisms contributing to the long wave-
lengths of Neptune, including enhanced chromophore copla-
narity and the addition of a novel water-chromophore hydrogen
bond to the acylimine oxygen of the chromophore.
RESULTS
Evolution of Far-Red Fluorescent Proteinswith Excitation in the Optical WindowWe first attempted to create red-shifted fluorescent proteins
based on mRFP1 by introducing a tyrosine side chain near the
chromophore to create a p-p stacking interaction similar to the
1170 Chemistry & Biology 16, 1169–1179, November 25, 2009 ª200
one responsible for the red-shifted excitation and emission
spectra of yellow fluorescent protein relative to GFP. We intro-
duced a I197Y mutation (197 in RFPs is homologous to 203 of
GFP) into mRFP1.1 (Shaner et al., 2004) and then evolved the re-
sulting protein in bacteria for brightness and red-shifted absor-
bance by screening for blue-appearing colonies. One clone,
named mGrape1 for its blue color, showed maximal absorbance
at 595 nm, 11 nm red-shifted relative to mRFP1.1 (see Supple-
mental Experimental Procedures and Table S1 available online).
Further evolution yielded two proteins with dual absorbance
peaks: 470 and 605 nm for mGrape2 and 470 and 608 nm for
mGrape3 (Figure S1 and Table 1). Illumination by 465–495 nm
light converts the 470 nm-absorbing species into the longer
wavelength-absorbing species (complete in 15 min at power
density 0.1 W/cm2), while the reverse process occurs slowly in
the dark (half-life of 70 min at 37�C). These observations are
most likely attributed to cis-trans isomerization of the chromo-
phore, as seen previously in other fluorescent proteins (see
Supplemental Experimental Procedures). Although the mGrapes
exhibit the most red-shifted absorbance peaks of all autocata-
lytic fluorescent proteins, in light of their complex photophysics
and low fluorescence quantum yields of 0.03 (Table S1), we
pursued alternative approaches to red-shifted fluorescent
proteins.
We selected mKate as another starting point for directed
evolution because of its high quantum yield and large Stokes
shift. Saturation mutagenesis of amino acids Ser-143 and Ser-
158, residues predicted to be located near the chromophore
based on the structure of mKate (Pletnev et al., 2008), was
first performed to improve mKate characteristics. Mutation of
9 Elsevier Ltd All rights reserved

Chemistry & Biology
Fluorescent Proteins with Far-Red Excitation
Ser-158 to Cys or Ala improved the peak extinction coefficient of
mKate (Figure 1A and Table 1). In the course of this work, mKate
S158A (Pletnev et al., 2008) and its improved folding variant
mKate2 (Shcherbo et al., 2009) were described. mKate and its
S158A and S158C mutants all exhibit residual green fluorescent
components (Figure S2A). While TagRFP (Shaner et al., 2008),
TagRFP-T (Shaner et al., 2008), mKate, and mKate S158A
(Figure S2A) bleached with complex kinetics, mKate S158C
bleached in a monoexponential manner with a normalized half-
life of 220 s, making it the most photostable fluorescent protein
with monoexponential photobleaching. This rare attribute makes
mKate S158C well suited for quantitative time-lapse experiments.
We next attempted to further red-shift mKate S158C by adopt-
ing the mechanism of emission red-shifting in mPlum. In mPlum,
Glu-13 hydrogen bonds to the terminal carbonyl of the conju-
gated bond system of the chromophore, but the interaction is
dependent on chromophore excitation and therefore primarily
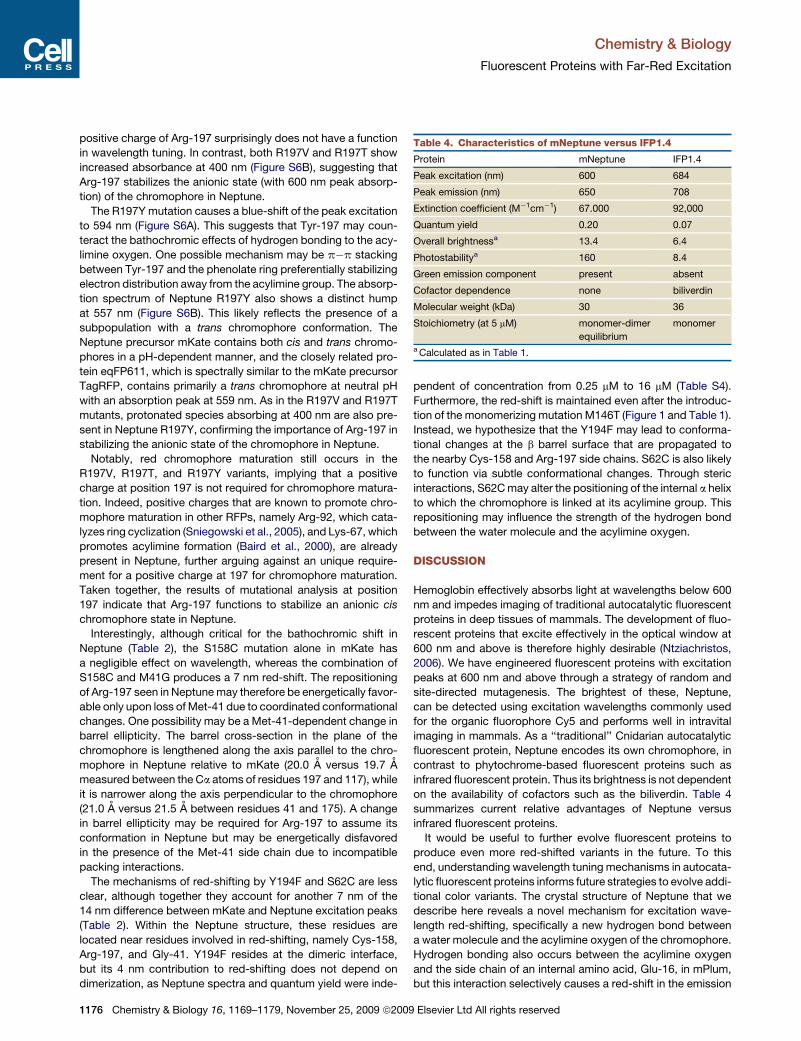
Figure 1. Neptune Spectra and Sequence
(A) Absorbance spectra of oxyhemoglobin (red), deoxyhemoglobin (dotted
red), mKate (green dashed), mKate S158C (orange), mKate2 (dotted black),
Neptune (dashed blue), and mNeptune (light blue). Units are M�1cm�1 versus
nm. Hemoglobin spectra are previously published (Stamatas et al., 2006).
(Inset) Purified mCherry, mKate, S158C, and Neptune proteins at 0.5 mg/ml
in visible light.
(B) Normalized excitation (left) and emission (right) spectra of mKate (green
dashed), mKate S158C (orange), Neptune (dashed blue), and mNeptune (light
blue). mKate2 excitation and emission spectra are identical to mKate, as
described previously (Shcherbo et al., 2009).
(C) Sequence of mNeptune aligned with its parent, mKate. Changes respon-
sible for the red-shift are highlighted in red. The additional monomerization
mutation to create mNeptune from Neptune is highlighted in green.
Chemistry & Biology 16, 1169–117
affects the emission spectrum (Abbyad et al., 2007; Shu et al.,
2009b). We hypothesized that a stable hydrogen bonding inter-
action with the terminal carbonyl in the ground state could cause
a red-shift in excitation as well. Screening of libraries with all
possible substitutions at position 13 and nearby positions 28,
41, and 65, which are not conserved between mKate and
mPlum, did not recover an obvious hydrogen bond donor at
one of these positions. However, we found that mutation of
Met-41 to Gly alone resulted in red-shifted excitation and emis-
sion (Table 1). Two rounds of random mutagenesis by error-
prone PCR then yielded Y194F and S61C mutations, resulting
in a protein with 600 nm excitation and 650 nm emission
(Figure 1B and Table 1). Because this protein (mKate M41G
S61C S158C Y194F; Figure 1C) looks blue in ambient lighting
(Figure 1A) and has fluorescence wavelengths furthest away
from our starting point among mKate derivatives, we named it
Neptune.
Neptune is the first bright fluorescent protein (extinction coef-
ficient 72,000 M�1cm�1, quantum yield 0.18) with an excitation
peak reaching 600 nm. Compared to its parent, mKate, its
absorption and excitation peaks are 18 nm redder (600 versus
582 nm) and its peak extinction coefficient 71% larger (72,000
versus 42,000 M�1cm�1), resulting in more efficient excitation
beyond 600 nm (Figure 1A and Table 1). Neptune exhibits a pho-
tobleaching half-life longer than EGFP (Figure S2A), a pKa of 5.8,
and fast maturation (half-maximal in 35 min; Figure S2C). Like
mKate and the brighter mKate S158A and S158C variants,
Neptune shows a residual green component upon excitation at
470 nm (Figure S2C).
Visualization of Neptune in Cells and DeepTissues of Living MammalsCompared to previous fluorescent proteins, Neptune has the
largest extinction coefficient at 633 nm, a wavelength well within
the optical window and a common laser line used for exciting
the organic fluorophore Cy5 (Figure 1A and Table 1). We tested
the ability to detect Neptune or mKate in cells with 633 nm exci-
tation. Neptune was well detected in liver sections following
adenovirus-mediated gene transfer in mice (Figure 2A) with
532 or 633 nm laser excitation, while mKate was only detected
above background with the 532 nm laser (Figure 2B). Thus the
bathochromic shift of Neptune relative to its parent mKate has
conferred improved excitability at 633 nm, well within the optical
window.
The ability to be excited at �630 nm makes Neptune poten-
tially suitable for fluorescence imaging in living mammals using
existing Cy5 filter sets. The liver in particular is a heavily vascu-
larized organ where hemoglobin absorbance hinders imaging
(Colin et al., 2000). Using an available Cy5 filter set (610–630
nm excitation, 660–700 nm emission), Neptune fluorescence in
livers of living mice following adenovirus-mediated gene transfer
was easily visible, with the brightest areas displaying 44-fold
contrast over uninfected tissue autofluorescence (Figure 2C).
We recently engineered a bacterial phytochrome into a bili-
verdin-dependent infrared fluorescent protein, IFP1.1, with exci-
tation and emission maxima at 660 nm and 700 nm (Shu et al.,
2009a). To see whether Neptune could be visualized orthogo-
nally to IFP1.1, we imaged living mice expressing either Neptune
or IFP1.1, using filter sets separately optimized for Cy5 (far-red
9, November 25, 2009 ª2009 Elsevier Ltd All rights reserved 1171

Chemistry & Biology
Fluorescent Proteins with Far-Red Excitation
Figure 2. Performance of Neptune in Cells and Animals
(A) Design of a monocistronic adenovirus vector for coexpression of GFP and Neptune (Ad-Neptune) or (Ad-mKate) in hepatocytes.
(B) Sections of liver were removed from a mouse injected with Ad-Neptune or Ad-mKate and imaged at red or far-red wavelengths on a confocal microscope. GFP
was also imaged to confirm expression of the cistron. Fluorescence intensities are shown in the chart. Scale bar, 50 mm.
(C) Epifluorescence of Neptune in the liver of a living mouse acquired on a Maestro imaging system with excitation and emission at 610–630 nm and 660–700 nm,
respectively. Scale bar, 5 mm.
(D) Dual fluorescence imaging in the optical window is possible with Neptune and infrared fluorescent protein. Images of live mice expressing Neptune or IFP1.1 in
liver were acquired with Cy5 and Cy5.5 channels. Excitation/emission wavelengths used were 610–630/660–700 nm for Cy5 and 625–675/700–730 nm for Cy5.5.
In the right column, spectral unmixing was used to correct for Neptune cross-excitation and -detection in the Cy5.5 channel. Restricting infrared fluorescent
protein excitation to above 650 nm with custom filters would produce similar results.
emission) and Cy5.5 (infrared emission), respectively. Indeed
liver-expressed Neptune was selectively imaged in the Cy5
channel while IFP1.1 was preferentially imaged in the Cy5.5
channel (Figure 2D). A small amount of cross-detection of
Neptune occurred using our Cy5.5 excitation filter due to its
broad excitation range (625–675 nm). This signal can be sub-
tracted by linear unmixing (Figure 2D) or preferably eliminated
by the future design of an appropriately narrow excitation filter
for IFP1.1. We also confirmed that excitation wavelengths in
the optical window detected liver fluorescence more efficiently
than shorter wavelengths for both Neptune and its parent mKate
(Figure S3 and Table S2).
1172 Chemistry & Biology 16, 1169–1179, November 25, 2009 ª200
Quaternary Structure of Neptune and FurtherMonomerizationWe studied the quaternary structure of Neptune, mKate, and
mKate derivatives in solution by size-exclusion chromatography
with in-line multiangle laser light scattering. At low micromolar
concentrations, Neptune and mKate (Figure 3A), as well as mKate
S158A and mKate S158C (Figure S4A), primarily comigrate with
the dimeric standard dTomato. However, the elution profiles
are not monodisperse, but rather exhibit a trailing tail that over-
laps with the elution profile of the monomeric standard mCherry.
Incontrast,mGrape3,EGFP,andmCherryall comigrate ina sharp
monodisperse peak (Figure S4A). Light scattering reveals
9 Elsevier Ltd All rights reserved

Chemistry & Biology
Fluorescent Proteins with Far-Red Excitation
average molecular weights for Neptune and mKate of 62 and 58
kDa at the elution peak, consistent with dimers (Figure 3A).
Average measured molecular weight in the tail is consistent
with the late-eluting subpopulation of mKate proteins being
predominantly monomers (34 kDa), while late-eluting Neptune
proteins exhibit an average molecular weight of 40 kDa, suggest-
ing a mix of monomers and dimers. Finally, at similar concentra-
tions, Neptune and mKate migrate as dimers in native gel electro-
phoresis but as monomers in SDS, a behavior between that of
mCherry, which migrates as a monomer in both conditions, and
dTomato, which migrates as a dimer in both conditions (Figures
S4B and S4C). Together, these data suggest that mKate and
Neptune exist in a monomer-dimer equilibrium at low micromolar
concentrations.
To improve its performance in fusion proteins, we further
monomerized Neptune. The Y194F mutation in Neptune alters
an external side chain located adjacent to Met-146, which partic-
ipates in a hydrophobic intersubunit interaction. Removal of
a polar hydroxyl group by the Y194F mutation in Neptune might
have resulted in increased dimerization tendency. To restore
a polar group near position 194, we performed saturation muta-
genesis of Met-146 and found a M146T mutant that retained the
brightness and spectral profile of Neptune (Table 1 and Figure 1),
while exhibiting enhanced dissociation into monomers com-
pared to mKate (Figure 3A). We performed equilibrium analytical
ultracentrifugation to measure dissociation constants for
Neptune and Neptune M146T. Sedimentation profiles were
best fit to a monomer-dimer equilibrium model with a dissocia-
tion constant of 2.1 mM for the M146T mutant compared with
Figure 3. A functionally Monomeric Variant
of Neptune for Protein Fusions
(A) Neptune exhibits more dimerization relative to
mKate, while mNeptune exhibits less. Normalized
elution profiles on size-exclusion HPLC (thin
traces, axis on left) and estimated molecular
weights upon elution by in-line light scattering
(thick traces, axis on right) are shown for dTomato
(orange solid), Neptune (dark blue dashed), mNep-
tune (light blue solid), mKate (green dashed),
mKate2 (red dashed), and mCherry (maroon solid).
Dots show estimated molecular weights upon
elution by in-line light scattering. Proteins were
analyzed sequentially in the same day at 5 mM in
PBS. mCherry and dTomato serve as monomeric
and dimeric controls, respectively.
(B) mNeptune-actin and mNeptune-tubulin are
correctly localized upon expression in HeLa cells,
similarly to mKate2 fusions. Scale bar, 10 mm.
Table 2. Contributions of Individual Mutations to Red-Shifting in
Neptune
Reversion from
Neptune
Excitation
Peaka
Emission
Peaka 3b fc
none (Neptune) 600 650 72,000 0.18
C61S 597 649 80,000 0.18
F197Y 596 649 56,000 0.16
G41M 595 637 60,000 0.21
C158A 593 644 97,000 0.19
C61S F197Y G41M
C158A (mKate S158A)
585 630 75,000 0.30
C61S F197Y G41M
(mKate S158C)
586 630 63,000 0.33
a Excitation and emission maxima in nm.b Maximum extinction coefficient in M�1cm�1 measured by the alkali
denaturation method (Chalfie and Kain, 2006; Gross et al., 2000).c Quantum yield of fluorescence.
0.5 mM for Neptune (Table S3), confirming
the increased monomeric character of
the mutant. Fusions of Neptune 146T
protein, which we refer to as mNeptune,
to actin and tubulin localized correctly in
HeLa cells, similarly to mKate2 (Fig-
ure 3B), demonstrating its usefulness as
a monomeric fusion tag. Hydrolysis of
the chromophore acylimine in mNeptune,
which occurs upon exposure of the chro-
mophore to water during protein denaturation, was observed in
less than 7% of the protein in samples aged for 4 months
(Figure S4D), indicating that mNeptune is structurally stable.
Structural Basis of the Bathochromic Shift in NeptuneOf the mutations differentiating Neptune from mKate S158A, no
single one is necessary for the majority of the bathochromic shift
(Table 2), implying multiple additive mechanisms for red-shifting.
To explore the biophysical basis of wavelength tuning in
Neptune, we determined the crystal structure of Neptune at pH
Chemistry & Biology 16, 1169–1179, November 25, 2009 ª2009 Elsevier Ltd All rights reserved 1173
Chemistry & Biology
Fluorescent Proteins with Far-Red Excitation
7 to 1.6 A resolution (Figure 4). Neptune crystallized in tetragonal
space group P42212 with unit cell dimensions of a = b = 92.1 A,
c = 53.2 A, a = b = g = 90�, and with one subunit per asymmetric
unit (Table 3). Symmetry operations generate a tetramer with
similar organization as mKate. Despite being characterized in
a different space group, the structure of Neptune is well superim-
posed upon the pH 7 structure of mKate (minimum rms of 0.24 A
over the Ca atoms of residues 1–220). Not surprisingly, side
chains atoms show more structural divergence from mKate than
backbone atoms (minimum rms of 0.38 A versus 0.24 A). As in
mKate at pH 7.0, the chromophore of Neptune exists entirely
in the cis, or Z, state, with no electron density observed in the
region expected for a trans-state chromophore even at a sigma
value of 0.2 (Figure S5). The covalent structure of the chromo-
phore is identical to that of dsRed, with primarily sp2 geometry
at the Ca atom of Met-63 (observed bond angles of 110�, 117�,
and 126�), consistent with the presence of an acylimine group.
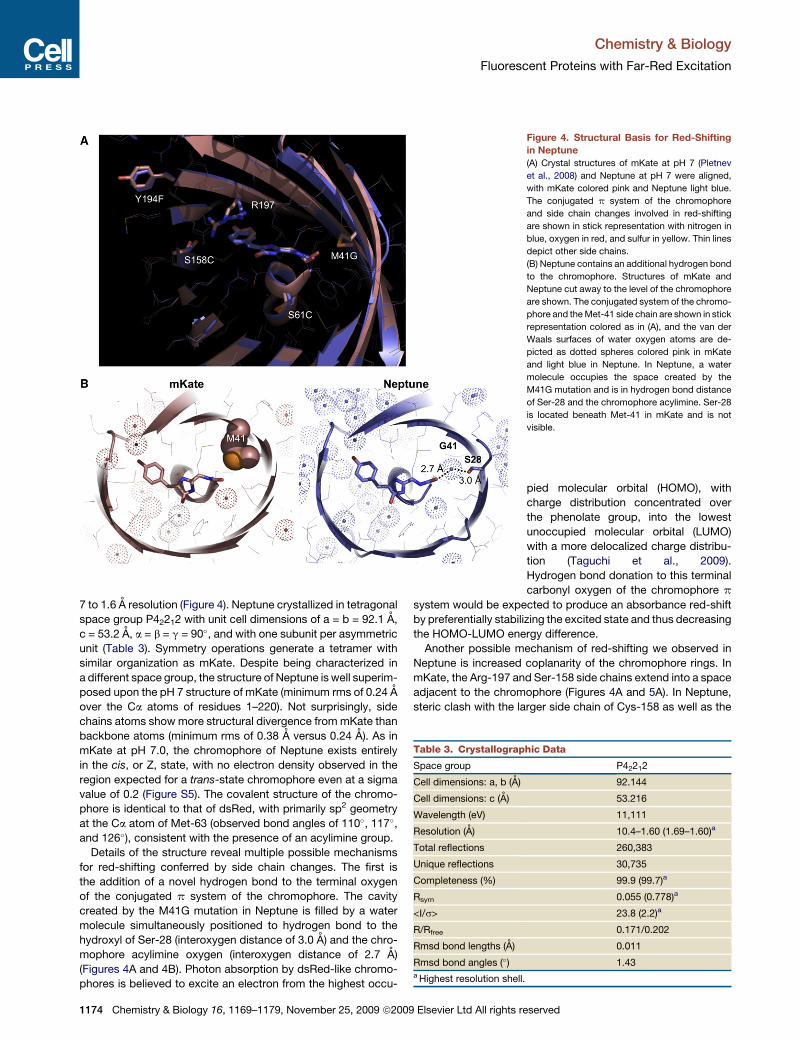
Details of the structure reveal multiple possible mechanisms
for red-shifting conferred by side chain changes. The first is
the addition of a novel hydrogen bond to the terminal oxygen
of the conjugated p system of the chromophore. The cavity
created by the M41G mutation in Neptune is filled by a water
molecule simultaneously positioned to hydrogen bond to the
hydroxyl of Ser-28 (interoxygen distance of 3.0 A) and the chro-
mophore acylimine oxygen (interoxygen distance of 2.7 A)
(Figures 4A and 4B). Photon absorption by dsRed-like chromo-
phores is believed to excite an electron from the highest occu-
Figure 4. Structural Basis for Red-Shifting
in Neptune
(A) Crystal structures of mKate at pH 7 (Pletnev
et al., 2008) and Neptune at pH 7 were aligned,
with mKate colored pink and Neptune light blue.
The conjugated p system of the chromophore
and side chain changes involved in red-shifting
are shown in stick representation with nitrogen in
blue, oxygen in red, and sulfur in yellow. Thin lines
depict other side chains.
(B) Neptune contains an additional hydrogen bond
to the chromophore. Structures of mKate and
Neptune cut away to the level of the chromophore
are shown. The conjugated system of the chromo-
phore and the Met-41 side chain are shown in stick
representation colored as in (A), and the van der
Waals surfaces of water oxygen atoms are de-
picted as dotted spheres colored pink in mKate
and light blue in Neptune. In Neptune, a water
molecule occupies the space created by the
M41G mutation and is in hydrogen bond distance
of Ser-28 and the chromophore acylimine. Ser-28
is located beneath Met-41 in mKate and is not
visible.
Table 3. Crystallographic Data
Space group P42212
Cell dimensions: a, b (A) 92.144
Cell dimensions: c (A) 53.216
Wavelength (eV) 11,111
Resolution (A) 10.4–1.60 (1.69–1.60)a
Total reflections 260,383
Unique reflections 30,735
Completeness (%) 99.9 (99.7)a
Rsym 0.055 (0.778)a
<I/s> 23.8 (2.2)a
R/Rfree 0.171/0.202
Rmsd bond lengths (A) 0.011
Rmsd bond angles (�) 1.43a Highest resolution shell.
pied molecular orbital (HOMO), with
charge distribution concentrated over
the phenolate group, into the lowest
unoccupied molecular orbital (LUMO)
with a more delocalized charge distribu-
tion (Taguchi et al., 2009).
Hydrogen bond donation to this terminal
carbonyl oxygen of the chromophore p
system would be expected to produce an absorbance red-shift
by preferentially stabilizing the excited state and thus decreasing
the HOMO-LUMO energy difference.
Another possible mechanism of red-shifting we observed in
Neptune is increased coplanarity of the chromophore rings. In
mKate, the Arg-197 and Ser-158 side chains extend into a space
adjacent to the chromophore (Figures 4A and 5A). In Neptune,
steric clash with the larger side chain of Cys-158 as well as the
1174 Chemistry & Biology 16, 1169–1179, November 25, 2009 ª2009 Elsevier Ltd All rights reserved

Chemistry & Biology
Fluorescent Proteins with Far-Red Excitation
loss of hydrogen bonding to Ser-158 may prevent Arg-197 from
assuming a similar conformation. Instead the Arg-197 side chain
extends parallel to the long axis of the chromophore and the
phenolate ring of the chromophore and Cys-158 shift toward
each other by 1.0 A (5.3 A in Neptune versus 6.3 A in mKate) to
partially fill the space previously occupied by Arg-197 (Figures
4A and 5A). The Arg-197 guanidinium group is located 3.9 A
above the methylidene bridge of the chromophore (when the
molecule is viewed with N and C termini upwards), where it
can participate in a cation-p interaction that would be expected
to stabilize the extended Arg-197 conformation. The Arg-197
movement away from its previous location to the side of the
phenolate rings also allows a reduction in the twist angle
between the imidazolinone and phenolate rings of the chromo-
phore (Figure 5A and Figure S5), improving coplanarity and
electron delocalization, which would also tend to increase wave-
length, extinction coefficient, and quantum yield. The conforma-
tional flexibility of Arg-197 is made possible by the presence of
an accommodating chromophore cavity. In mKate, the space
above the methylidene bridge is not occupied by amino acid
side chains but rather by a water molecule. In Neptune, Arg-
197 projects into this space, while a water molecule occupies
the portion of the chromophore cavity adjacent to the b barrel
vacated by the Arg-197 side chain movement (Figure 5A).
Figure 5. Changes in Arg-197 Conformation and
Interactions in Neptune
(A) In mKate (top), the Arg-197 and Ser-158 side chains (in
space-fill representation) fill a space adjacent to the
chromophore (stick), and the two rings of the chromo-
phore are non-coplanar. A water molecule occupies
a space above the methylidene bridge. Atoms are colored
as in Figure 4A. In Neptune (bottom), only Cys-158 is adja-
cent to the chromophore, while Arg-197 extends along the
chromophore axis with its guanidinium group above the
methylidene bridge. A water molecule occupies the former
location of the guanidinium group.
(B) In mKate (left), Arg-197 is hydrogen bonded to water
molecules. In Neptune (right), it also participates in a
hydrogen bond network involving Lys-67, Tyr-178, and
Glu-145, including an unusual Arg-Lys hydrogen bond.
Possible hydrogen bonds (interatomic distances <3.5 A)
are shown as dotted lines. Colors are the same as in
Figure 4A, except water molecules are in turquoise.
(C) Detailed model of the hydrogen bonding network with
proposed donor-acceptor relationships. Hydrogen atoms
are attached to donors with solid lines and to acceptors
with dotted lines. Water molecules are omitted for clarity.
In conjunction with the repositioning of Arg-
197, Neptune contains an unusual hydrogen
bond between Arg and Lys side chains. In
mKate, the nitrogen atoms of Arg-197 are
involved in hydrogen bond interactions with
water molecules. In Neptune, the Nh atoms
have acquired new hydrogen bond partners in
Lys-67 and Glu-145. Specifically, one Nh atom
is positioned 2.9 A from the Lys-67 nitrogen
while the other is positioned 2.9 A from an
oxygen atom of Glu-145. (Figure 5B). The short
distance observed between the Arg-197 and
Lys-67 nitrogen atoms is compatible with hydrogen bonding
and also argues strongly against both residues carrying formal
positive charges. Indeed, the program PROPKA (Li et al., 2005)
predicts Lys-67 to be predominantly uncharged (pKa of 5.97
for the conjugate acid). The retention of positive charge primarily
on the Arg-197 is also consistent with the greater ability of Arg to
stabilize charge through resonance delocalization and its higher
pKa relative to Lys. The addition of Glu-145, which is rotated to
become more coplanar with Arg-197 in Neptune (Figure 5B), as
an additional hydrogen bond acceptor further stabilizes the posi-
tive charge on Arg-197. By acquiring these hydrogen bonding
interactionswithLys-67and Glu-145,Arg-197 extends a hydrogen
bond network already present in mKate comprising Lys-67, Glu-
145, and Tyr-178. We propose a model for this hydrogen bond
network consistent with the structural data (Figure 5C).
The cation-p interaction of Arg-197 could conceivably func-
tion in stabilizing the anionic state of the chromophore, in color
tuning by influencing the electron distribution of the chromo-
phore, and/or in catalysis of chromophore formation. To deter-
mine the function of Arg-197, we performed saturation mutagen-
esis at position 197 and obtained fluorescent variants with Val,
Thr, and Tyr side chains at this position. Neptune R197V and
R197T exhibit excitation peaks and shoulders shaped identically
to Neptune (Figure S6A). This observation implies that the
Chemistry & Biology 16, 1169–1179, November 25, 2009 ª2009 Elsevier Ltd All rights reserved 1175
Chemistry & Biology
Fluorescent Proteins with Far-Red Excitation
positive charge of Arg-197 surprisingly does not have a function
in wavelength tuning. In contrast, both R197V and R197T show
increased absorbance at 400 nm (Figure S6B), suggesting that
Arg-197 stabilizes the anionic state (with 600 nm peak absorp-
tion) of the chromophore in Neptune.
The R197Y mutation causes a blue-shift of the peak excitation
to 594 nm (Figure S6A). This suggests that Tyr-197 may coun-
teract the bathochromic effects of hydrogen bonding to the acy-
limine oxygen. One possible mechanism may be p�p stacking
between Tyr-197 and the phenolate ring preferentially stabilizing
electron distribution away from the acylimine group. The absorp-
tion spectrum of Neptune R197Y also shows a distinct hump
at 557 nm (Figure S6B). This likely reflects the presence of a
subpopulation with a trans chromophore conformation. The
Neptune precursor mKate contains both cis and trans chromo-
phores in a pH-dependent manner, and the closely related pro-
tein eqFP611, which is spectrally similar to the mKate precursor
TagRFP, contains primarily a trans chromophore at neutral pH
with an absorption peak at 559 nm. As in the R197V and R197T
mutants, protonated species absorbing at 400 nm are also pre-
sent in Neptune R197Y, confirming the importance of Arg-197 in
stabilizing the anionic state of the chromophore in Neptune.
Notably, red chromophore maturation still occurs in the
R197V, R197T, and R197Y variants, implying that a positive
charge at position 197 is not required for chromophore matura-
tion. Indeed, positive charges that are known to promote chro-
mophore maturation in other RFPs, namely Arg-92, which cata-
lyzes ring cyclization (Sniegowski et al., 2005), and Lys-67, which
promotes acylimine formation (Baird et al., 2000), are already
present in Neptune, further arguing against an unique require-
ment for a positive charge at 197 for chromophore maturation.
Taken together, the results of mutational analysis at position
197 indicate that Arg-197 functions to stabilize an anionic cis
chromophore state in Neptune.
Interestingly, although critical for the bathochromic shift in
Neptune (Table 2), the S158C mutation alone in mKate has
a negligible effect on wavelength, whereas the combination of
S158C and M41G produces a 7 nm red-shift. The repositioning
of Arg-197 seen in Neptune may therefore be energetically favor-
able only upon loss of Met-41 due to coordinated conformational
changes. One possibility may be a Met-41-dependent change in
barrel ellipticity. The barrel cross-section in the plane of the
chromophore is lengthened along the axis parallel to the chro-
mophore in Neptune relative to mKate (20.0 A versus 19.7 A
measured between the Ca atoms of residues 197 and 117), while
it is narrower along the axis perpendicular to the chromophore
(21.0 A versus 21.5 A between residues 41 and 175). A change
in barrel ellipticity may be required for Arg-197 to assume its
conformation in Neptune but may be energetically disfavored
in the presence of the Met-41 side chain due to incompatible
packing interactions.
The mechanisms of red-shifting by Y194F and S62C are less
clear, although together they account for another 7 nm of the
14 nm difference between mKate and Neptune excitation peaks
(Table 2). Within the Neptune structure, these residues are
located near residues involved in red-shifting, namely Cys-158,
Arg-197, and Gly-41. Y194F resides at the dimeric interface,
but its 4 nm contribution to red-shifting does not depend on
dimerization, as Neptune spectra and quantum yield were inde-
1176 Chemistry & Biology 16, 1169–1179, November 25, 2009 ª200
pendent of concentration from 0.25 mM to 16 mM (Table S4).
Furthermore, the red-shift is maintained even after the introduc-
tion of the monomerizing mutation M146T (Figure 1 and Table 1).
Instead, we hypothesize that the Y194F may lead to conforma-
tional changes at the b barrel surface that are propagated to
the nearby Cys-158 and Arg-197 side chains. S62C is also likely
to function via subtle conformational changes. Through steric
interactions, S62C may alter the positioning of the internal a helix
to which the chromophore is linked at its acylimine group. This
repositioning may influence the strength of the hydrogen bond
between the water molecule and the acylimine oxygen.
DISCUSSION
Hemoglobin effectively absorbs light at wavelengths below 600
nm and impedes imaging of traditional autocatalytic fluorescent
proteins in deep tissues of mammals. The development of fluo-
rescent proteins that excite effectively in the optical window at
600 nm and above is therefore highly desirable (Ntziachristos,
2006). We have engineered fluorescent proteins with excitation
peaks at 600 nm and above through a strategy of random and
site-directed mutagenesis. The brightest of these, Neptune,
can be detected using excitation wavelengths commonly used
for the organic fluorophore Cy5 and performs well in intravital
imaging in mammals. As a ‘‘traditional’’ Cnidarian autocatalytic
fluorescent protein, Neptune encodes its own chromophore, in
contrast to phytochrome-based fluorescent proteins such as
infrared fluorescent protein. Thus its brightness is not dependent
on the availability of cofactors such as the biliverdin. Table 4
summarizes current relative advantages of Neptune versus
infrared fluorescent proteins.
It would be useful to further evolve fluorescent proteins to
produce even more red-shifted variants in the future. To this
end, understanding wavelength tuning mechanisms in autocata-
lytic fluorescent proteins informs future strategies to evolve addi-
tional color variants. The crystal structure of Neptune that we
describe here reveals a novel mechanism for excitation wave-
length red-shifting, specifically a new hydrogen bond between
a water molecule and the acylimine oxygen of the chromophore.
Hydrogen bonding also occurs between the acylimine oxygen
and the side chain of an internal amino acid, Glu-16, in mPlum,
but this interaction selectively causes a red-shift in the emission
Table 4. Characteristics of mNeptune versus IFP1.4
Protein mNeptune IFP1.4
Peak excitation (nm) 600 684
Peak emission (nm) 650 708
Extinction coefficient (M�1cm�1) 67.000 92,000
Quantum yield 0.20 0.07
Overall brightnessa 13.4 6.4
Photostabilitya 160 8.4
Green emission component present absent
Cofactor dependence none biliverdin
Molecular weight (kDa) 30 36
Stoichiometry (at 5 mM) monomer-dimer
equilibrium
monomer
a Calculated as in Table 1.
9 Elsevier Ltd All rights reserved

Chemistry & Biology
Fluorescent Proteins with Far-Red Excitation
spectrum only. Based on ultrafast spectroscopy and structural
analysis of mPlum and its mutants, an explanation for this effect
has been proposed that involves two dynamic changes. First, the
hydrogen bond is relatively weak in the ground state and
strengthens in the excited state (Shu et al., 2009b). Glu-16 side
chain rotation then occurs in the excited state, causing relaxation
to a lower energy intermediate state and emission at red-shifted
wavelengths (Abbyad et al., 2007; Shu et al., 2009b). In the case
of Neptune, hydrogen bonding between the acylimine oxygen
and a water molecule causes bathochromic shifts in both the
excitation and emission spectra. The conformational flexibility
of water may allow strong hydrogen bonding and thereby influ-
ence the electron distribution in the ground state in Neptune.
Together with the studies on mPlum, our findings raise the
possibility of inducing further red-shifts in RFPs by introducing
other hydrogen bond donors or acidic groups near the acylimine
oxygen. Other strategies that could be explored include
enhancing chromophore co-planarity between the imidazolinone
ring and acylimine group and the introduction of electrostatic
interactions near the chromophore to preferentially stabilize the
excited state electron distribution. Continued evolution of mono-
meric autocatalytic RFPs along these lines has the potential to
further expand their use in intracellular and intravital applications.
SIGNIFICANCE
We have developed the first autocatalytic fluorescent
proteins with excitation peaks at R600 nm. The brightest
of these, Neptune, allows for efficient intravital imaging in
mammals with excitation wavelengths in the optical window.
Among many potential applications, Neptune should be use-
ful for tracking movement and proliferation in vivo of specific
cell populations during development, of implanted tumors
during metastasis, or of implanted stem cells in therapy
models. Used together with bacterial phytochrome-based
fluorescent proteins such as infrared fluorescent protein,
Neptune allows for the simultaneous tracking of two protein
or cell populations in the optical window.
EXPERIMENTAL PROCEDURES
Mutagenesis and Screening
Random mutagenesis was performed by error-prone PCR using the Gene-
Morph I or GeneMorph II kit (Stratagene). Mutations at specific residues
were introduced by overlapping PCR or by QuikChange (Stratagene). For all
library construction methods, chemically competent or electrocompetent
Escherichia coli strain JM109(DE3) (for pRSETB) or LMG194 (for pBAD) were
transformed and grown overnight on LB/agar [supplemented with 0.02%
(w/v) L-arabinose (Fluka) for pBAD constructs] at 37�C and maintained there-
after at room temperature. LB/agar plates were screened for transmitted color
by eye and for fluorescence using a Gel-DocIt imaging system (UVP).
JM109(DE3) colonies of interest were cultured overnight in 2 ml LB supple-
mented with ampicillin. For secondary screening, colonies of interest were
cultured in LB/ampicillin with 0.2% (w/v) arabinose overnight. Lysates were
extracted with B-PER II (Pierce), and spectra were obtained on a Safire
96 well fluorescence plate reader (TECAN).
Fluorescence-Activated Cell Sorting
LMG194 bacteria were electroporated with a modified pBAD vector containing
the gene library and the transformed cells were grown in 30 ml RM media (M9
media with 0.2% glucose, 2% casamino acids, and 1 mM MgCl2) with ampi-
cillin. After 8 hr, RFP expression was induced by adding L-arabinose to a final
Chemistry & Biology 16, 1169–117
concentration of 0.2% (w/v). Overnight induced cultures were diluted 1:100
into PBS supplemented with ampicillin prior to FACS sorting. Multiple rounds
of cell sorting were performed on a FACSDiva (BD Biosciences) in yield mode
for the first sort and purity or single cell mode for subsequent sorts of the same
library. Sorted cells were grown overnight in 4 ml RM with ampicillin and 0.2%
(w/v) D-glucose and the resulting saturated culture was diluted 1:100 into 30 ml
of the same media to start the next culture to be sorted. After three to four
rounds of FACS sorting, the bacteria were plated onto LB agar with 0.02%
(w/v) L-arabinose and grown overnight, after which individual clones were
screened manually as described above.
Protein Production and Characterization
For spectral characterization, bacteria were lysed in B-PER (Pierce) and His-
tagged proteins were purified by Ni-NTA chromatography (QIAGEN). Purified
proteins were exchanged into PBS (pH 7.4) by dialysis or gel filtration. Absor-
bance measurements were performed on a Cary UV-Vis spectrophotometer.
Fluorescence measurements were obtained on a Fluorolog-3 spectrofluorim-
eter with excitation spectra corrected for the xenon lamp spectrum and emis-
sion corrected for detector quantum yield. The excitation monochromator was
calibrated to the xenon spectrum peak at 467 nm and the emission monochro-
mator to the water Raman spectrum peak at 397 nm. Cresyl violet in methanol
was used as a quantum yield standard with a correction factor applied for the
refractive index difference between methanol and water (Lakowicz, 2006).
Visible light photography was performed on a light table with a digital camera
with white balance calibrated to the background. For maturation experiments,
bacteria were grown in sealed flasks in broth deoxygenated by bubbling with
nitrogen gas. Fluorescence intensities were measured at various times after
lysis on the Safire fluorescence plate reader. For size-exclusion chromatog-
raphy and light scattering, 15 mg of purified purified protein in 100 ml was
applied to a Shodex KW803 column and run in PBS (pH 7.0) at a flow rate of
0.5 ml/min using an Agilent 1100 Series HPLC system controlled by ChemSta-
tion software. Protein elution was dually monitored with 280 nm absorbance
and 568 nm absorbance for RFPs and 480 nm absorbance for EGFP. In-line
light scattering was performed by a Wyatt Heleos system running ASTRA soft-
ware. For native PAGE, 10 mg of purified protein was run on a 4%–16% Bis-Tris
polyacrylamide gel (Invitrogen) in 50 mM Bis-Tris and 50 mM Tricine (pH 6.8)
with 0.002% Coomassie blue G-250. Gels were imaged for fluorescence at
indicated wavelengths in a UVP iBox imaging system. For SDS-PAGE,
samples were loaded without boiling onto 4%–12% Bis-Tris polyacrylamide
gels and electrophoresed in MOPS electrophoresis buffer. Gels were then
fixed and stained with 0.02% Coomassie blue in 40% ethanol and 10% acetic
acid and destained in 40% ethanol and 10% acetic acid. For equilibrium
analytical ultracentrifugation, purified protein samples in 10 mM Tris (pH 7.4)
were centrifuged for 48 hr at 25�C in a Beckman Optima XL-I at speeds of
16,000, 20,000, and 24,000 rpm, measuring absorbance as a function of
radius. Absorbance at 220 nm was measured at 0.13, 0.38, 0.63, 1.0, 3.0,
and 5.0 mM protein concentrations. Profiles were globally fitted by nonlinear
least-squares analysis to single-component and monomer-dimer equilibrium
models using Ultrascan version 9.9 software.
Photobleaching Measurements
Aqueous droplets of purified protein in PBS were formed under mineral oil in
a chamber on the fluorescence microscope stage. For reproducible results it
proved essential to preextract the oil with aqueous buffer, which would remove
any traces of autoxidized or acidic contaminants. The droplets were small
enough (5–10 mm diameter) so that all the molecules would see the same inci-
dent intensity. The absolute excitation irradiance in photons/(cm2$s$nm) as
a function of wavelength was computed from the spectra of a xenon lamp,
the transmission of the excitation filter, the reflectance of the dichroic mirror,
the manufacturer-supplied absolute spectral sensitivity of a miniature inte-
grating-sphere detector (SPD024 head and ILC1700 m; International Light
Corp.), and the measured detector current. The predicted rate of initial photon
emission per chromophore (before any photobleaching had occurred) was
calculated from the excitation irradiance and absorbance spectrum (both as
functions of wavelength) and the quantum yield. The observed photobleaching
time courses were normalized to a common arbitrary standard of 1000 initially
emitted photons s�1 chromophore�1.
9, November 25, 2009 ª2009 Elsevier Ltd All rights reserved 1177

Chemistry & Biology
Fluorescent Proteins with Far-Red Excitation
Animal Imaging
Transcription units containing mKate, dNeptune, or IFP1.1 followed by the
poliovirus IRES and a GFP coding sequence were constructed in pENTR1
by standard methods, and then recombined into pAd-CMV-DEST by the
Gateway system (Invitrogen). Linearized plasmid was used to transfect
HEK293A cells for adenovirus production, followed by amplification and puri-
fication on FastTrap columns (Millipore) and elution into HBSS + 10% glycerol.
Serial dilutions onto HEK293A cells and GFP visualization were performed to
assess titers. Injections, imaging, and dissection were carried out in duplicate.
Mice were anesthesized with ketamine/xylazine, and then injected via the tail
vein with 50 ml of 5 3 1010 infectious units per milliliter of purified adenoviruses.
Five days later, mice were shaved on their ventral side and anesthesized with
ketamine/xylazine. Images were acquired on a Maestro 1 animal fluorescence
imaging system (CRI) with indicated excitation filters and a tunable liquid
crystal emission filter of 40 nm bandwidth centered on the indicated wave-
lengths. For quantification, off-animal dark counts were first subtracted, and
then mid-sagittal line intensities were obtained in ImageJ with the Plot Profile
function. Similar results were obtained in the duplicate samples for each condi-
tion. For the charts in Figure 3, line intensities from duplicate conditions were
averaged and background was defined as the mean mid-sagittal intensity of
uninfected liver, treatment-matched in terms of pre- or post-dissection condi-
tion. Defining background as the mid-thoracic region of infected animals gave
similar results. For confocal imaging, three randomly oriented freshly prepared
liver slices were placed on a coverslip and imaged with a 403 water objective
on a Zeiss LSM 5Live microscope. For each slice, fluorescence intensities
were measured from maximum intensity projections of a ten section stack of
total thickness of 40 mm. All animal procedures were performed according
to protocols approved by the University of California, San Diego, institutional
animal care and use committee. For spectral unmixing, the predicted Neptune
distribution in the infrared image is removed based on the Neptune distribution
in the far-red channel and the relative efficiencies in the two channels in detect-
ing Neptune, as calculated from the Neptune spectra.
Crystallization and Refinement
For crystallization, the His tag on the protein was removed by TEV protease
digestion. Crystals were grown by the sitting drop vapor diffusion method.
One microliter of protein at 10 mg/ml was mixed with 1 ml of 0.1 M HEPES
(pH 7.0), 0.2 M CaCl2, and 20% PEG 6000 at 18�C. Crystals were cryopro-
tected with a mixture of 66.5% Paratone-N, 28.5% paraffin oil, and 5% glyc-
erol (Sugahara and Kunishima, 2006) prior to immersion in liquid nitrogen.
Data were collected at Beamline 8.3.1 at the Advanced Light Source, Law-
rence Berkeley National Laboratory and processed with ELVES (Holton and
Alber, 2004) and MOSFLM/SCALA (Evans, 2006; Leslie, 2006). The crystal
structure was solved by molecular replacement using PHASER (McCoy
et al., 2007) with mKate at pH 4.2 without the chromophore (PDB 3BXA) as
the search model. The structure was refined with TLS parameters using
PHENIX (Zwart et al., 2008), alternating with manual revision of the model
using COOT (Emsley and Cowtan, 2004). No planarity restraints were applied
to the chromophore during refinement. Crystallographic data and refinement
statistics are presented in Table 3. Structure validation was performed with
WHAT_CHECK (Hooft et al., 1996). Neptune and mKate (pH 7.0) (PDB file
3BXB) were aligned and root mean square deviations were calculated using
the align command in PyMol (http://www.pymol.org).
ACCESSION NUMBERS
Coordinates have been deposited in the PDB with accession codes 3IP2.
Sequences have been deposited in the EMBL Nucleotide Sequence Database
with accession codes FN565568 (Neptune) and FN565569 (mNeptune), and
in GenBank with accession codes GU189532 (Neptune) and GU189533
(mNeptune).
SUPPLEMENTAL DATA
Supplemental Data include Supplemental Experimental Procedures, six
figures, and four tables and can be found with this article online at http://
www.cell.com/chemistry-biology/supplemental/S1074-5521(09)00360-3.
1178 Chemistry & Biology 16, 1169–1179, November 25, 2009 ª200
ACKNOWLEDGMENTS
We thank Paul Steinbach for assisting with protein photobleaching and related
analysis. We acknowledge the following sources of support: the Jane Coffin
Childs Foundation and a Burroughs Wellcome Career Award for Medical
Scientists (M.Z.L.), the University of California, San Diego, Chancellor’s Award
for Undergraduate Research (M.R.M.), a Howard Hughes Medical Institute
(HHMI) predoctoral fellowship (N.C.S.), a Canadian Institutes of Health
Research postdoctoral fellowship (R.E.C.), the National Institutes of Health
(NIH) Medical Scientist Training Program and U.S. Army Breast Cancer
Research Program (BCRP) grant W81XWH-05-01-0183 (T.A.A.), NIH grant
R01 GM048958 (H-L.N., W.M., and T.A.), HHMI, NIH grants R01 GM086197
and R37 NS027177, and BCRP grant W81XWH-05-01-0183 (R.Y.T.).
Received: June 29, 2009
Revised: October 5, 2009
Accepted: October 12, 2009
Published: November 24, 2009
REFERENCES
Abbyad, P., Childs, W., Shi, X., and Boxer, S.G. (2007). Dynamic Stokes
shift in green fluorescent protein variants. Proc. Natl. Acad. Sci. USA 104,
20189–20194.
Baird, G.S., Zacharias, D.A., and Tsien, R.Y. (2000). Biochemistry, mutagen-
esis, and oligomerization of DsRed, a red fluorescent protein from coral.
Proc. Natl. Acad. Sci. USA 97, 11984–11989.
Chalfie, M., and Kain, S.R. (2006). Green Fluorescent Protein: Properties,
Applications, and Protocols (Hoboken, NJ: Wiley-Interscience).
Colin, M., Moritz, S., Schneider, H., Capeau, J., Coutelle, C., and Brahimi-
Horn, M.C. (2000). Haemoglobin interferes with the ex vivo luciferase lumines-
cence assay: consequence for detection of luciferase reporter gene expres-
sion in vivo. Gene Ther. 7, 1333–1336.
Emsley, P., and Cowtan, K. (2004). Coot: model-building tools for molecular
graphics. Acta Crystallogr. D Biol. Crystallogr. 60, 2126–2132.
Evans, P. (2006). Scaling and assessment of data quality. Acta Crystallogr. D
Biol. Crystallogr. 62, 72–82.
Gross, L.A., Baird, G.S., Hoffman, R.C., Baldridge, K.K., and Tsien, R.Y.
(2000). The structure of the chromophore within DsRed, a red fluorescent
protein from coral. Proc. Natl. Acad. Sci. USA 97, 11990–11995.
Henderson, J.N., Ai, H.W., Campbell, R.E., and Remington, S.J. (2007). Struc-
tural basis for reversible photobleaching of a green fluorescent protein homo-
logue. Proc. Natl. Acad. Sci. USA 104, 6672–6677.
Holton, J., and Alber, T. (2004). Automated protein crystal structure determina-
tion using ELVES. Proc. Natl. Acad. Sci. USA 101, 1537–1542.
Hooft, R.W., Vriend, G., Sander, C., and Abola, E.E. (1996). Errors in protein
structures. Nature 381, 272.
Lakowicz, J.R. (2006). Principles of Fluorescence Spectroscopy (New York:
Springer).
Leslie, A.G. (2006). The integration of macromolecular diffraction data. Acta
Crystallogr. D Biol. Crystallogr. 62, 48–57.
Li, H., Robertson, A.D., and Jensen, J.H. (2005). Very fast empirical prediction
and rationalization of protein pKa values. Proteins 61, 704–721.
McCoy, A.J., Grosse-Kunstleve, R.W., Adams, P.D., Winn, M.D., Storoni, L.C.,
and Read, R.J. (2007). Phaser crystallographic software. J. Appl. Crystallogr.
40, 658–674.
Ntziachristos, V. (2006). Fluorescence molecular imaging. Annu. Rev. Biomed.
Eng. 8, 1–33.
Ormo, M., Cubitt, A.B., Kallio, K., Gross, L.A., Tsien, R.Y., and Remington, S.J.
(1996). Crystal structure of the Aequorea victoria green fluorescent protein.
Science 273, 1392–1395.
Petersen, J., Wilmann, P.G., Beddoe, T., Oakley, A.J., Devenish, R.J., Pre-
scott, M., and Rossjohn, J. (2003). The 2.0-A crystal structure of eqFP611,
9 Elsevier Ltd All rights reserved
Chemistry & Biology
Fluorescent Proteins with Far-Red Excitation
a far red fluorescent protein from the sea anemone Entacmaea quadricolor. J.
Biol. Chem. 278, 44626–44631.
Pletnev, S., Shcherbo, D., Chudakov, D.M., Pletneva, N., Merzlyak, E.M.,
Wlodawer, A., Dauter, Z., and Pletnev, V. (2008). A crystallographic study of
bright far-red fluorescent protein mKate reveals pH-induced cis-trans isomer-
ization of the chromophore. J. Biol. Chem. 283, 28980–28987.
Remington, S.J. (2006). Fluorescent proteins: maturation, photochemistry and
photophysics. Curr. Opin. Struct. Biol. 16, 714–721.
Remington, S.J., Wachter, R.M., Yarbrough, D.K., Branchaud, B., Anderson,
D.C., Kallio, K., and Lukyanov, K.A. (2005). zFP538, a yellow-fluorescent
protein from Zoanthus, contains a novel three-ring chromophore. Biochem-
istry 44, 202–212.
Shaner, N.C., Campbell, R.E., Steinbach, P.A., Giepmans, B.N., Palmer, A.E.,
and Tsien, R.Y. (2004). Improved monomeric red, orange and yellow fluores-
cent proteins derived from Discosoma sp. red fluorescent protein. Nat.
Biotechnol. 22, 1567–1572.
Shaner, N.C., Steinbach, P.A., and Tsien, R.Y. (2005). A guide to choosing
fluorescent proteins. Nat. Methods 2, 905–909.
Shaner, N.C., Lin, M.Z., McKeown, M.R., Steinbach, P.A., Hazelwood, K.L.,
Davidson, M.W., and Tsien, R.Y. (2008). Improving the photostability of bright
monomeric orange and red fluorescent proteins. Nat. Methods 5, 545–551.
Shcherbo, D., Merzlyak, E.M., Chepurnykh, T.V., Fradkov, A.F., Ermakova,
G.V., Solovieva, E.A., Lukyanov, K.A., Bogdanova, E.A., Zaraisky, A.G., Lukya-
nov, S., and Chudakov, D.M. (2007). Bright far-red fluorescent protein for
whole-body imaging. Nat. Methods 4, 741–746.
Shcherbo, D., Murphy, C.S., Ermakova, G.V., Solovieva, E.A., Chepurnykh,
T.V., Shcheglov, A.S., Verkhusha, V.V., Pletnev, V.Z., Hazelwood, K.L., Roche,
P.M., et al. (2009). Far-red fluorescent tags for protein imaging in living tissues.
Biochem J. 418, 567–574.
Shu, X., Shaner, N.C., Yarbrough, C.A., Tsien, R.Y., and Remington, S.J.
(2006). Novel chromophores and buried charges control color in mFruits.
Biochemistry 45, 9639–9647.
Chemistry & Biology 16, 1169–11
Shu, X., Royant, A., Lin, M.Z., Aguilera, T.A., Lev-Ram, V., Steinbach, P.A., and
Tsien, R.Y. (2009a). Mammalian expression of infrared fluorescent proteins
engineered from a bacterial phytochrome. Science 324, 804–807.
Shu, X., Wang, L., Colip, L., Kallio, K., and Remington, S.J. (2009b). Unique
interactions between the chromophore and glutamate 16 lead to far-red emis-
sion in a red fluorescent protein. Protein Sci. 18, 460–466.
Sniegowski, J.A., Lappe, J.W., Patel, H.N., Huffman, H.A., and Wachter, R.M.
(2005). Base catalysis of chromophore formation in Arg96 and Glu222 variants
of green fluorescent protein. J. Biol. Chem. 280, 26248–26255.
Stamatas, G.N., Southall, M., and Kollias, N. (2006). In vivo monitoring of cuta-
neous edema using spectral imaging in the visible and near infrared. J. Invest.
Dermatol. 126, 1753–1760.
Sugahara, M., and Kunishima, N. (2006). Novel versatile cryoprotectants for
heavy-atom derivatization of protein crystals. Acta Crystallogr. D Biol. Crystal-
logr. 62, 520–526.
Taguchi, N., Mochizuki, Y., Nakano, T., Amari, S., Fukuzawa, K., Ishikawa, T.,
Sakurai, M., and Tanaka, S. (2009). Fragment molecular orbital calculations
on red fluorescent proteins (DsRed and mFruits). J. Phys. Chem. B 113,
1153–1161.
Tromberg, B.J., Shah, N., Lanning, R., Cerussi, A., Espinoza, J., Pham, T.,
Svaasand, L., and Butler, J. (2000). Non-invasive in vivo characterization of
breast tumors using photon migration spectroscopy. Neoplasia 2, 26–40.
Wang, L., Jackson, W.C., Steinbach, P.A., and Tsien, R.Y. (2004). Evolution of
new nonantibody proteins via iterative somatic hypermutation. Proc. Natl.
Acad. Sci. USA 101, 16745–16749.
Zwart, P.H., Afonine, P.V., Grosse-Kunstleve, R.W., Hung, L.W., Ioerger, T.R.,
McCoy, A.J., McKee, E., Moriarty, N.W., Read, R.J., Sacchettini, J.C., et al.
(2008). Automated structure solution with the PHENIX suite. Methods Mol.
Biol. 426, 419–435.
79, November 25, 2009 ª2009 Elsevier Ltd All rights reserved 1179