Auto-Scaling in OpenStackcs.utdallas.edu/wp-content/uploads/2015/09/AutoScaling.pdf · Auto-Scaling...
14
Auto-Scaling in OpenStack Saurav Tewari Student volunteer (May 2015 Aug 2015)
Transcript of Auto-Scaling in OpenStackcs.utdallas.edu/wp-content/uploads/2015/09/AutoScaling.pdf · Auto-Scaling...

Auto-Scaling in OpenStack
Saurav Tewari Student volunteer (May 2015 Aug 2015)

Index Introduction PreConfiguration Heat Orchestration Template (HOT) HOT created as part of autoscaling application Workflow of autoscaling Interval at which alarm will be triggered Snapshots
Initial state of network Creating network stack from networkmain.yaml Creating network scale from networkmain.yaml Injecting code (increasing cpu_util) from ScalingMain vm to machine28 vm Scaling up Injecting code (decreasing cpu_util) from ScalingMain vm to machine28 vm Scaling down Ceilometer statistics API Stack event for checking alarm triggering time
Ceilometer query for measuring specific resource cpuutilization OpenStack CLI
Heat API Ceilometer API Code injection commands
References
1

Introduction Heat is the component responsible for orchestration in OpenStack. It manages the lifecycle of openstack application using templates and defines the relationship among resources. It defines the lifecycle of applications. Heat allow advanced functionality such as nested stacks and autoscaling. AutoScaling is a feature of OpenStack Heat that allows resources of an application to autoscale when required. Autoscaling is possible for any number of resources but in this application we have considered only autoscaling of virtual machines. In autoscaling Heat and Ceilometer plays vital role. Heat provides resources to be scaled and policy for scaling. Ceilometer provides alarm which notifies when certain threshold (of some meter) have been met.
Pre-Configuration Creating image with following three files.
1. run.sh: this file contains code for running infinite echo and dumping to \dev\null file. 2. start.sh: it contains for loop that executes run.sh file in each loop. 3. end.sh: it contains command to kill all the running shell processes.
After all files have been created take a snapshot of this image. This screenshot will be used for booting all the virtual machine instances for autoscaling.
Heat Orchestration Template (HOT) It it the default format which is used to create stack: a collection of resource. HOT is written in YAML (YAML Ain’t Markup Language) format. It integrates well with software configuration management tools and other OpenStack components. There are three versions of HOT that are
2

available today. The version of templates matter because each version contains specific features and supports specific functions: 1. Icehouse (oldest) 20130523 2. Juno 2141016 3. Kilo (latest) 20150430
HOT created as part of autoscaling application 1. networkmain.yaml This templates creates an infrastructure for creating autoscaling resources. It creates a Router (ScalingRouter) which is connected to Network (ScalingNetwork) and an Instance (ScalingMain).
3

2.scalingmain.yaml This is the main templates which is used for scaling. It has following main resource: a. Heat::AutoScalingGroup: It is the group of resources that can be scaled. The template contains only Nova::Server as scalinggroup member. Metadata has been set for server since alarm will check resources with this metadata (key, value pair ) for triggering alarm. b. Heat::ScalingPolicy: Defines the policy for change (add/remove) in scalinggroup. The template includes two scaling policies. One for scalingup and other for scaling down. Depending on the triggered alarm it will scaleup/ scaledown the AutoScalingGroup resources. c. Ceilometer::Alarm: Defines the meter and condition to be monitored for triggering alarm. The template monitors cpu utilization (cpu_util meter) of resources having metadata as defined in AutoScalingGroup. This is important because by default alarm monitors cpu utilization for all the resource present in tenant. By setting matchingmetadata we are restricting to monitor only those resource with specific metadata.
4

Workflow of autoscaling ScalingMain is used to inject code to any virtual machine of AutoScalingGroup. Initially AutoScalingGroup has one virtual machine. Overall two virtual machines on ScalingNetwork. 1. Using SSH inject code/kill process from ScalingMain to other virtual machine. 2. Ceilometer Alarms monitors the average cpu utilization of all the virtual machines of Scaling stack (part of scaling group in scalingmain.yaml). 3. If the average cpu utilization of stack is greater than or equal to 30% (mentioned in cpu_high alarm) or less than or equal to 10% (mentioned in cpu_low alarm) then alarm is triggered. 4. The alarm notifies the ScalingPolicy URL (as mentioned in alarm_action of ceilometer alarm definition in scalingmain.yaml). The time at which alarm is triggered depends on the interval of pipeline.yaml file and period of alarm. 5. The ScalingPolicy add or removes virtual machines depending which alarm has been triggered. 6. step 15 is repeated until specific condition is specified.
Interval at which alarm will be triggered The time at which meter sample will be collected by Ceilometer Collector is defined in “pipeline.yaml”. By default the cpu_util meter sample are collected at every 600 seconds or 10 minutes (interval under meter ‘cpu’).
5
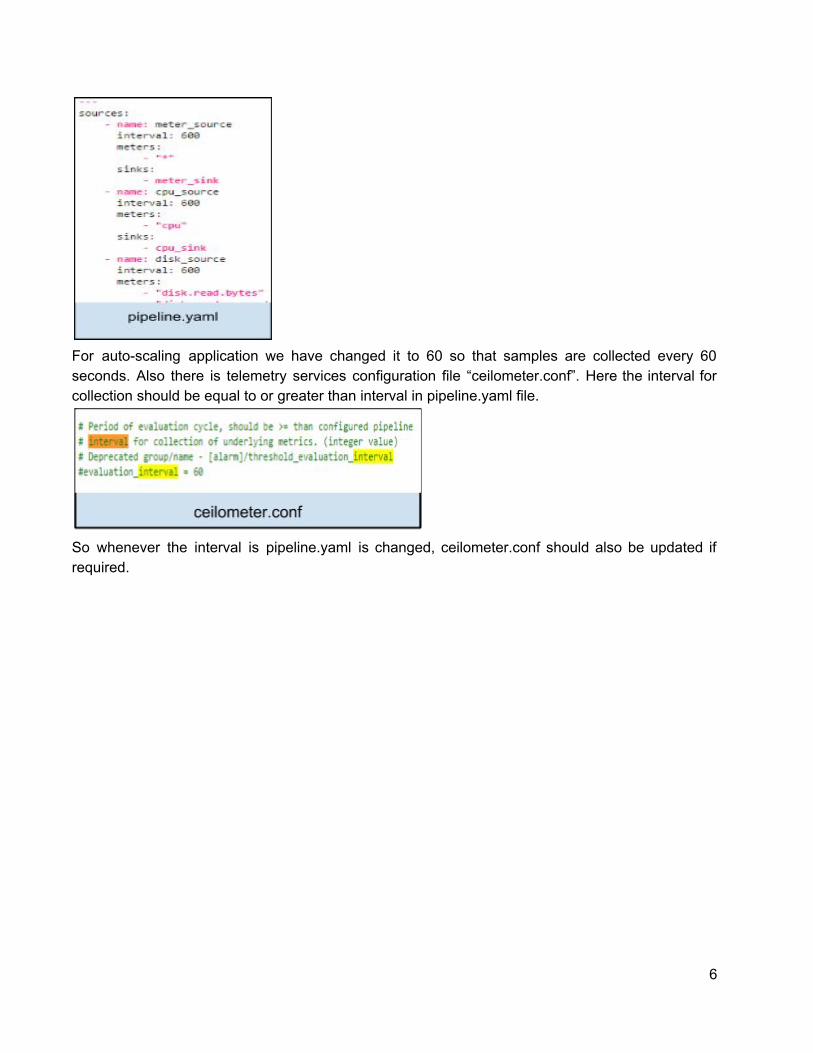
For autoscaling application we have changed it to 60 so that samples are collected every 60 seconds. Also there is telemetry services configuration file “ceilometer.conf”. Here the interval for collection should be equal to or greater than interval in pipeline.yaml file.
So whenever the interval is pipeline.yaml is changed, ceilometer.conf should also be updated if required.
6

Snapshots
Initial state of network
Creating network stack from networkmain.yaml
7

Creating network scale from networkmain.yaml
Injecting code (increasing cpu_util) from ScalingMain vm to machine28 vm
8

Scaling up
9

Injecting code (decreasing cpu_util) from ScalingMain vm to machine28 vm
Scaling down
10

Ceilometer statistics API
Stack event for checking alarm triggering time
Ceilometer query for measuring specific resource cpu-utilization While creating Nova::Server (as part of AutoScalingGroup) we set following metadata:
metadata: {"metering.stack": {get_param: "OS::stack_id"}} While creating Ceilometer::Alarm we set following matching_metadata:
matching_metadata: "metadata.user_metadata.stack": {get_param: "OS::stack_id"}
11

This metadata query is not same because when resource contains metadata in the form of “metering.X: Y” then ceilometer converts the metadata of resource to “user_metadata.x: Y”. And since we are checking the metadata the ceilometer query becomes “metadata.user_metadata.x: Y”
OpenStack CLI To check information of stack or any telemetry services OpenStack had provided API. For this application some of Heat and Ceilometer API are used. Following are the API used are
Heat API To check stack present in tenant heat stacklist To create new stack heat stackcreate scale f scalingmain.yaml //scale: name of stack, scalingmain.yaml: filename To delete a stack heat stackdelete scale //scale: name of stack to be deleted To display stack information heat stackshow scale //scale: stack name
Ceilometer API To check alarm present in tenant ceilometer alarmlist To display alarm information ceilometer alarmshow a alarm_id //alarm_id: ID of alarm To check samplelist of cpu_util meter ceilometer samplelist m cpu_util q metadata.user_metadata.stack=stack_id
//m cpu_util: meter for outputting sample, stack_id: id of stack To check statistics ceilometer statistics m cpu_util q metadata.user_metadata.stack=stack_id p 120
//p: period for statistics should be displayed To delete alarm ceilometer alarmdelete a alarm_id //alarm_id: ID of alarm
12

Code injection commands To login to virtual machine remotely using ssh ssh [email protected] //cirros: hostname, x.x.x.x floating IP To start injecting code sh start.sh //start.sh: shell file that runs multiple infinite loops in background To kill all shell process sh end.sh //end.sh: shell file that kill all the running shell process
References ● http://docs.openstack.org/developer/heat/template_guide/hot_spec.html ● https://ask.openstack.org/en/question/50124/heattemplatealarm/ ● https://bugs.launchpad.net/heat/+bug/1356544 ● https://ask.openstack.org/en/question/58566/heatorchestrationscaledownaspecificin
stance/ ● http://docs.openstack.org/adminguidecloud/content/section_telemetrydatacollectionp
rocessing.html ● http://docs.openstack.org/developer/ceilometer/configuration.html#pipelineconfiguration ● http://docs.openstack.org/kilo/configreference/content/section_ceilometer.conf.html ● http://docs.openstack.org/developer/ceilometer/architecture.html ● http://docs.openstack.org/developer/ceilometer/configuration.html#pipelineconfiguration ● https://github.com/rbowen/presentations/blob/master/ceilometer/slides.md ● https://github.com/openstack/ceilometer/blob/master/ceilometer/compute/util.py#L34
13