AUTO PRODUCTION IN SOUTH AFRICA AND COMPONENTS ...
82
GLOBAL LABOUR UNIVERSITY AUTO PRODUCTION IN SOUTH AFRICA AND COMPONENTS MANUFACTURING IN GAUTENG PROVINCE Alex Mohubetswane Mashilo Working Paper No. 58 SEPTEMBER 2019
Transcript of AUTO PRODUCTION IN SOUTH AFRICA AND COMPONENTS ...

GLOBALLABOURUNIVERSITY
AUTO PRODUCTION IN SOUTH AFRICA AND COMPONENTS MANUFACTURING IN GAUTENG PROVINCE
Alex Mohubetswane Mashilo
Working Paper No. 58
SEPTEMBER 2019
The Global Labour University (GLU) www.global-labour-university.org is an international network of universities, trade unions, research institutes, think tanks and the International Labour Organisation that
! develops and implements university post graduate programmes on labour and globalization for trade unionists and other labour experts;
! undertakes joint research and organizes international discussion fora
on global labour issues;
! publishes textbooks, research and discussion papers on labour and globalization issues.
Editorial Board Patrick Belser (International Labour Organisation) Hansjörg Herr (Berlin School of Economics and Law, Germany) Frank Hoffer (Action, Collaboration, Transformation) Seeraj Mohamed (University of the Witwatersrand, South Africa) Rafael Peels (International Labour Organisation) Archana Prasad (Jawaharlal Nehru University, India) Helen Schwenken (University of Osnabrück, Germany) Michael Watt (International Labour Organisation) Marcelo Weishaupt Proni (Universidade Estadual de Campinas, Brazil) Contact Address Hochschule für Wirtschaft und Recht Berlin IMB - Prof. Hansjörg Herr Badensche Str. 52 D-10825 Berlin E-mail: [email protected] http://www.global-labour-university.org Layout: Harald Kröck
!!!!!!!!!!!!!!!!!!!!!!!!!!!!!!!!!!!!!!!!!!!!!!!!!!!!!!
AUTO PRODUCTION IN SOUTH
AFRICA AND COMPONENTS
MANUFACTURING IN GAUTENG
PROVINCE
Alex Mohubetswane Mashilo We thank the Hans-Böckler Foundation which supported this publication. The paper is part of the project “Global value chains, economic and social upgrading” at the Berlin School of Economics and Law.
The responsibility for opinions expressed in the GLU working papers rests solely with their authors, and publication does not constitute an endorsement by the International Labour Office of the opinions expressed in them.

GLU | Economic and Social Upgrading in Auto Global Value Chains in South Africa
I I
Copyright © International Labour Organization 2019
First published 2019
Publications of the International Labour Office enjoy copyright under Protocol 2 of the Universal Copyright Convention. Nevertheless, short excerpts from them may be reproduced without authorization, on condition that the source is indicated. For rights of reproduction or translation, application should be made to ILO Publications (Rights and Permissions), International Labour Office, CH-1211 Geneva 22, Switzerland, or by email: [email protected]. The International Labour Office welcomes such applications.
Libraries, institutions and other users registered with reproduction rights organizations may make copies in accordance with the licences issued to them for this purpose. Visit www.ifrro.org to find the reproduction rights organization in your country.
ISSN: 1866-0541 (print) ; 2194-7465 (PDF)
The designations employed in ILO publications, which are in conformity with United Nations practice, and the presentation of material therein do not imply the expression of any opinion whatsoever on the part of the International Labour Office concerning the legal status of any country, area or territory or of its authorities, or concerning the delimitation of its frontiers.
The responsibility for opinions expressed in signed articles, studies and other contributions rests solely with their authors, and publication does not constitute an endorsement by the International Labour Office of the opinions expressed in them.
Reference to names of firms and commercial products and processes does not imply their endorsement by the International Labour Office, and any failure to mention a particular firm, commercial product or process is not a sign of disapproval.
Information on ILO publications and digital products can be found at: www.ilo.org/publns.
Printed in Switzerland
GLU | Economic and Social Upgrading in Auto Global Value Chains in South Africa
I I I
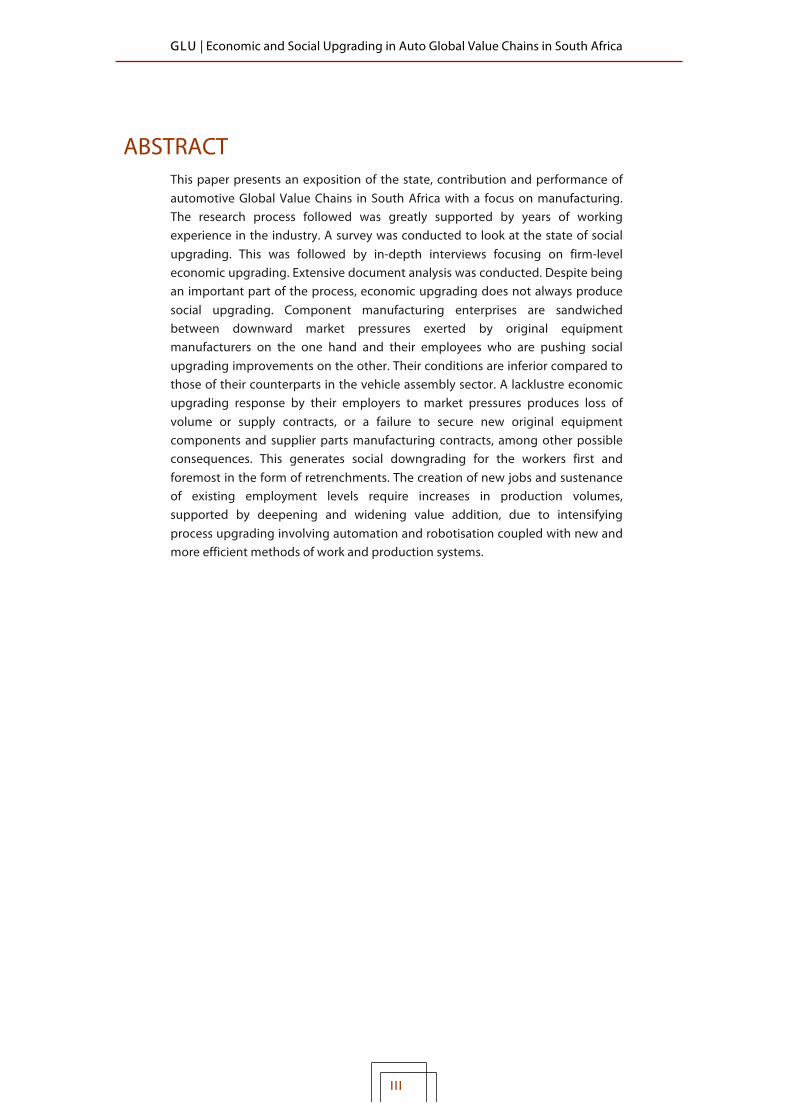
ABSTRACT This paper presents an exposition of the state, contribution and performance of automotive Global Value Chains in South Africa with a focus on manufacturing. The research process followed was greatly supported by years of working experience in the industry. A survey was conducted to look at the state of social upgrading. This was followed by in-depth interviews focusing on firm-level economic upgrading. Extensive document analysis was conducted. Despite being an important part of the process, economic upgrading does not always produce social upgrading. Component manufacturing enterprises are sandwiched between downward market pressures exerted by original equipment manufacturers on the one hand and their employees who are pushing social upgrading improvements on the other. Their conditions are inferior compared to those of their counterparts in the vehicle assembly sector. A lacklustre economic upgrading response by their employers to market pressures produces loss of volume or supply contracts, or a failure to secure new original equipment components and supplier parts manufacturing contracts, among other possible consequences. This generates social downgrading for the workers first and foremost in the form of retrenchments. The creation of new jobs and sustenance of existing employment levels require increases in production volumes, supported by deepening and widening value addition, due to intensifying process upgrading involving automation and robotisation coupled with new and more efficient methods of work and production systems.

GLU | Economic and Social Upgrading in Auto Global Value Chains in South Africa
IV
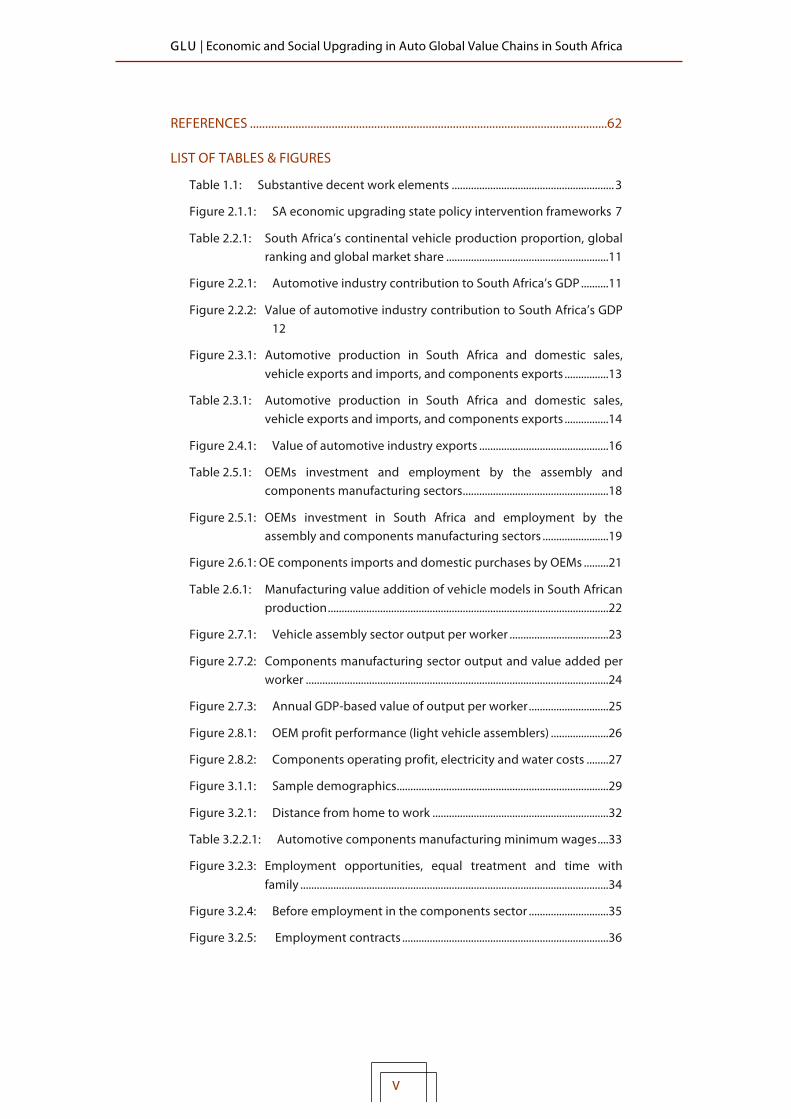
TABLE OF CONTENTS ACRONYMS .......................................................................................................................... 1!
INTRODUCTION .................................................................................................................. 2!
1.! METHODOLOGY ........................................................................................................ 2!1.1! Decent work survey ............................................................................................ 2!1.2! Economic upgrading .......................................................................................... 4!1.3! Limitations ............................................................................................................. 5!
2.! AUTOMOTIVE PRODUCTION DEVELOPMENT, OPERATING ENVIRONMENT AND INDUSTRY-LEVEL ECONOMIC UPGRADING CONTEXT ............................................................................................................... 7!2.1! Automotive production industrial policy ................................................... 7!2.2! Significance of the automotive industry in South Africa ...................... 9!2.3! Production output, domestic market, imports and exports .............. 12!2.4! Value of exports ................................................................................................. 15!2.5! Investment and employment ....................................................................... 18!2.6! Original Equipment components imports and exports and
manufacturing value addition ................................................................. 21!2.7! Output per worker ............................................................................................ 23!2.8! Profit ....................................................................................................................... 25!
3.! THE STATE OF SOCIAL UPGRADING IN THE COMPONENTS MANUFACTURING SECTOR .......................................................................... 28!3.1! Survey demographics ...................................................................................... 29!3.2! State of social upgrading, findings from the survey ............................. 31!3.2.1! Distance from work and expenditure on transport ............................ 31!3.2.2! Average monthly take home pay, overtime work and shift
configurations ............................................................................................... 32!3.2.3! Employment opportunities and equal treatment of females, males
and workers of all races ............................................................................. 34!3.3.4! Job quality .......................................................................................................... 36!3.2.5! Grades and grading model .......................................................................... 39!3.2.6! Skills training ..................................................................................................... 41!3.2.7! Wage increases and dismissal procedures ............................................. 45!3.2.8! Social dialogue, trade union and other organisations ....................... 47!3.2.9! Social protection; benefits ............................................................................ 49!3.2.10!Work health and safety .................................................................................. 51!
4.! RELATIONSHIP BETWEEN ECONOMIC AND SOCIAL UPGRADING IN THE AUTOMOTIVE COMPONENTS MANUFACTURING SECTOR – AN ASSESSMENT OF THE FINDINGS ................................................................. 52!4.1! Low decent work category ............................................................................ 52!4.2! High decent work category ........................................................................... 54!4.3! Conclusions from the findings ...................................................................... 57!
GLU | Economic and Social Upgrading in Auto Global Value Chains in South Africa
V
REFERENCES ...................................................................................................................... 62!
LIST OF TABLES & FIGURES
Table 1.1:! Substantive decent work elements ........................................................... 3!
Figure 2.1.1:! SA economic upgrading state policy intervention frameworks 7!
Table 2.2.1:! South Africa’s continental vehicle production proportion, global ranking and global market share ........................................................... 11!
Figure 2.2.1:! Automotive industry contribution to South Africa’s GDP .......... 11!
Figure 2.2.2:! Value of automotive industry contribution to South Africa’s GDP 12!
Figure 2.3.1:! Automotive production in South Africa and domestic sales, vehicle exports and imports, and components exports ................ 13!
Table 2.3.1:! Automotive production in South Africa and domestic sales, vehicle exports and imports, and components exports ................ 14!
Figure 2.4.1:! Value of automotive industry exports ............................................... 16!
Table 2.5.1:! OEMs investment and employment by the assembly and components manufacturing sectors ..................................................... 18!
Figure 2.5.1:! OEMs investment in South Africa and employment by the assembly and components manufacturing sectors ........................ 19!
Figure 2.6.1: OE components imports and domestic purchases by OEMs ......... 21!
Table 2.6.1:! Manufacturing value addition of vehicle models in South African production ...................................................................................................... 22!
Figure 2.7.1:! Vehicle assembly sector output per worker .................................... 23!
Figure 2.7.2:! Components manufacturing sector output and value added per worker .............................................................................................................. 24!
Figure 2.7.3:! Annual GDP-based value of output per worker ............................. 25!
Figure 2.8.1:! OEM profit performance (light vehicle assemblers) ..................... 26!
Figure 2.8.2:! Components operating profit, electricity and water costs ........ 27!
Figure 3.1.1:! Sample demographics ............................................................................. 29!
Figure 3.2.1:! Distance from home to work ................................................................ 32!
Table 3.2.2.1:! Automotive components manufacturing minimum wages .... 33!
Figure 3.2.3: ! Employment opportunities, equal treatment and time with family ................................................................................................................ 34!
Figure 3.2.4:! Before employment in the components sector ............................. 35!
Figure 3.2.5:! Employment contracts ........................................................................... 36!
GLU | Economic and Social Upgrading in Auto Global Value Chains in South Africa
VI
Table 3.2.1:! South African component hourly workforce .................................... 38!
Figure 3.2.6:! Grades populations .................................................................................. 39!
Table 3.2.2:! Other: Job titles instead of grades ........................................................ 40!
Figure 3.2.7:! Work and industry related training ..................................................... 41!
Figure 3.2.8:! Education Levels ........................................................................................ 42!
Table 3.2.3:! SAQA: National Certificate: Automotive Components: Manufacturing and Assembly: 2011-2015 Completions ............... 43!
Figure 3.2.9:! Automotive assembly sector hourly skills grading model ......... 44!
Figure 3.2.10:! Training expenditure by light vehicle assemblers ...................... 45!
Figure 3.2.11:! Wage increases and dismissal procedures .................................... 46!
Figure 3.2.12:! Social dialogue and trade union organisation ............................. 48!
Figure 3.2.13:! Other organisations to which workers belonged ....................... 49!
Figure 3.2.14:! Social protection: Benefits .................................................................. 50!
Figure 3.2.15:! Occupational work and safety ........................................................... 51!
Table 4.1:! The battle for social upgrading in the South African automotive assembly sector ............................................................................................... 58!
Table 4.2:! The battle for social upgrading in the South African automotive components manufacturing sector ......................................................... 59!

GLU | Economic and Social Upgrading in Auto Global Value Chains in South Africa
1
ACRONYMS AIDC: Automotive Industry Development Council AIEC: Automotive Industry Export Council AIS: Automotive Incentive Scheme APDP: Automotive Production and Development Programme B&M: Benchmarking and Manufacturing CBU: Complete Built Up CCMA: Commission for Conciliation, Mediation and Arbitration CPI: Consumer Price Index CPI(X): Consumer Price Index excluding interest rates on mortgage
bonds DTI: Department of Trade and Industry FTC: Fixed Term Contract GDP: Gross Domestic Product GVC: Global Value Chains IAM: Independent Aftermarket ILO: International Labour Organisation IVECO: Industrial Vehicles Corporation MERSETA: Manufacturing, Engineering and Related Services Sector
Education and Training Authority MIBCO: Motor Industry Bargaining Council MIDP: Motor Industry Development Programme MVA: Manufacturing Value Addition NAACAM: National Association of Automotive Components and Allied
Manufacturers NAAMSA: National Association of Automobile Manufacturers of South
Africa NBF: National Bargaining Forum NQF: National Qualifications Framework NUMSA: National Union of Metalworkers of South Africa OE: Original Equipment OEM: Original Equipment Manufacturer OES: Original Equipment Supplier OICA: International Organisation of Motor Vehicle Manufacturers PI: Production Incentive PPP: Purchasing Power Parity SAQA: South African Qualifications Authority StatsSA: Statistics South Africa SWOP: Society, Work and Development Institute TES: Temporary Employment Service, commonly known as a labour
broker TNC: Transnational Corporation UIF: Unemployment Insurance Fund USD: United States Dollars VAA: Vehicle Asset Allowance WTO: World Trade Organisation

GLU | Economic and Social Upgrading in Auto Global Value Chains in South Africa
2
INTRODUCTION This working paper looks at economic and social upgrading in the automotive Global Value Chains (GVCs) in South Africa, and is the first of a series of two working papers on the subject and the country. Firstly, this paper examines the progress of economic upgrading in the automotive industry in South Africa, 24 years after the beginning of South Africa’s breakthrough to its current democratic transition. The transition coincided with increased production integration in GVCs and international trade liberalisation. The paper then looks at the state of social upgrading. The second working paper will focus on the strategies pursued by stakeholders in the industry, inclusive of both labour and capital, as well as the state, and their perspectives on economic and social upgrading. Some of the key dynamics associated with this, including the automotive GVCs operating environment in South Africa, are covered in this present paper in so far as it is necessary.
The focus on economic upgrading in this paper covers performance indicators related to process and production upgrading, as well as functional and inter-chain upgrading, while the focus on social upgrading is explained starting in the next section.
1. METHODOLOGY 1.1 Decent work survey
The survey was designed to look at decent work, which represents the central thrust of social upgrading in this study. The survey questionnaires focused on hourly personnel, or wage labourers since they are at the bottom rungs of the workplace employment structure. They covered a total of 184 workers, spanning a manageable sample of 16 enterprises in the automotive components manufacturing sector in Gauteng Province. This is South Africa’s central economic hub, which is why the survey focused on the province.
The City of Tshwane, which is located in Gauteng Province, is both South Africa’s administrative capital and host to more automotive original equipment manufacturers (OEMs) than any city in the country.
Of the seven major OEMs that have production facilities in South Africa, three are located in the City of Tshwane, namely Ford Motor Company of Southern Africa (FMCSA), Bavarian Motor Works (BMW) and Nissan South Africa. In addition, Industrial Vehicles Corporations (IVECO) (2017) was also developing its final assembly operations for its medium, heavy duty and extra heavy duty trucks and buses in the City of Tshwane where, UD Trucks (previously Nissan Diesel), a subsidiary of the Volvo Group, also has its final assembly operations. The cities of Johannesburg and Ekurhuleni, both located in Gauteng Province, are also host to a significant proportion of the vehicle components manufacturing sector. At the time the survey was designed, Gauteng Province was host to the largest
GLU | Economic and Social Upgrading in Auto Global Value Chains in South Africa
3
proportion of South Africa’s automotive components manufacturing in South Africa in aggregate terms.
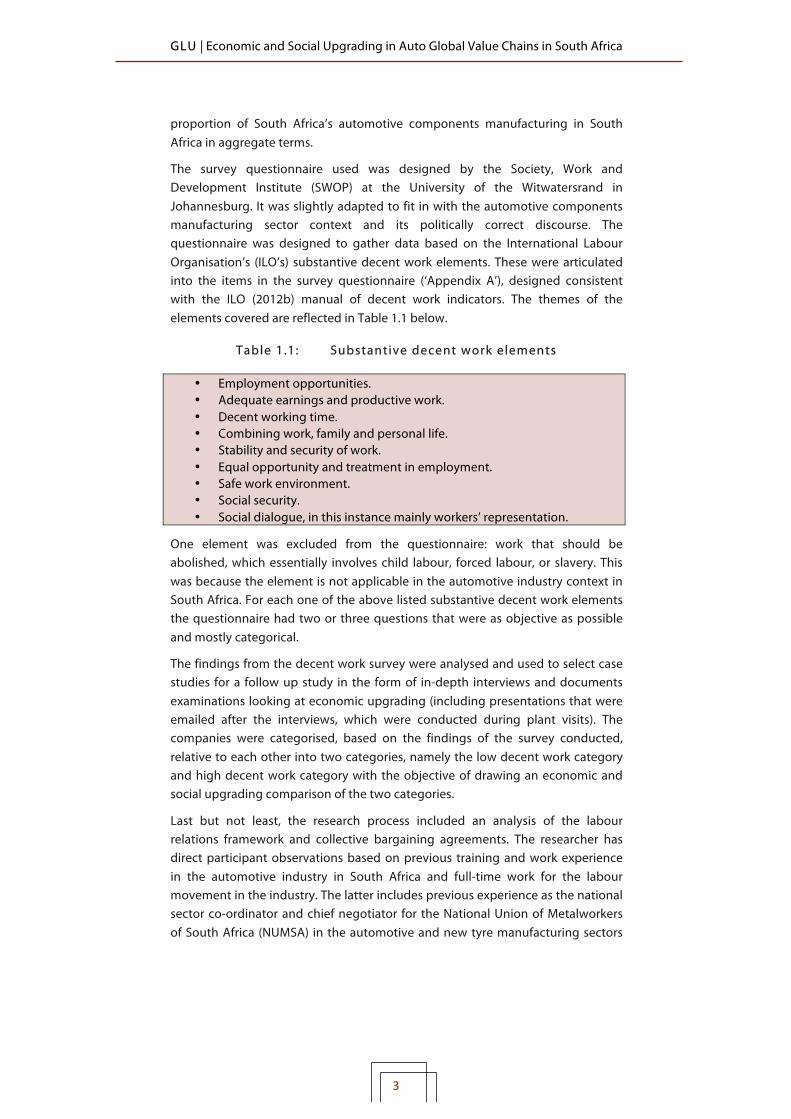
The survey questionnaire used was designed by the Society, Work and Development Institute (SWOP) at the University of the Witwatersrand in Johannesburg. It was slightly adapted to fit in with the automotive components manufacturing sector context and its politically correct discourse. The questionnaire was designed to gather data based on the International Labour Organisation’s (ILO’s) substantive decent work elements. These were articulated into the items in the survey questionnaire (‘Appendix A’), designed consistent with the ILO (2012b) manual of decent work indicators. The themes of the elements covered are reflected in Table 1.1 below.
Table 1.1: Substantive decent work elements
• Employment opportunities. • Adequate earnings and productive work. • Decent working time. • Combining work, family and personal life. • Stability and security of work. • Equal opportunity and treatment in employment. • Safe work environment. • Social security. • Social dialogue, in this instance mainly workers’ representation.
One element was excluded from the questionnaire: work that should be abolished, which essentially involves child labour, forced labour, or slavery. This was because the element is not applicable in the automotive industry context in South Africa. For each one of the above listed substantive decent work elements the questionnaire had two or three questions that were as objective as possible and mostly categorical.
The findings from the decent work survey were analysed and used to select case studies for a follow up study in the form of in-depth interviews and documents examinations looking at economic upgrading (including presentations that were emailed after the interviews, which were conducted during plant visits). The companies were categorised, based on the findings of the survey conducted, relative to each other into two categories, namely the low decent work category and high decent work category with the objective of drawing an economic and social upgrading comparison of the two categories.
Last but not least, the research process included an analysis of the labour relations framework and collective bargaining agreements. The researcher has direct participant observations based on previous training and work experience in the automotive industry in South Africa and full-time work for the labour movement in the industry. The latter includes previous experience as the national sector co-ordinator and chief negotiator for the National Union of Metalworkers of South Africa (NUMSA) in the automotive and new tyre manufacturing sectors
GLU | Economic and Social Upgrading in Auto Global Value Chains in South Africa
4
and head of organising, campaigning and collective bargaining, including involvement in industry policy related aspects.
1 .2 Economic upgrading
The in-depth firm-level economic upgrading interviews, following up on the survey conducted, focused on gathering data on the following items and related follow-up questions:
Whether the company adopted economic upgrading measures in the last five to ten years and what the context, challenges and opportunities were. To the extent that the company did adopt economic upgrading measures, what their essential content and strategic aims were.
What the results were with regard to productivity and whether there was an impact on employment. If so, in what way – i.e. whether there was an increase or decrease in the company’s workforce level or whether it remained unchanged. If so, why.
Why the workers were remunerated at their present remuneration levels, what the challenges were in this regard and in relation to the company’s production structure and economic upgrading position.
Whether the company outsourced the employment of any section of its workforce and what the reasons were. To the extent there were workers who were labour brokered, casualised, on temporary or short-term contracts of employment, what the reasons were.
What the company believed was the way forward with regard to economic upgrading and of course in its relationship to social upgrading.
The in-depth interviews took place at factories, the only place where the production process and the economic upgrading changes that had been adopted could be observed. The 16 companies covered by the decent work survey made up a sampling frame from which the case studies for in-depth interviews looking at firm-level economic upgrading were selected. A total of seven supplier case studies (i.e. the low decent work category and the high decent work category) were conducted.
Four of the seven case studies fell in the high decent work category and three in the low decent work category with both categories described relative to each other. The reason why there were four companies in the relatively high decent work category covered by the firm-level economic upgrading study (i.e. one more than in the low decent work category) is that the fourth, an independent aftermarket (IAM) supplier, declared its availability later than the others. Its inclusion revealed important dynamics which would have been lost to the study had they not been covered after the firm declared its availability to participate in the study.
GLU | Economic and Social Upgrading in Auto Global Value Chains in South Africa
5
Finally, data on economic upgrading was requested from key industry stakeholders: the National Association of Automobile Manufacturers of South Africa (NAAMSA), an authority of original equipment manufacturers (OEMs); the lead firms in the automotive industry GVCs; and the National Association of Automotive Components and Allied Manufacturers (NAACAM), an authority of automotive components manufacturers and their allied suppliers. These included data from the Department of Trade and Industry (DTI). Furthermore, data were either accessed or obtained from the following reliable sources: Benchmarking and Manufacturing (B&M) Analysts, a reputable industrial upgrading consultancy on the automotive industry in South Africa; the Manufacturing, Engineering and Related Services Sector Education and Training Authority (MERSETA), which is responsible for facilitating skills development for the sector; Statistics South Africa (StatsSA); the World Bank; the Automotive Industry Development Council (AIDC); and the Automotive Supply Chain Competitiveness Initiative (ASCCI), which was either formed or is supported by NAACAM, NAAMSA, the DTI and NUMSA (the largest trade union in the automotive industry in South Africa).
An analysis of the annual Automotive Export Manual, a statistical publication on the automotive industry in South Africa produced by the Automotive Industry Export Council (AIEC) played an important role. The same role was played by an analysis of statistics recorded by the International Organisation of Motor Vehicle Manufacturers (OICA) (e.g. 2008; 2009; 2013; 2014; 2017; 2018), the voice and statistical authority for the automotive industry globally.
1 .3 Limitations
While reflecting on both the assembly sector and the components manufacturing sector and their inextricable linkage, the focus of this paper leans more towards the components manufacturing sector. The reason for this focus is also due to the automotive assembly sector in South Africa having received much more analytical attention relative to the components manufacturing sector.
A key limitation faced by this paper was the availability and accessibility of data. As will be seen, statistical recording on accessible data started in 2010 on automotive GVCs in South Africa on a number of indicators. This includes data gathered through surveys with respect to the affected variables or indicators, such as publicly declared information on profit, rent, water, electricity and other related production costs that show how much the GVCs are leaving in the country when profits are expatriated elsewhere. In the same vein, access to comprehensive payroll data, encompassing both the total and breakdowns of total executive pay against salaried and hourly personnel wages, has also proven to be very hard to reach. There is therefore a need for mandatory data collection on all of these and other important aspects from industry. This will enable researchers to develop a comprehensive analysis of economic and social upgrading, as well as government to holistically evaluate the impact of its support to the industry.

GLU | Economic and Social Upgrading in Auto Global Value Chains in South Africa
6
The above highlighted difficulty of accessing the described data can be attributed to at least two factors. Firstly, all original equipment manufacturers with production operations in South Africa and 75 per cent of first-tier suppliers are foreign-controlled transnational corporations (TNCs). Secondly, collective bargaining both in the automotive assembly and components manufacturing sectors does not include salaried personnel. It is very difficult according to this labour regime even for trade unions to access related remuneration data through the labour relations processes governing the disclosure of relevant information.
Some of the data sets provided by the sources that have duly been acknowledged were given under conditions of a disclaimer: ‘Findings, conclusions and recommendations are based on information and sources believed to be accurate and reliable at the time of submission. The publisher makes no representation or warranty of any kind as to the accuracy of any information provided, and accepts no liability whatsoever for any loss or damage resulting from opinion, errors, inaccuracies or omissions affecting any part of the content.’ This ethical standard is hereby accordingly affirmed not only with regard to those specific instances but with regard to the entire data used, related findings and conclusions.
!
GLU | Economic and Social Upgrading in Auto Global Value Chains in South Africa
7
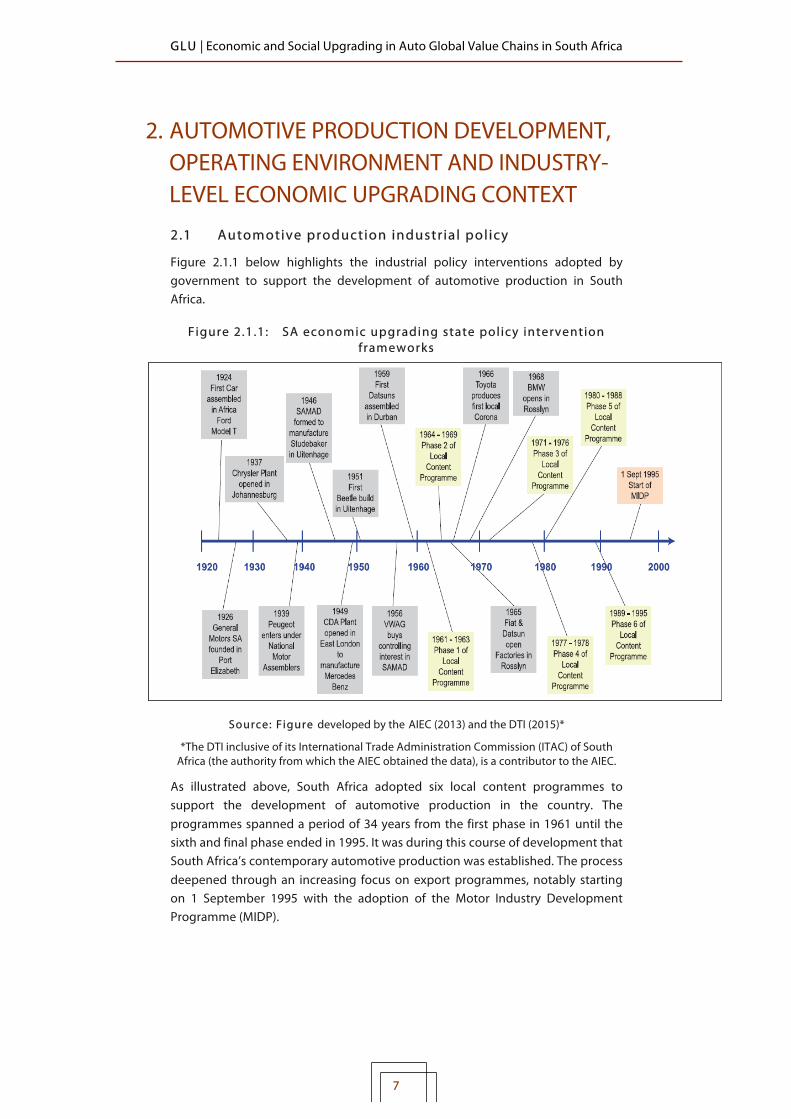
2. AUTOMOTIVE PRODUCTION DEVELOPMENT, OPERATING ENVIRONMENT AND INDUSTRY-LEVEL ECONOMIC UPGRADING CONTEXT 2.1 Automotive production industr ial policy
Figure 2.1.1 below highlights the industrial policy interventions adopted by government to support the development of automotive production in South Africa.
F igure 2.1.1: SA economic upgrading state policy intervention frameworks
Source: Figure developed by the AIEC (2013) and the DTI (2015)*
*The DTI inclusive of its International Trade Administration Commission (ITAC) of South Africa (the authority from which the AIEC obtained the data), is a contributor to the AIEC.
As illustrated above, South Africa adopted six local content programmes to support the development of automotive production in the country. The programmes spanned a period of 34 years from the first phase in 1961 until the sixth and final phase ended in 1995. It was during this course of development that South Africa’s contemporary automotive production was established. The process deepened through an increasing focus on export programmes, notably starting on 1 September 1995 with the adoption of the Motor Industry Development Programme (MIDP).

GLU | Economic and Social Upgrading in Auto Global Value Chains in South Africa
8
In summary, Phase 1 (1961-1963) of the successive local content programmes aimed at achieving a 15 to 40 per cent of local content in mass; Phase 2 (1964-1969) aimed at increasing local content in mass to 55 per cent; Phase 3 (1971-1976) set a minimum target of 52 per cent in net local content with the aim of increasing this to 66 per cent; Phase 4 (1977-1978) occurred in the aftermath of the oil crisis in the 1970s and did not alter the target from its predecessor; Phase 5 (1980-1988) aimed at achieving 66 per cent minimum net local content and a 50 per cent local content by mass on light goods vehicles and minibuses; finally Phase 6 (1989-1995) aimed at achieving a 75 per cent of local content (AEIC, 2013). Import duties were used and increased during each corresponding phase of the local content programme in accordance with its targets, and ranged from 35 per cent up to 100 per cent (AEIC, 2013).
The South African government industrial policy interventions, the MIDP and the Automotive Production and Development Programme (APDP) are widely recognised as having been, post-1994, among the key drivers of automotive industry production development and growth in the country (Lamprecht & Tolmay, 2017). The MIDP became a new automotive industrial policy in the context of the country’s April 1994 transition from apartheid to democracy. This democratic breakthrough ended the sanctions that were directed at the apartheid regime and paved the way for re-investment in South Africa mainly by the OEMs that had left, as well as by the global headquarters of those OEMs that, despite the sanctions, had maintained their production operations in the country but confined them largely to domestic market. The post-1994 automotive production development in South Africa coincided with the rising wave of production globalisation including international trade liberalisation. This entailed the functional integration of domestic automotive production operations into their respective OEM automotive GVCs.
The MIDP facilitated a phased-in liberalisation process in the context of an intensifying globalisation wave by only gradually reducing the degree of previous protection. For example, complete built up (CBU) vehicle duty was gradually reduced from 65 per cent in 1995 to 25 per cent in 2012 (AIEC, 2013). The process allowed local production development to build capacity to withstand the pressures of global competition and stay afloat in the new, increasingly liberalised global operating environment.
The MIDP was composed of incentives to encourage economies of scale or increased production volumes. Exports were incentivised for example by import rebate credit certificates allowing exporters reduced duty, or even through duty-free imports of other components not sourced locally or other vehicle models not produced in the country. Automotive OEMs thus rationalised model platforms, and in some instances reduced their production facilities to a single platform assembly plant.
The MIDP was replaced on 1 January 2013 by the APDP. The latter comprised mainly four pillars, namely import duty, Vehicle Assembly Allowance (VAA), Production Incentive (PI) and the Automotive Investment Scheme (AIS). This

GLU | Economic and Social Upgrading in Auto Global Value Chains in South Africa
9
translated, in line with the World Trade Organisation’s international trade regime, into a shift away from what could be construed to be seen as exclusive export ‘subsidisation’ under the MIDP.
Under the APDP, import duties were maintained at the MIDP’s 2012 level of 25 per cent for motor vehicles and 20 per cent for components. The plan was to maintain these levels until 2020 and by then have achieved an annual production level of 1.2 million CBU vehicles. South Africa will obviously not achieve this target everything remaining constant. The country is currently conducting a review of the APDP with the objective of replacing it with a new programme: the Automotive Master Plan up to 2035. The APDP was scheduled run out in 2020.
The APDP’s VAA was designed as support for the vehicle assembly sector at volumes greater than 50 000 units per annum with the incentive for qualifying investment amounting to 20 per cent in 2013, 19 per cent in 2014 and 18 per cent in 2015. The 2015 VAA incentive support level scheduled to apply until 2020.
The PI was expected to be the primary driver of local value addition and therefore to underpin growth in the domestic components manufacturing sector. The support came in the form of standard qualifying value of 55 per cent of production in 2013, with a 1 per cent annual reduction until 2018 which would then be maintained at 50 per cent until 2020.
The AIS was designed as a support in the form of a cash grant for qualifying capital investment according to criteria set by the Department of Trade and Industry (DTI) after consultation with industry stakeholders. The cash grant contributed 25 to 30 per cent of the value of the qualifying investment for the assembly sector and 25 to 35 per cent for the components manufacturing sector, payable over three years.
The APDP incentive structure comprised other support parameters for standard and manufacturing value addition on selected materials and for so-called ‘vulnerable components’. APDP measures are covered, for example, by the Department of Economic Development (2013) and the DTI (2016b) – among the numerous documents on the policy that were perused during the research.
2 .2 Signif icance of the automotive industry in South Afr ica
Prior to 1994, South Africa faced sanctions to compel the country’s last colonial regime, apartheid, to accede to democracy. The withdrawal from South Africa by transnational OEMs observing the sanctions directed at the apartheid regime left the majority of OEM production in the country operating under licensing agreements made with the headquarters of the automotive TNCs that had pulled out of manufacturing activity in South Africa (Barnes, 2000).
The country’s breakthrough to its current democratic dispensation in April 1994 resulted in the lifting of the sanctions. This paved the way for the TNC OEMs that had pulled out of the South African economy to return and for investment in the automotive industry to increase, as will be shown. These TNCs reacquired the production facilities which had become domestically based OEMs operating

GLU | Economic and Social Upgrading in Auto Global Value Chains in South Africa
10
under licensing agreements. Many of these production facilities had failed to keep up with ‘world class’ production development standards during the sanctions period. Their technical organisation of production (including work methods and technological capabilities) were also lacking in many productive and international aspects, in part due to the disinvestment that had occurred. In short, they were not globally competitive after the period of economic isolation.
The automotive assembly sector in South Africa has, for the most part, been made up of seven major, foreign-controlled global OEMs since 1995: the BMW South Africa, FMCSA, General Motors South Africa (GMSA) (later sold to Isuzu Motors), Mercedes Benz South Africa (MBSA), Nissan South Africa, Toyota South Africa (TSA) and Volkswagen South Africa (VWSA).
According to the DTI (2015), in 2014 South Africa had 120 first-tier suppliers and 200 second and third-tier suppliers. According to NAACAM’s 2017 directory, in 2016 the association had 130 affiliate companies with approximately 225 manufacturing facilities. NAACAM also had 32 associate affiliate companies providing a variety of services. About 110 of its affiliates were OEM and IAM suppliers. The majority, 75 per cent of first-tier suppliers were foreign-controlled TNCs, while most of the second and third-tier suppliers were local (DTI, 2015). Their presence in the country was mainly sustained by the OEMs that were producing vehicles in the country.
The automotive industry in South Africa is recognised both internationally (e.g. by OICA) and nationally (e.g. by government and industry stakeholders) as the largest automotive manufacturing industry on the African continent. In 2015 for example, according to an analysis of the statistics recorded by OICA (2017), South Africa’s automotive production output was followed on the African continent by that of Morocco, which is 288 337 Completely Built Up (CBU) vehicles. Morocco’s production output was less than half of South Africa’s production output during the same year, which reached 615 658 CBU vehicles.
However, while being continentally strong, South Africa’s vehicle production as a proportion of Africa’s total vehicle production exhibits a declining trend. This is indicated in Table 2.2.1 below, covering a period of seven years from 2010 to 2017. The table was developed using a data set supplied by NAAMSA in the form of its March 2018 presentation on the key performance indicators of automotive vehicle manufacturing in the country. As will be seen in the following chapters, the declining trend in South Africa’s proportion of Africa’s continental vehicle production is not necessarily a function of falling investment and domestic vehicle production, but rather that vehicle production in other African countries such as Morocco has increased. As the table below indicates, South Africa’s global vehicle production raking has improved by three notches from 25th in 2010 to 22nd in 2015 and maintained this position until 2017.

GLU | Economic and Social Upgrading in Auto Global Value Chains in South Africa
11
Table 2.2.1: South Afr ica’s continental vehicle production proportion, global ranking and global market
share
South Afr ica 2010 2015 2016 2017 Vehicle production as
percentage of Africa’s vehicle production
74% 64% 58.5% 55.6%
Global production ranking 25th 22nd 22nd 22nd Global market share 0.61% 0.68% 0.63% 0.61%
Data source: Data provided by NAAMSA during the research process
South Africa’s global market share improved from 0.61 per cent in 2010, to 0.68 per cent in 2015 but then fell back to its 2010 position in 2017.
The automotive industry in South Africa is the country’s largest manufacturing sector (DTI, 2015; 2016a), and is regarded as ‘the mainstay of the national industrial base’ (DTI, 2016a: 29). The industry is the leading contributor to South Africa’s manufacturing output (DTI, 2016a; AIEC, 2016). For example, it accounted for 33.5 per cent of South Africa’s total manufacturing output in 2015 (AIEC, 2016; DTI, 2016a).
According to the AIEC (2016) and the DTI (2016a), the automotive industry recorded a substantial 30.9 per cent increase in export earnings between 2014 and 2015, from R115.7 billion in Rand value terms in 2014 to 151.5 billion in 2015, making up a significant 14.6 per cent of the country’s total export earnings. The wider automotive industry’s contribution to South Africa’s gross domestic product (GDP) averaged approximately 7 per cent from 1999 to 2017. The industry’s annual contributions to the country’s GDP for the period are illustrated in Figure 2.2.1 below.
Figure 2.2.1: Automotive industry contribution to South Afr ica’s GDP

GLU | Economic and Social Upgrading in Auto Global Value Chains in South Africa
12
In the aftermath of the international economic crisis, the wider automotive industry contribution to South Africa’s GDP declined substantially from 7.3 per cent in 2008 to a new low of 5.9 per cent in 2009. The latter is just above the lowest 5.5 per cent percentage contribution recorded in 1999. It took nine years for the industry to recover to its peak of 7.5 per cent contribution to South Africa’s GDP from 2006 to 2015. A recent decline occurred thereafter, down to 6.9 per cent in 2017.
Figure 2.2.2 reflects the value of South Africa’s GDP in United States Dollars (USD) for the period 1995 to 2017. These and the above automotive industry percentage contributions to South Africa’s GDP were used to calculate the value of the industry’s contribution to the country’s national GDP for each year from 1999 to 2017.
Figure 2.2.2: Value of automotive industry contribution to South Afr ica’s GDP
The value of wider automotive industry contribution to South Africa’s GDP in USD terms increased almost fourfold, from $7.51 billion in 1999 to a peak of $28.35 billion in 2011. Thereafter there was decline, down to the value of $24.11 billion in USD value terms in 2017. However, on average the industry’s contribution to the country’s GDP reflects an increase for the period 1999 to 2017.
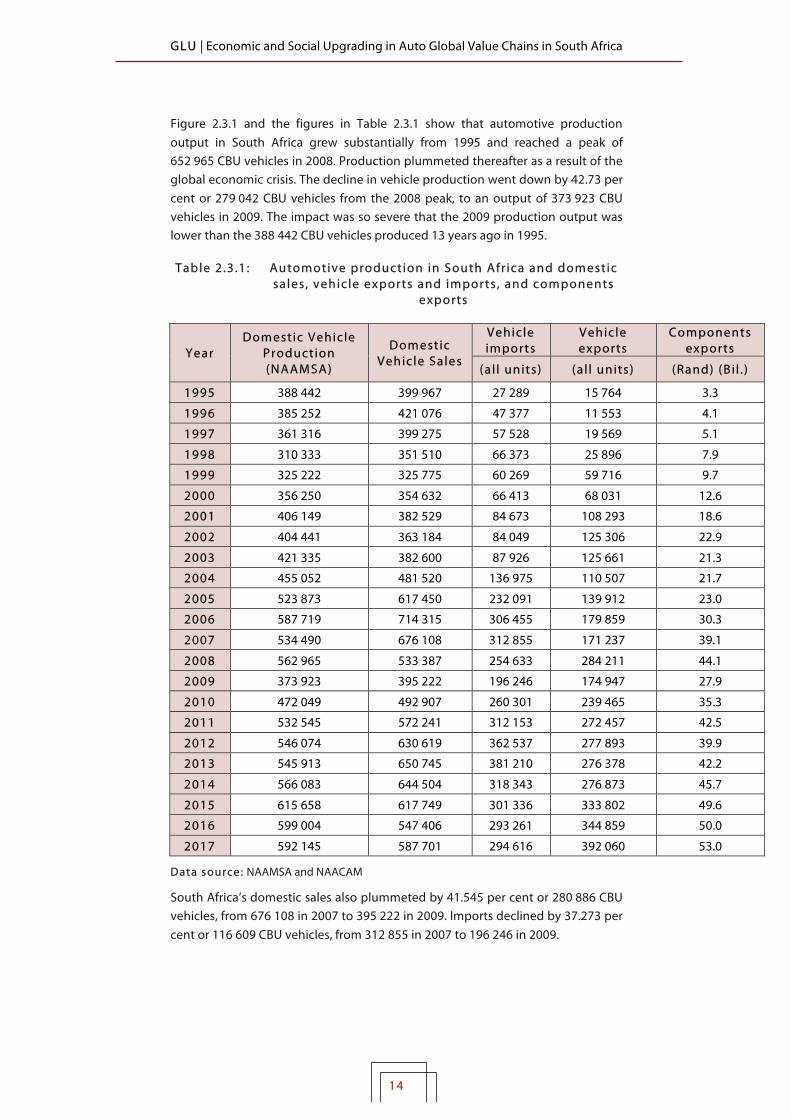
2 .3 Production output, domestic market, imports and exports
Figure 2.3.1 presents the trends for important automotive industry economic upgrading performance indicators in South Africa for a period of 22 years from 1995 to 2017. Investment and components exports are presented in Rand value terms, while domestic vehicle production output, imports and exports are
155,46!
152,586!
136,632!
115,748!
175,257!
228,937!
257,671!
271,811!
299,034!
287,1!
297,217!
375,298!
416,878!
366,829!
295,763!
349,419!
7,51!
8,18!
7,78!
7,41!
11,92!
16,03!
19,33!
20,39!
20,33!
20,96!
17,54!
23,27!
28,35!
27,74!
25,68!
25,27!
23,83!
21,89!
24,11!
0,00!50,00!100,00!150,00!200,00!250,00!300,00!350,00!400,00!450,00!
1995!
1996!
1997!
1998!
1999!
2000!
2001!
2002!
2003!
2004!
2005!
2006!
2007!
2008!
2009!
2010!
2011!
2012!
2013!
2014!
2015!
2016!
2017!
Billion
!USD
!
Year%
!GDP!(Billion!USD)!(Data!source:!World!Bank!naDonal!accounts!data)!(current)!

GLU | Economic and Social Upgrading in Auto Global Value Chains in South Africa
13
presented in volumes of CBU vehicles. The illustration was developed from data sets supplied by key industry actors (in particular, the NAAMSA and NAACAM). While most of the statistical data used is similar to the statistics recorded by OICA, some figures have been adjusted in accordance with domestic operating conditions. Some of the data used are also available in the AIEC’s annual Automotive Export Manual series.
F igure 2.3.1: Automotive production in South Afr ica and domestic sales, vehicle exports and imports , and components
exports
Data source: Data supplied by NAAMSA and NAACAM during the research process
388442!
310333!
406149!
523873!
587719!
652965!
566083!
615658!
421076!
399275!
325775!
382600!
617450!
714315!
395222!
630619!
650745!
547406!
66413!
312855!
381201!
294616!
125306! 139912!
179859!
171237!
284211!
174947!
239465!
272457!
276873!
344859!
392060!
E100000!
0!
100000!
200000!
300000!
400000!
500000!
600000!
700000!
800000!
1995!
1996!
1997!
1998!
1999!
2000!
2001!
2002!
2003!
2004!
2005!
2006!
2007!
2008!
2009!
2010!
2011!
2012!
2013!
2014!
2015!
2016!
2017!
Produc+on.%%Vehicle%exports.%%Vehicle%imports.%(Volumes)%
Year%
DomesDc!vehicle!producDon!! DomesDc!vehicle!sales!(all)! Vehicle!imports!Vehicle!exports! Linear!(DomesDc!vehicle!producDon!)! Linear!(DomesDc!vehicle!sales!(all))!Linear!(Vehicle!imports)! Linear!(Vehicle!exports)!
GLU | Economic and Social Upgrading in Auto Global Value Chains in South Africa
14
Figure 2.3.1 and the figures in Table 2.3.1 show that automotive production output in South Africa grew substantially from 1995 and reached a peak of 652 965 CBU vehicles in 2008. Production plummeted thereafter as a result of the global economic crisis. The decline in vehicle production went down by 42.73 per cent or 279 042 CBU vehicles from the 2008 peak, to an output of 373 923 CBU vehicles in 2009. The impact was so severe that the 2009 production output was lower than the 388 442 CBU vehicles produced 13 years ago in 1995.
Table 2.3.1: Automotive production in South Afr ica and domestic sales, vehicle exports and imports , and components
exports
Year Domestic Vehicle
Production (NAAMSA)
Domestic Vehicle Sales
Vehicle imports
Vehicle exports
Components exports
(al l units) (al l units) (Rand) (Bi l . )
1995 388 442 399 967 27 289 15 764 3.3
1996 385 252 421 076 47 377 11 553 4.1 1997 361 316 399 275 57 528 19 569 5.1
1998 310 333 351 510 66 373 25 896 7.9 1999 325 222 325 775 60 269 59 716 9.7
2000 356 250 354 632 66 413 68 031 12.6 2001 406 149 382 529 84 673 108 293 18.6
2002 404 441 363 184 84 049 125 306 22.9
2003 421 335 382 600 87 926 125 661 21.3 2004 455 052 481 520 136 975 110 507 21.7
2005 523 873 617 450 232 091 139 912 23.0 2006 587 719 714 315 306 455 179 859 30.3
2007 534 490 676 108 312 855 171 237 39.1
2008 562 965 533 387 254 633 284 211 44.1 2009 373 923 395 222 196 246 174 947 27.9
2010 472 049 492 907 260 301 239 465 35.3 2011 532 545 572 241 312 153 272 457 42.5
2012 546 074 630 619 362 537 277 893 39.9 2013 545 913 650 745 381 210 276 378 42.2
2014 566 083 644 504 318 343 276 873 45.7
2015 615 658 617 749 301 336 333 802 49.6 2016 599 004 547 406 293 261 344 859 50.0
2017 592 145 587 701 294 616 392 060 53.0
Data source: NAAMSA and NAACAM
South Africa’s domestic sales also plummeted by 41.545 per cent or 280 886 CBU vehicles, from 676 108 in 2007 to 395 222 in 2009. Imports declined by 37.273 per cent or 116 609 CBU vehicles, from 312 855 in 2007 to 196 246 in 2009.
GLU | Economic and Social Upgrading in Auto Global Value Chains in South Africa
15
Exports also fell, but starting in 2008, by 38.445 per cent or 109 264 CBU vehicles, from 284 211 in 2008 to 174 947 in 2009. The decline in vehicle production and related domestic and export market conditions had a severe impact on employment. As will be shown, employment in the automotive components manufacturing sector was the most affected.
In addition to the country’s 1994 democratic breakthrough, the subsequent lifting of the sanctions that were directed at the apartheid regime and adoption of the MIDP and the APDP, South Africa’s increased domestic vehicle sales can be attributed to transformation towards redressing colonially created race and gender imbalances after apartheid. The redress has been driven in the workplace through affirmative action, also known as employment equity transformation. As a result of the process, an increasing number of those who were marginalised under apartheid (mainly Black people and women), gradually gained access to employment in upper levels and professions from which they were previously excluded. This increased their purchasing power. According to successive employment equity reports released by the Commission for Employment Equity, the public sector in particular has playing a leading role in redressing the racial and gender imbalances of the past.
Firm-level economic upgrading played an important role towards the overall increased output experienced by automotive production in South Africa since 1995. This was linked to and largely driven by integration into respective GVCs as well as the increased competitiveness and development pressures associated with the new global operating environment. Leading companies in automotive industry GVCs, which are foreign controlled transnational OEMs in South Africa, attached increased importance to firm-level economic upgrading, making it a decisive condition in awarding automotive components manufacturing contracts, as well as for investment in their own domestic subsidiaries. The latter includes decisions on the allocation of new models and production volumes.
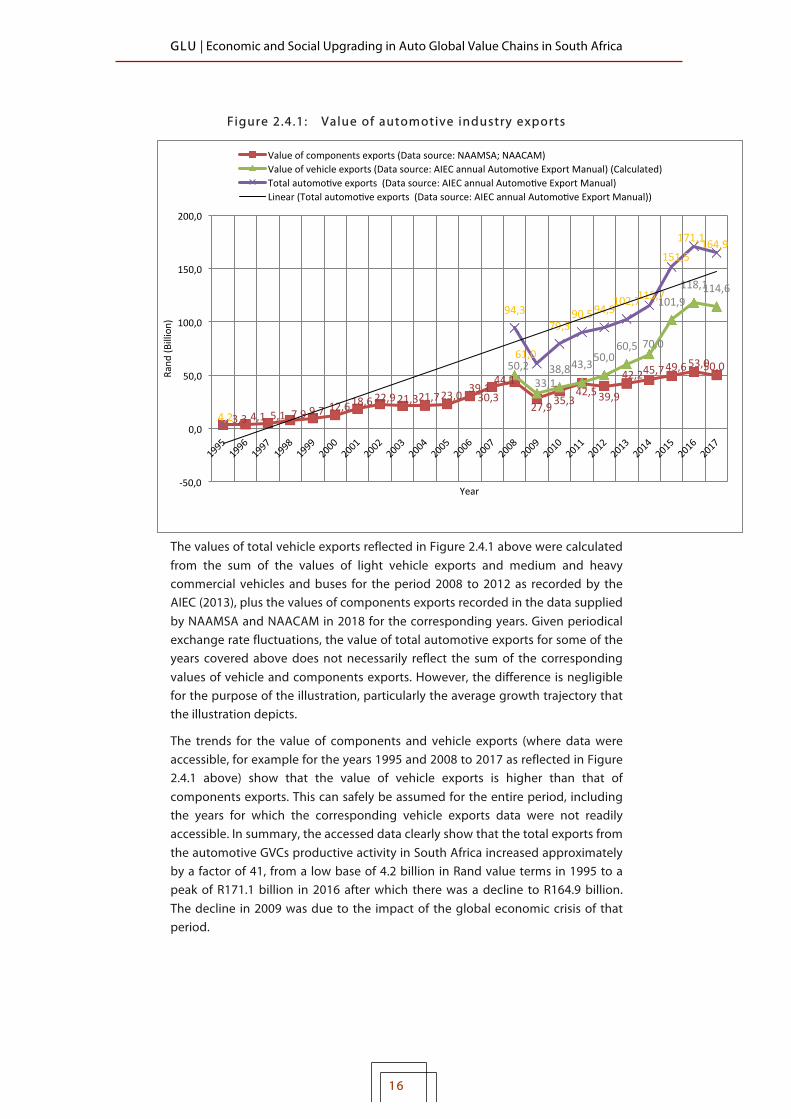
2 .4 Value of exports
Figure 2.4.1 reflects the value of automotive industry exports from South Africa. The values of components exports were accessible for the entire illustrated period from 1995 to 2017, while those of vehicle exports were accessible for the period 2008 to 2017. Data for some of the total values were not readily available and thus were calculated in the way explained below. !
GLU | Economic and Social Upgrading in Auto Global Value Chains in South Africa
16
Figure 2.4.1: Value of automotive industry exports
The values of total vehicle exports reflected in Figure 2.4.1 above were calculated from the sum of the values of light vehicle exports and medium and heavy commercial vehicles and buses for the period 2008 to 2012 as recorded by the AIEC (2013), plus the values of components exports recorded in the data supplied by NAAMSA and NAACAM in 2018 for the corresponding years. Given periodical exchange rate fluctuations, the value of total automotive exports for some of the years covered above does not necessarily reflect the sum of the corresponding values of vehicle and components exports. However, the difference is negligible for the purpose of the illustration, particularly the average growth trajectory that the illustration depicts.
The trends for the value of components and vehicle exports (where data were accessible, for example for the years 1995 and 2008 to 2017 as reflected in Figure 2.4.1 above) show that the value of vehicle exports is higher than that of components exports. This can safely be assumed for the entire period, including the years for which the corresponding vehicle exports data were not readily accessible. In summary, the accessed data clearly show that the total exports from the automotive GVCs productive activity in South Africa increased approximately by a factor of 41, from a low base of 4.2 billion in Rand value terms in 1995 to a peak of R171.1 billion in 2016 after which there was a decline to R164.9 billion. The decline in 2009 was due to the impact of the global economic crisis of that period.
3,3!4,1! 5,1! 7,9!9,7! 12,6!
18,6!22,9!21,3!21,7!23,0! 30,3!39,1!
44,1!
27,9!35,3!42,5!39,9!
42,2!45,7!49,6!53,0!50,0!50,2!
33,1!38,8!43,3!
50,0!60,5! 70,0!
101,9!118,1!114,6!
4,2!
94,3!
61,0!
79,3!90,5!94,9!
102,7!115,7!
151,5!
171,1!164,9!
E50,0!
0,0!
50,0!
100,0!
150,0!
200,0!
Rand
!(Billion)!
Year!
Value!of!components!exports!(Data!source:!NAAMSA;!NAACAM)!Value!of!vehicle!exports!(Data!source:!AIEC!annual!AutomoDve!Export!Manual)!(Calculated)!Total!automoDve!exports!!(Data!source:!AIEC!annual!AutomoDve!Export!Manual)!Linear!(Total!automoDve!exports!!(Data!source:!AIEC!annual!AutomoDve!Export!Manual))!
GLU | Economic and Social Upgrading in Auto Global Value Chains in South Africa
17
The AIEC (2018) attributes the decline in exports value in 2017 compared to 2016 to a stronger Rand exchange rate and the time effect of major new model introductions during the fourth quarter of 2017. Despite the decline, the automotive export revenue for 2017 was the second highest level on record, according to the AIEC (2018). The council valued the total revenue in the ambit of the automotive business sphere in South Africa as having amounted to 500 billion in Rand value terms in 2017, and the total automotive exports value of R164.9 billion for the same year as having equated to 13.9 per cent of total South African exports. !

GLU | Economic and Social Upgrading in Auto Global Value Chains in South Africa
18
2 .5 Investment and employment
Table 2.5.1 shows that investment by automotive OEMs increased substantially in South Africa in Rand value terms since 1995.
Table 2.5.1: OEMs investment and employment by the assembly and components manufacturing sectors
Year
Automotive manufacturing employment Investment by
automotive OEMs
Components manufacturing sector
Vehicle assembly sector
Total (Rand) (Bi l . )
1995 60 800 38 600 99 400 0.8
1996 64 100 38 600 102 700 1.2
1997 64 300 37 100 101 400 1.3
1998 64 400 33 700 98 100 1.3
1999 64 700 32 000 96 700 1.5
2000 67 600 32 300 99 900 1.6
2001 69 700 32 700 102 400 2.1
2002 72 000 32 370 104 370 2.7
2003 73 000 31 700 104 700 2.3
2004 76 900 33 000 109 900 2.2
2005 77 000 33 500 110 500 3.6
2006 78 000 37 900 115 900 6.2
2007 80 000 38 486 118 486 3.1
2008 69 000 35 900 104 900 3.3
2009 61 000 28 400 89 400 2.5
2010 65 000 28 100 93 100 4.0
2011 68 500 28 300 96 800 3.9
2012 70 000 29 180 99 180 4.7
2013 74 640 30 120 104 760 4.4
2014 82 790 27 715 110 505 6.9
2015 82 100 31 260 113 360 6.6
2016 82 000 30 953 112 953 6.4
2017 80 000 30 000 110 000 8.2 Source: Data supplied by NAAMSA and NAACAM during the research process

GLU | Economic and Social Upgrading in Auto Global Value Chains in South Africa
19
As reflected in Table 2.5.1 and Figure 2.5.1, investment by OEMs increased by 70 per cent or 1.9 billion in Rand value terms in seven years from R0.8 billion in 1995 to R2.7 billion in 2002.
Figure 2.5.1 below presents the trend for the investment, as well as for employment in both the assembly and components manufacturing sectors, and the combined automotive manufacturing employment in South Africa from 1995 to 2017.
Figure 2.5.1: OEMs investment in South Afr ica and employment by the assembly and components manufacturing sectors
Data source: Data supplied by NAAMSA and NAACAM during the research process
As reflected both in Table 2.5.1 and Figure 2.5.1, investment declined between 2003 and 2004 and then increased to a new peak of R6.2 billion in 2006. There was another decline thereafter, reaching a new low of R2.5 billion in 2009. This was during the global economic crisis which had a severe impact on production.
38600! 37100!33700! 32370! 33500!
37900!38486!35900!
28400! 28300! 30120!27715!31260! 30000!
60800!64300! 64700!
69700!76900!
80000!
61000!
68500!
82790!80000!
99400!102700!
96700!102400! 104700!
118486!
104900!
89400!
96800!
104760!
113360!110000!
0,8!1,2! 1,3!
2,1!
2,7!2,3! 2,2!
3,6!
6,2!
3,1!3,3!
2,5!
4!3,9!
4,7! 4,4!
6,6!6,4!
8,2!
0!
1!
2!
3!
4!
5!
6!
7!
8!
9!
0!
20000!
40000!
60000!
80000!
100000!
120000!
140000!
1995!
1996!
1997!
1998!
1999!
2000!
2001!
2002!
2003!
2004!
2005!
2006!
2007!
2008!
2009!
2010!
2011!
2012!
2013!
2014!
2015!
2016!
2017!
Investmen
t%by%Au
tomo+
ve%OEM
s%
Employmen
t%
Year%%
Assembly!sector!employment!Components!sector!employment!Total!assembly!and!components!sector!employment!Investment!by!AutomiDve!OEMs!(Rand)!(Bil)!Linear!(Assembly!sector!employment)!Linear!(Investment!by!AutomiDve!OEMs!(Rand)!(Bil))!Linear!(Investment!by!AutomiDve!OEMs!(Rand)!(Bil))!

GLU | Economic and Social Upgrading in Auto Global Value Chains in South Africa
20
Investment by OEMs recovered and has since been generally increasing, reaching a new high of 8.2 billion on Rand value terms in 2017. General Motors exited manufacturing in South Africa in 2017. Its production facility was acquired by Isuzu Motors. The exit contributed to the decline in employment through retrenchments.
The trends of investment by OEMs and their employment levels (see Figure 2.5.1) indicate a contradictory relationship between economic and social upgrading in the automotive assembly sector. The investment includes process upgrading through increased automation and robotisation of production. This process, which improved output per employee as shall be shown, has also been driven by restructuring through new production systems with lean production principles playing a leading role. The restructuring, particularly by OEMs, also included outsourcing – mainly after 1995.
Therefore, while certain automotive production jobs were discarded through process upgrading, others were shifted to the components manufacturing sector. The assembly sector employment trend reflects a calculated relative change, meaning an average year on year reduction of approximately 1 per cent from 1995 to 2017. This means that the sector did not create but reduced direct assembly sector jobs through process upgrading involving an increased machine-labour ratio. This was achieved with intensified automation and robotization and new, more efficient work and production coordination methods. At 1.41 per cent, the calculated relative gain in components sector employment for the corresponding period was just above the employment reduction in the assembly sector, while the total relative change reflecting an employment gain, with both sectors combined, was lower at a marginal 0.6 per cent.
The growth in components sector employment was driven by increased volumes and exports (in part indicated in Figure 2.4.1 in Rand value terms). Components sector companies were themselves restructuring their operations and continued to advance process upgrading. The overall increase that the components manufacturing sector experienced in its output, including exports as just underlined, but as well as through new and increased investments, indicate that the increases output were mostly sufficient to absorb the aggregate employment increase from 60 800 in 1995 to 80 000 in 2017.
The fall in components manufacturing sector employment between 2007 and 2009 in part underlines the importance of high production to employment sustenance and growth in the context of continuous process upgrading. As previously indicated, the global economic crisis that erupted during that period had a severe impact on production output. As a result, the sector shed jobs by 23.75 per cent, from 80 000 jobs in 2007 to a new low of 61 000 in 2009 since the lowest employment level of 60 800 in 1995. Recovery in the components manufacturing sector’s employment occurred after 2009 and reached its peak of 82 790 in 2014. However, this then fell again, by 3.4 per cent or 2 790 jobs back to 80 000 in 2017. The disinvestment by General Motors also contributed to this

GLU | Economic and Social Upgrading in Auto Global Value Chains in South Africa
21
decline in employment in the components manufacturing sector because of the supply linkages being impacted negatively by the exit.
As reflected in Table 2.5.1 and Figure 2.5.1, in aggregate terms employment in the automotive manufacturing industry in South Africa increased, from 99 400 in 1995 to 110 000 in 2017 as a result of the aggregate employment increase in the components sector – despite its ebbs and flows and the decline in the assembly sector employment. However, total automotive manufacturing industry employment has not recovered to its peak of 118 486 reached in 2007.
2 .6 Original Equipment components imports and exports and manufacturing value addit ion
Figure 2.6.1 shows that the average value of light original equipment (OE) components imports purchases by OEMs is consistently higher compared to that of their domestic OE components purchases.
F igure 2.6.1: OE components imports and domestic purchases by OEMs
The average for OE components imports purchases by light vehicle assemblers for the decade 2006 to 2016 is 38.18 billion in Rand value terms, while that of domestic OE components purchases is lower at R26.26 billion. OE components imports purchases are therefore higher on average than OE domestic components purchases by 32.22 per cent or 11.92 billion in Rand value terms for the decade.
24,6!30,7!
34!
23,4!29,1! 28,8!
34,3!
45,5!50,8!
46,9!
71,9!
17,3! 18,9! 18,1! 17,8!21,2! 23,7!
29,9! 29,5! 31,9! 29,9!
49,4!
0!
10!
20!
30!
40!
50!
60!
70!
80!
2006! 2007! 2008! 2009! 2010! 2011! 2012! 2013! 2014! 2015! 2016!
Rand
%(Billion)%
Year%%
Light!Vehicle!Assemblers!OE!components!imports!(Data!source:!DTI,!2017)!Light!Vehicle!Assemblers!OE!components!domesDc!purchases!(Data!source:!DTI,!2017)!

GLU | Economic and Social Upgrading in Auto Global Value Chains in South Africa
22
Manufacturing value addition (MVA) (defined as sales less material costs) of local models in production for the period 2013 to 2016 is reflected in Table 2.6.1.
Table 2.6.1: Manufacturing value addit ion of vehicle models in South Afr ican production
Year 2013 2014 2015 2016
MVA 36% 38% 40% 37.4%
Source: DTI (2017)
Based on the above figures, the calculated average value addition of local models in production in South Africa is 37.85 per cent. This highlights a policy concern that the APDP has not resulted in a deepening sourcing of domestically produced components and that, as a result, the ability to absorb stagnant or reducing OEM employment into the local components supply chain will continue to be constrained. Increased localisation of components manufacturing, underpinned by deepening manufacturing value addition, can make an important contribution in addressing the situation and fostering employment growth. !

GLU | Economic and Social Upgrading in Auto Global Value Chains in South Africa
23
2 .7 Output per worker
Figure 2.7.1 below shows that average output per worker in the assembly sector in volume terms doubled from 10.1 CBU vehicles in 1995 to a peak of 20.4 CBU vehicles in 2014.
F igure 2.7.1: Vehicle assembly sector output per worker
Data source: Data supplied by NAAMSA during the research process
The average increase in the assembly sector productivity was made possible by process upgrading involving the aforementioned increased investment in automation and robotics, as well as new production systems with lean production principles playing a leading role. Skills training, as discussed at a later stage, also played an important role. Figure 2.7.1 suggests that there has been an increasing intensity of work in the assembly.
The automotive assembly sector employment, as well as the trend for the average output per worker as reflected in Figure 2.7.1, shows that OEMs increased output per worker and reduced overall employment. This in part indicates that an increase in output per worker without a sufficient increase in volume to maintain existing employment levels or employ additional workers leads to workforce reduction decisions, and therefore social downgrading in the form of job losses and related social consequences.
Data supplied by B&M Analysts, expressed in Rand value terms for the period 2010 to 2017 and adjusted to Consumer Price Index (CPI) revealed a somewhat different trend contradicting the assembly sector trend through a decline both in output and value added per worker in the automotive components manufacturing sector. This is reflected in Figure 2.7.2 below. The declining trend
10,1! 10! 9,7! 9,2!10,2!
11!12,4!
12,5! 13,3!13,8!
15,6! 15,5!13,9!15,7!
13,2!
16,8!18,8! 18,7!18,1!
20,4!19,7!19,4!
19,7!
0!
5!
10!
15!
20!
25!
1995!
1996!
1997!
1998!
1999!
2000!
2001!
2002!
2003!
2004!
2005!
2006!
2007!
2008!
2009!
2010!
2011!
2012!
2013!
2014!
2015!
2016!
2017!
CBU%veh
icles%(volume)%
Year%
OEM!output!per!worker!(Volumes)!
GLU | Economic and Social Upgrading in Auto Global Value Chains in South Africa
24
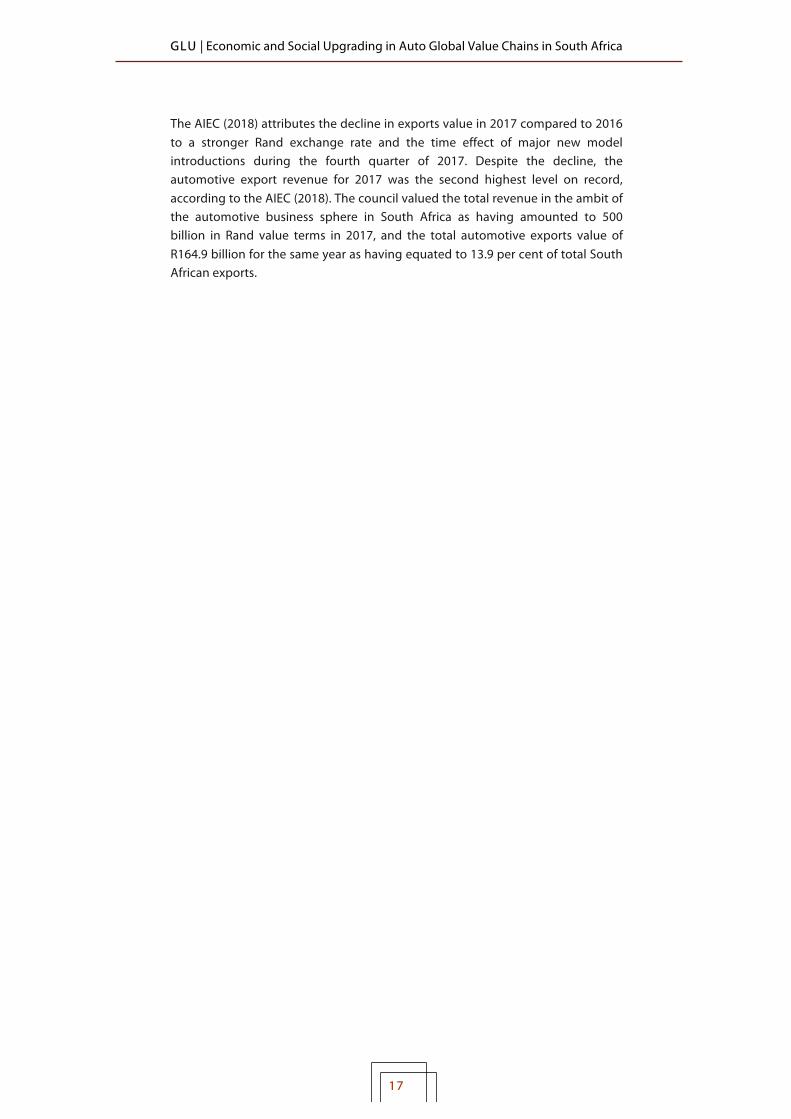
in output and value added per worker in the components manufacturing sector during the period as depicted in Figure 2.7.2 below coincided with a recovery in employment in the sector, starting in 2010 after employment fell in 2008-2009 and then recovered until 2014 when it reached a new peak of 82 790. This could be interpreted as reflecting an adjustment in the relationship between the three variables. Nevertheless, there is an important factor to take into account with regard to the data, which will be explained below.
F igure 2.7.2: Components manufacturing sector output and value added per worker
Data source: Data supplied during the research process in a dataset by B&M Analysts
The data set supplied B&M Analysts was based on a survey the organisation conducted. Unlike the data supplied by NAAMSA on output per worker in the assembly sector by CBU vehicle volumes (which covered all OEMs based on their combined total production and employment per annum), the survey conducted by B&M Analysts on components manufacturing sector output and value added per worker is based on the responses received from only 77 components manufacturing sector enterprises, rather than from all of them. The figures in the data set supplied by B&M Analysts were approximated for the purpose of developing the above illustration and the other illustrations that flowed from the use of the data, which reflect averages.
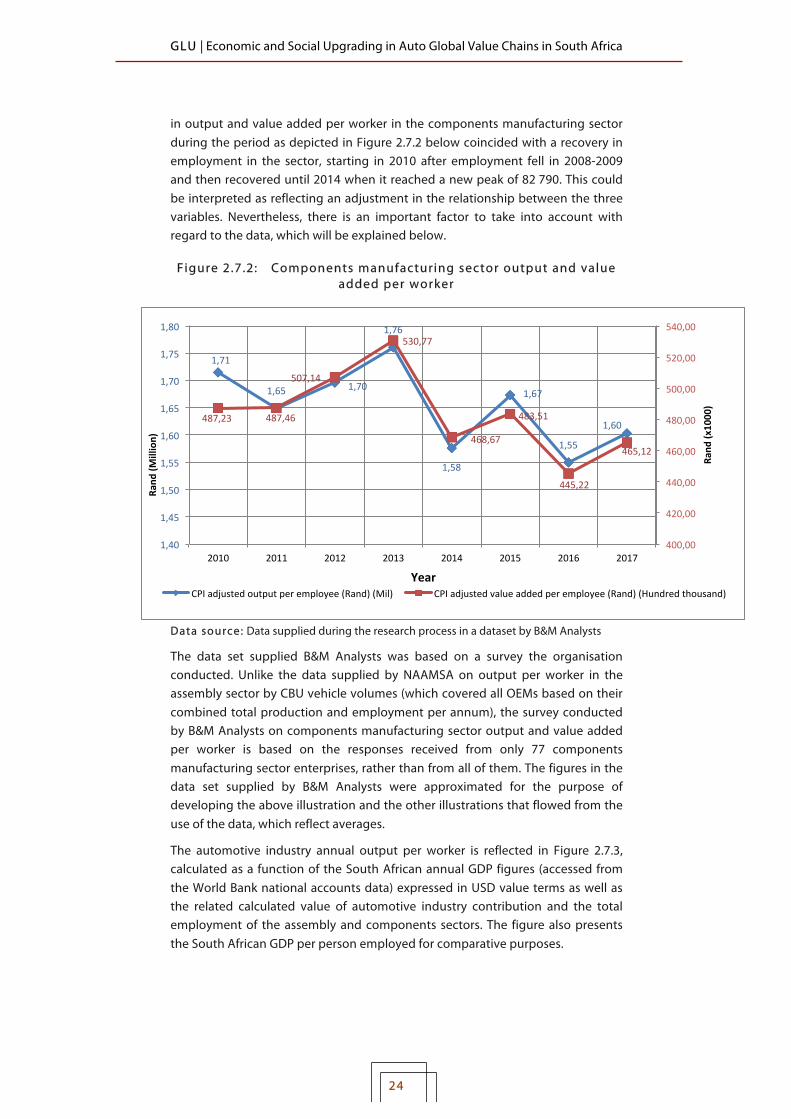
The automotive industry annual output per worker is reflected in Figure 2.7.3, calculated as a function of the South African annual GDP figures (accessed from the World Bank national accounts data) expressed in USD value terms as well as the related calculated value of automotive industry contribution and the total employment of the assembly and components sectors. The figure also presents the South African GDP per person employed for comparative purposes.
1,71!
1,65! 1,70!
1,76!
1,58!
1,67!
1,55!
1,60!487,23! 487,46!
507,14!
530,77!
468,67!
483,51!
445,22!
465,12!
400,00!
420,00!
440,00!
460,00!
480,00!
500,00!
520,00!
540,00!
1,40!
1,45!
1,50!
1,55!
1,60!
1,65!
1,70!
1,75!
1,80!
2010! 2011! 2012! 2013! 2014! 2015! 2016! 2017!
Year%%
Rand
%(x1000)%
Rand
%(Million)%
CPI!adjusted!output!per!employee!(Rand)!(Mil)! CPI!adjusted!value!added!per!employee!(Rand)!(Hundred!thousand)!
GLU | Economic and Social Upgrading in Auto Global Value Chains in South Africa
25
Figure 2.7.3: Annual GDP-based value of output per worker
The GDP World Bank figures are measured in current USD value (accessed in July 2018) while the ILO GDP per person employed data are based on constant 2011 PPP (purchasing power parity) but also in USD terms. For the purpose of maintaining data accuracy, the constant 2011 PPP USD was not rebased but used as is. However, what is clear for the purpose of the illustration is that average automotive annual output per worker in South Africa is higher than the national GDP per person employed in the country.
2 .8 Profit
The DTI conducted an OEM survey covering profit performance, skills training expenditure, OE components purchases (domestic and imports) and local content for top selling passenger cars. The survey covered the period from 2007 to 2016. Figure 2.8.1, developed with the aid of the findings made by the DTI (2017), reflects average profit performance for all seven major OEMs for the period covered.
Profit performance plummeted in the aftermath of the global economic crisis to a low level of 1.628 billion in Rand value terms in 2009. It then recovered to a new peak of R11.272 billion in 2011, followed by a decline to a new low of 8.075 in Rand value terms in 2014. A new cycle of recovery started thereafter, reaching R10.347 billion in 2016. !
77712,10!
81899,10!
76000,63!
70977,02!
113824,99!
145819,75!
174889,82!
175891,50!
171617,85!
199793,14!
196149,92!
249929,92!
292848,18!
279726,86!
245112,92!
228633,64!
210220,32!
193766,10!
219181,01!
31960,38!
34203,76!
35124,74!
35457,29!
38039,41!
38655,82!
39324,90!
40418,47!
40086,35!
40771,19!
43332,29!
44049,74!
44009,74!
43769,28!
43772,26!
42781,62!
43002,00!
42440,49!
0!
50000!
100000!
150000!
200000!
250000!
300000!
350000!
1995!
1996!
1997!
1998!
1999!
2000!
2001!
2002!
2003!
2004!
2005!
2006!
2007!
2008!
2009!
2010!
2011!
2012!
2013!
2014!
2015!
2016!
2017!
USD
%
Year%
Calculated!annual!output!per!worker!in!the!auto!industry!(USD)!
GDP!per!person!employed!(Source:!InternaDonal!Labour!OrganisaDon,!accessed!from!the!World!Bank)!(constant!2011!PPP!USD)!

GLU | Economic and Social Upgrading in Auto Global Value Chains in South Africa
26
Figure 2.8.1: OEM profit performance ( l ight vehicle assemblers)
Despite large fluctuations, on average the profit performance of the OEMs reflects an increase. The DTI survey findings further indicate that six out of the seven major OEMs in South Africa made profit in 2016 while one made a loss. The findings indicate that the turnover for 2015 was 241.1 billion in Rand value terms and increased to R247.7 billion in 2016. This translates to a turnover increase of 2.738 per cent or 6.6 billion in Rand value terms from 2015 to 2016.
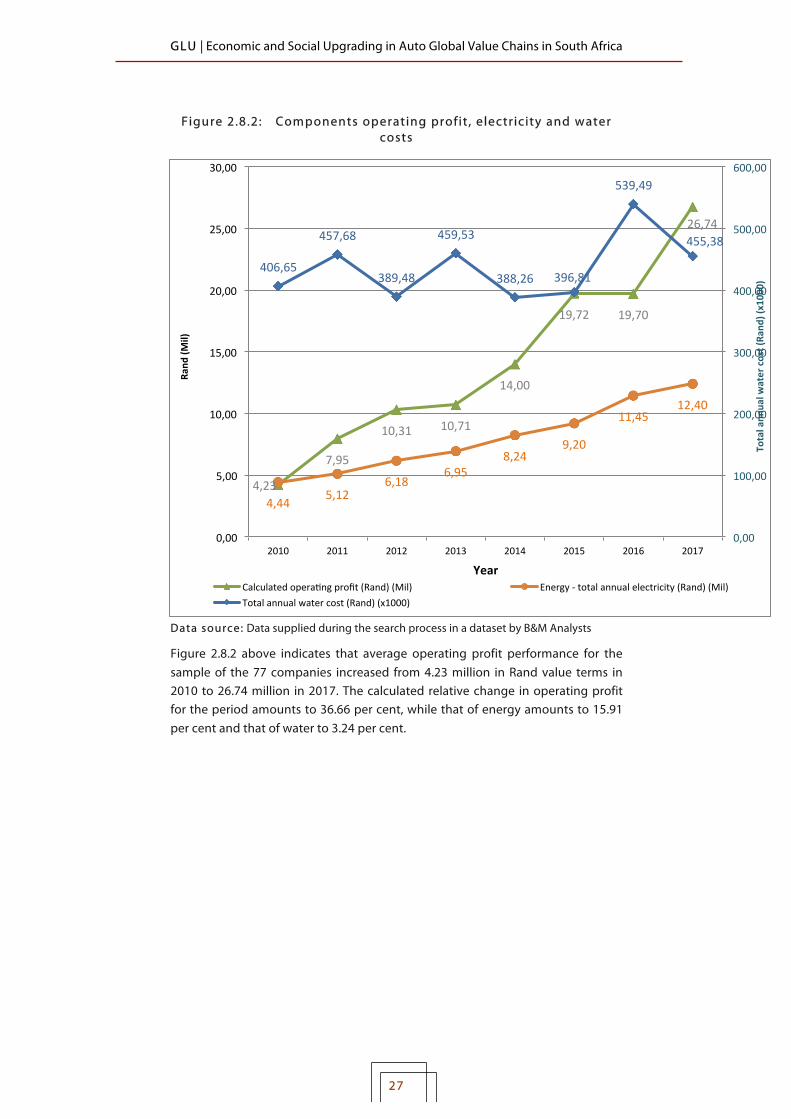
Consolidated data for energy costs (e.g. electricity and water) as well as rent for the assembly sector were not accessible. However, data for energy costs (electricity and water) were accessible in the form of the already introduced survey conducted by B&M Analysts. The averages for the sample on the two factors are reflected in Figure 2.8.2 below. The illustration also covers B&M Analysts’ calculated operating profit for the components manufacturing sector based on its final survey responses from the 77 enterprises in Rand value terms from 2010 to 2017. !
6,695! 6,537!
1,628!
8,162!
11,272!
9,245! 9,029!8,075!
8,788!
10,347!
0!
2!
4!
6!
8!
10!
12!
2007! 2008! 2009! 2010! 2011! 2012! 2013! 2014! 2015! 2016!
Rand
%(Billion)%
Year%
Profit!performance!(Rand)!(Billion):!Light!vehicle!assemblers!(Data!source:!DTI!Annual!survey!aggregate!data:!2016)!!
GLU | Economic and Social Upgrading in Auto Global Value Chains in South Africa
27
Figure 2.8.2 : Components operating profit , e lectr ic ity and water costs
Data source: Data supplied during the search process in a dataset by B&M Analysts
Figure 2.8.2 above indicates that average operating profit performance for the sample of the 77 companies increased from 4.23 million in Rand value terms in 2010 to 26.74 million in 2017. The calculated relative change in operating profit for the period amounts to 36.66 per cent, while that of energy amounts to 15.91 per cent and that of water to 3.24 per cent.
!
4,23!
7,95!
10,31! 10,71!
14,00!
19,72! 19,70!
26,74!
4,44! 5,12!6,18!
6,95!8,24!
9,20!
11,45!12,40!
406,65!
457,68!
389,48!
459,53!
388,26! 396,81!
539,49!
455,38!
0,00!
100,00!
200,00!
300,00!
400,00!
500,00!
600,00!
0,00!
5,00!
10,00!
15,00!
20,00!
25,00!
30,00!
2010! 2011! 2012! 2013! 2014! 2015! 2016! 2017!
Total%ann
ual%w
ater%cost%(Ra
nd)%(x1000)%
Rand
%(Mil)%
Year%%Calculated!operaDng!profit!(Rand)!(Mil)! Energy!E!total!annual!electricity!(Rand)!(Mil)!Total!annual!water!cost!(Rand)!(x1000)!!

GLU | Economic and Social Upgrading in Auto Global Value Chains in South Africa
28
3. THE STATE OF SOCIAL UPGRADING IN THE COMPONENTS MANUFACTURING SECTOR The assessment of the state of social upgrading presented in this section focuses on the components manufacturing sector. As the ILO (2019) states in its global working conditions study, job quality is incresaingly recognised as a major policy concern. The ILO has accordingly attached great importance to job quality and placed it as a central issue to its decent work agenda. This includes a number of aspects, namely the physical environment, work intensity, working time quality, the social environment, skills training and development, prospects and earnings. In this section focus is on these important social upgrading issues based on the decent work survey conducted by the researcher as explained under methodology.
While the findings are based on the responses received from hourly paid workers in the automotive components manufacturing sector in Gauteng Province, South Africa’s economic hub, the results are generally representative of the average conditions of the hourly paid workers employed in the sector in the country’s other automotive manufacturing clusters. This conclusion was drawn from an analysis of the findings vis-à-vis the bargaining demands that labour has historically been advancing at MIBCO to achieve social upgrading improvements for workers in the components manufacturing sector and the collective bargaining agreements reached. The analysis benefits from the researcher’s previous work experience in the industry and the labour movement, as highlighted under methodology.1
The automotive manufacturing industry employment levels are covered in the previous sections. This section will focus on other social upgrading dynamics. The starting point in this regard is made up of the demographics of the workers covered by the survey. Unless stated otherwise, the figures on all the charts that follow are presented as percentages of the responses. !
!!!!!!!!!!!!!!!!!!!!!!!!!!!!!!!!!!!!!!!!!!!!!!!!!!!!!!!!!!!!!!!!!!!!1 A detailed discussion of labour’s bargaining demands and strategy to achieve economic and social upgrading, with a focus on labour agency and specifically NUMSA, is covered in the next working paper.

GLU | Economic and Social Upgrading in Auto Global Value Chains in South Africa
29
3 .1 Survey demographics
As reflected in Figure 3.1.1, most of the 184 workers covered by the survey, 65.2 per cent were males, while females made up 34.8 per cent.
F igure 3.1.1: Sample demographics
The majority of the workers, 63.6 per cent, were aged between 30 and 49. All the workers were South African citizens, of whom 98.9 per cent were African and 1.1 per cent were Coloured. Youth under 20 years of age were a minority, almost close to ground zero at 0.5 per cent, and were even less than the number of workers aged 60 years or older, who made up 1.1 per cent of the sample.
The low number of young workers could be attributed as reflecting South Africa’s high rate of youth unemployment as a proportion of the country’s overall unemployment rate. According to ‘Employment, unemployment, skills and
100,0!0!
98,9!1,1!0,0!0,0!
65,2!34,8!
0,5!8,2!
30,4!33,2!
26,6!1,1!
57,6!15,3!16,8!
7,6!2,7!
11,4!26,1!
22,8!10,9!
2,2!18,5!
2,7!1,6!2,7!1!0,1!
0,0! 10,0! 20,0! 30,0! 40,0! 50,0! 60,0! 70,0! 80,0! 90,0!100,0!
South!African!Foreign!naDonal!!
African!Coloured!
White!Indian!!Male!
Female!Under!20!
20E29!30E39!40E49!50E59!
60!or!more!Married!!
LongEterm!relaDonship!!Never!married!
Divorced!/!Separated!Widowed!
Bond!house!RDP!house!
Shack!/!Informal!seblement!Backyarder!
Flat!Own!house!!
FourEroom!family!house!Hostel!
RenDng!a!one!to!three!bedEroom!house!Former!Bophuthatswana!house!
Living!with!parents!
NaD
onal!
Race!
Gend
er!!
Age!
Marita
l!status!
Dwelling!type
!

GLU | Economic and Social Upgrading in Auto Global Value Chains in South Africa
30
economic growth: An exploration of household survey evidence on skills development and unemployment between 1994 and 2014’ by Statistics South Africa (StatsSA) (2016), the official unemployment rate in South Africa increased from 22 per cent in 1994 to 25 per cent 20 years later in 2014, while the expanded unemployment rate, covering discouraged work seekers, remained persistent at 35 per cent in 2014 as it was in 1994.
The country’s unemployment situation has since worsened, respectively reaching the official rate of 29 per cent and the expanded rate of 38.5 per cent – affecting approximately 10.3 million unemployed work seekers in the second quarter of 2019 (StatsSA, 2019). The high unemployment rate in South Africa was identified by the ILO (2012a) as a key issue affecting employment opportunities. The ILO (2012a) provides a useful wider decent work national context both in terms of approach and findings important for the location of this paper.
Successive unemployment statistics show that the majority of South Africa’s unemployed are the youth, with women the most affected. Women are more likely to be in long-term unemployment than men, and at least two out of three unemployed women or 67.2 per cent have been unemployed for a year or longer compared to 57.3 per cent of their male counterparts (StatsSA, 2018). These could contribute to explaining the low number of young, female workers reached by the survey compared to males.
In a similar manner, a number of notable demographics in the sample mirrored the overall demographics in the sector and the industry on a national level as a whole (i.e. the private sector). In this regard, the racial dynamics also merit a further reflection.
Employment composition at higher levels was remarkably different to that at lower levels. It mirrored the findings contained in successive reports by South Africa’s Commission for Employment Equity with regard to race and also gender. The reports underline that the face of the private sector still largely reflects the social engineering designed for the colonial-apartheid era that prevailed in the country until 1994. The bottom rungs of the pyramid employment structure of workplace articulation were populated by Black workers, defined as Africans, Coloureds and Indians. Africans are the majority both of the country’s population and at the bottom rungs in industry while the top employment levels or categories were populated by Whites, mainly males. The ILO (2012a) made the same finding on equal opportunity and treatment in its decent work country profile for South Africa.
The Commission for Employment Equity Annual Report of 2016-2017 underline that, at top management level, South Africa’s workforce profile in the private sector was 72 per cent Whites, of whom 79.3 per cent were males.
With regard to seniority, as can be seen in Figure 3.1.1, the average length of service among the workers in the sample was approximately 11 years. The minimum was approximately four months and the most senior worker had been working for the same company for 41 years.
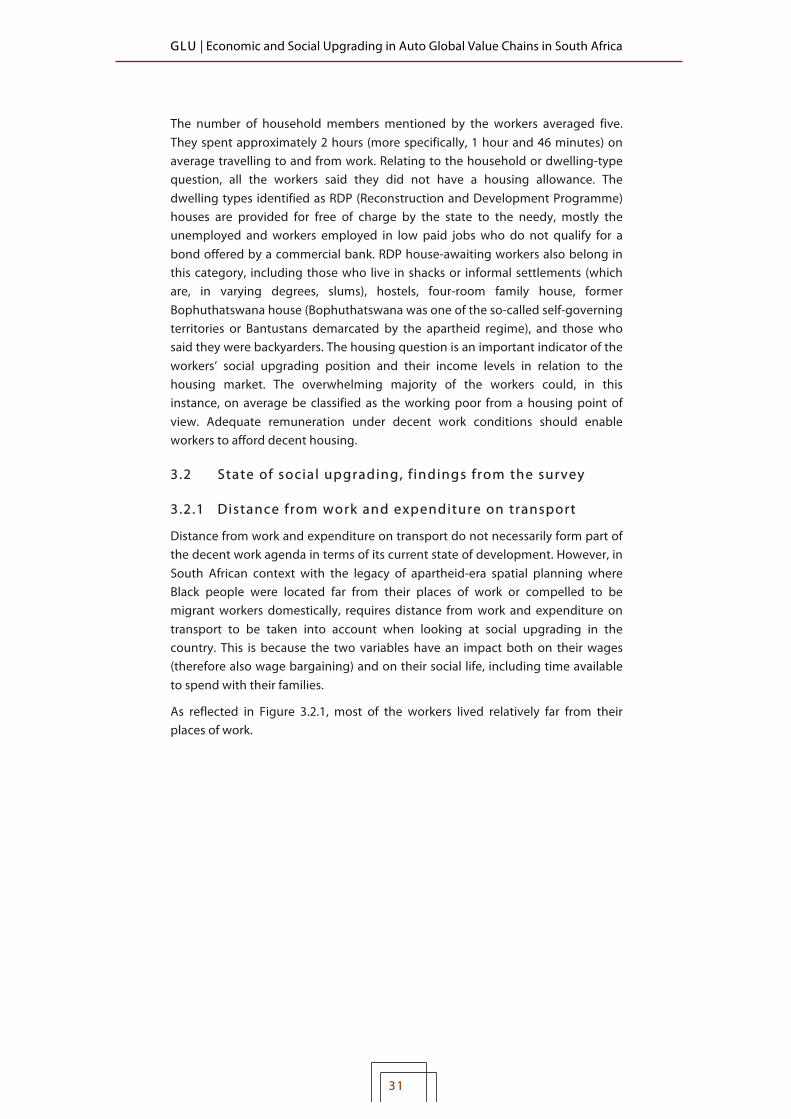
GLU | Economic and Social Upgrading in Auto Global Value Chains in South Africa
31
The number of household members mentioned by the workers averaged five. They spent approximately 2 hours (more specifically, 1 hour and 46 minutes) on average travelling to and from work. Relating to the household or dwelling-type question, all the workers said they did not have a housing allowance. The dwelling types identified as RDP (Reconstruction and Development Programme) houses are provided for free of charge by the state to the needy, mostly the unemployed and workers employed in low paid jobs who do not qualify for a bond offered by a commercial bank. RDP house-awaiting workers also belong in this category, including those who live in shacks or informal settlements (which are, in varying degrees, slums), hostels, four-room family house, former Bophuthatswana house (Bophuthatswana was one of the so-called self-governing territories or Bantustans demarcated by the apartheid regime), and those who said they were backyarders. The housing question is an important indicator of the workers’ social upgrading position and their income levels in relation to the housing market. The overwhelming majority of the workers could, in this instance, on average be classified as the working poor from a housing point of view. Adequate remuneration under decent work conditions should enable workers to afford decent housing.
3 .2 State of social upgrading, f indings from the survey
3 .2 .1 Distance from work and expenditure on transport
Distance from work and expenditure on transport do not necessarily form part of the decent work agenda in terms of its current state of development. However, in South African context with the legacy of apartheid-era spatial planning where Black people were located far from their places of work or compelled to be migrant workers domestically, requires distance from work and expenditure on transport to be taken into account when looking at social upgrading in the country. This is because the two variables have an impact both on their wages (therefore also wage bargaining) and on their social life, including time available to spend with their families.
As reflected in Figure 3.2.1, most of the workers lived relatively far from their places of work. !

GLU | Economic and Social Upgrading in Auto Global Value Chains in South Africa
32
Figure 3.2.1: Distance from home to work
The majority, 59.7 per cent of the workers said they lived a distance of 20 kilometres or more from their respective workplaces. The 59.7 per cent included 12.5 per cent who said they lived 40 to 49 kilometres from their workplaces and 10.3 per cent who said they lived more than 50 kilometres away from their workplaces. The workers furthermore faced the challenge of a lack of an efficient public transport system. Living far from work under the circumstances was costly for the workers. It meant that they spent a significant portion of their wages on transport. Only 40.2 per cent of the workers lived a distance of 19 kilometres or less from their workplaces.
Related to the above, only 6 per cent said they had a transport allowance, which is a collective bargaining issue, while a supermajority of 94 per cent said they did not have it.
Considering the entire sample, the average monthly expenditure on transport among the workers was 14.3 per cent of their average monthly take home pay. Those who lived far from work obviously spent far more than the average in accordance with their respective distances between their places of residence and their workplaces.
3 .2 .2 Average monthly take home pay, overt ime work and shift configurations
The average monthly take home pay among the surveyed workers was R5,132.74. The workers said they received their pay generally on a weekly basis, although a few received it on a monthly basis. Except for one worker, a specialist laboratory technician (of course in a higher employment level), who said his basic monthly take home pay was R23,500, the rest of the wages were close to the average. There were a few workers in higher grades. One of them was a supervisor.
4,3!
10,9!
25,0!
21,7!
15,2!
12,5!
10,3!
0,0! 5,0! 10,0! 15,0! 20,0! 25,0! 30,0!
Less!than!5!km!
5E9!km!
10E19!km!
20E29!km!
30E39!km!
40E49!km!
50!km!or!more!
GLU | Economic and Social Upgrading in Auto Global Value Chains in South Africa
33
Table 3.2.2.1 below reflects minimum wage levels in Rand value terms for the hourly personnel per grade, excluding apprenticeships and learnerships, for year 1 September 2018 to 31 August 2019.2 The concluding section returns to the wage levels with a focus on annual increases and strikes during bargaining as a vehicle in the workers’ battle to achieve social upgrading.
Table 3.2.2.1: Automotive components manufacturing minimum wages
1 September 2018 - 31 August 2019
Grade Hourly
(Rand)
Weekly
(Rand)
Monthly
(Calculated, i.e. weekly x 4)
(Rand)
1 23.44 1054.80 4219.20
2 30.46 1389.15 5556.60
3 33.38 1502.10 6008.40
4 36.46 1640.70 6562.80
5 40.67 1830.15 7320.60
6 48.81 2196.45 8785.80
8 69.54 3129.30 12517.20
Data source: MIBCO Main Agreement as gazetted by the government through the Department of Labour (Government Gazette No. 40771, April 2017). Grade 7 is excluded from the Agreement.
At individual hourly personnel level, overtime work and shift patterns introduced daily, weekly and monthly variations in the take home pay for those workers who were working overtime. Only a few workers did not work overtime compared to those who said they worked overtime. Working overtime was a source of an additional income. Related to this point, 69 per cent of the workers said they never refused to work overtime, although they could refuse, while 28.3 per cent said they did at some point refuse to work overtime and 2.7 per cent said they either did not know whether they could refuse to, or they did not work overtime hours. Overtime hours among the workers were on average 9 per week.
!!!!!!!!!!!!!!!!!!!!!!!!!!!!!!!!!!!!!!!!!!!!!!!!!!!!!!!!!!!!!!!!!!!!2 These figures are not applicable to workers who are on actual conditions of employment higher than the respective minimum conditions including wages. The dynamics associated with this point are discussed in the next sections. Unlike in the auto assembly sector, there was a difficulty in the automotive components sector to access data on the number of workers per grade. This made it difficult to work out related dynamics such as the average wages for instance. The shortcomings were recognised during this research by the MIBCO personnel the researcher interacted with. A meeting was agreed to outline all the data required for record keeping and ensure that, going forward, the information is recorded. This could possibly include a project to mine the data backwards at least up to September 1995, when the first post-apartheid motor industry development programme was adopted by the state to assist the sector with industrial upgrading.
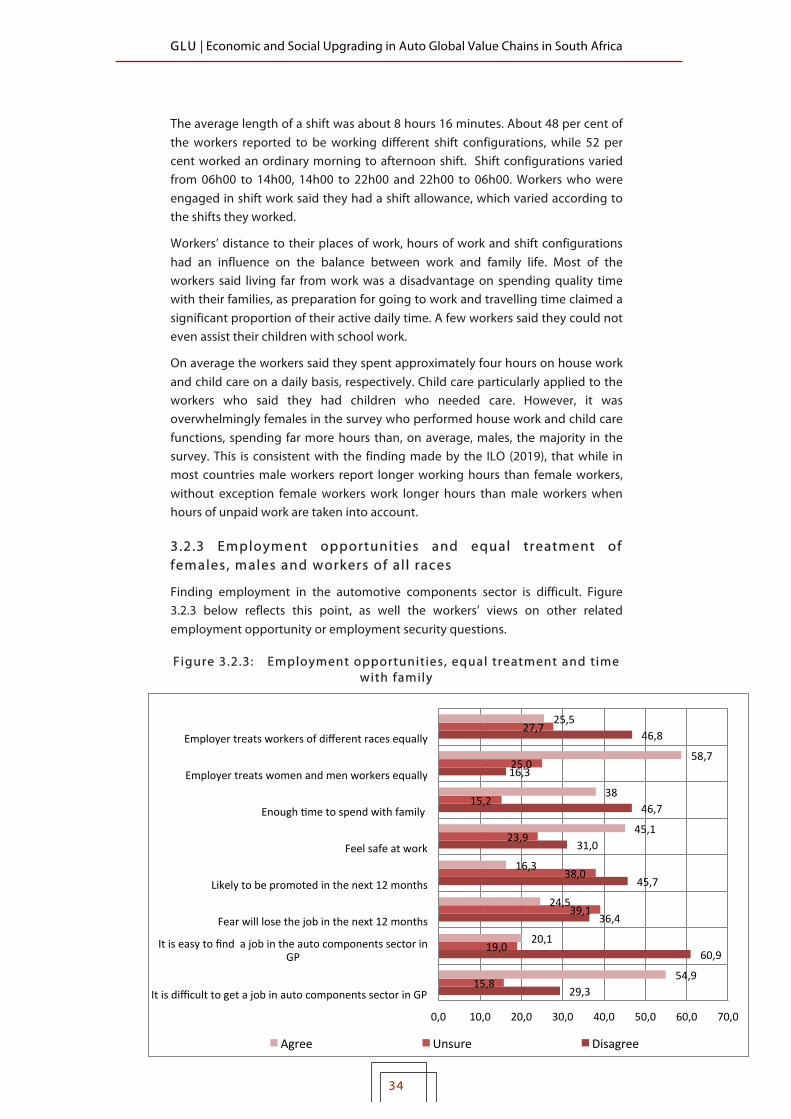
GLU | Economic and Social Upgrading in Auto Global Value Chains in South Africa
34
The average length of a shift was about 8 hours 16 minutes. About 48 per cent of the workers reported to be working different shift configurations, while 52 per cent worked an ordinary morning to afternoon shift. Shift configurations varied from 06h00 to 14h00, 14h00 to 22h00 and 22h00 to 06h00. Workers who were engaged in shift work said they had a shift allowance, which varied according to the shifts they worked.
Workers’ distance to their places of work, hours of work and shift configurations had an influence on the balance between work and family life. Most of the workers said living far from work was a disadvantage on spending quality time with their families, as preparation for going to work and travelling time claimed a significant proportion of their active daily time. A few workers said they could not even assist their children with school work.
On average the workers said they spent approximately four hours on house work and child care on a daily basis, respectively. Child care particularly applied to the workers who said they had children who needed care. However, it was overwhelmingly females in the survey who performed house work and child care functions, spending far more hours than, on average, males, the majority in the survey. This is consistent with the finding made by the ILO (2019), that while in most countries male workers report longer working hours than female workers, without exception female workers work longer hours than male workers when hours of unpaid work are taken into account.
3 .2 .3 Employment opportunit ies and equal treatment of females, males and workers of a l l races
Finding employment in the automotive components sector is difficult. Figure 3.2.3 below reflects this point, as well the workers’ views on other related employment opportunity or employment security questions.
F igure 3.2.3: Employment opportunit ies , equal treatment and t ime with family
29,3!
60,9!
36,4!
45,7!
31,0!
46,7!
16,3!
46,8!
15,8!
19,0!
39,1!
38,0!
23,9!
15,2!
25,0!
27,7!
54,9!
20,1!
24,5!
16,3!
45,1!
38!
58,7!
25,5!
0,0! 10,0! 20,0! 30,0! 40,0! 50,0! 60,0! 70,0!
It!is!difficult!to!get!a!job!in!auto!components!sector!in!GP!
It!is!easy!to!find!!a!job!in!the!auto!components!sector!in!GP!
Fear!will!lose!the!job!in!the!next!12!months!
Likely!to!be!promoted!in!the!next!12!months!
Feel!safe!at!work!
Enough!Dme!to!spend!with!family!!
Employer!treats!women!and!men!workers!equally!
Employer!treats!workers!of!different!races!equally!
Agree! Unsure! Disagree!
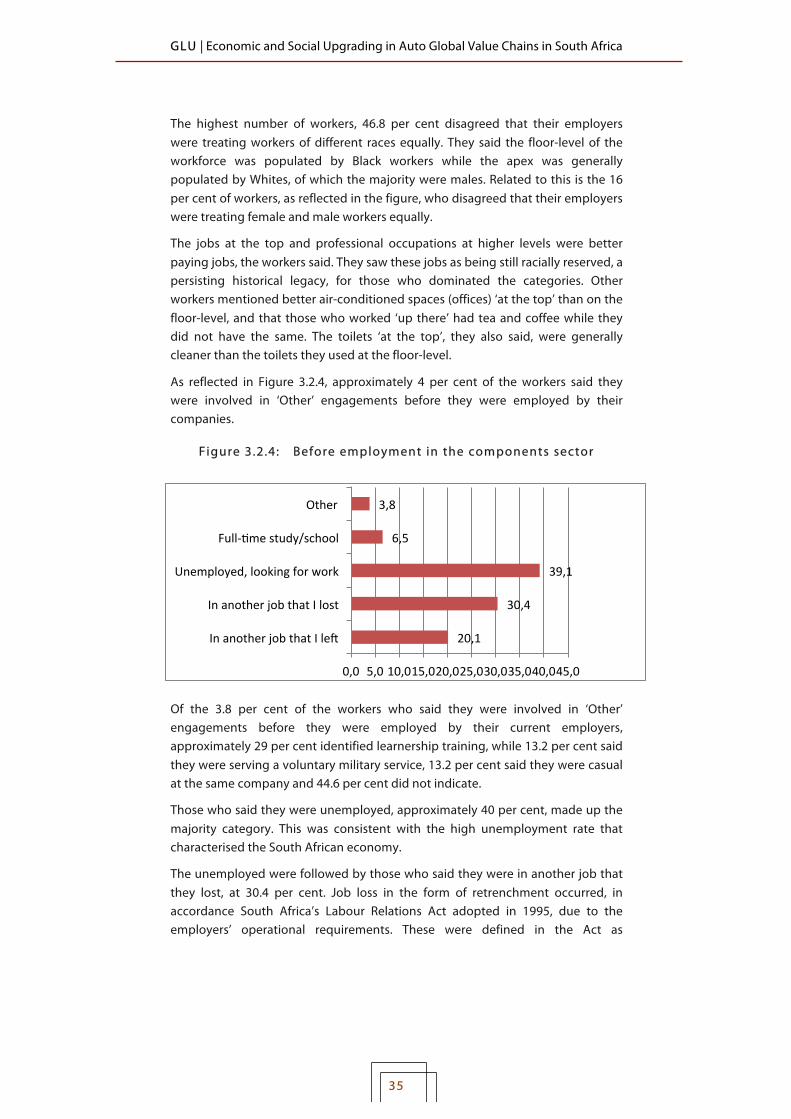
GLU | Economic and Social Upgrading in Auto Global Value Chains in South Africa
35
The highest number of workers, 46.8 per cent disagreed that their employers were treating workers of different races equally. They said the floor-level of the workforce was populated by Black workers while the apex was generally populated by Whites, of which the majority were males. Related to this is the 16 per cent of workers, as reflected in the figure, who disagreed that their employers were treating female and male workers equally.
The jobs at the top and professional occupations at higher levels were better paying jobs, the workers said. They saw these jobs as being still racially reserved, a persisting historical legacy, for those who dominated the categories. Other workers mentioned better air-conditioned spaces (offices) ‘at the top’ than on the floor-level, and that those who worked ‘up there’ had tea and coffee while they did not have the same. The toilets ‘at the top’, they also said, were generally cleaner than the toilets they used at the floor-level.
As reflected in Figure 3.2.4, approximately 4 per cent of the workers said they were involved in ‘Other’ engagements before they were employed by their companies.
F igure 3.2.4: Before employment in the components sector
Of the 3.8 per cent of the workers who said they were involved in ‘Other’ engagements before they were employed by their current employers, approximately 29 per cent identified learnership training, while 13.2 per cent said they were serving a voluntary military service, 13.2 per cent said they were casual at the same company and 44.6 per cent did not indicate.
Those who said they were unemployed, approximately 40 per cent, made up the majority category. This was consistent with the high unemployment rate that characterised the South African economy.
The unemployed were followed by those who said they were in another job that they lost, at 30.4 per cent. Job loss in the form of retrenchment occurred, in accordance South Africa’s Labour Relations Act adopted in 1995, due to the employers’ operational requirements. These were defined in the Act as
20,1!
30,4!
39,1!
6,5!
3,8!
0,0! 5,0!10,0!15,0!20,0!25,0!30,0!35,0!40,0!45,0!
In!another!job!that!I!lef!
In!another!job!that!I!lost!
Unemployed,!looking!for!work!
FullEDme!study/school!
Other!
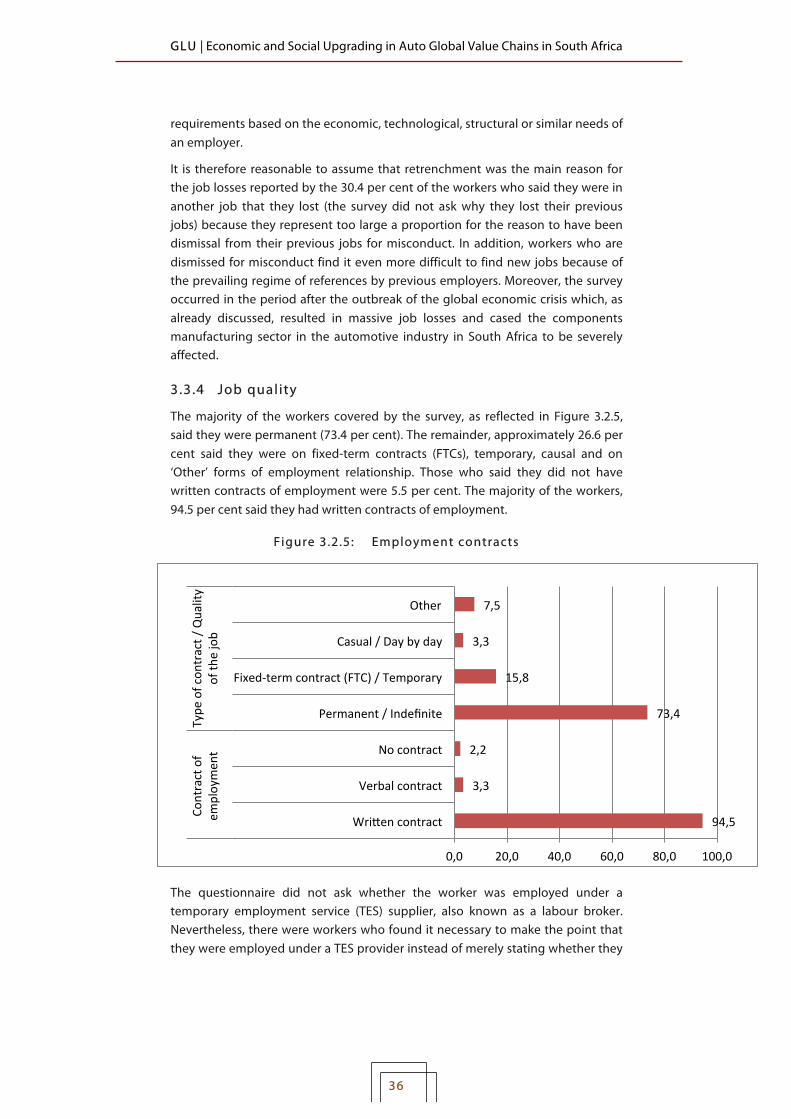
GLU | Economic and Social Upgrading in Auto Global Value Chains in South Africa
36
requirements based on the economic, technological, structural or similar needs of an employer.
It is therefore reasonable to assume that retrenchment was the main reason for the job losses reported by the 30.4 per cent of the workers who said they were in another job that they lost (the survey did not ask why they lost their previous jobs) because they represent too large a proportion for the reason to have been dismissal from their previous jobs for misconduct. In addition, workers who are dismissed for misconduct find it even more difficult to find new jobs because of the prevailing regime of references by previous employers. Moreover, the survey occurred in the period after the outbreak of the global economic crisis which, as already discussed, resulted in massive job losses and cased the components manufacturing sector in the automotive industry in South Africa to be severely affected.
3 .3 .4 Job quality
The majority of the workers covered by the survey, as reflected in Figure 3.2.5, said they were permanent (73.4 per cent). The remainder, approximately 26.6 per cent said they were on fixed-term contracts (FTCs), temporary, causal and on ‘Other’ forms of employment relationship. Those who said they did not have written contracts of employment were 5.5 per cent. The majority of the workers, 94.5 per cent said they had written contracts of employment.
F igure 3.2.5: Employment contracts
The questionnaire did not ask whether the worker was employed under a temporary employment service (TES) supplier, also known as a labour broker. Nevertheless, there were workers who found it necessary to make the point that they were employed under a TES provider instead of merely stating whether they
94,5!
3,3!
2,2!
73,4!
15,8!
3,3!
7,5!
0,0! 20,0! 40,0! 60,0! 80,0! 100,0!
Wriben!contract!
Verbal!contract!
No!contract!
Permanent!/!Indefinite!
FixedEterm!contract!(FTC)!/!Temporary!
Casual!/!Day!by!day!
Other!
Contract!of!
employmen
t!!Type
!of!con
tract!/!Quality!
of!th
e!job!
GLU | Economic and Social Upgrading in Auto Global Value Chains in South Africa
37
were employed on temporary, FTC or casual basis. They used the option ‘Other’ to make the point that they were employed under labour brokering. Others used the same option to describe their employment contracts as ‘ongoing’, implying that they were on temporary employment contracts that were renewed on an ongoing basis.
Those who said they were in ‘Ongoing’ (temporary) employment relationships made up approximately 15 per cent of those who identified their types of contracts as ‘Other’. Those who said they were employed under a labour broker made up 44 per cent of this category (‘Other’), while the rest did not specify what they meant by ‘Other’ types of employment contract.
However, those who found it necessary to state that they were employed under a TES provider were probably not the only ones who were employed under labour brokering. Among those who defined themselves as employed on FTC, casual or ongoing temporary employment relationships, there may well have been others who were employed under labour brokers who simply did not state the fact.
The above assumption is supported by follow up employment statistics obtained by the MIBCO in 2017, indicating the number of workers who were employed under labour brokers. In addition, the components and motor retail and related services sectors had a significant number of workers who were employed under labour brokers before 2010. To that extent, in 2010 the labour movement in the sector, with NUMSA leading the charge, had to push for a reduction through industry-level collective bargaining of the use of labour brokers. The MIBCO main agreement reached after the negotiations that year concluded:
‘Notwithstanding anything else in this clause, for all employers operating in the rest of the industry no employer will have more than 35% of their core work force consisting of temporary employment services by the end of August 2013’ (MIBCO main agreement 2010: 56).
As a result of the agreement, the many employers who used labour brokers in the sector reduced their use to 35 per cent of their workforce. However, other employers who were under 35 per cent of labour brokering use could still increase it to 35 per cent as per the agreement. More specifically, the clause as quoted above did not prevent that situation – unlike in the vehicle assembly sector.
In 2010 the automotive National Bargaining Forum (NBF), under which collective bargaining for the hourly workforce in the vehicle assembly sector is conducted, reached an agreement completely prohibiting the use of labour brokers to employ workers who fall in the NBF as a bargaining unit. This charge, again, was led by NUMSA, the majority union in the sector. It is important to indicate that both the NBF and MIBCO facilitate collective bargaining for hourly personnel and exclude the salaried.

GLU | Economic and Social Upgrading in Auto Global Value Chains in South Africa
38
Table 3.2.1 reflects the component sector’s hourly employment numbers as obtained from MIBCO, including the number of workers who were employed under labour brokers (where the data were available to MIBCO). The data exclude the tyre manufacturing sector as well as the overall components sector salaried personnel. The tyre manufacturing sector falls in a separate bargaining council.
The Northern Region and Highveld Region are chiefly Gauteng Provincial areas. The City of Tshwane is the epicentre of the Northern Region while the cities of Johannesburg and Ekurhuleni are the epicentres of the Highveld Region, covering surrounding municipalities in the west, east and south of the province.
The table shows that a total of 7 849 hourly workers were employed under labour brokers during the follow up research inquiry with MIBCO in 2017.
Table 3.2.1: South Afr ican component hourly workforce
Data source: MIBCO | * Calculated using the data obtained from MIBCO
Vehicle body (as a component) building
Region Employer
s Directly
employed Labour
Brokered Total
Eastern Cape 16 339 - 339
Northern region (Gauteng) 29 1 246 119 1 365
Highveld region (Gauteng) 91 3 402 632 4 034
KwaZulu-Natal region 24 917 86 1 003
Free State and Northern Cape 9 2 072 - 2 072
Western Cape 23 1 301 3 1 304
Total vehicle body building 192 9 277 840 10 117
Components manufacturing (excluding tyre manufacturing)
Eastern Cape 121 11 103 2 776 13 879
Northern region (Gauteng) 77 5 563 3 175 8 738
Highveld region (Gauteng) 86 3 515 473 3 988
KwaZulu-Natal region 57 8 105 330 8 435
Free State and Northern Cape 1 -
-
Western Cape 21 1 801 255 2 056
Total other vehicle components
363 30 087 7 009 37 096
Grand totals : Vehicle body building and components manufacturing
7 849* 47 413*

GLU | Economic and Social Upgrading in Auto Global Value Chains in South Africa
39
3 .2 .5 Grades and grading model
The grade in which a worker falls is very important as it determines their wage rate or level. This makes grading necessary when looking at decent work.
The average time workers spent in the same grade was about eight years and five months, with the minimum being three months and three weeks and the maximum being 34 years in the same grade. Grade 1 is the lowest grade and Grade 8 the highest grade in the hourly grades model, as reflected in Figure 3.2.6.
F igure 3.2.6: Grades populations
Grade 5 (closely followed by Grade 3) hosted the highest proportion of workers, at 23.4 per cent. Meanwhile, 48.4 per cent of workers were spread between different grades below Grade 5, including Grade 3. In total, the workers in Grade 5 and below made up an overwhelming majority of 71.8 per cent. Grade 6, 7 and 8 hosted a minority of the workers at 6.5 per cent, meaning that populations became lower the higher the grade, with Grade 8 hosting only 0.5 per cent, Grade 7 hosting 3.8 per cent and Grade 6 hosting 2.2 per cent of the workers.
In which grade a worker fell in the automotive components manufacturing sector was decided largely by the specific job criteria. This could be the reason why a significant proportion, 41 per cent of the 21.7 per cent of the workers who identified their grades as ‘Other,’ defined themselves not according to grades but according to the jobs that they were performing. This is reflected in Table 3.2.2. !
6,5!6,5!
22,8!12,6!
23,4!2,2!
3,8!0,5!
21,7!
0! 5! 10! 15! 20! 25!
Grade!1!Grade!2!Grade!3!Grade!4!Grade!5!Grade!6!Grade!7!Grade!8!Other!
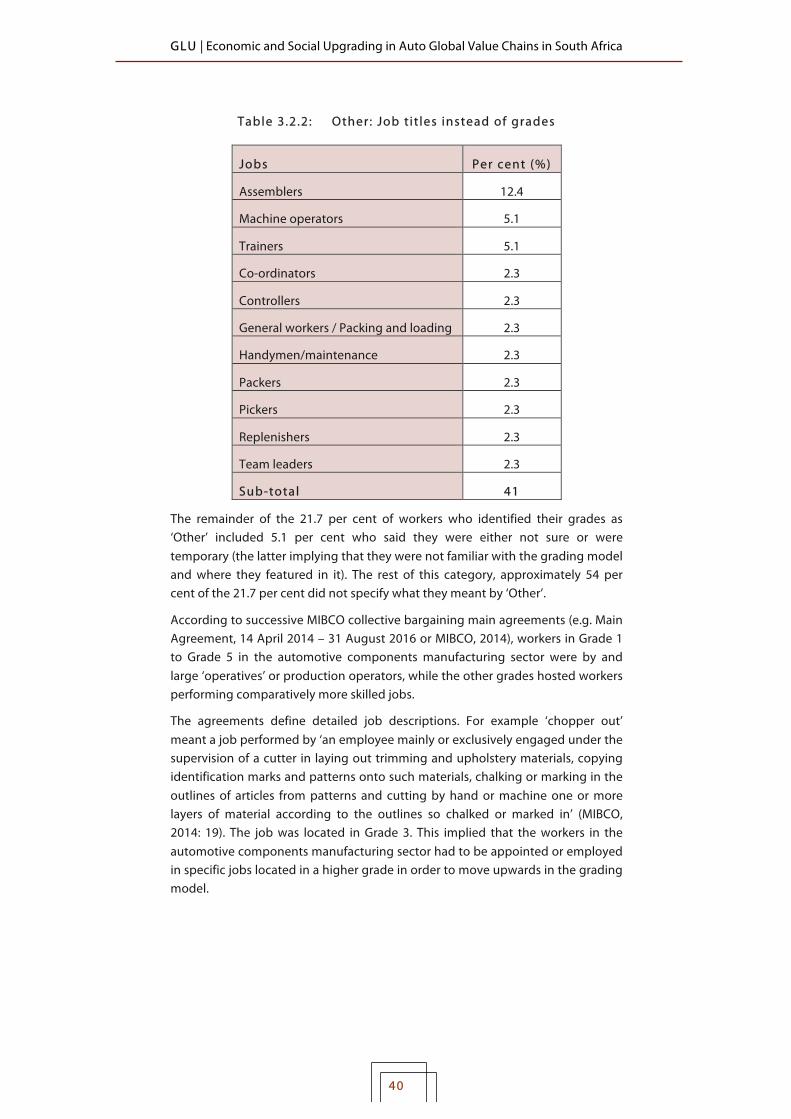
GLU | Economic and Social Upgrading in Auto Global Value Chains in South Africa
40
Table 3.2.2: Other: Job t it les instead of grades
Jobs Per cent (%)
Assemblers 12.4
Machine operators 5.1
Trainers 5.1
Co-ordinators 2.3
Controllers 2.3
General workers / Packing and loading 2.3
Handymen/maintenance 2.3
Packers 2.3
Pickers 2.3
Replenishers 2.3
Team leaders 2.3
Sub-total 41
The remainder of the 21.7 per cent of workers who identified their grades as ‘Other’ included 5.1 per cent who said they were either not sure or were temporary (the latter implying that they were not familiar with the grading model and where they featured in it). The rest of this category, approximately 54 per cent of the 21.7 per cent did not specify what they meant by ‘Other’.
According to successive MIBCO collective bargaining main agreements (e.g. Main Agreement, 14 April 2014 – 31 August 2016 or MIBCO, 2014), workers in Grade 1 to Grade 5 in the automotive components manufacturing sector were by and large ‘operatives’ or production operators, while the other grades hosted workers performing comparatively more skilled jobs.
The agreements define detailed job descriptions. For example ‘chopper out’ meant a job performed by ‘an employee mainly or exclusively engaged under the supervision of a cutter in laying out trimming and upholstery materials, copying identification marks and patterns onto such materials, chalking or marking in the outlines of articles from patterns and cutting by hand or machine one or more layers of material according to the outlines so chalked or marked in’ (MIBCO, 2014: 19). The job was located in Grade 3. This implied that the workers in the automotive components manufacturing sector had to be appointed or employed in specific jobs located in a higher grade in order to move upwards in the grading model. !
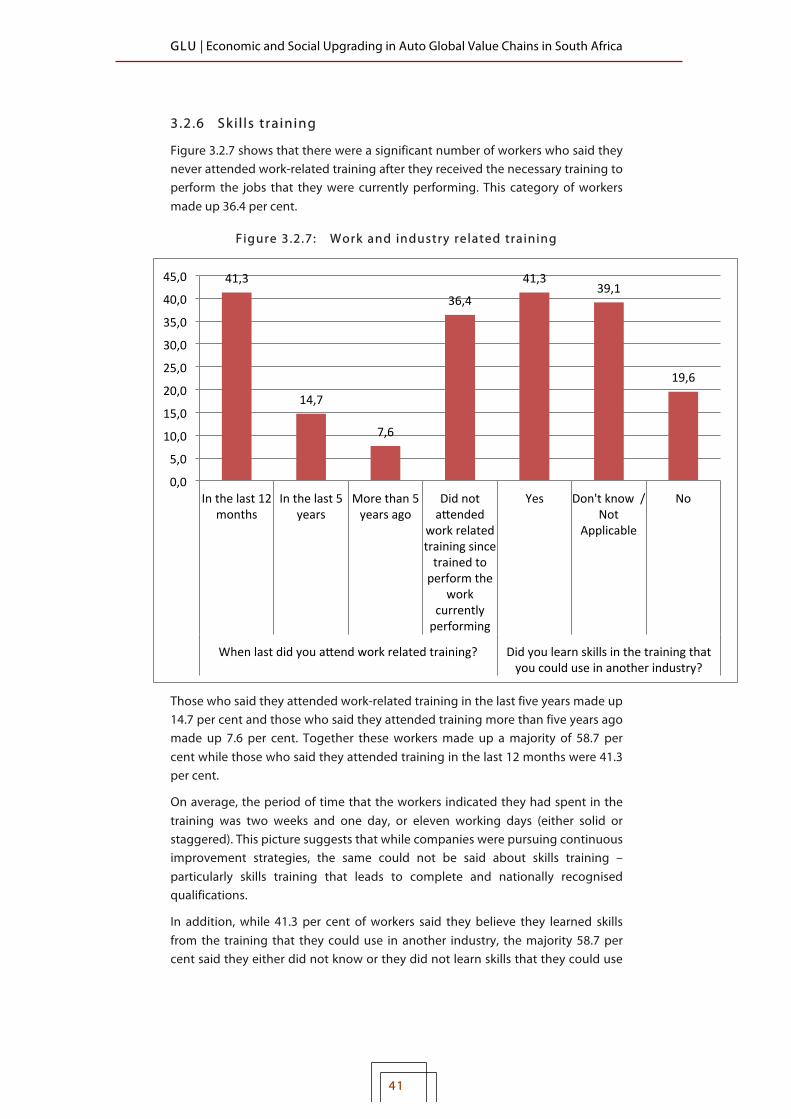
GLU | Economic and Social Upgrading in Auto Global Value Chains in South Africa
41
3 .2 .6 Ski l ls training
Figure 3.2.7 shows that there were a significant number of workers who said they never attended work-related training after they received the necessary training to perform the jobs that they were currently performing. This category of workers made up 36.4 per cent.
F igure 3.2.7: Work and industry related training
Those who said they attended work-related training in the last five years made up 14.7 per cent and those who said they attended training more than five years ago made up 7.6 per cent. Together these workers made up a majority of 58.7 per cent while those who said they attended training in the last 12 months were 41.3 per cent.
On average, the period of time that the workers indicated they had spent in the training was two weeks and one day, or eleven working days (either solid or staggered). This picture suggests that while companies were pursuing continuous improvement strategies, the same could not be said about skills training – particularly skills training that leads to complete and nationally recognised qualifications.
In addition, while 41.3 per cent of workers said they believe they learned skills from the training that they could use in another industry, the majority 58.7 per cent said they either did not know or they did not learn skills that they could use
41,3!
14,7!
7,6!
36,4!
41,3!39,1!
19,6!
0,0!
5,0!
10,0!
15,0!
20,0!
25,0!
30,0!
35,0!
40,0!
45,0!
In!the!last!12!months!
In!the!last!5!years!
More!than!5!years!ago!
Did!not!abended!
work!related!training!since!trained!to!perform!the!
work!currently!performing!
Yes! Don't!know!!/!Not!
Applicable!
No!
When!last!did!you!abend!work!related!training?! Did!you!learn!skills!in!the!training!that!you!could!use!in!another!industry?!

GLU | Economic and Social Upgrading in Auto Global Value Chains in South Africa
42
in another industry. It follows then that the 19.6 per cent who said they did not learn skills they could use in another industry implied that the training did not equip them with portable skills.
Related to the above, the survey covered the important issue of schooling and post-school education profile of the workers. The outcome is captured in Figure 3.2.8.
F igure 3.2.8: Education Levels
The majority of the workers, 53.8 per cent, said they completed secondary schooling, while only a few, 4.9 per cent, said they either completed or did not complete primary education. Those who said they completed it were 3.3 per cent, while those who said they did not complete it were 1.1 per cent, and 0.5 per cent said they had no formal education at all. Considering that these were a numerically insignificant minority, the sector’s workforce could therefore be considered as generally trainable towards South African Qualifications Authority (SAQA) recognised vertically articulated qualifications.
For example, about 54 per cent said they completed secondary school and 22.3 per cent said they had Technical and Vocation Education and Training (TVET) and some university-level certificates. However, the levels of training towards a SAQA recognised qualification on automotive components manufacturing and assembly were very low. This is reflected in Table 3.2.3. The qualification is vertically articulated from low to high National Qualifications Framework (NQF) bands. The higher the band, the lower the number of workers with the qualification and vice versa.. !
0,5!
1,1!
3,3!
19!
53,8!
22,3!
0! 10! 20! 30! 40! 50! 60!
No!formal!educaDon!
Did!not!complete!primary!school!
Completed!primary!school!
Did!not!complete!secondary!school!
Completed!secondary!school!
Mainly!Technical!and!VocaDonal!college!cerDficates,!and!some!universityElevel!

GLU | Economic and Social Upgrading in Auto Global Value Chains in South Africa
43
Table 3.2.3: SAQA: National Certif icate: Automotive Components: Manufacturing and Assembly: 2011-2015 Completions
Data Source: Data supplied by MERSETA during the research process
The situation for the hourly personnel in the assembly sector was different to the components manufacturing sector for the corresponding period. This is reflected in the assembly sector’s grading system which, unlike that of the components manufacturing sector, is articulated not only according to the skills applied in a given job but also according to the education and skills acquired. The lower the education and skills acquired the lower the grade, based on a multi-skilling model that allows workers to move horizontally between job functions in their respective plants. This means that assembly sector workers are not confined to one job function but can switch between job functions. Figure 3.2.9 reflects the population of the assembly sector hourly workforce by the number of workers in each Skills Level.
Learnership!Title! NQF! Year! Total!Completed!
Total!auto!comp!sector!workforce*!
National!Certificate:!Automotive!Components:!Manufacturing!And!Assembly!
NQF!Level!2!2! 2011! 164! 68!500!
National!Certificate:!Automotive!Components:!Manufacturing!And!Assembly!
NQF!Level!2!2! 2012! 79! 70!000!
National!Certificate:!Automotive!Components:!Manufacturing!And!Assembly!
NQF!Level!3!3! 2012! 76! 70!000!
National!Certificate:!Automotive!Components:!Manufacturing!And!Assembly!
NQF!Level!2!2! 2013! 328! 74!640!
National!Certificate:!Automotive!Components:!Manufacturing!And!Assembly!
NQF!Level!3!3! 2013! 116! 74!640!
National!Certificate:!Automotive!Components:!Manufacturing!And!Assembly!
NQF!Level!2!2! 2014! 146! 82!790!
National!Certificate:!Automotive!Components:!Manufacturing!And!Assembly!
NQF!Level!3!3! 2014! 27! 82!790!
National!Certificate:!Automotive!Components:!Manufacturing!And!Assembly!
NQF!Level!2!2! 2015! 286! 82!100!
National!Certificate:!Automotive!Components:!Manufacturing!And!Assembly!
NQF!Level!3!3! 2015! 29! 82100!

GLU | Economic and Social Upgrading in Auto Global Value Chains in South Africa
44
Figure 3.2.9: Automotive assembly sector hourly ski l ls grading model
Data source: National Bargaining Forum/AMEO
Skills Level 1 is an entry level in which an employee spends a few weeks after employment in the sector. Progression from Skills Level 1 to Skills Level 4 is automatic upon an employee acquiring the required number of skills credits, vertically articulating the Automobile Manufacturing Industry Certificate (AMIC). This holds for the entire assembly sector. Skills Level 4 is host to the majority of workers compared to any skills level. This means that the workers in Skills Level 4 progressed vertically through AMIC credits from Skills Level 1 to Skills Level 4 (the highest skills level in which recruitment is not vacancy driven). Recruitment in Skills Level 5 and 6, as well as for the Artisans and Technicians categories, is vacancy driven. What the above figures indicate is that the majority of the production workforce in the assembly sector has reached the highest level of multi-skilling expected of them. Training expenditure by OEMs is reflected in Figure 3.2.10 for the period 2010 to 2016.
!
16!
4047!
1519!
8348!
173! 11!
1779!937!
285!
0!
1000!
2000!
3000!
4000!
5000!
6000!
7000!
8000!
9000!Num
ber%o
f%workers%
Skills%Levels/Categories%

GLU | Economic and Social Upgrading in Auto Global Value Chains in South Africa
45
Figure 3.2.10: Training expenditure by l ight vehicle assemblers
Training is also funded by MERSETA through grants. The above shows that the OEMs have made use of the opportunity to a large extent. This process of skill-upgrading is the context in which, as previously shown, the assembly sector’s output per worker has increased tremendously between 1995 and 2017. However, this was also closely tied to process upgrading which included increased automation, robotics and new and more efficient methods of work and production co-ordination.
The automotive components manufacturing sector therefore displayed spacious room for improvement compared to the assembly sector, which is clearly more advanced in the area of skills training.
3 .2 .7 Wage increases and dismissal procedures
The majority of the workers, 90.8 per cent as showed in Figure 3.2.11 said that they received wage increases in the last 12 months, while 2.2 per cent said they did not receive wage increases in the last 12 months because their employment was less than 12 months. Those who did not specify a reason comprised 7.1 per cent of the workers who said they did not receive wage increases in the last 12 months. It could not be concluded whether their respective employers did not comply with MIBCO’s main collective bargaining agreement which provides for wage increases on an annual basis. Employer compliance with collective agreements in the sector was generally reasonable. The basis for employers not complying arbitrarily was very limited. In addition, the agreements were made statutory in that they were extended by the Minister of Labour to apply to non-parties with equal force.
154,5!125,88!
91,4! 111,7!84,3!
142,8! 123,4!176,8!
226,6!
356,8!
431,2!
0!50!100!150!200!250!300!350!400!450!500!
2006! 2007! 2008! 2009! 2010! 2011! 2012! 2013! 2014! 2015! 2016!
Rand
%(Million)%
Year%
Training!expenditure!by!OEMs!(Data!source:!DTI,!2017)!
Linear!(Training!expenditure!by!OEMs!(Data!source:!DTI,!2017))!

GLU | Economic and Social Upgrading in Auto Global Value Chains in South Africa
46
Figure 3.2.11: Wage increases and dismissal procedures
Furthermore, the high trade union density, which is discussed in the next sub-section, also acts as a mechanism to enforce compliance. Moreover, where a company was not able to implement compliance on wage increases due to its financial situation, the employer was often required to follow exemption procedures stipulated in the agreements and the workers would duly be consulted (or at least informed). In other words, workers would know why they have not received their wage increases, if the exemption was granted.
The way in which temporary contracts were administered was another probable factor. Workers on temporary contracts did not consider new wage levels as wage increases if their contracts were terminated before the wage increases, and then reinstated at a later stage.
Generally employers complied with dismissal procedures. As reflected in Figure 3.2.11 above, 88.6 per cent of the workers said their employers complied with dismissal procedures. Of those workers, 60.3 per cent referred to ‘Verbal and written warnings and disciplinary hearings’ and 28.3 per cent referred to employer ‘Consultation with the union’. This level of compliance was consistent with the high level of compliance with the MIBCO agreements and labour legislation.
90,8!
7,1! 2,2!
60,3!
28,3!
6,5! 4,3! 0,5!0,0!10,0!20,0!30,0!40,0!50,0!60,0!70,0!80,0!90,0!100,0!
Yes!
No:!Reasons!not!sp
ecified
!
Not!app
licable:!W
orked!less!th
an!
12!m
onths!
Verbal!/!wrib
en!warning!&!
hearing!
ConsultaDo
n!with
!union
!
No!set!p
rocedu
re!
Didn
’t!know
!
Employer!not!con
sistent:!D
oesn't!
always!follow!procudu
res!
Wage!increases:!Recieved!a!wage!increase!in!the!last!12!months!
Dismissal!procedure!followed!by!the!employer!

GLU | Economic and Social Upgrading in Auto Global Value Chains in South Africa
47
The questionnaire did not distinguish between dismissals for misconduct, performance, ill-health and operational requirements or retrenchment as also known. Those who said they did not know whether their employers followed procedures could be categorised as not being familiar with dismissal regulations or procedures and therefore not necessarily saying the employers did not comply. In that case, the level of compliance with dismissal procedures would be higher than 88.6 per cent considering the 4.3 per cent of those who said they ‘Don’t know’ (as indicated in Figure 3.2.11).
The two categories, one making up 60.3 per cent (‘Verbal and written warnings and hearings’) and the other making up 28.3 per cent (‘Consultation with the union’), were interesting in that they could be seen as having brought a distinction with regards to the nature of the dismissals. ‘Verbal and written warnings and hearings’ are generally applicable to dismissals for misconduct, while ‘Consultation with the union’ is generally applicable to dismissals for operational requirements or shop steward dismissals – in some in stances depending also on applicable trade union recognition agreements.
The 0.5 per cent (also reflected in Figure 3.2.11) of the workers who said their employer was inconsistent in other words suggested that sometimes the employers complied with dismissal procedures and sometimes did not comply. This still included compliance (during consistency), while the lack of compliance (during inconsistency) required a detailed review of the cases specifically referred to, each according to its merits. However, the study was not designed to go to that extent.
In the ultimate analysis it was only 6.5 per cent of workers who categorically said there were no set procedures for dismissal. This implied either that the workers were not familiar with the procedures set out under labour law and MIBCO collective bargaining agreements, or that the employer did not have a code of conduct that they were aware of.
3 .2 .8 Social dialogue, trade union and other organisations
Social dialogue, particularly in relation to collective bargaining in the automotive components manufacturing sector, is taking place under MIBCO’s auspices. MIBCO’s collective agreements are, as already indicated, extended to non-parties by the Minister of Labour. The agreements are therefore binding on all employers who fall in the sector regardless of whether they do not belong to an employers’ organisation affiliated to MIBCO, and therefore cover all hourly workers regardless of whether or not they belong to a trade union.
Figure 3.2.12 below reflects trade union density among the workers who were covered by the survey conducted. The figure shows that 81 per cent of the workers were unionised, and only 19 per cent did not belong to a union.

GLU | Economic and Social Upgrading in Auto Global Value Chains in South Africa
48
Figure 3.2.12: Social dialogue and trade union organisation
More interesting is that unionisation was also strong among the workers who said they were employed under labour brokers. This suggests that they saw trade union organisation as a vehicle to address their employment situation – which for workers employed under labour brokers is characterised by the minimum of permissible conditions.
The level of unionisation of the workers in the sample was higher than the sector’s overall union density of approximately 39 per cent (calculated from a data set provided by MIBCO). Consistent with this articulation is that the sector’s union density is higher than the economy-wide union density of 33 per cent, as calculated by Mashilo (2017) from a data set provided by the Department of Labour towards the end of 2016.
Approximately 87 per cent of the workers, as reflected in Figure 3.2.13, said they did not belong to other organisations other than their trade unions. This implies that they saw unionisation as the main force to achieve and protect their interests at the workplace.
However, there were workers who said they belonged to other organisations. Out of the 11.4 per cent of this section of workers, 4.3 per cent did not specify the names of the other organisations they belonged to. The remainder mentioned Legal Wise (2.7%), Scorpions (1.1%) and (private) lawyers, First National Bank Legal and Clientele (each 0.5 %) as reflected below.
81,0!
19,0!
Unionised!! Not!belonging!to!a!union!

GLU | Economic and Social Upgrading in Auto Global Value Chains in South Africa
49
Figure 3.2.13: Other organisations to which workers belonged
Some of the workers said they belonged to the law firms in order to protect themselves. Other than law firms, the other organisation that workers mentioned (1.6%) that they belonged to is a political party: South Africa’s parliamentary majority and governing party, the African National Congress (ANC). By virtue of its majority status in Parliament and position as the country’s governing party, its name did not emerge as a surprise in the sample. The ANC received the majority of over 60 per cent in all previous democratic general elections in South Africa since the first democratic general election held in 1994.
3 .2 .9 Social protection; benefits
All the workers indicated that they had Unemployment Insurance Fund (UIF) payroll deductions. To a lesser extent, a similar picture emerged with other benefits (paid annual leave, funeral cover, retirement fund, etc.) for the majority of the workers, ranging from a minimum of about 60 per cent up to almost 97 per cent, reflected in Figure 3.2.14. Two benefits, housing and travel allowance, were excluded below as they have formerly been covered in this paper.
11,4!
88,6!
1,6!
0,5!
0,5!
0,5!
2,7!
4,3!
1,1!
0,0! 10,0! 20,0! 30,0! 40,0! 50,0! 60,0! 70,0! 80,0! 90,0!100,0!
Yes!
No!
ANC!
Clientele!
FNB!Legal!
Lawyers!
Legal!Wise!
Private!(won't!disclose)!
Scorpions!
Other!
organisaDo
ns!
to!which!
workers!
belonged
!to!
othe
r!than!
trade!un
ions!
Nam
es!m
enDo
ned!by!workers!who
!said!th
ey!
belonged
!to:!O
ther!organisa
Dons!(o
ther!th
an!
trade!un
ions)!
GLU | Economic and Social Upgrading in Auto Global Value Chains in South Africa
50
Figure 3.2.14: Social protection: Benefits
From the above it can be seen that about 97 per cent of the workers said they had a paid sick leave, just over 95 per cent a paid annual leave (taken during annual production shutdown, mostly in December), 64 per cent a funeral cover other than the funeral cover associated with their provident funds benefits (which 84 per cent of the workers said they had), 58.2 per cent a medical aid scheme cover and 92 per cent an annual bonus.
With respect to some types of benefits, very few workers said they do not have benefits: 3.3 per cent said they do not have a paid sick leave, almost 5 per cent said they do not have a paid annual leave, and just over 7 per cent said they do not have an annual bonus. But there were certain types of benefits which significant amounts of workers said they do not receive: 35 per cent said they do not have a funeral cover, 15 per cent said they do not have a retirement fund and about 41.8 per cent said they do not have a medical aid scheme cover. Approximately 80 per cent of workers said they were entitled to paid leave when their partners gave birth, while almost 10 per cent said they do not receive the benefit and just over 10 per cent said they do not know. The latter group of
92,9!
7,1!
58,2!
41,8!
84,2!
15,8!
64,7!
35,3!
95,1!
4,9!
96,7!
3,3!
79,9!
9,8!
10,3!
0,0! 20,0! 40,0! 60,0! 80,0! 100,0! 120,0!
Yes!
No!
Yes!
No!
Yes!
No!
Yes!
No!
Yes!
No!
Yes!
No!
Yes!
No!
Don't!know!
Annu
al!
bonu
s!
Med
ical!
aid/
sche
me!
ReDrem
ent!Fun
d!Fune
ral!
cover!
Paid!
annu
al!
leave!
Paid!sick!
leave!
Paid!leave!
whe
n!partne
r!gives!b
irth!

GLU | Economic and Social Upgrading in Auto Global Value Chains in South Africa
51
workers may have not yet been in a situation where they needed that type of leave.
The workers who were on some type of temporary employment relationship or labour brokered were the ones specifically who said they did not have the above benefits.
The questionnaire did not include a question on maternity leave because it is guaranteed in terms of South Africa’s labour framework. A part of the benefit is paid by the employer while a part of it is paid under the UIF. However, the coverage is not comprehensive. Trade unions such as NUMSA have been pushing for a full six month employer paid maternity leave, which is yet to be achieved in this sector.
3 .2 .10 Work health and safety
Generally, the levels of occupational health and safety in workplaces were fairly reasonable. As shown in Figure 3.2.15, approximately 95 per cent of the workers said their employers provided them with personal protective equipment (PPE). Just over 72 per cent did not report any occupational health problems. Just over 84 per cent reported that they never sustained any occupational injuries to the best of their knowledge.
Figure 3.2.15: Occupational work and safety
Those who said their employers provided them with PPE mentioned articles such as safety aprons, safety gloves, dust masks, ear plugs, safety boots, safety vests, safety jackets, safety helmets, work suits or overalls, while others simply said ‘Full PPE’. Only a few workers, 5.4 per cent said they were not provided with PPE or not
15,8!
84,2!
27,7!
72,3!
94,6!
5,4!
0,0! 10,0! 20,0! 30,0! 40,0! 50,0! 60,0! 70,0! 80,0! 90,0! 100,0!
Yes!
No!
Yes!
No!
Yes!
No!
Once!injured!
Work!related!
health!problem
s!repo
rted
!
Person
al!
protecDve!
equipm
ent!!
Occup
aDon
al!work!and!safety!!
GLU | Economic and Social Upgrading in Auto Global Value Chains in South Africa
52
all the PPE required. Those who reported that they once sustained an occupational injury were also few, albeit a significant minority at 15.8 per cent. Those who reported known occupational health problems were a more significant minority at approximately 28 per cent.
4. RELATIONSHIP BETWEEN ECONOMIC AND SOCIAL UPGRADING IN THE AUTOMOTIVE COMPONENTS MANUFACTURING SECTOR – AN ASSESSMENT OF THE FINDINGS This section is based on the in-depth interviews conducted during factory visits on firm-level economic upgrading in the components sector, which were a follow up to the survey conducted. The section is organised into two three concluding subsections. The first summarises the findings from the enterprises that fell in the low decent work category. The second summarises the findings from those enterprises that fell in the high decent work category. This is also done in a comparative way. The last section concludes the assessment.
4 .1 Low decent work category
Price reduction and cost cutting pressures exerted by OEMs as part of their economic upgrading strategies and their decisions leading to a reduction in supplier contract volumes impacted negatively on the social upgrading positions of the workers in this category. Low volume production, compounded by reductions in supply volumes or by a loss of supply contract impacted negatively not only on the suppliers but also on the social upgrading positions of their workers.
OEMs are very concerned not only about component prices and cost reduction but also about quality, component safety and delivery. An OEM could terminate a supply contract due to the supplier’s weaknesses on the quality and delivery fronts. Substandard or faulty components could result in the costly recall campaign with serious market implications, and OEMs want to avoid this. At least one of the suppliers that fell in this low decent work category lost a supply contract at some point due to quality, component safety and delivery concerns by two OEMs. This form of economic downgrading – which reflects a failure to comply with the production standards required by OEMs and a failure to achieve a required process upgrading level – had an adverse impact on workers, resulting in social downgrading in the form of retrenchments.
This form of social downgrading particularly occurred in situations where there was no increase in volume to avoid the retrenchments. Suppliers, independently of the pressures they experienced from OEMs, are profit-driven and therefore suppressed an increase in ‘labour costs’ – as commonly referred to among the employers.

GLU | Economic and Social Upgrading in Auto Global Value Chains in South Africa
53
It was therefore structural that the workers employed at the suppliers facing OEM market pressures in the context of relatively weak volumes displayed a low decent work score.
In one of the instances where a supply contract was cancelled, the lost volume was awarded by the OEM to a competing supplier at a lower cost. A further social downgrading occurred at the country-level through retrenchments as the competing supplier relocated production from South Africa to lower the cost of production.
As supplier profit margins came under an increasing downward pressure, compounded in some instances by the loss of volume, the affected suppliers increasingly turned on labour and strengthened their own hand in curtailing ‘labour costs’. This also meant restricting workers’ income to the minimum permissible and furthermore avoiding any higher employment conditions than are required at the minimum.
The employment of labour brokers to cut costs surfaced in this context and was therefore not only a strategy to build flexibility in response to increasing market pressures. This is, in turn, the context in which the labour movement embarked on a social upgrading strategy to abolish, restrict and/or regulate the use of the practice of labour brokering. In this regard, economic upgrading and social upgrading met each other from opposed directions in a struggle that is yet to be definitively resolved despite the mitigating settlements and the progressive labour law reforms that were enacted in 2014 to address the problems caused by the practice of labour brokering.3
The suppliers in this category were not involved in product upgrading, in terms of product research and development (R&D) as well as in innovation. They did not enjoy the relative bargaining power associated with R&D. This point is discussed further in the next sub-section focusing on the relatively high decent work category.
Only one of the three supplier case studies covered in the low decent work category was beginning to engage in functional upgrading through involvement in components R&D. The supplier was still at an innovation stage and not yet at the core product R&D stage of this functional upgrading process.
!!!!!!!!!!!!!!!!!!!!!!!!!!!!!!!!!!!!!!!!!!!!!!!!!!!!!!!!!!!!!!!!!!!!3 In 2018 for instance the Constitutional Court heard a case in a matter initiated by Assign Services, a labour brokering company in 2015 with the Commission for Conciliation, Mediation and Arbitration (CCMA), following the labour law reforms enacted in 2014. The reforms, which were adopted in response to the labour movement pushing for the banning of labour brokering, stopped short of the banning but regulated the practice. The Constitutional Court ruled that, as a result of the Labour Relations Act reforms, workers performing work for a client of a labour broker were deemed to be solely employed by that client after a temporary employment service period of three months (Assign Services (Pty) Limited v National Union of Metalworkers of South Africa and Others [2018] ZACC 22; judgment delivered by Dlodlo, A.J. (2018)). This is the interpretation that Assign Services disagreed with when it brought the case to the Constitutional Court against NUMSA, the CCMA and others. Essentially, the labour broker wanted to remain a dual employer of the affected workers after the temporary employment service period of three months. This is what the labour movement opposed in response to the low or poor employment conditions generally experienced by workers employed under the practice.

GLU | Economic and Social Upgrading in Auto Global Value Chains in South Africa
54
One of the companies that fell in this category is a labour brokering firm. This enterprise, a South African subsidiary of a United States based TNC, was not involved in any form of economic and social upgrading, including skills training for the workforce, and was wholly dependent on labour brokering as its business.
The workers employed by the labour broker were administered solely on minimum conditions decided under MIBCO. Their social upgrading position could therefore not be higher than the minimum of permissible conditions.
In the other case studies in this category, there were workers reported to be marginally above the minimum permissible conditions. This section of workers was smaller than that of the workers who were on minimum conditions within this category. It was also smaller than the section of workers who were on higher actual conditions in the high decent work category.
None of the three suppliers that fell in this low social upgrading category engaged in value chain or inter-chain upgrading, or any other form of economic upgrading other than process upgrading and very limited functional upgrading.
Lastly, the case studies in this category further underline that the relationship between economic upgrading and social upgrading is not straightforward, but constitutes a rather complex affair – and one subject to contradictions, the balance of power between OEMs and suppliers, and the balance of power between suppliers and labour.
There were firm-level strikes by workers to achieve social upgrading, particularly to secure benefits such as transport allowance. All of these strikes were unlawful in terms of the applicable labour regime. Yet the workers, under social pressures, felt compelled to accept the risk of embarking on the strikes.
Only the strikes that took place at the sectoral-level during sectoral-level bargaining (conducted on average once every three years) were lawful. In terms of MIBCO’s labour regime, no industrial action is allowed at the company- or plant-level outside of sectoral industrial action or outside of a national socio-economic protest action. This is referred to as the ‘peace clause’. According to the clause, there can be no bargaining at the firm-level on matters that have been negotiated at the industry-level.
4 .2 High decent work category
OEM price reduction and cost cutting pressures, including control over the production process of OE components and supplier parts (i.e. control of tooling, quality control and control of parts and components safety and delivery, as well as related market control), applied to the suppliers in this category as well as the suppliers that fell under the low decent work category.
What then differentiates the enterprises that fall into the two different categories in the same sector?

GLU | Economic and Social Upgrading in Auto Global Value Chains in South Africa
55
There were company- and firm-level specific differences that distinguished high decent work category suppliers from low decent work category suppliers. High decent work category suppliers displayed a relatively strong market position. Associated with this were their robust economies of scale reflected in their high volume production. This included relatively strong global market positions and relatively robust export volume programmes based on high volume production. Companies in this category pursued process upgrading more rigorously. This reduced their vulnerability to volume reductions or contract cancellations by OEMs, in comparison to the companies in the low decent work category that were more exposed to this vulnerability.
In addition, sufficiently increased and high production volumes reduced the occurrence of retrenchments as a result of process upgrading leading to increased productivity. Where there were sufficient increases in volumes to employ new workers, this was done, which led to social upgrading for the newly employed workers.
These were among the reasons given by the suppliers for sustaining relatively higher working conditions compared to the low decent work category. Particularly their core/permanent workforces were paid above MIBCO negotiated minimum wage rates. This translated into relatively higher medical aid and retirement fund employer-employee contributions (which are based on actual rates of pay), as well as relatively higher annual leave pay and pay for other types of leave.
Other economic upgrading factors that played an important role in this category were functional upgrading – particularly involvement in product innovation and R&D. However, product upgrading was not limited to involvement in R&D and innovation. Since it included an increased variety of the products that a supplier produced, it thus expanded the firm’s market position. Linked with increased product variety were relatively high production volumes. This functional upgrading, as well as its associated product upgrading, boosted the bargaining position of the suppliers involved in product R&D and those with a higher variety of products based on a high volume production, compared to those suppliers that fell under the low decent work category. For this reason, the high decent work category suppliers involved in product upgrading displayed a better chance of being awarded the associated supply contracts.
There was a different angle introduced by an IAM supplier that fell in this high decent work category. The IAM supplier realised relatively greater independence from OEMs after exiting the OE components and supplier parts markets, and therefore avoiding the inherent ‘profit squeeze’ problem in these markets. The suppliers’ exit from the GVCs of OE components and supplier parts translated into an exit from direct control by OEMs, including what the supplier referred to as designer control.

GLU | Economic and Social Upgrading in Auto Global Value Chains in South Africa
56
The IAM share of the products produced by the supplier were widely distributed both in South Africa and in export markets, covering the entire sub-Saharan Africa under a licensed brand name. The supplier was able to sustain the pre-existing, relatively higher decent work conditions of its employees because of the high profit margins in the IAM segment compared to the OE components and supplier parts markets, wholly controlled by OEMs.
At least one of the suppliers in this category was supplying components for state-of-the-art driverless vehicles, thus securing its future and that of the current social upgrading position of its workers in the emerging market of the autonomous vehicles in the context of industry 4.0 or the fourth industrial revolution. All of the self-driving vehicle components that the supplier produced were exports.
In this category there was also a product upgrading contradiction for one of the suppliers: economic downgrading occurred in the form of a plant closure and social downgrading in the form of retrenchments, but the average actual conditions of the unaffected workers, already above the minimum levels, were maintained. This was caused by product upgrading by an OEM (a good thing for the consumer), which then reduced the supplier’s market share. The new component had a higher lifespan compared to its predecessor and therefore did not require frequent replacements in the OE supplier parts or after sales market. This caused the suppliers’ volume to plummet, resulting in the closure of one of its plants and the retrenchment of the affected workers. The supplier was also affected by poor market regulation, where cheaper but substandard quality products, overwhelmingly imports, flooded the domestic market.
Despite relatively high social upgrading positions, particularly for their core/permanent workforces, labour brokered workers in this category were maintained at the minimum of permissible conditions treated as maximums conditions, as in the low decent work category. However, in many instances these suppliers had relatively fewer such workers than suppliers in the low decent category.
However, the suppliers in this high decent work category warned that the overall movement of the contradiction having on one hand, workers increasing their bargaining demands bottom-up, and on the other hand, OEMs pressing top-down for price and cost reduction, would reach a point where they too would be unable to sustain the relatively high social upgrading position of their employees.
The higher social upgrading position that the suppliers in this category sustained was nevertheless partly a result of ‘legacy costs’, associated with their core/permanent workforces’ previously-won higher employment conditions compared to the sector-wide negotiated minimum conditions. There was an emerging consideration to bring new generations of core/permanent workers in line with industry negotiated minimum conditions treated as maximums.

GLU | Economic and Social Upgrading in Auto Global Value Chains in South Africa
57
4 .3 Conclusions from the f indings
Employers do not embark on economic upgrading in order to raise the decent work level or improve the social upgrading position of workers. Economic upgrading in the automotive components manufacturing sector is first and foremost undertaken by employers in order to secure and sustain their inclusion in the OEM controlled GVCs for profit-making objectives. Decent work or social upgrading is thus a secondary or circumstantial aspect to the employers. Employed workers had to organise and engage in collective bargaining and industrial action to achieve social upgrading improvements.
Related to the above, in an analysis on the future of work in the automotive industry, covering several the European countries and the North American region, as well as China, India and Mexico, Pardi (2017) found that structuring new industries and restructuring are varyingly over-determined by global trends. This is associated, among others, with the pivotal role played by foreign direct investment and integration in global value chains or, in other words, a globalising trend. It was further found that the workforce is, to varying extents, increasingly divided into a reduced core and an increased flexible labour force characterised by greater insecurity and less favourable conditions. These findings are similar to the relevant findings made and presented in this paper. In response, the labour movement in South Africa was able to negotiate, albeit varyingly to moderating extents, a reduction of more exploitative flexible labour conditions. This was achieved both through collective bargaining in the automotive industry and national legislative amendments and regulation. The latter is highlighted the country’s Constitutional Court judgment briefly discussed above, under the low decent work category.
In addition, and further to the strikes in the automotive components manufacturing sector previously reported on, Table 4.1 and 4.2 below highlight the labour struggle for social upgrading improvements in the automotive assembly sector in South Africa, dating back from 1993, and in the components manufacturing sector. In both instances, key areas of focus are wage increments and strikes embarked on by workers to secure social upgrading improvements as represented by their collective bargaining demands. !

GLU | Economic and Social Upgrading in Auto Global Value Chains in South Africa
58
Table 4.1: The battle for social upgrading in the South Afr ican automotive assembly sector
Duration Settlement
(Average)
Consumer Price Index
(Average)
Variance Str ike
(Yes/No)
Duration of the str ike
Duration of the
agreement
1993-1994 7 10.8 - 3.8 Yes 10 weekdays 1 year
1994-1995 10.5 7.3 3.2 Yes 20 weekdays 1 year
1995-1997 9.3 8.7 0.6 Yes 10 weekdays 3 years
1998-2000 7.4 5.8 1.6 Yes 10 weekdays 3 years
2001-2003 8.9 7.3 1.6 Yes 15 weekdays 3 years
2004-2006 3.6 2.6 1 No 0 3 years
2007-2009 8.2 8.9 - 0.7 No 0 3 years
2010-2012 9.3 5 4.3 Yes 8 weekdays 3 years
2013-2016 9 5.6 4.4 Yes 15 weekdays 3 years
2016-2019 8.6 * * No 0 3 years
Data source: National Bargaining Forum (NBF)/AMEO/Author former bargaining representative and chief negotiator for labour in the NBF
*To be calculated in 2019 August
The differences or variances between the average wage settlements and inflation rates as indicated in Table 4.1 show that real wage increases are low in the vehicle assembly sector despite the strikes, and that there are negative real wage increases such as for the period 1993 to 1994 and 2007 to 2009. While the table focuses on wages, the bargaining and strikes were also about other social upgrading improvements. This underlines the importance of the role played by labour agency to social upgrading.
The table below highlights the social upgrading battle in relation to wage settlements in the automotive components sector for the period 2004 to 2019.4 !
!!!!!!!!!!!!!!!!!!!!!!!!!!!!!!!!!!!!!!!!!!!!!!!!!!!!!!!!!!!!!!!!!!!!4 Unlike in the automotive assembly sector, data for the period 1994 to 2003 in the automotive components manufacturing sector proved to be very difficult to access due to a lack of proper records.
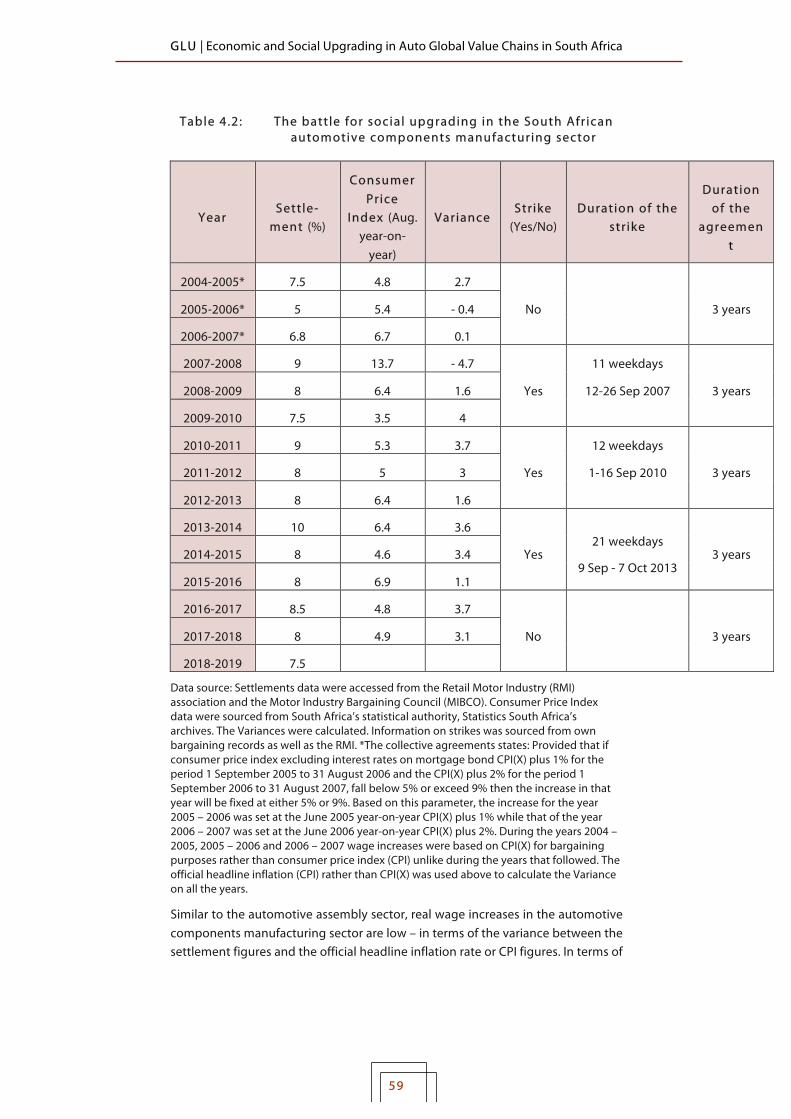
GLU | Economic and Social Upgrading in Auto Global Value Chains in South Africa
59
Table 4.2: The battle for social upgrading in the South Afr ican automotive components manufacturing sector
Year Settle-
ment (%)
Consumer Price
Index (Aug. year-on-
year)
Variance Str ike
(Yes/No) Duration of the
str ike
Duration of the
agreement
2004-2005* 7.5 4.8 2.7
No
3 years 2005-2006* 5 5.4 - 0.4
2006-2007* 6.8 6.7 0.1
2007-2008 9 13.7 - 4.7
Yes
11 weekdays
3 years 2008-2009 8 6.4 1.6 12-26 Sep 2007
2009-2010 7.5 3.5 4
2010-2011 9 5.3 3.7
Yes
12 weekdays
3 years 2011-2012 8 5 3 1-16 Sep 2010
2012-2013 8 6.4 1.6
2013-2014 10 6.4 3.6
Yes 21 weekdays
9 Sep - 7 Oct 2013 3 years 2014-2015 8 4.6 3.4
2015-2016 8 6.9 1.1
2016-2017 8.5 4.8 3.7
No
3 years 2017-2018 8 4.9 3.1
2018-2019 7.5
Data source: Settlements data were accessed from the Retail Motor Industry (RMI) association and the Motor Industry Bargaining Council (MIBCO). Consumer Price Index data were sourced from South Africa’s statistical authority, Statistics South Africa’s archives. The Variances were calculated. Information on strikes was sourced from own bargaining records as well as the RMI. *The collective agreements states: Provided that if consumer price index excluding interest rates on mortgage bond CPI(X) plus 1% for the period 1 September 2005 to 31 August 2006 and the CPI(X) plus 2% for the period 1 September 2006 to 31 August 2007, fall below 5% or exceed 9% then the increase in that year will be fixed at either 5% or 9%. Based on this parameter, the increase for the year 2005 – 2006 was set at the June 2005 year-on-year CPI(X) plus 1% while that of the year 2006 – 2007 was set at the June 2006 year-on-year CPI(X) plus 2%. During the years 2004 – 2005, 2005 – 2006 and 2006 – 2007 wage increases were based on CPI(X) for bargaining purposes rather than consumer price index (CPI) unlike during the years that followed. The official headline inflation (CPI) rather than CPI(X) was used above to calculate the Variance on all the years.
Similar to the automotive assembly sector, real wage increases in the automotive components manufacturing sector are low – in terms of the variance between the settlement figures and the official headline inflation rate or CPI figures. In terms of

GLU | Economic and Social Upgrading in Auto Global Value Chains in South Africa
60
the absolute figures, the 2007 – 2008 real wage increase was substantially negative, that is 4.7 below the corresponding CPI.
Automotive components manufacturers’ business – particularly the manufacturing and supply of OE components and supplier parts – depends first and foremost on their inclusion in the OEM controlled GVCs. There are no other markets for the OE components and supplier parts except the OEMs. It is the OEMs that set the terms and conditions for inclusion in their GVCs based on their profit objectives. That is where the OE components and supplier parts manufacturers’ business historically derived its existence and development.
The automotive GVCs are characterised by deepening competition between automotive components manufactures, intensified by OEMs under conditions of ever-increasing market pressures. The OEMs use components manufacturing outsourcing as a lever not for social upgrading for workers in the outsourced operations, but as a lever to achieve competitiveness – geared at profit maximisation. This process, which creates monopsonistic OE components and OES parts market structures controlled by OEMs, giving OEMs power over suppliers, impacts the social upgrading position of components manufacturing sector workers.
By the time the research was conducted, the operating environment in the automotive GVCs in South Africa had reached a point where automotive components manufacturers were embarking on and intensifying economic upgrading. This was not least to make profit per se but, given the ever-mounting market pressures, was increasingly just to survive and maintain their inclusion in the OEM controlled automotive GVCs.
This is the context in which workers’ conditions are lower than those of their counterparts in the assembly sector, where workers are numerically decreasing due to intensifying automation, robotisation and new and more effective and efficient work methods as well as ways of co-ordinating production. While the components sector is on average now decisively on this path of deepening process upgrading, the high level of its workforce suggests that, compared to the assembly sector, it has a greater job creating potential – as long as there is increasing manufacturing value addition based on high volume production. Without sufficiently increasing production volumes based on high volume production, the components manufacturing sector is more likely to join the vehicle assembly sector in reducing employment to increase output per worker as process upgrading intensifies.
The ILO (2016) looks at the same issues from a global supply chains perspective. It was correctly found that the value created during the various stages of the global supply chains, meaning, step by step, the activities followed from conception to final use to bring a product to the market, is not shared equally with all participating firms, and that high value elements tend to be those located in conceptual stages, namely research and development as well as design, and

GLU | Economic and Social Upgrading in Auto Global Value Chains in South Africa
61
those located in the end, referring logistics, marketing and sales, rather than in those located in the middle.
With regard to the above, economic upgrading appears more as inspiration for companies and countries located at lower rungs of value capture and as the domain of capital or firms. Labour’s concern for a share equal to its value creating contribution, after production costs are settled, as a social upgrading goal is excluded. It would similarly still be excluded even if the value created was to be shared equally with all participating firms. This is not a mere conceptual or formulation issue arising out of a particular school of political economy which does not regard it as a problem requiring a solution.
The relationship between economic and social upgrading, in terms of which economic upgrading and its proceeds are basically associated with capital, is by no small measure a function of the relationship between labour and capital, within the ranks of capital competition and competitive strategies, and between different countries competition to attract the foreign direct investment associated with hosting GVCs. In this regard outsourcing and offshoring facilitate inclusion, as the ILO (2016) states. However, outsourcing as an example also facilitates exclusion. This finds its expression when outsourcing is particularly used as a competitive strategy and, associated with this, as a cost cutting lever with impact on ‘labour costs’ – to workers their income and number in production.
Economic upgrading strategies especially pursued to meet capital accumulation requirements can produce social downgrading with adverse effects on workers, as showed by the relevant findings in this paper. Economic upgrading is a key concern for lead firms rather than only for firms and countries in low rungs of value capture. In GVCs, lead firms play a pioneering role to achieve economic upgrading at all levels, including in outsourced production and is a key requirement for outsourcing. The lead firms use their flagship position to set other preconditions for inclusion in their GVCs and to exclude suppliers and countries that do not comply. In this regard cost cutting and therefore achieving low cost production play a decisive role.
As showed above, on the other hand labour agency has played an important role to social upgrading improvements in the automotive industry GVCs in South Africa, as well as in mitigating the impact of economic upgrading strategies that lead to adverse effects on their social upgrading position. In this regard by labour agency reference is to unionisation and mobilisation by workers to achieve social upgrading improvements, including through collective bargaining, the pursuit of better legislation or regulation, and legal action to enforce legislative and regulatory achievements.
The above highlight a key driver of social upgrading other than when it happens to occur concomitantly with economic upgrading, and underline the fact that there are economic upgrading measures that do result in social downgrading.

GLU | Economic and Social Upgrading in Auto Global Value Chains in South Africa
62
REFERENCES Automobile Manufacturers’ Employers Organisation (AMEO) (2017) Automotive
Assembly Sector hourly workforce and Skills Levels Populations. Unpublished report supplied by AMEO: Pretoria.
Automotive Industry Development Council (AIDC) (2015) Economic Impact Assessment of the AIDC for the 2013/14 Financial Year. Pretoria: AIDC.
Automotive Industry Export Council (AIEC) (2013) Automotive Export Manual 2013. AIEC: Pretoria
Automotive Industry Export Council (AIEC) (2014) Automotive Export Manual 2014. AIEC: Pretoria.
Automotive Industry Export Council (AIEC) (2015) Automotive Export Manual 2015. AIEC: Pretoria.
Automotive Industry Export Council (AIEC) (2016) Automotive Export Manual 2016. AIEC: Pretoria.
Automotive Industry Export Council (AIEC) (2017) Automotive Export Manual 2017. AIEC: Pretoria.
Automotive Industry Export Council (AIEC), 2010. Automotive Export Manual 2010. AIEC: Pretoria.
Automotive Industry Export Council (AIEC), 2010. Automotive Export Manual 2018. AIEC: Pretoria.
Barnes, J. (2000) The Competitiveness of the South African Automotive Component Industry: Findings from the 1999 Follow-up Study. Durban: Industrial Restructuring Project, University of Natal.
Commission for Employment Equity (CEE) (2017) Annual Report 2016-2017. Pretoria: Department of Labour.
Department of Economic Development (DED) (2013) Automotive Production and Development Programme (APDP) Regulations. In Government Gazette 36147: 8 – 21.
Department of Trade and Industry (DTI) (2016a) Annual Report 2015/16: Towards full-scale industrialisation and inclusive growth. DTI: Pretoria.
Department of Trade and Industry (DTI) (2017) Annual Survey Aggregate Data: 2016. DTI: Pretoria.
Department of trade and Industry (DTI) (2017) Minister Davies Responds to GM SA’s Decision to Exit South Africa http://www.dti.gov.za/; http://www.dti.gov.za/editmedia.jsp?id=4064 (Accessed November 2017)

GLU | Economic and Social Upgrading in Auto Global Value Chains in South Africa
63
Department of Trade and Industry (DTI), 9 June (2015) Presentation on SA automotive sector to the Economic Development Parliamentary Portfolio Committee https://www.thedti.gov.za/parliament/2015/SA_Automotive_Sector.pdf. (Accessed November 2015)
Department of Trade and Industry (DTI) (2016b) Presentation to the Portfolio Committee on Trade and Industry 16 February 2016: Automotive Production and Development Programme (APDP) 2014/15 Review. https://www.thedti.gov.za/parliament/2016/APDP_Review2014_15.pdf (Accessed July 2017)
Dlodlo, A.J. (2018) Assign Services (Pty) Limited v National Union of Metalworkers of South Africa and Others. ZACC 22 (Constitutional Court judgment)
Eurofound and International Labour Organization (2019), Working conditions in a global perspective, Publications Office of the European Union, Luxembourg, and International Labour Organization. Geneva: ILO; or https://www.ilo.org/wcmsp5/groups/public/---dgreports/---dcomm/---publ/documents/publication/wcms_696174.pdf (Accessed August 2019)
International Labour Organisation (ILO) (2012a) Decent Work Country Profile: South Africa. Geneva: ILO
International Labour Organisation (ILO) (2012b) Decent Work Indicators: Concepts and Definitions. ILO Manual/ International Labour Office – 1st ed. Geneva: ILO
International Labour Organization (ILO) (2016) Sectoral Studies on Decent Work in Global Supply Chains: Comparative Analysis of Opportunities and Challenges for Social and Economic Upgrading. Geneva: ILO; or https://www.ilo.org/wcmsp5/groups/public/---dgreports/---integration/documents/publication/wcms_180322.pdf
International Labour Organisation (ILO) (2018) South Africa, GDP per person employed https://data.worldbank.org/indicator/SL.GDP.PCAP.EM.KD?locations=ZA&view=chart (Accessed July 2018)
International Organisation of Motor Vehicle Manufacturers (OICA) (2017) World Motor Vehicle Production by Country and Type 2015-2016, OICA correspondence survey, http://www.oica.net/wp-content/uploads//Total-2016.pdf (Accessed November 2017)
International Organisation of Motor Vehicle Manufacturers (OICA) (2008) Production statistics. http://www.oica.net/category/production-statistics/2008-statistics/ (Accessed November 2016)
International Organisation of Motor Vehicle Manufacturers (OICA) (2009) Production statistics. http://www.oica.net/category/production-statistics/2009-statistics/ (Accessed November 2016)

GLU | Economic and Social Upgrading in Auto Global Value Chains in South Africa
64
International Organisation of Motor Vehicle Manufacturers (OICA) (2013) Production statistics. http://www.oica.net/category/production-statistics/2013-statistics/ (Accessed November 2016)
International Organisation of Motor Vehicle Manufacturers (OICA) (2014) Production statistics. GLU WP No.58 without cover.docxhttp://www.oica.net/category/production-statistics/2014-statistics/). (Accessed November 2016)
International Organisation of Motor Vehicle Manufacturers (OICA) (n.d.) A growth industry. http://www.oica.net/category/economic-contributions/ (Accessed January 2017)
Iveco (2017) Iveco is present in all five continents with manufacturing sites and research centres. http://www.iveco.com/southafrica/company/pages/company-values-sediment-systems.aspx (Accessed November 2017)
Labour Relations Act (LRA), Act 66 (1995) Pretoria: Department of Labour
Lamprecht, N. and Tolmay, A.S. (2017) Performance of South African automotive exports under the African Growth and Opportunity Act from 2001 to 2015. International Business & Economics Research Journal, 2nd Quarter 2017, 16(2): 131-142
Mashilo, A.M. (2010) Changes in Work and Production Organisation in the Automotive Industry Value Chains: An evaluation of the responses by labour in South Africa. Unpublished MA Research Report, University of the Witwatersrand, Johannesburg.
Mashilo, A.M. (2017) Regression of workers’ unity in South Africa: Divisions postpone greater progress and ultimate victory. Global Labour Review, (271); or http://www.global-labour-university.org/fileadmin/GLU_Column/papers/no_272_Mashilo.pdf
Motor Industry Bargaining Council (MIBCO) (2010) MIBCO main agreement. Pretoria: Department of Labour.
Motor Industry Bargaining Council (MIBCO) (2011) MIBCO Simplified Main Agreement: Johannesburg: MIBCO (MIBCO website, Accessed November 2015 http://www.mibco.org.za/).
Motor Industry Bargaining Council (MIBCO) (2014) MIBCO Main Agreement: Pretoria: Department of Labour.
Motor Industry Bargaining Council (MIBCO) (2017) MIBCO Main Agreement: Pretoria: Department of Labour (Government Gazette No. 40771, April 2017)
National Association of Automotive Components and Allied Manufacturers (NAACAM) (2016) NAACAM Directory. Edenglen: NAACAM.

GLU | Economic and Social Upgrading in Auto Global Value Chains in South Africa
65
National Association of Automotive Components and Allied Manufacturers (NAACAM) (2017) NAACAM Directory. Edenglen: NAACAM.
National Bargaining Forum (NBF) (2010) Composite National Bargaining Forum Agreement Applicable to all hourly paid in the automobile manufacturing industry. NBF: Pretoria
National Bargaining Forum (NBF) (2013) Composite National Bargaining Forum Agreement Applicable to all hourly paid in the automobile manufacturing industry. NBF: Pretoria
Pardi, T. (2017) The future of work in the automotive sector: The challenges of deglobalization. Geneva: ILO; or https://www.ilo.org/wcmsp5/groups/public/---dgreports/---inst/documents/publication/wcms_551606.pdf (Accessed August 2019)
Statistics South Africa (StatsSA) (2015) Employment, unemployment, skills and economic growth: An exploration of household survey evidence on skills development and unemployment between 1994 and 2014. : https://www.statssa.gov.za/presentation/StatsSApresentationskillsunemployment_16September.pdf (Accessed January 2017)
Statistics South Africa (StatsSA) (2018) Labour Force Survey: Quarter 1 (15 May 2018). Pretoria: StatsSA; or http://www.statssa.gov.za/publications/P0211/P02111stQuarter2018.pdf (Accessed July 2018)
Statistics South Africa (StatsSA) (2019) Labour Force Survey: Quarter 2 (30 July 2019). Pretoria: StatsSA; http://www.statssa.gov.za/publications/P0211/P02112ndQuarter2019.pdf (Accessed August 2018)
World Bank; Organisation for Economic Co-operation and Development (OECD) GDP (2018) https://data.worldbank.org/indicator/NY.GDP.MKTP.CD?locations=ZA (Accessed June 2018)
!
GLU | Economic and Social Upgrading in Auto Global Value Chains in South Africa
66
About the author
Alex M Mashilo has a Masters in Labour Policies and Globalisation, a Global Labour University Programme, and a PhD from Wits University. He started working in the automotive industry in the late 1990s as an apprentice, continued in full-time employment, engineering maintenance, and served as the National Union of Metalworkers of South Africa’s full-time shop steward. He rose through the ranks of the union holding several key positions including head of bargaining while furthering his studies. He remains active in South Africa’s policy discourse.
Members of the GLU network: British Trade Union Congress (TUC), U.K. Cardiff University, U.K. Central Única dos Trabalhadores (CUT) / Observatorio Social, Brazil Congress of South African Trade Unions (COSATU), South Africa Deutscher Gewerkschaftsbund (DGB) / DGB Bildungswerk, Germany European Trade Union Institute (ETUI) Hochschule für Wirtschaft und Recht Berlin (HWR), Germany Friedrich-Ebert-Stiftung (FES), Germany Global Union Research Network (GURN) Global Unions (GU) Hans-Böckler-Stiftung (HBS), Germany Industriegewerkschaft Metall (IG Metall), Germany International Federation of Workers' Education Associations (IFWEA) International Institute for Labour Studies (IILS), ILO International Labour Organisation (ILO) / Bureau for Workers' Activities (ACTRAV) Jawaharlal Nehru University (JNU), New Delhi, India National Labour and Economic Development Institute (Naledi), South Africa PennState University, USA Ruskin College, Oxford, U.K. Tata Institute of Social Sciences, India Universidade Estadual de Campinas, Brazil Universität Kassel, Germany University of the Witwatersrand (WITS), South Africa

GLU | Economic and Social Upgrading in Auto Global Value Chains in South Africa
67
Published GLU Working Papers
No.1 Seeraj Mohamed; Economic Policy, Globalization and the Labour Movement: Changes in the Global Economy from the Golden Age to the Neoliberal Era, February 2008 http://www.global-labour-university.org/fileadmin/GLU_Working_Papers/GLU_WP_No.1.pdf
No.2 Birgit Mahnkopf; EU Multi-Level Trade Policy: Neither coherent nor development-friendly, February 2008 http://www.global-labour-university.org/fileadmin/GLU_Working_Papers/GLU_WP_No.2.pdf
No.3 Edward Webster, Christine Bischoff, Edlira Xhafa, Juçara Portilho Lins, Doreen D. Deane, Dan Hawkins, Sharit K. Bhowmik, Nitin More, Naoko Otani, Sunghee Park, Eustace I. James, Melisa Serrano, Verna D. Viajar, Ramon A. Certeza, Gaye Yilmaz, Bülend Karadağ, Tolga Toren, Elif Sinirlioğlu and Lyudmyla Volynets; Closing the Representation Gap in Micro and Small Enterprises, November 2008 http://www.global-labour-university.org/fileadmin/GLU_Working_Papers/GLU_WP_No.3.pdf
No.4 Max J. Zenglein; Marketization of the Chinese Labor Market and the Role of Unions, November 2008 http://www.global-labour-university.org/fileadmin/GLU_Working_Papers/GLU_WP_No.4.pdf
No.5 Wilfried Schwetz and Donna McGuire; FIFA World Cup 2006 Germany: An opportunity for union revitalisation? November 2008 http://www.global-labour-university.org/fileadmin/GLU_Working_Papers/GLU_WP_No.5.pdf
No.6 Hansjörg Herr, Milka Kazandziska, Silke Mahnkopf-Praprotnik; The Theoretical Debate about Minimum Wages, February 2009 http://www.global-labour-university.org/fileadmin/GLU_Working_Papers/GLU_WP_No.6.pdf
No.7 Patricia Chong; Servitude with a Smile: An Anti-Oppression Analysis of Emotional Labour, March 2009 http://www.global-labour-university.org/fileadmin/GLU_Working_Papers/GLU_WP_No.7.pdf
No.8 Donna McGuire and Christoph Scherrer with: Svetlana Boincean, Ramon Certeza, Doreen Deane, Eustace James, Luciana Hachmann, Kim Mijeoung, Maike Niggemann, Joel Odigie, Rajeswari, Clair Siobhan Ruppert, Melisa Serrano, Verna Dinah Q. Viajar and Mina Vukojicic; Developing a Labour Voice in Trade Policy at the National Level, February 2010 http://www.global-labour-university.org/fileadmin/GLU_Working_Papers/GLU_WP_No.8.pdf
GLU | Economic and Social Upgrading in Auto Global Value Chains in South Africa
68
No.9 Paulo Eduardo de Andrade Baltar, Anselmo Luís dos Santos, José Dari Krein, Eugenia Leone, Marcelo Weishaupt Proni, Amilton Moretto, Alexandre Gori Maia and Carlos Salas; Moving towards Decent Work. Labour in the Lula government: reflections on recent Brazilian experience, May 2010 http://www.global-labour-university.org/fileadmin/GLU_Working_Papers/GLU_WP_No.9.pdf
No.9 Paulo Eduardo de Andrade Baltar, Anselmo Luís dos Santos, José Dari Krein, Eugenia Leone, Marcelo Weishaupt Proni, Amilton Moretto, Alexandre Gori Maia and Carlos Salas; Trabalho no governo Lula: uma reflexão sobre a recente experiência brasileira, May 2010 (http://www.global-labour-university.org/fileadmin/GLU_Working_Papers/GLU_WP_No._9_portuguese.pdf)
No.10 Christine Bischoff, Melisa Serrano, Edward Webster and Edlira Xhafa; Strategies for Closing the Representation Gap in Micro and Small Enterprises, July 2010 http://www.global-labour-university.org/fileadmin/GLU_Working_Papers/GLU_WP_No.10.pdf
No.11 Hansjörg Herr and Milka Kazandziska; Principles of Minimum Wage Policy - Economics, Institutions and Recommendations, March 2011 http://www.global-labour-university.org/fileadmin/GLU_Working_Papers/GLU_WP_No.11.pdf
No.12 Chiara Benassi; The Implementation of Minimum Wage: Challenges and Creative Solutions, March 2011 http://www.global-labour-university.org/fileadmin/GLU_Working_Papers/GLU_WP_No.12.pdf
No.13 Rudolf Traub-Merz; All China Federation of Trade Unions: Structure, Functions and the Challenge of Collective Bargaining, August 2011 http://www.global-labour-university.org/fileadmin/GLU_Working_Papers/GLU_WP_No.13.pdf
No.14 Melisa R. Serrano and Edlira Xhafa; The Quest for Alternatives beyond (Neoliberal) Capitalism, September 2011 http://www.global-labour-university.org/fileadmin/GLU_Working_Papers/GLU_WP_No.14.pdf
No.15 Anna Bolsheva; Minimum Wage Development in the Russian Federation, July 2012 http://www.global-labour-university.org/fileadmin/GLU_Working_Papers/GLU_WP_No.15.pdf

GLU | Economic and Social Upgrading in Auto Global Value Chains in South Africa
69
No.16 Hansjörg Herr and Gustav A. Horn; Wage Policy Today, August 2012 http://www.global-labour-university.org/fileadmin/GLU_Working_Papers/GLU_WP_No.16.pdf
No.17 Neil Coleman; Towards new Collective Bargaining, Wage and Social Protection Strategies in South Africa - Learning from the Brazilian Experience, November 2013 http://www.global-labour-university.org/fileadmin/GLU_Working_Papers/GLU_WP_No.17.pdf
No.18 Petra Dünhaupt; Determinants of Functional Income Distribution – Theory and Empirical Evidence, November 2013 http://www.global-labour-university.org/fileadmin/GLU_Working_Papers/GLU_WP_No.18.pdf
No.19 Hansjörg Herr and Zeynep M. Sonat; Neoliberal Unshared Growth Regime of Turkey in the Post-2001 Period, November 2013 http://www.global-labour-university.org/fileadmin/GLU_Working_Papers/GLU_WP_No.19.pdf
No.20 Peter Wahl; The European Civil Society Campaign on the Financial Transaction Tax, February 2014 http://www.global-labour-university.org/fileadmin/GLU_Working_Papers/GLU_WP_No.20.pdf
No.21 Kai Eicker-Wolf and Achim Truger; Demystifying a 'shining example': German public finances under the debt brake, February 2014 http://www.global-labour-university.org/fileadmin/GLU_Working_Papers/GLU_WP_No.21.pdf
No.22 Lena Lavinas, in collaboration with Thiago Andrade Moellmann Ferro; A Long Way from Tax Justice: the Brazilian Case, April 2014 http://www.global-labour-university.org/fileadmin/GLU_Working_Papers/GLU_WP_No.22.pdf
No.23 Daniel Detzer; Inequality and the Financial System - The Case of Germany, April 2014 http://www.global-labour-university.org/fileadmin/GLU_Working_Papers/GLU_WP_No.23.pdf
No.24 Hansjörg Herr and Bea Ruoff; Wage Dispersion – Empirical Developments, Explanations, and Reform Options, April 2014 http://www.global-labour-university.org/fileadmin/GLU_Working_Papers/GLU_WP_No.24.pdf
No.25 Bernhard Leubolt; Social Policies and Redistribution in South Africa, May 2014 http://www.global-labour-university.org/fileadmin/GLU_Working_Papers/GLU_WP_No.25.pdf
GLU | Economic and Social Upgrading in Auto Global Value Chains in South Africa
70
No.26 Bernhard Leubolt; Social Policies and Redistribution in Brazil, May 2014 http://www.global-labour-university.org/fileadmin/GLU_Working_Papers/GLU_WP_No.26.pdf
No.27 Sarah Godar, Christoph Paetz and Achim Truger; Progressive Tax Reform in OECD Countries: Perspectives and Obstacles, May 2014 http://www.global-labour-university.org/fileadmin/GLU_Working_Papers/GLU_WP_No.27.pdf
No.29 Thomas Obst; Long-term trends in income distribution - a global perspective, February 2015 http://www.global-labour-university.org/fileadmin/GLU_Working_Papers/GLU_WP_No.29.pdf
No.30 Bruno Dobrusin; Trade union debates on sustainable development in Brazil and Argentina, February 2015 http://www.global-labour-university.org/fileadmin/GLU_Working_Papers/GLU_WP_No.30.pdf
No.31 Christoph Hermann; Green New Deal and the Question of Environmental and Social Justice, February 2015 http://www.global-labour-university.org/fileadmin/GLU_Working_Papers/GLU_WP_No.31.pdf
No.32 John Cody; How labor manages productivity advances and crisis response: a comparative study of automotive manufacturing in Germany and the US, February 2015 http://www.global-labour-university.org/fileadmin/GLU_Working_Papers/GLU_WP_No.32.pdf
No.33 Lauro Mattei; The Brazilian Rural Development Model in the Context of Green Economy, 2015 http://www.global-labour-university.org/fileadmin/GLU_Working_Papers/GLU_WP_No.33.pdf
No.34 Daniela Magalhães Prates, Adriana Nunes Ferreira and Daniela Gorayeb; The Brazilian Credit Market: Recent Developments and Impact on Inequality, 2015 http://www.global-labour-university.org/fileadmin/GLU_Working_Papers/GLU_WP_No.34.pdf
No.35 Sumedha Bajar and Meenakshi Rajeev; The Impact of Infrastructure Provisioning on Inequality: Evidence from India, 2015 http://www.global-labour-university.org/fileadmin/GLU_Working_Papers/GLU_WP_No.35.pdf
!

GLU | Economic and Social Upgrading in Auto Global Value Chains in South Africa
71
No.36 Luciole Sauviat; In Search for Political Consciousness. The Role of Workers' Education, 2015 http://www.global-labour-university.org/fileadmin/GLU_Working_Papers/GLU_WP_No.36.pdf
No.37 Meenakshi Rajeev; Financial Inclusion and Disparity: A Case of India, 2015 http://www.global-labour-university.org/fileadmin/GLU_Working_Papers/GLU_WP_No.37.pdf
No.38 Mohd Raisul Islam Khan and Christa Wichterich; Safety and labour conditions: the accord and the national tripartite plan of action for the garment industry of Bangladesh, 2015 http://www.global-labour-university.org/fileadmin/GLU_Working_Papers/GLU_WP_No.38.pdf
No.39 Bea Ruoff; Labour Market Developments in Germany: Tales of Decency and Stability, 2016 http://www.global-labour-university.org/fileadmin/GLU_Working_Papers/GLU_WP_No.39.pdf
No.40 Claudia Hofmann and Norbert Schuster; It ain’t over ‘til it’s over: The right to strike and the mandate of the ILO committee of experts revisited, 2016 http://www.global-labour-university.org/fileadmin/GLU_Working_Papers/GLU_WP_No.40.pdf
No.41 Adriana Nunes Ferreira, Ana Rosa Ribeiro de Mendonça and Simone Deos; The role of Brazilian public banks facing inequality: some reflections on the case of Brazilian development bank, Caixa and the federal regional banks, 2016 http://www.global-labour- university.org/fileadmin/GLU_Working_Papers/GLU_WP_No.41.pdf
No.42 Melisa R. Serrano and Edlira Xhafa; From ‘precarious informal employment’ to ‘protected employment’: the ‘positive transitioning effect’ of trade unions, 2016 http://www.global-labour- university.org/fileadmin/GLU_Working_Papers/GLU_WP_No.42.pdf
No.43 Christoph Scherrer and Stefan Beck; Trade regulations and global production networks, 2016 http://www.global-labour- university.org/fileadmin/GLU_Working_Papers/GLU_WP_No.43.pdf
No.44 Hansjörg Herr, Erwin Schweisshelm and Truong-Minh Vu; The integration of Vietnam in the global economy and its effects for Vietnamese economic development, 2016 http://www.global-labour-university.org/fileadmin/GLU_Working_Papers/GLU_WP_No.44.pdf
!

GLU | Economic and Social Upgrading in Auto Global Value Chains in South Africa
72
No.45 Devan Pillay and Michelle Williams; Rekindling the utopian imagination: Intellectual diversity and the GLU/ICDD network, 2017 http://www.global-labour-university.org/fileadmin/GLU_Working_Papers/GLU_WP_No.45.pdf
No.46 Glynne Williams, Steve Davies, Julius Lamptey and Jonathan Tetteh; Chinese Multinationals: Threat to, or Opportunity for, Trade Unions? The case of SINOHYDRO in Ghana, 2017 http://www.global-labour-university.org/fileadmin/GLU_Working_Papers/GLU_WP_No.46.pdf
No.47 Tandiwe Gross and Amar Kharate; Organizing the invisible – strategies of informal garment workers in Mumbai’s slum economy, 2017 http://www.global-labour-university.org/fileadmin/GLU_Working_Papers/GLU_WP_No.47.pdf
No.48 Ho Ching Florence Yuen; Development of Wage Dispersion: A Case Study of Hong Kong, 2017 http://www.global-labour-university.org/fileadmin/GLU_Working_Papers/GLU_WP_No.48.pdf
No.49 Aelim Yun; Curbing precarious informal employment: A Case Study of precarious workers in the South Korean construction industry, 2017 http://www.global-labour-university.org/fileadmin/GLU_Working_Papers/GLU_WP_No.49.pdf
No.50 Baba Aye; “NUPENGASSAN” and the struggle against precarious work in the Nigerian oil and gas industry, 2017 http://www.global-labour-university.org/fileadmin/GLU_Working_Papers/GLU_WP_No.50.pdf
No.51 Devan Pillay; Trade union revitalisation in South Africa: Green shoots or false dawns?, 2017 http://www.global-labour-university.org/fileadmin/GLU_Working_Papers/GLU_WP_No.51.pdf
No.52 Ramon A. Certeza; The PALEA Struggle Against Outsourcing and Contractualization in the Airline Industry in the Philippines, 2018 http://www.global-labour-university.org/fileadmin/GLU_Working_Papers/GLU_WP_No.52.pdf
No.53 Hansjörg Herr and Zeynep M. Nettekoven; The Role of Small and Medium-sized Enterprises in Development: What Can be Learned from the German Experience?, 2018 http://www.global-labour-university.org/fileadmin/GLU_Working_Papers/GLU_WP_No.53.pdf
!
GLU | Economic and Social Upgrading in Auto Global Value Chains in South Africa
73
No.54 Marlese von Broembsen and Jenna Harvey; Decent Work for Homeworkers in Global Supply Chains: Existing and Potential Mechanisms for Worker-Centred Governance, 2019 http://www.global-labour-university.org/fileadmin/GLU_Working_Papers/GLU_WP_No.54.pdf
No.55 Edlira Xhafa; Organising against all odds: Precarious workers as ‘actors and authors of their own drama’, 2019 http://www.global-labour-university.org/fileadmin/GLU_Working_Papers/GLU_WP_No.55.pdf
No.56 Gaye Yılmaz and Diyar Erdoğan; Anatomy of a refugee workshop: Syrian labourers in Istanbul, 2019 http://www.global-labour-university.org/fileadmin/GLU_Working_Papers/GLU_WP_No.56.pdf
No.57 Bishnu Rimal; Curbing precarious informal Employment and bonded Labour in the Agriculture Sector of Nepal: GEFONT's Initiative to liberate Kamaiyas, 2019 http://www.global-labour-university.org/fileadmin/GLU_Working_Papers/GLU_WP_No.57.pdf
No.58 Alex M Mashilo; Auto production in South Africa and components manufacturing in Gauteng Province, 2019 http://www.global-labour-university.org/fileadmin/GLU_Working_Papers/GLU_WP_No.58.pdf

ISSN 1866-0541
Global Labour University c/o Bureau for Workers’ Activities International Labour OfficeRoute des Morillons 4CH- 1211 Geneva 22Switzerland
www.global-labour-university.org