Auto-Oil II Cost-effectiveness Study Part I: Introduction ... · Auto-Oil II Cost-Effectiveness...
35
Auto-Oil II Cost-effectiveness Study Part I: Introduction and Overview Draft Final Report Presented to Working Group 7 August 1999 by the European Commission, Standard & Poor’s DRI and K.U. Leuven
Transcript of Auto-Oil II Cost-effectiveness Study Part I: Introduction ... · Auto-Oil II Cost-Effectiveness...
Auto-Oil II Cost-effectiveness StudyPart I: Introduction and Overview
Draft Final Report
Presented to Working Group 7
August 1999
by
the European Commission, Standard & Poor’s DRI and K.U. Leuven

Contents
FOREWORD ......................................................................................... 1
1. INTRODUCTION ............................................................................ 3
2. HISTORY OF THE EUROPEAN AUTO-OIL PROGRAMME ......... 3
2.1 The First European Auto-Oil Programme.................................... 32.2 The Second European Auto Oil Programme............................... 5
3. OVERVIEW OF THE AUTO-OIL II PROGRAMME........................ 9
3.1 The organisational structure........................................................ 93.2 The methodology ...................................................................... 103.3 The Scope................................................................................. 16
4. THE AOPII COST-EFFECTIVENESS ANALYSIS ....................... 20
4.1 Composition of the Working Group ........................................... 214.2 Objectives of the Working Group .............................................. 214.3 The work programme................................................................ 22
ANNEX A: THE WG7 TERMS OF REFERENCE................................ 26
ANNEX B: EXPERIENCE FROM THE AUTO-OIL I PROGRAMME... 29
ANNEX C: EXPERIENCE FROM THIRD COUNTRIES...................... 31

Auto-Oil II Cost-Effectiveness Study Part I: Introduction and Overview
ii European Commission, Standard & Poor’s DRI – KULeuven, August 1999Draft Final report
Tables and ChartsFigure 1: Organisational structure of AOP II .................................................... 9Figure 2: Overview of the AOP II methodology.............................................. 12Table 1: Air emissions and concentrations covered in Auto-Oil II .................. 17Table 1: Auto-Oil II Cities and Countries ....................................................... 18Table 3: AOPII source categories.................................................................. 19Table 4: AOPII Vehicle Categories................................................................ 19Table 5: Source Categories covered in the AOP II City Inventories............... 20Figure 3: Overview of the Cost-Effectiveness work programme .................... 23

Auto-Oil II Cost-Effectiveness Study Part I: Introduction and Overview
European Commission, Standard & Poor’s DRI – KULeuven, August 1999 1Draft Final report
ForewordWhilst the need for integrated analysis is often quoted by many stakeholdersinvolved in environmental policy making, putting the ideas in practice is muchharder. The Auto-Oil Programme is correctly considered to be one of thepioneering programmes in applying integrated analysis. However, whenembarking on the second stage of the Auto-Oil Programme, numerous andoften heated debates were held before coming to an acceptable consensus interms of methodology, analytical tools and data requirements. Indeed,integration means considering many views from a wide range of experts. It alsomeans consolidating different jargon, different priorities, and data which varyin quality. In addition, a commitment to the principles of shared responsibility,sound science and transparency, deadlines often need to be downgraded inimportance to ensure the necessary buy-in of stakeholders.
Having established the methodology, the analytical tools and the transport basecase (or reference scenario), the next step is to analyse the cost-effectiveness ofpolicy scenarios for tackling future air quality problems, and to update thisreport accordingly. At the same time, we remain committed to enhance themethodology and data whenever appropriate and feasible.
This report, released in August 1999, is to form the basis for the final reportfrom the cost-effectiveness analysis group (WG7) to be presented towards theend of AOPII. It includes a comprehensive account of the work undertaken inWG7 to date. The report also incorporates most reports and notes discussed inWG7 so far. The report includes the final transport base case run finalised inJune 1999 by the WG7 consultants after having modified previous versions toaccount for the final comments of the working group members in the spring of1999. The report aims to take account of the many views expressed around theWG7 table, including some views expressed outside the scope of the cost-effectiveness working group, for example those expressed by the EuropeanParliament prior to the adoption of the AOP I Directives (containing themandate of AOP II).
Given the amount of work undertaken so far and the time available for detailedreporting, it is acknowledged that there is still ample scope to improve thequality and consistency of this report. Therefore, editorial comments andsuggestions from WG7 members are welcomed by the chair in view ofincreasing the accessibility of the report to outsiders whilst preparing the finalreport due end 1999. An executive summary will be added then which willalso account for any remaining differences of opinion to support the longer-term work.
Finally, the results presented to date are the result of months of intense workand collaboration among the many members of the AOP II working groups.This could not be achieved without the competence and commitment of a largenumber of people. We are particularly indebted to the experts of Standard &Poor’s-DRI (DRI) and the University of Leuven (KUL) for carrying-out adifficult task in the most transparent way possible. Our appreciation goes toAlain Henry (DRI), Stef Proost (KUL), Elisabeth Waelbroeck Rocha (DRI),Marjolein Jansen (KUL), Sylvie Demeulenaere, and Silvia Pariente-David(DRI). We are equally grateful to all the members of the cost-effectiveness
Auto-Oil II Cost-Effectiveness Study Part I: Introduction and Overview
2 European Commission, Standard & Poor’s DRI – KULeuven, August 1999Draft Final report
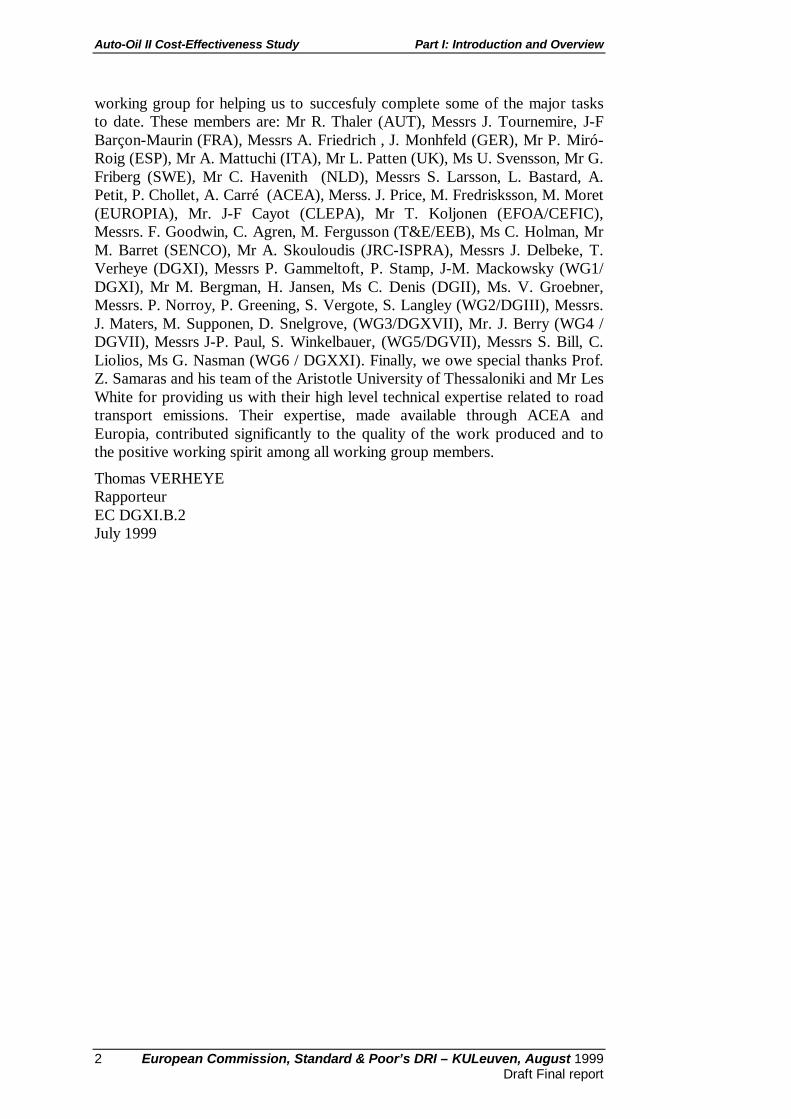
working group for helping us to succesfuly complete some of the major tasksto date. These members are: Mr R. Thaler (AUT), Messrs J. Tournemire, J-FBarçon-Maurin (FRA), Messrs A. Friedrich , J. Monhfeld (GER), Mr P. Miró-Roig (ESP), Mr A. Mattuchi (ITA), Mr L. Patten (UK), Ms U. Svensson, Mr G.Friberg (SWE), Mr C. Havenith (NLD), Messrs S. Larsson, L. Bastard, A.Petit, P. Chollet, A. Carré (ACEA), Merss. J. Price, M. Fredrisksson, M. Moret(EUROPIA), Mr. J-F Cayot (CLEPA), Mr T. Koljonen (EFOA/CEFIC),Messrs. F. Goodwin, C. Agren, M. Fergusson (T&E/EEB), Ms C. Holman, MrM. Barret (SENCO), Mr A. Skouloudis (JRC-ISPRA), Messrs J. Delbeke, T.Verheye (DGXI), Messrs P. Gammeltoft, P. Stamp, J-M. Mackowsky (WG1/DGXI), Mr M. Bergman, H. Jansen, Ms C. Denis (DGII), Ms. V. Groebner,Messrs. P. Norroy, P. Greening, S. Vergote, S. Langley (WG2/DGIII), Messrs.J. Maters, M. Supponen, D. Snelgrove, (WG3/DGXVII), Mr. J. Berry (WG4 /DGVII), Messrs J-P. Paul, S. Winkelbauer, (WG5/DGVII), Messrs S. Bill, C.Liolios, Ms G. Nasman (WG6 / DGXXI). Finally, we owe special thanks Prof.Z. Samaras and his team of the Aristotle University of Thessaloniki and Mr LesWhite for providing us with their high level technical expertise related to roadtransport emissions. Their expertise, made available through ACEA andEuropia, contributed significantly to the quality of the work produced and tothe positive working spirit among all working group members.
Thomas VERHEYERapporteurEC DGXI.B.2July 1999

Auto-Oil II Cost-Effectiveness Study Part I: Introduction and Overview
European Commission, Standard & Poor’s DRI – KULeuven, August 1999 3Draft Final report
1. IntroductionThis part of the cost-effectiveness study report provides general background forthe cost-effectiveness analysis carried out in the context of the SecondEuropean Auto-Oil Programme (AOP II).
Chapter 2 includes a brief history of the European Auto-Oil Programme andthe mandate for AOPII. Chapter 3 provides a summary of the organisationalstructure of AOPII and an overview of the methodology and scope. Chapter 4describes composition and objectives of the AOPII cost-effectiveness workinggroup and summarises the state of play of the work programme established atthe outset of the programme.
Part II of the study report describes the policy simulation tool (TREMOVE)that has been designed and developed to support the AOPII cost-effectivenessanalysis. This tool has also been used to help constructing the referencescenario. Important comments on the current status of the model are includedin the executive summary and annex to Part II.
The reference scenario, i.e. the AOPII transport base case, is described in PartIII of the study report. This base case will be used for analysing alternativetransport policies aimed at further reducing emissions from transport wheneverair quality concentrations do not meet Community standards.
Parts IV through VI are still being developed and currently representpreliminary draft reports.
Part IV of the AOPII Cost-effectiveness study report currently contains adescription of a limited number of scenarios that have been constructed to testthe TREMOVE model. A discussion on these scenarios has not yet taken placeand is scheduled for the second half of 1999. Part IV will be further developedwhen future policy scenarios have been provided by the other AOPII workinggroups and when the input data have been transferred to the cost-effectivenessworking group. This part will also include a description of other than road-transport policy options, which will have to be considered simultaneously.
Part V of the report contains a draft description of the optimisation tool(LEUVEN II) that has been developed to assist the search for future cost-effective strategies for achieving Community air quality standards.
The conclusion of the cost-effectiveness analysis will be summarised in Part VIof the report. An overall executive summary will be developed in parallel.
2. History of the European Auto-Oil programme
2.1 The First European Auto-Oil Programme
Directive 70/220/EEC was the first directive to lay down emission limits forpassenger cars1. Since then, subsequent amendments to Directive 70/220/EECand the adoption of legislation for light commercial2 and heavy duty3 vehicles 1 Directive 70/220/EEC; OJ No. L76, 06.04.1970, p.12 Directive 93/59/EEC; OJ No. L 186, 28.07.1993, p.21
Auto-Oil II Cost-Effectiveness Study Part I: Introduction and Overview
4 European Commission, Standard & Poor’s DRI – KULeuven, August 1999Draft Final report
have strengthened and extended Community policy in this area. WhenDirective 70/220/EEC was again amended by the adoption of Directive94/12/EC in 1994 it was estimated that emissions of regulated pollutants wouldbe reduced by over 90% by 1996/97 compared their levels in the early 1970’s.
However, whilst preparing for that directive, it was concluded that the overallincrease of traffic volumes was overtaking the considerable technicalachievements and that further action would be needed to achieve future airquality objectives. It then being apparent that the emission reduction potentialoffered by further improvements in vehicle technology was possibly limitedand very costly in comparison with other potential solutions, the pursuit offuture air quality objectives necessitated a reassessment of the existing policyapproach. Hence, the European Commission organised a conference in October1992 with the interested parties to discuss the issue of vehicle emissionstandards for the year 2000 and beyond. The major conclusion of thisconference was that future emission standards should be based on acomprehensive and integrated approach. Subsequently, a technical workprogramme was initiated at the end of 1992 to provide a solid foundation uponwhich to base its future legislative proposals.
In accordance with the principle of ‘shared responsibility’ (cf. The 5thEnvironmental Action Programme), the Commission invited the Europeanautomobile and oil industries to collaborate in the realisation of thisprogramme, which became known as the Auto-Oil Programme (AOP). TheAOP embodied the new approach as outlined in the legislative proposalssubmitted to the Council and Parliament in 1993, and reflected in Article 4 ofDirective 94/12/EC adopted by Council in 1994. When proposing emissionstandards to apply from 2000 onwards, the Commission now had to adopts anapproach such that proposed measures:
• were designed to produce effects to meet the requirements of theCommunity’s air quality criteria and related objectives;
• were subjected to a cost-effectiveness assessment, undertaken for eachmeasure, whilst in the global assessment taking account of, inter alia, thepotential contributions from:
• traffic management,• enhanced urban public transport,• new propulsion techniques, and• alternative fuels;
• were proportional and reasonable in the light of the intended objectives.
In other words, the AOP was to provide policy-makers with an objectiveassessment of the most cost-effective measures for reducing emissions from theroad transport sector, to a level consistent with the attainment of the EU airquality standards. The measures examined included vehicle technology, fuelquality, mechanisms for improved durability and the complementary,predominantly non-technical measures mentioned above.
3 Directive 91/542/EEC; OJ No. L 295, 25.10.1991, p.1

Auto-Oil II Cost-Effectiveness Study Part I: Introduction and Overview
European Commission, Standard & Poor’s DRI – KULeuven, August 1999 5Draft Final report
The cost-effectiveness analysis carried-out during the first AOP was reportedin November 1995.4 The outcome of a major research programme on vehicle-fuel quality interactions, resulting from intensive co-operation between theEuropean Motor and Fuel industry was published in the so-called EPEFEreport, i.e. “European Programme on Emissions, Fuels and EngineTechnologies”. The overall AOP report was published by the EuropeanCommission in 1996.5
Simultaneously and as a result of the AOP, the Commission adopted aCommunication in June 1996 on a future strategy for the control of emissionsfrom road transport (COM 96/248), together with several proposals fordirectives. Among these were proposals related to:
• the quality standards for diesel and petrol fuels (96/0163), and• passenger car emissions (96/0164).
Other initiatives have followed on from the AOP, including proposals for:
• tighter emission standards for light commercial vehicles6,• tighter emission standards for heavy-duty vehicles7, and• improved procedures for inspection and maintenance8.
The term “Auto Oil proposals “ is applied indiscriminately to some or all ofthe legislative actions referred to above. However, the term is most frequentlyapplied to the proposals that were adopted together in June 1996.
2.2 The Second European Auto Oil Programme
As part of the above mentioned proposals on passenger cars (96/0164) andpetrol and diesel fuels (96/0163) submitted in June 1996, the Commission setout the basis upon which its future proposals on passenger car emissionstandards and fuel quality standards will be developed. This was to form themandate for a follow-up Programme, referred to as the Auto-Oil II Programme.
The second European Auto Oil Programme (AOPII) was established in thespring of 1997. It was designed to provide the technical input for theCommission’s work on future vehicle emission limit values, fuel qualitystandards and related measures. It was specifically intended to satisfy therequirements of Articles 3 and 9 of the proposed Directives, which establishedthe mandate for AOPII. These articles referred to the need to come forward
4 A cost-effectiveness study of the various measures that are likely to reduce pollutantemissions from road vehicles for the year 2010, Commission of the European Communities,Directorate General III –Industry division III E5, Automobiles and other road users and ToucheRoss Management Consultants, Final Report, November 1995.5 The European Auto Oil Programme, Directorate Generals for Industry; Energy; andEnvironment, Civil Protection and Nuclear Safety, European Commission, 1996 (XI/361/96)6 Subsequently merged with the proposal 96/0164 and adopted by the Commission in February1997.7 COM (99) 89, adopted by the Commission on December 3, 19978 Proposal for a Council Directive on the roadside inspection of the roadworthiness ofcommercial vehicles circulating in the Community (COM/98/0117 final, O.J. C 190, dd.18/06/1998).

Auto-Oil II Cost-Effectiveness Study Part I: Introduction and Overview
6 European Commission, Standard & Poor’s DRI – KULeuven, August 1999Draft Final report
with an updated strategy to meet the requirements of the Community air qualitystandards and related objectives by 2010 at least cost. In particular, theCommission was required to submit proposals for a further tightening of thestandards, confirming or amending the indicative values for the year 2005.
The AOPII mandate, however, was amended several times as the proposalswere discussed in the European Council and Parliament. The first amendmentwas defined mid 1998 after the Council had agreed a common position, takingaccount of the amendments proposed by the European Parliament.
At the time, the amended mandate9 specified that the Commission [was] topropose a further tightening of the emission standards for motor vehicles andquality standards for diesel and petrol fuels no later than 30 June 1999. TheCommission’s proposals [had] to be based on a revised and enhanced versionof the AOP I methodology. The strategy put forward in those proposals [was]to be designed in such a way as to meet the requirements of the Community airquality standards and related objectives10 at the least possible cost. Thestrategy [was] also to be consistent with the objectives laid down in theCommunity strategy to reduce CO2 emissions from passenger cars11 andimprove fuel quality, and [was] to take account, as far as possible, of:
− trends in air quality towards the year 2010 and beyond;
− noxious pollutant emissions in Europe from transport and non-transportsources, and an estimate of the contribution that existing and pending andpotential emission reduction measures from all sources could make toimprove air quality;
− technical developments with regard to vehicle technologies as well as newpropulsion technologies (e.g. electric propulsion, fuel cells) and theirmarket potential;
− refinery technologies;
− the potential for reducing vehicle emissions by the use of alternative fuelssuch as natural gas (CNG), liquefied petroleum gas (LPG), dimethyl ether(DME) and biofuels, including the distribution systems needed for theirapplication;
− possible improvements in the test procedures, in particular measurementmethods for particulates and consideration of extending durabilityprovisions12;
− the potential and feasibility of technical, non-technical and local measures toreduce vehicle emissions; in this context the contribution of transport andother policy measures such as traffic management, urban public transport,
9 As amended; relevant amendments are indicated in italics.10 In particular the deadlines laid down for the attainment of these objectives, for example onacidification and eutrophication.11 As laid down in the Council conclusions of 25 June 1996.12 The addition of a new test procedure at low temperatures, originally included in the AOP IImandate, has now been incorporated in the AOP I proposals, as amended.

Auto-Oil II Cost-Effectiveness Study Part I: Introduction and Overview
European Commission, Standard & Poor’s DRI – KULeuven, August 1999 7Draft Final report
enhanced inspection and maintenance and vehicle scrapping schemesshould be evaluated;
− the particular situation of captive fleets and the potential for emissionreductions related to the use by such fleets of fuels with very stringentenvironmental specifications;
− the potential emission reductions to be gained from fixing the environmentalspecifications of fuels to be used in agricultural tractors as covered byDirective 74/150/EEC and in internal combustion engines to be installed innon-road mobile machinery as covered by a future Directive;
− the contribution that selective and differentiated fiscal measures could maketo reducing vehicle emissions, without any negative impact on thefunctioning of the internal market, taking into account the effects of revenuelosses on neighbouring countries;
− the effects of any such measures on CO2 emissions;
− the strategies followed by relevant third countries to improve air quality andthe emission limit values and environmental fuel specifications envisaged inthose strategies;
− the supply situation and qualities of crude oil available to the Community.
The Commission’s proposal [was] to contain, inter alia, mandatory emissionlimit values to be applied from 1 January 2005, confirming or amending theindicative limit values in the proposed directives 96/0163 and 096/0164. Inaddition, the proposal [was] to establish whether the framework under whichMember States can make provision for tax incentives should be revised.13
Based on the amended articles, and to focus the work in the context of theAOPII cost-effectiveness analysis, the objectives of the Programme weredefined by the members of the cost-effectiveness analysis group as follows:
The objective of AOP II is to develop a revised and enhanced methodology forthe integrated assessment of measures to reduce noxious pollutant emissions inthe Community from road transport and other sources. This is to provide atechnical input for the development of further proposals on vehicle emissionstandards, fuel quality standards and other measures in the context of a strategydesigned to produce effects to meet the requirements of the Community airquality standards and related objectives at least possible cost. Based on theinsights that are gained regarding the relative cost-effectiveness of othermeasures, the Commission will also consider the need for proposals additionalto those concerning vehicle emissions and fuel quality.
In the event, however, the directives adopted in October 1998 by the Counciland European Parliament, containing the package of measures on fuels14 andpassenger car and light commercial vehicles15 as well as the final AOPII 13 Established in Directive 70/220/EEC, as amended by the proposed Directive 96/0164.14 Directive 98/70/EC of the European Parliament and of the Council relating to the quality ofpetrol and diesel fuels and amending Council Directive 93/12/EEC.15 Directive 98/69/EC of the European Parliament and of the Council relating to measures to betaken against air pollution by emissions from motor vehicles and amending Council Directive70/220/EEC.
Auto-Oil II Cost-Effectiveness Study Part I: Introduction and Overview
8 European Commission, Standard & Poor’s DRI – KULeuven, August 1999Draft Final report
mandate, went further than anticipated and settled many, though not all, of the2005 standards. The package included:
• A two-step tightening of vehicle emission limit values for passenger carsand light commercial vehicles, with the first step in the year 2000 and thesecond step in 2005;
• New environmental specifications for petrol and diesel fuels to take effectfrom the year 2000; very low sulphur fuels to be mandatory from 2005;
• Provision made for earlier phase-in of very low sulphur fuels (2005specifications);
• Leaded fuels to be phased out by 2000 (though with the possibility ofderogation up to 2005);
• The need for proposals to be brought forward by the Commission forfurther complementing measures to take effect from 2005.
As a result, revised terms of reference for AOPII were issued in autumn 1998.These contained two principal aims:
• To complete the work which is being done under Auto-Oil II to assessfuture air quality and establish a consistent framework within whichdifferent policy options to reduce emissions can be assessed using theprinciples of cost effectiveness, sound science and transparency; and
• To provide a foundation (in terms of data and modelling tools) for thetransition towards longer-term air quality studies covering all emissionsources.
Within this new, relatively wide remit, there was a specific need to provide theanalytical foundation for a limited set of Community measures which wouldtake effect from around 2005 and would complement those specificationswhich were already fixed in the Auto-Oil I conciliation process. These newmeasures could include:
• environmental specifications for two and three wheeled vehicles;• environmental specifications for heavy duty vehicles;• Community provisions for improved roadworthiness testing;• environmental specifications for petrol and diesel fuels complementing the
mandatory specifications for sulphur and aromatics;• specifications for fuels used by captive fleets; and• environmental specifications for liquid petroleum gas, natural gas and bio-
fuels.
Whereas the short-term needs to evaluate additional vehicle technologies werelimited for the time being, the revised terms of reference did not, however, alterthe need to evaluate the potential of other predominantly non-technicalmeasures. Thus, from a methodological perspective, the overall objectives ofAOPII described above remains more or less unchanged, although the scope ofthe Programme, in particular the balance of efforts between the respectivemeasures that need to be analysed, has been modified.

Auto-Oil II Cost-Effectiveness Study Part I: Introduction and Overview
European Commission, Standard & Poor’s DRI – KULeuven, August 1999 9Draft Final report
3. Overview of the Auto-Oil II ProgrammeIn order to achieve the AOP II objectives, the Commission developed anorganisational structure and a draft work programme that was presented fordiscussion to the stakeholders in January 1997.16 This chapter provides anoverview of the organisational set-up of AOPII, the overall methodology andthe scope.
3.1 The organisational structure
In order to design and implement AOPII, a number of Commission servicesstarted to draft a preliminary work programme and organisational structure inthe second half of 1996.
In January 1997, the Commission again invited the AOP stakeholders andproposed an organisational structure for discussion. The intention also was toextend the stakeholder dialogue. Therefore, not only the vehicle manufacturingand refining industries but also the Member States, NGOs and other expertswere invited. The organisational structure, subsequently agreed in the spring of1997, is shown in Figure 1.
FIGURE 1: ORGANISATIONAL STRUCTURE OF AOP II
Management GroupEC Inter-service Management Group
Co-ordination
Contact GroupJoint MS, Industry, NGO
Information Dessimination
Member StatesExperts
IndustryExperts
NGOsExperts
7 Working GroupsExpert Level
Director GeneralsIndustry, Transport, Energy, Environment
Seven working groups have been established, each of which are operating onthe basis of its individual terms of reference. Each working group is formed ofa number of experts nominated by the stakeholders and chaired by aCommission official.17 These working groups are:
• environmental objectives (WG1 / DGXI),• vehicle technologies (WG2 / DGIII),• fuel quality and alternative fuels (WG3 / DGXVII),• inspection and maintenance (WG4 / DGVII),• non-technical measures (WG5 / DGVII), 16 Whereas in the first AOP (AOP I) the European automobile and oil industries formed themain players along with the Commission, the numbers of stakeholders in AOP II has beenextended to include several Member States, related industries and NGOs.17 For an accurate and detailed account of the respective responsibilities, see the discussionpapers prepared by the respective working groups.
Auto-Oil II Cost-Effectiveness Study Part I: Introduction and Overview
10 European Commission, Standard & Poor’s DRI – KULeuven, August 1999Draft Final report
• fiscal measures (WG6 /DGXXI), and• cost-effectiveness analysis(WG7 / DGXI).
The work of the seven working groups is co-ordinated by the Commission’sManagement Group18 and reported to a contact group19. In a number of casessub-groups were also created to tackle particular issues and provide technicaladvice. These included sub-groups on: urban air quality modelling andmeasures related to other than road transport sources (WG1), and fuels/vehiclesinteractions and EPEFE equations (WG2/3).
Direct information exchanges with the AOPII cities are organised through acity contact group hosted by the Commission’s Joint Research Centre in Ispra.The Commission’s JRC based in Petten and the European EnvironmentAgency have also been involved in the work of the working groups.
Following the final amendment of the AOPII mandate and the drafting of therevised terms of reference mentioned above, it was agreed not to change theorganisational structure of the Programme so as to avoid on overlyadministrative burden. Instead, it was decided to reduce the number ofmeetings and to rely more on exchange of information via surface andelectronic mail. Some groups, merged their activities taking place under AOPIIwith other regular meetings (e.g. WG5 co-ordinated the activities on non-technical measures with the CANTIQUE project, a concerted action in theresearch programme related to the same subject but with a longer timehorizon).
3.2 The methodology
It had become clear from the AOP-I experience that, in order to carry out aproper integrated assessment of future air quality concentrations and potentialemission reduction scenarios across various sources and domains, a goodunderstanding is required of:
• Current air quality concentrations and emission levels;
• The relationship between air quality and emissions taking account ofgeographical and meteorological conditions specific to the domains;
• Available forecasting methodologies and tools for emissions and air qualitytaking account of available historical data; and
18 The management group includes the chairmen and rapporteurs of each of the working groupsand meets as a function of needs. It is to oversee the day to day management of the variousworking groups, to facilitate the interface between the different working groups and to to co-ordinate the administrative details relating to the organisation of meetings and contracts. Itconsists of members from a wide range of Commission Services, including: Industry(Directorate General III), Transport (Directorate General VII), Environment (DirectorateGeneral XI), Energy (Directorate General XVII), and Indirect Taxation (Directorate GeneralXXI. A number of other services were also supporting the activities, including: Economics andFinance (Directorate General DG II), and Research (Directorate General XII)
19 The contact group is chaired by the Commission and serves as a forum where all the interestgroups have the opportunity to discuss issues of general interest and to receive and commentupon interim reports and progress reports from the working groups.
Auto-Oil II Cost-Effectiveness Study Part I: Introduction and Overview
European Commission, Standard & Poor’s DRI – KULeuven, August 1999 11Draft Final report
• Current and future technology and socio-economic activity levels.
The methodology developed in the context of the first Auto-Oil Programmecame a long way towards integrating the above mentioned elements. Indeed,compared to previous exercises, the complexity of the methodology hadalready increased significantly –a price to pay if one wanted to stick to theprinciples of sound science, shared responsibility and transparency. Althoughthis methodology was very comprehensive, it was felt, however, that it was tosome extent biased towards the analysis of technical command-and-controlmeasures and not sufficiently suited to analyse these measures at an equalfooting with market-based instruments.
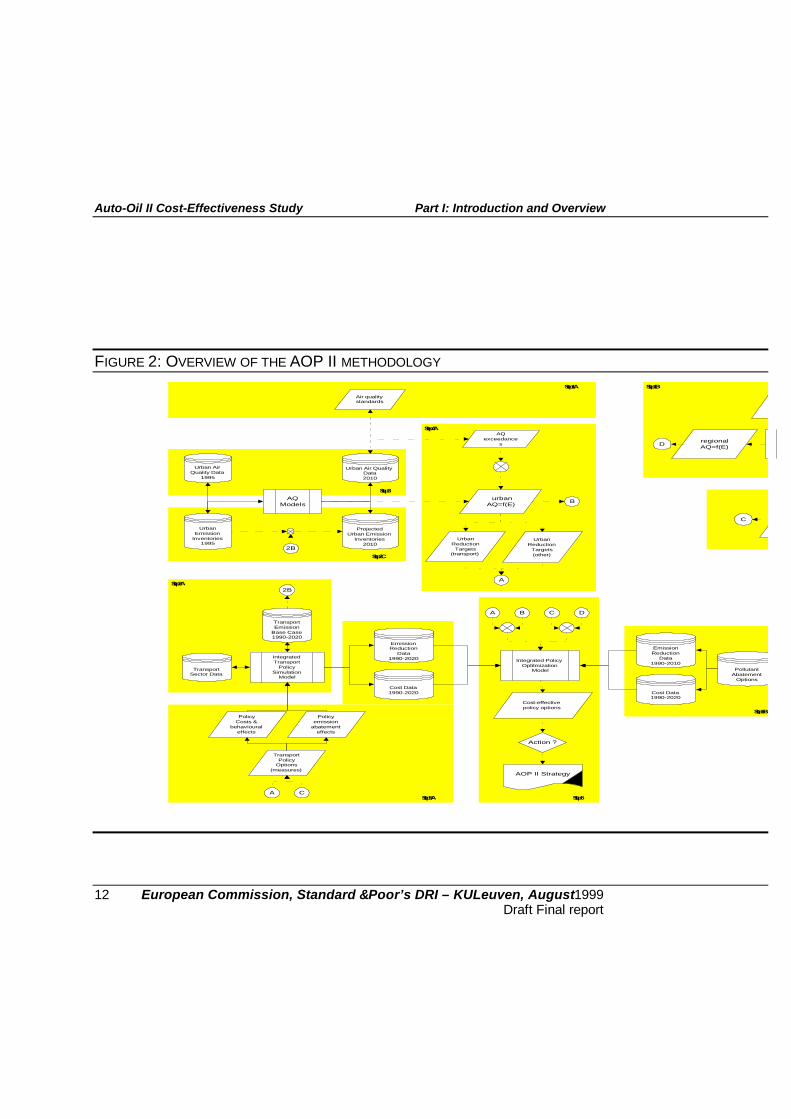
Hence, when designing the AOPII methodology, the aim was to build on theapproach of the first programme but improving it where possible. The approachtaken in AOPII was discussed intensely and developed within the context ofthe cost-effectiveness analysis and environmental objectives working groups,in close co-operation with other working groups and co-ordinated by theCommission’s Management Group. The methodology has also been developedover time to reflect the amendments made to the AOPII mandate (see above),the progress being made within the respective AOPII working groups, and theresources available. To some to some extent it may still be subject to changesas some stages still need to be implemented. The current methodology ispresented in Figure 2.20
20 The main symbols used in Figure 2 are explained as follows: drums refer to databases,circles are connectors, crossed circles refer either to “and” or “or”; rectangles with vertical barsrefer to models, a parallelogram refers to data in the broad sense, a rectangle with a curvedbaseline refers to a report.
Auto-Oil II Cost-Effectiveness Study Part I: Introduction and Overview
12 European Commission, Standard & Poor’s DRI – KULeuven, August 1999Draft Final report
FIGURE 2: OVERVIEW OF THE AOP II METHODOLOGY
Step 6Step 5A
Step 5B
Step 2A
Step 4A
Step 1B
Step 3
Step 2 C
Step 1A
Air qualitystandards
UrbanEmission
Inventories1995
Urban AirQuality Data
1995
AQModels
UrbanReductionTargets
(transport)
urbanAQ=f(E)
IntegratedTransport
PolicySimulation
Model
TransportEmission
Base Case1990-2020
Cost Data1990-2020
TransportPolicy
Options(measures)
Integrated PolicyOptilmization
Model
Cost-effectivepolicy options
Action ?
AOP II Strategy
TransportSector Data
PolicyCosts &
behaviouraleffects
Policyemission
abatementeffects
Urban Air QualityData2010
ProjectedUrban Emission
Inventories2010
EmissionReduction
Data1990-2020
AQexceedance
s
UrbanReduction
Targets(other)
Cost Data1990-2020
EmissionReduction
Data1990-2010
PollutantAbatement
Options
A
C
B
A B C D
2B
2B
A C
regionalAQ=f(E)D

Auto-Oil II Cost-Effectiveness Study Part I: Introduction and Overview
European Commission, Standard & Poor’s DRI – KULeuven, August 1999 13Draft Final report
The scheme presented in Figure 2 above is best be described as a series ofsteps. Also, in practice, there are many more interfaces than what can be shownhere.21
Step 1: Identify environmental objectives.
This step belongs to the domain of the environmental objectives working group(WG1) and relates to the definition of air quality standards (step 1A), whilstalso considering regional ozone and acidification objectives (step 1B). The linkto ozone is needed because of its emission precursors (e.g. NOx emission affectNO2 concentrations but also cause ozone formation).
Rather than fully integrating the forecasting of ozone and acidificationformation into AOPII, maximum use is made of the analysis carried out in thecontext of the work on the proposed directive for national emission ceilings,recently finalised by the Commission. For example, as shown in Figure 2, thenational emission ceilings established in the context of the Community ozoneand acidification strategy are being compared to the AOPII emissioninventories to derive regional emission reduction targets for NOx and VOCs tobe considered alongside with local emission reduction targets. The targetsestablished in WG1 are subsequently used in the cost-effectiveness analysisworking group (WG7) to evaluate the effectiveness of proposed policy options(see step 6). An alternative to using emission reduction targets, would be toincorporate the so-called blame matrices describing the (complex) relationbetween ozone precursors and concentration directly in the AOPII optimizationtool.22
Step 2: Forecast base case trends in emissions of all pollutants.
This step belongs mainly to the domain of WG1 but requires the involvementof all working groups in order to achieve a consistent level of analysis whenconsidering future reduction options. Indeed, forecasting emission levels alsorequires account to be taken of changes in technology and activity levels and ofthe impact of current and expected legislation; It is important to note that theAOPII base case has been developed at three levels which are subsequentlylinked to maintain the necessary coherence. The three levels are often referredto as the transport base case (step 2A, mainly managed by the cost-effectiveness working group (WG7) in close co-operation with all othergroups), the overall base case (step 2B, which covers all sectors, including thetransport and the other than transport sources, and is managed by WG1 insupport of the air quality modelling), and the city emission inventories (step2C, including detailed a spatial emission base case directly supporting the airquality modelling). More explanation is provided in Part III of the AOPII Cost-effectiveness study report.
Step 3: Forecast future air quality.
21 In an ideal world these steps might be carried out sequentially though with the small risk thatby the time the programme had reached the reporting stage the early steps might need to berepeated. In practice most of the above steps were carried out simultaneously.22 The latter option may be tested on an experimental basis towards the end of the AOPIIprogramme, in view of developing future analytical tools.
Auto-Oil II Cost-Effectiveness Study Part I: Introduction and Overview
14 European Commission, Standard & Poor’s DRI – KULeuven, August 1999Draft Final report
This step also belongs to the domain of WG1 supported by JRC-Ispra and theEEA, and relates to the air quality modelling at urban and regional scale, usingseveral meteorological and air quality models, observed historical air qualitydata historical and projected emission inventories. (Historical emissioninventories are projected using indices calculated in step 2.)
Step 4: Establish emission reduction targets
Having established detailed emission inventories (step 2) and forecasted airquality concentrations (step 3), these predicted concentrations (for 2010 andbeyond) now need to be compared against the selected air quality standards(step 1). Where exceedances are predicted, compatible emission reductiontargets need to be established. This is not a trivial exercise as concentrationsare affected by many parameters, including geographical and meteorologicalconditions, timing, location and heights of emissions, etc. In addition, somepollutant concentrations have several precursors and trade-offs betweenrespective precursor reductions need to be accounted for in order not togenerate reverse effects.
At this time, the current knowledge about the relation between emissions andair quality, is used to establish urban and/or regional emission reduction targetsfor all pollutants (connector A in step 4A and C in step 4B), whilstdifferentiating between transport sources (emitted at ground level and withinthe urban area) and other sources (often emitted at higher levels and outside theurban boundaries). These targets are subsequently used to design appropriatepolicy options (step 5), and to assess their cost-effectiveness (step 6).
Ideally, as mentioned above, the proper (often non-linear) relations betweenemissions and concentrations would be fully described based on the air qualityanalysis through so-called air quality functions. These would then beincorporated in the optimisation model used in step 6 to directly assess whetherair quality (rather than emission reduction) targets are achieved. This step (seeconnector B from step 4A to 6) may be introduced on an experimental basispending a better understanding of the nature of these relations.
Step 5: Identify policy options
Having indicated the remaining future air quality problems and havingquantified compatible emission reduction targets, appiopriate policy optionscan now be identified related to the transport sector (connector A in step 5A) orother sectors (connector A step 5B). Step 5A is the domain of the AOPIIworking groups dealing with vehicle technology (WG2), fuel quality (WG3),inspection and maintenance (WG4), transport demand management and othernon-technical measures (WG5), and fiscal measures (WG6). Step 5B, related topolicy options for the non-transport sector is the domain of a WG1 subgroup.
All groups are responsible for identifying a range of policy option and forcollecting data on costs, changes in activity levels as a result of proposedmeasures and anticipated emission reduction effects. These data are thenforwarded to the cost-effectiveness working group which has developed theanalytical framework and modelling tools for assessing the wide range ofmeasures on an equal footing. However, while AOPII extended the analysisfrom transport policy options to options in other sectors, the policy simulationtools have been developed mainly for the transport sector. Policy options for
Auto-Oil II Cost-Effectiveness Study Part I: Introduction and Overview
European Commission, Standard & Poor’s DRI – KULeuven, August 1999 15Draft Final report
other sectors are currently collected from existing sources (mainly from theozone and acidification studies) and are likely to be focussed on technicalsolutions only at this time.
Step 6: Carry out cost-effectiveness analysis of potential measures
This step is the domain of the cost-effectiveness analysis working group(WG7). At this stage, all information collected in the previous steps is to beused in an integrated assessment. Two analytical tools have been developed forthis purpose, i.e. a transport policy simulation tool (TREMOVE) and anoptimisation tool (LEUVEN). The bulk of the analysis is centred on theTREMOVE model which allows to analyse technical and market basedsolutions on an equal footing. For each country considered, policy options canbe defined at the level of a sample city, the other urban areas as a whole, thenon-urban areas or the country as a whole. A European assessment is done byconsidering all countries (or areas) simultaneously. The common costdenominator used in TREMOVE is the total cost to society (i.e., the transportusers, service providers and government). TREMOVE also allows forcalculation of direct and induced emission reduction effects. The latter mayoccur when policy options significantly upset the price structure of currentlyused transport modes (including non-motorised, road, rail and waterwaytransport for passengers and/or freight). Part II of the cost-effectiveness studyreport contains further detail about the TREMOVE model. TREMOVE hasalso been used to help constructing the transport base case as explained in step223.
LEUVEN II is an optimisation tool that is used to help select cost-effectivesolutions, taking account of the environmental targets (connector A in step 4A,C in step 4B) which can differ by geographical domain (e.g. different cities ordifferent countries). It is thus a tool that also helps to assess to what extentCommunity policies are warranted and when “subsidiarity” may provide morecost-effective solutions. In this context it should be noted that the tools aredeveloped for a strategic analysis rather then for studying detailed localsolutions. They provide benchmarking capacity for either more detailed ormore aggregated exercises. The methodology is further detailed in thefollowing chapter related to the cost-effectiveness analysis and in otherworking group reports.
Step 7: Report cost-effective measures to achieve air quality standards
Finally, the activities carried-out in the working groups are disseminated,discussed and reported and the conclusions are summarised in an overall reportdescribing future air quality concentrations, standards, and cost-effectivesolutions to achieve air quality standards where remaining exceedances are stillexpected to exist. Individual working groups may also report separately and inmore detail on their activities and conclusions. Given the revised terms ofreference discussed above, and the preliminary results in terms of future airquality exceedances, the bulk of the reporting will concentrate on the tranportbase case following the adoption of the so called AOP-I directives, the relatedair quality predictions and the methodology, analytical tools and databases 23 A discussion on the transport base case is provided in Part III of the AOPII Cost-effectiveness study report
Auto-Oil II Cost-Effectiveness Study Part I: Introduction and Overview
16 European Commission, Standard & Poor’s DRI – KULeuven, August 1999Draft Final report
devloped in the context of AOPII. The latter is required to ensure a propertransition of the AOP activities into the longer term air quality analysis.
3.3 The Scope
This section summarises the scope of AOPII. The focus is mostly on thoseaspects of the scope that are relevant for the environmental and cost-effectiveness analysis, without trying to provide an exhaustive description.More detail can be found in the following chapters, in Part II of the AOPIICost-effectiveness study report describing the TREMOVE model, and in PartIII describing the transport base case. Reference is also made to the reports ofthe other working groups for more specific detail.
The specification of the scope has been developed in parallel with the design ofthe methodology and starts from the guidance found in the AOPII mandate.The outcome of the discussions taking place in WG7, those in other workinggroups, and the debates in the context of the adoption of the AOP-I directiveshave also been accounted for. The decisions taken in WG1 relating to theenvironmental objectives and the air quality modelling have a direct impact onthe scope of the work undertaken in other working groups, and in particularWG7.
Time Horizon
The overall time horizon for AOPII extends from 1990 through 2020 withannual or five-annual intervals. As a general rule, policy measures underconsideration in AOPII would have to be implemented by the year 2005.Environmental standards have to be attained throughout Europe by the year2010 and have to be maintained beyond that date. It has therefore been decidedthat the period under consideration extends until 2020.
Environmental objectives
WG1 has selected a number of pollutants that will need to be assessed inAOPII. These are listed in Table 1 below.
The core emission analysis of AOPII focuses on carbon monoxide, nitrogenoxides, particulate matter, total and non-methane volatile organic compounds,and benzene. These are related to air quality concentration for carbonmonoxide, nitrogen oxide, particulate matter, benzene and ozoneconcentrations which are analysed in the air quality analysis carried out byWG1.
Whenever feasible, other emissions have been included to facilitate the linkwith related exercises and to improve consistency of analysis across Europeanenvironmental programmes. They are, however, not specifically targeted.Depending on the availability of information for the respective activity areas,these emissions include sulphur dioxide (acidification), carbon dioxide, andmethane (climate change), and particulate matter other than from dieselengines. Also, where data is available, the possible effects of AOPII scenarioson emissions for 1,3 butadiene and PAHs and particulates smaller than PM10
will be accounted for. As the base case for the second category of emissions isnot being used in the air quality modelling, and not central to the objective ofAOPII, it is discussed separately.

Auto-Oil II Cost-Effectiveness Study Part I: Introduction and Overview
European Commission, Standard & Poor’s DRI – KULeuven, August 1999 17Draft Final report
TABLE 1: AIR EMISSIONS AND CONCENTRATIONS COVERED IN AUTO-OIL II
Symbol
WG7
Transport
sector
analysis
WG1
Other
sector
analysis
WG1 air
quality
analysis
CO x x xNOx x x xVOC xNMVOC x x xC6H6 x x xPM10 x x x
CO2 x xSO2 xCH4 xPM-gasoline xPM-exhaust x
CO xN2O xC6H6 xPM10 xO3 xOzone
BenzeneFine particulate material
Air qualityCarbon monoxideNitrogen dioxide
PM (from gasoline)PM (non-exhaust)
Core emissions
Other emissionsFine particulate material (from diesel)
Carbon dioxideSulphur dioxideMethane
Nitrogen oxidesVolatile organic compoundsNon methane VOCBenzene
Pollutants
Carbon monoxide
Geographical scope
Environmental standards apply uniformly throughout Europe. Nevertheless, forpollutants other than regional ozone, the AOPII focuses on a detailed analysisof a number of cities because urban areas are more likely to suffer from airpollution. The geographical domains covered by AOP II are presented inTable 2 below.
The air quality analysis covers 10 European cities that were selected by WG1,inter alia, on the basis of their representativity for urban air pollution and dataavailability. The city of Reggio Emilia has been included within the Milandomain to enable the investigation of the impact of proposed measuresdownwind of a major city. The overall analysis for all sectors covers 15European countries, and 3 non-EU countries. The non-EU countries (i.e.,Estonia, Poland and Switzerland) needed to be included because the air qualitymodelling covers parts of these countries. The transport sector analysis coversa detailed analysis for nine EU countries (including 10 cities and 9 other andnon-urban areas) and cost-effectiveness information can be extrapolated to theother 6 EU countries (only at the national level).

Auto-Oil II Cost-Effectiveness Study Part I: Introduction and Overview
18 European Commission, Standard & Poor’s DRI – KULeuven, August 1999Draft Final report
TABLE 2: AUTO-OIL II CITIES AND COUNTRIES
W G 7
Transport
sector
analysis
WG1 Other
sector
analysis
WG1 a i r
quality
analysis
1 F inland x x1 H e lsinki x x
Other Urban xNon-Urban x
2 France x x2 Lyons x x
Other Urban xNon-Urban x
3 Germany x x3 Berlin x x4 C o logne x x
Other Urban xNon-Urban x
4 Greece x x5 Athens x x
Other Urban xNon-Urban x
5 Ireland x x6 Dublin x x
Other Urban xNon-Urban x
6 Italy x x7 M ilan x x
Regio-Emilia x xOther Urban xNon-Urban x
7 Nether lands, The x x8 U trecht x x
Other Urban xNon-Urban x
8 Spain x x9 Madrid x x
Other Urban xNon-Urban x
9 U n ited Kingdom x x10 London x x
Other Urban xNon-Urban x
10 Austria x x11 Belgium x12 Denmark x13 Luxembourg x14 Por tugal x15 Sweden x
Estonia xPoland xS w itserland x
D o m a i n s
Sectors and source categories
Several source categories are considered in AOPII. The list of sourcecategories considered at the overall level is provided in Table 3. Thesecategories are organised according to the ten main CORINAIR24 anthropogenicsource categories. The equivalent SNAP1 code is presented in a separate
24 CORINAIR is the European Environment Agency’s air emission inventory
Auto-Oil II Cost-Effectiveness Study Part I: Introduction and Overview
European Commission, Standard & Poor’s DRI – KULeuven, August 1999 19Draft Final report
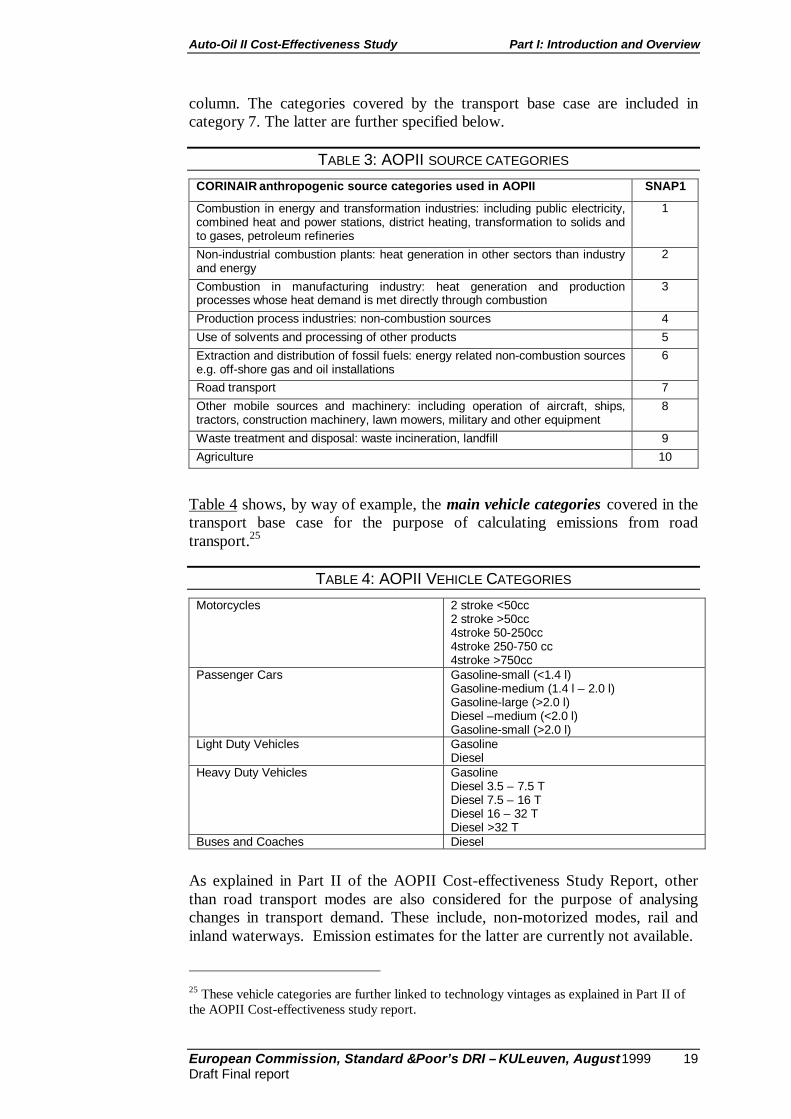
column. The categories covered by the transport base case are included incategory 7. The latter are further specified below.
TABLE 3: AOPII SOURCE CATEGORIES
CORINAIR anthropogenic source categories used in AOPII SNAP1
Combustion in energy and transformation industries: including public electricity,combined heat and power stations, district heating, transformation to solids andto gases, petroleum refineries
1
Non-industrial combustion plants: heat generation in other sectors than industryand energy
2
Combustion in manufacturing industry: heat generation and productionprocesses whose heat demand is met directly through combustion
3
Production process industries: non-combustion sources 4Use of solvents and processing of other products 5Extraction and distribution of fossil fuels: energy related non-combustion sourcese.g. off-shore gas and oil installations
6
Road transport 7Other mobile sources and machinery: including operation of aircraft, ships,tractors, construction machinery, lawn mowers, military and other equipment
8
Waste treatment and disposal: waste incineration, landfill 9Agriculture 10
Table 4 shows, by way of example, the main vehicle categories covered in thetransport base case for the purpose of calculating emissions from roadtransport.25
TABLE 4: AOPII VEHICLE CATEGORIES
Motorcycles 2 stroke <50cc2 stroke >50cc4stroke 50-250cc4stroke 250-750 cc4stroke >750cc
Passenger Cars Gasoline-small (<1.4 l)Gasoline-medium (1.4 l – 2.0 l)Gasoline-large (>2.0 l)Diesel –medium (<2.0 l)Gasoline-small (>2.0 l)
Light Duty Vehicles GasolineDiesel
Heavy Duty Vehicles GasolineDiesel 3.5 – 7.5 TDiesel 7.5 – 16 TDiesel 16 – 32 TDiesel >32 T
Buses and Coaches Diesel
As explained in Part II of the AOPII Cost-effectiveness Study Report, otherthan road transport modes are also considered for the purpose of analysingchanges in transport demand. These include, non-motorized modes, rail andinland waterways. Emission estimates for the latter are currently not available.
25 These vehicle categories are further linked to technology vintages as explained in Part II ofthe AOPII Cost-effectiveness study report.

Auto-Oil II Cost-Effectiveness Study Part I: Introduction and Overview
20 European Commission, Standard & Poor’s DRI – KULeuven, August 1999Draft Final report
Finally, Table 12 shows the source categories covered in the city-emissioninventories. The emissions from road transport vehicles are again distributedaccording to a specific indexing system compatible with the air quality modelsbeing used by WG1. As can be seen, consideration is also given to the height atwhich emissions are released. This is important for determining the properrelation between emissions and air quality concentrations.
TABLE 5: SOURCE CATEGORIES COVERED IN THE AOP II CITY INVENTORIES
AQ-IDX AQ-CODE CORINAIRHEIGHT EMIS (m) NAME OF ACTIVITY1 PCg 7 0 Passenger Cars Gasoline+LPG including evaporative emissions2 PCd 7 0 Passenger Cars Diesel 3 LDV 7 0 Light Duty Vehicles 4 HDV 7 0 Heavy Duty Vehicles 5 Buses 7 0 Buses6 2WV 7 0 Two Wheeled Vehicles, 7 NICP 2 50 Non-Industrial Combustion Plants 8 CMI 3 50 Combustion in Manufacturing Industry 9 SLV 6 50 Solvent and Other Product use10 EDF 5 50 Extraction and distribution of fossil & other Fuels
11 SPS 1 50Combustion in Energy & Transformation Industries <50MW, gas turbines, stationary engines
12 MPS 1 120 Combustion in Energy & Transformation Industries 50-300MW13 LPS 1 Exact or 250Combustion in Energy & Transformation Industries >300MW14 PRO 4 120 Production Process Industries 15 WAS 9 120 Waste Treatment & Disposal
16 OMSM 8 0 Other mobile sources and machinery 17 ARG 10 0 Agriculture18 NAT 11 0 Natural Emissions19 TOT 0-250 Total Sources
20 TRA_(1+2+3+4+5+6) 0 Total Traffic Sources 21 TAREA_(7+8+9+10+11) 50 Total Area Sources22 LAREA_(12+13+14+15) 120-250 Total Large Area Sources23 OSRC_(16+17+18) 0 Other Area Sources
Policy options
The AOPII mandate required an assessment of selected pollutant abatementmeasures for road transport to achieve European environmental standards in2010 at least cost, taking into account the potential of the other sectors. In theshort-run, particular attention has to be paid to complement a number of fuelquality parameters for 2005. With respect to vehicle technologies, the mainfocus in the short-run will be on measures for motor cycles and alternativepropulsion systems for captive and city fleets. A number of outstanding moretechnical issues need to be settled related to vehicle standards such asdurability testing and cold start limit values. The latter are likely to fall outsidescope of the strategic assessment. In any case is the Commission required toassess the potential of so called non-technical measures, including transportdemand and fiscal measures which may be implemented at the local or regionalscale. A more detailed discussion on the AOPII measures that can be assessedis found in Part II of the Cost-effectiveness study report and in Part IV.
4. The AOPII cost-effectiveness analysisAs mentioned in Chapter 2, the cost-effectiveness analysis will be carried-outin working group 7 (WG7) of the Auto-Oil II Programme, assisted by aconsortium of experts contracted by the Commission. Section 1 belowdescribes the composition of WG7. Section 2 summarizes the WG7 objectives

Auto-Oil II Cost-Effectiveness Study Part I: Introduction and Overview
European Commission, Standard & Poor’s DRI – KULeuven, August 1999 21Draft Final report
as defined at the outset of the programme. Section 3 summarises the state ofplay of the work programme.
4.1 Composition of the Working Group
The work done in WG7 is chaired by the Environment Directorate, DGXI.B2(Economic Analysis and Employment Unit). The members of the workinggroup consist of experts from Austria, France, Germany, Italy, the Netherlands,Sweden, Spain, the United Kingdom, ACEA, EUROPIA, CLEPA, EFOA, andT&E.
In August 1997, the Commission contracted an external consultant to assist inthe technical development of the cost-effectiveness analysis and the objectivestudy of the output and formulation of the final results. The study contract hasbeen awarded to a consortium led by DRI, including experts from theKatholieke Universiteit Leuven (KULeuven).
DRI is acting as co-ordinator of the consortium and of other contributors,including consultants from other working groups. In that capacity it isproviding day-to-day assistance and support to the chair of WG7. DRI is takingguidance from, and is directly reporting to, the chair of WG7. Finally, DRI isalso assisting in facilitating the communication of the outcome of the study tothe interested parties.
KULeuven is acting as scientific co-ordinator, assuming responsibility for thedevelopment of the integrated optimisation model and working jointly withDRI on the Transport Model26. KULeuven will also participate in theevaluation and interpretation of the modelling results.
4.2 Objectives of the Working Group
The main objective of WG7 is to provide technical assistance for undertakingan economic analysis of local, regional, or European policy options laid downin the context of the European Auto-Oil Programme. This includes the designand implementation of the necessary tools to support the analysis. Indeed, theaim is to evaluate in an objective and consistent way those pollutant abatementmeasures capable of reducing emissions from road-transport and other sourcesin pursuit of European air quality standards.
The cost-effectiveness analysis carried-out by WG7 heavily relies on the airquality modelling (WG1), and on the input provided by the other workinggroups. Indeed, these working groups will have to deliver the bulk of the dataneeded define, calculate and evaluate the effects and costs of pollutantabatement policy options. To ensure an effective co-ordination between theworking groups, the chair relies on, and closely co-operates with theCommission’s inter-service Management Group and its secretariat, inaccordance with the organisational set-up of the Programme described before.27
26 See Part II of the Cost-effectiveness study report.27 However, WG7 has no mandate to change the terms of reference of the respective workinggroups. Therefore, major changes to the latter, should this be required, have to be taken upwith the Management Group set-up to co-ordinate the overall work programme of the AOP II.
Auto-Oil II Cost-Effectiveness Study Part I: Introduction and Overview
22 European Commission, Standard & Poor’s DRI – KULeuven, August 1999Draft Final report
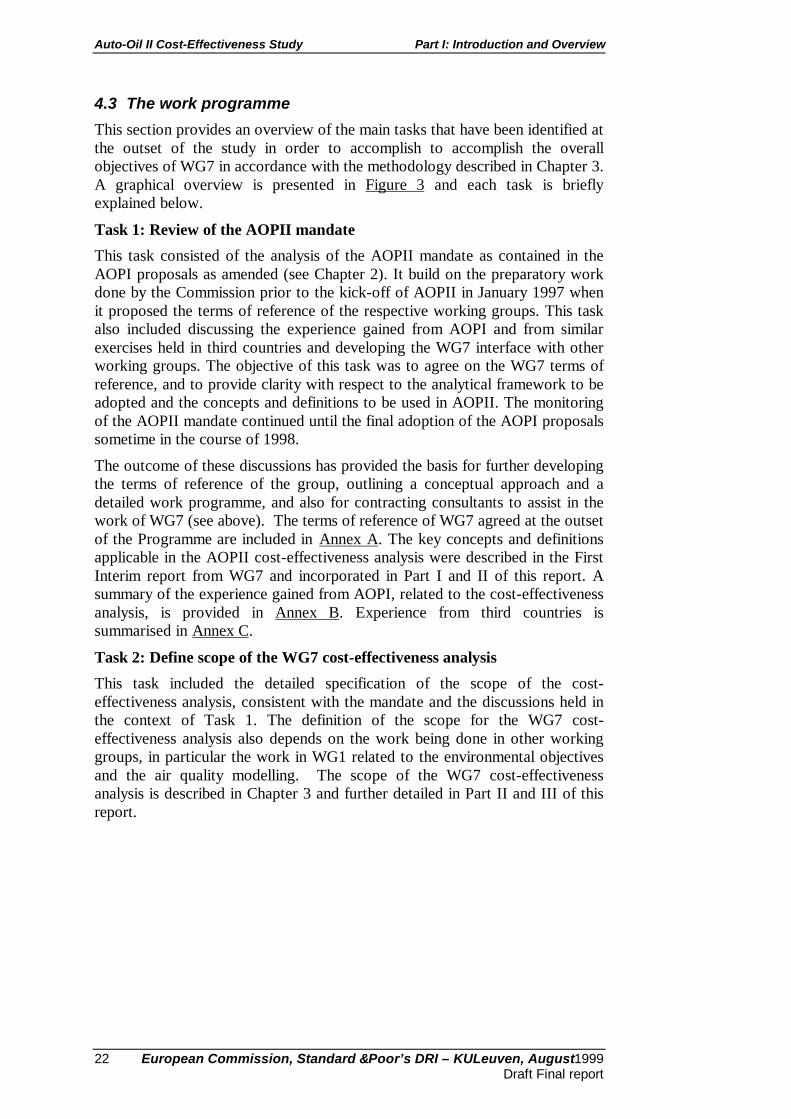
4.3 The work programme
This section provides an overview of the main tasks that have been identified atthe outset of the study in order to accomplish to accomplish the overallobjectives of WG7 in accordance with the methodology described in Chapter 3.A graphical overview is presented in Figure 3 and each task is brieflyexplained below.
Task 1: Review of the AOPII mandate
This task consisted of the analysis of the AOPII mandate as contained in theAOPI proposals as amended (see Chapter 2). It build on the preparatory workdone by the Commission prior to the kick-off of AOPII in January 1997 whenit proposed the terms of reference of the respective working groups. This taskalso included discussing the experience gained from AOPI and from similarexercises held in third countries and developing the WG7 interface with otherworking groups. The objective of this task was to agree on the WG7 terms ofreference, and to provide clarity with respect to the analytical framework to beadopted and the concepts and definitions to be used in AOPII. The monitoringof the AOPII mandate continued until the final adoption of the AOPI proposalssometime in the course of 1998.
The outcome of these discussions has provided the basis for further developingthe terms of reference of the group, outlining a conceptual approach and adetailed work programme, and also for contracting consultants to assist in thework of WG7 (see above). The terms of reference of WG7 agreed at the outsetof the Programme are included in Annex A. The key concepts and definitionsapplicable in the AOPII cost-effectiveness analysis were described in the FirstInterim report from WG7 and incorporated in Part I and II of this report. Asummary of the experience gained from AOPI, related to the cost-effectivenessanalysis, is provided in Annex B. Experience from third countries issummarised in Annex C.
Task 2: Define scope of the WG7 cost-effectiveness analysis
This task included the detailed specification of the scope of the cost-effectiveness analysis, consistent with the mandate and the discussions held inthe context of Task 1. The definition of the scope for the WG7 cost-effectiveness analysis also depends on the work being done in other workinggroups, in particular the work in WG1 related to the environmental objectivesand the air quality modelling. The scope of the WG7 cost-effectivenessanalysis is described in Chapter 3 and further detailed in Part II and III of thisreport.

Auto-Oil II Cost-Effectiveness Study Part I: Introduction and Overview
European Commission, Standard & Poor’s DRI – KULeuven, August 1999 23Draft Final report
FIGURE 3: OVERVIEW OF THE COST-EFFECTIVENESS WORK PROGRAMME
Task 1Review AOPII mandate
Task 2Define detailed scope
Task 4Develop models
Task 3Develop methodology
Task 5Define format for data transfer
Task 6Prepare base case
Task 7Select cost-effective policies
Task 8Test “side effects”
Task 9Conclusions
andRecommendations
other WGs
Task 3: Develop methodology
This task involved outlining a methodology for the cost-effectiveness analysisthat is capable of fulfilling the AOPII mandate, covering the scope identified inTask 2, whilst at the same time being consistent with the concepts anddefinitions identified in Task 1. This task also had to take into account theexperience gained from the AOPI methodology and the need for enhancementswhere appropriate and possible. In this task, particular attention was to be paidto ensuring compatibility with the air quality methodology developed inparallel by WG1, to ensure the most integrated analysis possible. This task alsoincluded a discussion of the validation procedures and that were needed forassuring the robustness of the cost-effectiveness methodology.
Auto-Oil II Cost-Effectiveness Study Part I: Introduction and Overview
24 European Commission, Standard & Poor’s DRI – KULeuven, August 1999Draft Final report
The AOPII cost-effectiveness methodology developed in WG7 was describedin Chapter 5 of the First Interim report and is incorporated in Parts II, III, andV of this study.
Task 4: Enhance/develop models
In this task, mainly of a technical nature, the consultants developed enhancedpolicy simulation and assessment tools required to support the cost-effectiveness methodology outlined in Task 3. This task consisted ofreformulating existing models, or components thereof, to take account of thescope of the study and the methodology agreed by Working Group 7. Mostattention so far went to the development of the TREMOVE model which isused to simulate transport policy options and also to construct the base case(see step 5). Pending the availability of input data from other working groups, alimited number of tests were carried out based on preliminary or dummy data.The development of the policy assessment model (i.e. LEUVEN II) has beenfinalized but, pending the availability of input data from other working groups,testing has been very limited to date. As part of the further testing procedures,indications will be given of what are the critical parameters that need to becarefully monitored.
Detailed specifications of the models are provided in Parts II and V of thisreport. Models have been made available to WG7 experts allowing to gaininsights into the detailed functioning of models. Once fully tested, models willalso be made available to stakeholders upon request.
Task 5: Define format for submission of data/information by WG2-6
Having identified the scope (Task 2) and methodology (Task 3) of the cost-effectiveness analysis, as well as the models needed in support themethodology (task 4), this task focused on the specification of the input datarequirements for WG7 and the format in which these data have to be delivered.This task involved considerable interaction between WG7 and other workinggroups (and their consultants) responsible for identifying possible measuresand related data. It also involved the identification of a number of milestonesfor a timely delivery of data to WG7 as well as an agreement on the proceduresfor the validation of input and output data. To date, however, limited input hasbeen received due to the delays incurred in the overall AOPII time table.
The guidelines for data collection were provided in Chapter 7 of the FirstInterim Report released in February 1998 and incorporated in Part IV of thisreport. Guidelines are continuously subject to clarification as working groupsmake progress in the identification of future pollutant abatement measures.Whereas most guidelines refer to data associated with policy options, workinggroups also assisted in the collection and validation of the transport base casedata (see next).
Task 6: Define a base case to 2020
This task consisted of specifying the overall base case, against which AOPIIpolicy options were to be evaluated in terms of cost and effects.
Whilst WG1 was co-ordinating the overall process for constructing the basecase, the task of WG7 is to contribute to the detailed construction of the basecase related to the road transport sector. Specifications for constructing the

Auto-Oil II Cost-Effectiveness Study Part I: Introduction and Overview
European Commission, Standard & Poor’s DRI – KULeuven, August 1999 25Draft Final report
AOPII base case were discussed in WG1/WG7 ad hoc meetings which werealso attended by experts from other working groups. The task also included thespecification of validation and calibration procedures in WG7 (and in WG1),involving other working groups, in particular WG2 and WG3.
The transport base case is discussed in Part III of this report.
Task 7: Select cost-effective policy scenarios
This task is not yet completed to date due to delays in the overall AOPIItimetable. It is dedicated to the identification of an optimal set of policymeasures to reach the environmental objectives of AOPII at least cost. As this“what’s best” scenario will depend, among other, on the assumptions made inthe models and the robustness of the input data, a sensitivity analysis will becarried-out. This “what-if” analysis will be based on changed assumptions forcritical parameters identified in prior tasks (i.e. Task 4). The incremental costsand effects of pollutant abatement policy options compared to the base casewill be calculated or assembled in WG7 and be used as an input into theoptimisation model LEUVEN2. Those costs and effects related to the transportsector will be estimated through the integrated transport emission forecastingmodel (TREMOVE). Costs and effects of policy options in other sectors willbe assembled by WG1 and checked for consistency with the transport data inWG7, before inclusion in the optimisation model.
The preliminary results will be presented to WG7 in accessible formats(including tables and graphs), to facilitate the analysis and discussions. Forexample, the contribution of the key measures of the optimal policy mix inachieving the desired emission reduction will be commented upon. This willallow more transparency in the tractability of inputs to better understand theresults. Preliminary examples of policy scenarios are currently provided in PartIV of this report.
Task 8: Evaluates side effects of policy scenarios
The analysis described in Task 7 will be complemented in this task to takeaccount of the fact that the conclusions from the AOPII need to be consistentwith other EU strategies and policies. Cost-effective scenarios will be tested forthe possible “side effects” identified by WG7 (see Part II of this study). These“side effects” also cover aspects that are not immediately revealed in a cost-effectiveness analysis. For example, the distribution of costs across sectors ordifferences in time paths for selected emission reduction scenarios that lead toearly achievement of some targets.
Task 9: Prepare conclusion and final report
In this task, the findings emerging from the cost-effectiveness analysis will beanalysed and summarised for inclusion in the final report from WG7. Care willbe given to common sense interpretation of the modelling output, by providingas much transparency as possible on assumptions made and the limitations ofthe approach. Draft final reports will be prepared so that the different AOPIIstakeholders can provide comments. Conclusions will be formulated in termsof the attractiveness of different policy solutions. The report will then befinalised on the basis of comments received. The final report will include anexecutive summary which is to present the results in an accessible format tofacilitate their interpretation and dissemination outside WG7.

Auto-Oil II Cost-Effectiveness Study Part I: Introduction and Overview
26 European Commission, Standard & Poor’s DRI – KULeuven, August 1999Draft Final report
Annex A: The WG7 Terms of reference28
1. Objectives
The objective of the working group is to
• devise a multi-faceted strategy,
• covering road-transport and other than road-transport emission sources
• at local and European level,
• to enable the Commission to propose a cost-effective set of measures
• for achieving the objectives resulting from the Community air qualitystandards.
The results from working group 7 will be established in close co-operation withthe other working groups.
These results will, inter alia, provide the basis for the discussion and thedecision on the emission limit values to be applied from January 2005,confirming or modifying the indicative limit values stipulated in the currentproposals.
2. Scope
Pending any modifications, Article 5 of the proposed directive 96/0164 (COD),and Article 9 of the proposed directive 96/0163 (COD), determine the initialscope of the cost-effectiveness analysis which must be undertaken by theCommission services. The scope could be amended by the Institutions duringthe decision process on the Auto-Oil I proposals. Therefore, the programmeshould be flexible to incorporate any modifications to the Commission’sproposal.
3. Methodology — Research and Tasks to be Undertaken
Where possible, the methodology will be based on a revised and enhancedversion of the methodology used for the Auto-Oil I programme.
At the outset, the working group will undertake review and research activitiesto evaluate the possibility to enhance the models used in the Auto-Oil IProgramme (e.g., the underlying assumptions, the nature and number ofparameters, etc.), and to develop the appropriate methodology to be used in theAuto-Oil II Programme. Their applicability within the enlarged scope of theexercise needs to be assessed. The main modifications will be the inclusion ofthe non-transport emission reduction measures and non-technical measures.Several models can be used as a basis, including TRANSOPT, EUCARS,RAINS, or the LEUVEN model, all with different merits and shortcomings.Confirmation and/or revision of the basic assumptions underlying the Auto-Oil
28 As agreed at the outset of AOPII in the spring of 1997, The terms of reference were notamended following the final adoption of the AOPII mandate. However, the work plan and timetable contained in section 4 has become obsolete and has been removed. Reference is made toChapter 4 of this report for a more up to date description.
Auto-Oil II Cost-Effectiveness Study Part I: Introduction and Overview
European Commission, Standard & Poor’s DRI – KULeuven, August 1999 27Draft Final report
I programme will to some extent be subject to the decisions taken in thecontext of working group 1 (number of pollutants, time intervals, etc.). Thesimulation model will have to be compatible with the air quality and emissionmodels used to calculate the emission reduction objectives (Working group 1),in particular the level of aggregation of data.
Concurrently, an integrated concept needs to be developed to accommodate theenlarged scope of the Auto-Oil II Programme. In particular, allowance foranalyzing the potential from sources other than road-transport needs to beincluded in the model(s). Provided major obstacles do not occur during theinitial phase of the programme, the following approach is envisaged:
1. When revising emission reduction targets related to road-transportsources, the emission reduction potential of other (principally stationary)sources will be considered simultaneously. In order to determine an initialorder of magnitude for sector-related emission reduction targets, currentdata on the cost-effectiveness of various measures will be considered,including inter alia: the results of the AOP1; the analysis undertaken tosupport the development of the Community strategies on acidification andozone; the studies undertaken in connection with the Communities’legislative proposals on Large Combustion Plants, the Incineration ofDangerous Waste, Emission Standards for Non-Road Mobile Machinery,Air Quality Standards for NO2, Particulates, CO2, Benzene and informationavailable to Member States Industry and NGOs.
2. When developing cost-effective measures, or a set of measures, theemission reduction targets will initially be those set for road-transportsources.
3. Time permitting, the exercise will be extended to a more detailed analysis ofthe measures related to other sources eventually including non-technical andfiscal measures. Upon availability of these data, the order of magnitude forsector related emission reduction targets could be revised.
This approach will be worked out further at the working group level in order toput forward a pragmatic and transparent methodology, capable of delivering ontime.
The preliminary list of outstanding issues include decision to be made on:
• discrete/continuous scenarios;
• consecutive/simultaneous optimization;
• model constraints (number of pollutants, number of measures, type ofmeasures);
• use of welfare/real (financial) costs — concept definition and data update;
• developing integrated concept for including non-technical and fiscalmeasures;
• reference year and time horizon;
• NPV assumptions;
• possible emission discounting;

Auto-Oil II Cost-Effectiveness Study Part I: Introduction and Overview
28 European Commission, Standard & Poor’s DRI – KULeuven, August 1999Draft Final report
• inclusion of effects on CO2 emissions;
• possible overlaps and economic side effects
4. Interaction Between Working Group 7 And Other Working Groups
It is acknowledged that the activities of working group 7 depend strongly onthe work of the other working groups and vice versa. Working group 7 willclosely co-operate with all working groups in order to assure data compatibilityand validity in all stages of the process. A high level of co-operation andflexibility between all working groups will be essential for the success of theprogramme.
The input for the cost-effectiveness will be provided by working groups 1(environmental objectives) and 2 through 6 (measures). The output of thevarious vertical working groups will have to be presented in a format suitablefor the cost/effectiveness optimization, and will have to be compatible with themodel capabilities and characteristics. Thus, an important role of workinggroup 7 will be to provide guidance to the other working groups with regard tothe required nature, format, and level of detail of the data to be delivered. Theinput will be screened before acceptance.
In case this task is subcontracted, the contractor(s) must be able to liaise withthe other working groups in order to take into account the format of theirresults, which will be inputs to the model, and give them information about thepossibilities/limitation of the optimization model in order to instruct them onthe format of the data able to be introduce into the modeling process.
4. Working plan (Preliminary)
[obsolete following the subsequent revisions of the AOPII mandate, the termsof reference and the related timetable. See Chapter 2 and 4 of this report fordetails.]

Auto-Oil II Cost-Effectiveness Study Part I: Introduction and Overview
European Commission, Standard & Poor’s DRI – KULeuven, August 1999 29Draft Final report
Annex B: Experience from the Auto-Oil I ProgrammeThe AOPII mandate requires that the AOPII proposals from the Commissionshould be based upon a revised and an enhanced methodology relative to thatapplied in AOPI.
Throughout the Auto-Oil I exercise, and during the initial discussions on theAuto-Oil II Programme, the need for a more integrated approach to policyassessment became apparent. Such an approach is needed if there is to be asimultaneous analysis of the impact of regulations and norms that directlyaffect technology – the technical measures – and of measures that specificallyaim to alter the behaviour of transport users – the non-technical measures. Atthe outset of the work in WG7, a number of comments or criticisms have beenmade concerning the methodology employed for the Auto-Oil I Programme,which are summarised below:
• the Programme focused on technological solutions implemented through thecommand-and- control approach; not enough attention was given to the useof fiscal instruments and measures for transport demand management;
• the models used were not capable of dealing adequately with fiscalinstruments or with transport demand management measures;
• the allocation of emission reduction targets across sectors did not occur inan integrated way, thereby insufficiently taking into account the potential ofother-than-road-transport emission sources;
• the methodology, in particular the modelling tools, should have beendeveloped in a more transparent way.
The Commission has responded positively to the comments resulting from theAuto-Oil I experience. It has committed itself to maintaining a high level oftransparency in Auto-Oil II, and to address the above-mentioned concerns asfully as possible.
The mandate of Auto-Oil II (see Chapter 2) requires in itself a broaderapproach to the analysis of cost-effective policies than that adopted for Auto-Oil I. It is recognised that technical standards and fiscal measures that affectfactors such as travel demand or modal choice are complementary rather thanexclusive. The cost-effectiveness methodology must allow a simultaneousanalysis of these different instruments.
It has also become clear that forecasts of travel demand and a thorough anddetailed understanding of the composition of the vehicle stock are important.Indeed, emissions are a function not only of the number of vehicles, but alsotheir technical characteristics, average usage, and the characteristics of the fuelused. In order to incorporate all these elements, Auto-Oil II requires integratedmodelling tools that allow different policy measures to be handled within aconsistent analytical framework.
However, given the increased complexity of the modelling task compared toAuto-Oil I it is important that the methodology employed is well understood,and that any assumptions used in the modelling are clearly stated and open toscrutiny. It is therefore essential that the work of all working groups is closelyintegrated. In addition, it will be important to make judicious use of sensitivity
Auto-Oil II Cost-Effectiveness Study Part I: Introduction and Overview
30 European Commission, Standard & Poor’s DRI – KULeuven, August 1999Draft Final report
analysis to test the robustness of modelling results, and to allow as much timeas possible for the analysis of the modelling output.
Auto-Oil II Cost-Effectiveness Study Part I: Introduction and Overview
European Commission, Standard & Poor’s DRI – KULeuven, August 1999 31Draft Final report
Annex C: Experience from third countriesUseful experiences can be drawn from looking at how the cost-effectiveness ofmeasures is assessed in other parts of the world. At the outset of the work to bedone in WG7, DRI reviewed what is currently being done in the US and, inparticular, in California.
Some care has to be taken in drawing lessons from the US experience forEurope, because of differences in problems and approaches between the tworegions. However, there are a number of interesting conclusions to be drawnfrom these efforts that are applicable irrespective of the original situations andthe desired effects of the programmes.
• There is no single best approach to cost-effectiveness analysis. The choiceof methods and models to use depends on both the analytical needs and theresource availability. There is a long list of interesting models ortechniques that can be used, and types of improvements that can be made toexisting models. Some of these improvements are necessary for goodanalyses but others may generate only small marginal benefits. Analyststherefore need to select a methodology with the real-world context in mindand not based (exclusively) on abstract theory. Cost-effectiveness analysesshould be policy-relevant. The analysis is a means to achieve such a goal,but not an end in itself.
• In the case of the US, the analyses show that reasonable technical measuresand fuel programmes are more cost-effective than traffic managementmeasures. Advanced vehicle technology and fuel programs, however, arevery expensive.
With respect to the cost-effectiveness of emission control measures in thetransport sector, it can be concluded that it is important to consider theinteractions among the individual emission control options - a featureembedded into the proposed methodology for AOP II. These conclusions werebased on the Californian experience, which is used as a model by the otherStates within the US, and is followed with interest in other parts of the world.