
Autism Activities at CDC: The Public Health ModelThe … Activities at CDC: The Public Health...
23
Autism Activities at CDC: The Public Health Model Autism Activities at CDC: The Public Health Model The Public Health Model The Public Health Model Act Early Region II Summit Bronx, NY March 26, 2009 Marshalyn Yeargin-Allsopp, MD Georgina Peacock, MD, MPH National Center on Birth Defects and Developmental Disabilities
Transcript of Autism Activities at CDC: The Public Health ModelThe … Activities at CDC: The Public Health...
Autism Activities at CDC: The Public Health ModelAutism Activities at CDC: The Public Health ModelThe Public Health ModelThe Public Health Model
Act Early Region II SummitBronx, NY
March 26, 2009
Marshalyn Yeargin-Allsopp, MDGeorgina Peacock, MD, MPHNational Center on Birth Defects and
Developmental Disabilities
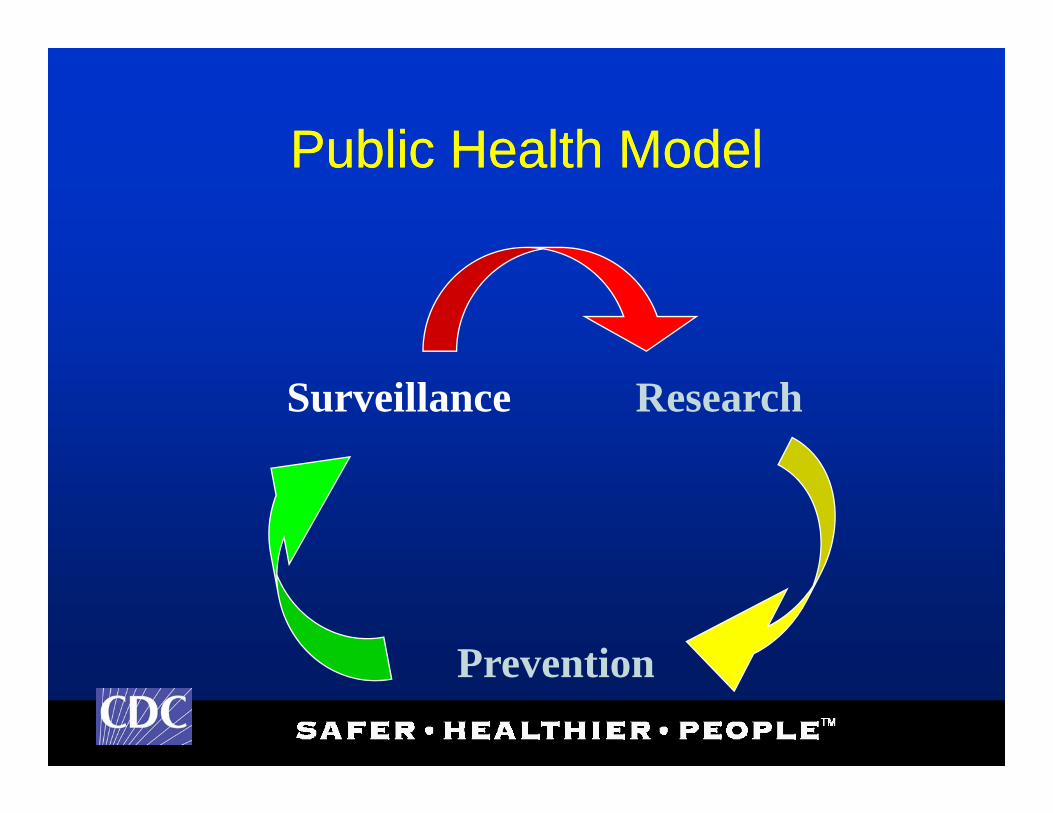
Public Health ModelPublic Health ModelPublic Health ModelPublic Health Model
Surveillance Research
PreventionPrevention
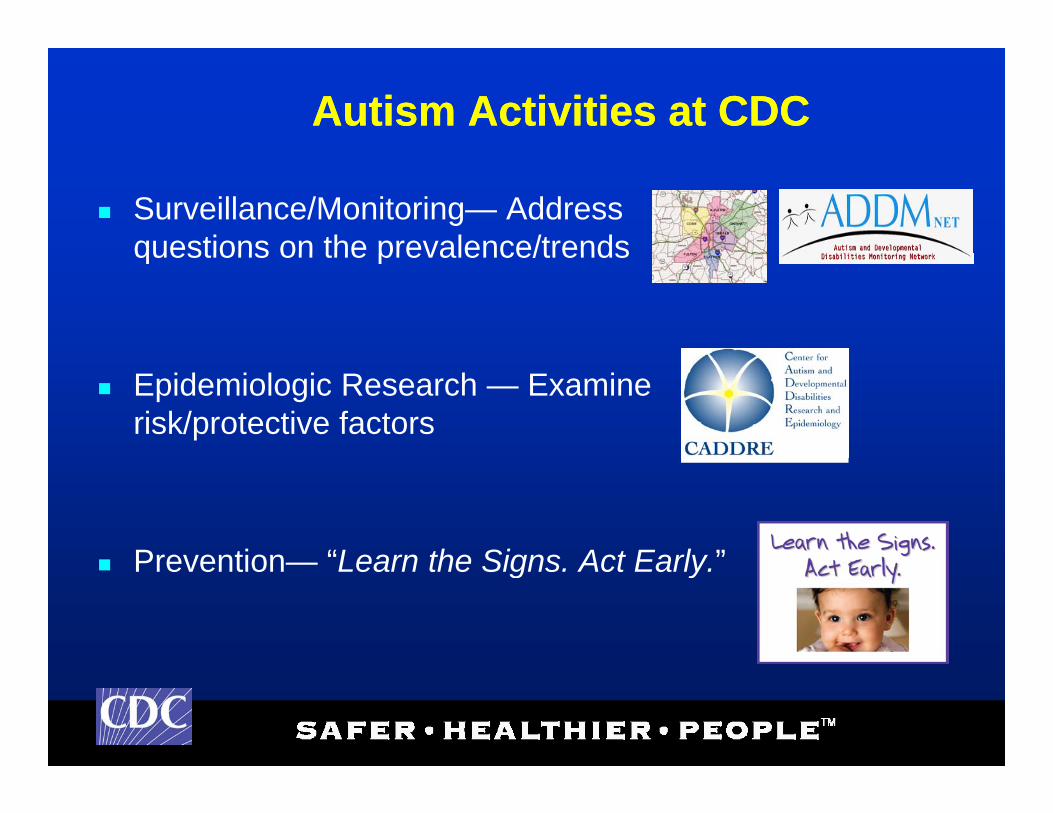
Autism Activities at CDCAutism Activities at CDC
Surveillance/Monitoring— Address questions on the prevalence/trendsquestions on the prevalence/trends
Epidemiologic Research — Examine risk/protective factors
Prevention “Learn the Signs Act Early ” Prevention— Learn the Signs. Act Early.
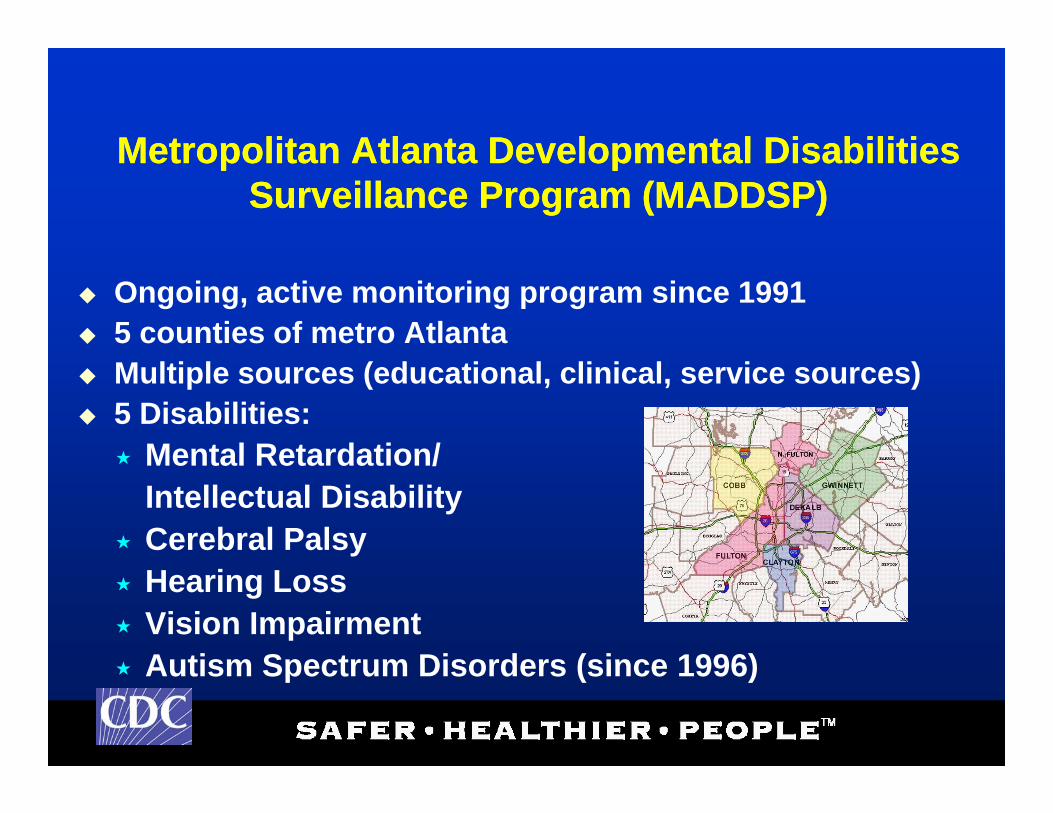
Metropolitan Atlanta Developmental DisabilitiesMetropolitan Atlanta Developmental DisabilitiesMetropolitan Atlanta Developmental Disabilities Surveillance Program (MADDSP)
Metropolitan Atlanta Developmental Disabilities Surveillance Program (MADDSP)
Ongoing, active monitoring program since 1991 5 counties of metro Atlanta Multiple sources (educational, clinical, service sources) 5 Disabilities: Mental Retardation/ Mental Retardation/
Intellectual Disability Cerebral Palsy Hearing Loss Vision Impairment Autism Spectrum Disorders (since 1996) Autism Spectrum Disorders (since 1996)
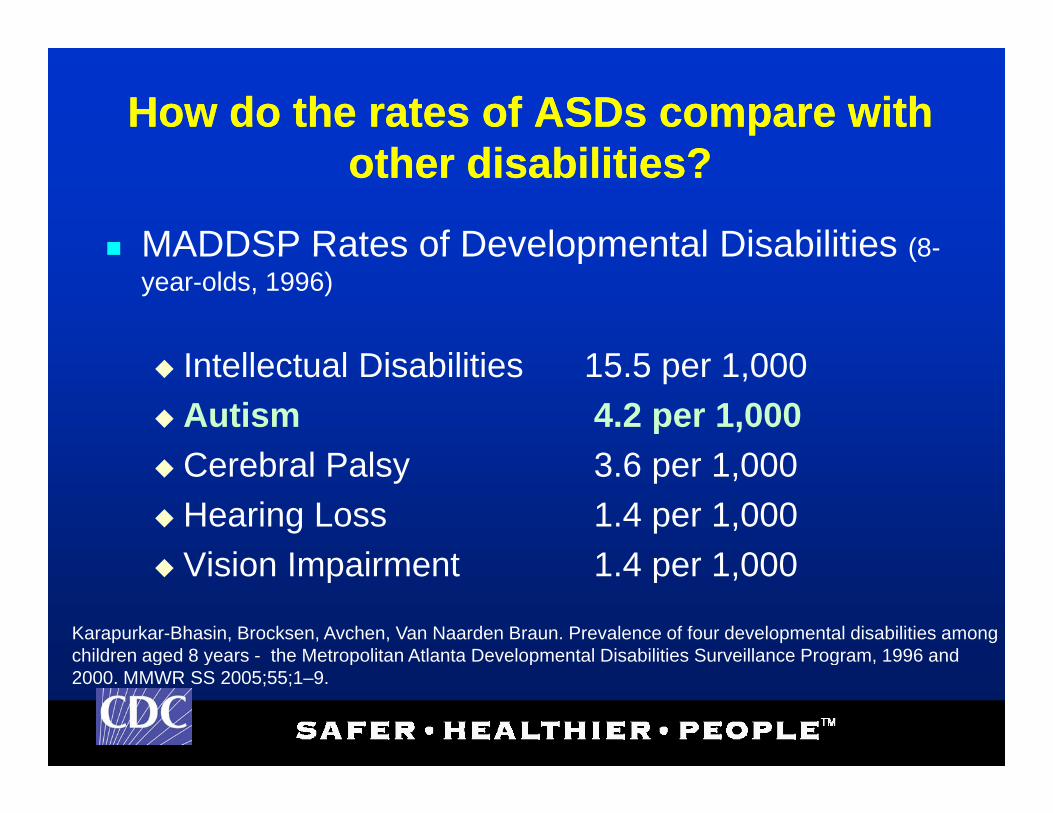
How do the rates of ASDs compare with th di biliti ?
How do the rates of ASDs compare with th di biliti ?other disabilities?other disabilities?
MADDSP Rates of Developmental Disabilities (8- MADDSP Rates of Developmental Disabilities (8year-olds, 1996)
I t ll t l Di biliti 15 5 1 000 Intellectual Disabilities 15.5 per 1,000 Autism 4.2 per 1,000
C b l P l 3 6 1 000 Cerebral Palsy 3.6 per 1,000 Hearing Loss 1.4 per 1,000 Vision Impairment 1 4 per 1 000 Vision Impairment 1.4 per 1,000
Karapurkar-Bhasin, Brocksen, Avchen, Van Naarden Braun. Prevalence of four developmental disabilities among children aged 8 years - the Metropolitan Atlanta Developmental Disabilities Surveillance Program, 1996 and g y p p g ,2000. MMWR SS 2005;55;1–9.
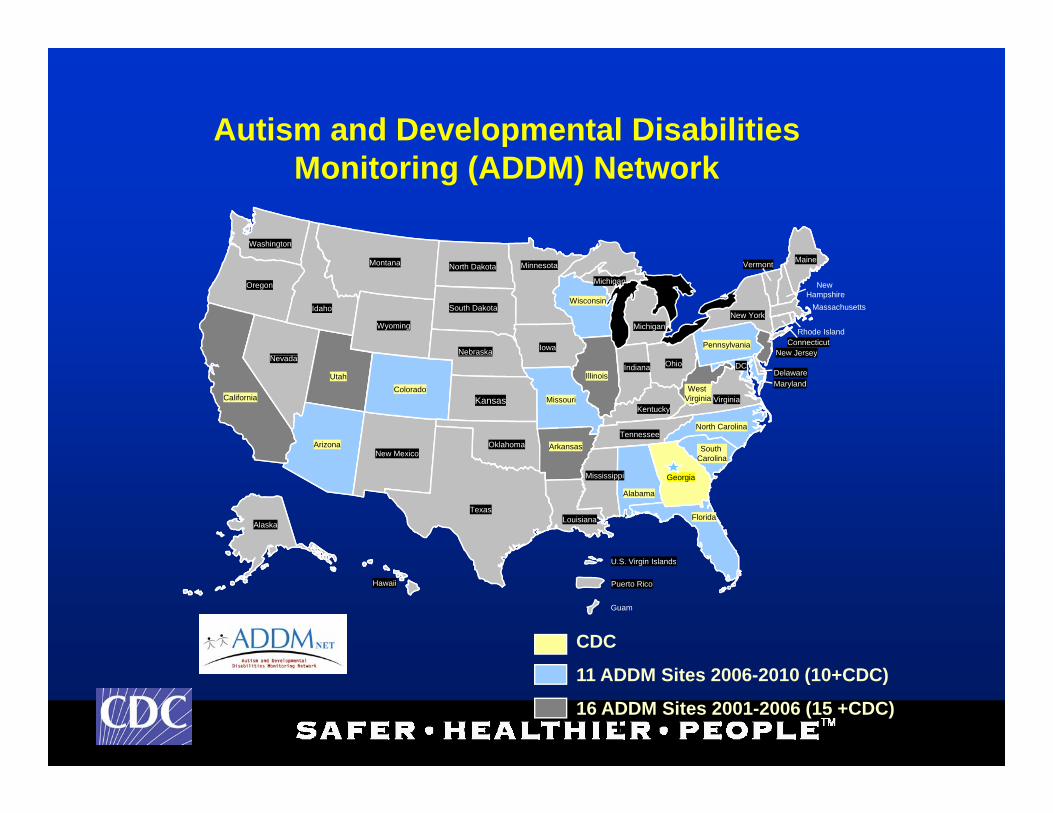
Autism and Developmental Disabilities
Washington
Monitoring (ADDM) Network
Montana
Oregon
N d
Idaho
Wyoming
North Dakota
South Dakota
Minnesota
IowaNebraska
Maine
New York
Michigan
Wisconsin
Michigan
New Jersey
Vermont
Rhode IslandConnecticut
New Hampshire
Massachusetts
Pennsylvania
Nevada
California
Utah
ArizonaNew Mexico
ColoradoKansas
South Carolina
North Carolina
Virginia
Oklahoma
Missouri
ArkansasTennessee
Kentucky
IllinoisIndiana Ohio
West Virginia
DC
MarylandDelaware
e Je sey
TexasFlorida
Mississippi
Louisiana
Alabama
Georgia
Carolina
Alaska
U S Virgin Islands
Hawaii
U.S. Virgin Islands
Puerto Rico
Guam
CDC
11 ADDM Sites 2006-2010 (10+CDC)
16 ADDM Sites 2001-2006 (15 +CDC)+
Goals: Accurate and comparable population-based p p p
estimates of the prevalence of Autism Spectrum Disorder (ASD) in selected regions
f U Sof U.S. Describe the characteristics of children with
A tiAutism Examine trends in prevalence
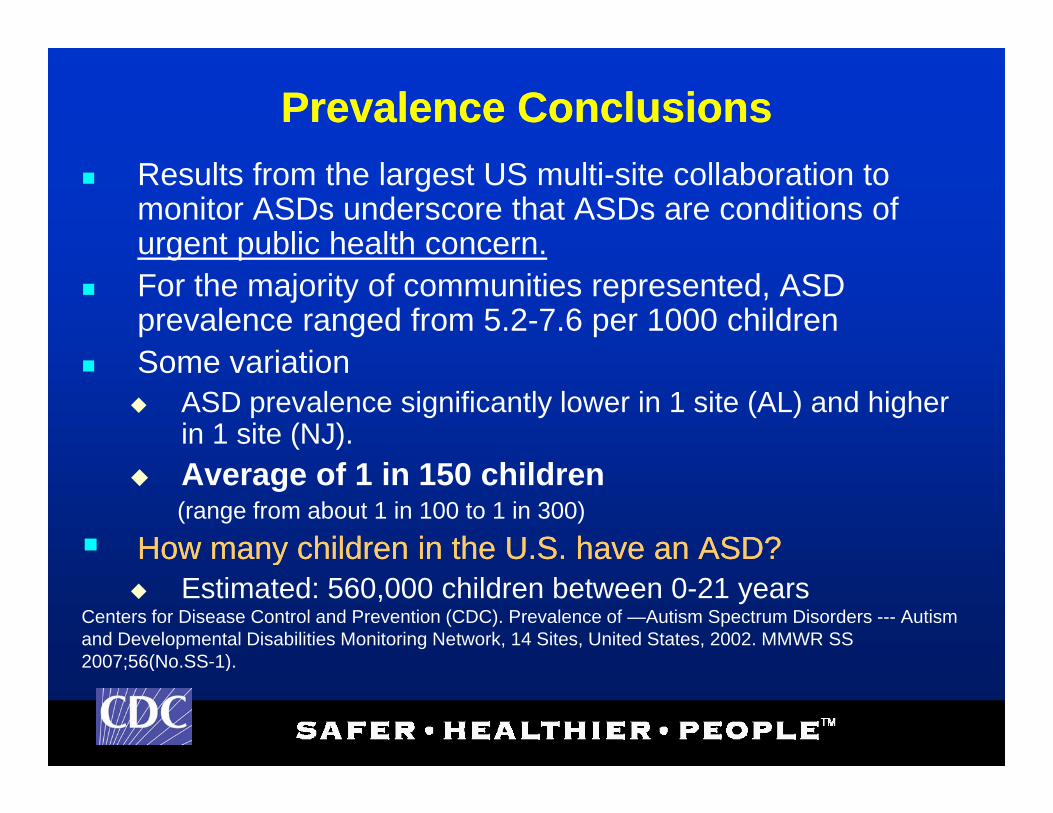
Prevalence ConclusionsPrevalence Conclusions Results from the largest US multi-site collaboration to
monitor ASDs underscore that ASDs are conditions of urgent public health concern.urgent public health concern.
For the majority of communities represented, ASD prevalence ranged from 5.2-7.6 per 1000 childrenS i ti Some variation ASD prevalence significantly lower in 1 site (AL) and higher
in 1 site (NJ). Average of 1 in 150 children
(range from about 1 in 100 to 1 in 300)
How many children in the U.S. have an ASD?How many children in the U.S. have an ASD?yy Estimated: 560,000 children between 0-21 years
Centers for Disease Control and Prevention (CDC). Prevalence of —Autism Spectrum Disorders --- Autismand Developmental Disabilities Monitoring Network, 14 Sites, United States, 2002. MMWR SS 2007;56(No SS-1)2007;56(No.SS-1).
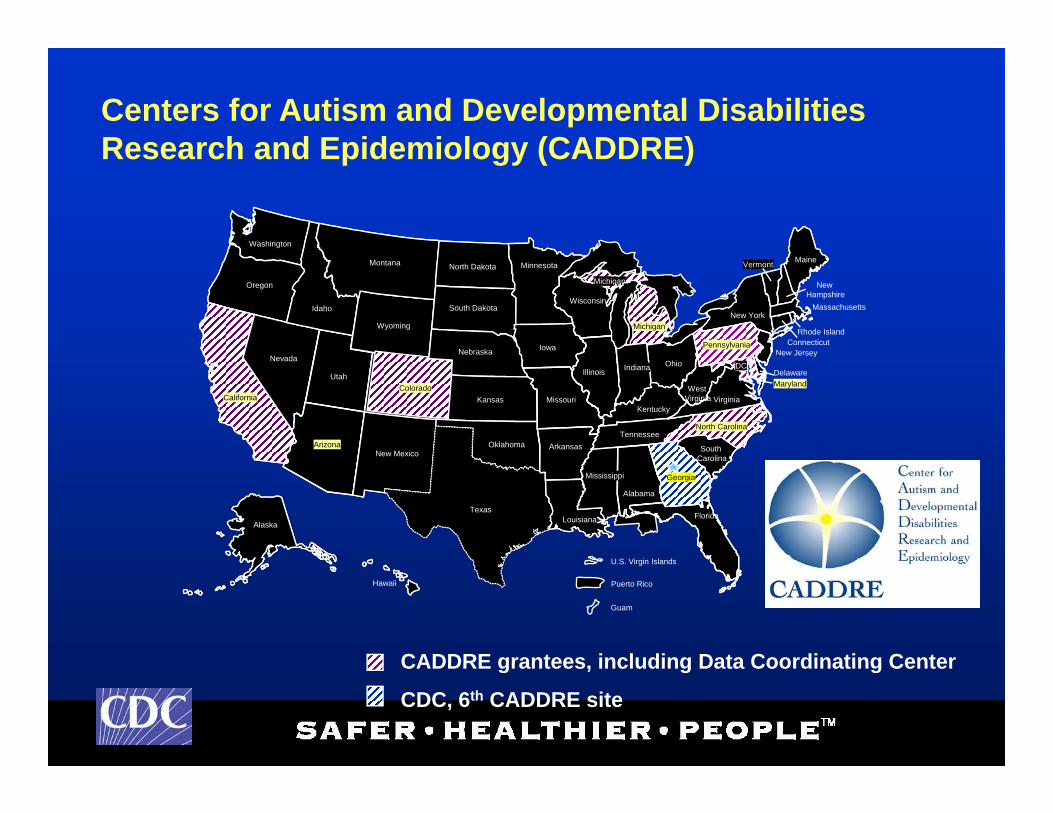
Centers for Autism and Developmental Disabilities Research and Epidemiology (CADDRE)
Washington
Research and Epidemiology (CADDRE)
Montana
Oregon
N d
Idaho
Wyoming
North Dakota
South Dakota
Minnesota
IowaNebraska
Maine
New York
Michigan
Wisconsin
Michigan
New Jersey
Vermont
Rhode IslandConnecticut
New Hampshire
Massachusetts
Pennsylvania
Nevada
California
Utah
ArizonaNew Mexico
ColoradoKansas
South Carolina
North Carolina
Virginia
Oklahoma
Missouri
ArkansasTennessee
Kentucky
Illinois Indiana Ohio
West Virginia
DC
MarylandDelaware
e Je sey
TexasFlorida
Mississippi
Louisiana
Alabama
Georgia
Carolina
Alaska
U S Virgin Islands
Hawaii
U.S. Virgin Islands
Puerto Rico
Guam
CADDRE grantees including Data Coordinating CenterCADDRE grantees, including Data Coordinating Center
CDC, 6th CADDRE site
Research: Study to Explore Early Development (SEED)
Research: Study to Explore Early Development (SEED)y p y p ( )y p y p ( )
Multi-state collaborative study to help identify factors that may put children at risk for autism spectrumthat may put children at risk for autism spectrum disorders and other developmental disabilities.
California, Colorado, Georgia, Maryland, North Carolina, Pennsylvania
Approximately 2,700 children, ages 2 to 5, and their parents will be part of this study.
Study to Explore Early Study to Explore Early
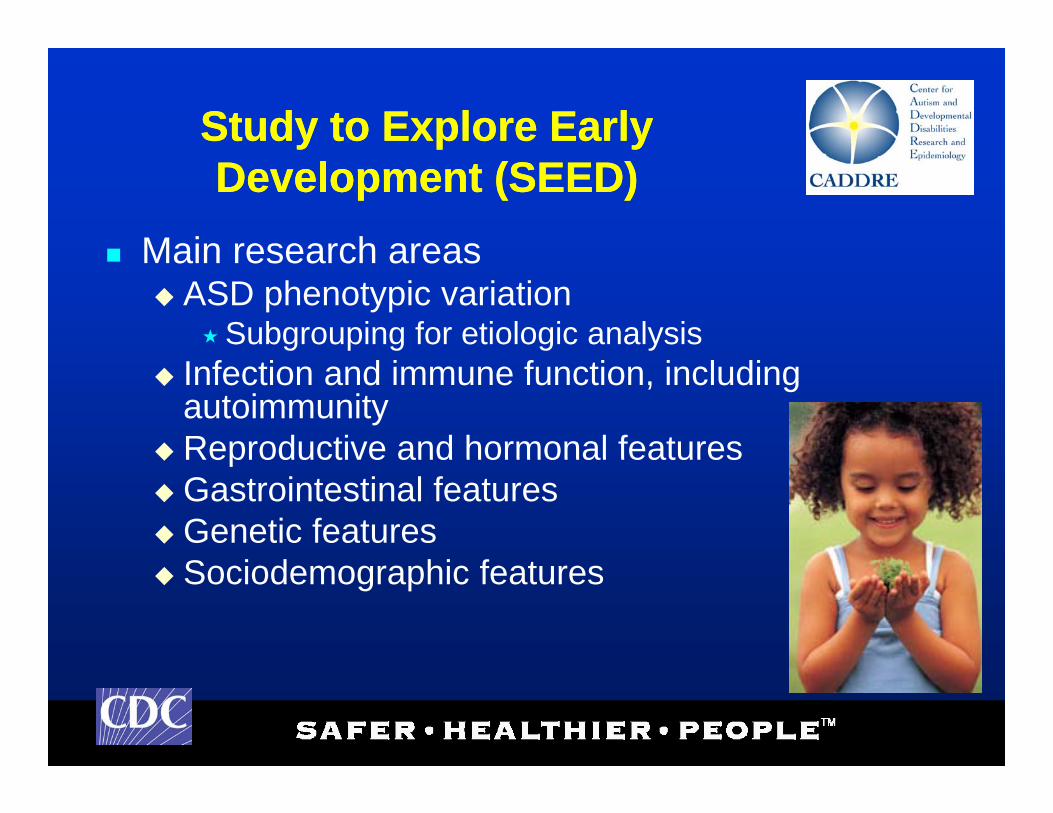
Main research areas
Development (SEED)Development (SEED) Main research areas
ASD phenotypic variationSubgrouping for etiologic analysis
Infection and immune function, including autoimmunity
Reproductive and hormonal features Reproductive and hormonal features Gastrointestinal features Genetic features
S i d hi f t Sociodemographic features
Early ASD SurveillanceEarly ASD Surveillance
Challenge = The median age of ASD diagnosis is 4 5-5 5 years of age (ADDM Network) Current4.5-5.5 years of age (ADDM Network). Current surveillance must rely on older children to understand peak prevalence. No model for p ppopulation-based surveillance of ASDs in young children in US.
Goal = develop a valid way to characterize and track the population of children with an ASD in
hild ( d th f 4)young children (under the age of 4). Long-range goal = tie population-based surveillance with efforts
for early identification (“Learn the Signs. Act Early.”), screening, and link to intervention.
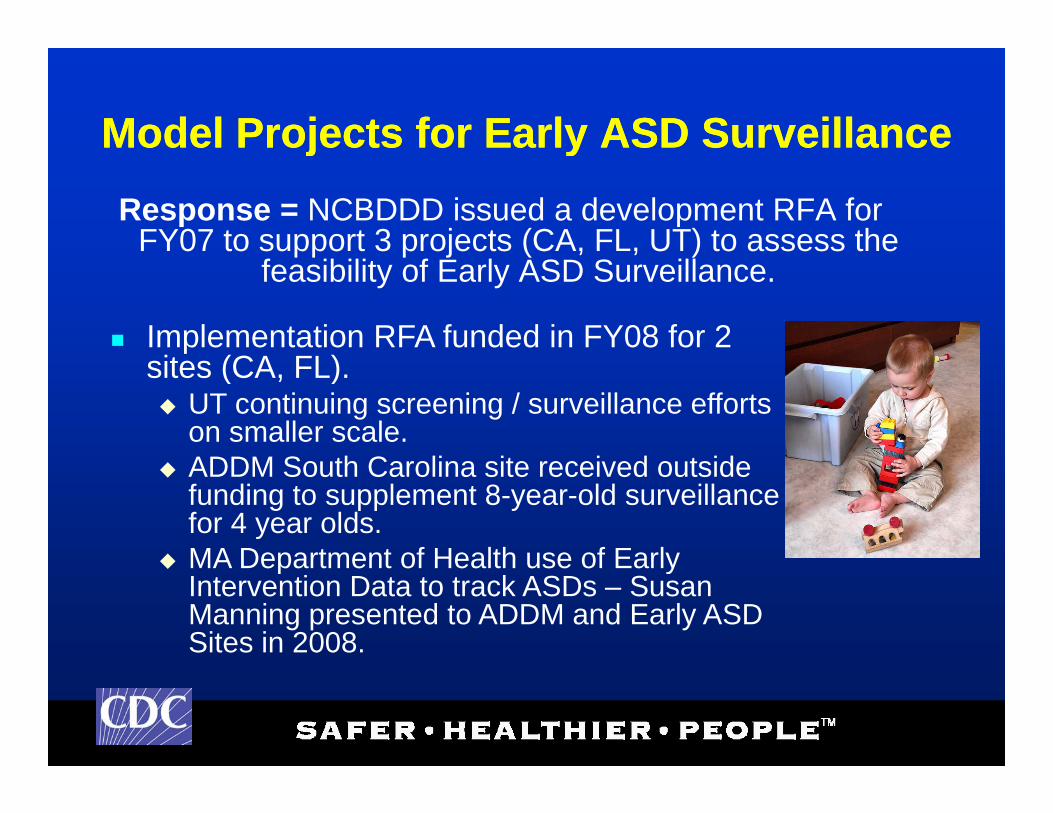
Model Projects for Early ASD SurveillanceModel Projects for Early ASD Surveillancej yj yResponse = NCBDDD issued a development RFA for
FY07 to support 3 projects (CA, FL, UT) to assess the pp p j ( , , )feasibility of Early ASD Surveillance.
Implementation RFA funded in FY08 for 2 i (CA FL)sites (CA, FL). UT continuing screening / surveillance efforts
on smaller scale.ADDM S th C li it i d t id ADDM South Carolina site received outside funding to supplement 8-year-old surveillance for 4 year olds.
MA Department of Health use of Early MA Department of Health use of Early Intervention Data to track ASDs – Susan Manning presented to ADDM and Early ASD Sites in 2008.
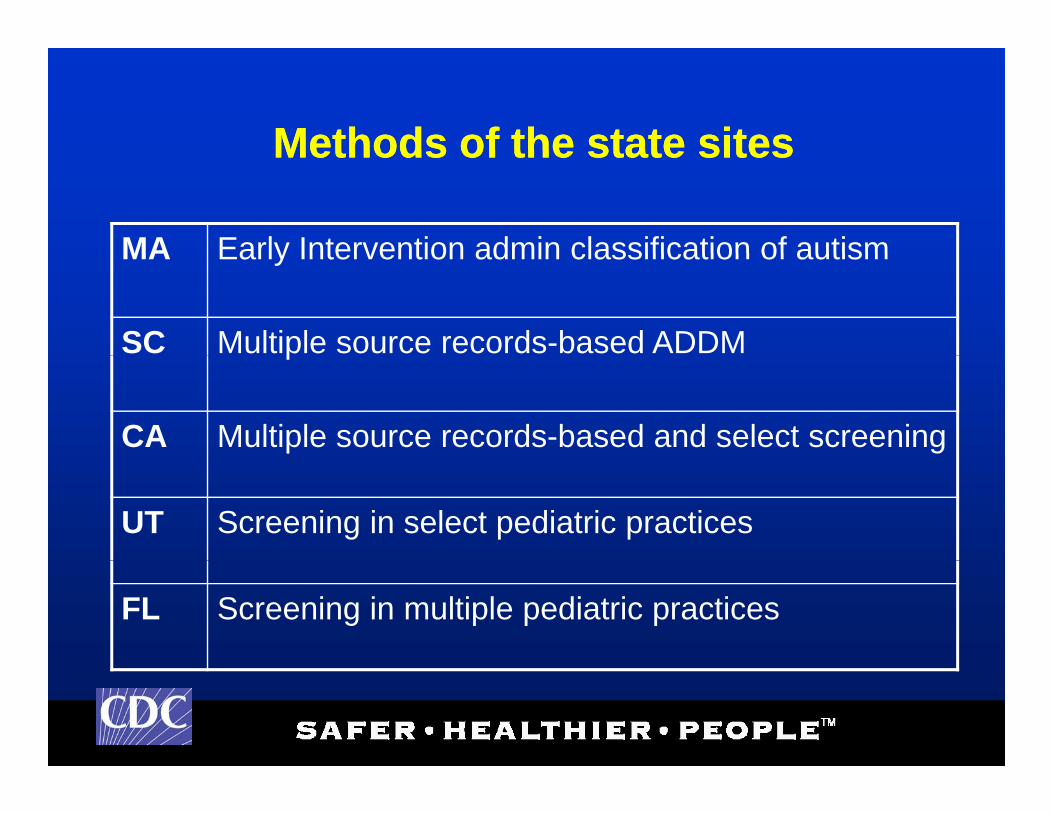
Methods of the state sitesMethods of the state sitesMethods of the state sitesMethods of the state sites
MA Early Intervention admin classification of autismMA Early Intervention admin classification of autism
SC Multiple source records-based ADDMp
CA Multiple source records-based and select screening
UT Screening in select pediatric practices
FL Screening in multiple pediatric practices

Benefits of Early ASD surveillanceBenefits of Early ASD surveillanceBenefits of Early ASD surveillanceBenefits of Early ASD surveillanceBenefits of Early ASD surveillanceBenefits of Early ASD surveillanceBenefits of Early ASD surveillanceBenefits of Early ASD surveillance
Best estimate of true prevalence at very young agesBest estimate of true prevalence at very young ages Best estimate of true prevalence at very young agesBest estimate of true prevalence at very young ages Compare rates from direct assessment v. administrative Compare rates from direct assessment v. administrative
methods, to see possible trends in awareness and methods, to see possible trends in awareness and diagnostic practicesdiagnostic practicesdiagnostic practices diagnostic practices
Opportunity to study validity of screening instruments and Opportunity to study validity of screening instruments and effectiveness of screening processeffectiveness of screening process
How to increase specificityHow to increase specificity How to increase specificityHow to increase specificity How do parents respond to screeningHow do parents respond to screening How can communities plan and provide supportHow can communities plan and provide support
Establish a cohort that can be followed over time to Establish a cohort that can be followed over time to examine developmental course and costs of care.examine developmental course and costs of care.
Provide participants the opportunity to seek earlier Provide participants the opportunity to seek earlier p p pp yp p pp yintervention.intervention. Source: J. MillerSource: J. Miller
Learn the Signs. Act Early.Learn the Signs. Act Early.g yg y
www.cdc.gov/actearly
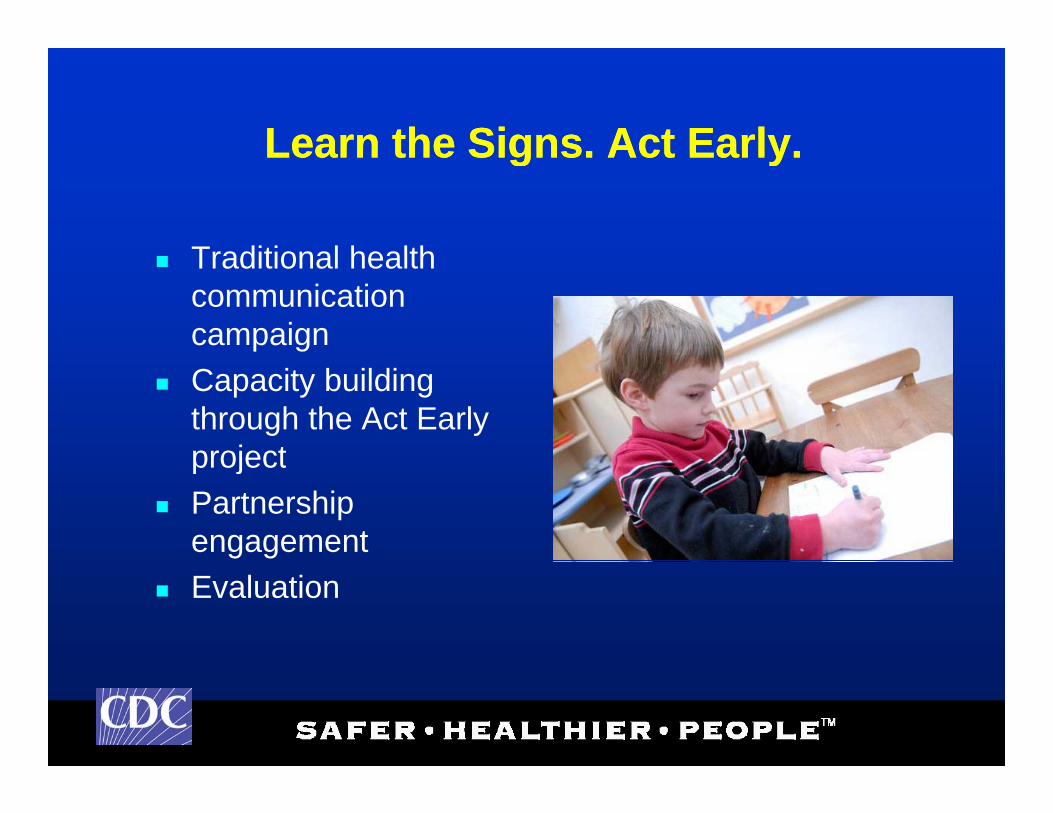
Learn the Signs Act EarlyLearn the Signs Act EarlyLearn the Signs. Act Early.Learn the Signs. Act Early.
Traditional health Traditional health communication campaign
Capacity building through the Act Early projectproject
Partnership engagement
Evaluation
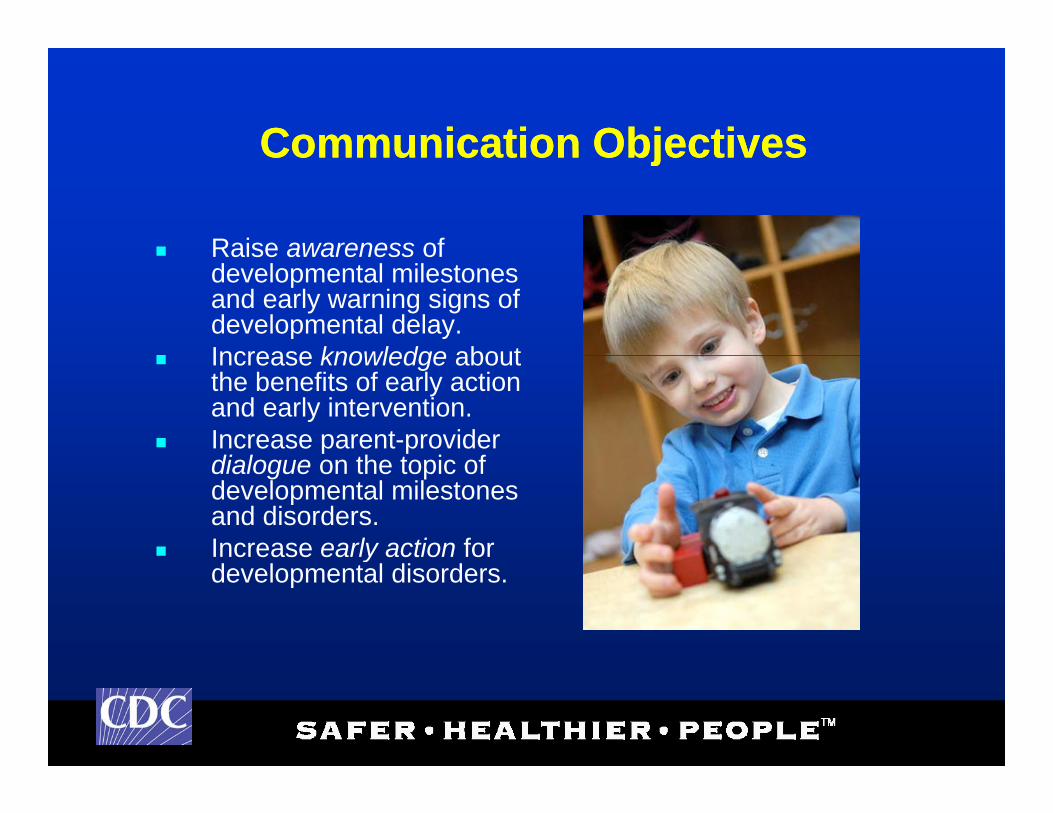
Communication ObjectivesCommunication ObjectivesCommunication ObjectivesCommunication Objectives
Raise awareness of Raise awareness of developmental milestones and early warning signs of developmental delay.
Increase knowledge about Increase knowledge about the benefits of early action and early intervention.
Increase parent-provider di l th t i fdialogue on the topic of developmental milestones and disorders.
Increase early action for ydevelopmental disorders.

Target AudiencesTarget AudiencesTarget AudiencesTarget Audiences
H lth C P f i l Health Care ProfessionalsPediatricians, family physicians,
physician assistants, nurses, allied health professionals
Parents of Young Children Ages 4 and younger
Early Educators
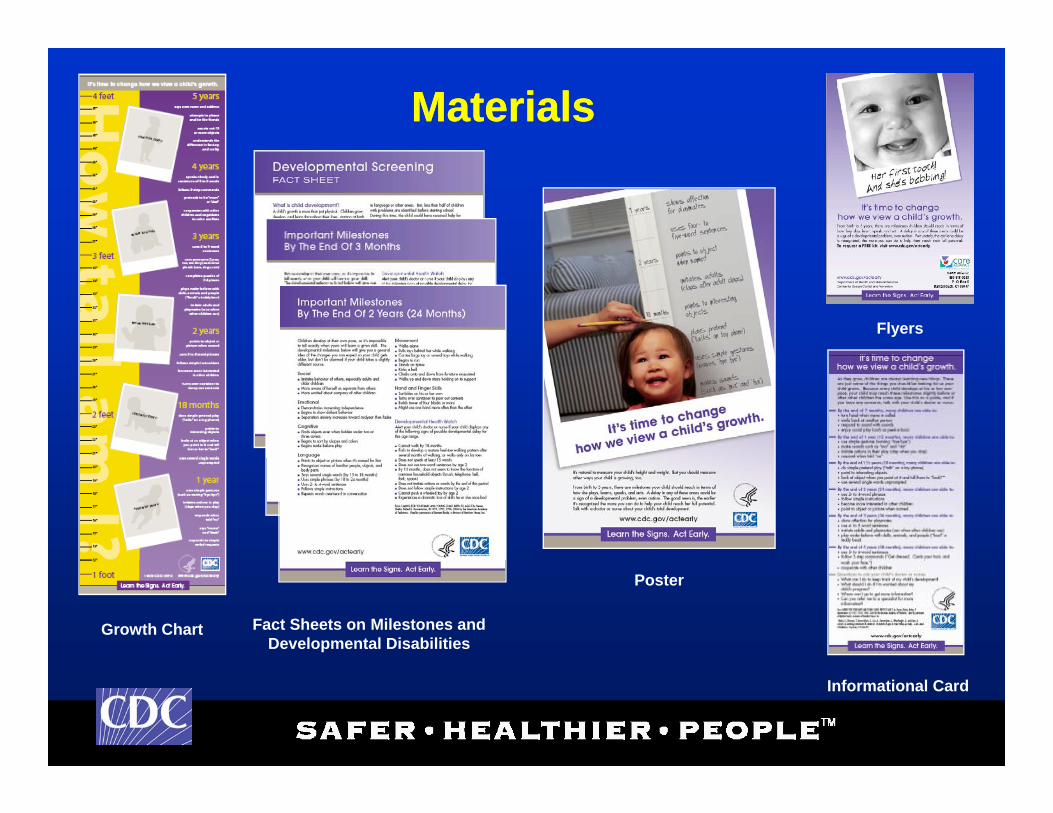
MaterialsMaterials
Flyers
Fact Sheets on Milestones and Developmental Disabilities
Growth Chart
Poster
Informational Card
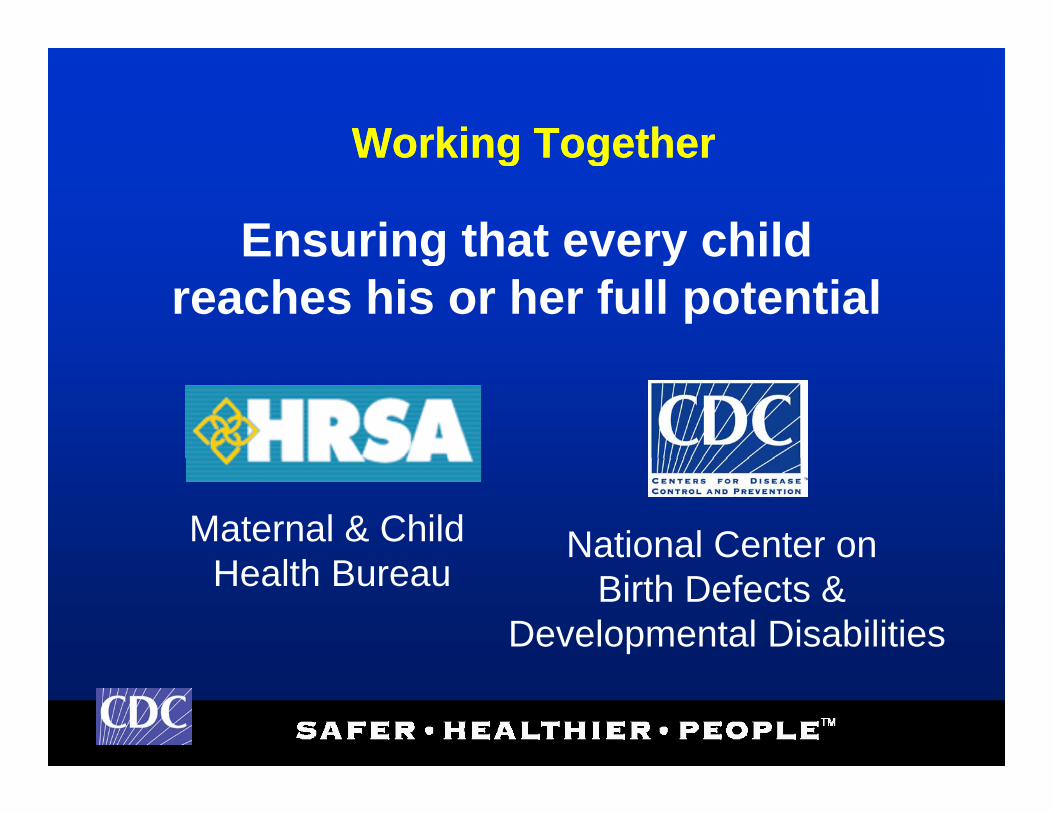
Working TogetherWorking TogetherWorking TogetherWorking Together
Ensuring that every childEnsuring that every child reaches his or her full potential
Maternal & Child H lth B
National Center on Health Bureau Birth Defects &
Developmental Disabilities
Capacity buildingCapacity buildingCapacity buildingCapacity building
CDC& HRSA C ll b ti CDC& HRSA CollaborationAct Early Summits Act Early Minigrants
Other CDC initiatives Research Topics of Interest (RTOIs)Collaborative Research Awards (CRAs)Collaborative Research Awards (CRAs)