Authorship Distribution and Collaboration in LIS Open ...
25
University of Nebraska - Lincoln DigitalCommons@University of Nebraska - Lincoln Library Philosophy and Practice (e-journal) Libraries at University of Nebraska-Lincoln Fall 9-19-2018 Authorship Distribution and Collaboration in LIS Open Access Journals: A Scopus based analysis during 2001 to 2015 Nilaranjan Barik KIIT University, Bhubaneswar-751024, [email protected] Puspanjali Jena Utkal University, Bhubaneswar-04, [email protected] Follow this and additional works at: hp://digitalcommons.unl.edu/libphilprac Part of the Library and Information Science Commons Barik, Nilaranjan and Jena, Puspanjali, "Authorship Distribution and Collaboration in LIS Open Access Journals: A Scopus based analysis during 2001 to 2015" (2018). Library Philosophy and Practice (e-journal). 2033. hp://digitalcommons.unl.edu/libphilprac/2033
Transcript of Authorship Distribution and Collaboration in LIS Open ...

University of Nebraska - LincolnDigitalCommons@University of Nebraska - Lincoln
Library Philosophy and Practice (e-journal) Libraries at University of Nebraska-Lincoln
Fall 9-19-2018
Authorship Distribution and Collaboration in LISOpen Access Journals: A Scopus based analysisduring 2001 to 2015Nilaranjan BarikKIIT University, Bhubaneswar-751024, [email protected]
Puspanjali JenaUtkal University, Bhubaneswar-04, [email protected]
Follow this and additional works at: http://digitalcommons.unl.edu/libphilprac
Part of the Library and Information Science Commons
Barik, Nilaranjan and Jena, Puspanjali, "Authorship Distribution and Collaboration in LIS Open Access Journals: A Scopus basedanalysis during 2001 to 2015" (2018). Library Philosophy and Practice (e-journal). 2033.http://digitalcommons.unl.edu/libphilprac/2033
1 | P a g e
Authorship Distribution and Collaboration in LIS Open Access
Journals: A Scopus based analysis during 2001 to 2015
Mr. Nilaranjan Barik
Asst. Librarian, KIIT University, Bhubaneswar-751024, India
Email- [email protected]
Prof. (Dr.) Puspanjali Jena
Professor, Post Graduate Dept. of Library and Information Science
Utkal University, Bhubaneswar-751004, India
Email- [email protected]
Abstract: The present study is a bibliometric analysis of some selected open access Library
and Information Science (LIS) journals indexed in Scopus database during the period 2001 to
2015. The study has covered 10 LIS open access journals with 5208 publications to establish
an idea about the pattern of authorship, research collaboration, collaboration index, degree of
collaboration, collaboration coefficient, author’s productivity, ranking of prolific authors etc.
of said journals. Lotkas’s inverse square law has been applied to know the scientific
productivity of authors. Results show that, the covered LIS open access journals are dominant
with single authorship pattern. The value of Collaborative Index (0.73), Degree of
Collaboration (0.72), and Collaboration Coefficient (0.29) do not show the trend of
collaboration. Lotka’s law of author’s productivity is fitting to the present data set. The
country wise distribution of authorship based on the country of origin of the corresponding
author shows that 83 countries across the Globe are active in publication of their research in
LIS open access journals. United States of America (USA) is the leader country producing of
2822(54.19%) authors alone.
Keywords: Open Access, Bibliometrics, Collaboration Index, Degree of Collaboration,
Collaboration Coefficient, Lotka’s law.
Introduction
Scientific publishing is undergoing significant changes due to immense growth of online
publications and increases in the number of open access journals. Most leading publishers
like Elsevier, Taylor and Francis, Springer and others have introduced open access journals in
a big way and their acceptance among authors for publishing articles has also increased.
Open access journals are gaining its popularity because of free availability of articles on the
public internet, permitting any users to read, download, copy, distribute, print, search, or link
to the full texts of these articles. As the numbers of open access journals are growing in a big
way, it's a challenge for the authors to identify the best journals for their research and
publications. So, the present study entitled “Authorship Distribution and Collaboration in LIS
Open Access Journals: A Scopus based analysis during 2001 to 2015” is an attempt to
analyzed the authorship pattern, collaboration index, degree of collaboration, collaboration
coefficient, author productivity, and ranking of prolific authors of LIS open access journals

2 | P a g e
covered in the study during the period 2001 to 2015. The study will be a useful for the
authors and researchers in the field of Library and Information Science to be aware about the
ongoing trend of authorship, research collaboration, author’s productivity of LIS open access
journals.
Literature Review
The author have referred so many research papers and articles related to authorship studies of
LIS journals to have a clear understanding of ongoing trend of authorship studies and to find
out some possible ways to carry out the present study smoothly in a qualitative way.
Parameswaran and Smitha (2001) examine the 60 issues of Library and Information Science
Abstracts (LISA), published from 1994-1998, and reveal that single authors publications
were greater in number than collaborative work as covered by LISA. Tiew, Abdullah and
Kaur (2001) carry out a bibliometric examination of all the journal articles published in the
Malaysian Journal of Library & Information Science from 1996-2000 and reveal that the
percentage of multi-authored papers is slightly higher at 52.6%. Bharvi, Garg and Bali (2003)
analyze the 1317 papers published in first fifty volumes during 1978 to 2001 of the
international journal of Scientometric and show that the journal is dominated by the single
authored papers; however, multi authored papers are gaining momentum. Similar pattern has
been observed for domestic and international collaboration. Uzun (2004) identifies an
increase in the share of collaborative papers contributed by authors in JASIST, Journal of
Documentation, Journal of Information Science (JIS), and Information Processing &
Management (IP&M). Mittal, Sharma & Singh (2006) present in their study of 536 papers
covering to library and information science education from 1995 to 2004 and reveal that most
of the papers are contributed by single authors (72.8%) contribution and only less numbers of
papers are collaborated by two and more authors. Verma, Rajnish and Priyanka (2007) reveal
that most of the contributions of the journal Annals of Library and Information Studies are
contributed by single author. Mukherjee (2009) reveals the collaborative authorship pattern of
the Journal of the American Society for Information Science and Technology (JASIST)
during the period 2000 to 2007. Park (2010) studies the authorship characteristics of journal
D-Lib Magazine and reveals that the source journal is dominated by single author
contributions with 77% of papers. Pradhan and Chandrakar (2011) find in their study that
Indian LIS authors’ contribution to scholarly publication is moving towards single to two
authors as 75.88 % articles covered in the study are contributed by two authors. Thanuskodi
(2011) presents the authorship pattern of the journal Library Herald for the period 2006 to
2010 and reveals that out of 138 articles covered in the study single author contributions are
72 (52.17%) articles and rest 66 (47.83%) articles are contributed by joint authors. Warraich
and Ahmad (2011) analyze Pakistan Journal of Library and Information Science (PJLIS)
during 1995 to 2010 and reveal that the authors' collaboration is clearly visible in the journal
PJLIS. Ardanuy (2012) analyzes the level of co-authorship of Spanish research in Library and
Information Science (LIS) until 2009 and found a significant increase in all co-authorship,
including publications in English and those involving international collaboration. Priya and
Khaparde (2012) elucidate the trends of authorship pattern and authors' collaborative research

3 | P a g e
in their study covering with a sample of 12263 LIS articles that single authored contributions
are dominant in the journal Library Management. Thanuskodi (2012) shows the authorship
pattern of DESIDOC Journal of Library and Information Technology covering to a total of
199 articles published in the journal and finds that 116 articles, out of 199 articles are
contributed by joint authors while the rest 83 articles are contributed by single author. Yank
and Lee (2012) assess the research patterns and trends of library and information science
(LIS) in Korea and find an increasing trend for research collaboration among LIS authors.
Ardanuy (2013) shows the scientific output of Library and Information Science in Spain
during 2006-2010 and reveal that the authorship pattern of published works indicates towards
multi authorship. Barik and Jena (2013) analyse the authorship patterns of journal Trends in
Information Management and reveal that the source journal is dominant by joint authorship
pattern. The degree of authors' collaboration is not so strong in the journal. However, the
journal constitutes 28% of foreign authors’ contributions. Khaparde (2013) reveals in the
study E- Journals in Library and Information Science: A bibliometric study that joint
authorship has dominated the research where male authors have the dominance over gender
with (66.28%) of total publications and collaborative research with (64.11%) publications.
Khurshid (2013) measures the quality of articles published in foreign LIS journals by
Pakistani authors and reveals that the authorship patterns show a shift from single-authorship
to collaborative authorship. Pandita (2013) undertakes a bibliometric study of Annals of
Library and Information Studies (ALIS) journal during the last decade and finds that 65.81%
articles of the journal are contributed on co-authorship pattern. Swain, Swain and Rautaray
(2013) examine the scholarly communications in Library Review (LR) from 2007 to 2011
and to reveal that single authored articles occupy the prominent position indicating the
supremacy of solo research in Library Review. The degree of collaboration in the
publications of this journal is found to be 0.36. Satpathy, Maharana and Das (2014)
investigate the scholarly communications in open access journals of Library & Information
Science and show that single authored papers are found to be the highest (40.48 percent),
followed by two-authored and then three-authored papers. The degree of collaboration is
found to be between 0.33 and 0.8. Singh and Chander (2014) explore the authorship pattern
of the journal Library Management, and highlight that the journal has produced majority of
the contributions by single authors during the period 2006-2012. Swain (2014) shows the
authorship patterns of International Information and Library Review from 2004 to 2013 and
highlights that majority of papers are published in single authorship mode followed by two-
authorship mode. It is seen that contributions in three-authorship and more than three-
authorship mode are quite less. The degree of collaboration is found to be 0.45, indicating
less intensity of collaborative trend of research. Das (2015) highlights the authorship pattern
and research collaboration in the area of Informetrics based on 420 scholarly communications
appeared in the Journal of Informetrics during 2007 to 2013. Study illustrates various
significant aspects like types and trends of authorship, author productivity, degree of
collaboration, collaborative index, geographical diffusion and institutional diversification of
authorship. Swain (2015) shows the authorship patterns of Library Hi Tech from 2004 to
2013 and highlights that the majority of papers are produced in single authorship mode
followed by two-authorship mode. The degree of collaboration (DC) in Library Hi Tech

4 | P a g e
publications is found to be 0.519 indicating less intensity of collaborative trend of research.
Verma, Sonkar and Gupta (2015) show the authorship pattern of Library Philosophy and
Practice from 2005 to 2014 and reveal that single authorship is leading authorship trend in the
journal and the rate of degree of collaboration is 0.51. Vellaichamy and Jeyshankar (2015)
analyse the 158 papers published in the journal Webology during the period 2004-2013 and
reveal that single authorship possess a lead role in the journal. Zakaria (2015) studies the
authorship pattern of Arab Librarians who published in Library and Information Science
journals. The study analyses the journal research publications in Library and Information
Science journals by professional librarians from 1981 to 2010. Single-author articles are
found to be highly followed by two and three authored articles. The average degree of
collaboration between authors in Library and Information Science journals is 9.64% (only 19
journal articles written by at least two or three authors). Khan (2016) explores the
bibliometric analysis of the LIBRI: International Journal of Libraries and Information
Services during the period of 2011-2015. The result shows that out of 140 research articles
63(45%) articles are contributed by single authored whereas, 77(55%) articles were
contributed by multi-authored. The average degree of author collaboration was 0.55 which
ranges from 0.57 to 0.58. Shukla and Moyon (2017) analyze the bibliometric analysis of
Indian open access LIS journal for five years from 2011 to 2015 covering 218 publications
and reveal that two authorship patterns is prevelant with 0.66 degree of collaboration. Suresh
(2017) examines authorship pattern of 556 papers published in Journal of Documentation
during 2003 to 2015 and finds that almost half of the total publications published by single
authors.
Objectives of the study
The main objectives of the present study are;
• To establish an idea on yearly distribution of publications of LIS open access journals,
• To know the journal wise distribution of authorship pattern,
• To identify the strength of Single Vrs Collaborative authorship,
• To identify the Collaborative Index (CI), Degree of Collaboration (DC), and
Collaborative Coefficient (CC) of authors,
• To study the author’s productivity,
• To trace authorship patterns by country of authors, and most prolific authors
Scope & Limitations
The scope of the present study is limited to only open access journals published in the field of
Library and Information Science and indexed in Scopus database. The study is to focus on the
journals which are only registered under Directory of Open Access Journals (DOAJ) and
indexed for a period of 15 years uninterruptedly. The period of study is to cover from the year
2001 to 2015. The source journals are identified by consulting the Scopus database pertaining
to the following criterion to avoid unnecessary influence and ambiguity in selecting the
journals. The criterion followed are: i) The journal must have published in an open access
platform and registered in Directory of Open Access Journals (DOAJ; ii) The journal must

5 | P a g e
have indexed in Scopus database for a period of 15 years continuously from the year 2001-
2015 and there must not be discontinuation of any year; iii) Publication status of journal must
be showing Active as on 31st December, 2015.
Based on the aforesaid criterion for selecting of journals, the study found 10 numbers of
Scopus indexed open access Library and Information Science journals fitting to the study.
The journals covered in the study with their abbreviation are; i) College and Research
Libraries (LRL), ii) D-Lib Magazine (D-Lib), iii) Information Research (IR), iv) Information
Technology and Libraries (ITL), v) Informing Sciences (IS), vi) Journal of the Medical
Library Association (JMLA), vii) LIBER Quarterly (LIBERQ), viii) Library and Information
Science Research (LISR), ix) Libres (LIBRES), x) School Library Media Research (SLMR).
Methodology
The publications of selected 10 journals were searched individually one by one ranging from
the year 2001 to 2015 in the Scopus database. The required data were exported in an excel
spreadsheet and analyzed using some statistical methods like average, mean, percentage etc.
The gathered data were tabulated for final presentation of the results.
Results & Discussions
Year wise Distribution of LIS Open Access Publications
Table 1 depicts the year wise distribution of 10 LIS open access journals covered in the
study. During the period 2001 to 2015, a total numbers of 5208 publications are indexed in
Scopus database. The year wise distribution of publications show that in the year 2002, a
highest number of 433(8.31%) publications were witnessed followed by the year 2003 with
416(7.99%) publications, and 2006 with 405(7.78%) publications. The year 2013 has
witnessed a very low numbers of publications with 285(5.47%).
It is observed in the study that, the year wise distribution of journals do not show any
increasing trend, however the cumulative numbers of distribution shows a steady growth of
publications. Further it is seen that, not a single journal is strict to a constant numbers of
publications by its issues or by its volumes. Every journal has a distribution of random
numbers of publications in each year. Figure 1 shows the year wise distribution of
publications.
Table 1: Year wise Distribution of Publications

6 | P a g e
Figure 1: Year wise Distribution of Publications
Distribution of Authorship Pattern
Table 2 shows the authorship pattern of the LIS open access journals covered in the study.
During the period 2001 to 2015, single authorship contribution is dominant with highest
2791(53.59%) publications, followed by two authorship contribution with 1209(23.21%)
publications, and three authorship contribution with 627(12.04%) publications. The data set
shows that, there are no such established research groups in this area or the researchers are
not interested to publish their research by collaborative authorship. Further, the study throws
light in the journal wise authorship pattern and finds that, JMLA is the only LIS open access
journals having ≥2 mean authorship while other journals have ≥1 mean authorship. The
average mean of authorship has found to be 1.93. This means the authorship pattern of LIS
open access journals clearly indicates towards single authorship publications.
Further it is observed that D-Lib has produced highest 2579(25.59%) authorship followed by
JMLA with 2322(23.04%) authorship and IR with 1230(12.21%) authorship. The lowest
percentage of authorship has been contributed by the journal SLMR with 173(1.72%). Figure

7 | P a g e
2 illustrates the authorship pattern and mean of authorship of the LIS open access journals
covered in the study.
Table 2: Distribution of Authorship Pattern
Figure 2: Authorship Pattern
Single Authorship Vrs Collaborative Authorship
In the present study, table 3 shows the number of single vrs collaborative authored
publications. Single authored publications have shown an increasing trend throughout the
period of study except the years 2009, 2010, 2011, 2013, and 2014. Out of 5208 publications
highest 2791(53.59%) publications were contributed with Single Authorship and only
2417(46.41%) publications were contributed by Collaborative Authorship contribution.
Further it is seen that a total of 10077 authorship have been counted for 5208 publications.
The mean of authorship per publication is seen at 1.95 which is less than 2 or far from
collaboration. So, the present dataset shows that LIS open access journals do not favor
collaborative research. The year wise Single authorship Vrs Collaborative authorship is
depicted in figure 3.

8 | P a g e
Table 3: Single Authorship Vrs Collaborative Authorship
Figure 3: Single Authorship Vrs Collaborative Authorship
Collaborative Index (CI), Degree of Collaboration (DC), and Collaborative Coefficient
(CC) among authors
The Collaborative Index (CI), Degree of Collaboration (DC), and Collaborative Coefficient
(CC) among authors in LIS open access journals covered in the study are shown in table 4.
Collaborative Index is a mean number of authors per publication. The formula used to
identify Collaborative Index of authors per publication is; CI= (total publications)/ (total
collaborative authors). The CI mean value in the present study shows to be 0.73 which is so
weak at its label.
For analysis of Degree of Collaboration among authors, the study has applied the
Subramanian’s equation of C= (Nm/ Nm+Ns) where; C= degree of collaboration, Nm= number
of multi-authored work, and Ns= number of single-authored works to examine the extent of

9 | P a g e
research collaboration among LIS authors and prominent area of inquiry indicating the
patterns of single and joint authors’ publication. It is observed that, the DC value has ranged
up and down from minimum 0.58 to maximum 0.87 which shows a weak intensity of
author’s collaboration at 0.72. Correspondingly, the Collaboration Co-efficient value which
measures the extent and strength of collaboration among the authors shows at 0.29 which is
also so weak at its level. This implies that, the LIS open access journals are far from
collaborative research. Figure 4 clearly shows the graphical presentation of CI,DC, and CC
values of LIS open access journals.
Table 4: Collaborative Index (CI), Degree of Collaboration (DC), and Collaborative
Coefficient (CC)
Figure 4: CI, DC & CC of authors

10 | P a g e
Author’s Productivity and Applicability of Lotka’s Law
Lotka's inverse square law of scientific productivity is a widely used law for bibliometric
mapping of research outputs and authors’ productivity in any discipline of knowledge.
Lotka's law states that the number of authors making n contributions is about 1/n² of those
making one; and the proportion of all contributors, that make a single contribution, is about
60 percent. This means that out of all the authors in a given field, 60 percent will have just
one publication, and 15 percent will have two publications, 7 percent of authors will have
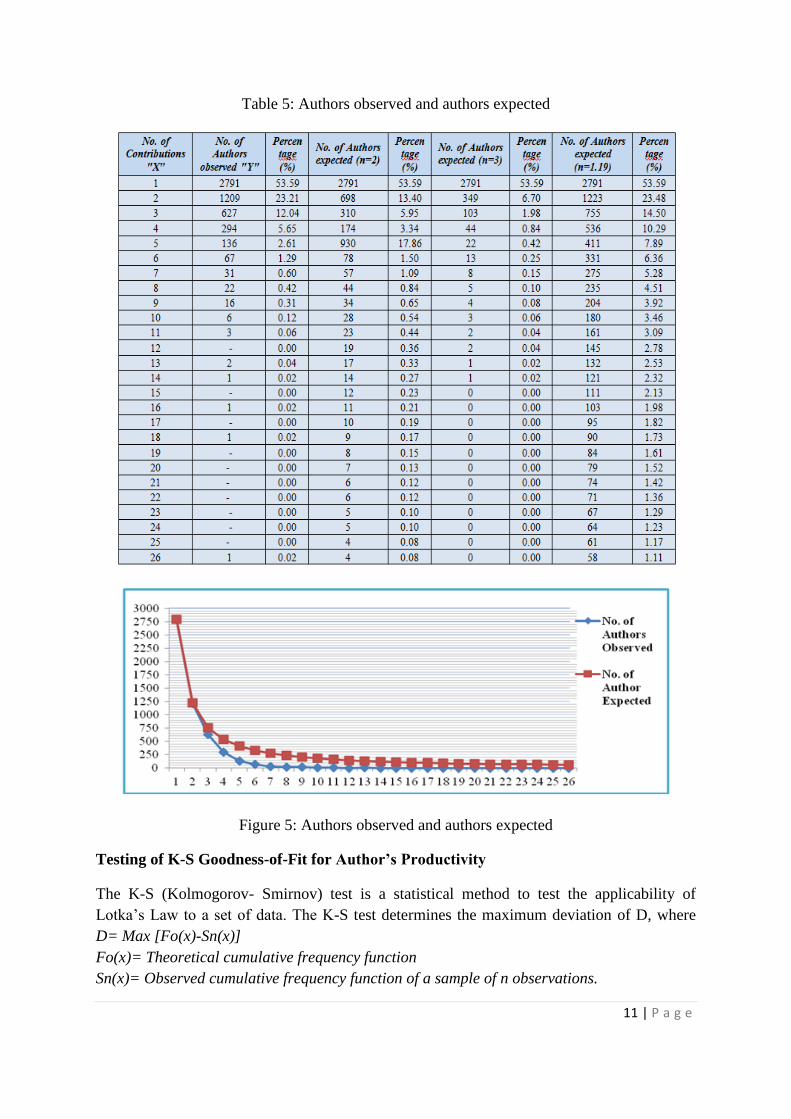
three publications and so on. Table 5 shows the author’s productivity and applicability of
Lotka's law to the following data set. The study finds that with one article contribution 2791
(53.59%) authors are both observed and expected. Whereas for two articles contribution 1209
(23.21%) authors are observed and 1223 (23.48%) authors expected. Again for three articles
contribution 627(12.04%) authors observed and 755(14.50%) authors expected. So, in this
following data set it is found that the numbers of authors observed are somehow equal with
the numbers of authors expected. So, the study fits to Lotka’s law of scientific productivity.
Figure 5 shows the authors observed and authors expected value for the present data set.
Lotk'a formula for scientific productivity of authors has been applied in the present study as
XnY= C and Y= C/Xn Where, X= number of publications, Y= relative frequency of authors
with ‘X’ publications, and C= constants depending on the specified field.
Putting the value of X= 1 and Y= 2791, the calculation obtained is;
1n.2791= C
=> C=2791
Again putting the value of X= 2 and Y= 1209 and C= 2791 the calculation obtained is;
2n.1209= 2791
=> 2n= 2791/1209
=> nlog2= log2.308
=> n(0.301)= 0.361
=> n= 2.30/0.301
=> n=1.19
11 | P a g e
Table 5: Authors observed and authors expected
Figure 5: Authors observed and authors expected
Testing of K-S Goodness-of-Fit for Author’s Productivity
The K-S (Kolmogorov- Smirnov) test is a statistical method to test the applicability of
Lotka’s Law to a set of data. The K-S test determines the maximum deviation of D, where
D= Max [Fo(x)-Sn(x)]
Fo(x)= Theoretical cumulative frequency function
Sn(x)= Observed cumulative frequency function of a sample of n observations.
12 | P a g e
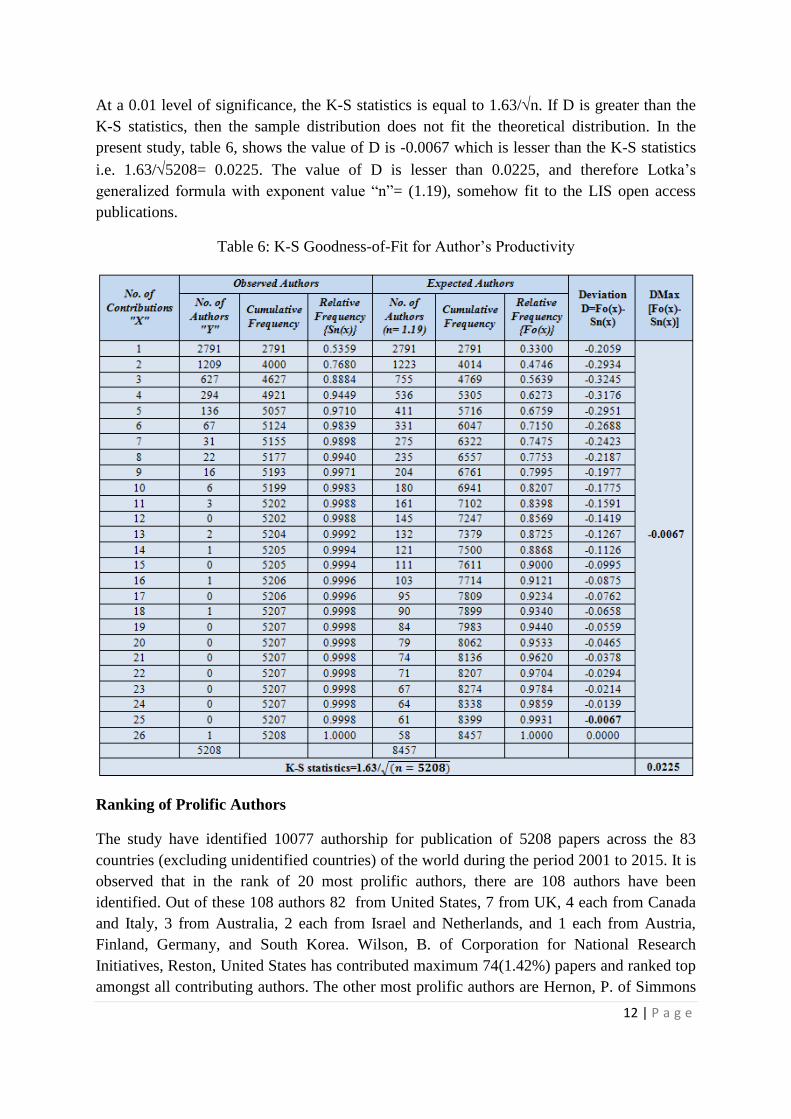
At a 0.01 level of significance, the K-S statistics is equal to 1.63/n. If D is greater than the
K-S statistics, then the sample distribution does not fit the theoretical distribution. In the
present study, table 6, shows the value of D is -0.0067 which is lesser than the K-S statistics
i.e. 1.63/5208= 0.0225. The value of D is lesser than 0.0225, and therefore Lotka’s
generalized formula with exponent value “n”= (1.19), somehow fit to the LIS open access
publications.
Table 6: K-S Goodness-of-Fit for Author’s Productivity
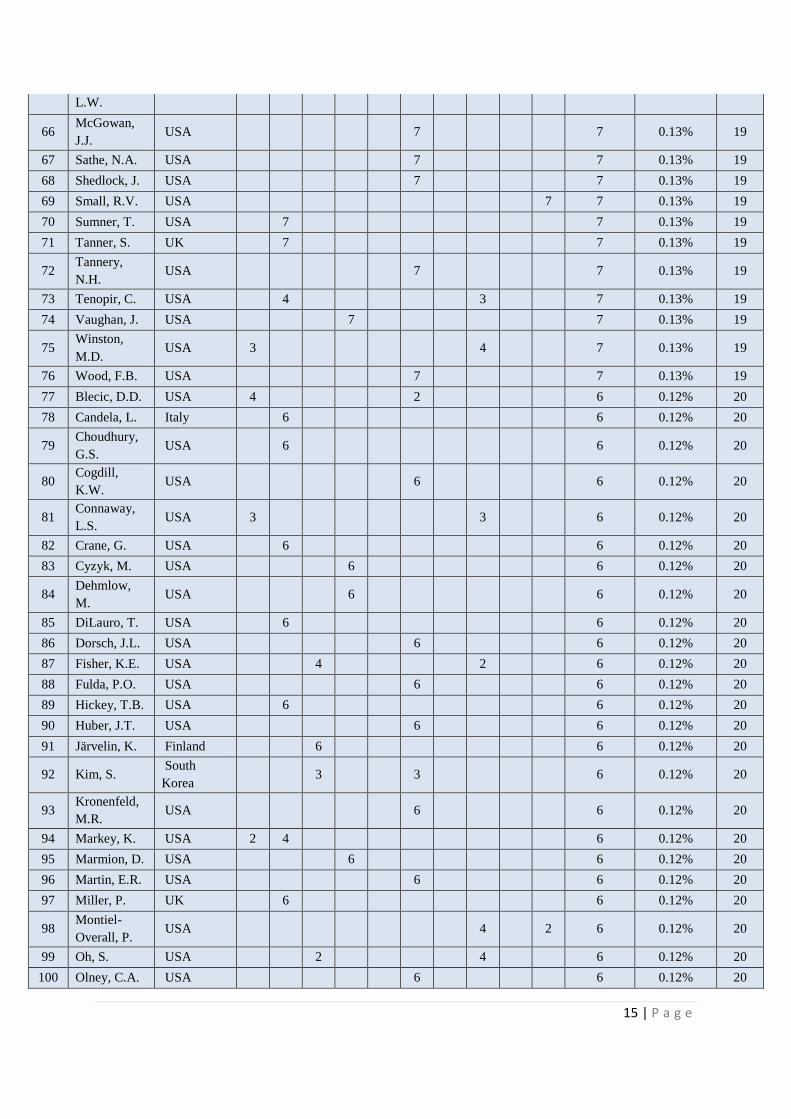
Ranking of Prolific Authors
The study have identified 10077 authorship for publication of 5208 papers across the 83
countries (excluding unidentified countries) of the world during the period 2001 to 2015. It is
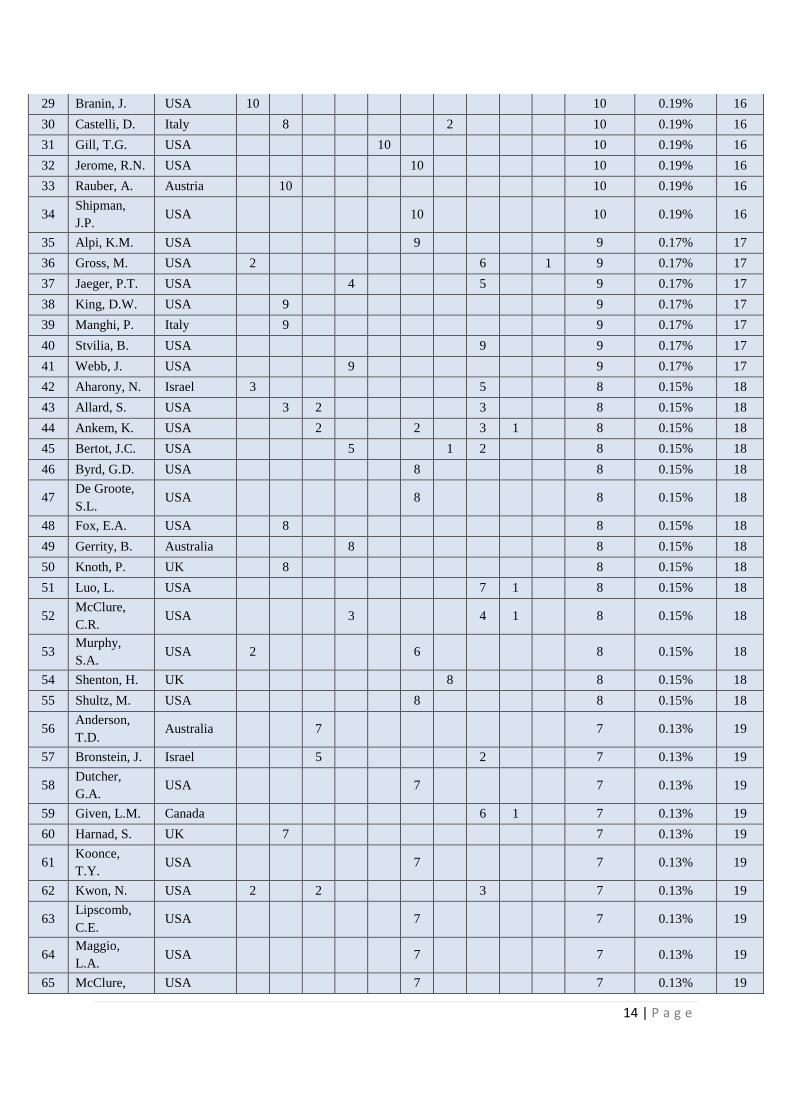
observed that in the rank of 20 most prolific authors, there are 108 authors have been
identified. Out of these 108 authors 82 from United States, 7 from UK, 4 each from Canada
and Italy, 3 from Australia, 2 each from Israel and Netherlands, and 1 each from Austria,
Finland, Germany, and South Korea. Wilson, B. of Corporation for National Research
Initiatives, Reston, United States has contributed maximum 74(1.42%) papers and ranked top
amongst all contributing authors. The other most prolific authors are Hernon, P. of Simmons

13 | P a g e
College, Boston, United States with 62(1.19%) papers, followed by Schwartz, C. of Simmons
College, Boston, United States with 55(1.06%) papers, Wilson, T of USA with 45(0.86%)
papers, and Lannom, L. of Corporation for National Research Initiatives, Reston, United
States with 35(0.67%). A detailed list of prolific authors is depicted in table 7. ,,,
Table 7: Ranking of Prolific Authors
Sl
No Author Country
No. of Publications in the Source Journals Total
(n=5208)
Percentage
(%) Rank
CR
L
D-L
IB
IR
ITL
IS
JM
LA
LIB
ER
LIS
R
LIB
RE
SL
MR
1 Wilson, B. USA 74 74 1.42% 1
2 Hernon, P. USA 7 55 62 1.19% 2
3 Schwartz, C. USA 55 55 1.06% 3
4 Wilson, T. USA 45 45 0.86% 4
5 Lannom, L. USA 35 35 0.67% 5
6 Plutchak,
T.S. USA 21 21 0.40% 6
7 Savolainen,
R. UK 11 8 19 0.36% 7
8 Wilson, T.D. USA 19 19 0.36% 7
9 Giuse, N.B. USA 18 18 0.35% 8
10 Nelson, M.L. USA 17 17 0.33% 9
11 Morris, C.M. USA 16 16 0.31% 10
12 Bakker, T. USA 15 15 0.29% 11
13 Truitt, M. Canada 15 15 0.29% 11
14 Walter, S. USA 15 15 0.29% 11
15 Starr, S. USA 14 14 0.27% 12
16 Brooks, T.A. USA 13 13 0.25% 13
17 Julien, H. Canada 3 10 13 0.25% 13
18 Van De
Sompel, H. USA 13 13 0.25% 13
19 Ayris, P. Germany 12 12 0.23% 14
20 Williamson,
K. Australia 4 6 2 12 0.23% 14
21 Angevaare,
I. Netherlands 11 11 0.21% 15
22 Dekeyser, R. USA 11 11 0.21% 15
23 Dilevko, J. Canada 3 8 11 0.21% 15
24 Eldredge,
J.D. USA 11 11 0.21% 15
25 Epstein, B.A. USA 11 11 0.21% 15
26 Lagoze, C. USA 11 11 0.21% 15
27 Tennant,
M.R. USA 11 11 0.21% 15
28 Thelwall, M. UK 4 6 1 11 0.21% 15
14 | P a g e
29 Branin, J. USA 10 10 0.19% 16
30 Castelli, D. Italy 8 2 10 0.19% 16
31 Gill, T.G. USA 10 10 0.19% 16
32 Jerome, R.N. USA 10 10 0.19% 16
33 Rauber, A. Austria 10 10 0.19% 16
34 Shipman,
J.P. USA 10 10 0.19% 16
35 Alpi, K.M. USA 9 9 0.17% 17
36 Gross, M. USA 2 6 1 9 0.17% 17
37 Jaeger, P.T. USA 4 5 9 0.17% 17
38 King, D.W. USA 9 9 0.17% 17
39 Manghi, P. Italy 9 9 0.17% 17
40 Stvilia, B. USA 9 9 0.17% 17
41 Webb, J. USA 9 9 0.17% 17
42 Aharony, N. Israel 3 5 8 0.15% 18
43 Allard, S. USA 3 2 3 8 0.15% 18
44 Ankem, K. USA 2 2 3 1 8 0.15% 18
45 Bertot, J.C. USA 5 1 2 8 0.15% 18
46 Byrd, G.D. USA 8 8 0.15% 18
47 De Groote,
S.L. USA 8 8 0.15% 18
48 Fox, E.A. USA 8 8 0.15% 18
49 Gerrity, B. Australia 8 8 0.15% 18
50 Knoth, P. UK 8 8 0.15% 18
51 Luo, L. USA 7 1 8 0.15% 18
52 McClure,
C.R. USA 3 4 1 8 0.15% 18
53 Murphy,
S.A. USA 2 6 8 0.15% 18
54 Shenton, H. UK 8 8 0.15% 18
55 Shultz, M. USA 8 8 0.15% 18
56 Anderson,
T.D. Australia 7 7 0.13% 19
57 Bronstein, J. Israel 5 2 7 0.13% 19
58 Dutcher,
G.A. USA 7 7 0.13% 19
59 Given, L.M. Canada 6 1 7 0.13% 19
60 Harnad, S. UK 7 7 0.13% 19
61 Koonce,
T.Y. USA 7 7 0.13% 19
62 Kwon, N. USA 2 2 3 7 0.13% 19
63 Lipscomb,
C.E. USA 7 7 0.13% 19
64 Maggio,
L.A. USA 7 7 0.13% 19
65 McClure, USA 7 7 0.13% 19
15 | P a g e
L.W.
66 McGowan,
J.J. USA 7 7 0.13% 19
67 Sathe, N.A. USA 7 7 0.13% 19
68 Shedlock, J. USA 7 7 0.13% 19
69 Small, R.V. USA 7 7 0.13% 19
70 Sumner, T. USA 7 7 0.13% 19
71 Tanner, S. UK 7 7 0.13% 19
72 Tannery,
N.H. USA 7 7 0.13% 19
73 Tenopir, C. USA 4 3 7 0.13% 19
74 Vaughan, J. USA 7 7 0.13% 19
75 Winston,
M.D. USA 3 4 7 0.13% 19
76 Wood, F.B. USA 7 7 0.13% 19
77 Blecic, D.D. USA 4 2 6 0.12% 20
78 Candela, L. Italy 6 6 0.12% 20
79 Choudhury,
G.S. USA 6 6 0.12% 20
80 Cogdill,
K.W. USA 6 6 0.12% 20
81 Connaway,
L.S. USA 3 3 6 0.12% 20
82 Crane, G. USA 6 6 0.12% 20
83 Cyzyk, M. USA 6 6 0.12% 20
84 Dehmlow,
M. USA 6 6 0.12% 20
85 DiLauro, T. USA 6 6 0.12% 20
86 Dorsch, J.L. USA 6 6 0.12% 20
87 Fisher, K.E. USA 4 2 6 0.12% 20
88 Fulda, P.O. USA 6 6 0.12% 20
89 Hickey, T.B. USA 6 6 0.12% 20
90 Huber, J.T. USA 6 6 0.12% 20
91 Järvelin, K. Finland 6 6 0.12% 20
92 Kim, S. South
Korea 3 3 6 0.12% 20
93 Kronenfeld,
M.R. USA 6 6 0.12% 20
94 Markey, K. USA 2 4 6 0.12% 20
95 Marmion, D. USA 6 6 0.12% 20
96 Martin, E.R. USA 6 6 0.12% 20
97 Miller, P. UK 6 6 0.12% 20
98 Montiel-
Overall, P. USA 4 2 6 0.12% 20
99 Oh, S. USA 2 4 6 0.12% 20
100 Olney, C.A. USA 6 6 0.12% 20

16 | P a g e
101 Pagano, P. Italy 6 6 0.12% 20
102 Rethlefsen,
M.L. USA 6 6 0.12% 20
103 Scherrer,
C.S. USA 6 6 0.12% 20
104 te Boekhorst,
P. USA 6 6 0.12% 20
105 Van Veen, T. Netherlands 6 6 0.12% 20
106 Warner, S. USA 6 6 0.12% 20
107 Weller, A.C. USA 2 4 6 0.12% 20
108 Wessel, C.B. USA 6 6 0.12% 20
2991 Authors with range of 5-1 publications each 4043 77.63% -
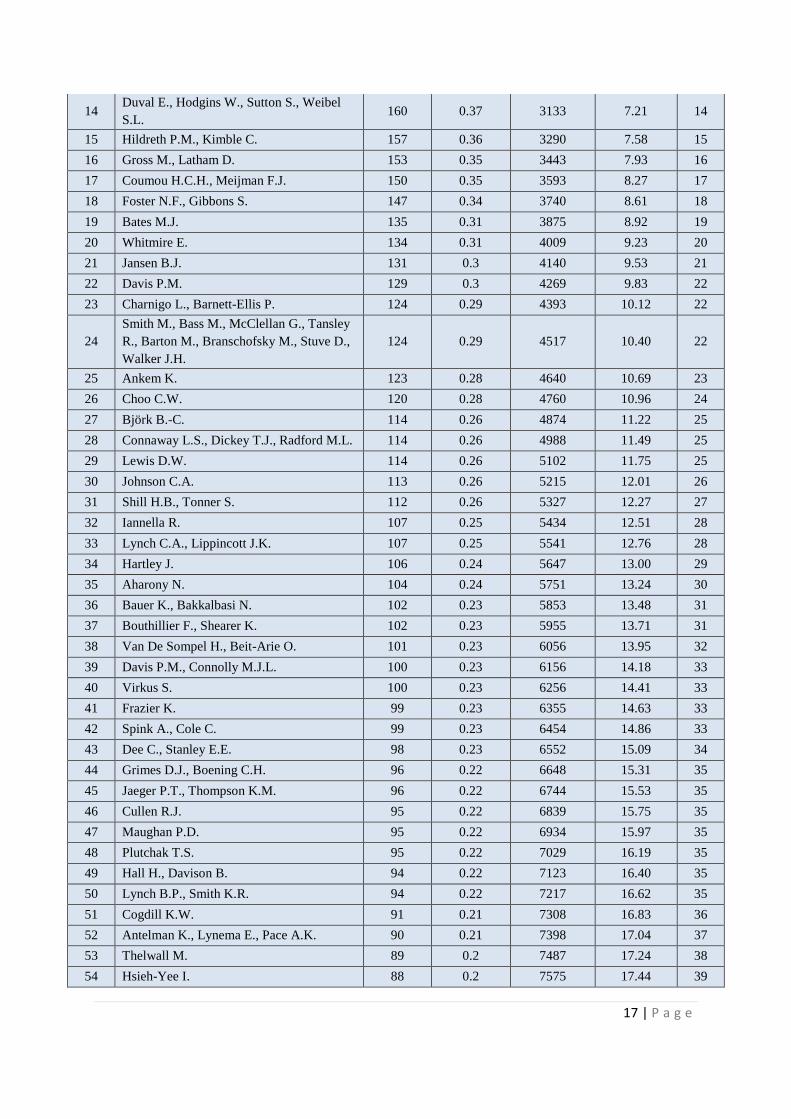
Most cited Authorship
Table 8 shows the most cited authorship of LIS open access journals during the period 2001
to 2015. Amongst the 10077 authorship across the 83 countries, the most cited authors have
been identified based on their citations count. Wilson T.D. is in top among all the authors
with 407(0.94%) citations followed by Hammond T., Hannay T., Lund B., Scott J. with
294(0.68%) citations, Levy Y., Ellis T.J. with 277(0.64%) citations and so on. It is seen that
among the top 100 highly cited authorship, there are 37 highly cited authorship are from
single authorship contribution and 63 are from collaborative contribution. So, the trend
shows that collaborative contributions are highly cited by LIS authors and researchers. Table
9 shows the detailed list of most cited authorship.
Table 8: Most cited Authors
Sl
No. Most Cited Authorship
Total
Citations
Percentage
(%)
Cumulative
Citations
Percentage
(%) Rank
1 Wilson T.D. 407 0.94 407 0.94 1
2 Hammond T., Hannay T., Lund B., Scott J. 294 0.68 701 1.61 2
3 Levy Y., Ellis T.J. 277 0.64 978 2.25 3
4 Saha S., Saint S., Christakis D.A. 269 0.62 1247 2.87 4
5 Borlund P. 225 0.52 1472 3.39 5
6 Savolainen R. 219 0.5 1691 3.89 6
7 Harnad S., Brody T. 216 0.5 1907 4.39 7
8 Case D.O., Andrews J.E., Johnson J.D.,
Allard S.L. 198 0.46 2105 4.85 8
9 Guy M., Tonkin E. 188 0.43 2293 5.28 9
10 Glanville J.M., Lefebvre C., Miles J.N.V.,
Camosso-Stefinovic J. 177 0.41 2470 5.69 10
11 Heinström J. 173 0.4 2643 6.09 11
12 Wong S.S.-L., Wilczynski N.L., Haynes
R.B. 168 0.39 2811 6.47 12
13 Knight S.-A., Burn J. 162 0.37 2973 6.85 13
17 | P a g e
14 Duval E., Hodgins W., Sutton S., Weibel
S.L. 160 0.37 3133 7.21 14
15 Hildreth P.M., Kimble C. 157 0.36 3290 7.58 15
16 Gross M., Latham D. 153 0.35 3443 7.93 16
17 Coumou H.C.H., Meijman F.J. 150 0.35 3593 8.27 17
18 Foster N.F., Gibbons S. 147 0.34 3740 8.61 18
19 Bates M.J. 135 0.31 3875 8.92 19
20 Whitmire E. 134 0.31 4009 9.23 20
21 Jansen B.J. 131 0.3 4140 9.53 21
22 Davis P.M. 129 0.3 4269 9.83 22
23 Charnigo L., Barnett-Ellis P. 124 0.29 4393 10.12 22
24
Smith M., Bass M., McClellan G., Tansley
R., Barton M., Branschofsky M., Stuve D.,
Walker J.H.
124 0.29 4517 10.40 22
25 Ankem K. 123 0.28 4640 10.69 23
26 Choo C.W. 120 0.28 4760 10.96 24
27 Björk B.-C. 114 0.26 4874 11.22 25
28 Connaway L.S., Dickey T.J., Radford M.L. 114 0.26 4988 11.49 25
29 Lewis D.W. 114 0.26 5102 11.75 25
30 Johnson C.A. 113 0.26 5215 12.01 26
31 Shill H.B., Tonner S. 112 0.26 5327 12.27 27
32 Iannella R. 107 0.25 5434 12.51 28
33 Lynch C.A., Lippincott J.K. 107 0.25 5541 12.76 28
34 Hartley J. 106 0.24 5647 13.00 29
35 Aharony N. 104 0.24 5751 13.24 30
36 Bauer K., Bakkalbasi N. 102 0.23 5853 13.48 31
37 Bouthillier F., Shearer K. 102 0.23 5955 13.71 31
38 Van De Sompel H., Beit-Arie O. 101 0.23 6056 13.95 32
39 Davis P.M., Connolly M.J.L. 100 0.23 6156 14.18 33
40 Virkus S. 100 0.23 6256 14.41 33
41 Frazier K. 99 0.23 6355 14.63 33
42 Spink A., Cole C. 99 0.23 6454 14.86 33
43 Dee C., Stanley E.E. 98 0.23 6552 15.09 34
44 Grimes D.J., Boening C.H. 96 0.22 6648 15.31 35
45 Jaeger P.T., Thompson K.M. 96 0.22 6744 15.53 35
46 Cullen R.J. 95 0.22 6839 15.75 35
47 Maughan P.D. 95 0.22 6934 15.97 35
48 Plutchak T.S. 95 0.22 7029 16.19 35
49 Hall H., Davison B. 94 0.22 7123 16.40 35
50 Lynch B.P., Smith K.R. 94 0.22 7217 16.62 35
51 Cogdill K.W. 91 0.21 7308 16.83 36
52 Antelman K., Lynema E., Pace A.K. 90 0.21 7398 17.04 37
53 Thelwall M. 89 0.2 7487 17.24 38
54 Hsieh-Yee I. 88 0.2 7575 17.44 39

18 | P a g e
55 Majid S., Foo S., Luyt B., Zhang X., Theng
Y.-L., Chang Y.-K., Mokhtar I.A. 88 0.2 7663 17.65 39
56 Järvelin K., Ingwersen P. 87 0.2 7750 17.85 40
57 Tenopir C., King D.W., Boyce P., Grayson
M., Zhang Y., Ebuen M. 84 0.19 7834 18.04 41
58 McGowan J., Sampson M. 83 0.19 7917 18.23 42
59 Shultz M. 83 0.19 8000 18.42 42
60 Björk B.-C., Roos A., Lauri, M. 82 0.19 8082 18.61 43
61 George C., Bright A., Hurlbert T., Linke
E.C., St. Clair G., Stein J. 82 0.19 8164 18.80 43
62 Hernon P., Powell R.R., Young A.P. 82 0.19 8246 18.99 43
63 Kuh G.D., Gonyea R.M. 82 0.19 8328 19.18 43
64 Evans D. 81 0.19 8409 19.36 43
65 Julien H., Barker S. 81 0.19 8490 19.55 43
66 Lund B., Hammond T., Flack M., Hannay
T. 81 0.19 8571 19.74 43
67 Tenopir C., King D.W., Bush A. 81 0.19 8652 19.92 43
68 Holley R. 79 0.18 8731 20.11 44
69 Shank J.D., Dewald N.H. 79 0.18 8810 20.29 44
70 Järvelin K., Wilson T.D. 76 0.18 8886 20.46 45
71 Kwon N. 76 0.18 8962 20.64 45
72 Sollaci L.B., Pereira M.G. 75 0.17 9037 20.81 46
73 Van De Sompel H., Nelson M.L., Lagoze
C., Warner S. 75 0.17 9112 20.98 46
74 Andrews J.E., Pearce K.A., Ireson C., Love
M.M. 74 0.17 9186 21.15 47
75 Ponzi L.J., Koenig M. 74 0.17 9260 21.32 47
76 Burkell J. 73 0.17 9333 21.49 48
77 Agosto D.E., Hughes-Hassell S. 72 0.17 9405 21.66 49
78 Kim K.-S. 72 0.17 9477 21.82 49
79 Mackey T.P., Jacobson T.E. 72 0.17 9549 21.99 49
80 Agosto D.E. 71 0.16 9620 22.15 50
81 Chua A.Y.K., Goh D.H. 71 0.16 9691 22.32 50
82 De Groote S.L., Dorsch J.L. 71 0.16 9762 22.48 50
83 Dervin B. 71 0.16 9833 22.64 50
84 Johnson R.K. 71 0.16 9904 22.81 50
85 Booth A. 70 0.16 9974 22.97 51
86 Herring S.D. 70 0.16 10044 23.13 51
87 Marchionini G., Geisler G. 70 0.16 10114 23.29 51
88 Tabatabai D., Shore B.M. 70 0.16 10184 23.45 51
89 Van De Sompel H., Payette S., Erickson J.,
Lagoze C., Warner S. 70 0.16 10254 23.61 51
90 Foley M. 69 0.16 10323 23.77 52
91 McGillis L., Toms E.G. 68 0.16 10391 23.93 53
92 Hayslett M.M., Wildemuth B.M. 66 0.15 10457 24.08 54

19 | P a g e
93 Hendrix D., Chiarella D., Hasman L.,
Murphy S., Zafron M.L. 66 0.15 10523 24.23 54
94 Nesset V., Large A. 66 0.15 10589 24.39 54
95 Shah C., Oh S., Oh J.S. 66 0.15 10655 24.54 54
96 Xie H. 65 0.15 10720 24.69 55
97 Nisonger T.E., Davis C.H. 65 0.15 10785 24.84 55
98
Urquhart C., Light A., Thomas R., Barker
A., Yeoman A., Cooper J., Armstrong C.,
Fenton R., Lonsdale R., Spink S.
65 0.15 10850 24.99 55
99 Dorsch J.L., Aiyer M.K., Meyer L.E. 64 0.15 10914 25.13 56
100 Fisher K.E., Marcoux E., Miller L.S.,
Sánchez A., Cunningham E.R. 64 0.15 10978 25.28 56
101-
3188 Other 3088 authorship 32446 74.72 43424 100.00 -
TOTAL 43424 100 - - -
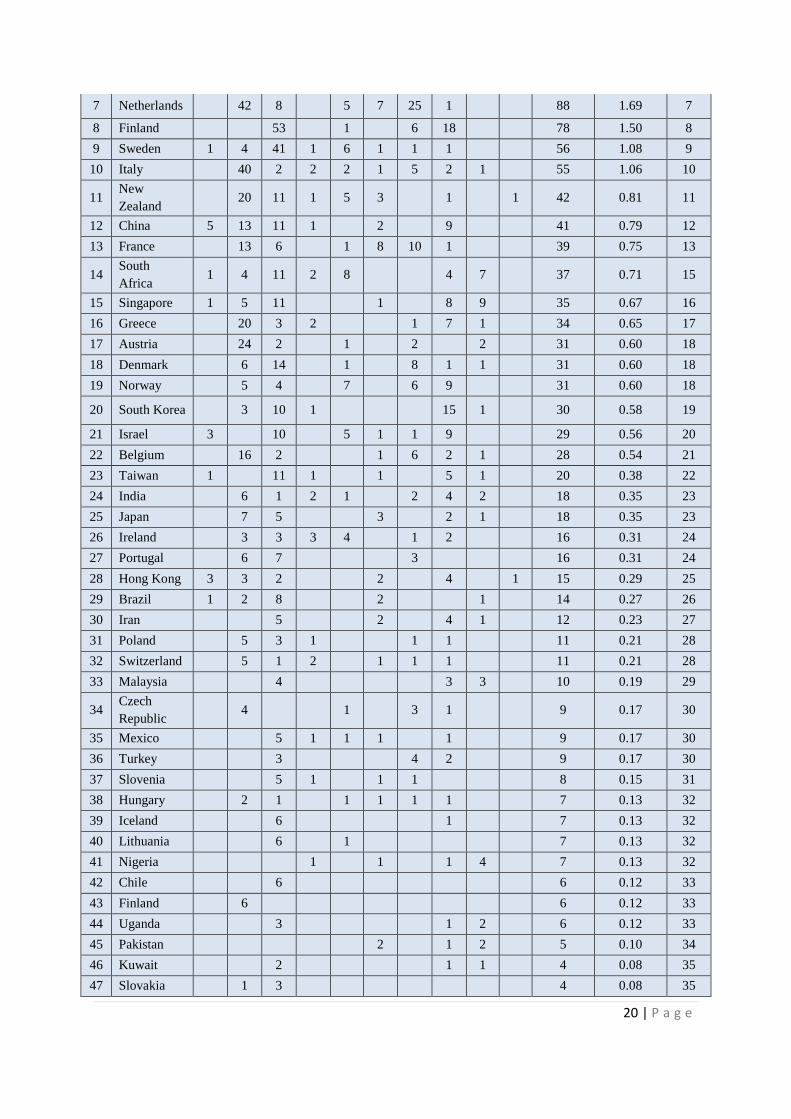
Country wise Authorship Distribution
The country wise distribution of authorship has been counted based on the country of origin
of the corresponding author. Authors from 83 countries (excluding unidentified countries)
across the world are active in publication of their research in LIS open access journals.
Amongst them authors from America and Europe are the leaders. Table 9 shows that United
States of America (USA) is the top country producing of 2822(54.19%) authors alone
followed by United Kingdom (UK) with 372(7.14%) authors, Canada with 242(4.65%)
authors, Australia with 176(3.38%) authors and so on. United States of America alone
contributes more than fifty percent of authorship to the LIS open access journals. Amongst
the Asian countries China, Singapore and Taiwan are much ahead of India. The developing
countries like India should give more emphasis on their authors to aware them for open
access publications.
Table 9: Country wise Authorship Distribution
Sl
No Country
No. of Publications in the Source Journals
Total
(n=5208)
Percentage
(%) Rank
CR
L
D-L
IB
IR
ITL
IS
JM
LA
LIB
ER
Q
LIS
R
LIB
RE
SL
MR
1
United
States of
America
(USA)
441 621 163 320 71 755 15 300 45 91 2822 54.19 1
2
United
Kingdom
(UK)
191 80 1 9 23 37 27 4 372 7.14 2
3 Canada 25 27 44 28 4 49 3 52 10 242 4.65 3
4 Australia 4 38 50 5 20 11 1 29 13 5 176 3.38 4
5 Germany 69 2 2 5 24 1 103 1.98 5
6 Spain 3 13 59 10 6 2 6 99 1.90 6
20 | P a g e
7 Netherlands 42 8 5 7 25 1 88 1.69 7
8 Finland 53 1 6 18 78 1.50 8
9 Sweden 1 4 41 1 6 1 1 1 56 1.08 9
10 Italy 40 2 2 2 1 5 2 1 55 1.06 10
11 New
Zealand 20 11 1 5 3 1 1 42 0.81 11
12 China 5 13 11 1 2 9 41 0.79 12
13 France 13 6 1 8 10 1 39 0.75 13
14 South
Africa 1 4 11 2 8 4 7 37 0.71 15
15 Singapore 1 5 11 1 8 9 35 0.67 16
16 Greece 20 3 2 1 7 1 34 0.65 17
17 Austria 24 2 1 2 2 31 0.60 18
18 Denmark 6 14 1 8 1 1 31 0.60 18
19 Norway 5 4 7 6 9 31 0.60 18
20 South Korea 3 10 1 15 1 30 0.58 19
21 Israel 3 10 5 1 1 9 29 0.56 20
22 Belgium 16 2 1 6 2 1 28 0.54 21
23 Taiwan 1 11 1 1 5 1 20 0.38 22
24 India 6 1 2 1 2 4 2 18 0.35 23
25 Japan 7 5 3 2 1 18 0.35 23
26 Ireland 3 3 3 4 1 2 16 0.31 24
27 Portugal 6 7 3 16 0.31 24
28 Hong Kong 3 3 2 2 4 1 15 0.29 25
29 Brazil 1 2 8 2 1 14 0.27 26
30 Iran 5 2 4 1 12 0.23 27
31 Poland 5 3 1 1 1 11 0.21 28
32 Switzerland 5 1 2 1 1 1 11 0.21 28
33 Malaysia 4 3 3 10 0.19 29
34 Czech
Republic 4 1 3 1 9 0.17 30
35 Mexico 5 1 1 1 1 9 0.17 30
36 Turkey 3 4 2 9 0.17 30
37 Slovenia 5 1 1 1 8 0.15 31
38 Hungary 2 1 1 1 1 1 7 0.13 32
39 Iceland 6 1 7 0.13 32
40 Lithuania 6 1 7 0.13 32
41 Nigeria 1 1 1 4 7 0.13 32
42 Chile 6 6 0.12 33
43 Finland 6 6 0.12 33
44 Uganda 3 1 2 6 0.12 33
45 Pakistan 2 1 2 5 0.10 34
46 Kuwait 2 1 1 4 0.08 35
47 Slovakia 1 3 4 0.08 35

21 | P a g e
48 United Arab
Emirates 1 1 1 1 4 0.08 35
49 Argentina 1 2 3 0.06 36
50 Colombia 1 1 1 3 0.06 36
51 Croatia 1 1 1 3 0.06 36
52 Cuba 2 1 3 0.06 36
53 Estonia 2 1 3 0.06 36
54 Russian
Federation 1 2 3 0.06 36
55 Serbia 2 1 3 0.06 36
56 Thailand 3 3 0.06 36
57 Botswana 1 1 2 0.04 37
58 Ecuador 2 2 0.04 37
59 Latvia 2 2 0.04 37
60 Macedonia 1 1 2 0.04 37
61 Netherlands
Antilles 1 1 2 0.04 37
62 Qatar 1 1 2 0.04 37
63 Trinidad
and Tobago 1 1 2 0.04 37
64 Zambia 2 2 0.04 37
65 Aruba 1 1 0.02 38
66 Bahrain 1 1 0.02 38
67 Bangladesh 1 1 0.02 38
68 Bulgaria 1 1 0.02 38
69 Costa Rica 1 1 0.02 38
70 Cyprus 1 1 0.02 38
71 Fiji 1 1 0.02 38
72 Ghana 1 1 0.02 38
73 Honduras 1 1 0.02 38
74 Iraq 1 1 0.02 38
75 Kazakhstan 1 1 0.02 38
76 Kenya 1 1 0.02 38
77 Panama 1 1 0.02 38
78 Peru 1 1 0.02 38
79 Saudi
Arabia 1 1 0.02 38
80 Swaziland 1 1 0.02 38
81 Togo 1 1 0.02 38
82 Uruguay 1 1 0.02 38
83 Venezuela 1 1 0.02 38
84 Unidentified 70 224 58 33 3 53 287 7 5 3 743 14.27 -
Key Findings

22 | P a g e
The key findings of the study are presented as under:
• During the period 2001-2015, it is observed in the study that, the year wise
distribution of journals do not show any increasing trend, however the cumulative
numbers of distribution shows a steady growth of publications.
• The authorship pattern of LIS open access journals shows that single authorship
contribution is dominant with highest 2791(53.59%) publications.
• The Collaborative Index mean value in the present study shows to be 0.73 which is so
weak at its label. The Degree of Collaboration value shows a weak intensity of
author’s collaboration at 0.72. Correspondingly, the Collaboration Co-efficient value
shows at 0.29 which is also so weak at its level. This implies that, the LIS open access
journals do not favour for collaborative research.
• The value of D is lesser than 0.0225, and therefore Lotka’s generalized formula with
exponent value “n”= (1.19), somehow fit to the LIS open access publications.
• Wilson, B. of Corporation for National Research Initiatives, Reston, United States has
contributed maximum 74(1.42%) papers and ranked top amongst all contributing
authors. Based on the citations count Wilson T.D. is in top among all the authors with
407(0.94%) citations.
• Authors from 83 countries across the world are active in publication of their research
in LIS open access journals. Amongst them authors from America and Europe are the
leaders, and United States of America (USA) is the top country producing of
2822(54.19%) authors alone
Conclusion
The present day research is fast embracing open access platforms because of greater visibility
of publications with considerable impact and influence. As it has posed tough challenges for
LIS researchers, academicians and librarians to select specific journals that promise quality
and impact, some front line open access journals have proved their mettle to be chosen as the
right channel of publications to follow suit. Contextually, the present study has rightly
addressed the trends of authorship, research collaboration, author’s productivity, prolific
authors, geographical distribution of authors of 10 selected open access LIS journals that
have gained immense popularity with high reputation. Geographically scattered contributors
and the quantum of citations received by different articles published in these open access
journals indicates the quality of publications brought out by these journals. This in fact, will
motivate the LIS researchers, academicians and librarians to bank on open access journals to
insure academic and research excellence in different parts of the world.
References
Ardanuy, J. (2012). Scientific collaboration in library and information science viewed
through the web of knowledge: The spanish case. Scientometrics, 90(3), 877-890.
Ardanuy, J. (2013). Catalan research in library and information science as viewed through the
web of knowledge. Revista Espanola De Documentacion Cientifica, 36(3).
Barik, N., & Jena, P. (2013). Authorship Studies of Trends in Information Management,
2008-2012. International Journal of Library and Information Studies, 3(4), 75-83.

23 | P a g e
Bharvi, D., Garg, K. C., & Bali, A. (2003). Scientometrics of the international journal
Scientometrics. Scientometrics, 56(1), 81-93.
Das, P. K. (2015). Authorship Pattern and Research Collaboration of Journal of Informetrics.
International Journal of Information Dissemination and Technology, 5(1), 53-62.
Khan, D. (2016). Bibliometric analysis with special reference to authorship patterns and
collaborative research in the LIBRI: International Journal of Libraries and Information
Services. Brazilian Journal of Information Science: Research Trends, 10(3).
Khurshid, Z. (2013). Contributions of Pakistani authors to foreign Library and Information
Science journals: An evaluative study. ASLIB Proceedings: New Information
Perspectives, 65(4), 441-459.
Mittal, R., Sharma, A., & Singh, G. (2006). Periodical literature on library and information
science education: A bibliometric study. Annals of Library and Information Studies, 53
December, 224-229.
Mukherjee, B. (2009). Scholarly research in LIS open access electronic journals: A
bibliometric study. Scientometrics, 80(1), 167-194.
Pandita, R. (2013). Annals of library and information studies (ALIS) journal: A bibliometric
study (2002-2012). DESIDOC Journal of Library and Information Technology, 33(6), 493-
497.
Parameswaran, M. & Smitha, K.G. (2001). Bibliometric analysis of LISA. Annals of Library
and Information Studies, 48(4), 149-156.
Park, T. M. (2010) D-Lib Magazine: Its First 13 Years: bibliometric study. D-Lib Magazine,
16 (1/2).
Pradhan, P., & Chandrakar, R. (2011) Indian LIS Literature in International Journals with
Specific Reference to SSCI Database: A Bibliometric Study. Library Philosophy and
Practice (e-journal).
Priya, A. S. & Khaparde, V. S. (2012) Authorship Pattern and Degree of Collaboration in
Library Management. International Journal of Digital Library Services, 2 (1), 243-257.
Satpathy, S. K., Maharana, R. K., & Das, A. K. (2014). Open source journals of library and
information science: A bibliometric study. Collection Building,33(1), 15-20.
Singh, K. P., & Chander, H. (2014). Publication trends in library and information science: A
bibliometric analysis of library management journal. Library Management, 35(3), 134-149.
Swain, C. (2015). A Bibliometric Profile of the Journal Library Hi Tech from 2004 to 2013.
KIIT Journal of Library and Information Management, 2(2). 134-144.
Swain, C., Swain, D. K., & Rautaray, B. (2013). Bibliometric analysis of Library Review
from 2007 to 2011. Library Review, 62 (8/9), 602 – 618.
Swain, D. K. (2014). International information and library review: A ten year bibliometric
study. International Information and Library Review, 46(3-4), 113-124.
Tiew, W. S., Abdullah, A., & Kaur, K. (2001). Malaysian journal of library and information
science 1996-2000: A bibliometric study. Malaysian Journal of Library & Information
Science, 6(1), 43-56.
Thanuskodi, S. (2011). Library Herald journal: a bibliometric study. Researchers
World, 2(4), 68.

24 | P a g e
Thanuskodi, S. (2012) Bibliometric Analysis of DESIDOC Journal of Library and
Information Technology. DESIDOC Journal of Library and Information Technology, 303-
305.
Uzun, A. (2004). Assessing internationality of scholarly journals through foreign authorship
patterns: The case of major journals in information science, and Scientometrics.
Scientometrics, 61 (3), 457-465.
Vellaichamy, A., & Jeyshankar, R. (2015). Bibliometric analysis of the Journal Webology
from 2004-2013. J. of Adv. in Lib. and Inf. Sci, 4(1), 7-13.
Verma, A., Sonkar, S. K. & Gupta, V. (2015). A bibliometric study of the Library Philosophy
and Practice (e-Journal) for the period 2005-2014. Library Philosophy and Practice (e-
journal). Paper 1292.
Verma, N., Rajnish, T. and Priyanka, S. (2007). Analysis of contributions in Annals of
Library and Information Studies. Annals of Library and Information Studies,
Yang, K., & Lee, J. (2012). Analysis of publication patterns in Korean library and
information science research. Scientometrics, 93(2), 233-251.
Zakaria, M. S. (2015). Scholarly productivity of Arab librarians in library and information
science journals from 1981 to 2010: An analytical study. IFLA Journal, 41(1), 70-79.

![Stephen R. Wagner PUBLICATIONSstevew/pubs.pdf · Stephen R. Wagner PUBLICATIONS Primary Authorship - Particle Physics 1. B. Aubert et al. [BABAR Collaboration], “Branching Fraction](https://static.fdocuments.in/doc/165x107/5f2f64ba7fb7f825b7337d60/stephen-r-wagner-publications-stevewpubspdf-stephen-r-wagner-publications.jpg)