AUTHOR’S PROOF! - cs.usyd.edu.aujudy/Homec/Pubs/2005_umuai_proof.pdf · 3 david j. carmichael,...
40
DOI 10.1007/s11257-005-0001-z User Modeling and User-Adapted Interaction (2005) 00:1–40 © Springer 2005 Consistent Modelling of Users, Devices and Sensors 1 in a Ubiquitous Computing Environment 2 DAVID J. CARMICHAEL, JUDY KAY and BOB KUMMERFELD 3 School of Information Technologies, University of Sydney, Australia 2006. 4 e-mail: {dcarmich,judy,bob}@it.usyd.edu.au 5 (Received: ; accepted in revised form ) 6 Abstract. This paper describes the use of an accretion-resolution user modelling 7 representation to model people, places and objects. We explain the motivation for the key 8 properties of the representation, especially those of particular importance for ubiquitous 9 computing: firstly, for flexibility in interpreting the typically noisy and potentially conflict- 10 ing evidence about users’ locations; secondly, to support users in scrutinising their user 11 model, the processes that determine its contents and the way that it is used in the ubiq- 12 uitous computing environment. 13 A novel and important aspect of this work is our extension of the representation beyond 14 modelling just users, using it also to represent the other elements such as devices, sen- 15 sors, rooms and buildings. We illustrate our approach in terms of models we have been 16 building for a system which enables users to gain personalised information about the sen- 17 sors and services in a ubiquitous computing environment. We report experiments on the 18 scalability and the management of inconsistency in modelling of location, based on 19 accretion-resolution. 20 Key words. modelling location, modelling pervasive computing environments, scrutability, 21 user control, user model representation 22 1. Introduction 23 User modelling has an important role in ubiquitous computing. It is essential for 24 important forms of the personalisation of user environments: it is user models 25 which will be the repositories of information that might be collected about a user 26 from ubiquitous sensors. Modelling the user’s location is central to much ubiqui- 27 tous computing work. 28 This is reflected in the large amount of work on mechanisms that can be used to 29 determine a user’s location. Many of these operate invisibly, from the early active 30 badges (Want et al., 1992) to the now common radio-based sensors like Wi-Fi and 31 Bluetooth, low cost radio-frequency tags and associated RFID readers as well as 32 ultrasound devices as in the Cambridge BAT (Addlesee et al., 2001) and in the 33 Cricket system (Priyantha et al., 2000). In addition, many other sensors, such as 34 cameras, pressure pads and microphones may sense people. To model a person’s 35 location, a system must interpret the data from such sensors to model aspects of 36 the user that are associated with location. 37 AUTHOR’S PROOF! Journal: USER MS.: USER355 PIPS: DO00020001 TYPESET DISK LE CP Disp.: 8/7/2005 Pages: 40
Transcript of AUTHOR’S PROOF! - cs.usyd.edu.aujudy/Homec/Pubs/2005_umuai_proof.pdf · 3 david j. carmichael,...

DOI 10.1007/s11257-005-0001-zUser Modeling and User-Adapted Interaction (2005) 00:1–40 © Springer 2005
Consistent Modelling of Users, Devices and Sensors1
in a Ubiquitous Computing Environment2
DAVID J. CARMICHAEL, JUDY KAY and BOB KUMMERFELD3School of Information Technologies, University of Sydney, Australia 2006.4e-mail: {dcarmich,judy,bob}@it.usyd.edu.au5
(Received: �; accepted in revised form �)6
Abstract. This paper describes the use of an accretion-resolution user modelling7representation to model people, places and objects. We explain the motivation for the key8properties of the representation, especially those of particular importance for ubiquitous9computing: firstly, for flexibility in interpreting the typically noisy and potentially conflict-10ing evidence about users’ locations; secondly, to support users in scrutinising their user11model, the processes that determine its contents and the way that it is used in the ubiq-12uitous computing environment.13A novel and important aspect of this work is our extension of the representation beyond14modelling just users, using it also to represent the other elements such as devices, sen-15sors, rooms and buildings. We illustrate our approach in terms of models we have been16building for a system which enables users to gain personalised information about the sen-17sors and services in a ubiquitous computing environment. We report experiments on the18scalability and the management of inconsistency in modelling of location, based on19accretion-resolution.20
Key words. modelling location, modelling pervasive computing environments, scrutability,21user control, user model representation22
1. Introduction23
User modelling has an important role in ubiquitous computing. It is essential for24important forms of the personalisation of user environments: it is user models25which will be the repositories of information that might be collected about a user26from ubiquitous sensors. Modelling the user’s location is central to much ubiqui-27tous computing work.28
This is reflected in the large amount of work on mechanisms that can be used to29determine a user’s location. Many of these operate invisibly, from the early active30badges (Want et al., 1992) to the now common radio-based sensors like Wi-Fi and31Bluetooth, low cost radio-frequency tags and associated RFID readers as well as32ultrasound devices as in the Cambridge BAT (Addlesee et al., 2001) and in the33Cricket system (Priyantha et al., 2000). In addition, many other sensors, such as34cameras, pressure pads and microphones may sense people. To model a person’s35location, a system must interpret the data from such sensors to model aspects of36the user that are associated with location.37
AU
TH
OR
’SP
RO
OF
!
Journal: USER MS.: USER355 PIPS: DO00020001 TYPESET � DISK LE � CP Disp.: 8/7/2005 Pages: 40
2 DAVID J CARMICHAEL ET AL.
We want to model the user’s location, activity and other relevant aspects of38context in a manner that is consistent with the other information a system holds39about a user in a user model. We introduce our approach in terms of two, closely40related, target classes of scenario: the first is a personalised user interface that41enables each user to see all elements of the ubiquitous computing environment,42especially the invisible ones; and the second is to support one person in locating43another person.44
1.1. the invisibility scenario45
Alice walks into her house, and pauses at the mirror in the foyer, checking her46hair. Then she asks for any messages and it lights up, displaying messages that her47children have left for her. She walks into the lounge room and the new release of48Monsieur Camembert begins playing. Later, her father enters the house. He is visit-49ing for a few days and staying at the house. For him, the mirror in the foyer behaves50only like a conventional mirror. He is rather irritated at the music coming from the51lounge, but is then surprised when it changes to a recording of his grandchildren’s52recent band concert. (He does not like this music but has always tried to indicate53that he does.)54
This scenario illustrates the invisibility goal of ubiquitous computing environ-55ments, where devices should fit so well and operate so naturally, that the experi-56enced user, like Alice, finds that they blend into the environment. Another goal of57invisibility is that the computing elements in the environment should be unobtru-58sive. This is the case with the sensors that are needed to detect Alice for the mirror59
and music in the scenario to operate.60This naturalness and unobtrusiveness can pose problems. It may be impossi-61
ble for people even to be aware of facilities available to them. Once Alice knows62about the mirror and how to activate it, it may provide a natural and convenient63hands-free interface. However, for the new user, even locating the interface may64pose real problems. We can expect this to be a long term issue of importance65because invisibility is one of the fundamental goals of pervasive computing design.66
There are also problems in unobtrusiveness of sensors, such as those used in67well-known ubiquitous computing projects, like the Georgia Tech Aware Home68(Kidd et al., 1999) and the Microsoft Easy Living Project (Brummit et al., 2000),69as well as many others. This is in conflict with privacy principles such as those70of Langheinrich (2001), which require that people be able to determine what sen-71sors operate in an environment and what they do with the information they collect.72It also is at odds with the observation (Ackerman et al., 1999) that many people73want to control the use of personal data, especially where that data can be linked74to their identity. This makes it important that a user model representation in this75environment supports such scrutiny.76
Another important aspect of the scenario relates to the personalisation of ser-77vices and facilities available. In the scenario, the mirror’s hidden services were not78
Journal: USER MS.: USER355 PIPS: DO00020001 TYPESET � DISK LE � CP Disp.: 8/7/2005 Pages: 40

CONSISTENT MODELLING OF USERS, DEVICES AND SENSORS 3
available to Alice’s father. The different choices of music delivered are an example79of personalising the environment, first to Alice’s preferences when she was alone,80and then, when her father arrived, it switched to music which the system predicted81both she and her father would enjoy. Since her father was surprised at the change82in music, and did not like it, the scenario illustrates a case where a person may83wish to be able to determine how the environment chose the music and how he84
might correct this in the future.85This scenario illustrates several issues, and in this paper we focus on the need86
to provide support for the user to determine:87
• what facilities are available and relevant to them in their current environment;88• what sensors operate in an environment;89
This involves the typical long term elements of user modelling, where the system90maintains a model of aspects of the user. It also calls for maintenance of the91user’s dynamic location. We now consider another scenario that requires location92modelling to help users interact with each other.93
1.2. locator scenario94
Boris is an academic who carries a Bluetooth enabled PDA. Natasha is a student95who comes to his office, wanting to discuss a problem about her assignment in96Boris’s course. She consults the Locator interface at the door to determine where97he is, recording a voice message explaining the need to meet him. Locator asks98her to wait while it locates Boris.99
We now consider three possible cases of what happens next:100
1. Boris has set Locator to indicate that he is willing to be contacted by people101who come to his door. The Locator system consults the user model for Boris102and is able to detect that he is talking with researchers in the lab nearby. Loca-103tor calls the phone in that lab, delivering the audio message from Natasha.104He indicates that he is coming to meet her. The Locator system tells Natasha105that Boris is coming and she should wait. Within a few minutes, Boris comes106to meet her.107
2. The system determines that its best information about Boris’s location is that10820 minutes ago he was at his home, many kilometres away. It informs Natasha109that he is not available.110
3. Boris is in his office, working at his computer. He has established a Locator111policy that he is not to be interrupted when he is actively using his computer,112meaning that he has used the keyboard or mouse within the previous five min-113utes. The Locator system tells Natasha that Boris is not available.114
Journal: USER MS.: USER355 PIPS: DO00020001 TYPESET � DISK LE � CP Disp.: 8/7/2005 Pages: 40
4 DAVID J CARMICHAEL ET AL.
Note that users think of locations in terms of places or rooms that make sense115in this particular social context, rather than more rigid but precise representations116like longitude and latitude. This set of scenarios illustrates the following issues.117
• Depending upon the situation, an application may need different levels of118‘spatial accuracy’ in the modelling of Boris’s location. For example, in the119first case, the application needed to determine the room he was in. By con-120trast, in the second, it does not: it needs only to model that he is not near.121In neither case was it necessary to model location to the fine detail such as122in active badge systems (Addlesee et al., 2001; Scott and Hazas, 2003) and123ultrasound-based systems like Cricket (Priyantha et al., 2000).124
• Similarly, different applications require different ‘time accuracy’. For example,125since Locator determines that Boris was at home 20 minutes ago and that it126typically takes him at least 30 minutes to travel that route, then it can declare127him unavailable. On the other hand, it needs much finer resolution, of the128order of a few minutes, on locations within the building.129
• User location may depend upon who asks for the information. In the third130case, Boris was unavailable. However, if Boris’s daughter was at the door,131rather than Natasha, Locator might tell her to wait (and it would interrupt132him).133
• Location determination must be fast enough for Natasha to wait for an indi-134cation that Boris is either unavailable or that it is trying to contact him.135
We now describe our approach to defining, implementing and evaluating a user136modelling representation that supports the creation of ubiquitous computing envi-137ronments that address these issues. In Section 2, we give an overview of our rep-138resentational approach in the case of modelling a user’s location and in Section 3,139we describe the MyPlace prototype for location modelling in support of scenar-140ios like the ones just described. We then return to the two scenarios: in Section 4141we give examples of the information provided to the user in relation to a simpler142form of the invisibility scenario; and in Section 5 we report experiments showing143how our user model representation supports the needs of the Locator scenario.144Section 6 reports experiments on scalability and the management of inconsistency.145Section 7 describes related work on user model representations, linking it to the146challenges of ubiquitous computing environments and the modelling of location147and Section 8 has the final discussions, conclusions and projections of future work.148
2. Overview of the Accretion-Resolution Representation149for Modelling user Location150
We introduce the accretion-resolution representation for user modelling151for systems which implement the scenarios described above. The representation152has two basic operations. The first, accretion, involves collection of uninterpreted153
Journal: USER MS.: USER355 PIPS: DO00020001 TYPESET � DISK LE � CP Disp.: 8/7/2005 Pages: 40
CONSISTENT MODELLING OF USERS, DEVICES AND SENSORS 5
evidence about the user. Each piece of evidence includes the source and the time154associated with it. The second operation is resolution, the interpretation of the cur-155rent collection of evidence when we need to know the user’s location or the values156
of other aspects of the user model.157We now illustrate the accretion-resolution approach used to model loca-158
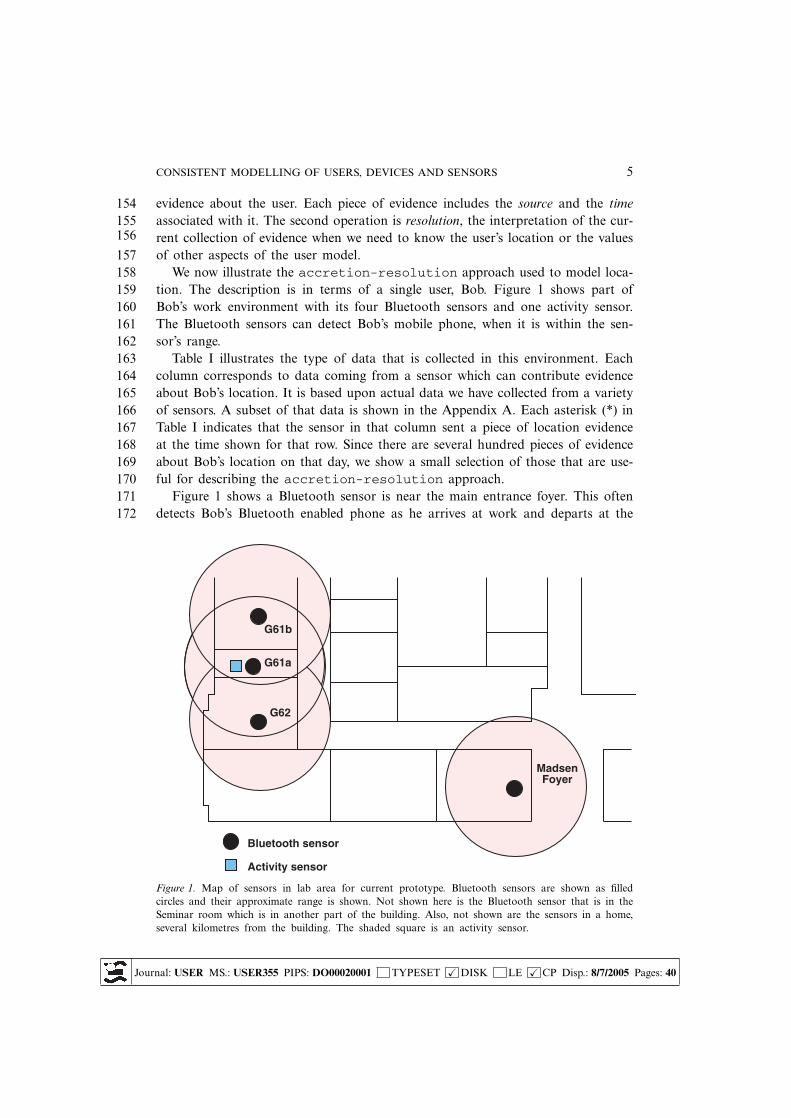
tion. The description is in terms of a single user, Bob. Figure 1 shows part of159Bob’s work environment with its four Bluetooth sensors and one activity sensor.160The Bluetooth sensors can detect Bob’s mobile phone, when it is within the sen-161sor’s range.162
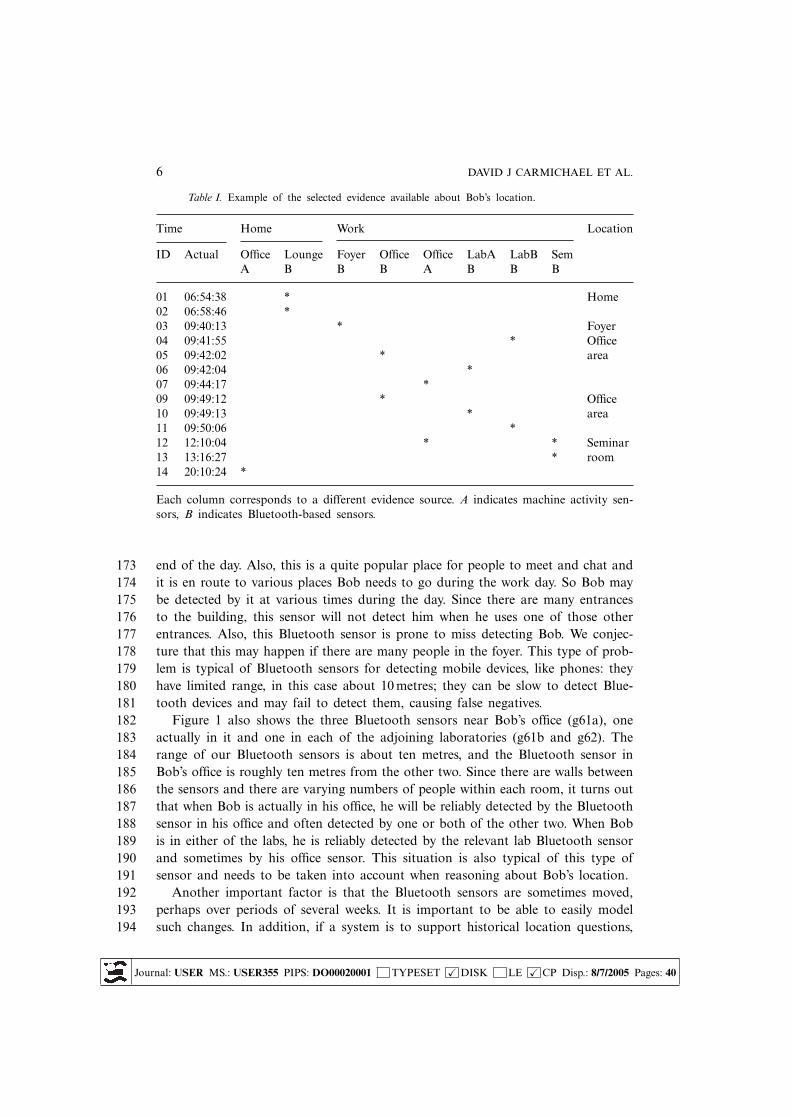
Table I illustrates the type of data that is collected in this environment. Each163column corresponds to data coming from a sensor which can contribute evidence164about Bob’s location. It is based upon actual data we have collected from a variety165of sensors. A subset of that data is shown in the Appendix A. Each asterisk (*) in166Table I indicates that the sensor in that column sent a piece of location evidence167at the time shown for that row. Since there are several hundred pieces of evidence168about Bob’s location on that day, we show a small selection of those that are use-169ful for describing the accretion-resolution approach.170
Figure 1 shows a Bluetooth sensor is near the main entrance foyer. This often171detects Bob’s Bluetooth enabled phone as he arrives at work and departs at the172
G62
G61b
G61a
MadsenFoyer
Bluetooth sensor
Activity sensor
Figure 1. Map of sensors in lab area for current prototype. Bluetooth sensors are shown as filledcircles and their approximate range is shown. Not shown here is the Bluetooth sensor that is in theSeminar room which is in another part of the building. Also, not shown are the sensors in a home,several kilometres from the building. The shaded square is an activity sensor.
Journal: USER MS.: USER355 PIPS: DO00020001 TYPESET � DISK LE � CP Disp.: 8/7/2005 Pages: 40
6 DAVID J CARMICHAEL ET AL.
Table I. Example of the selected evidence available about Bob’s location.
Time Home Work Location
ID Actual Office Lounge Foyer Office Office LabA LabB SemA B B B A B B B
01 06:54:38 * Home02 06:58:46 *03 09:40:13 * Foyer04 09:41:55 * Office05 09:42:02 * area06 09:42:04 *07 09:44:17 *09 09:49:12 * Office10 09:49:13 * area11 09:50:06 *12 12:10:04 * * Seminar13 13:16:27 * room14 20:10:24 *
Each column corresponds to a different evidence source. A indicates machine activity sen-sors, B indicates Bluetooth-based sensors.
end of the day. Also, this is a quite popular place for people to meet and chat and173it is en route to various places Bob needs to go during the work day. So Bob may174be detected by it at various times during the day. Since there are many entrances175to the building, this sensor will not detect him when he uses one of those other176entrances. Also, this Bluetooth sensor is prone to miss detecting Bob. We conjec-177ture that this may happen if there are many people in the foyer. This type of prob-178lem is typical of Bluetooth sensors for detecting mobile devices, like phones: they179have limited range, in this case about 10 metres; they can be slow to detect Blue-180tooth devices and may fail to detect them, causing false negatives.181
Figure 1 also shows the three Bluetooth sensors near Bob’s office (g61a), one182actually in it and one in each of the adjoining laboratories (g61b and g62). The183range of our Bluetooth sensors is about ten metres, and the Bluetooth sensor in184Bob’s office is roughly ten metres from the other two. Since there are walls between185the sensors and there are varying numbers of people within each room, it turns out186that when Bob is actually in his office, he will be reliably detected by the Bluetooth187sensor in his office and often detected by one or both of the other two. When Bob188is in either of the labs, he is reliably detected by the relevant lab Bluetooth sensor189and sometimes by his office sensor. This situation is also typical of this type of190sensor and needs to be taken into account when reasoning about Bob’s location.191
Another important factor is that the Bluetooth sensors are sometimes moved,192perhaps over periods of several weeks. It is important to be able to easily model193such changes. In addition, if a system is to support historical location questions,194
Journal: USER MS.: USER355 PIPS: DO00020001 TYPESET � DISK LE � CP Disp.: 8/7/2005 Pages: 40

CONSISTENT MODELLING OF USERS, DEVICES AND SENSORS 7
such as determining Bob’s location a month ago, it must take account of such195changes in the location of sensors.196
In addition to the Bluetooth sensors, there is an activity sensor in Bob’s office197(see Figure 1) and at his home. These detect mouse and keyboard activity on his198computer. The corresponding columns of Table I are labelled A.199
The last column of Table I shows one interpretation of Bob’s location, based on200the available data from the sensors. The first piece of sensor evidence comes from201the Bluetooth sensor in Bob’s lounge. We see that at times 1 and 2, Bob is detected202in his lounge.203
The table shows six sources of data about Bob’s location at work. The Blue-204
tooth sensor in the main foyer shows him arriving at work at time 3. In the time205periods 4 – 7, Bob is detected by the sensors in his office or in the two labs near206his office. Given that these times are so close, we can be reasonably confident Bob207is in the area of his office. Moreover, if we are asked to account for this conclu-208sion, it could be explained on the basis of the evidence from the sensors in his209office and the nearby labs.210
Note that if we need to know a more precise location, the interpretation is more211complex. For example in time period 7, Bob appeared to be active at his machine212and was detected by his office Bluetooth sensor about 2 minutes earlier. He was213also detected by each of the two nearby lab sensors in the previous 2–3 minutes.214The interpretation would be easier if we had additional knowledge about the like-215lihood that these sensors would detect Bob when he was actually in his office.216
Table I also illustrates another interesting case. In time period 12, Bob’s office217activity sensor is activated at exactly the same time as the seminar room Bluetooth218detector senses him. Since the seminar room is more than 50 metres from his office,219it is impossible for him to be in his office and detected by the seminar room sen-220sor. Even if we take account of the possibility that the different clocks in different221parts of our system have some small inaccuracies, this pair of pieces of evidence222appear to be in conflict.223
There are many ways to resolve this conflict. Depending upon the nature of224the location modelling required, we might use various strategies to conclude a225value. We discuss this below, in Section 3. For example, Bob might know that226his machine is sometimes used by other people in the lab. There are many other227possible explanations for the apparent inconsistency in location model. For exam-228ple, he may often lend his phone to other people. This type of problem is inherent229in location modelling based upon sensing such devices.230
The example illustrates the approach taken to location modelling using the231accretion-resolution representation, as implemented in the Personis user232modelling system (Kay et al., 2002). There are four main elements:233
• sensors, detecting the user;234• transformation of the raw sensor data into evidence for use in reasoning about235
location;
Journal: USER MS.: USER355 PIPS: DO00020001 TYPESET � DISK LE � CP Disp.: 8/7/2005 Pages: 40

8 DAVID J CARMICHAEL ET AL.
• accretion of such evidence, ignoring conflicting information at this stage;236• resolution, a process that interprets evidence to determine the user’s location237
at the time that an application requires it.238
2.1. implementation of the accretion-resolution representation239
We have built three main implementations of the accretion-resolution rep-240resentation. Our experience with the earlier ones has informed the current work.241First, we built the um toolkit (Kay, 1995) and used it extensively to model users of242a text editor. The second main implementation of the accretion-resolution243representation is the Personis user model server (Kay et al., 2002). This version244provided flexible support for defining personas, with information about users con-245trollable at several levels: view, component, evidence from nominated sources and246the resolvers. The third implementation, used in this work, is a library within247an application. It is intended for use in mobile devices where memory and process-248ing constraints are tight.249
3. Overview of the MyPlace Prototype250
To evaluate our approach, we have implemented a prototype ubiquitous computing251environment which we call MyPlace. This is a testbed for personalised ubiquitous252computing environments that support scrutability of the personalisation. We now253describe the core elements of the approach: the accretion of location evidence in254device and sensor models; location modelling based upon the evidence; the conflict255resolution process used to deal with conflicting evidence and to provide flexibility in256temporal, spatial and privacy granularity; as well as details of the implementation.257
3.1. accretion of location evidence in device and sensor models258
The part of the architecture that is responsible for building device and sensor mod-259els of MyPlace is shown in Figure 2. At the top, it shows the range of sensors.260At the bottom are the Personis models, in this case:261
• sensor models for entities such as the foyer Bluetooth sensor.262• device models for entities such as Bob’s Bluetooth enabled phone;263
The middle of the figure shows the Publish/Subscribe server. MyPlace establishes264a subscription for all messages related to sensors and devices. Then, it accepts265incoming data from the Publish/Subscribe server and uses that to update the device266and sensor models, as we now describe.267
Bluetooth sensors perform a scan every 30 seconds, detecting Bluetooth devices268in their environment. Whenever a sensor detects a device, it publishes a message to269the Publish/Subscribe server. This message includes the detected device’s Bluetooth270
Journal: USER MS.: USER355 PIPS: DO00020001 TYPESET � DISK LE � CP Disp.: 8/7/2005 Pages: 40

CONSISTENT MODELLING OF USERS, DEVICES AND SENSORS 9
modelfoyer sensor
modelBob's phone
MyPlacelocation modeller
serverPUB/SUB
sensorbluetooth
sensorbluetooth
sensoractivity
Figure 2. Accretion elements of the MyPlace architecture.
ID and the sensor’s own ID. Every sensor and device has its own, unique ID. For271example, if the foyer sensor detects Bob’s phone, the message has the unique ID272for the foyer sensor and Bob’s phone.273
An activity sensor operates in a similar manner. It scans for mouse and key-274board activity in the last 5 minutes. If there is no activity, it does nothing but if275there is activity, it publishes a message to the Publish/Subscribe server. This mes-276sage has the sensor ID and the ID of the owner of the sensor. For example, the277owner of the activity sensor on Bob’s computer is Bob. As in the case of the Blue-278tooth sensors, each sensor and device has its own, unique ID. In general, all sensor279messages, from any form of sensor, contain:280
• SourceID: ID of the sensor.281
• Type: which is always sensor.282• SenseeID: ID of the thing sensed.283• SensorType: Bluetooth, system activity, etc.284• A timestamp.285
Figure 3 shows how sensor data contributes evidence to the sensor and device286models when Bob’s Bluetooth phone is detected in the foyer.287
Step A occurs when the MyPlace location modeller first starts up. It subscribes288with the Publish/Subscribe server for all messages of type sensor. The MyPlace289location modeller has to check for network failures and re-establish this subscrip-290tion as necessary.291
Step B shows how the Bluetooth sensor in the foyer acts upon detecting Bob’s292phone. Importantly, it does not recognise that the phone belongs to Bob. The293
Journal: USER MS.: USER355 PIPS: DO00020001 TYPESET � DISK LE � CP Disp.: 8/7/2005 Pages: 40

10 DAVID J CARMICHAEL ET AL.
Figure 3. Process for sending sensor data into models for devices and sensors, where a device withID <BobsPhone MAC address> is detected by the foyer sensor. Angled brackets, as in <BobsPhoneMAC address>, indicate this is a description rather than the actual value.
message simply records the device’s unique ID (MAC address for the phone) as the294SenseeID, and the other elements shown in the Figure.295
In Step C, the Publish/Subscribe server receives this message. From Step A, it296has a subscription from the MyPlace location modeller for this message. So, it297sends the message on to the MyPlace location modeller.298
Step D is the accretion stage that occurs when the MyPlace location modeller,299uses the message to update both the sensor and device models:300
• the model for the foyer sensor accretes one piece of evidence that it has sensed301a device with ID 〈BobsPhone MAC address〉. We call this model component302Seen since it models devices this sensor has seen.303
• a corresponding piece of evidence is stored in the device model’s Seenby com-304ponent, which models what sensors this device has been seen by.305
Essentially, this means that the sensor model remembers what it has seen and the306device model remembers that it has been seen by the sensor.307
3.2. location modelling308
The accretion process described above is continuous, with evidence added as each309sensor detects a device. We now describe what happens when an application asks310for a person’s location. Figure 4, shows how an application, such as MyPlace,311reasons from sensor and device models to determine Bob’s location in his user312
model. The figure has numbered lines corresponding to steps needed to determine313Bob’s location, in the case where Bob’s phone was sensed by the foyer sensor.314
At the top left of the figure, is the user model for Bob. The figure shows just a315few of the relevant components of his user model:316
• location modelling his location;317
Journal: USER MS.: USER355 PIPS: DO00020001 TYPESET � DISK LE � CP Disp.: 8/7/2005 Pages: 40

CONSISTENT MODELLING OF USERS, DEVICES AND SENSORS 11
BobPhone
location
seenby
foyer
location
seen
Madsen Bldg Foyer(given)
Madsen G61a(given)
3
carrying
Bob
location
activity
office computer
location
seen
4
2
1
Figure 4. Example of the way that the evidence from the foyer sensor is used to contribute to themodel for Bob’s location. The query for Bob’s location uses the carrying component of his modelto determine the devices he is carrying, in this case his phone. It then consults the phone devicemodel to determine what sensors this was Seenby, in this case, the foyer sensor. It then consults thefoyer sensor model to determine its location which adds evidence on the location of Bob’s phone.Finally, the evidence is added to Bob’s model.
• carrying representing devices Bob is carrying;318• activity for his activity sensors (such as the one on his office computer).319
When MyPlace wants to know Bob’s location, it first asks his user model for320the list of devices he is carrying. In the figure, we indicate that there is evidence,321which is interpreted by Personis, to mean that one of these is Bob’s phone.322
So, MyPlace queries the device model for Bob’s phone. This is the line labelled3231 in Figure 4, to indicate that the value in Bob’s user model is used to direct a324query on the device model for his phone. That device model has a component325location for its own location. It also has a seenby component. This accretes evi-326dence from sensors (via the Publish/Subscribe server) as described in the last sec-327tion. In our example, we suppose that the query on Bob’s phone device model, for328the last location where this device was detected, returns the ID for the foyer sen-329sor.330
At this stage, MyPlace queries the model for the foyer sensor. The figure331illustrates this with the line labelled 2.332
The model for the sensor, shown in the figure as foyer, has a component for333its location which is the foyer. So when MyPlace queries its location, this value334
Journal: USER MS.: USER355 PIPS: DO00020001 TYPESET � DISK LE � CP Disp.: 8/7/2005 Pages: 40

12 DAVID J CARMICHAEL ET AL.
is returned and MyPlace lodges a piece of evidence in the location component of335the phone model, to indicate that its location at that time was in the foyer. This336action is shown by the line labelled 3. This means that the phone model keeps a337trail of all such queries on the phone’s location.338
Finally, MyPlace uses this value to add a piece of evidence to Bob’s user339model. This is evidence from the sensing of phone’s location at the time that phone340was last seen in that location. This step is indicated by the line labelled 4.341
The figure shows that Bob’s activity sensor is also linked to his model. To keep342the figure simple, we have not shown the flow of reasoning and evidence for it. We343do note, however, that the activity sensor is directly associated with Bob, since he344does not carry it.345
3.3. resolving the value of a person’s location346
The process described above may produce many pieces of evidence, one for each347of the devices that the user model indicates that the user is carrying as well as for348non-mobile sensors such as the activity sensor. These may conflict, with some evi-349dence indicating Bob is in one place and other evidence that he in another place.350The last stage in determining Bob’s location is to reconcile this set of evidence,351resolving any inconsistencies.352
The accretion-resolution representation allows for arbitrary resolvers.353These may use a simple Point algorithm (Hightower and Borriello, 2004). This354estimates location based on the most recent piece of evidence. Hightower reports355that it is ‘used by most commercial infrared badge systems as well as some cellu-356lar telephony location services’. Equally, a resolver can implement a sophisticated357algorithm such as a particle filter (Hightower and Borriello, 2004) or Dynamic358Bayesian Networks (Patterson et al., 2004). Of course, there are also many other359algorithms of intermediate sophistication; Hightower describes the Centroid, which360combines a small set of the recent data, the Smooth Centroid which is similar,361but weights more recent evidence more heavily and the Smooth Weighted Centroid362which also takes account of device characteristics. A similar approach could be363based upon the accretion-resolution evidence classes (Kay, 1995) combined364with time.365
Importantly, the resolver is applied at the time the application requests the user’s366location: so, at this stage, less privileged applications, such as in the case of the367Locator scenario, can only use restricted resolvers.368
3.4. separation of modelling evidence across sensor, device and user369models.370
We need to explain the motivation for keeping separate sensor, device and user371models. Certainly, an alternative architecture could simply place all evidence372directly into the user model. So long as that evidence was timestamped and373
Journal: USER MS.: USER355 PIPS: DO00020001 TYPESET � DISK LE � CP Disp.: 8/7/2005 Pages: 40

CONSISTENT MODELLING OF USERS, DEVICES AND SENSORS 13
indicated the sensors that provided it and the device detected, the reasoning374process could be simplified by avoiding the need for the four steps shown in Figure3754. There are several reasons that our architecture does not do this.376
One important reason is that our approach affords distribution of the data and377computations. This is important for scalability and efficiency.378
Another reason is to handle movement of sensors. When a sensor is moved, a379new piece of evidence is given about its location. This component of the model380effectively maintains a history of the location of this sensor. This makes it possi-381ble to perform queries about people’s locations in the past: in that case, the rele-382vant time is matched against the sensor’s location at that time. This representation383associates a unique ID with each sensor and then uses evidence about that sensor’s384location to map the ID to location. This mapping of sensor to location correctly385handles the case where sensor locations change. This will be particularly common386when sensors are also mobile.387
An important reason for maintaining an explicit sensor model is that it keeps all388information about that sensor in one place. For example, although Figure 4 omits389such details, the device models can model who is carrying them, with a component390that corresponds to the carrying component in user models. It is then straightfor-391ward to answer such questions as: who was the last person to leave via this door?392
Similarly, maintaining a separate device model supports queries such as: what393sensors have recently detected this device? Answering this in our example requires394the seenby component of the phone model and the location of the sensor, as shown395in Figure 4. This is important for the Invisibility Scenario because we want to be396able to present information about the environment using devices that the user is397carrying.398
Note that the evidence in Bob’s location component is used for more than sim-399ply calculating his location. Recall that this evidence is only added to his loca-400tion model when there is a request for his location. This piece of evidence includes401details of the application that requested his location. We designed the represen-402tation so that his user model effectively has an audit trial of all requests for his403location. If Bob wants to scrutinise the way that his model has been used, he404can examine this information. Importantly for scrutability, we ensure that the user405model is not full of large numbers of sensor detections that were never used by406any application. At the same time, historical queries can always be made, follow-407ing the process shown in Figure 4, but requesting resolved values for the time of408concern, rather than simply the most recent evidence as in our example.409
3.5. implementation of myplace410
The software running in the processors controlling the Bluetooth sensors is writ-411ten in C. Currently, the sensors are located in two buildings, the workplace and a412home as in the example above. The activity sensors run on two personal machines,413and as in the example, one of these is in the workplace and one in a home.414
Journal: USER MS.: USER355 PIPS: DO00020001 TYPESET � DISK LE � CP Disp.: 8/7/2005 Pages: 40

14 DAVID J CARMICHAEL ET AL.
Sensors send their messages to the Publish/Subscribe server, which is implemented415with Elvin (Segall et al., 2000). This runs on a machine in the workplace build-416ing being modelled. The location modeller programs can run on any machine,417having established a subscription at the Publish/Subscribe server. The particular418location modeller program reported in the experiments below is implemented in419Python and runs on a separate machine in that workplace building. The user, sen-420sor and device models are stored on another machine (for pragmatic reasons). In421the current implementation messages from sensors are not encrypted. Personis uses422a backend database, Berkeley DB1 for the user model evidence.423
4. MyPlace Interface for the Invisibility Scenario424
We now describe the interface which makes use of the accretion-resolution425
representation and the MyPlace architecture to enable users to determine the sen-426sors and facilities in the environment, the core of the invisibility scenario. The My-427Place invisibility interface presents information about a building, based upon the428identity of the user and their location. Figure 5 shows examples of the interface429seen by two users when they first enter the building. Fred is a new graduate stu-430dent. John is a visitor to the building and he is coming to present a seminar.431
The difference between what is delivered to the two users depends upon which432sensors and devices are relevant to each. The system starts by telling the user433where it thinks they are. It then lists the ID for the one sensor (where this is its434MAC address 00:80:C8:35:53:6B) in the current location and provides a link to a435list of other sensors in the building. To this point, the displays are the same for436both users.
Figure 5. Two user’s view of the whole building.
4371http://www.sleepycat.com/
Journal: USER MS.: USER355 PIPS: DO00020001 TYPESET � DISK LE � CP Disp.: 8/7/2005 Pages: 40

CONSISTENT MODELLING OF USERS, DEVICES AND SENSORS 15
The difference between the two displays is in the details of other locations that438are nearby. John is only shown information about the seminar room (g92). By con-439trast, Fred sees information about his workspace (g61b), the departmental resource440room (G70) and the seminar room (g92).441
In Figure 6, we contrast views of a room as presented to Fred and Bob, an aca-442demic who is Fred’s supervisor. In this case, notice that Fred is not allowed to use443the colour printer and thus is not shown it. Bob’s location listing also includes his444own office in addition to the places presented to Fred.445
Our building and room models are implemented using Personis and so are446represented in a manner that is consistent with the other elements of the system.447
Note that this approach can also be applied where users do not want to disclose448their identity. In that case, the user is informed about all Bluetooth sensors that449can detect them as well as any public services in the building. There are also many450other possible personas that can be supported. For example, since this building is451used by undergraduate computing students as well as geography students, a user452could take the persona of a geography undergraduate and see the services avail-453able to such students. Equally, the same student could decide to take on a com-454puting undergraduate persona and be presented with details of services available to455them. (We note that in the scope of this paper, we cannot deal with the associated456security issues and the need to authenticate identity, although we acknowledge that457these are important issues in the practical deployment of systems.)458
Location or world models are a crucial part of many context aware applica-459tions. There has been a range of work on such models, including, for example, Pro-460ject Aura’s Context Information Service (Judd and Steenkiste, 2003) and the Nexus461
Figure 6. Two user’s views of a particular room.
Journal: USER MS.: USER355 PIPS: DO00020001 TYPESET � DISK LE � CP Disp.: 8/7/2005 Pages: 40

16 DAVID J CARMICHAEL ET AL.
system (Bauer et al., 2002) which has been integrated in the Georgia Tech Aware462Home (Lehmann et al., 2004).463
The distinctive aspect of our work is the generalised use of our user model-464ling representation for rooms and spaces so that these are managed consistently,465extending the scrutability of the user model to the other entities in the pervasive466computing environment.467
In our introduction to the invisibility scenario, we noted the need for persona-468lised descriptions of the user’s environments. The figures in this section illustrate469how MyPlace enables users to see what is in their current location, so that they470can see the otherwise invisible sensors that are detecting them as well as the facil-471ities available to them.472
5. Fine-Grained Single User Evaluation: The Locator Scenario473
We now describe the use of the representation to manage the issues identified in474the Locator scenario:475
• flexible spatial accuracy location modelling;476• flexible time accuracy location modelling;477• selective presentation of location depending upon who asks;478• timely response to location queries479
In addition, we need to demonstrate how accretion-resolution deals with480the issues, identified in Section 2, in modelling sensors:481
• sensors may be moved;482• they have varying accuracy in terms of range, error rates, likelihood of false483
positives and negatives;484• different sensors may provide inconsistent location information and this must485
be interpreted, taking account of the fact that different user behaviours486require different policies in this interpretation.487
We now present results of our experiments in relation to these issues. Our results488are based upon sensor data for one user, Bob, and the devices and sensors needed489to model his location:490
• one carried device, a Bluetooth enabled mobile phone,491• two activity sensors, one at his home and one in his work office492• and six Bluetooth sensors, one at his house and the remainder in his493
workplace. The sensors correspond to those of Figure 1, Table I and the494Appendix A.495
The user whose results are reported here is one of the authors of the paper. Cur-496rently fifteen people are registered with MyPlace. None has as extensive a collec-497tion of sensor detections as the user whose results are reported here.498
Journal: USER MS.: USER355 PIPS: DO00020001 TYPESET � DISK LE � CP Disp.: 8/7/2005 Pages: 40

CONSISTENT MODELLING OF USERS, DEVICES AND SENSORS 17
Figure 7 shows the Bluetooth evidence for the user’s location through one typi-499cal work day. This corresponds to making only evidence that came from Bluetooth500evidence sources visible to the resolver. This graph shows each evidence point501connected with a line. So, for example, there is evidence from the sensor at Bob’s502home at around 7 am. Then there is a period where no evidence is available until503around 9.40 am when he is detected by the sensor in the foyer of his workplace.504There are considerable periods when he is in the area of his office. This appears as505evidence from the sensors in his office (g61a) and the two adjoining labs (g62 and506g61b). There are two blocks of time when he is detected by sensors in the seminar507room (g92). Since the lines in the graph connect evidence points, the horizontal508lines may equally well reflect a series of many evidence points, all from the same509location, or just two points of evidence, one each at the beginning and end of the510lines.511
Figure 8 shows Bob’s location on the same day, as assessed by a two-value512resolver: this returns only work for all evidence from sensors at work and513unknown where there is evidence from any other source. Similar to Figure 7, this514graph has one point for each resolved location value and lines connecting these.515So, for example, we see that as soon as Bob is detected by a work sensor, his516resolved location is shown as work until there is evidence for his location else-517
where. Both Figures 7 and 8 show one point for each piece of evidence in any518of the relevant sensor models. In practice, we are more interested in the location519requests from applications and these will require a resolved location value based520
home
foyer
g62
g61a
g61b
g92
7am 8am 9am 10am 11am noon 1pm 2pm 3pm 4pm 5pm 6pm 7pm 8pm
Bob: March 30th
Figure 7. Bluetooth evidence for one user, Bob, on March 30th. The modelled locations are on theY -axis and time on the X-axis. Each piece of evidence is a point in the graph. Lines connect these.There was no sensor data for the user before the first point at appropriately 7 am or after the lastpoint at approximately 7.30 pm.
Journal: USER MS.: USER355 PIPS: DO00020001 TYPESET � DISK LE � CP Disp.: 8/7/2005 Pages: 40

18 DAVID J CARMICHAEL ET AL.
unknown
work
7am 8am 9am 10am 11am noon 1pm 2pm 3pm 4pm 5pm 6pm 7pm 8pm
Bob: March 30th
Figure 8. Bob’s location based on the same evidence as in Figure 7 using a resolver which onlyindicates whether he is at work or not.
upon the sensor evidence available over a specified recent period of time. We illus-521trate this in the next set of graphs.522
Figure 9 shows how we model whether Bob is active, based on the policy523described in the third case of the Locator scenario. This policy defines the user524(Bob in this case) as unavailable if he has used the keyboard or mouse of his525work terminal in the last five minutes. The reason for making this time 5 minutes is526that the activity sensor only detects mouse and keyboard activity, and the policy527is intended to allow for the periods, of up to 5 minutes, when he is focussed on528a task but is in-between active use of the mouse or keyboard. The figure shows529that this policy establishes periods when Bob is actively working and the Loca-530tor-style interface would not disturb him at these times. Of course, by this policy,531if Bob is not detected as active in the last 5 minutes, we can only conclude that we532do not know whether he is active.533
Figure 10 shows the same type of Bluetooth evidence as in Figure 7 but it cov-534ers a six day period. (There was no sensor data on the seventh day.) Figure 11 is535for the same period as Figure 10 but it shows his availability to a general user who536comes to his door wanting to talk with him. The figure was generated by query-537ing the user model for Bob’s availability every minute, according to the following538policy:539
available540if a sensor has detected him in the area near his office541
(g61, g61b, g62) in the last 10 minutes and542he has not been active in the last 5 minutes;543
unavailable544otherwise.545
Journal: USER MS.: USER355 PIPS: DO00020001 TYPESET � DISK LE � CP Disp.: 8/7/2005 Pages: 40

CONSISTENT MODELLING OF USERS, DEVICES AND SENSORS 19
unknown
active
7am 8am 9am 10am 11am noon 1pm 2pm 3pm 4pm 5pm 6pm
Bob: March 30th
Figure 9. Display of user activity, following a user policy that they are active if they have used theirkeyboard or mouse in the last 5 minutes. Note that when the user is not determined to be active,we cannot conclude whether they are really active or not. So the resolved value of the activity com-ponent in this case is unknown.
home
foyer
g62
g61a
g61b
g92
Sun Mon Tue Wed Thu Fri
Bob: Mar 28 to Apr 2
Figure 10. Bluetooth-sourced evidence for Bob over six days.
These two graphs indicate the difference in the response to requests about loca-546tion that would be given to different classes of users. If Bob’s child came to his547door, they might be informed of his location as shown in Figure 10. In the case548of typical people coming to Bob’s door, the Locator system would first ask his549
Journal: USER MS.: USER355 PIPS: DO00020001 TYPESET � DISK LE � CP Disp.: 8/7/2005 Pages: 40

20 DAVID J CARMICHAEL ET AL.
user model for his availability. We now discuss the issues listed at the beginning of550this section.551
5.1. flexible modelling of spatial accuracy of location552
The granularity of location modelling illustrated in Figure 8 is partly adequate for553the first option in the Locator scenario. It does determine if Bob is near enough554to come to his door in a reasonable amount of time. However, it is insufficient to555identify the exact room among g61b, g61a and g62 as required in that case. This is556a problem associated with overlapping Bluetooth sensors and the limited accuracy557they offer. The accretion-resolution representation operates properly within558those constraints. The approach in Figures 8 and 11 would deal properly with the559second variant of the Locator scenario, where Bob is actually at home and the560user (Natasha in the scenario) is to be told that he is unavailable.561
The way that we model different degrees of spatial accuracy is by using different562resolvers. Figure 7 was used to show the location evidence for Bob. If we use a563resolver which simply determines a user’s location on the basis of the last piece564of evidence available, a continuous series of queries on Bob’s location would give565just this graph. Figure 8 illustrates the values returned by a resolver which is566able to operate on the same location evidence but, in this case, the resolver can567return only two possible values, either work or unknown. Figure 11 indicates how568other policies can be used to determine the answer to requests for Bob’s availabil-569
available
Sun Mon Tue Wed Thu Fri
Bob: Mar 28 to Apr 2
unavailable
Figure 11. Availability of the user over the same six day period, following a policy that he is avail-able when he is around the area of his office but not active at his terminal.
Journal: USER MS.: USER355 PIPS: DO00020001 TYPESET � DISK LE � CP Disp.: 8/7/2005 Pages: 40
CONSISTENT MODELLING OF USERS, DEVICES AND SENSORS 21
ity, which might be all that would be returned on a query about his location. Bob570can control the degree of spatial accuracy and nature of the response available to571an application that requests his location. He would do this, using a suitable inter-572face, to select the resolver to be used by that application.573
5.2. flexible modelling of time accuracy574
This aspect operates in a similar manner to the spatial accuracy. As we saw in575Figure 9, the user’s activity level was determined on the basis of a resolver576which used evidence from the last 5 minutes to determine if Bob was active. The577
indication of availability, shown Figure 11, is based upon a resolver which578interprets evidence about the user with two sets of time granularity: the last57910 minutes in the case of the Bluetooth location sensors and 5 minutes in the case580
of the activity sensors.581
5.3. selective presentation of location depending upon who asks582
Both the scenarios at the beginning of the paper indicated cases where it is desir-583able to control what information is available about a user, depending upon who584asks. As discussed above, this can operate in terms of the spatial and temporal585accuracy. Importantly, these cases also illustrated examples of the important cases586where Bob’s location is to be reported as unavailable.587
6. Large Scale Experiments588
In the last section, we reported detailed experiments, based upon authentic data589for a single user with heterogenous evidence sources. We now report experiments590on a much larger scale, involving large numbers of users, over several months.591
We wanted to test with realistic data, with the potential to produce conflicting592information about a person. We also wanted to experiment with data that would593produce large amounts of user modelling evidence and where we choose to simu-594late the effects of bursts of activity. It was also desirable to have a range of users,595in terms of the scalability; at one extreme, there should be some people with mod-596est amounts of data feeding into their user models and, at the other extreme, there597should be users with large amounts of evidence added to their user models.598
We have found a suitable user modelling evidence source in data about logins599across our computing laboratories. This produces one datum for each time an600account is logged in or out of at a terminal in those labs, as well as evidence601from periodic scans which survey active users each 15 minutes. These locations are602spread across many rooms, some being several hundred metres apart. An individ-603ual can only be physically present in one place at a time; so any evidence indicat-604ing that an individual is in multiple locations produces conflict. Moreover, there605are many ways that such conflicting evidence can occur. For example, a faulty606
Journal: USER MS.: USER355 PIPS: DO00020001 TYPESET � DISK LE � CP Disp.: 8/7/2005 Pages: 40

22 DAVID J CARMICHAEL ET AL.
1
10
100
1000
10000
100000
0 500 1000 1500 2000 2500
Num
ber
of d
ata
item
s
User Number
Figure 12. Overview of the amount of data per account. For the centre of the curve, it shows agently slopping line for the log of the size of the data set against the user rank number. For theboundaries, it shows a small number of accounts with very little data and a small number with verylarge data sets.
machine might be used to log in but then the person may move elsewhere, leav-607ing that login active while they are actually in a different room.608
The full data set has over 450,000 records, covering the period 16th May to60910 September, 2004. The included periods during semester as well as examinations610and breaks. There were 2496 different accounts making use of 487 terminals. Most611accounts were for individuals, although there were some group accounts. Figure 12612shows how many pieces of evidence were collected for each account. Note the log613scale on the vertical axis. The distribution is unsurprising (Zipf, 1949): there is614a small number of accounts with very little evidence; small numbers having very615large amounts and most forming a straight line for the log of the data set size616against the rank number. Some accounts are actually used by groups of people,617who, together, account for over 10,000 pieces of evidence, through the four months.618This data was stored so that we could run repeated simulations for measurements619under different conditions: for example, we could simulate the system being under620heavy load due to a large amount of incoming sensor data.621
In the remainder of this section, we describe the results of three main evalu-622ations, exploring the scalability of the following operations as a function of the623amount of evidence in the user model:624
Journal: USER MS.: USER355 PIPS: DO00020001 TYPESET � DISK LE � CP Disp.: 8/7/2005 Pages: 40
CONSISTENT MODELLING OF USERS, DEVICES AND SENSORS 23
• a tell operation, adding one more piece of evidence to a person’s user model;625• a simple ask operation, making use of the simplest resolver that deter-626
mines the user’s location using the Point algorithm (Hightower and Borriello,6272004) which simply accesses the most recent piece of evidence.628
• a complex ask operation which uses a Smooth Centroid algorithm. This takes629account of the last 32 minutes of user data, requiring retrieval of all evidence630from that period and calculating a weighted location prediction, where more631recent locations were weighted higher;632
Tests were performed on a Intel Pentium 4 CPU 2.53 GHz with 1 GB RAM.633
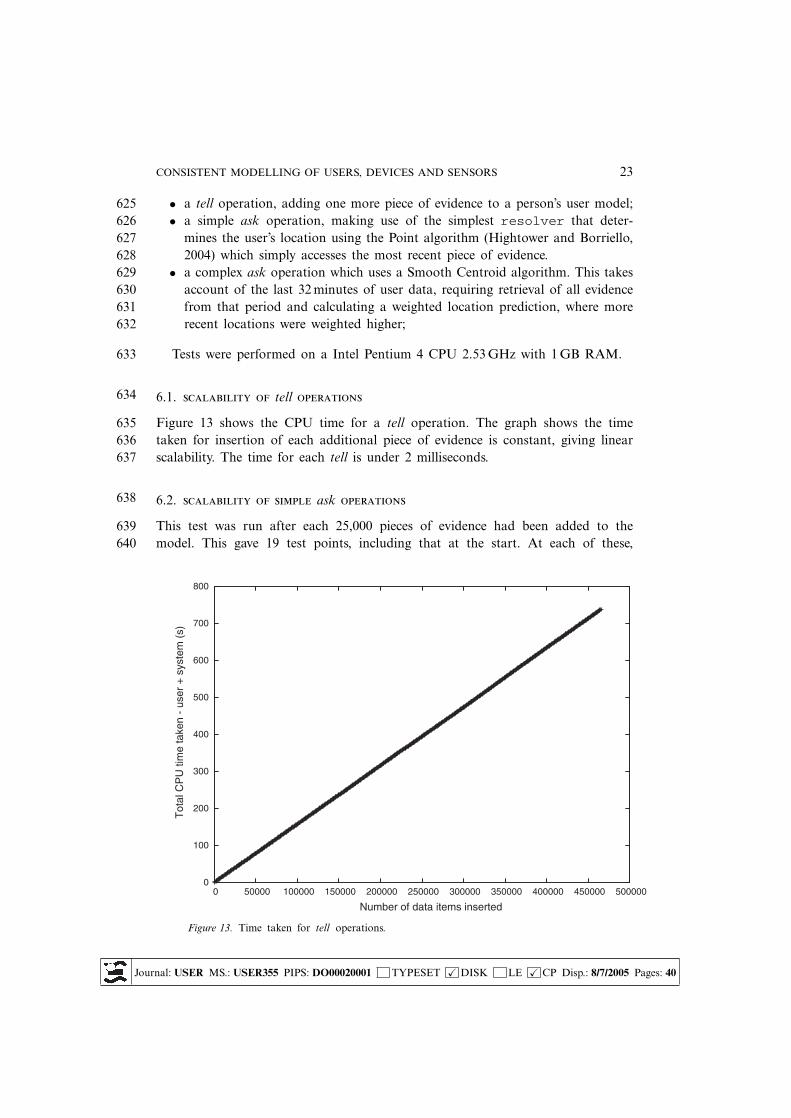
6.1. scalability of tell operations634
Figure 13 shows the CPU time for a tell operation. The graph shows the time635taken for insertion of each additional piece of evidence is constant, giving linear636scalability. The time for each tell is under 2 milliseconds.637
6.2. scalability of simple ask operations638
This test was run after each 25,000 pieces of evidence had been added to the639model. This gave 19 test points, including that at the start. At each of these,640
0
100
200
300
400
500
600
700
800
0 50000 100000 150000 200000 250000 300000 350000 400000 450000 500000
Tot
al C
PU
tim
e ta
ken
- us
er +
sys
tem
(s)
Number of data items inserted
Figure 13. Time taken for tell operations.
Journal: USER MS.: USER355 PIPS: DO00020001 TYPESET � DISK LE � CP Disp.: 8/7/2005 Pages: 40

24 DAVID J CARMICHAEL ET AL.
0
0.2
0.4
0.6
0.8
1
1.2
0 50000 100000 150000 200000 250000 300000 350000 400000 450000 500000
Tot
al C
PU
tim
e -
user
+sy
stem
(s)
Total number of data items in models
Average CPU time for 400 complex queriesAverage CPU time for 400 simple queries
Figure 14. Performance of ask with complex resolver, compared with simpleresolver
we ran 400 simple asks, twenty for each of twenty accounts. For these tests, we641selected these accounts, in four equal-sized groups, as follows:642
• accounts with the largest amount of evidence. These were three constant643users, who left machines continuously logged in and group accounts with64412,603–16,329 pieces of evidence.645
• heavy individual users with 999–1309 evidence items, reflecting frequent logins646over several hours each week;647
• at the median of the remaining accounts were the occasional users, with648around 66–67 data items, equivalent to logging into a terminal for one hour649per week, such as for a single weekly tutorial;650
• users who logged in once or twice in total;651
The results are indicated in the broken line in Figure 14. This shows the CPU652time, averaged over three runs. This indicates the time for a simple mechanism653such as that of the common Point query. As the size of the model grows, this is654essentially constant. It increases very slightly, but it generally took under 0.9 sec-655onds of CPU time to complete the 400 asks performed at each point, or 2.25 mil-656liseconds per query.657
Journal: USER MS.: USER355 PIPS: DO00020001 TYPESET � DISK LE � CP Disp.: 8/7/2005 Pages: 40
CONSISTENT MODELLING OF USERS, DEVICES AND SENSORS 25
6.3. scalability of complex ask operations658
The second method of query was more complex. This makes use of a resolver659which examines all data gathered about a user in the last 32 minutes. The choice660of this time is based on the fact that the sensor which performs the periodic login661scan runs every fifteen minutes. This means that even if the sensor is delayed662slightly by other activity on the system, or network unavailabilities, it will have663published at least twice in that time.664
The time taken for this resolver to run depends on the amount of data on665that account in the previous half hour. To ensure we simulated queries for all times666of day, we ran at intervals of 6 hours and 35 minutes; as this does not divide into66724 hours evenly, it ensures that tests are run at all times of day.668
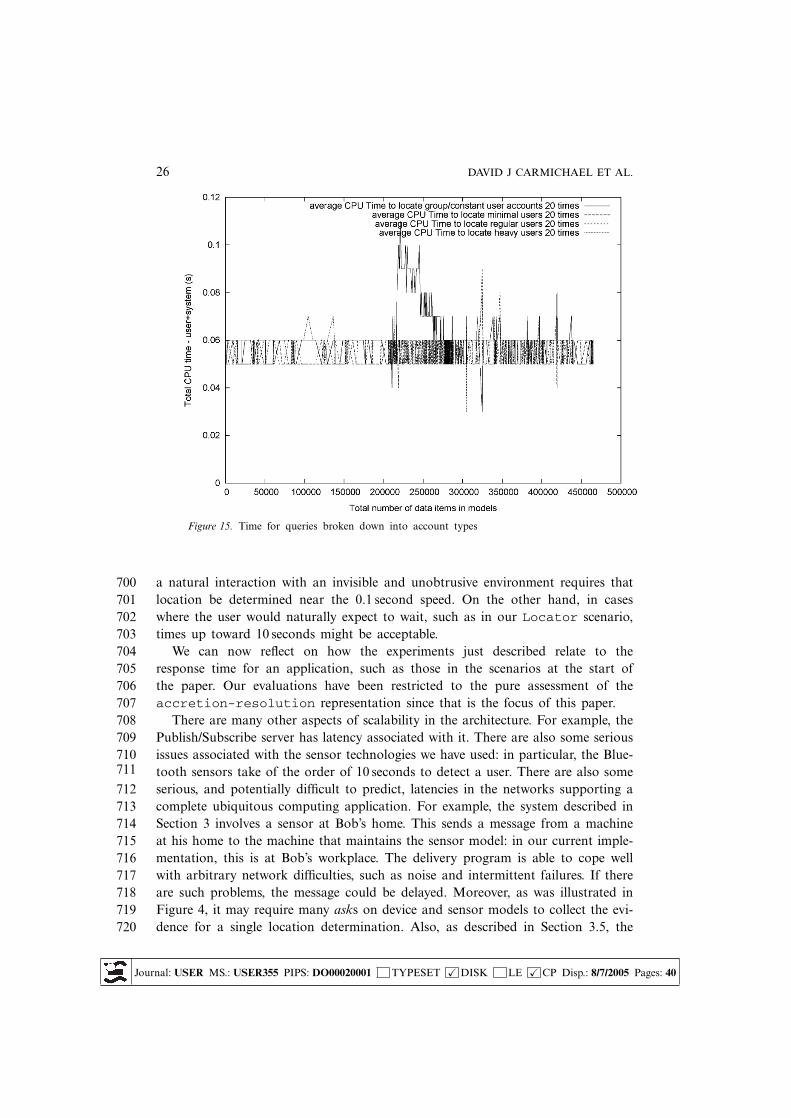
The solid line in Figure 14 shows how this resolver performed compared669with the simple resolver (broken line). In general, it takes a little more CPU670time than the simple resolver, but it is essentially the same time cost.671
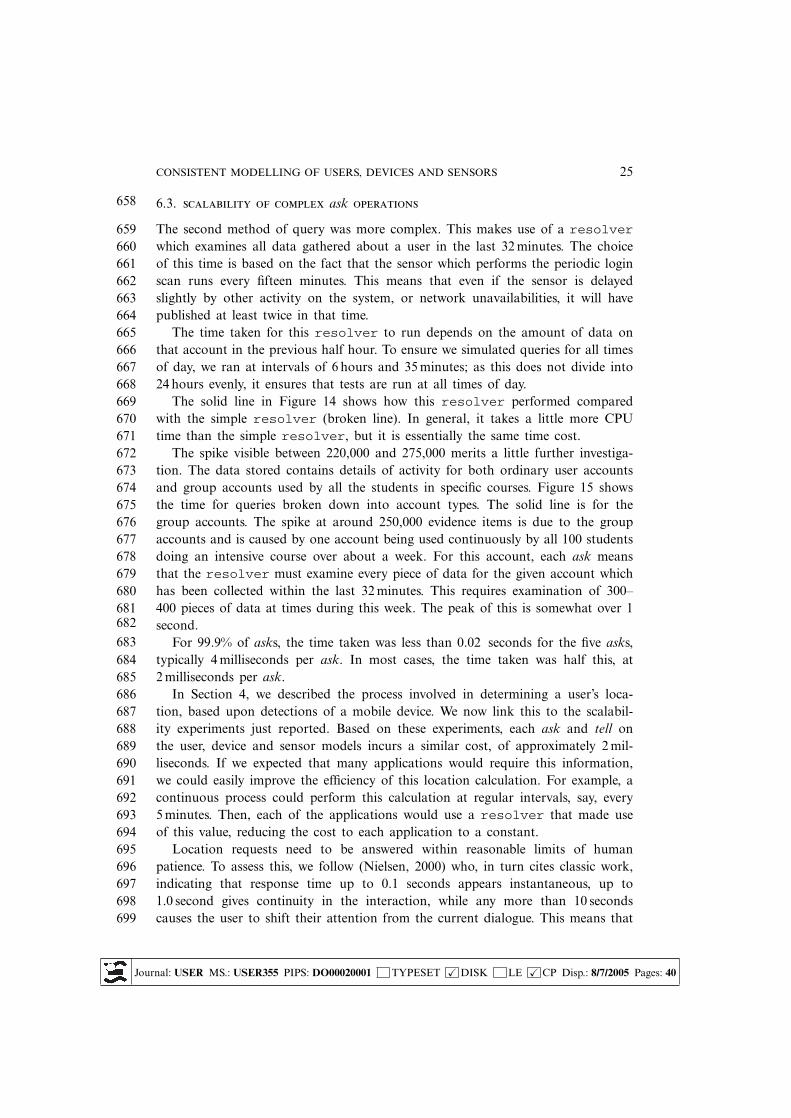
The spike visible between 220,000 and 275,000 merits a little further investiga-672tion. The data stored contains details of activity for both ordinary user accounts673and group accounts used by all the students in specific courses. Figure 15 shows674the time for queries broken down into account types. The solid line is for the675group accounts. The spike at around 250,000 evidence items is due to the group676accounts and is caused by one account being used continuously by all 100 students677doing an intensive course over about a week. For this account, each ask means678that the resolver must examine every piece of data for the given account which679has been collected within the last 32 minutes. This requires examination of 300–680400 pieces of data at times during this week. The peak of this is somewhat over 1681second.682
For 99.9% of asks, the time taken was less than 0.02 seconds for the five asks,683typically 4 milliseconds per ask. In most cases, the time taken was half this, at6842 milliseconds per ask.685
In Section 4, we described the process involved in determining a user’s loca-686tion, based upon detections of a mobile device. We now link this to the scalabil-687ity experiments just reported. Based on these experiments, each ask and tell on688the user, device and sensor models incurs a similar cost, of approximately 2 mil-689liseconds. If we expected that many applications would require this information,690we could easily improve the efficiency of this location calculation. For example, a691continuous process could perform this calculation at regular intervals, say, every6925 minutes. Then, each of the applications would use a resolver that made use693of this value, reducing the cost to each application to a constant.694
Location requests need to be answered within reasonable limits of human695patience. To assess this, we follow (Nielsen, 2000) who, in turn cites classic work,696indicating that response time up to 0.1 seconds appears instantaneous, up to6971.0 second gives continuity in the interaction, while any more than 10 seconds698causes the user to shift their attention from the current dialogue. This means that699
Journal: USER MS.: USER355 PIPS: DO00020001 TYPESET � DISK LE � CP Disp.: 8/7/2005 Pages: 40
26 DAVID J CARMICHAEL ET AL.
Figure 15. Time for queries broken down into account types
a natural interaction with an invisible and unobtrusive environment requires that700location be determined near the 0.1 second speed. On the other hand, in cases701where the user would naturally expect to wait, such as in our Locator scenario,702times up toward 10 seconds might be acceptable.703
We can now reflect on how the experiments just described relate to the704response time for an application, such as those in the scenarios at the start of705the paper. Our evaluations have been restricted to the pure assessment of the706accretion-resolution representation since that is the focus of this paper.707
There are many other aspects of scalability in the architecture. For example, the708Publish/Subscribe server has latency associated with it. There are also some serious709issues associated with the sensor technologies we have used: in particular, the Blue-710tooth sensors take of the order of 10 seconds to detect a user. There are also some711
serious, and potentially difficult to predict, latencies in the networks supporting a712complete ubiquitous computing application. For example, the system described in713Section 3 involves a sensor at Bob’s home. This sends a message from a machine714at his home to the machine that maintains the sensor model: in our current imple-715mentation, this is at Bob’s workplace. The delivery program is able to cope well716with arbitrary network difficulties, such as noise and intermittent failures. If there717are such problems, the message could be delayed. Moreover, as was illustrated in718Figure 4, it may require many asks on device and sensor models to collect the evi-719dence for a single location determination. Also, as described in Section 3.5, the720
Journal: USER MS.: USER355 PIPS: DO00020001 TYPESET � DISK LE � CP Disp.: 8/7/2005 Pages: 40

CONSISTENT MODELLING OF USERS, DEVICES AND SENSORS 27
architecture of our current version of MyPlace involves many different machines,721each with potentially varying loads affecting their response times and with several722network connections each with varying latencies.723
In summary, to determine the actual response time for a query is strongly724dependent upon the detailed architecture of the ubiquitous computing application.725Clearly, it is important to engineer this to match the needs of the application.726However, from the experiments reported above, we can conclude that the overhead727of queries on the sensor, device and user models that make use of our accre-728tion-resolution representation is very modest and well within the timescales729for responses.730
6.4. evaluation of conflict management731
We now report experiments into the nature of the conflicting evidence about user’s732locations, based upon the login sensor data. Although this analysis is restricted733to a single sensor, we will use this as a basis for describing how the accre-734tion-resolution approach tackles the problems involved in reasoning about735aspects like user location from such unobtrusive sensors.736
For each account, we defined a login event to include each login, and a scan737event as each detection of the logged-in account during the periodic scans. For738each of these events, we identified all evidence indicating any conflicts in the user’s739current location. Essentially, we maintained a list of all locations for which there740was evidence from one of the login or scan events. If this list had any conflicts, we741concluded that the event showed inconsistency.742
The calculation of inconsistency had to take account of the fact that people can743move. To do this at each event, as described above, we compiled all evidence of744events from that scan period, which means all evidence within the last 15 minutes745under normal operation. (There were sensor restarts approximately once per day746and these altered the timing slightly. But the effect was small.) We use this to cre-747ate a list of all the locations that are suggested by the available evidence. So, for748example, if the scan indicates the user is at two terminals which are in different749locations, this list has those two locations. In addition to this, we make use of data750about logouts to indicate that the user left that terminal: we use this information751to remove that location from the list of possible user locations. This way if a user752logs out from one terminal, walks down the hall and logs into a different terminal,753this is not treated as a conflict. (A more accurate measure would take account of754the time to move between the logout and login location.)755
The actual calculation examines the list of location evidence associated with the756
current event. It identifies the location that has the most evidence. We then cal-757
culate the percentage of evidence for this location over the total amount of evi-758dence on the list. So, for example, if the location list has 10 pieces of evidence, of759which five are for Location A and five for Location B, this gives a 50% consistency760value.761
Journal: USER MS.: USER355 PIPS: DO00020001 TYPESET � DISK LE � CP Disp.: 8/7/2005 Pages: 40

28 DAVID J CARMICHAEL ET AL.
0
20
40
60
80
100
0 500 1000 1500 2000 2500 1
10
100
1000
10000
100000P
erce
ntag
e of
dat
a gi
ving
a c
onsi
sten
t loc
atio
n fo
r th
e us
er
Tot
al d
ata
item
s pe
r us
er (
note
log
scal
e)
Account number (number is the rank, based on amount of evidence)
Percentage of data about location.Total data items
Figure 16. The left axis shows the percentage of login events and scan events with all evidence consis-tent, compared with the total number of events. Each cross indicates this percentage for one account.The right axis shows the log of the number of events and the S-shaped curve shows the number ofevents per account.
Figure 16 shows the results. The horizontal axis is the account rank, as in762Figure 12. The figure has one cross for each account, indicating the consistency763as just described. So, for example, at rank 1764, we can see an account which has764136 events. The analysis indicated that in 74 cases, there was no conflict and the765remaining 62 had conflict. Studying the detailed evidence, it emerges that this per-766son logged in for 5 minutes, then logged out, returning one week later, logging into7672 terminals in nearby rooms, within a few minutes, then leaving these logged in768overnight.769
The figure is dominated by the solid bar near 100%, indicating that, for most770accounts, the consistency was very high. To gain a sense of the nature of the con-771flicting evidence, we studied the data for those accounts with the highest proportion772of events with conflicting evidence. The reasons for the conflict can be categorised773as follows:774
1. group or shared accounts;7752. a terminal is normally left logged in for very long periods, for example, in the776
person’s office;7773. a person fails to log off properly, for example, due to a faulty machine which778
breaks leaving the person logged in while they move to another machine;779
Journal: USER MS.: USER355 PIPS: DO00020001 TYPESET � DISK LE � CP Disp.: 8/7/2005 Pages: 40
CONSISTENT MODELLING OF USERS, DEVICES AND SENSORS 29
4. account sharing, with different people commonly using the same account in780different locations;781
5. very small data collections, where even modest effects from cases 3 and 4 above782can give large proportions of inconsistent data.783
We can ignore the first if we limit user modelling to evidence from sensor data784for the individual. The others describe inherent limitations in this class of evi-785
dence source. Notably, correct management of these problems will differ for differ-786ent people; for example, the second will be relevant only to people with an office.787
This evaluation explored the degree and nature of inconsistency due to the788unobtrusive login sensor. The accretion-resolution representation provides789the framework for collecting and resolving such conflicting evidence. There are790many algorithms that can be applied, within different resolvers, to deal with791conflict, as discussed in the section on resolvers in Section 3.3. These can792incorporate the sensor characteristics and additional evidence from other sensors.793Notably, it seems likely that different people may elect to personalise the choice of794resolver that is applied to them.795
7. Related Work796
An excellent review (Kobsa, 2001a) indicates the breadth of representations used797by generic user modelling shells. He identified a trend towards lighter weight,798simpler representations. Early systems tended to come from work in artificial intel-799ligence and natural language understanding and these valued generality, expres-800siveness and powerful inferences in representations. For example, UMT (User801Modelling Tool) (Brajnik and Tasso, 1994) had a database of all the user mod-802els held by the system, a knowledge base of stereotypes (Rich and Wahlster, 1989)803in a multiple inheritance hierarchy, the database of possible user models for the804current user, a rule-base of constraints on values of attributes in the user model805and inference rules for generating new user modelling information as well as a con-806sistency manager based on an truth maintenance based approach (Doyle, 1979)807and associated mechanisms. Similarly, BGP-MS models user’s Beliefs, Goals and808Plans (Kobsa and Pohl, 1995), representing concepts in the user model as an inher-809itance hierarchy. Each concept was described by a four-tuple: a role predicate for810each relation this concept participates in; value restrictions on the arguments of811each relation; a number of restrictions indicating how many of the attributes were812required for an instance of this concept; a modality to indicate whether an attri-813bute was necessary or not. Such concepts were kept in partitions which themselves814could be organised into inheritance hierarchies. These provided a representation815for alternate views of knowledge, such as SB, the system’s beliefs, SB(UB), the sys-816tem’s beliefs about the user’s beliefs, SB(UB(SB)), the system’s beliefs about the817user’s beliefs about the system’s beliefs.818
Journal: USER MS.: USER355 PIPS: DO00020001 TYPESET � DISK LE � CP Disp.: 8/7/2005 Pages: 40

30 DAVID J CARMICHAEL ET AL.
One of the important representational elements in user modelling is the stereo-819type, a term coined by Rich (1989) to mean ‘a collection of attributes that often820co-occur in people ... they enable the system to make a large number of plausible821inferences on the basis of a substantially smaller number of observations. These infer-822ences must, however, be treated as defaults, which can be overridden by specific obser-823vations’ (Rich, 1989: 35). They have been explicitly incorporated into the repre-824sentations of UMT and BGP-MS as well as several other systems which explored825general representations for user modelling, for example: Generalised User Model-826ling System, GUMS (Kass, 1991); TAGUS (Paiva and Self, 1995) which also sup-827ports inferences about the user’s reasoning about knowledge; the Student Model-828ling Maintenance System, SMMS, (Huang et al., 1991) where the latter two had829support for truth maintenance.830
These early systems dealt with the challenges of uncertainty and inconsistency831with truth maintenance based approaches (Doyle, 1979). These are rather heavy-832weight for a ubiquitous environment. THEMIS (Kono et al., 1994) explored the833role of inconsistency and when it needs to be resolved by the system. Notably,834it highlighted the possibility that people may have inconsistent beliefs: a system835which tries to construct a consistent model of them imposes constraints that are836inappropriate. In the case of ubiquitous computing, a very important source of837inconsistency in the user model will be due to the unreliability of information from838sensors. More importantly, many aspects of the user, including their location, will839change frequently. A representation for ubiquitous computing must deal with this840efficiently.841
An important form of stereotype is the double stereotype (Chin and Wahlster,8421989) which enables reasoning in two directions. For example, information about843the user could be used in stereotypic inference about their predicted behaviour;844in the other direction, limited sensor observations of their behaviour can be used845to infer other attributes about them. Taking a concrete example, suppose that an846active-badge tracking system observes a user in the executive coffee suite on a few847occasions. This could be used to infer that this person is an executive. Another848person who has just joined the organisation as an executive could be predicted to849visit the executive coffee suite.850
More recent work has been characterised by simpler representations, matching851the needs of emerging personalised applications such as recommenders and per-852sonalised web sites. It seems that quite modest user models have been useful for853recent ubiquitous computing systems, such as (Hatala and Wakkary, 2005; Petrelli854and Not, 2005). As Kobsa observes, the demands of personalised applications will855determine the characteristics which should be provided by a user model representa-856tion. Our accretion-resolution representation is in the spirit of such simpler857representations but is distinctive in differentiating evidence sources so that these858can play a role in the general operation of resolver algorithms and in the selective859and tailored granularity of asks that each application is allowed.860
Journal: USER MS.: USER355 PIPS: DO00020001 TYPESET � DISK LE � CP Disp.: 8/7/2005 Pages: 40

CONSISTENT MODELLING OF USERS, DEVICES AND SENSORS 31
Another dimension of the representation of user models relates to the ontol-861ogy which defines the semantics of the user modelling language. Heckmann has862used an XML-based user modelling language (Heckmann, 2003b) for Ubi’s world,863and has provided a user interface to define policies for access to the user model864(Heckmann, 2003a). Heckmann also has provided an interface (Heckmann, 2004)865that enables users to scrutinise the representation as well as the semantics defining866them.867
An important design goal for the accretion-resolution representation868has been that the representation should support user scrutiny and control of869personalisation: both in terms of being able to access and control the values repre-870sented in the user model and the processes that defined them. It is widely acknowl-871edged that there are critical privacy and control issues for ubiquitous computing872environments. For example, from the early work on active badges (Want et al.,8731992) to recent work based on similar approaches (Priyantha et al., 2000), the874researchers noted concerns about privacy. In such work, an important basis for875managing privacy is based on the fact that devices, rather than people are tracked.876Our architecture explicitly supports this.877
It was also observed that it is the way location data is used or logged that is often878the main concern for badge wearers. In all this work, including more recent research879on privacy of location information (Hengartner and Steenkiste, 2003), the focus880has been on the security of the information without proposing that a user model881would be a natural repository for the information and its management. The work882reported in this paper represents an important departure from that dominant view883of location information.884
Our work is also complementary to the research into policy languages and spec-885ifications for managing privacy (Godefroid et al., 2000) as well as middleware for886policy management, such as LocServ (Myles et al., 2003) and the pawS, privacy887awareness system for ubquitous computing environments (Langheinrich, 2002b).888These have been influenced by P3P (P3P, 2004) which was developed in the con-889text of web privacy. There is also the very important need for interfaces enabling890users to define privacy policies (Lau et al., 1999; Lederer et al., 2003) as well as891(Heckmann, 2003a) mentioned above. Another loosely related area of work con-892cerns anonymity and pseudonymity, which has been linked to user modelling893(Kobsa and Schreck, 2003). There has also been considerable work on design894guidelines for ubiquitous computing systems, such as (Bellotti et al., 2002), and895the principles of design for privacy awareness in ubiquitous system (Langheinrich,8962001). He further argues (Langheinrich, 2002a) that privacy requirements should897include comprehensibility and manageability, control and accountability for the use898and management of personal data collected in the environment. A complementary899concern for these issues has been described in the context of user modelling and900personalisation (Kobsa, 2002; Miller, 2000). Some work towards addressing these901issues has been done. For example, privacy mirrors (Mynatt and Nguyen, 2001)902
Journal: USER MS.: USER355 PIPS: DO00020001 TYPESET � DISK LE � CP Disp.: 8/7/2005 Pages: 40

32 DAVID J CARMICHAEL ET AL.
enable users to see what sensors are detecting them and how information about903them has been used. This is somewhat similar to our invisibility interface.904
The accretion-resolution representation and the MyPlace architecture905match well the ongoing refinements to a range of national and international pri-906vacy legislation (Kobsa, 2001b). For example, the European Community Directive907on Data Protection (EU and the Council of the European Union, 1995) man-908dates ‘right of access to and the right to rectify the data’ and, a particular demand909for scrutability in the requirement for ‘an intelligible form of the data undergoing910processing and of any available information as to their source’.911
8. Discussion and Conclusions912
The use of accretion and resolvers provides an elegant and flexible way to deal913with inconsistency. The whole point of modelling some components is to track914changes. For example, the user’s location changes as they move around their envi-915ronment. There is no need to deal with conflicting evidence until an application916requests the value of components of the user model. Until a value is required, the917accretion-resolution representation allows evidence to accrete in the mod-918els of sensors and devices without interpreting it. When an application needs to919know the user’s location, it can ask for the current resolved value of the evidence920available for that component. If it is authorised to have that information, then at921that point, the resolver it has nominated is used to determine the value of the922component. In the case of the user’s location, the values returned by this request923would be either an indication that the system really does not know, or the value924of the modelled location, possibly with a certainty value.925
A primary motivation for the design of accretion-resolution was to pro-926vide a scrutable representation, where the user could examine the user model, the927value of its components such as inferred location and the processes that define928that value. Those processes can be explained in terms of the list of evidence and929the resolver process used to interpret it. We see scrutability as a foundation930for user control over personalisation, an issue that is also explored by (Cheverst931et al., 2005). In this paper, we have described how the design of the accretion-932resolution representation supports modelling of users in a ubiquitous comput-933ing environment, in a manner that should be amenable to user scrutiny. Discus-934sion of the very important issues of the design of suitable scutability interfaces is935beyond the scope of this paper but has been explored in previous work (Apted936et al., 2003; Czarkowski and Kay, 2003; Kay, 1995; Uther and Kay, 2003) includ-937ing some exploration of ubiquitous computing environments (Kay et al., 2003).938
This introduces another dimension of a practical deployment of MyPlace: we939need to explore ways that people can select a suitable policy for the ways that appli-940cations should be allowed to access accretion -resolution user models. One941
natural possibility would make use of visualisations such as the graphs in Section 5:942these would enable a person to see how a policy would operate in practice.943
Journal: USER MS.: USER355 PIPS: DO00020001 TYPESET � DISK LE � CP Disp.: 8/7/2005 Pages: 40
CONSISTENT MODELLING OF USERS, DEVICES AND SENSORS 33
We have barely touched upon the underlying modelling of space: the Invisibility944Scenario requires this. We have chosen to model locations at a symbolic level, in945terms of rooms and other places that make sense to people. This matches propos-946als (Hightower and Borriello, 2001; Lin et al., 2002) which call for intuitive mod-947elling of location. We have also performed some preliminary experiments towards948interfaces that enable people to personalise the ontology of the underlying space949models used for them (Carmichael et al., 2004). Further discussion of this impor-950tant topic is outside the scope of this paper. There are other issues that are very951important but were outside the scope of this paper. For example, we have not952addressed security and privacy. Nor have we explored the details of the engineering953of the actual machines, networks and their configurations.954
We have illustrated how MyPlace demonstrates the effectiveness of the accre-955tion-resolution user model representation for an interesting class of problems956for user modelling in a ubiquitous computing environment. We began this paper with957two scenarios, one illustrating the problems of invisibility in ubiquitous computing958environments and the second, Locator, illustrating the need for flexible spatial959and temporal accuracy in the modelling of location and the need to be able to effi-960ciently determine a user’s location and ensure that it can be reported differently for961different users. We have described how the accretion-resolution representa-962tion addresses these issues.963
This work makes the following contributions.964
• It introduces the MyPlace architecture, which derives considerable power and965flexibility from the use of a Publish/Subscribe server to receive and redirect966the messages from sensors to sensor and device models. This is an inherently967distributed approach that copes naturally with geographically spread sensors.968This approach has not been explored in previous work on personalised ubiq-969uitous computing environments.970
• MyPlace makes use of the redundant Seen and Seenby components, a novel971approach, that serves to separate the elements of the system. This is impor-972tant as a foundation for controlling access to information for privacy and973security as well as for partitioning information within the personalised ubiq-974uitous computing environment.975
• We have illustrated how MyPlace manages multiple, heterogenous sensors in976a light-weight approach designed to be simple enough to support scrutabil-977ity as well as user controlled, flexible interpretation of available evidence via978resolvers that could, potentially, be chosen and tuned by users.979
• The accretion-resolution representation was implemented as a980light-weight tool and we have demonstrated the efficiency of the core tell and981ask operations.982
• Finally, we have extended the use of a user model representation to model,983not only users, but also the other entities in the personalised ubiquitous984computing environment, the sensors and devices. This provides a consistent985
Journal: USER MS.: USER355 PIPS: DO00020001 TYPESET � DISK LE � CP Disp.: 8/7/2005 Pages: 40

34 DAVID J CARMICHAEL ET AL.
representation and reasoning mechanism across these three classes informa-986tion and recognises that the same core reasoning flexibility can be useful for987all of these. This provides an elegant mechanism to address the need to inte-988grate context modelling and user modelling (Zimmermann et al., 2005).989
We have illustrated these contributions in terms of the two demonstrator MyPlace990applications. The first addresses the invisibility scenario. This is a novel but poten-991tially important personalised ubiquitous computing application, which has much992in common with more established work that delivers information based upon the993user’s location (Hatala and Wakkary, 2005; Petrelli and Not, 2005). The second994scenario, Locator, goes beyond the many systems that have used various sensor995technologies to model people’s location, exploring the flexible personalisation of996modelling people’s location and activity.997
Appendix A998
Annotation Actual data collected from sensorsformat: location of sensor, time
Starts at home ‘Home’, Tue Mar 30 06:54:38 2004‘Home’, Tue Mar 30 06:58:46 2004
Seen in the building foyer ‘Madsen Foyer’, Tue Mar 30 09:40:13 2004Offices near Bob’s office (G61a) ‘G62’, Tue Mar 30 09:41:55 2004
‘G61a’, Tue Mar 30 09:42:02 2004‘G61b’, Tue Mar 30 09:42:04 2004
Activity detected on Bob’ssystem ‘G61a system’, Tue Mar 30 09:44:17 2004
Note very close oroverlapping detections ‘G61a’, time = Tue Mar 30 09:49:12 2004
‘G61b’, time = Tue Mar 30 09:49:13 2004‘G62’, time = Tue Mar 30 09:50:06 2004
System activity disambiguates ‘G61a system’, time = Tue Mar 30 09:50:57 2004’G62’, time = Tue Mar 30 09:51:07 2004‘G61a’, Tue Mar 30 12:05:07 2004‘G61b’, Tue Mar 30 12:05:08 2004
Seminar/lunch ‘G92’, Tue Mar 30 12:10:04 2004‘G61a’, Tue Mar 30 12:10:04 2004‘G92’, Tue Mar 30 13:16:27 2004
Brief visit back to office ‘G61b’, Tue Mar 30 13:18:43 2004‘G92’, Tue Mar 30 13:19:31 2004
Journal: USER MS.: USER355 PIPS: DO00020001 TYPESET � DISK LE � CP Disp.: 8/7/2005 Pages: 40

CONSISTENT MODELLING OF USERS, DEVICES AND SENSORS 35
‘G61a’, Tue Mar 30 13:20:45 2004‘G61a system’, Tue Mar 30 13:24:18 2004‘G61a’, Tue Mar 30 18:34:32 2004
Leaving ‘Madsen Foyer’, Tue Mar 30 18:34:42 2004At home ‘Home’, Tue Mar 30 19:20:11 2004
Annotated subset of data collected for a single user on Tuesday 30th March 2004. Therewere 336 sensor entries for this user. Annotations indicate main locations and conflictingsensor evidence. Horizontal lines indicate that data has been omitted at this point so thatwe can show those entries that are important for the discussion. The double line indicatesthe end of the data used for Table I.
Acknowledgements999
This research was partially funded by the Smart Internet Technology Cooperative1000Research Centre Intelligent Environments Programme. We thank Chris Johnson,1001Australian National University, for his detailed and very helpful comments on the1002earlier draft of this paper and encouragement for this project.1003
References1004
Ackerman, M., Cranor, L. and Reagle, J.: 1999, Privacy critics: UI components to1005safeguard user’ privacy’. In: M.H. Williams (ed.): The CHI is the Limit: Human1006Factors in Computing Systems, CHI99 Conference Proceedings. Pittsburgh, Penn-1007sylvania, USA, pp. 1–8.1008
Addlesee, M., Curwen, R., Hodges, S., Newman, J., Steggles, P., Ward, A. and1009Hopper, A.: 2001, Implementing a sentient computing system. IEEE Computer101034(8), 50–56.1011
Apted, T., Kay, J., Lum, A. and Uther, J.: 2003, Visualisation of ontological1012inferences for user control of personal web agents. In: E. Banissi, K. Borner,1013C. Chen, G. Clapworthy, C. Maple, A. Lobben, C. Moore, J. Roberts, A. Ursyn,1014and J. Zhang (eds.): Proceedings of IV03-VSW, Information Visualisation –1015Semantic Web Visualisation. London, UK, pp. 305 – 311.1016
Bauer, M., Becker, C. and Rothermel, K.: 2002, Location models from the per-1017spective of context-aware applications and mobile ad hoc networks. Personal and1018Ubiquitous Computing 6(5-6), 322–328.1019
Bellotti, V., Back, M., Edwards, W.K., Grinter, R.E., Henderson, D.A. and Lopes,1020C.V.: 2002, Making sense of sensing systems: five questions for designers and1021researchers. In: CHI ’02: Proceedings of the SIGCHI Conference on Human Fac-1022tors in Computing Systems. Minneapolis, Minnesota, USA, pp. 415–422.1023
Brajnik, G. and Tasso, C.: 1994, A shell for developing non-monotonic user mod-1024eling systems’. International Journal of Human-Computer Studies 40(1), 36–62.1025
Journal: USER MS.: USER355 PIPS: DO00020001 TYPESET � DISK LE � CP Disp.: 8/7/2005 Pages: 40
36 DAVID J CARMICHAEL ET AL.
Brummit, B., Krumm, J., Kern, A. and Shafer, S.A.: 2000, Easyliving: technologies1026for intelligent environments’. In: Proceedings of: 2nd International Symposium on1027Handheld and Ubiquitous Computing. Bristol, United Kingdom, pp. 12–29.1028
Carmichael, D.J., Kay, J. and Kummerfeld, R.J.: 2004, Personal ontologies for fea-1029ture selection in intelligent environment visualisations. In: J. Baus, C. Kray, and1030R. Porzel (eds.): Proceedings of AIMS’04 – Artificial Intelligence in Mobile Sys-1031tem. Nottingham, England, pp. 44–51.1032
Cheverst, K., Byun, H.E., Fitton, D., Sas, C., Kray, C. and Villar, N.: 2005,1033Exploring issues of user model transparency and proactive behaviour in an office1034environment control system. User Modeling and User-Adapted Interaction: The1035Journal of Personalization Research (this issue).1036
Chin, D. and Wahlster, W.: 1989, KNOME: modeling what the user knows in UC.1037In: A. Kobsa (ed.): User Models in Dialog Systems. Springer-Verlag, Berlin, pp.103874–107.1039
Czarkowski, M. and Kay, J.: 2003, How to give the user a sense of control over the1040personalization of adaptive hypertext?. In: P. de Bra, H. Davis, and J. Kay (eds.):1041Proceedings of Workshop on Adaptive Hypermedia and Adaptive Web-Based Sys-1042tems, User Modeling 2003 Session. University of Pittsburgh, Johnstown, PA,1043USA, pp. 121–132.1044
Doyle, J.: 1979, A truth maintenance system. Artificial Intelligence 12(3), 231–171.1045EU, T.E.P. and the Council of the European Union, 1995, European Community1046
Directive on Data Protection. http://www.doc.gov/ecommerce/eudir.htm.1047Godefroid, P., Herbsleb, J.D., Jagadeesan, L.J. and Li, D.: 2000, Ensuring privacy1048
in presence awareness systems: an automated verification approach. In: Proceed-1049ings of ACM 2000 Conference on Computer Supported Cooperative Work. Phila-1050delphia, Pennsylvania, USA.1051
Hatala, M. and Wakkary, R.: 2005, User modeling and semantic technologies in1052support of a tangible interface. User Modeling and User-Adapted Interaction:1053The Journal of Personalization Research (this issue).1054
Heckmann, D.: 2003a, Integrating privacy aspects into ubiquitous computing: a1055basic user interface for personalization. In: Proceedings of Artificial Intelligence1056in Mobile Systems Workshop at Ubicomp 2003, Seattle, Washington, USA.1057
Heckmann, D.: 2003b, A specialised representation for ubiquitous computing and1058user modeling. In: Proceedings of Workshop on User Modelling for Ubiquitous1059Computing at User Modelling 2003 (UM’03). University of Pittsburgh, Johns-1060town, PA, USA. http://www.di.uniba.it/ ubium03/heckmann-2.pdf.1061
Heckmann, D.: 2004, Ubisworld. http://www.u2m.org/.1062Hengartner, U. and Steenkiste, P.: 2003, Protecting access to people location infor-1063
mation. In: Proceedings of First International Conference on Security in Pervasive1064Computing. Boppard, Germany, pp. 25–38.1065
Hightower, J. and Borriello, G.: 2001, Location systems for ubiquitous computing.1066IEEE Computer 34(8), 57–66.1067
Journal: USER MS.: USER355 PIPS: DO00020001 TYPESET � DISK LE � CP Disp.: 8/7/2005 Pages: 40

CONSISTENT MODELLING OF USERS, DEVICES AND SENSORS 37
Hightower, J. and Borriello, G.: 2004, Particle filters for location estimation in1068ubiquitous computing. In: N. Davies, E. Mynatt, and I. Siio (eds.): Proceed-1069ings of 6th International Conference on Ubiquitous Computing (UbiComp 2004).1070Nottingham, England, pp. 88–106.1071
Huang, X., McCalla, G.I., Greer, J.E. and Neufeld, E.: 1991, Revising deductive1072knowledge and stereotypical knowledge ina student model. User Modeling and1073User-Adapted Interaction: The Journal of Personalization Research 1(1), 87–116.1074
Judd, G. and Steenkiste, P.: 2003, Providing contextual information to pervasive1075computing applications. In: Proccedings of IEEE International Conference on1076Pervasive Computing (PERCOM), Dallas, pp. 133–142.1077
Kass, R.: 1991, Building a user model implicitly from a cooperative advisory dia-1078log. User Modeling and User-Adapted Interaction: The Journal of Personalization1079Research 1(3), 203–258.1080
Kay, J.: 1995, The um toolkit for cooperative user modelling. User Modeling and1081User-Adapted Interaction: The Journal of Personalization Research 4(3), 149–196.1082
Kay, J., Kummerfeld, B. and Lauder, P.: 2002, Personis: a server for user mod-1083els. In: P.D. Bra, P. Brusilovsky, and R. Conejo (eds.): Proceedings of AH’2002,1084Adaptive Hypertext 2002. Malaga, Spain, pp. 203–212.1085
Kay, J., Lum, A. and Uther, J.: 2003, How can users edit and control their mod-1086els in ubiquitous computing environments?. In: K. Cheverst, N. de Carolis, and1087A. Kruger (eds.): UM03 Workshop on User Modeling for Ubiquitous Computing.1088University of Pittsburgh, Johnstown, PA, USA, pp. 12–16.1089
Kidd, C.D., Orr, R., Abowd, G.D., Atkeson, C.G., Essa, I.A., MacIntyre, B.,1090Mynatt, E.D., Starner, T.E. and Newstetter, W.: 1999, The Aware Home: a liv-1091ing laboratory for ubiquitous computing research. In: Proceedings of the Second1092International Workshop on Cooperative Buildings, Integrating Information, Orga-1093nization, and Architecture, Pittsburgh, USA, pp. 191–198.1094
Kobsa, A.: 2001a, Generic user modeling systems. User Modeling and User-1095Adapted Interaction – Ten Year Anniversary Issue 11(1–2), 49–63.1096
Kobsa, A.: 2001b, Invited keynote: tailoring privacy to user’s needs. In: Proceed-1097ings of the User Modeling Conference. Sonthofen, Germany, pp. 303–313.1098
Kobsa, A.: 2002, Personalized hypermedia and international privacy. Communica-1099tions of the ACM 45(5), 64–67.1100
Kobsa, A. and Pohl, W.: 1995, The user modeling shell system BGP-MS. User1101Modeling and User-Adapted Interaction: The Journal of Personalization Research11024(2), 59–106.1103
Kobsa, A. and Schreck, J.: 2003, Privacy through pseudonymity in user-adaptive1104systems. ACM Transactions on Internet Technology 3(2), 149–183.1105
Kono, Y., Ikeda, M. and Mizoguchi, R.: 1994, THEMIS: a nonmonotonic induc-1106tive student modeling system. International Journal of Artificial Intelligence in1107Education 5(3), 371–413.1108
Langheinrich, M.: 2001, Privacy by design – principles of privacy-aware ubiquitous1109systems. In: G.D. Abowd, B. Brumitt, and S.A. Shafer (eds.): Proceedings of1110
Journal: USER MS.: USER355 PIPS: DO00020001 TYPESET � DISK LE � CP Disp.: 8/7/2005 Pages: 40

38 DAVID J CARMICHAEL ET AL.
3rd International Conference on Ubiquitous Computing (UbiComp 2001), Atlanta,1111Georgia, USA, pp. 273–291.1112
Langheinrich, M.: 2002a, As we may live – real-world implications of ubiquitous1113computing. http://www.vs.inf.ethz.ch/publ/papers/uc-implications.pdf.1114
Langheinrich, M.: 2002b, A privacy awareness system for ubiquitous computing1115environments. In: G. Borriello and L.E. Holmquist (eds.): Proceedings of 4th1116International Conference on Ubiquitous Computing (UbiComp 2002), Goteberg,1117Sweden, pp. 237–245.1118
Lau, T., Etzioni, O. and Weld, D.S.: 1999, Privacy interfaces for information man-1119agement. Communications of the ACM 42(10), 89–94.1120
Lederer, S., Hong, J.I., Jiang, X., Dey, A.K., Landay, J.A. and Mankoff, J.: 2003,1121Towards everyday privacy for ubiquitous computing of everyday privacy in ubiq-1122uitous computing environments. Technical report ucb-csd-03-1283, Computer1123Science Division, University of California, Berkley.1124
Lehmann, O., Bauer, M., Becker, C. and Nicklas, D.: 2004, From home to world1125- supporting context-aware applications through world models. In: Proceedings1126of the Second IEEE International Conference on Pervasive Computing and Com-1127munications (PERCOM’04). Orlando, Florida, pp. 297–306.1128
Lin, J., Laddaga, R. and Naito, H.: 2002, Personal location agent for communicat-1129ing entities (PLACE). In: F. Paterno (ed.): Proceedings of Fourth International1130Symposium on Human Computer Interaction with Mobile Devices (Mobile HCI11312002), Vol. 2411 of Lecture Notes in Computer Science. Pisa, Italy, pp. 45–59.1132
Miller, C.: 2000, Rules of etiquette, or how a mannerly AUI should comport itself to1133gain social acceptance and be perceived as gracious and well-behaved in polite soci-1134ety. In: S. Rogers and W. Iba (eds.): Papers from 2000 Adaptive User Interfaces AAAI1135Spring Symposium, Technical Report SS-00-01, Stanford, CA:, pp. 80–81.1136
Myles, G., Friday, A. and Davies, N.: 2003, Preserving privacy in environments1137with location-based applications. IEEE Pervasive Computing 2(1), 56–64.1138
Mynatt, E.D. and Nguyen, D.: 2001, Making Ubiquitous Computing Visible. In:1139Proceedings of CHI 2001 Workshop on Building the Ubiquitous Computing User1140Experience. Minneapolis, Minnesota. http://www2.parc.com/csl/ projects/ubi-1141comp-workshop/positionpapers/mynatt.pdf (visited April 2003).1142
Nielsen, J.: 2000, Designing Web Usability. Indianapolis, Indiana, USA: New Riders.1143P3P: 2004, Platform for Privacy Preferences (P3P). http://www.w3.org/P3P/ (visited1144
April 2004).1145Paiva, A. and Self, J.: 1995, TAGUS – a user and learner modeling workbench.1146
User Modeling and User-Adapted Interaction: The Journal of Personalization1147Research 4(3), 197–228.1148
Patterson, D., Liao, L., Gajos, K., Coller, M., Livic, N., Olson, K., Wang, S.,1149Fox, D. and Kautz, H.: 2004, Opportunity knocks: a system to provide cogni-1150tive assistance with transportation services. In: N. Davies, E. Mynatt, and I. Siio1151(eds.): Proceedings of 6th International Conference on Ubiquitous Computing (U-1152biComp 2004). Nottingham, England, pp. 433–450.1153
Journal: USER MS.: USER355 PIPS: DO00020001 TYPESET � DISK LE � CP Disp.: 8/7/2005 Pages: 40

CONSISTENT MODELLING OF USERS, DEVICES AND SENSORS 39
Petrelli, D. and Not, E.: 2005, User-centred design of flexible hypermedia for a1154mobile guide: reflections on the HyperAudio Experience. User Modeling and1155User-Adapted Interaction: The Journal of Personalization Research (this issue).1156
Priyantha, N.B., Chakraborty, A. and Balakrishnan, H.: 2000, The Cricket loca-1157tion-support system. In: MobiCom ’00: Proceedings of the 6th Annual Interna-1158tional Conference on Mobile Computing and Networking, Boston, Massachusetts,1159pp. 32–43.1160
Rich, E. and Wahlster, W.: 1989, Stereotypes and user modeling. In: A. Kobsa1161(ed.): User Models in Dialog Systems. Berlin: Springer-Verlag, pp. 35–51.1162
Scott, J. and Hazas, M.: 2003, User-friendly surveying techniques for location-1163aware systems. In: Proceedings of 5th International Conference on Ubiquitous1164Computing (UbiComp 2003). Seattle, Washington, USA, pp. 44–53.1165
Segall, B., Arnold, D., Boot, J., Henderson, M. and Phelps, T.: 2000, Content1166based routing with Elvin4. In: Proceedings AUUG2K. Canberra, Australia.1167http://elvin.dstc.edu.au/doc/papers/auug2k/auug2k.pdf.1168
Uther, J. and Kay, J.: 2003, A web-based visualion of large user models. In: P.1169Brusilovsky, A. Corbett, and F. de Rosis (eds.): Proceedings of 9th International1170Conference on User Modeling (UM 2003). Johnston, PA, USA, pp. 198–202.1171
Want, R., Hopper, A., Falco, V. and Gibbons, J.: 1992, The active badge location1172system. ACM Transactions on Information Systems 10(1).1173
Zimmermann, A., Sprecht, M. and Lorenz, A.: 2005, Personalisation and context-1174management. User Modeling and User-Adapted Interaction: The Journal of Per-1175sonalization Research. (this issue).1176
Zipf, G.K.: 1949, Human Behaviour and the Principle of Least Effort. Addison-1177Wesley, Cambridge, MA.1178
Authors’ Vitae1179
David J Carmichael1180
David Carmichael is a Ph.D. candidate in the School of Information Tech-1181
nologies as the University of Sydney. He received his B.Sc. with First Class1182Honours at the University of Sydney. His research is supported by the Smart In-1183ternet Technology Cooperative Research Centre (SITCRC), and is in the areas1184of Ubiquitous Computing and Intelligent Environments. He is particularly inter-1185ested in exploring the challenges of producing personalised views of the invis-1186ible elements, sensors, services and nearby people, within an Intelligent1187Environment.1188
Judy Kay1189Judy Kay is Associate Professor at School of Information Technologies, at the1190University of Sydney. She is co-leader of the Smart Internet Technology Research1191Group which conducts fundamental as well as applied research in user-adapted1192systems. The core of her work is to represent and manage personalisation that1193
Journal: USER MS.: USER355 PIPS: DO00020001 TYPESET � DISK LE � CP Disp.: 8/7/2005 Pages: 40

40 DAVID J CARMICHAEL ET AL.
ensures the user can maintain control, being able to scrutinise and control the1194whole process of personalisation. She has over 100 publications in the areas of per-1195sonalisation and teaching and learning.1196Bob Kummerfeld1197
Bob Kummerfeld is an Associate Professor of Computer Science at the University1198of Sydney working in the area pervasive computing. He is particularly interested1199in scalable message systems for the distribution and management of context infor-1200mation and user modelling for pervasive computing. He is co-leader of the Smart1201Internet Technology Research Group.1202
Journal: USER MS.: USER355 PIPS: DO00020001 TYPESET � DISK LE � CP Disp.: 8/7/2005 Pages: 40