Authors Coal Transition in the Dominika Rečková … · Coal Transition in the CZECH REPUBLIC...
24
Coal Transition in the CZECH REPUBLIC Authors Dominika Rečková Lukáš Rečka Milan Ščasný www.coaltransitions.org 2017 An historical case study for the project “Coal Transitions: Research and Dialogue on the Future of Coal”
Transcript of Authors Coal Transition in the Dominika Rečková … · Coal Transition in the CZECH REPUBLIC...

Coal Transition in the CZECH REPUBLIC
Authors Dominika Rečková
Lukáš Rečka Milan Ščasný
www.coaltransitions.org
2017
An historical case study for the project “Coal Transitions: Research and Dialogue on the Future of Coal”

Coal Transition in the
CZECH REPUBLIC
History of coal production and coal reserves 3
Key features of the Czech economy 4
Fuel mix in the Czech Republic 1990 - 2014 4
Key features of coal sector in the Czech Republic after 1990 6
The use of coal in the Czech Republic and its possible replacement 8
A. Coal as source of Electricity 8
B. Coal as Heating source 9
C. Non - energy coal use 10
The state role in the coal sector after 1990 – mining limits 10
Measures to ease transition 13
Phasing-out of mining activities 14
Rehabilitation of environmentally damaged land 15
Programmes financing the remediation of ecological damage 15
Remediation of environmental damage caused by mining 15
Future outlook 16
Lessons learned 16
References 17
Annex 18
Cite this report asDominika Rečková et al. (2017) , Coal Transition in the Czech Republic, IDDRI and Climate Strategies.
AuthorsDominika Rečková, Lukáš Rečka, Milan Ščasný, Charles University
Publishers: IDDRI and Climate Strategies Editors: Pierre Barthélemy, Andrzej Błachowicz, Germana Canzi, Alexandra Carr, Oliver Sartor, Thomas SpencerGraphic design: Ivan Pharabod
Contact informationOliver Sartor, IDDRI, [email protected] Thomas Spencer, IDDRI, [email protected] Andrzej Błachowicz, Climate Strategies, [email protected]
Copyright © 2017 IDDRI and Climate StrategiesIDDRI and Climate Strategies encourage reproduction and communication of their copyrighted materials to the public, with proper credit (bibliographical reference and/or corresponding URL), for personal, corporate or public policy research, or educational purposes. However, IDDRI and Climate Strategies copyrighted materials are not for commercial use or dissemination (print or electronic). Unless expressly stated otherwise, the findings, interpretations, and conclusions expressed in the materials are those of the various authors and are not necessarily those of IDDRI’s board or Climate Strategies Board/Secretariat.
An historical case study for the project “Coal Transitions: Research and Dialogue on the Future of Coal”
A project funded by the KR Foundation
This is one of the 6 country case-studies commissioned to collect experience on past coal transitions. The 6 countries are: Czech Republic, the Netherlands, Poland, Spain, UK, USA. Their role in the Coal Transitions project was to provide background information for a Synthesis Report for decision makers, and provide general lessons for national project teams to take into account in developing their coal transitions pathways for the future.

AbstractIn this report we summarize the development of coal sector in Czech Republic since 1990 with a particular focus on the socio-economic impacts. First we present the key features of the Czech economy and the energy system; second the development of coal mining and lastly the governmental role in the downturn of the coal industry, including its support for renewable energy sources.
COAL TRANSITION IN THE CZECH REPUBLIC 3
1History of coal production and coal reserves
The oldest written mention of mining on the present Czech Republic territory comes from the 15th century, while the expansion of hard coal, brown coal, and lignite mining began with the construction of railways in mid 19th century (Czech News Agency 2016). The main brown coal deposits are located on the border with Germany in the North Bohemian Brown Coal Basin. Hard coal deposits are situated near the Polish border in the Czech part of the Upper Silesian Basin. The mining of coal in the Czech Republic gradually increased from 10 million tonnes in 1876 to over 40 million tonnes in 1950 and then culminated around 1980 at about 120 million tonnes (Maca & Melichar 2016). The slowdown of coal mining was experienced across Western Europe, beginning around the year 1960. The output of the largest producers at the time – Germany, France, England and Belgium – decreased their yearly outputs by anywhere between tens to
hundreds of millions of tonnes. In Middle and Eastern Europe, states continued to mine for economic and mainly political reasons over the next 30 years, starting their downturn after 1990 (Sochor). This was the case in the Czech Republic (see Figure 1). In the Czech Republic coal is the only indigenous energy source. In 2014 the Czech Republic had around 16 million kt of hard coal reserves (1,475,446 kt economic explored, 5,993,812 kt economic prospected and 8,835,351 kt potentially economic reserves); approximately 56 Mt is mineable and about 8 Mt of hard coal per year is presently extracted from 8 deposits.Brown coal reserves are smaller – in 2014 around 9 mil-lion kt (2,273,951 kt economic explored, 2,062,445kt economic prospected and 4,489,937 kt potentially eco-nomic reserves); approximately 796 Mt is exploitable and around 40 Mt of brown coal is mined yearly from 10 deposits (Starý et al. 2015).
Source: IEA (2016a), Coal Information 2016, www.iea.org/statistics/.
Brown coalHard coal
2015
2012
2009
2006
2003
2000
1997
1994
1991
1988
1985
1982
1979
1976
1973
Mt
0
20
40
60
80
100
120
Figure 1. Brown and hard coal production, 1973-2015
(Data are estimated.)

4 COAL TRANSITION IN THE CZECH REPUBLIC
2Key features of the Czech economy
The Czech economy underwent significant structural changes between the period 1990 to 2015. The energy intensity decreased significantly between 1995 and 2014, from 398.3 to 256.3 thousand tonnes of oil equivalent (ktoe) per EUR 1,000 of gross domestic product (GDP). It increased slightly in 2010 as a consequence of the eco-nomic crisis and decrease of GDP. The increase of GDP per capita and decrease of the unemployment rate were in-terrupted in 2009 also as a consequence of the economic crisis. After a short recovery in 2011, both GDP per capita and unemployment rate again slightly deteriorated, but the final recovery came in 2013. The proportion of mining and quarrying on Gross Value Added dropped from 3.7% in 1990 to 0.91% in 2015, mainly as a consequence of coal sector decline. (cf. Table A-1 in the Annex).
In the period 1990-2014 (except for 1995 and 1996), the Czech Republic was a net electricity exporter (see Figure 2). Since 2000 it has been one of the three larg-est net electricity exporters in the European Union (EU) next to France and Germany; it was only in 2012 that excessive exports from Sweden and Norway shifted the Czech Republic into fifth place.1 Consumption of primary energy sources in the Czech Republic is fast by ½ covered by domestic sources; this energy import dependence of around 50% is among the lowest in the EU. Coal domi-nates the Czech energy mix and is also used for domestic heating (Ministry of Industry and Trade 2015).
3Fuel mix in the Czech Republic 1990 - 2014
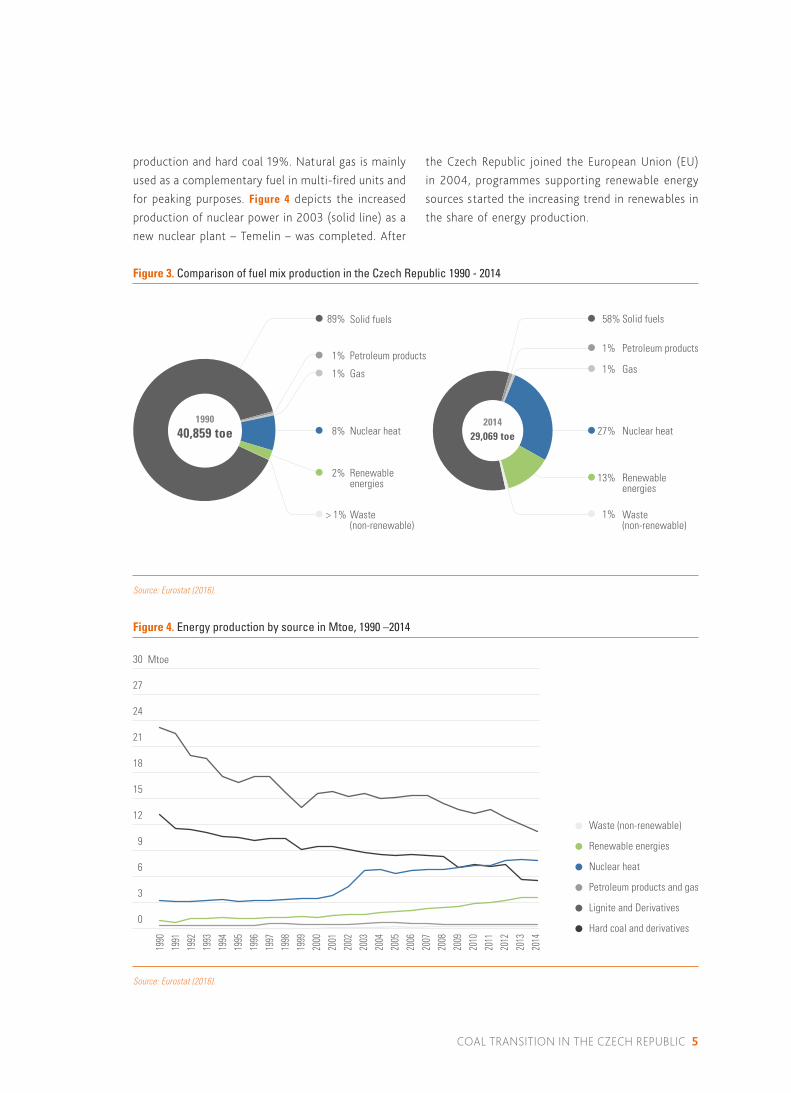
The Czech Republic in 1990 used mainly coal and lig-nite as the primary energy source (89%), nuclear (8%) was the second most important source (see Figure 3). By 2014 coal and lignite had fallen from their dominant position (down to 58%) in favour of all other sources.
Especially nuclear, which more than tripled (27%) and the share of renewables grew from 2% in 1990 to 13% in 2014. The overall primary energy production decreased from 41 ktoe in 1990 to 29 ktoe in 2014. In 2014 brown coal s till makes up 39% of energy
Source: Eurostat (2016).
Import
Export
2014
2013
2012
2011
2010
2009
2008
2007
2006
2005
2004
2003
2002
2001
2000
1999
1998
1997
1996
1995
1994
1993
1992
1991
1990
ktoe
-2500
-2000
-1500
-1000
-500
0
500
1000
1500
Net import
Figure 2. Electricity cross-border trade in the Czech Republic, 1990 - 2014
1 See http://appsso.eurostat.ec.europa.eu/nui/submitViewTableAction.do online.
COAL TRANSITION IN THE CZECH REPUBLIC 5
production and hard coal 19%. Natural gas is mainly used as a complementary fuel in multi-fired units and for peaking purposes. Figure 4 depicts the increased production of nuclear power in 2003 (solid line) as a new nuclear plant – Temelin – was completed. After
the Czech Republic joined the European Union (EU) in 2004, programmes supporting renewable energy sources started the increasing trend in renewables in the share of energy production.
Source: Eurostat (2016).
Solid fuels
Petroleum products
Gas
Nuclear heat
Renewable energies
Waste (non-renewable)
Solid fuels
Petroleum products
Gas
Nuclear heat
Renewable energies
Waste (non-renewable)
89%
1%
1%
1%
1%
8%
2%
199040,859 toe
58%
27%
13%
1%> 1%
201429,069 toe
Figure 3. Comparison of fuel mix production in the Czech Republic 1990 - 2014
Source: Eurostat (2016).
Lignite and Derivatives
Nuclear heat
Hard coal and derivatives
Renewable energies
Petroleum products and gas
Waste (non-renewable)
2014
2013
2012
2011
2010
2009
2008
2007
2006
2005
2004
2003
2002
2001
2000
1999
1998
1997
1996
1995
1994
1993
1992
1991
1990
Mtoe
0
3
6
9
12
15
18
21
24
27
30
Figure 4. Energy production by source in Mtoe, 1990 –2014

6 COAL TRANSITION IN THE CZECH REPUBLIC
4Key features of coal sector in the Czech Republic after 1990
After the political and social change in 1989 in Czech-oslovakia, extensive economic transformation began. A strong recession in heavy industry decreased and changed the demand for energy supply which led to production decline. This, together with pressure for en-vironmental improvements, resulted in the coal sector downturn overseen by the government. Many mines were privatized and some closed.2 Even in 1993, publi-cally owned companies accounted for 65% of GVA in the whole mining and quarrying sector, while in 2014 it was only 20.5% (see Table A-2 in Annex). Coal output and value added has decreased since 1990 with few ex-ceptions, such as growth in output due to price rises in 1995 or before the crisis in 2009, but production remains constant or decreasing. Compare the increases of output in Figure 6 (green solid line) and constantly decreasing hard coal production trend in Figure 7 (green solid line) and brown coal and lignite production trend in Figure 8 (green solid line). Table A-3 shows the coking hard coal price increase from 86 to 137 Euro between the years 2007 and 2008 and summarizes the increasing brown coal prices trend since 2007.Since the 1990s, the overall mining and quarrying level has decreased from a point where 156,384 employees
in the mining and quarrying sector produced 36,295 ktoe of coal and lignite (see Figure 6). We see a gradual decrease of hard and brown coal derivatives produc-tion (solid lines in Figure 7 and Figure 8). The solid line in Figure 5 shows the number of employees in mining and quarrying in terms of Full Time Equivalents (FTE). Between 1990 and 1993 employment dropped by 41% - i.e. more than 64,000 employees – and this decreas-ing trend continued until 2015. Table A-1 shows that in 1990 2.9% of all employees worked in the mining and quarrying sector (156,384 in terms of FTE) while in 1993 it was 1.8% (91,906 FTE) and in 2015 it was 0.7% (33,546 FTE). The dashed line in Figure 5 depicts employment in the mining of coal and lignite, which has a very similar decreasing trend. In 1993, 71,468 (FTE) employees in coal and lignite mining formed 78% of employees in mining and quarrying, while in 2015, 22,509 (FTE) corresponded to 67% of all mining and quarrying employees. The number of coal reserves is decreasing: in 1990 there were 100 hard coal deposits, by 2014 there were 62; for brown coal the decrease has been from 80 to 52 deposits. The same is true for exploited deposits: 38 hard coal deposits in 1990, and 8 in 2014; 23 brown
Source: Czech Statistical Office (2016).
Mining of coal and lignite (FTE)
Mining & quarrying (FTE)
1000 people
0
20
40
60
80
100
120
140
160
201520102005200019951990
Figure 5. Employment of mining and quarrying sector 1990 – 2015, full time equivalents
Source: Czech Statistical Office (2016).
Output
Gross value added
Net value added
CZK billion, real prices (2010 )
0
20
40
60
80
100
120
87
100
7365
46
68
79
4839
29
63 73
4133
22
Figure 6. Coal market in Czech Republic, Output, GVA, 1993– 2015
201520102005200019951993
2 All data from Ministry of the Environment – Yearbook Mineral Commodity summary 2015.
COAL TRANSITION IN THE CZECH REPUBLIC 7
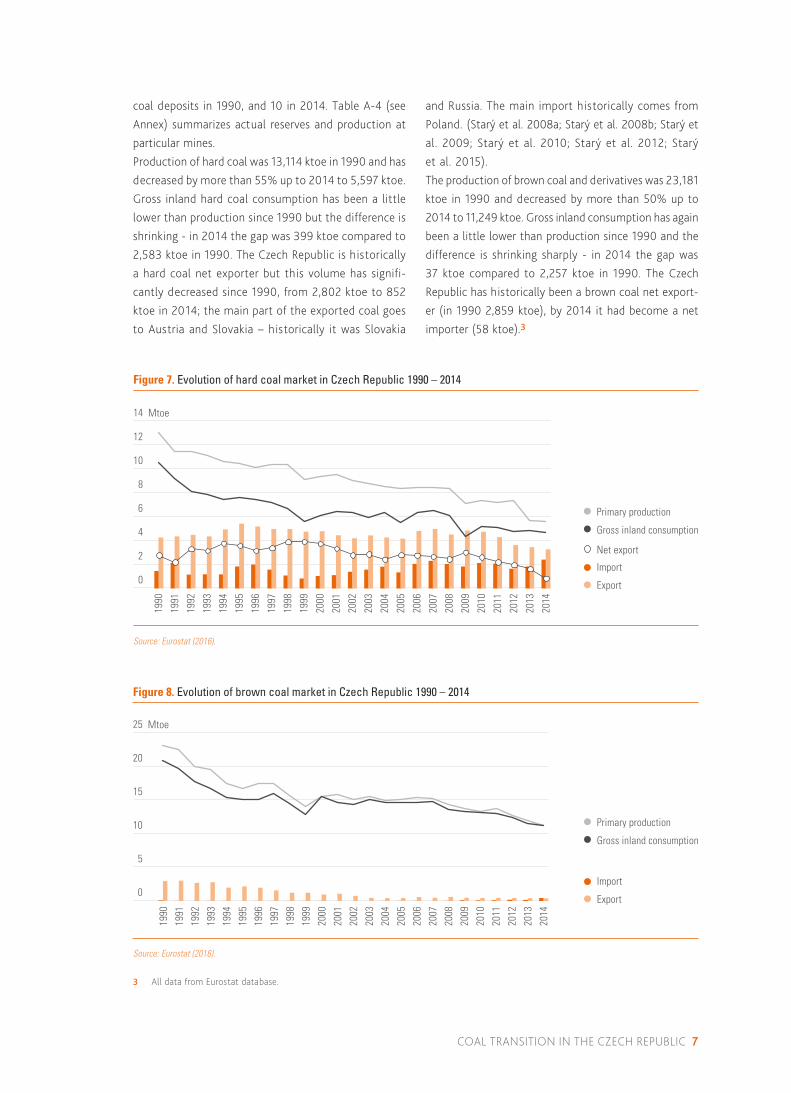
coal deposits in 1990, and 10 in 2014. Table A-4 (see Annex) summarizes actual reserves and production at particular mines.Production of hard coal was 13,114 ktoe in 1990 and has decreased by more than 55% up to 2014 to 5,597 ktoe. Gross inland hard coal consumption has been a little lower than production since 1990 but the difference is shrinking - in 2014 the gap was 399 ktoe compared to 2,583 ktoe in 1990. The Czech Republic is historically a hard coal net exporter but this volume has signifi-cantly decreased since 1990, from 2,802 ktoe to 852 ktoe in 2014; the main part of the exported coal goes to Austria and Slovakia – historically it was Slovakia
and Russia. The main import historically comes from Poland. (Starý et al. 2008a; Starý et al. 2008b; Starý et al. 2009; Starý et al. 2010; Starý et al. 2012; Starý et al. 2015).The production of brown coal and derivatives was 23,181 ktoe in 1990 and decreased by more than 50% up to 2014 to 11,249 ktoe. Gross inland consumption has again been a little lower than production since 1990 and the difference is shrinking sharply - in 2014 the gap was 37 ktoe compared to 2,257 ktoe in 1990. The Czech Republic has historically been a brown coal net export-er (in 1990 2,859 ktoe), by 2014 it had become a net importer (58 ktoe).3
Source: Eurostat (2016).
Mtoe
0
2
4
6
8
10
12
14
Import
Export
Primary production
Gross inland consumption
Net export
Figure 7. Evolution of hard coal market in Czech Republic 1990 – 2014
2014
2013
2012
2011
2010
2009
2008
2007
2006
2005
2004
2003
2002
2001
2000
1999
1998
1997
1996
1995
1994
1993
1992
1991
1990
Source: Eurostat (2016).
Mtoe
0
5
10
15
20
25
Import
Export
Primary production
Gross inland consumption
Figure 8. Evolution of brown coal market in Czech Republic 1990 – 2014
2014
2013
2012
2011
2010
2009
2008
2007
2006
2005
2004
2003
2002
2001
2000
1999
1998
1997
1996
1995
1994
1993
1992
1991
1990
3 All data from Eurostat database.

8 COAL TRANSITION IN THE CZECH REPUBLIC
5The use of coal in the Czech Republic and its possible replacement
In this section we sum up the use of coal in the Czech Republic during the years 1990 - 2014. We distinguish three categories of use: electricity generation, heat gen-eration, and non-energy use. Brown coal represents 84% of steam coal consumption and hard coal 16% (ASEK 2015). The majority (91.8%) is used for electricity and heat generation and, apart from a small amount used by households, the rest of steam coal is consumed by the industry sector. The overall share of coal combusted in households reaches 20% of the total coal consumption (IEA 2016). The following data also contains production from combined heat and power generation, which is very effective in fuel transformation. This cogeneration now secures almost 50% of all heat generation, in big and medium sources up to 70% and produces around 13% of generated electricity (ASEK 2015).
A. Coal as source of Electricity
Lignite and brown coal has been the main source of elec-tricity in the Czech Republic since the beginning of 20th century. In 1990, 66% electricity was generated from brown coal and 9% from hard coal, while nuclear pow-er generated 20% of a total of 5,379,000 toe electricity produced (see Table A-5 in Annex). Electricity production
followed an increasing trend with a steep rise at the begin-ning of 21st century, and a drop in 2005 and also in the run up to the economic crisis in 2008-9; we see a decreasing tendency from 2013. In 2014, 7,397,000 tonnes of oil equivalent 42% of electricity is generated from brown coal, 35% from nuclear and 6% from hard coal. The im-portance of other electricity sources also increased from 1990 to 2014: gas from 2% to 5% and renewables from 2% to 11%. The installed capacity of electricity increased during 1990-2014 from 15,279 MW to 23,077 MW due to the new nuclear power plant Temelin in 2003, and com-bined cycle, hydro and mixed plants in 1996, and wind and solar plants after 2002. Table 1 summarizes the develop-ment of installed electrical capacities by fuels.State energy policy, conceived in 2015, plans to trans-form the structure of electricity generation partially by moving away from coal in favour of nuclear power, natural gas and renewables up to 2040. According to its prediction, the share of brown coal in electricity production should fall as a result of energetic mod-ernization up to the year 2025, and then as a result of decreasing brown coal mining. In 2040 the brown coal share should be 15.2% while nuclear should increase to 48.8% and renewables to 22.8% (see Table 1) (Ministry of Industry and Trade 2015).
Note: TPES by consuming sector. Source: Ralfo 2017: IEA (2016b), Energy Balances of OECD Countries 2016, www.iea.org/statistics/.
Power generation
Other transformations
Industry
Transport
Residential
Commercial
2012
2009
2006
2003
2000
1997
1994
1991
1988
1985
1982
1979
1976
1973
Mtoe
0
5
10
15
20
25
30
35
40
Commercial includes commercial and public services, agriculture/forestry and fishing (negligible)
Other transformations includes other transformations such as coke ovens and refining, and energy own use
Industry includes non-energy use
Negligible.
Figure 9. Steam coal supply in the Czech Republic by consuming sector (1973 -- 2014)
COAL TRANSITION IN THE CZECH REPUBLIC 9
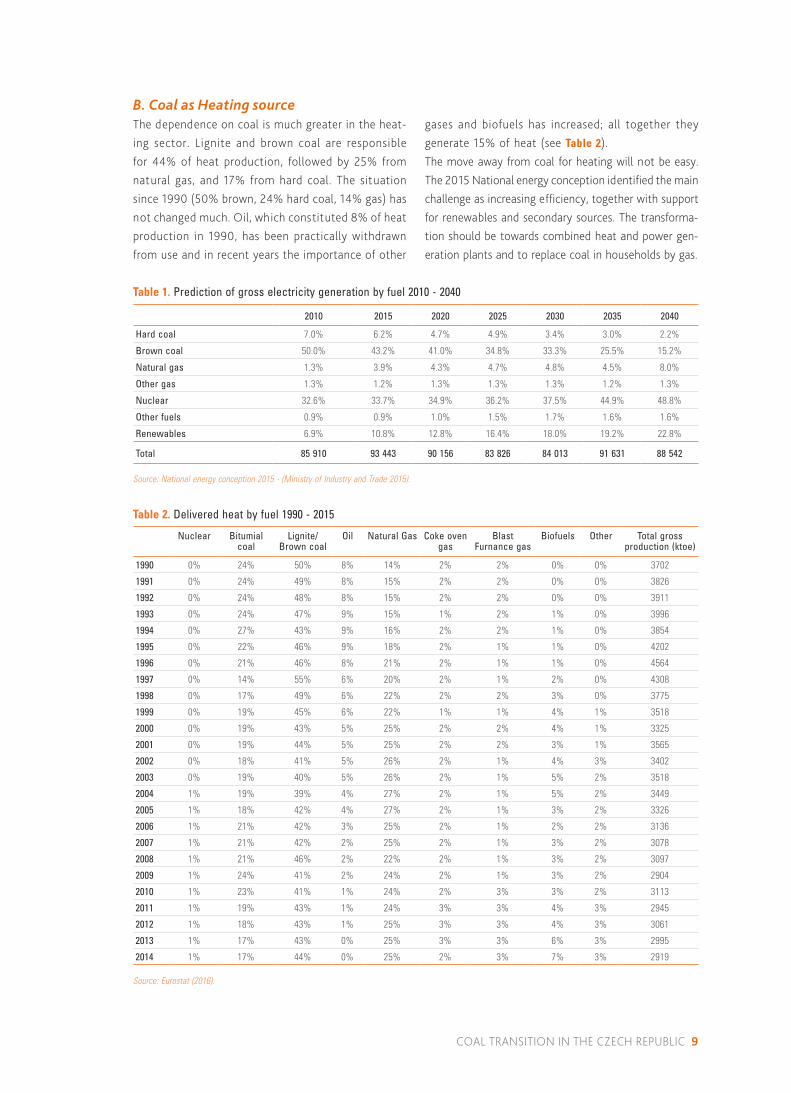
B. Coal as Heating sourceThe dependence on coal is much greater in the heat-ing sector. Lignite and brown coal are responsible for 44% of heat production, followed by 25% from natural gas, and 17% from hard coal. The situation since 1990 (50% brown, 24% hard coal, 14% gas) has not changed much. Oil, which constituted 8% of heat production in 1990, has been practically withdrawn from use and in recent years the importance of other
gases and biofuels has increased; all together they generate 15% of heat (see Table 2). The move away from coal for heating will not be easy. The 2015 National energy conception identified the main challenge as increasing efficiency, together with support for renewables and secondary sources. The transforma-tion should be towards combined heat and power gen-eration plants and to replace coal in households by gas.
Table 1. Prediction of gross electricity generation by fuel 2010 - 2040
2010 2015 2020 2025 2030 2035 2040
Hard coal 7.0% 6.2% 4.7% 4.9% 3.4% 3.0% 2.2%
Brown coal 50.0% 43.2% 41.0% 34.8% 33.3% 25.5% 15.2%
Natural gas 1.3% 3.9% 4.3% 4.7% 4.8% 4.5% 8.0%
Other gas 1.3% 1.2% 1.3% 1.3% 1.3% 1.2% 1.3%
Nuclear 32.6% 33.7% 34.9% 36.2% 37.5% 44.9% 48.8%
Other fuels 0.9% 0.9% 1.0% 1.5% 1.7% 1.6% 1.6%
Renewables 6.9% 10.8% 12.8% 16.4% 18.0% 19.2% 22.8%
Total 85 910 93 443 90 156 83 826 84 013 91 631 88 542
Source: National energy conception 2015 - (Ministry of Industry and Trade 2015).
Table 2. Delivered heat by fuel 1990 - 2015
Nuclear Bitumial coal
Lignite/ Brown coal
Oil Natural Gas Coke oven gas
Blast Furnance gas
Biofuels Other Total gross production (ktoe)
1990 0% 24% 50% 8% 14% 2% 2% 0% 0% 3702
1991 0% 24% 49% 8% 15% 2% 2% 0% 0% 3826
1992 0% 24% 48% 8% 15% 2% 2% 0% 0% 3911
1993 0% 24% 47% 9% 15% 1% 2% 1% 0% 3996
1994 0% 27% 43% 9% 16% 2% 2% 1% 0% 3854
1995 0% 22% 46% 9% 18% 2% 1% 1% 0% 4202
1996 0% 21% 46% 8% 21% 2% 1% 1% 0% 4564
1997 0% 14% 55% 6% 20% 2% 1% 2% 0% 4308
1998 0% 17% 49% 6% 22% 2% 2% 3% 0% 3775
1999 0% 19% 45% 6% 22% 1% 1% 4% 1% 3518
2000 0% 19% 43% 5% 25% 2% 2% 4% 1% 3325
2001 0% 19% 44% 5% 25% 2% 2% 3% 1% 3565
2002 0% 18% 41% 5% 26% 2% 1% 4% 3% 3402
2003 0% 19% 40% 5% 26% 2% 1% 5% 2% 3518
2004 1% 19% 39% 4% 27% 2% 1% 5% 2% 3449
2005 1% 18% 42% 4% 27% 2% 1% 3% 2% 3326
2006 1% 21% 42% 3% 25% 2% 1% 2% 2% 3136
2007 1% 21% 42% 2% 25% 2% 1% 3% 2% 3078
2008 1% 21% 46% 2% 22% 2% 1% 3% 2% 3097
2009 1% 24% 41% 2% 24% 2% 1% 3% 2% 2904
2010 1% 23% 41% 1% 24% 2% 3% 3% 2% 3113
2011 1% 19% 43% 1% 24% 3% 3% 4% 3% 2945
2012 1% 18% 43% 1% 25% 3% 3% 4% 3% 3061
2013 1% 17% 43% 0% 25% 3% 3% 6% 3% 2995
2014 1% 17% 44% 0% 25% 2% 3% 7% 3% 2919
Source: Eurostat (2016).

10 COAL TRANSITION IN THE CZECH REPUBLIC
C. Non - energy coal useThe use of coal in the Czech Republic for non-energy purposes, such as coke in metallurgy or in human or veterinary medicine, oscillates around 300 000 tones of oil equivalent, although there was a large drop in 2005
and 2009 during the economic crisis (see Table 3). Brown coal is also used in paper and the production of printing products. For these purposes, coal is irreplaceable.
6The state role in the coal sector after 1990 – mining limits
Until 1993, mines were organized into big coalfields and the profits and losses were redistributed within the coalfield. After this date, the redistribution process was cancelled and non-profitable mines were closed. The state provided support for social and health ben-efits, the technical liquidation of the mines, and for landscape recovery – which is discussed in the next section in detail. The government divided state-owned coal mining companies into units of profitable and unprofitable mines on one deposit to make them ca-pable of paying part of the costs of the mining phase out.4 The current mine situation, including operating organization, is summarized in Table 4 and Table 5.In 1991 the government imposed so-called ecological territorial limits in six mining locations in the North Bohemian Brown Coal Basin. The affected area covers 591 km2 with 34 villages (including 8 cities) around the cities of Bilina, Most and Litvinov. The area includes so-called economically troubled regions, as defined in the regional development strategy of the Czech Republic for 2014 – 2020. This means above-average unemployment, low living standards, low degree of economic performance, low average income, and adverse demographic trends (Minis try of Regional Development 2013). The mineral commodity summary 2015 points reserves of about 0.9 billion tonnes be-
yond the limits represent about 18-year mining. There is currently a hot debate around the possible easing of the limitations imposed on two mines – Czecho-slovak Army (henceforth “CSA”) and Bilina – which would bring about 400 million tonnes of brown coal (see Figure 10). As noted by (Maca & Melichar 2016) without revoking the limits, only one mine (Vrsany) would remain in operation by 2038 and its reserves would diminish by around 2060. The Czech Republic currently imports brown coal to meet its demand, a situation that will not improve in future unless the limits are revoked (see Figure 11). The government has already extended the limits in 2008 and in 2015 (100 – 120 mil. t of brown coal in the period 2020 - 2055) in the Bilina mine to secure the heating industry in the Czech Republic and to preserve jobs for miners. The excavation works are likely to expand to a distance of less than 500 m from the nearest village. The limits in the CSA mine were not broken because doing so would destroy entire villages: Horni Jiretin and Cernice. In the current circumstances, mining in the CSA mine should end in 2024. The Minister of Industry and Trade – Mr. Mladek – added that the potential need for coal from the CSA mine depends on the development of nuclear energy, renewable sources and the fulfillment of the National energy conception (Odbor 10500 2015).
Table 3. Non-energy use of solid fuels in the Czech Republic 1990 - 2015
Solid fuels Final non-energy consumption (ktoe)
2002 2003 2004 2005 2006 2007 2008 2009 2010 2011 2012 2013 2014
314 338 389 299 376 339 343 242 303 279 288 321 365
Source: Eurostat (2016) (Consumption from 1990 to 2001 was 0).
4 Source: http://slon.diamo.cz/hpvt/2003/sekce_l/L06.htm.

COAL TRANSITION IN THE CZECH REPUBLIC 11
Before this decision the ministry of industry and trade prepared studies of social and economic impacts for individual variants. For the approved variant it predicts that the biggest loss of primary mining jobs (720) will take place up to 2019, and then decrease by a further 107 jobs up to 2049. At the same time, many of the 3,275 retired positions will have to be replaced by new employees. Together 4,129 employees will be dismissed
or retired between the years 2015 and 2049. A similar scenario affects the follow-up jobs. The study predicts an overall drop in employees of between 1,108 and 2,217 until 2019, and then between 1,989 and 6,629 to the year 2049, based on the multiplier (0.75 or 1.5) used. According to the estimate of labour market flexibility over the whole period (35 years) potentially only 603 persons will become long term unemployed (PWC 2015).
Table 4. Brown coal and lignite mining territories with status to November 15, 2016
Name Organization Open date District
Exploration
Lom II Palivový kombinát Ústí, státní podnik 24.2.1970 Most
Mined deposits
Alberov Sokolovská uhelná, právní nástupce, a.s. 27.7.1962 Sokolov
Bílina Severoceské doly a.s. 10.11.1976 Teplice
Dolní Jiretín Severní energetická a.s. 24.12.1969 Most
Duchcov I Humatex, a.s. 11.5.2002 Teplice
Ervenice Severní energetická a.s. 29.11.1985 Most
Holešice Vršanská uhelná a.s. 18.12.1985 Most
Královské Porící Sokolovská uhelná, právní nástupce, a.s. 27.7.1962 Sokolov
Nové Sedlo Sokolovská uhelná, právní nástupce, a.s. 14.11.1962 Sokolov
Tušimice Severoceské doly a.s. 25.10.1977 Chomutov
Vršany Vršanská uhelná a.s. 13.2.1976 Most
Zabrušany Humatex, a.s. 11.5.2002 Teplice
Closing deposits
Hodonín UVR Mníšek pod Brdy a.s. 12.6.1981 Hodonín
Most Palivový kombinát Ústí, státní podnik 21.3.1986 Most
Stopped mining, security regime
Slatinice Vršanská uhelná a.s. 17.12.1979 Most
Reserve deposit
Komorany u Mostu Severní energetická a.s. 29.6.1970 Most
Closed deposits, 0 reserves
Bukovany Sokolovská uhelná, právní nástupce, a.s. 22.1.1962 Sokolov
Duchcov Severoceské doly a.s. 25.5.1992 Teplice
Habartov Sokolovská uhelná, právní nástupce, a.s. 9.11.1989 Sokolov
Hrdlovka Severoceské doly a.s. 1.6.1964 Teplice
Svatava Sokolovská uhelná, právní nástupce, a.s. 14.10.1964 Sokolov
Liquidation terminated, but unresolved conflicts
Dolní Litvínov Severní energetická a.s. 21.2.1970 Most
Kopisty I Severní energetická a.s. 27.3.1986 Most
Kopisty II Severní energetická a.s. 5.4.1986 Most
Lomnice Sokolovská uhelná, právní nástupce, a.s. 16.5.1966 Sokolov
Okorín Vršanská uhelná a.s. 3.12.1969 Chomutov
Souš II Severní energetická a.s. 22.12.1969 Most
Souš III Severní energetická a.s. 25.8.1970 Most
Záluží u Litvínova Severní energetická a.s. 21.2.1970 Most
Source: The State Mining Administration n.d.

12 COAL TRANSITION IN THE CZECH REPUBLIC
O.M.
Source: Mineral Commodity summary of the Czech Republic 2015, © VÚHU Most 2003 (modified).
Current mining extent
Territorial limits for mining established by Government Resolution no. 44/1991
Exploitation plans after breaking through limits for mining, incl. reserve localities
Opencast mine
Figure 10. Ecological territorial limits in the North Bohemian Basin
Lom CSA(CSA O.M.)
Cernice
HorniJiretin
Mezibori
Lom
Louka
MariánskéRadcice
Branani
Havran
Reserves : 72 Mt
163 Mt Reserve O.M. locality Bylany
92.3 Mttill circa 2040
Lifetime : 2018
Lom Bílina(Bílina O.M.)
Reserves : 249 Mt
Pokrok Dumptill circa 2010
Phase II264 Mt till circa 2060
Phase II264 Mt till circa 2060
Phase III a IV486 Mt till circa 2120
Phase III a IV486 Mt till circa 2120
Lifetime : 2030
CHEZA
DUK
MostBílina
Osek
Litvínov
Lom J. Sverma(J. Sverma O.M.)
Lom Vrs any(Vrs any O.M.)
OM Dumptill 2015
NW
Source: Maca and Melichar 2016.
within mining limits
revoked limits at Bilina
revoked limits at Bilina + partially at CSA
revoked limits at Bilina and CSA
Mt
0
5
10
15
20
25
30
35
40
45
50
2050
2049
2048
2047
2046
2045
2044
2043
2042
2041
2040
2039
2038
2037
2036
2035
2034
2033
2032
2031
2030
2029
2028
2027
2026
2025
2024
2023
2022
2021
2020
2019
2018
2017
2016
2015
Full demand
Domestic supply:
Figure 11. Domestic brown coal supply and demand for heat and electricity production under the revised mining limits

COAL TRANSITION IN THE CZECH REPUBLIC 13
7Measures to ease transition
Table 6 summarizes the measures the Czech government have implemented to ease the transition away from coal production and consumption. It is a collection of individ-ual measures that do not create an official state strategy.As the transition from coal to other energy sources has been a gradual process since 1990, we have to distinguish two types of state support. First, there is support that deals with debts from the past regime, that embrac-es environmental remediation, and the costs of closing mines as well as the provision of benefits for miners that became unemployed in the 1990s. The second type of support is financial compensation to support more ef-fective coal technologies and renewable energy sources and to help regions affected by mining decline. These regions are often economically troubled and in socially excluded localities and as such they are more support-ed by regional programmes in many areas (infrastruc-ture, environment, entrepreneurship, unemployment, research & development, etc.) (Ministry of Regional Development 2013).
Table 7 quantifies the support directly connected with the phasing out of mining activities and the restoration of land damaged by mining. Table A-7 then quantifies the total support provided to the fossil fuel sector and Table A-8 the support for renewable energy sources.During the period of the greatest number of redun-dancies, some miners were reallocated to mines that were s till working, instead of retired miners or to other companies in the same sector, while the older generation of miners took early retirement and the others were retrained.Last year the biggest hard coal company OKD employ-ing about 9,500 people declared insolvency due to high indebtedness and decreasing world prices of hard coal. The Czech government reacted by providing an exceptional state loan of CZK 700 million (from state company PRISCO) to continue mining and facilitate a gradual phasing out (10510 2016). Furthermore, the state carried out many development activities in the region including the establishment of a new industrial
Table 5. Hard coal mining territories with status to November 15, 2016
Name Organization Open date District
Exploration
Staríc OKD, a.s. 18.12.1962 Frýdek-Místek
Trojanovice OKD, a.s. 30.6.1989 Nový Jicín
Mined deposits
Darkov OKD, a.s. 11.3.1977 Karviná
Dolní Suchá OKD, a.s. 6.4.1961 Karviná
Doubrava u Orlové OKD, a.s. 4.10.1961 Karviná
Karviná - Doly I OKD, a.s. 1.10.1979 Karviná
Karviná Doly II OKD, a.s. 12.2.1964 Karviná
Lazy OKD, a.s. 28.4.1961 Karviná
Louky OKD, a.s. 15.10.1984 Karviná
Petrvald I OKD, a.s. 10.4.1987 Karviná
Rynholec Ceské lupkové závody, a.s. 16.3.1965 Rakovník
Stonava OKD, a.s. 12.12.1960 Karviná
Closing deposits
Žaclér GEMEC - UNION a.s. 12.7.1976 Trutnov
Closed deposits, 0 reserves
Poruba DIAMO, státní podnik odštepný závod ODRA 29.6.1963 Karviná
Vítkovice DIAMO, státní podnik odštepný závod ODRA 17.2.1983 Ostrava
Source: The State Mining Administration n.d.

14 COAL TRANSITION IN THE CZECH REPUBLIC
zone Nad Barborou and provided support for the man-ufacturing company Hyundai Mobis, along with social benefits for released miners (Odbor 10500 2016). The situation of the release of OKD miners eased also a new processing line of extractive waste launched in the summer of 2016 (10500 2016b). Initially, OKD has planned to close the Paskov mine, with approximately 1,800 employees, in May 2017. Some of the employees have already left and found new positions in many other sectors (transport, IT, engineering, etc.). It was not only the Ministry of Labour and Social Affairs that helped to find new positions for the miners, private
companies (such as LMC) were also supportive, in-cluding through the provision of training courses. The Ministry, in cooperation with OKD, the Employment Department and The Confederation of Industry and Traffic, created supportive web pages, called A New Shift, and also offered business advice at consultation centers in the mines (Nová šichta, 2014).
Phasing-out of mining activities
The Czech government committed to the state financ-ing of the technical work related to closing mines and
Table 6. Transition strategies — Typology (the Czech Republic)
Compensation or grandfathering (backward-looking)
Structural adjustment assistance (forward-looking, narrow)
Adaptive support (forward-looking, broad)
Consumers/ households
Energy tax repayments if mineral oil used for heatingExemption of real estate tax for 5 years when switching to RES.
Reduced VAT on energy-efficient heating, Green Saving program (e.g. the replacement of coal boilers with gas boilers or thermal insulation).
Advice on energy efficiency for example via program Green for savings.
Workers
Social allowances of CZK 5 280 for miners in the first 3 – 30 months following redundancy depending on the length of employment; early retirement; Health and social benefits for miners released before 1993 (including compensations for lost earnings).
Retraining programmes for ex-miners; help with finding new job; regional transport allowances of CZK 1000 – 3 500
--
CommunitiesCompensation of Municipalities Affected by Mining Funded from Royalties on Mining Leases
Support of manufacturing companies; new industrial zones
Support under the regional strategies for economically troubled regions.
Corporations
Financial resources for elimination of environmental damages, reclamation of areas affected by mining and social costs of phasing out mining such as health benefits for miners.
No barriers in the market economy for business adaptation (e.g. new technology and sources like gas can replace coal)
Guaranteed Feed-in-Tariffs and Premiums for electricity of RES; Biofuel obligation
Source: Table content by the author(s). Table concept by Fergus Green.
Table 7. Transfer of risk to governance, Czech Republic, in million CZK (only those quantified)
2006 2007 2008 2009 2010 2011
Financing of the technical work related to closing mines and rectifying the consequences of past mining activity 1,840 1,746 1,719 1,563 1,564 1,564
Elimination of past environmental damages by coal mines 2,687
Compensation of municipalities affected by mining 16 16 15 15 15 15
Programmes Financing Remediation of Ecological Damage attributable to coal mining, petroleum, and gas extraction x x x x x 1,800
Remediation of Environmental Damages Caused by Mining 153 165 169 161 161 161
Note: x - support spent only in the year 2011 is reported; see text above for the cumulative amount.

COAL TRANSITION IN THE CZECH REPUBLIC 15
rectifying the consequences of past mining activity, and covering the social costs of the phasing out of mining activity, such as covering health benefits for miners. Overall, since the initiation of the mining phase out in 1992, a total of CZK 72 billion (≈€3 billion) was released from the state budget up to 2009. CZK 43 billion (€1.7 billion) was spent on technical work related to the phase out of mining and on restoring the consequences of mining operations, and a remain-ing CZK 29 billion (€1.2 billion) was spent on social health benefits for miners (MoE 2010). About 43% of support was allocated to coal mining; CZK 16.6 billion to technical work and CZK 14.5 billion to social health expenses. As reported by The Ministry of the Environ-ment, the total amount of money reserved is up to €1,500 million. Every year during 2005-2011, between 1,563 and 1.890 million CZK was spent (that is €59 to €69 million). During the period 1992-2009, total support for uranium amounted to CZK 13 billion, which was spent on technical work, while CZK 4.6 billion was spent on social health.
Rehabilitation of environmentally damaged land
In 2006, the Ministry of Finance of the Czech Republic decided to use revenues from privatisation for financing the rehabilitation of land that had been environmentally damaged due to mining activity that had taken place before privatisation of the Czech mines. By the end of 2009, three coal mining entities had received financial resources from the National Property Fund of the Czech Republic in order to address environmental damage. By December 2009, about 2,687 million CZK (€102 mil-lion) were allocated from the National Property Fund of the Czech Republic to coal mines in order to deal with past environmental damages, with an additional CZK 25.5 billion (€1.0 billion) available for next drawing. An additional CZK 8.0 billion (€3.2 billion) was guaran-teed to DIAMO, a uranium mining company, which had claimed CZK 3.1 billion by December 2009.
Programmes financing the remediation of ecological damage
Only since 1994 have mining companies in the Czech Republic been obliged to generate financial reserves for the remediation and reclamation of areas affected
by mining. Therefore, the state has taken on respon-sibility for the financial remediation of ecological damage that arose prior to 1994, which has particu-larly involved: support for coal mining companies in the Ústí nad Labem, Karlovy Vary and Kladno Region; ecological revitalisation following termination of coal mining in the Moravian-Silesian Region; and restoration work in areas affected by crude oil and natural gas extraction in the South Moravian Region. The total spent on the ecological remediation of land affected by coal mining was estimated to be around 36 billion CZK (€1,361 million), wh ile around 712 million CZK (€27 million) and 465 million CZK (€18 million) has been spent on land affected by petroleum and gas extraction, respectively. About 1,800 million CZK (€73 million) was allocated in the year 2011. As of December 2009, the funds spent amounted to CZK 4.4 billion (€0.18 billion), while CZK 5.7 billion (€0.23 billion) were allocated to progress projects, and CZK 4.1 billion (€0.16 billion) is the remaining financial amount required to secure additional money for the projects in progress.
Remediation of environmental damage caused by mining
Environmental damage caused by mining is mitigated in the Czech Republic through clean-up measures that are funded by revenues from royalties on coal extrac-tion. Mining companies are obliged to pay royalties on the minerals they extract; however, these levies are capped to a maximum of 10% of the market price of the extracted minerals. Before 1999, the Regional Mining Authority transferred the collected revenue equally between the state budget and the budget of those municipalities on which the mining leases were located. Half of the revenues transferred to the state budget (i.e. 25% of the total collected royalties on extracted minerals) are earmarked for the remedia-tion of environmental damage caused by the mining of reserved deposits. Since 2000, the proportion of revenues transferred to the state budget has been reduced at 25 %, and all of which must be spent on the remediation of environmental damage caused by mining activity. Remediation of environmental damage caused by mining amounted annually to between 153 and 170 million CZK (about € 5-7 million) during 2005-2011.

16 COAL TRANSITION IN THE CZECH REPUBLIC
8Future outlook
It is possible that the new supercritical power plant Ledvice and two refurbished power plants Tusimice II (4 x 200 MW) and Prunerov II (3 x 250 MW) were the last major coal units built between 2009-2016 in the Czech Republic (Ralfo 2017). State energy policy plans to further lower the share of coal in energy and heat production for environmental reasons, but it still sees coal as strategic from security and economic perspec-tives. The use of coal should be however as efficient and ecological as possible (Ministry of Industry and Trade 2015). The substitute for coal should be nuclear energy. The State energy conception 2015 plans for the construction of additional nuclear capacity, aim-ing for a production of around 20 TWh till 2035 and lifespan extension of the second nuclear power plant
Ducovany (up to 60 years). The main advantages of nuclear power are low fuel prices and the possibility of its use as a strategic reserve.As mentioned in Section 5, the replacement of coal in heating is a more difficult task than for electricity generation. Furthermore, when moving away from coal one has to take into account the economical aspect: coal is a very cheap energy source. The State energy conception 2015 plans for the use of brown coal in heating and for highly effective combined generation. It sees potential in the energetic use of waste and therefore penalties for landfill waste.
9Lessons learned
Finding the solution of past environmental damages caused by mining last a long time period with unclear opinion of the government on state participation. Some government resolutions have not been respected (sup-porting the switching process from coal as an energy source) (Sochor n.d.). This has led to the necessary abandonment of brown coal mining limitations at Bili-na mine to secure sources for heating and to avoid the rapid dismissal of employees. There is also a question regarding whether the abandonment of mining limits was necessary or appropriate when taking into account the emissions targets that the Czech Republic has com-mitted to fulfill up to 2040.The privatization of mines was not ideal and as a consequence some new mining companies were plun-dered and many closed mines deals till today with unresolved property conflicts. A glaring example of this is the hard coal company OKD, which declared insolvency in 2016 – the Czech Republic call for CZK 1.9 billion claim that should cover the mine liquidation costs in case OKD will not be able to finance the liq-uidation process (10500 2016a). On the other hand, the liquidation procedure via state company DIAMO
seems to have been quite successful… that overtook the responsibilities arose before 1993.Although coal represents a strategic resource and an important energy source from the perspective of em-ployment, it is an issue of regional character since em-ployees in the mining sector represent only 1% of all employees. Their total number between 1993 and 2015 decreased by approximately 86,800 people. More than double this number left agriculture during the same time period, while almost all others sectors experienced a rise in employee numbers, especially in the wholesale and retail market and in scientific and technical activities (Czech statistical office 2016b). From this perspective the transformation of the economy seems to have been successful; while in terms of the transition from coal, one has to focus on the region.Regional support s tarted after the creation of the administrative regions in 2001, followed by even more effective support after joining the European Union in 2004. This delay in support had an impact on the social isolation of regions, which became economically troubled areas (above-average unemployment, low living standards, low degree of economic performance,

COAL TRANSITION IN THE CZECH REPUBLIC 17
low average income, and adverse demographic trends) as defined by the Ministry of Regional Development 2013. The unemployment rate in the population of Karvina in the west of the Czech Republic, one of the most impacted districts, once reached 11.5%, which is almost double that of the average rate in the Re-public, but has decreased in the last decade by 1.6 percentage points (The Ministry of Labour and Social Affairs 2016). Furthermore, since 1971 Karvina has experienced negative migration rates (except during the early 1990s) reaching a low in 2010 of migration
drop of inhabitants by 2 501. Since 2009 the district left around 1700 net migrants (Czech statistical office 2016a).The Czech experience teaches us that the transfor-mation process takes a long time, and is far from completion in the Czech Republic. Very thorough preparation is vital, along with the provision of con-siderable amounts of support in many forms to the affected regions.
10References
z 10500, 2016a. Ministr průmyslu a obchodu Jan Mládek přihlásil pohledávku státu vůči OKD, Available at: http://www.mpo.cz/cz/rozcestnik/pro-media/tiskove-zpravy/ministr-prumyslu-a-obchodu-jan-mladek-prihlasil-pohledavku-statu-vuci-okd--177594/.
z 10500, 2016b. Nová linka na zpracování těžebního odpadu odstraní ekologickou zátěž a zaměstná horníky z OKD, Available at: http://www.mpo.cz/cz/rozcestnik/pro-media/tiskove-zpravy/nova-linka-na-zpracovani-tezebniho-odpadu-odstrani-ekologickou-zatez-a-zamestna-horniky-z-okd--178302/.
z 10510, 2016. Vláda schválila půjčku pro OKD až do výše 700 milionů korun, Available at: http://www.mpo.cz/cz/rozcestnik/pro-media/tiskove-zpravy/vlada-schvalila-pujcku-pro-okd-az-do-vyse-700-milionu-korun--178387/.
z Czech News Agency, 2016. Historie těžby uhlí v severočeské pánvi sahá do 15. století. iuhli.cz. Available at: http://iuhli.cz/historie-tezby-uhli-v-severoceske-panvi-saha-do-15-stoleti/.
z Czech statistical office, 2016a. Database of demografic factors. Available at: https://www.czso.cz/csu/czso/databaze-demografickych-udaju-za-obce-cr.
z Czech statistical office, 2016b. Employed according to NACE. Available at: https://vdb.czso.cz/vdbvo2/faces/cs/index.jsf?page=vystup-objekt&pvo=ZAM03&filtr=G~F_M~F_Z~F_R~T_P~_S~_null_null_&katalog=30853&z=T&f=TABULKA&c=v265~8__RP2004&&u=v228__VUZEMI__97__19&h=v346&h=v299&h=v323&h=v322&h=v321&h=v320&h=v319&h=v318&h=v317&h=v316&h=.
z Maca, V. & Melichar, J., 2016. The health costs of revised coal mining limits in Northern Bohemia. Energies, 9(2), pp.1–20.
z Ministry of Industry and Trade, 2015. State Energy Policy of the Czech Republic, Prague.
z Ministry of Regional Development, 2013. Strategie regionálního rozvoje č r 2014–2020,
z Nová šichta, 2014. Nová Šichta (New shift). Available at: http://www.novasichta.cz/cs.
z Odbor 10500, 2016. Ministři Mládek a Marksová připravili soubor opatření ke snížení sociálních dopadů útlumu těžby
černého uhlí na zaměstnance společnosti OKD, Available at: http://www.mpo.cz/cz/rozcestnik/pro-media/tiskove-zpravy/ministri-mladek-a-marksova-pripravili-soubor-opatreni-ke-snizeni-socialnich-dopadu-utlumu-tezby-cerneho-uhli-na-zamestnance-spolecnosti-okd--170825/.
z Odbor 10500, 2015. Vláda rozhodla o zrušení limitů těžby na dole Bílina, Available at: http://www.mpo.cz/cz/rozcestnik/pro-media/tiskove-zpravy/vlada-rozhodla-o-zruseni-limitu-tezby-na-dole-bilina--165352/.
z OTE, 2015. Year Report on the Electricity and Gas Markets in the Czech Republic for 2015, Available at: www.ote-cr.cz.
z PWC, 2015. Posouzení sociální ch dopadů u jednotlivých obcí a dotčeného regionu z pohledu zvažovaných variant prolomení limitu těžby uhlí na území severních Čech,
z Ralfo, N.E., 2017. Energy Policies of IEA Countries Czech Republic 2016 Review,
z Sochor, Z., Útlum hornictví v procesu dokončení jeho restrukturalizace, Available at: http://slon.diamo.cz/hpvt/2003/sekce_l/L06.htm.
z Starý, J. et al., 2009. Mineral Commodity Summaries of the Czech Republic,
z Starý, J. et al., 2008a. Mineral Commodity Summaries of the Czech Republic 2007. Czech Geological Survey, 1(October), pp.164–165.
z Starý, J. et al., 2008b. Mineral Commodity Summaries of the Czech Republic 2008.
z Starý, J. et al., 2010. Mineral Commodity Summaries of the Czech Republic 2010.
z Starý, J. et al., 2012. Mineral Commodity Summaries of the Czech Republic 2012.
z Starý, J. et al., 2015. Mineral Commodity Summaries of the Czech Republic 2015.
z The Ministry of Labour and Social Affairs, 2016. Unemployment statistics. Available at: http://portal.mpsv.cz/sz/stat.
z The State Mining Administration, The State Mining Administration. Available at: http://cbusbs.cz.

18 COAL TRANSITION IN THE CZECH REPUBLIC
11Annex
Table A-1. Key economic indicators of the Czech Republic 1990 – 2015
Energy intensity (gross inland consumption,
kg oil equivalent, per €1 000 of GDP)2
Energy dependency (net imports /
gross inland energy consumption)2
GDP per capita, real
(2010 €)2
Mining & quirrying (% GVA)1
Unemployment (% labour force)2
Mining & quirrying (% all FTE employees)1
1990 15.4 3.71% 2.93%
1991 15.9 3.32% 2.77%
1992 16.0 3.25% 2.21%
1993 16.1 2.73% 4.3% 1.84%
1994 18.7 2.23% 4.3% 1.79%
1995 398.3 20.6 10 100 2.29% 4.0% 1.72%
1996 393.1 24.2 10 600 2.08% 3.9% 1.67%
1997 398.1 24.1 10 500 1.87% 4.8% 1.46%
1998 386.6 25.1 10 500 1.61% 6.5% 1.34%
1999 355.6 25.1 10 700 1.36% 8.7% 1.23%
2000 359.3 22.9 11 100 1.25% 8.8% 1.15%
2001 357.3 25.1 11 500 1.26% 8.1% 1.11%
2002 354.8 26.4 11 700 1.20% 7.3% 1.02%
2003 358.6 25.1 12 200 1.07% 7.8% 0.95%
2004 350.3 25.5 12 800 1.21% 8.3% 0.93%
2005 325.4 28.0 13 500 1.25% 7.9% 0.89%
2006 312.5 27.8 14 400 1.31% 7.1% 0.89%
2007 296.2 25.1 15 200 1.29% 5.3% 0.82%
2008 281.9 28.0 15 400 1.40% 4.4% 0.85%
2009 277.8 27.2 14 600 1.23% 6.7% 0.75%
2010 285.7 25.6 14 900 1.26% 7.3% 0.71%
2011 269.8 28.0 15 200 1.32% 6.7% 0.69%
2012 270.5 25.3 15 100 1.18% 7.0% 0.69%
2013 267.9 27.9 15 000 0.87% 7.0% 0.66%
2014 256.3 30.4 15 400 1.01% 6.1% 0.69%
2015 16 000 0.91% 5.1% 0.66%
Source: 1 Czech Statistical Office (2016), 2 Eurostat (2016).
COAL TRANSITION IN THE CZECH REPUBLIC 19
Table A-2. Key economic indicators of Czech Mining 1993 - 2015
Coal and lignite
Output CZK million (real (2010))
Gross value added CZK million (real (2010))
Net value added CZK million (real (2010))
Mining & Quiring (Gross Value added rate by Ownership)
Public National private Foreign controlled
1993 87411 68310 63187 65.2% 34.6% 0.2%
1994 81633 64736 59530 67.4% 32.1% 0.5%
1995 99908 79290 73381 66.0% 33.1% 0.9%
1996 94874 70141 63657 57.3% 42.0% 0.7%
1997 90364 62837 56251 20.6% 78.6% 0.8%
1998 84338 55824 49128 19.5% 79.4% 1.1%
1999 72715 47600 40983 30.1% 67.9% 2.0%
2000 75256 53416 46725 36.9% 60.2% 2.9%
2001 77878 52275 45232 33.9% 48.3% 17.8%
2002 78201 50699 43612 30.3% 51.0% 18.7%
2003 75295 45993 38977 31.8% 50.1% 18.1%
2004 72980 49066 42219 25.6% 58.5% 15.9%
2005 65308 39317 32594 15.4% 78.4% 6.2%
2006 72460 45560 38707 14.2% 65.0% 20.8%
2007 75459 44204 37610 13.8% 20.5% 65.7%
2008 74708 38102 31446 14.0% 20.8% 65.2%
2009 62129 33279 26402 18.5% 55.9% 25.6%
2010 63393 34126 26728 15.7% 61.6% 22.7%
2011 60579 31979 24788 16.1% 24.3% 59.6%
2012 59668 30222 23367 17.9% 63.0% 19.1%
2013 51810 21662 14720 25.3% 40.3% 34.4%
2014 50446 30523 23275 20.5% 31.2% 48.3%
2015 45784 29020 21802
Source: Czech Statistical Office (2016).
Table A-3. Prices of Hard and Brown coal at domestic market 2007– 2014
Coal type* 2007 2008 2009 2010 2011 2012 2013 2014
Hard Coal
Coking coal EUR/t 86 137 87 138 177 125 98 85
Steam coal EUR/t 48 69 72 60 67 74 56 54
Brown coal - Severoceské doly
Cube Coal II; 17.6 MJ/kg; CZK/t 1707-2045 1707-2045 1847-2143 1868-2143 1900-2150 1930-2170 2135-2150 2165-2170
Nut Coal I; 17.6 MJ/kg; CZK/t 1619-1942 1619-1942 1748-1942 1742-1937 1730-1950 1730-1950 1800-1850 1910-1920
Nut Coal II; 17.6 MJ/kg; CZK/t 1325-1586 1325-1697 1461-1782 1461-1782 1470-1790 1490-1810 1700-1800 1870-1900
Exchange rate CZK/EUR 27.8 24.9 26.4 25.3 24.6 25.1 26 27.5
Source: Yearbook Mineral Commodity summary 2012 and 2015; * Prices given without taxes on solid fuels; Regular grain size (mm): cube = 40 - 100, nut I = 20 - 40, nut II = 10 - 20.
20 COAL TRANSITION IN THE CZECH REPUBLIC
Table A-4. Coal reserves in the Czech Republic
Mine Extractable reserves (Mt)
Production (Mt)
Mining Number of mines
Calorific value (MJ/t)
Hard coal
OKD, a.s. 56.5 8.3 Underground Four 19-36
Brown coal
Severoceské Doly (SD) 346.4 21.7 Opencast Two 11-13
Severní Energetická (SEAS) 27.7 3.8 Opencast One 10-18
Vršanská Uhelná (VUAS) 265.9 6.5 Opencast One 10-18
Sokolovská Uhelná (SUAS) 131.3 6.4 Opencast Two 12-13
Dul Kohinoor a.s. 0.5 0.5 Underground One 15
Note: MJ/t = megajoules per tonne. Source: MIT, IDR country submission.
Table A-5. Electricity generation by fuel 1990 - 2015
Hydro Wind Solar Other renewables
Bituminous coal
Lignite/ Brown coal
Nuclear Gas Oil Total gross production (ktoe)
1990 2% 0% 0% 0% 9% 66% 20% 2% 1% 5379
1991 2% 0% 0% 0% 9% 66% 20% 2% 1% 5205
1992 3% 0% 0% 0% 9% 65% 21% 2% 1% 5098
1993 3% 0% 0% 0% 9% 64% 21% 1% 1% 5063
1994 3% 0% 0% 1% 9% 63% 22% 2% 1% 5048
1995 4% 0% 0% 1% 11% 61% 20% 2% 1% 5232
1996 4% 0% 0% 0% 11% 59% 20% 4% 1% 5525
1997 3% 0% 0% 1% 7% 64% 19% 5% 1% 5554
1998 3% 0% 0% 1% 7% 63% 20% 5% 1% 5599
1999 3% 0% 0% 1% 7% 62% 21% 6% 1% 5563
2000 3% 0% 0% 1% 8% 64% 18% 5% 1% 6317
2001 3% 0% 0% 1% 8% 63% 20% 5% 1% 6419
2002 4% 0% 0% 1% 7% 58% 25% 5% 1% 6565
2003 2% 0% 0% 1% 7% 54% 31% 5% 0% 7156
2004 3% 0% 0% 1% 7% 53% 31% 5% 0% 7251
2005 4% 0% 0% 1% 7% 53% 30% 5% 0% 7100
2006 4% 0% 0% 1% 7% 52% 31% 5% 0% 7254
2007 3% 0% 0% 1% 8% 53% 30% 5% 0% 7584
2008 3% 0% 0% 2% 7% 51% 32% 5% 0% 7181
2009 4% 0% 0% 2% 7% 49% 33% 5% 0% 7072
2010 4% 0% 1% 3% 7% 48% 33% 5% 0% 7387
2011 3% 0% 2% 3% 7% 47% 32% 5% 0% 7529
2012 3% 0% 2% 4% 6% 45% 35% 4% 0% 7530
2013 4% 1% 2% 5% 6% 42% 35% 5% 0% 7486
2014 3% 1% 2% 5% 6% 42% 35% 5% 0% 7397
Source: Eurostat (2016).

COAL TRANSITION IN THE CZECH REPUBLIC 21
Table A-6. Maximum electrical capacity 1990 - 2015
Hydro Wind Solar Steam gas, coal, oil ...)
Nuclear Mixed plants
Combined Cycle
Biogases Municipal waste
Electrical capacity (MW)
1990 9% 0% 0% 79% 12% 0% 0% 0% 0% 15 279
1991 9% 0% 0% 79% 12% 0% 0% 0% 0% 14 965
1992 10% 0% 0% 78% 12% 0% 0% 0% 0% 14 456
1993 13% 0% 0% 75% 12% 0% 0% 0% 0% 14 718
1994 13% 0% 0% 74% 12% 0% 0% 0% 0% 14 343
1995 13% 0% 0% 74% 12% 0% 0% 0% 0% 14 294
1996 17% 0% 0% 69% 11% 3% 0% 0% 0% 16 119
1997 17% 0% 0% 69% 11% 3% 0% 0% 0% 16 248
1998 17% 0% 0% 69% 11% 3% 0% 0% 0% 16 038
1999 17% 0% 0% 69% 11% 3% 0% 0% 0% 16 362
2000 17% 0% 0% 68% 11% 3% 1% 0% 0% 16 471
2001 17% 0% 0% 66% 11% 3% 4% 0% 0% 16 591
2002 16% 0% 0% 61% 16% 3% 4% 0% 0% 17 458
2003 15% 0% 0% 58% 20% 2% 4% 0% 0% 18 585
2004 15% 0% 0% 57% 20% 2% 4% 0% 1% 18 712
2005 15% 0% 0% 57% 20% 2% 4% 0% 1% 18 695
2006 15% 0% 0% 57% 20% 2% 4% 0% 1% 18 823
2007 15% 1% 0% 57% 20% 2% 4% 0% 1% 18 934
2008 15% 1% 0% 56% 20% 2% 5% 0% 1% 19 006
2009 15% 1% 2% 54% 19% 2% 5% 0% 1% 19 827
2010 14% 1% 8% 50% 18% 2% 5% 1% 1% 21 409
2011 13% 1% 9% 49% 18% 2% 5% 1% 2% 21 855
2012 13% 1% 9% 49% 18% 2% 5% 1% 2% 22 270
2013 13% 1% 9% 47% 19% 2% 6% 2% 2% 22 916
2014 13% 1% 9% 47% 19% 2% 6% 2% 2% 23 077
Source: Eurostat (2016).

22 COAL TRANSITION IN THE CZECH REPUBLIC
Table A-8. Direct and indirect support of renewables
Support Short description Years Amount
Reduced excise tax for Biofuels
Set for diesel blended with fatty acid methyl- or ethyl-esters (<30%, sometimes denoted as B30)
2004 -In 2011 amounted to CZK 1.1 billion (€45 million).
Direct transfers RES
A guaranteed feed-in tariff or a green bonus (feed-in-premium) paid on top of the regular electricity price achieved in the market paid mostly by consumers.
2001-2012 2013
€5 billion until 2012 (as-sumed to be increasing by almost €2 billion each year)
Green Savings Program
Subsidize energy savings in heating through thermal insulation, construction of new houses to the passive energy standard, and switch to renewable energy sources for space and water heating, including combinations of these mea-sures.
2009 - 2012
Around € 155 million for replacement of fossil fuel heating and solar panels installation .
Exemptions from energy tax on electricity
Tax on natural gas and tax on solid fuels since 2008 includes exemptions for renewable electricity, to electricity used for passenger and freight transport by rail, tramway and trolleybuses, for metallurgy, and for electrolyses.
2008 - n.a.
Biofuel ObligationThe minimum volumes of biofuels to be put on the market – currently 4.1% for petrol and 6% for diesel replaced in 2014 with obligation to reduce GHG emissions from motor fuels (by 2% in 2014, 4% by 2017 and 6% by 2020).
n.a.
Priority grid access
Plant operators are entitled against the grid operator a) to priority connection of a renewable energy plant to the grid (§ 4 par. 1 RES Act), b) to the expansion of the grid, if the expansion is necessary to satisfy the terms of a connection agreement (§ 45 par. 1 Energy Act), and c) to non-discriminatory use of the grid for the transmission or distribution of electricity from renewable sources.
n.a.
Exemption from real estate tax
Households that transform the heating system of their house from solid fuels to RES are not obliged to pay the real estate tax for 5 years.
n.a.
Energy efficiency upgrade
Support for home solar power and solar thermal systems. Financed from the sale of carbon allowances.
2016 € 105 million
Table A-7. Fossil fuel support
Support Short description Years Amount
Diesel or blended diesel tax refund
The partial tax refund for diesel or blended diesel (B30) used in crop production and partially forestry activities
2000-2009Between 1,477 and 1,824 million CZK (€50 to €74 million)
Energy-tax repayments Can obtain consumers of mineral oil used for heating 2008-2011Annually between €23 and €27 million
Reduced VAT on Energy-Efficient Heating
Reduced VAT on heating (and cooling) delivered through district heating -- 9 % in 2008, 10 % in 2010, 14 % in 2012 and to 15 % from 2013
2008- n.a.
Energy tax exemptions For certain uses of Natural Gas and Solid Fuels In 2011 around €100 million
Phasing-out of the Coal- Mining- Industry
In 2011 € 64 million
Elilmination of Past Environmental damages
2006-2009 € 102 million
Remediation of Ecological Damage
Remediation of Ecological Damage Caused piror to 1994 In 2011 € 73 million
Remediation of Environmentall Damage
Remediation of Environmental Damages Caused by Mining Funded from Royalties on Coal Extraction
In 2011 € 7 million
Compensation of MunicipalitiesCompensation of Municipalities Affected by Mining Funded from Royalties on Mining Leases
In 2011 € 0.6 million


COAL TRANSITIONS: RESEARCH AND DIALOGUE ON THE FUTURE OF COAL
COAL TRANSITIONS is a large-scale research project leaded by Climate Strate-gies and The Institute for Sustainable Development and International Relations (IDDRI) and funded by the KR Foundation.
The project’s main objective is to conduct research and policy dialogue on the issue of managing the transition within the coal sector in major coal using economies, as is required if climate change is to be successfully limited to 2°C.
THIS PROJECT BRINGS TOGETHER RESEARCHERS FROM AROUND THE GLOBE, INCLUDING AUSTRALIA, SOUTH AFRICA, GERMANY, POLAND, INDIA AND CHINA.
www.coaltransitions.org