AUTHOR STYLE ANALYSIS IN TEXT DOCUMENTS BASED ON …
141
AUTHOR STYLE ANALYSIS IN TEXT DOCUMENTS BASED ON CHARACTER AND WORD N-GRAMS by Magdalena Jankowska Submitted in partial fulfillment of the requirements for the degree of Doctor of Philosophy at Dalhousie University Halifax, Nova Scotia April 2017 c Copyright by Magdalena Jankowska, 2017
Transcript of AUTHOR STYLE ANALYSIS IN TEXT DOCUMENTS BASED ON …
AUTHOR STYLE ANALYSIS IN TEXT DOCUMENTS BASED ONCHARACTER AND WORD N-GRAMS
by
Magdalena Jankowska
Submitted in partial fulfillment of the requirementsfor the degree of Doctor of Philosophy
at
Dalhousie UniversityHalifax, Nova Scotia
April 2017
c© Copyright by Magdalena Jankowska, 2017
Table of Contents
List of Tables . . . . . . . . . . . . . . . . . . . . . . . . . . . . . . . . . . . v
List of Figures . . . . . . . . . . . . . . . . . . . . . . . . . . . . . . . . . . vi
Abstract . . . . . . . . . . . . . . . . . . . . . . . . . . . . . . . . . . . . . . viii
List of Abbreviations and Symbols Used . . . . . . . . . . . . . . . . . . ix
Acknowledgements . . . . . . . . . . . . . . . . . . . . . . . . . . . . . . . xi
Chapter 1 Introduction . . . . . . . . . . . . . . . . . . . . . . . . . . 1
1.1 Outline . . . . . . . . . . . . . . . . . . . . . . . . . . . . . . . . . . . 5
1.2 Contributions . . . . . . . . . . . . . . . . . . . . . . . . . . . . . . . 7
Chapter 2 Relative N-Gram Signatures — Document Visualizationat the Level of Character N-Grams . . . . . . . . . . . . 8
2.1 Introduction . . . . . . . . . . . . . . . . . . . . . . . . . . . . . . . . 8
2.2 Related Work . . . . . . . . . . . . . . . . . . . . . . . . . . . . . . . 9
2.3 Visualizing Characteristic N-Grams . . . . . . . . . . . . . . . . . . . 142.3.1 Single Relative Signature . . . . . . . . . . . . . . . . . . . . . 142.3.2 Series of Relative Signatures . . . . . . . . . . . . . . . . . . . 16
2.4 Relative N-Gram Signatures . . . . . . . . . . . . . . . . . . . . . . . 182.4.1 System Capabilities . . . . . . . . . . . . . . . . . . . . . . . . 182.4.2 Implementation . . . . . . . . . . . . . . . . . . . . . . . . . . 25
2.5 Use Cases . . . . . . . . . . . . . . . . . . . . . . . . . . . . . . . . . 252.5.1 Mark Twain’s Novels . . . . . . . . . . . . . . . . . . . . . . . 282.5.2 Authorship Attribution of Polish Literary Works . . . . . . . . 302.5.3 Subjective Modification of the Visualization . . . . . . . . . . 31
2.6 Conclusions . . . . . . . . . . . . . . . . . . . . . . . . . . . . . . . . 34
2.7 Possible Extensions . . . . . . . . . . . . . . . . . . . . . . . . . . . . 35
Chapter 3 Author Verification Using Common N-Gram Profiles ofText Documents . . . . . . . . . . . . . . . . . . . . . . . . 37
3.1 Introduction . . . . . . . . . . . . . . . . . . . . . . . . . . . . . . . . 37
ii
3.2 Related Work . . . . . . . . . . . . . . . . . . . . . . . . . . . . . . . 38
3.3 Methodology . . . . . . . . . . . . . . . . . . . . . . . . . . . . . . . 40
3.4 Evaluation on PAN 2013 Authorship Identification Data . . . . . . . 433.4.1 Datasets . . . . . . . . . . . . . . . . . . . . . . . . . . . . . . 433.4.2 Evaluation Measures . . . . . . . . . . . . . . . . . . . . . . . 453.4.3 Classifier Selection . . . . . . . . . . . . . . . . . . . . . . . . 463.4.4 Results . . . . . . . . . . . . . . . . . . . . . . . . . . . . . . . 49
3.5 Evaluation on PAN 2014 Author Identification Data . . . . . . . . . . 533.5.1 Datasets . . . . . . . . . . . . . . . . . . . . . . . . . . . . . . 533.5.2 Evaluation Measures . . . . . . . . . . . . . . . . . . . . . . . 553.5.3 Classifier Selection . . . . . . . . . . . . . . . . . . . . . . . . 553.5.4 Results . . . . . . . . . . . . . . . . . . . . . . . . . . . . . . . 57
3.6 Our Method as a Baseline for Competition Editions . . . . . . . . . . 62
3.7 Dependency of Performance on the Number of Known Documents . . 643.7.1 Data . . . . . . . . . . . . . . . . . . . . . . . . . . . . . . . . 643.7.2 Results . . . . . . . . . . . . . . . . . . . . . . . . . . . . . . . 64
3.8 Performance on Problems with a Single Known Document . . . . . . 663.8.1 Data . . . . . . . . . . . . . . . . . . . . . . . . . . . . . . . . 673.8.2 Results . . . . . . . . . . . . . . . . . . . . . . . . . . . . . . . 68
3.9 Feature Analysis . . . . . . . . . . . . . . . . . . . . . . . . . . . . . 693.9.1 Data . . . . . . . . . . . . . . . . . . . . . . . . . . . . . . . . 693.9.2 Results . . . . . . . . . . . . . . . . . . . . . . . . . . . . . . . 70
3.10 Conclusions . . . . . . . . . . . . . . . . . . . . . . . . . . . . . . . . 72
3.11 Possible Extensions . . . . . . . . . . . . . . . . . . . . . . . . . . . . 73
Chapter 4 Authorship Attribution with Topically Biased TrainingData . . . . . . . . . . . . . . . . . . . . . . . . . . . . . . . 75
4.1 Introduction . . . . . . . . . . . . . . . . . . . . . . . . . . . . . . . . 75
4.2 Related Work . . . . . . . . . . . . . . . . . . . . . . . . . . . . . . . 77
4.3 Cross-Topic Attribution with Topically Biased Training Data . . . . . 79
4.4 Features and Classifiers . . . . . . . . . . . . . . . . . . . . . . . . . . 82
4.5 Experiments on the Effect of Topically Biased Training Data . . . . . 834.5.1 Datasets . . . . . . . . . . . . . . . . . . . . . . . . . . . . . . 844.5.2 Experimental Measures . . . . . . . . . . . . . . . . . . . . . . 85
iii
4.5.3 Experimental Setting . . . . . . . . . . . . . . . . . . . . . . . 874.5.4 Results . . . . . . . . . . . . . . . . . . . . . . . . . . . . . . . 89
4.6 Feature Set Modification for Reducing Classifiers’ Bias . . . . . . . . 954.6.1 Modification of the Character N-Gram Feature Set . . . . . . 954.6.2 Evaluation . . . . . . . . . . . . . . . . . . . . . . . . . . . . . 96
4.7 Conclusions . . . . . . . . . . . . . . . . . . . . . . . . . . . . . . . . 98
4.8 Possible Extensions . . . . . . . . . . . . . . . . . . . . . . . . . . . . 99
Chapter 5 Conclusions . . . . . . . . . . . . . . . . . . . . . . . . . . . 104
Bibliography . . . . . . . . . . . . . . . . . . . . . . . . . . . . . . . . . . . 106
Appendix A Information about Dataset blogs . . . . . . . . . . . . . . 121
A.1 Dataset Properties . . . . . . . . . . . . . . . . . . . . . . . . . . . . 121
A.2 Preparation of the Dataset . . . . . . . . . . . . . . . . . . . . . . . . 121
Appendix B Information about SVM Implementation . . . . . . . . 124
Appendix C Copyright Form . . . . . . . . . . . . . . . . . . . . . . . . 127
iv
List of Tables
3.1 Characteristics of datasets used in authorship verification exper-iments. . . . . . . . . . . . . . . . . . . . . . . . . . . . . . . . 44
3.2 Parameters for four variants of single one-class classifiers andfour ensembles of one-class classifiers based on our method forauthorship verification. . . . . . . . . . . . . . . . . . . . . . . 47
3.3 Results on the test dataset of PAN 2013 Author Identificationcompetition task. . . . . . . . . . . . . . . . . . . . . . . . . . . 50
3.4 Results of our method on other English and Greek datasets. . . 52
3.5 Characteristics of PAN 2014 Authorship Identification trainingand test datasets. . . . . . . . . . . . . . . . . . . . . . . . . . 54
3.6 Results of experiments on the training corpora in the PAN 2014competition task Author Identification. . . . . . . . . . . . . . 56
3.7 Results on PAN 2014 Author Identification test dataset. . . . . 60
3.8 AUC and accuracy values on two pairs of length-normalized setsof problems with one and two known documents. . . . . . . . . 68
4.1 Statistics of datasets for experiments for authorship attributionwith topically biased training data. . . . . . . . . . . . . . . . . 84
4.2 Number of blog posts for each author and topic in the blogsdataset we compiled. . . . . . . . . . . . . . . . . . . . . . . . . 84
4.3 Macro-averaged F1 measure for five training scenarios and topicmatch ratio in misclassified documents for two biased scenarios. 90
4.4 Change in F1 measure and topic match ratio in misclassifieddocuments after applying the removal of the topic-characteristiccharacter n-grams from the features. . . . . . . . . . . . . . . . 97
A.1 Statistics of blogs dataset. . . . . . . . . . . . . . . . . . . . . 121
v
List of Figures
2.1 A relative signature of Burroughs’ Tarzan of the Apes on thebackground of the base document of Carroll’s Alice’s Adven-tures in Wonderland. . . . . . . . . . . . . . . . . . . . . . . . 17
2.2 The first 19 n-grams of the relative signature of Burroughs’Tarzan of the Apes on the background of the base documentCarroll’s Alice’s Adventures in Wonderland. . . . . . . . . . . 18
2.3 A series of relative signatures of various books, each on thebackground of the same base document: Carroll’s Alice’s Ad-ventures in Wonderland. . . . . . . . . . . . . . . . . . . . . . 19
2.4 The main view of RNG-Sig. . . . . . . . . . . . . . . . . . . . 20
2.5 Two examples of zoom levels of the set of relative signaturesdepicted in whole in Figure 2.4. . . . . . . . . . . . . . . . . . 21
2.6 Two types of context information available for users. . . . . . 22
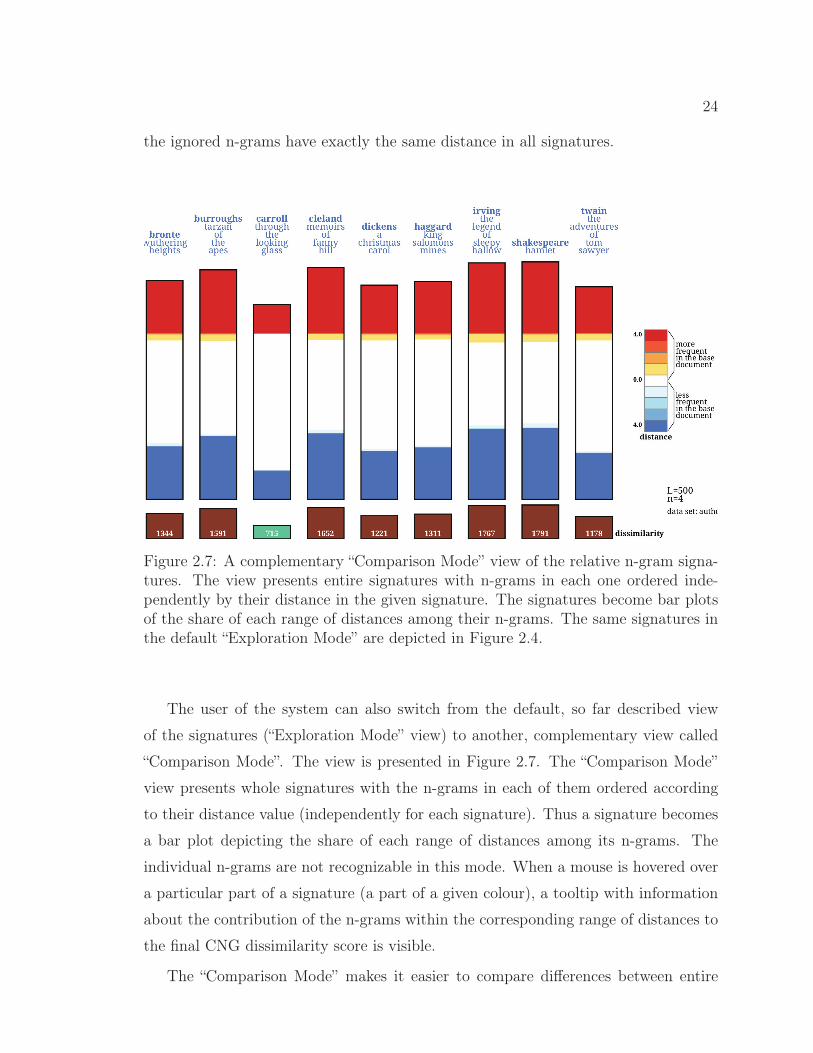
2.7 A complementary “Comparison Mode” view of the relative n-gram signatures. . . . . . . . . . . . . . . . . . . . . . . . . . . 24
2.8 Relative signatures of nine books by nine English authors onthe background of the base document of Alice’s Adventures inWonderland by L. Carroll. . . . . . . . . . . . . . . . . . . . . 28
2.9 Relative signatures of nine books by nine English authors onthe background of the base document of A Christmas Carol byC. Dickens. . . . . . . . . . . . . . . . . . . . . . . . . . . . . 29
2.10 Relative signatures of nine books by Mark Twain with the con-catenation of all these books as the base document. . . . . . . 31
2.11 Relative signatures of eight Polish books by eight authors onthe background of another book by one of these authors. . . . 32
2.12 An example of influencing a classifier by modifying the profileof the base document. . . . . . . . . . . . . . . . . . . . . . . 33
3.1 Relation between AUC measure and the number of known doc-uments in authorship verification problems. . . . . . . . . . . . 65
3.2 Analysis of performance of character and word n-grams of dif-ferent length for our method of authorship verification. . . . . 70
vi
4.1 Illustration of differences between intra-topic, cross-topic withone training topic and cross-topic with topically biased trainingdata settings of authorship attribution. . . . . . . . . . . . . . 80
4.2 Performance of classification models for authorship attributionin five topical scenarios on blogs4a dataset. . . . . . . . . . . 101
4.3 Performance of classification models for authorship attributionin five topical scenarios on nyt2a dataset. . . . . . . . . . . . 102
4.4 Performance of classification models for authorship attributionin five topical scenarios on guardian4a dataset. . . . . . . . . 103
A.1 Histogram of length of documents in the blogs dataset. . . . . 122
C.1 Page 1 of Copyright Form from IEEE Symposium on VisualAnalytics Science and Technology 2012. . . . . . . . . . . . . . 128
C.2 Page 2 of Copyright Form from IEEE Symposium on VisualAnalytics Science and Technology 2012. . . . . . . . . . . . . . 129
C.3 Page 3 of Copyright Form from IEEE Symposium on VisualAnalytics Science and Technology 2012. . . . . . . . . . . . . . 130
vii
Abstract
We describe our research on text analytics methods for detecting differences and sim-
ilarities in the style of authors of text documents. Automatic methods for analyzing
the written style of authors have applications in the domains of forensics, plagiarism
detection, security, and literary research. We present our method for the problem of
authorship verification, that is, the problem of deciding whether a certain text was
written by a specific person, given samples of their writing. Our proximity-based
one-class classifier method is evaluated on a multilingual dataset of the Author Iden-
tification competition of PAN 2013 shared tasks on digital text forensics. A version
of our method submitted to the task was the winner in the competition’s secondary
evaluation. We also propose a visual analytics tool RNG-Sig for investigation of dif-
ferences and similarities between text documents at the level of features that have
been shown to be powerful for identification of authorship, that is at the level of char-
acter n-grams. The tool provides a visual interface for performing classification for
authorship attribution — the task of deciding who among candidate authors wrote a
considered text, based on samples of writing of the candidates — using CNG classifier
proposed by Keselj et al. RNG-Sig allows for the visual interpretation of the inner
workings of the classifier and for influencing the classification process by a user. Fur-
ther, we systematically study authorship attribution in the situation when samples
of writing of different candidates have different levels of topical similarity to a text
that is attributed. We investigate how such a condition influences the behaviour of
two supervised classifiers on two sets of features commonly used for the task, and we
show that supervised models are biased towards attributing a questioned document
to a candidate that has writing samples topically more similar to the document. We
propose a method of character n-gram selection that alleviate this bias of classifiers.
viii
List of Abbreviations and Symbols Used
D Common N-Gram dissimilarity
G log-likelihood statistic
L length of a Common N-Gram profile
M average of dissimilarity ratios over known docu-ments in an author verification problem
P precision
P ′ precision for classification with missing labels
R recall
R′ recall for classification with missing labels
χ2 chi square statistic
θ a threshold for a classifier for authorship verifica-tion problems
θ1 a threshold for a classifier for authorship verifica-tion problems with only one known document
θ2+ a threshold for a classifier for authorship verifica-tion problems with at least two known documents
dx relative difference between frequencies of a givenn-gram x in two profiles
n length of an n-gram
p p-value in statistical testing of an effect against anull hypothesis: a probability of observing a con-sidered or larger effect under the null hypothesis
r dissimilarity ratio between a known document anda set of known documents in an author verificationproblem
AJAX Asynchronous JavaScript and XML
AUC Area under the Receiver Operating CharacteristicCurve
CNG Common N-Gram
ix
DNA deoxyribonucleic acid
NLP Natural Language Processing
PAN Evaluation Lab on Uncovering Plagiarism, Author-ship, and Social Software Misuse
PCA Principal Component Analysis
RNA ribonucleic acid
RNG-Sig Relative N-Gram Signatures
ROC Receiver Operating Characteristic
SMO Sequential Minimal Optimization
SVG Scalable Vector Graphics
SVM Support Vector Machine
XML eXtensible Markup Language
x
Acknowledgements
I would like to express my special gratitude to my supervisors, Dr. Evangelos Milios
and Dr. Vlado Keselj, for their guidance and support. I appreciate their invaluable
help, ideas and mentoring very much.
I also would like to thank very much Dr. Stephen Brooks, Dr. Stan Matwin,
Dr. Diana Inkpen, and Dr. Kirstie Hawkey for their advice and suggestions, which
were of great help.
I am also grateful to the members of our MALNIS research group, and especially
Raheleh Makki, Armin Sajadi and Dr. Axel Soto, for helpful discussions, comments
and encouragement.
I am very grateful to my family: my husband Ernest, and my children Yurek and
Veronika.
xi
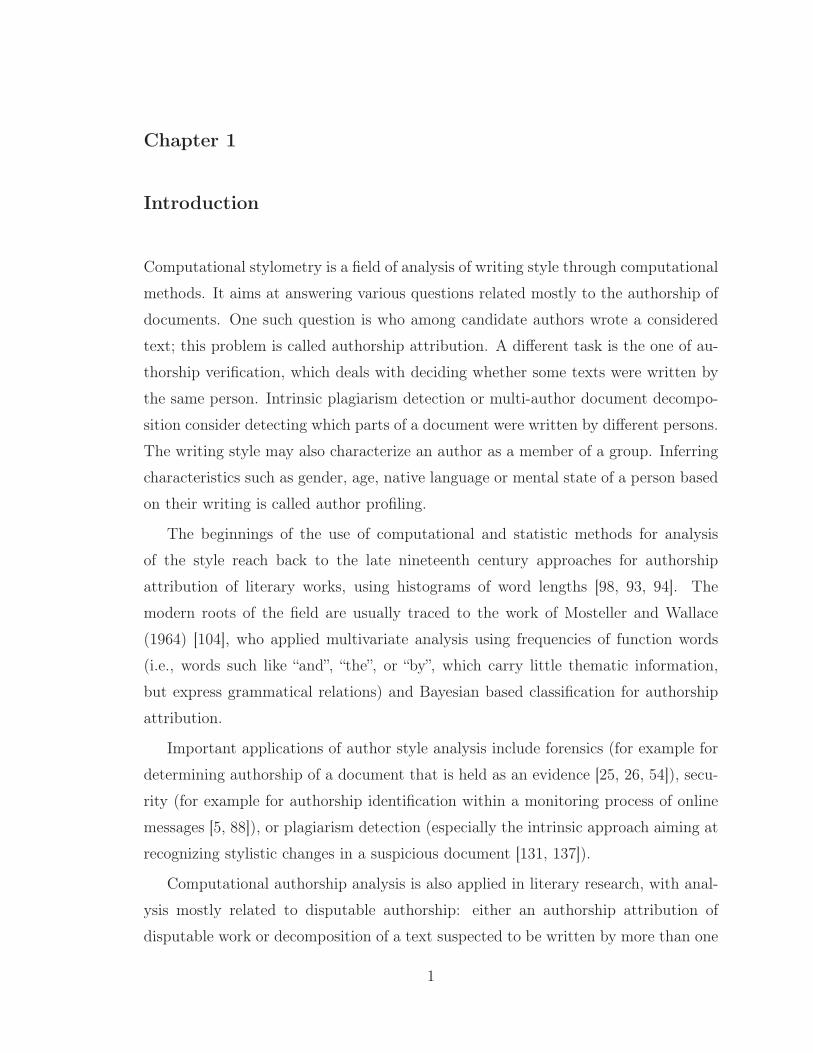
Chapter 1
Introduction
Computational stylometry is a field of analysis of writing style through computational
methods. It aims at answering various questions related mostly to the authorship of
documents. One such question is who among candidate authors wrote a considered
text; this problem is called authorship attribution. A different task is the one of au-
thorship verification, which deals with deciding whether some texts were written by
the same person. Intrinsic plagiarism detection or multi-author document decompo-
sition consider detecting which parts of a document were written by different persons.
The writing style may also characterize an author as a member of a group. Inferring
characteristics such as gender, age, native language or mental state of a person based
on their writing is called author profiling.
The beginnings of the use of computational and statistic methods for analysis
of the style reach back to the late nineteenth century approaches for authorship
attribution of literary works, using histograms of word lengths [98, 93, 94]. The
modern roots of the field are usually traced to the work of Mosteller and Wallace
(1964) [104], who applied multivariate analysis using frequencies of function words
(i.e., words such like “and”, “the”, or “by”, which carry little thematic information,
but express grammatical relations) and Bayesian based classification for authorship
attribution.
Important applications of author style analysis include forensics (for example for
determining authorship of a document that is held as an evidence [25, 26, 54]), secu-
rity (for example for authorship identification within a monitoring process of online
messages [5, 88]), or plagiarism detection (especially the intrinsic approach aiming at
recognizing stylistic changes in a suspicious document [131, 137]).
Computational authorship analysis is also applied in literary research, with anal-
ysis mostly related to disputable authorship: either an authorship attribution of
disputable work or decomposition of a text suspected to be written by more than one
1
2
person into single-author parts. The case of twelve of “Federalist Papers” — eighteen
century political essays — published under a pseudonym and claimed by two authors,
became a test-set for authorship attribution studies, including the seminal first ap-
plication of multivariate analysis [104] and many others (e.g., [79, 58, 105]). Other
examples of disputable authorship of literary works, to which computational methods
were applied, include authorship of Shakespearean plays (e.g., [101, 42, 99, 100]), or
authorship of Biblical books (e.g., [97, 18, 80]). Other applications of computational
methods to analysis of the style of authors of literary work include analysis of how
authors differ in style [22], or investigation of a style of collaborative work [118].
Several different features quantifying style of a text document have been proposed
and applied. According to the taxonomy proposed in [132], these stylometric features
can be categorized as lexical, character, syntactic, semantic and application-specific
features.
The basics of lexical features lay in viewing a text as a stream of word tokens.
The first proposed features were the counts of word lengths and of sentence lengths
[98, 93, 94]. Early statistical analysis of author style also relied on several features
measuring vocabulary richness, such as the type-token ratio (ratio of the number of
unique words over the number of all words), the number of hapax legomena (words
appearing only once in a document), or other related functions aiming at lessening
the dependency of the type-token ratio on the length of a text, such as K measure of
Yule [149]. The vocabulary richness features are presently considered not sufficient
for author detection [59, 132].
Important and powerful lexical features for author detection are frequencies of
function words (closed-class part of speech categories, such as articles, prepositions,
particles, etc., which carry very little semantic information). They were first proposed
by Mosteller and Wallace [104], and widely applied in authorship detection studies,
either by choosing a prescribed set of function words, or by selecting, in some way,
the most frequent words in a training corpus [132, 72]. One can notice that function
words are exactly the words that are usually removed from feature sets for classifi-
cations based on topics. Some explanation of the high power of function words in
differentiating between authors can be provided by an intuition that the use of func-
tion words by authors is to a large degree unconscious, and that they do not depend

3
on the topic of a document [72]. Word bigrams and longer n-grams have also been
used, though by themselves they usually do not lead to a better performance than
single words [132].
Character features are extracted by considering a text as a stream of characters.
They are based on frequencies of given types of characters (e.g., letters, digits, punc-
tuation marks) or frequencies of character n-grams: strings of consecutive characters
as they appear in an analyzed text. The character n-grams were first proposed for
author recognition by Kjell [78], and have been since shown to be the top performing
features for recognizing an author [66, 132]. Recently they have also been proven to be
the best features for author recognition in a cross-topic setting [133, 123, 88]. Their
relation to suffixes and affixes of words, and to punctuation choices of an author,
plays an important role in their effectiveness [121]. They also have a useful property
of being very easy to extract, as well as having a higher count than words in a given
text.
A specific type of approach for author recognition, which is implicitly based on
character sequences, are compression-based methods. Their idea lies in assessing the
similarity of texts by measuring the size of a compressed file, when a model obtained
from one text is used to compress another text [132].
Syntactic features exploit syntactic analysis of a text and were first proposed by
Baayen et al. [14]. The simplest of these features are frequencies of different parts of
speech or of part of speech n-grams. The more complex ones are based on complete or
partial syntactic parsing of sentences: they include frequencies of syntactic production
rules, frequencies and lengths of different phrases (noun phrases, verb phrases, etc.),
or n-grams of syntactic labels in the stream produced by a parser [132]. Some pro-
posed features require even more complex Natural Language Processing tools, such
as coherence features based on cross-sentence level of analysis, and requiring a system
for coreference resolution (detecting and resolving references to a given entity) [46].
While in themselves the syntactic features usually do not perform better than func-
tion words or character n-grams, they are often useful as additional features in an
analysis, although at the cost of requiring more computational resources and more
advanced processing tools [132, 70, 46].
Features based on writers’ errors have been proposed by Koppel and Schler [81].
4
The features rely on detection of word-based or syntactic-based errors of an author,
and have been shown to enhance author attribution. Their important property is
the fact that their usage emulates the approach taken usually by linguistic experts in
manual author recognition.
A category of features used less frequently for author recognition are semantic fea-
tures. Synonym choices of authors have been utilized by Koppel et al. [80] for Biblical
texts, for which manual annotation of synonyms was available. Other attempts at
using semantic information utilize WordNet [45] to extract for words measures of pol-
ysemy (the number of senses) and hypernymy (the number of levels in a hierarchy
of senses) [45], or the number of synonyms [30]. A framework of functional lexical
attributes, which allows an assignment of semantic values to words within a text,
has been proposed by Argamon et al. [12]; the attributes were used as features for
authorship analysis tasks.
For specific applications, special features were also applied, such as structural fea-
tures for analyzing email authorship, for example presence of greetings or a signature,
or a paragraph length [132].
One question raised about computational stylometry is its ability to increase un-
derstanding of style differences or to provide interpretable “evidence” for an auto-
matically discovered stylistic difference — the ability that is often considered too
low [34, 67, 35, 61, 133]. Some steps towards increasing the level of explanation in
computational authorship analysis were taken by choosing features or classification
algorithms that are easier to interpret, such as semantic attributes used by Argamon
et al. [12] or frequent rule mining approach chosen by Iqbal et al. for forensic appli-
cations [61]. Another way of approaching the need of explanation is through visual
and interactive systems for analysis of author style (e.g., [28, 38]).
An important aspect of the research of authorship analysis is addressing the po-
tentially impeding effect of various properties of the tasks. It has been systematically
shown that the decrease in the length of analyzed texts and the increase in the number
of candidates negatively affects performance of authorship attribution [91]. Recent
research related to cross-topic authorship attribution addresses the differences of top-
ics between analyzed documents and shows that the task of recognizing an author
becomes more difficult when available texts are not controlled for topic [133, 123, 88].
5
Recognition of an author in a cross-genre setting has also been shown to be more
difficult than in the traditionally studied situation of all analyzed texts being of the
same genre [52, 73, 133].
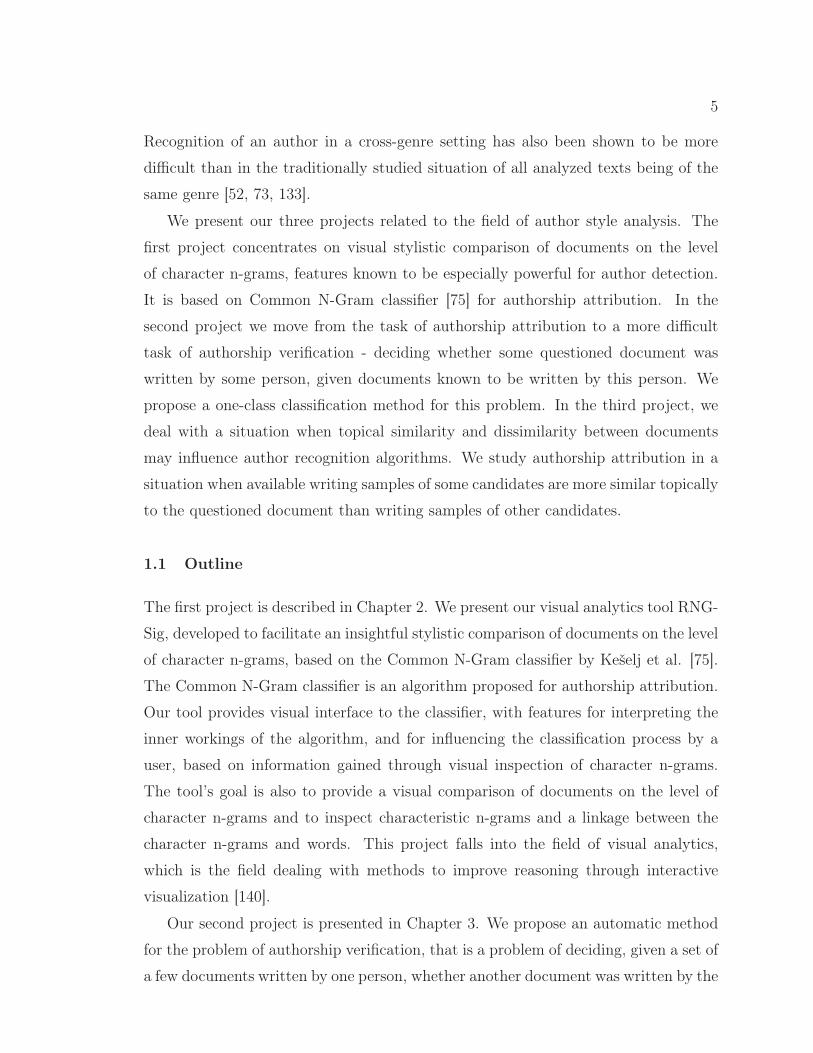
We present our three projects related to the field of author style analysis. The
first project concentrates on visual stylistic comparison of documents on the level
of character n-grams, features known to be especially powerful for author detection.
It is based on Common N-Gram classifier [75] for authorship attribution. In the
second project we move from the task of authorship attribution to a more difficult
task of authorship verification - deciding whether some questioned document was
written by some person, given documents known to be written by this person. We
propose a one-class classification method for this problem. In the third project, we
deal with a situation when topical similarity and dissimilarity between documents
may influence author recognition algorithms. We study authorship attribution in a
situation when available writing samples of some candidates are more similar topically
to the questioned document than writing samples of other candidates.
1.1 Outline
The first project is described in Chapter 2. We present our visual analytics tool RNG-
Sig, developed to facilitate an insightful stylistic comparison of documents on the level
of character n-grams, based on the Common N-Gram classifier by Keselj et al. [75].
The Common N-Gram classifier is an algorithm proposed for authorship attribution.
Our tool provides visual interface to the classifier, with features for interpreting the
inner workings of the algorithm, and for influencing the classification process by a
user, based on information gained through visual inspection of character n-grams.
The tool’s goal is also to provide a visual comparison of documents on the level of
character n-grams and to inspect characteristic n-grams and a linkage between the
character n-grams and words. This project falls into the field of visual analytics,
which is the field dealing with methods to improve reasoning through interactive
visualization [140].
Our second project is presented in Chapter 3. We propose an automatic method
for the problem of authorship verification, that is a problem of deciding, given a set of
a few documents written by one person, whether another document was written by the
6
same person. We tackle this problem through proximity-based one-class classification,
based on character n-grams and word n-grams, and utilizing the Common N-Gram
dissimilarity [75] between documents. The method is “intrinsic” in that it uses only the
texts presented in a problem, without a need to acquire additional documents, and is
suited for problems with at least 3 documents of known authorship. Variations of our
method, evaluated on a multilingual dataset of the Author Identification competition
of PAN 2013 shared tasks on digital text forensics, were competitive with respect to
the best competition results on the entire set and separately on two language subsets.
A version of our method submitted to the task was the winner in the competition’s
secondary evaluation.
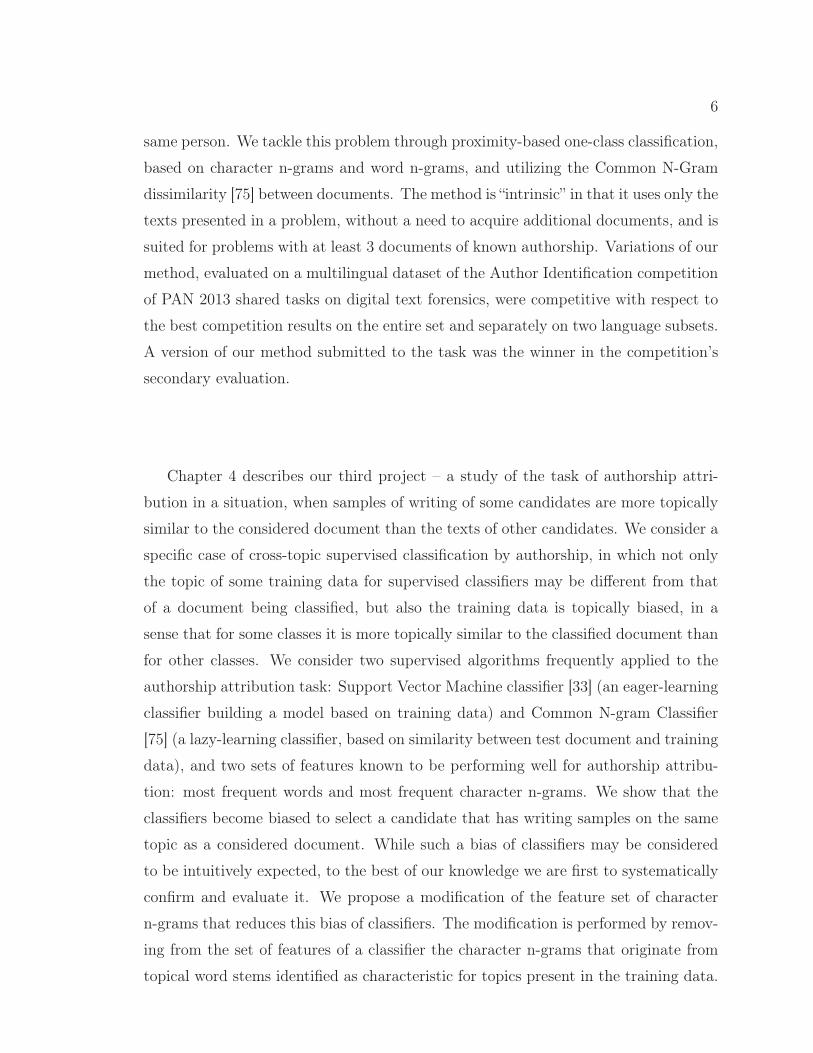
Chapter 4 describes our third project – a study of the task of authorship attri-
bution in a situation, when samples of writing of some candidates are more topically
similar to the considered document than the texts of other candidates. We consider a
specific case of cross-topic supervised classification by authorship, in which not only
the topic of some training data for supervised classifiers may be different from that
of a document being classified, but also the training data is topically biased, in a
sense that for some classes it is more topically similar to the classified document than
for other classes. We consider two supervised algorithms frequently applied to the
authorship attribution task: Support Vector Machine classifier [33] (an eager-learning
classifier building a model based on training data) and Common N-gram Classifier
[75] (a lazy-learning classifier, based on similarity between test document and training
data), and two sets of features known to be performing well for authorship attribu-
tion: most frequent words and most frequent character n-grams. We show that the
classifiers become biased to select a candidate that has writing samples on the same
topic as a considered document. While such a bias of classifiers may be considered
to be intuitively expected, to the best of our knowledge we are first to systematically
confirm and evaluate it. We propose a modification of the feature set of character
n-grams that reduces this bias of classifiers. The modification is performed by remov-
ing from the set of features of a classifier the character n-grams that originate from
topical word stems identified as characteristic for topics present in the training data.
7
1.2 Contributions
In summary, our main contributions are:
• a visual analytics method for comparing documents on character n-gram level
and for authorship attribution, allowing for interpreting characteristic character
n-grams, and enabling users to modify the classification algorithm,
• a language independent one-class classification method for author verification,
suited for problems with 3 or more documents of known authorship, combining
competitive performance with simplicity of required processing of data,
• a systematic evaluation of an effect yielded on authorship attribution classifiers
by topically biased training data,
• a method for feature set modification that reduces in authorship attribution a
bias of classifiers towards a candidate with training data topically more similar
to a test document.
Chapter 2
Relative N-Gram Signatures — Document Visualization at the
Level of Character N-Grams
2.1 Introduction
A character n-gram from a given text is a string of n consecutive characters appear-
ing in the text. Character n-gram based methods have been successfully applied to
various problems in the text mining domain. They proved to be especially effective
in the field of text classification. Language recognition [24] is the domain of one of
the earliest, and very successful, applications of n-gram methods. Authorship attri-
bution is another text classification problem that has been efficiently tackled by using
character n-gram approaches [17, 47, 130, 60, 75].
An important advantage of the character n-gram approach is its language inde-
pendence. As the model is based on character sequences, it does not rely on the
syntax or semantics of a language; the same algorithm can be used for text docu-
ments of various languages. Stemming and removing of stop words is usually not
necessary, and even not desirable, when a character n-gram method is used. More-
over, such an analytical method can be easily applied for languages of a non-trivial
word segmentation. An n-gram does not even have to be a sequence of characters;
analogous methods as for text documents can be employed for other, non-character
based sequences. For example such approaches can be used in biological domain for
classification based on amino acid sequences or DNA [144, 49, 141], or in the realm
of music for authorship attribution task for musical works [147].
The foundation of our system is the Common N-Gram (CNG) analysis method: a
text classification algorithm proposed by Keselj et al. [75]. It relies on a dissimilarity
measure between a document and a class that is based on the differences in the usage
frequencies of the most common n-grams of the document and of the class.
We present a visualization system called Relative N-Gram Signatures (RNG-Sig)
8
9
that sheds light on n-grams used for the CNG analysis method. The system provides
users with the ability to explore the most important (most distinguishing) n-grams
for a document or for a class of documents as well as to gain insight into the inner
workings of the classifier. The application employs visualization for discovery of
patterns of characteristic n-grams, facilitating a visual inspection of n-grams that are
characteristic for a given document or class. It also allows for a manual adaptation
of the classification process via the visualization based on the task-dependant decision
of a user. The system is targeted at users interested in detailed investigation of the
characteristic n-grams of documents, for example the documents whose authorship is
to be determined via CNG classification.
This chapter is organized as follows. Section 2.2 provides background information
on the CNG classifier and a survey of the literature related to our project. The main
ideas we employ in our visualization are described in Section 2.3, which is followed
by the presentation of the system capabilities and implementation in Section 2.4. We
describe use cases of the analysis of authorship style in Section 2.5. We conclude the
chapter by outlining possible extensions in Section 2.7.
The content of this chapter is based extensively on our publication [62].
2.2 Related Work
CNG Classifier
The Common N-Gram (CNG) classifier is at heart of our Relative N-Gram Signatures.
The classifier has been proposed by Keselj et al. [75] and is based on comparing the
frequencies of the most common character n-grams of the considered documents.
In addition to its original use for identification of texts’ authors [75, 67, 130],
the CNG classifier has been also reported as a successful method for various other
classification tasks: determination of software code’s authors [47], genome classifi-
cation [141], page genre classification [95], determination of composers of musical
works [147], recognition of computer viruses [9], and detection of Alzheimer’s disease
[139].
The character n-grams are strings of n consecutive characters from a given text.
For example, for the text “the table” there are 6 distinct 4-grams, namely “THE_”,
10
“HE_T”, “E_TA”, “_TAB”, “TABL”, “ABLE” (here the letters are converted to the
upper case and the space is replaced with the underscore, as is the convention in this
paper).
The CNG algorithm deals with the task of classifying a text document, that is
with the task of labelling a document with a single label from a given fixed set of
labels (or, in other words, of assigning the document to one class from a fixed set of
classes). The authorship attribution is an example of a classification task: given a
fixed set of author names the algorithm is to label a new document with one of these
names. The classifier is built based on training data consisting of documents for which
the class membership is known. For each class all training documents belonging to
the class are concatenated together into one class document.
For each class and for a given document to be assigned to one of the classes,
the classifier builds a profile that reflects the usage frequency of the most common
n-grams of a given length. A profile is built based on the frequency of each n-gram
in the corresponding document normalized by the length of the document (i.e., on
the number of times the given n-gram appears in the document divided by the total
number of n-grams of this length). Given the parameters L being the profile’s size
and n being the n-grams’ length, a profile is the sequence of the L most common
distinct n-grams of the length n, ordered by their decreasing normalized frequency.
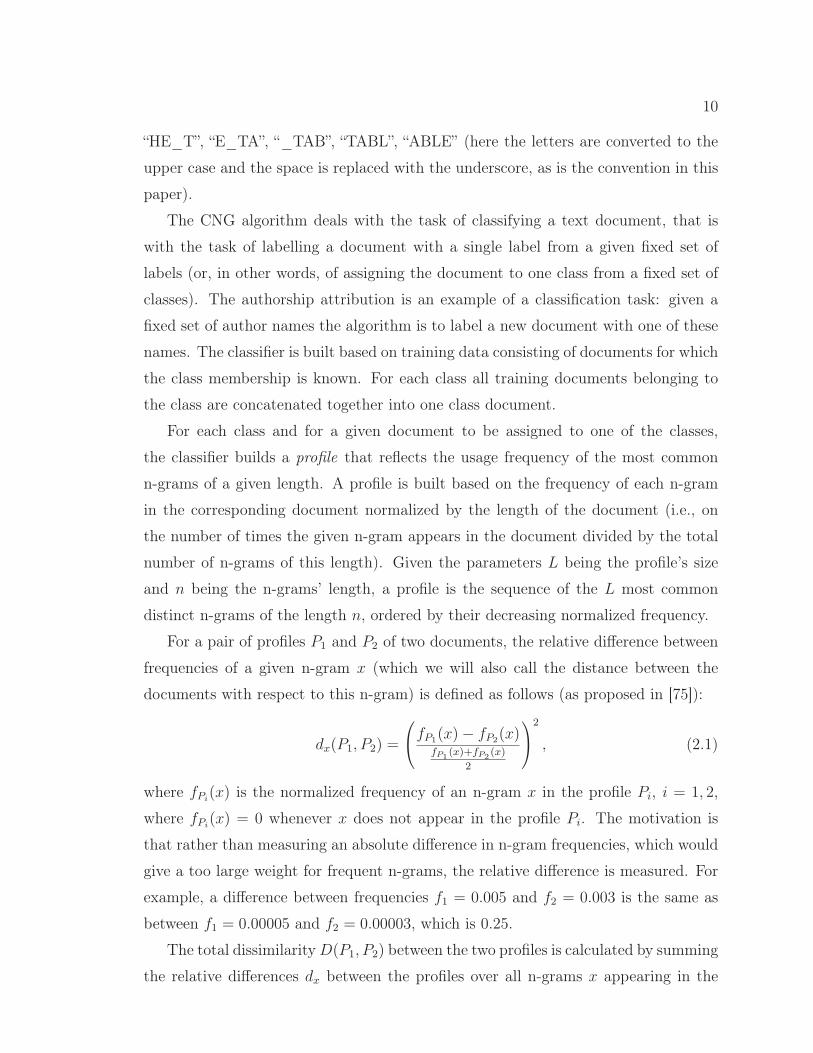
For a pair of profiles P1 and P2 of two documents, the relative difference between
frequencies of a given n-gram x (which we will also call the distance between the
documents with respect to this n-gram) is defined as follows (as proposed in [75]):
dx(P1, P2) =
⎛⎝fP1(x)− fP2(x)
fP1(x)+fP2
(x)
2
⎞⎠
2
, (2.1)
where fPi(x) is the normalized frequency of an n-gram x in the profile Pi, i = 1, 2,
where fPi(x) = 0 whenever x does not appear in the profile Pi. The motivation is
that rather than measuring an absolute difference in n-gram frequencies, which would
give a too large weight for frequent n-grams, the relative difference is measured. For
example, a difference between frequencies f1 = 0.005 and f2 = 0.003 is the same as
between f1 = 0.00005 and f2 = 0.00003, which is 0.25.
The total dissimilarity D(P1, P2) between the two profiles is calculated by summing
the relative differences dx between the profiles over all n-grams x appearing in the
11
union of the profiles:
D(P1, P2) =∑
x∈(P1∪P2)
dx(P1, P2). (2.2)
The CNG classifier applies the k-nearest neighbour algorithm with k = 1 based
on the dissimilarity measure between profiles. For a new document to be classified,
the dissimilarities between the profile of the document and the profiles of the classes
(i.e., of the training class documents) are calculated and the new instance is assigned
to the class with the least dissimilar profile.
The CNG classifier was originally evaluated for authorship attribution task on
five datasets [75]. The character n-grams used in the evaluation were not processed
(differently than in our system, no normalization of letter case or replacement of non-
letter characters was applied). For parameters similar to the parameters used in this
chapter, namely for the lengths of n-grams 3, 4 or 5, and for the lengths of profiles
500 or 1000, the reported accuracy is within the following ranges: 0.83− 1 on a small
English set with nine authors; 0.74 − 0.85 on a Chinese set with eight authors, and
0.66− 0.8, 0.79− 0.87, 0.87− 0.93 on three Greek sets with ten authors.
Related Work Regarding Visualisation
A visual representation of classification algorithms aims at depicting the classifica-
tion model, visually representing the classification results and facilitating better user
interaction with the algorithm. Such visualizations have been proposed for some
specific algorithms, such as Naive Bayes [15], Decision Trees [11], or Support Vector
Machines [32], or for classes of algorithms, such as additive classifiers [114], associative
classifiers [29], or classifiers with probabilistic results [128].
The visualization of classification processes applied specifically to the text data
poses its own specific challenges, especially due to the high dimensionality of the
text representation, and has been less often reported. Nunzio [107] applies two-
dimensional representation of a text document for probability-based classification and
for visualization of text collections. Plaisant et al. [111] use Naive Bayes for the text
classification task as the basis of their interactive exploratory system for analyzing
literary works by users that are not specialists in the text mining domain.
Important work related to visual analysis for classification of text data by author-
ship was performed by Abbasi and Chen, who developed two visualization methods
12
for stylistic analysis: Writeprints [6] and Ink Blots [7]. The Ink Blots method com-
bines a decision tree classification for authorship attribution with a visual represen-
tation of the features in the analyzed texts in a form of “blots” overlaid over the text,
which represent features’ importance and position in the text. The Writeprints visu-
alization applies Principal Component Analysis (PCA) for dimensionality reduction
of segments in a sliding window to create two dimensional plot of variation of fea-
ture use. The visual representation of documents is used for authorship attribution
through visual recognition of which of the candidate authors has the most similar
visual Writeprint to the one of an analyzed text. The main difference of our approach
lies in the fact that our system aims at visualizing a different algorithm and focuses
specifically on supporting the analysis of character n-gram features.
These two methods — Ink Blots and Writeprints — are the main components
of the CyberGate system [28] which additionally provides insight into differences
and similarities of use of various features through radar plots, parallel coordinates
plots, multidimensional scaling and text overlay. The latest version of this platform -
Arizona Authorship Analysis Portal [16] uses heat maps of usage of certain features
across authors and a view of which feature types are most characteristic for an author,
as well as incorporates sentiment analysis. These systems’ focus is at analysis and
monitoring of on-line content.
Visualization has been used for studying character n-grams as features for au-
thorship attribution tasks by plotting documents represented by n-grams frequencies
vectors on two 2-dimensional plots. Kjell [79] used principal component analysis
of vectors of character 2-grams and 3-grams. Soboroff et al. [129] applied Latent
Semantic Indexing with character n-grams representation. The idea behind these ap-
proaches is that a distinct separation between different authors’ documents on such
a plot indicates that the features distinguish between the authors, and a document
of a questioned authorship can be attributed to an author by its position in the plot.
A recent, newer than our system, method applying character n-grams and visu-
alization for author recognition, has been proposed by Ding et al. [38]. It employs
similarity-based approach to authorship attribution, and calculates for each portion
of a considered text its input to the total similarity, based on n-grams of words, char-
acters and parts of speech. This input to the total similarity is overlaid by colour
13
highlighting over the text, separately for each of the three types of features. The
system is targeted at forensic investigators and aims at providing visual evidences for
a hypothesis that a given candidate wrote the considered text.
Another type of a visualization employing character n-gram similarity of sequences
is based on similarity matrices, where each column and each row corresponds to a
sequence and the similarity between them is defined by means of the number of shared
n-grams. This is the basis of a tool for the music visualization presented by Wolkowicz
et al. [146]; the tool is based on a self-similarity matrix for a sequence encoding a
musical piece and allows for detection of musical themes. Such an n-gram based
similarity matrix is also used by Maetschke et al. [92] in a tool for visual comparison
of sequences of biological domain (DNA, RNA, amino acid sequences), which enables
users to identify clusters of related sequences.
Our system uses visualization for the discovery of patterns of characteristic n-
grams, which constitutes a way to visually depict and analyze text documents and
their similarity.
Seasoft by Eick et al. [41] is one of the important examples of text visualization
and analysis systems. It depicts various statistics related to lines of text to facili-
tate discovery of their patterns. TileBars by Hearst [57] present term frequency and
distribution within parts of a document. Compus by Fekete and Dufournaud [44]
is a system that allows for visual analysis of various XML attributes within a text.
FeatureLens by Don et al. [39] integrates mining for frequent text patterns with in-
teractive visualisation for analysis of literary works.
A visual text analytic system that is probably most similar in flavour to our ap-
proach and that served as an inspiration for the way our viewer presents characteristic
n-grams, is the Parallel Tag Clouds system by Collins et al. [31]. The authors visualize
subsets of a faceted corpus by extracting words that distinguish a given subset and
plotting these words as tag clouds in a parallel fashion. Our system aims at visualizing
character n-grams instead of words. The feature of our system is its presentation of
characteristic n-grams of a given background (base) document with respect to several
other documents (and so it facilitates the discovery of patterns of n-grams that are
distinguishing with respect to all analyzed documents or only with respect to some).
It also allows for perception of the value of the distance in frequency for a given
14
n-gram for a pair of documents.
Keim and Oelke [71] present a visualization technique called “literature finger-
printing” for the investigation of how some literary analysis measures (such as the
average sentence length or the vocabulary richness) vary between different parts of a
text. The visualization allows for the perception of specific traits of authors that can
be employed for the authorship attribution problem and for gaining in-depth insight
about characteristics of various parts of analyzed literature works. Our system is
similar to this approach in the fact that it also facilitates the comparison of various
text documents as a basis for authorship attribution analysis, but with an analysis
based on character n-gram profiles. Our analysis method differs from the literature
fingerprinting approach mostly by our different level of the visual analysis (the char-
acter n-gram level) and the fact that our system is coupled with an underlying text
classification.
2.3 Visualizing Characteristic N-Grams
Our visualization of documents at the n-gram level is based on the idea of depicting the
difference in the usage frequency of a given n-gram between two documents (where
one of the documents may represent a class to which the other document may be
assigned by a classifier). The goal of the visualization is to provide a user with an
insight both into the characteristics of the documents in terms of chunks of words
and into the inner workings of the CNG classifier.
2.3.1 Single Relative Signature
For a pair of documents we create a structure that we call a relative signature that
reflects the difference of usage frequency of the most common n-grams between the
documents. A relative signature of two documents is built based on their n-gram
profiles. Let P1 and P2 be the profiles of a given size L of two documents. Then, the
relative signature is a sequence of all n-grams appearing in the union of both profiles,
each of these n-grams coupled with the distance between the profiles with respect
to the given n-gram. The n-grams are ordered as follows: first we include all the
n-grams that appear in the first profile P1 (the profile of the so-called base document
that serves as a “background” for the signature), ordered in the same way as in the
15
first profile P1, which are followed by the n-grams that appear only in the second
profile P2 (i.e., they do not appear in the first profile P1), preserving their order in
the second profile P2. Thus, an n-gram with a number k in the signature such that
k ≤ L, is the k-th most common n-gram in the base document, while n-grams in
the signature with numbers greater than L appear only in the profile of the second
document; in the latter case, the lower the number of an n-gram, the more common
a given n-gram is in the second document.
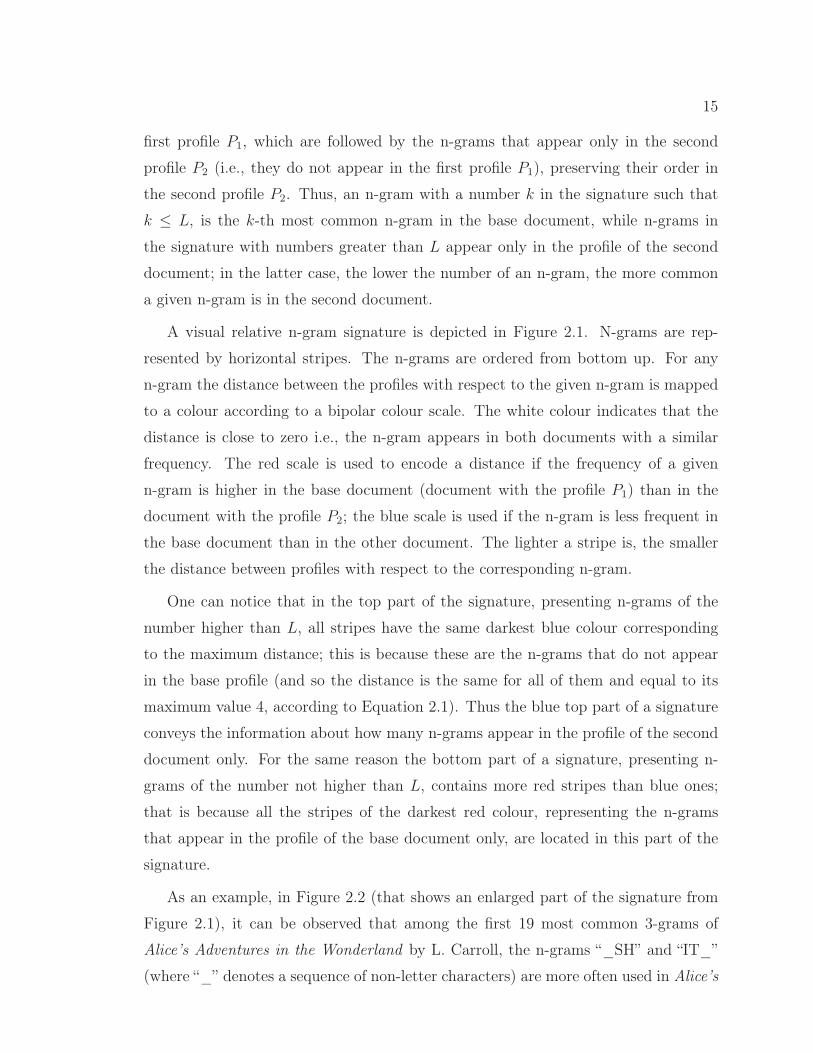
A visual relative n-gram signature is depicted in Figure 2.1. N-grams are rep-
resented by horizontal stripes. The n-grams are ordered from bottom up. For any
n-gram the distance between the profiles with respect to the given n-gram is mapped
to a colour according to a bipolar colour scale. The white colour indicates that the
distance is close to zero i.e., the n-gram appears in both documents with a similar
frequency. The red scale is used to encode a distance if the frequency of a given
n-gram is higher in the base document (document with the profile P1) than in the
document with the profile P2; the blue scale is used if the n-gram is less frequent in
the base document than in the other document. The lighter a stripe is, the smaller
the distance between profiles with respect to the corresponding n-gram.
One can notice that in the top part of the signature, presenting n-grams of the
number higher than L, all stripes have the same darkest blue colour corresponding
to the maximum distance; this is because these are the n-grams that do not appear
in the base profile (and so the distance is the same for all of them and equal to its
maximum value 4, according to Equation 2.1). Thus the blue top part of a signature
conveys the information about how many n-grams appear in the profile of the second
document only. For the same reason the bottom part of a signature, presenting n-
grams of the number not higher than L, contains more red stripes than blue ones;
that is because all the stripes of the darkest red colour, representing the n-grams
that appear in the profile of the base document only, are located in this part of the
signature.
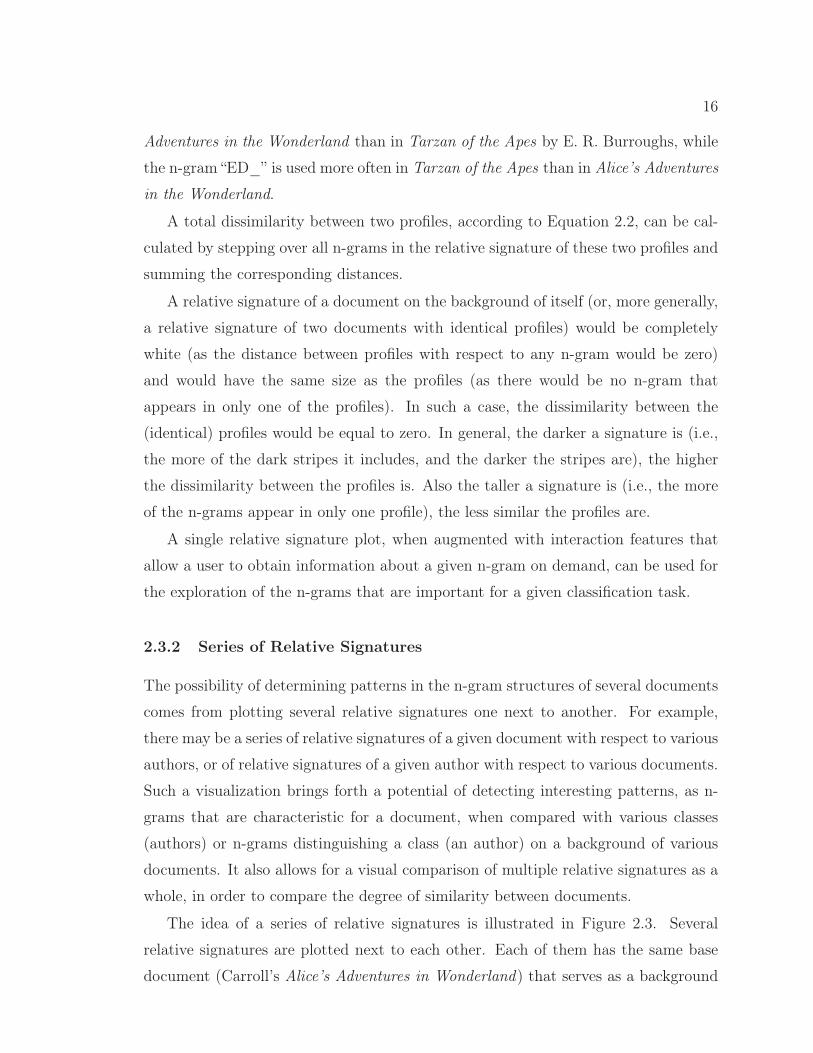
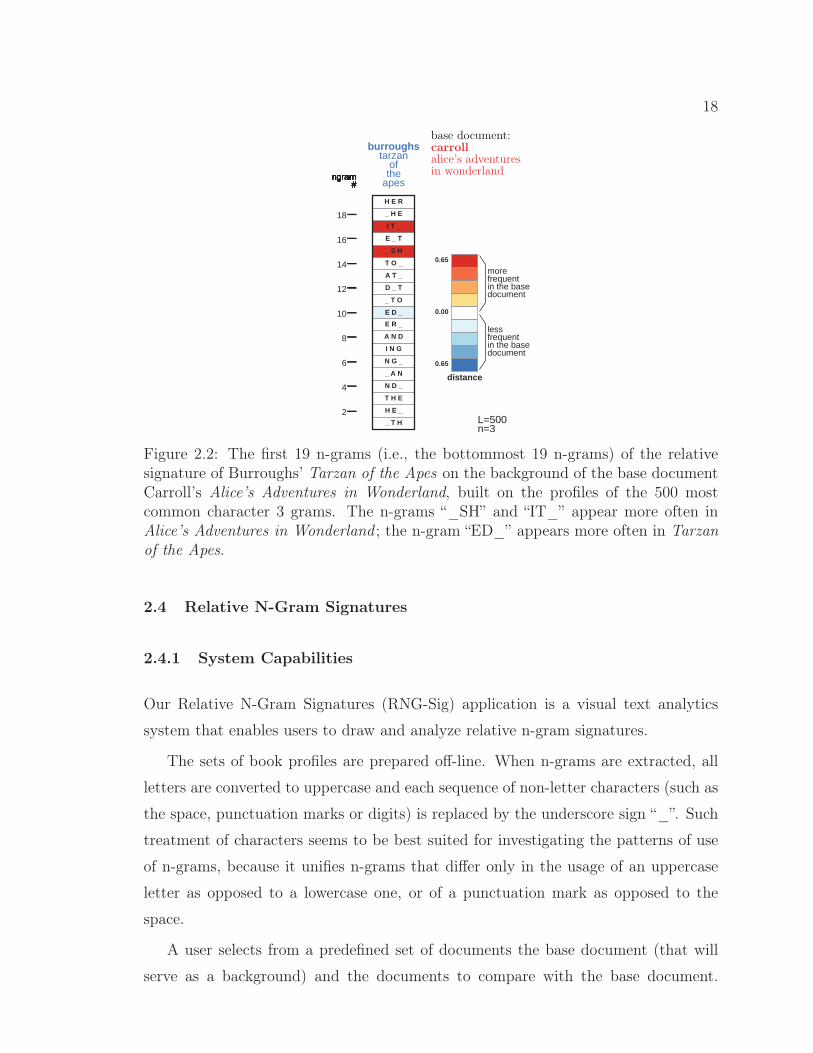
As an example, in Figure 2.2 (that shows an enlarged part of the signature from
Figure 2.1), it can be observed that among the first 19 most common 3-grams of
Alice’s Adventures in the Wonderland by L. Carroll, the n-grams “_SH” and “IT_”
(where “_” denotes a sequence of non-letter characters) are more often used in Alice’s
16
Adventures in the Wonderland than in Tarzan of the Apes by E. R. Burroughs, while
the n-gram “ED_” is used more often in Tarzan of the Apes than in Alice’s Adventures
in the Wonderland.
A total dissimilarity between two profiles, according to Equation 2.2, can be cal-
culated by stepping over all n-grams in the relative signature of these two profiles and
summing the corresponding distances.
A relative signature of a document on the background of itself (or, more generally,
a relative signature of two documents with identical profiles) would be completely
white (as the distance between profiles with respect to any n-gram would be zero)
and would have the same size as the profiles (as there would be no n-gram that
appears in only one of the profiles). In such a case, the dissimilarity between the
(identical) profiles would be equal to zero. In general, the darker a signature is (i.e.,
the more of the dark stripes it includes, and the darker the stripes are), the higher
the dissimilarity between the profiles is. Also the taller a signature is (i.e., the more
of the n-grams appear in only one profile), the less similar the profiles are.
A single relative signature plot, when augmented with interaction features that
allow a user to obtain information about a given n-gram on demand, can be used for
the exploration of the n-grams that are important for a given classification task.
2.3.2 Series of Relative Signatures
The possibility of determining patterns in the n-gram structures of several documents
comes from plotting several relative signatures one next to another. For example,
there may be a series of relative signatures of a given document with respect to various
authors, or of relative signatures of a given author with respect to various documents.
Such a visualization brings forth a potential of detecting interesting patterns, as n-
grams that are characteristic for a document, when compared with various classes
(authors) or n-grams distinguishing a class (an author) on a background of various
documents. It also allows for a visual comparison of multiple relative signatures as a
whole, in order to compare the degree of similarity between documents.
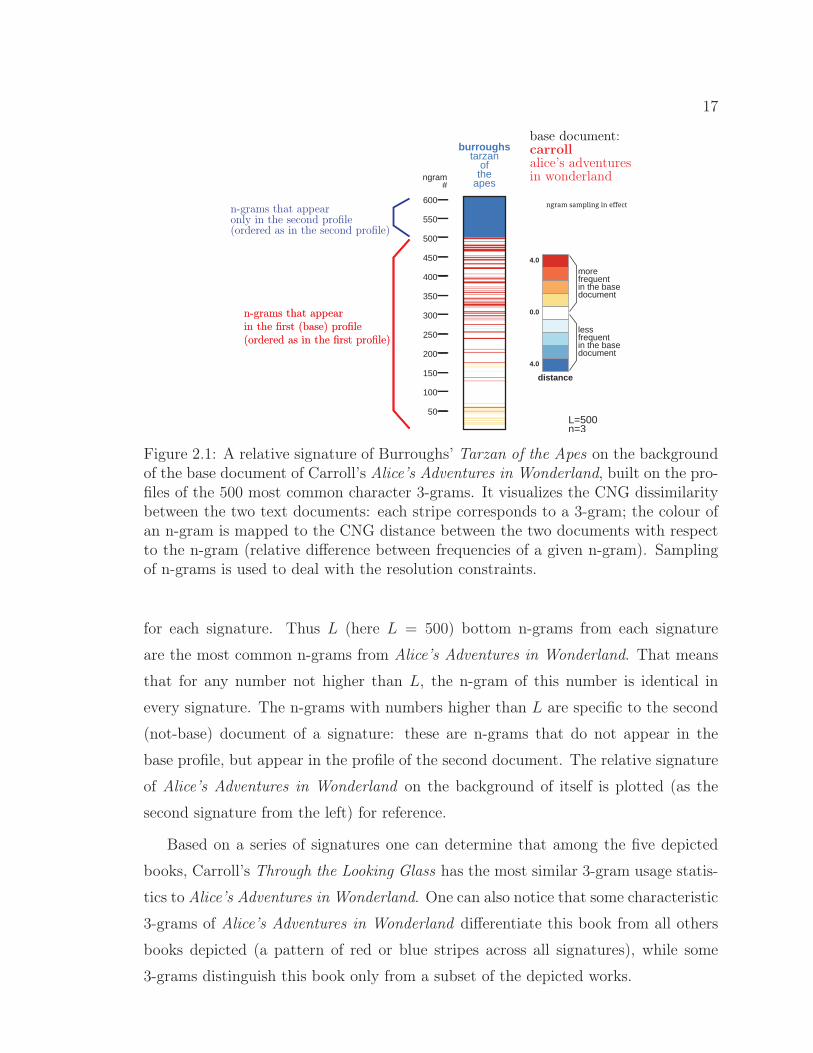
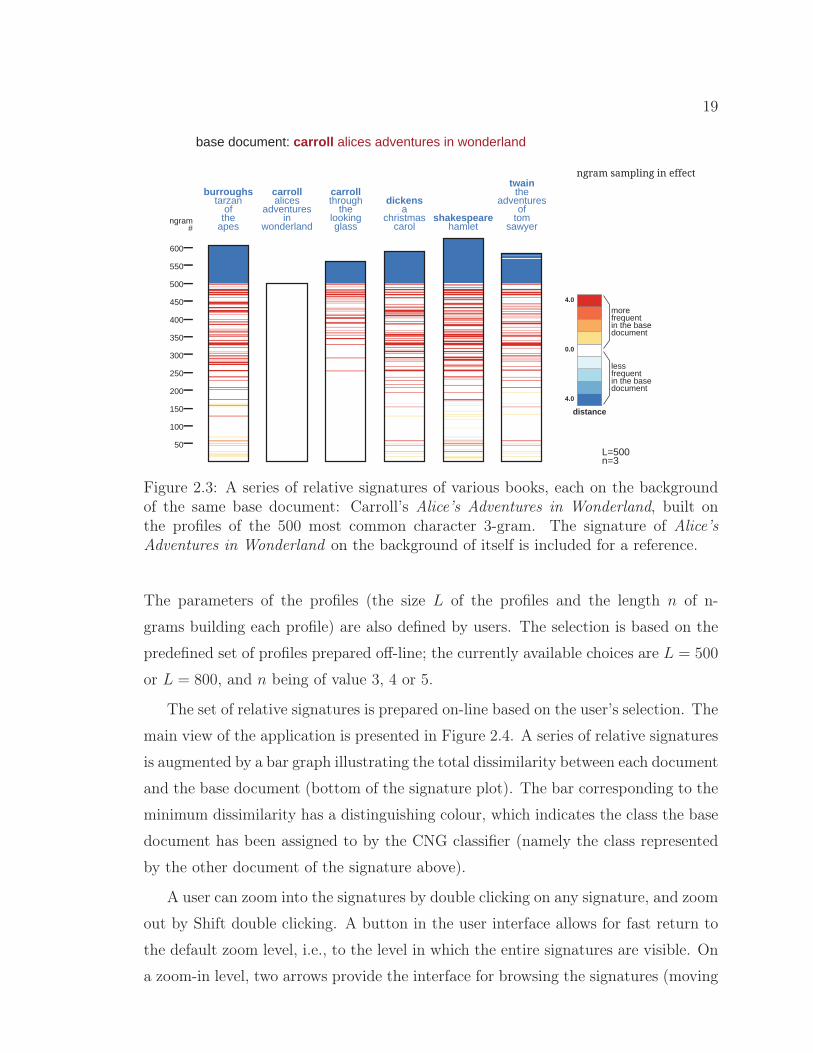
The idea of a series of relative signatures is illustrated in Figure 2.3. Several
relative signatures are plotted next to each other. Each of them has the same base
document (Carroll’s Alice’s Adventures in Wonderland) that serves as a background
17
���
���
���
������������ ������������
������������ ������������
������
�������
�����
��
���
���
���
���
���
���
���
���
���
���
���
�������������� �� ��
����������������� ���
n-grams that appearin the first (base) profile(ordered as in the first profile)
base document:carrollalice’s adventuresin wonderland
n-grams that appearin the first (base) profile(ordered as in the first profile)
only in the second profilen-grams that appear
(ordered as in the second profile)
Figure 2.1: A relative signature of Burroughs’ Tarzan of the Apes on the backgroundof the base document of Carroll’s Alice’s Adventures in Wonderland, built on the pro-files of the 500 most common character 3-grams. It visualizes the CNG dissimilaritybetween the two text documents: each stripe corresponds to a 3-gram; the colour ofan n-gram is mapped to the CNG distance between the two documents with respectto the n-gram (relative difference between frequencies of a given n-gram). Samplingof n-grams is used to deal with the resolution constraints.
for each signature. Thus L (here L = 500) bottom n-grams from each signature
are the most common n-grams from Alice’s Adventures in Wonderland. That means
that for any number not higher than L, the n-gram of this number is identical in
every signature. The n-grams with numbers higher than L are specific to the second
(not-base) document of a signature: these are n-grams that do not appear in the
base profile, but appear in the profile of the second document. The relative signature
of Alice’s Adventures in Wonderland on the background of itself is plotted (as the
second signature from the left) for reference.
Based on a series of signatures one can determine that among the five depicted
books, Carroll’s Through the Looking Glass has the most similar 3-gram usage statis-
tics to Alice’s Adventures in Wonderland. One can also notice that some characteristic
3-grams of Alice’s Adventures in Wonderland differentiate this book from all others
books depicted (a pattern of red or blue stripes across all signatures), while some
3-grams distinguish this book only from a subset of the depicted works.
18
��������
����
����
����
���� ����������������������
������ ����������������������
�������
�����
��
��
��
��
���
��
��
���
���
���
��
���
���
���
���
���
���
���
��
������� ��������������
�����
�����
�����
�����
�����
�����
�����
�����
��
��
��
�!
�����
�
�
�
!
��
�����
base document:carrollalice’s adventuresin wonderland
Figure 2.2: The first 19 n-grams (i.e., the bottommost 19 n-grams) of the relativesignature of Burroughs’ Tarzan of the Apes on the background of the base documentCarroll’s Alice’s Adventures in Wonderland, built on the profiles of the 500 mostcommon character 3 grams. The n-grams “_SH” and “IT_” appear more often inAlice’s Adventures in Wonderland ; the n-gram “ED_” appears more often in Tarzanof the Apes.
2.4 Relative N-Gram Signatures
2.4.1 System Capabilities
Our Relative N-Gram Signatures (RNG-Sig) application is a visual text analytics
system that enables users to draw and analyze relative n-gram signatures.
The sets of book profiles are prepared off-line. When n-grams are extracted, all
letters are converted to uppercase and each sequence of non-letter characters (such as
the space, punctuation marks or digits) is replaced by the underscore sign “_”. Such
treatment of characters seems to be best suited for investigating the patterns of use
of n-grams, because it unifies n-grams that differ only in the usage of an uppercase
letter as opposed to a lowercase one, or of a punctuation mark as opposed to the
space.
A user selects from a predefined set of documents the base document (that will
serve as a background) and the documents to compare with the base document.
19
���
���
���
������������ ������������
������������ ������������
�������
�������
�����
��
���
���
���
���
���
���
���
���
���
���
���
������������ �� ��
���!!������
���������
"�������
���!! ���� �
���#�������
��� ����
� �����������
�� ������ ����
���� �
������������
��"$��
�����������%����!!�������������������"�������
����������������� ���
Figure 2.3: A series of relative signatures of various books, each on the backgroundof the same base document: Carroll’s Alice’s Adventures in Wonderland, built onthe profiles of the 500 most common character 3-gram. The signature of Alice’sAdventures in Wonderland on the background of itself is included for a reference.
The parameters of the profiles (the size L of the profiles and the length n of n-
grams building each profile) are also defined by users. The selection is based on the
predefined set of profiles prepared off-line; the currently available choices are L = 500
or L = 800, and n being of value 3, 4 or 5.
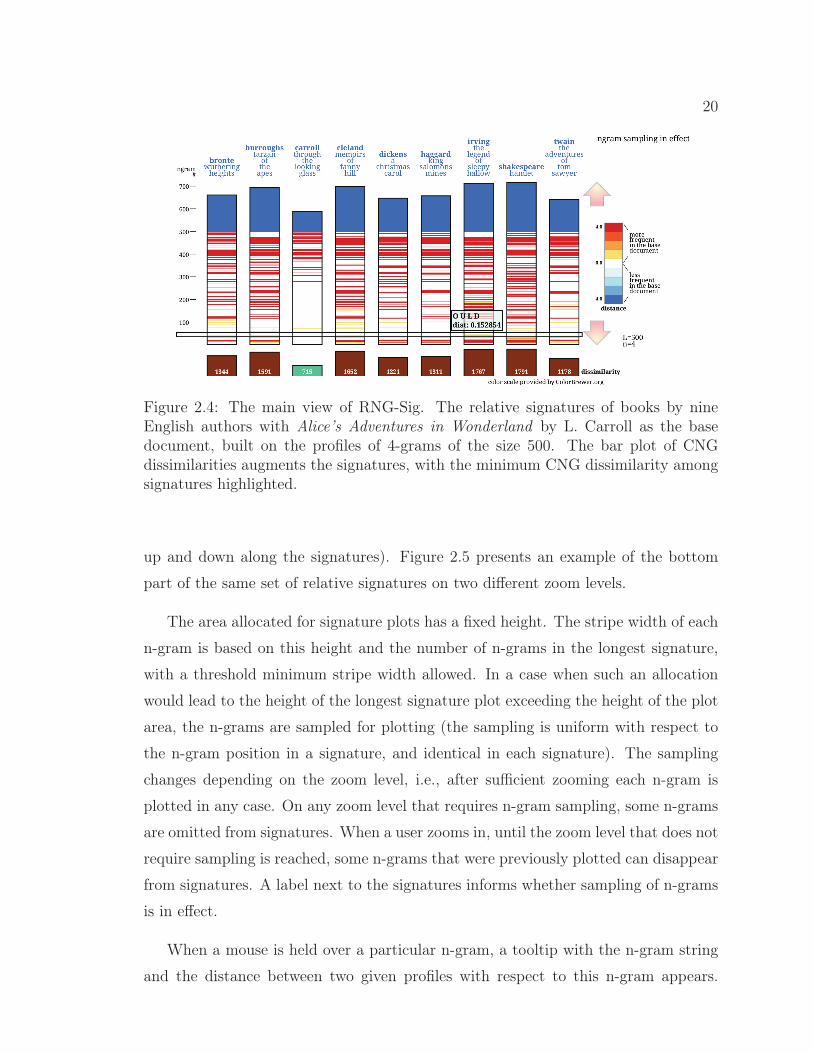
The set of relative signatures is prepared on-line based on the user’s selection. The
main view of the application is presented in Figure 2.4. A series of relative signatures
is augmented by a bar graph illustrating the total dissimilarity between each document
and the base document (bottom of the signature plot). The bar corresponding to the
minimum dissimilarity has a distinguishing colour, which indicates the class the base
document has been assigned to by the CNG classifier (namely the class represented
by the other document of the signature above).
A user can zoom into the signatures by double clicking on any signature, and zoom
out by Shift double clicking. A button in the user interface allows for fast return to
the default zoom level, i.e., to the level in which the entire signatures are visible. On
a zoom-in level, two arrows provide the interface for browsing the signatures (moving
20
Figure 2.4: The main view of RNG-Sig. The relative signatures of books by nineEnglish authors with Alice’s Adventures in Wonderland by L. Carroll as the basedocument, built on the profiles of 4-grams of the size 500. The bar plot of CNGdissimilarities augments the signatures, with the minimum CNG dissimilarity amongsignatures highlighted.
up and down along the signatures). Figure 2.5 presents an example of the bottom
part of the same set of relative signatures on two different zoom levels.
The area allocated for signature plots has a fixed height. The stripe width of each
n-gram is based on this height and the number of n-grams in the longest signature,
with a threshold minimum stripe width allowed. In a case when such an allocation
would lead to the height of the longest signature plot exceeding the height of the plot
area, the n-grams are sampled for plotting (the sampling is uniform with respect to
the n-gram position in a signature, and identical in each signature). The sampling
changes depending on the zoom level, i.e., after sufficient zooming each n-gram is
plotted in any case. On any zoom level that requires n-gram sampling, some n-grams
are omitted from signatures. When a user zooms in, until the zoom level that does not
require sampling is reached, some n-grams that were previously plotted can disappear
from signatures. A label next to the signatures informs whether sampling of n-grams
is in effect.
When a mouse is held over a particular n-gram, a tooltip with the n-gram string
and the distance between two given profiles with respect to this n-gram appears.
21
Moreover, a highlighting horizontal bar is visible when a mouse hovers over an n-
gram. This bar helps a user to analyze the given n-gram in all signatures. Naturally,
the highlighting bar appears only when one of the first L n-grams is hovered. An
example of a tooltip and the highlighting bar is visible in Figure 2.4.
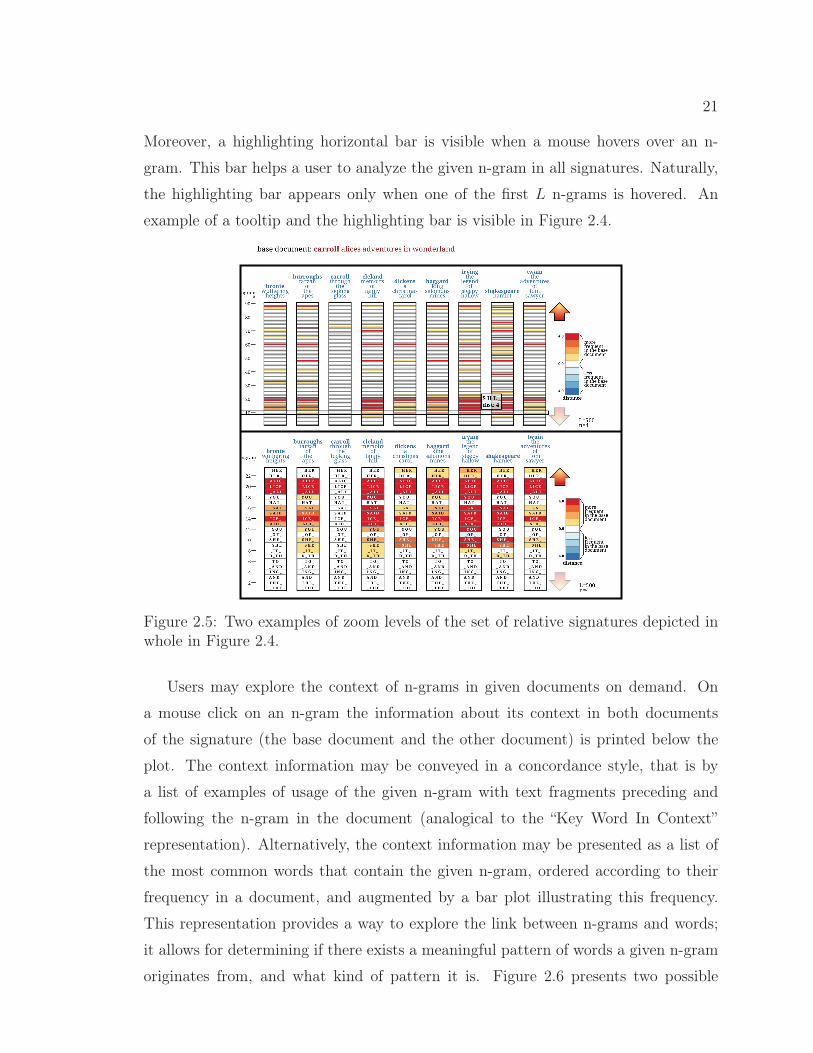
Figure 2.5: Two examples of zoom levels of the set of relative signatures depicted inwhole in Figure 2.4.
Users may explore the context of n-grams in given documents on demand. On
a mouse click on an n-gram the information about its context in both documents
of the signature (the base document and the other document) is printed below the
plot. The context information may be conveyed in a concordance style, that is by
a list of examples of usage of the given n-gram with text fragments preceding and
following the n-gram in the document (analogical to the “Key Word In Context”
representation). Alternatively, the context information may be presented as a list of
the most common words that contain the given n-gram, ordered according to their
frequency in a document, and augmented by a bar plot illustrating this frequency.
This representation provides a way to explore the link between n-grams and words;
it allows for determining if there exists a meaningful pattern of words a given n-gram
originates from, and what kind of pattern it is. Figure 2.6 presents two possible
22
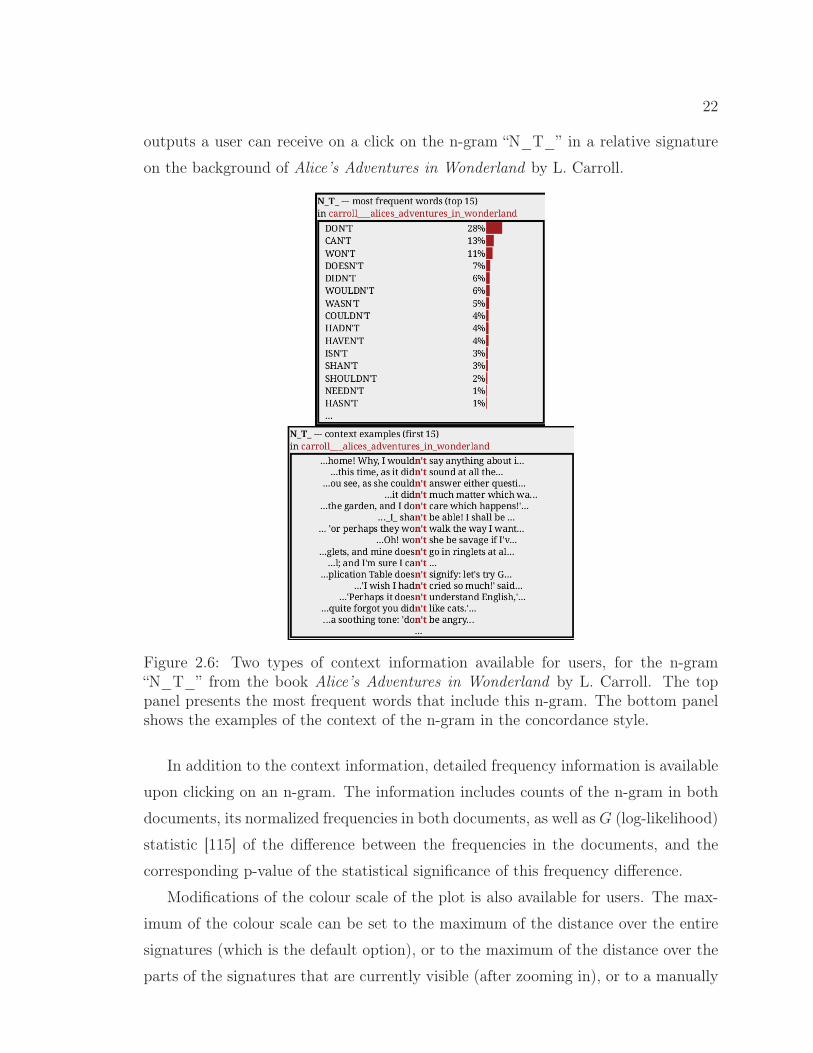
outputs a user can receive on a click on the n-gram “N_T_” in a relative signature
on the background of Alice’s Adventures in Wonderland by L. Carroll.
Figure 2.6: Two types of context information available for users, for the n-gram“N_T_” from the book Alice’s Adventures in Wonderland by L. Carroll. The toppanel presents the most frequent words that include this n-gram. The bottom panelshows the examples of the context of the n-gram in the concordance style.
In addition to the context information, detailed frequency information is available
upon clicking on an n-gram. The information includes counts of the n-gram in both
documents, its normalized frequencies in both documents, as well as G (log-likelihood)
statistic [115] of the difference between the frequencies in the documents, and the
corresponding p-value of the statistical significance of this frequency difference.
Modifications of the colour scale of the plot is also available for users. The max-
imum of the colour scale can be set to the maximum of the distance over the entire
signatures (which is the default option), or to the maximum of the distance over the
parts of the signatures that are currently visible (after zooming in), or to a manually
23
specified value. Additionally, a user may choose to depict only the n-grams with the
maximum distance (Figure 2.11 serves as an illustration of this option).
It is possible to search for n-grams in the visualization. A user specifies a text,
which may be of the length n of the currently plotted n-grams, in which case it
corresponds to a single n-gram, or may be longer. N-grams are extracted from the text
and the user is provided with a list of those among them that appear in the visualized
signatures. When the user selects a single n-gram from the list, the signature plots
zoom into the area centred on the n-gram position and the corresponding n-gram
stripes are highlighted.
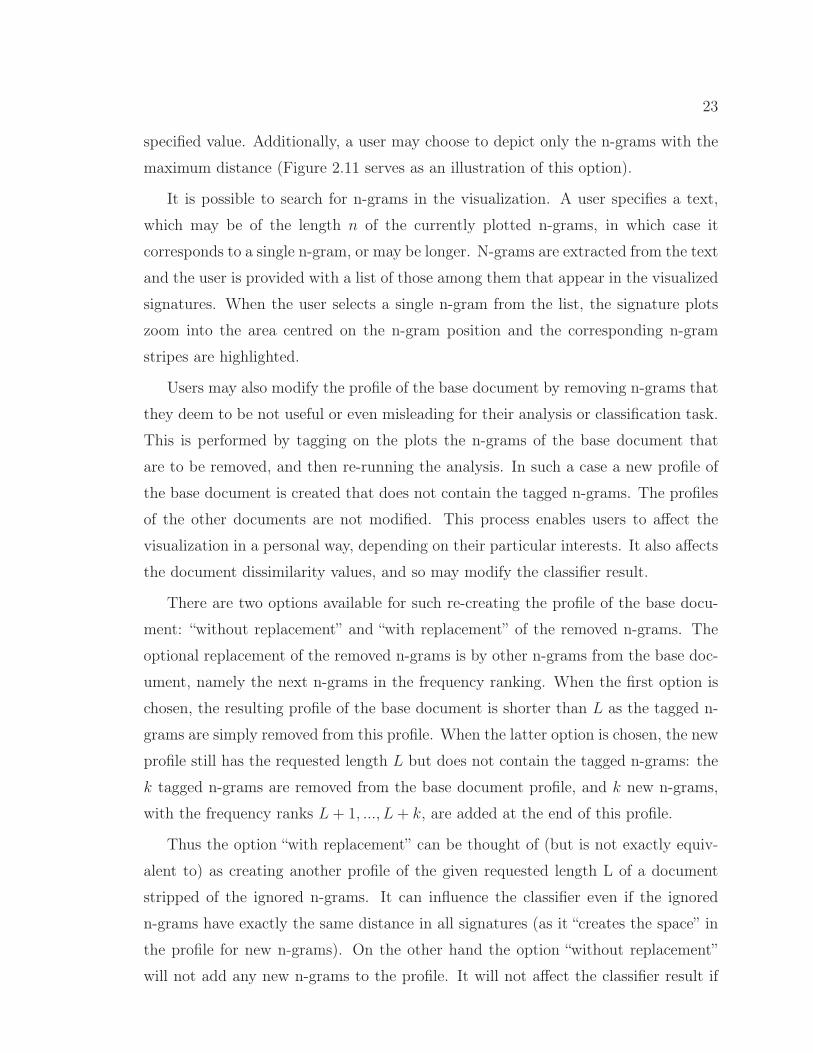
Users may also modify the profile of the base document by removing n-grams that
they deem to be not useful or even misleading for their analysis or classification task.
This is performed by tagging on the plots the n-grams of the base document that
are to be removed, and then re-running the analysis. In such a case a new profile of
the base document is created that does not contain the tagged n-grams. The profiles
of the other documents are not modified. This process enables users to affect the
visualization in a personal way, depending on their particular interests. It also affects
the document dissimilarity values, and so may modify the classifier result.
There are two options available for such re-creating the profile of the base docu-
ment: “without replacement” and “with replacement” of the removed n-grams. The
optional replacement of the removed n-grams is by other n-grams from the base doc-
ument, namely the next n-grams in the frequency ranking. When the first option is
chosen, the resulting profile of the base document is shorter than L as the tagged n-
grams are simply removed from this profile. When the latter option is chosen, the new
profile still has the requested length L but does not contain the tagged n-grams: the
k tagged n-grams are removed from the base document profile, and k new n-grams,
with the frequency ranks L+ 1, ..., L+ k, are added at the end of this profile.
Thus the option “with replacement” can be thought of (but is not exactly equiv-
alent to) as creating another profile of the given requested length L of a document
stripped of the ignored n-grams. It can influence the classifier even if the ignored
n-grams have exactly the same distance in all signatures (as it “creates the space” in
the profile for new n-grams). On the other hand the option “without replacement”
will not add any new n-grams to the profile. It will not affect the classifier result if
24
the ignored n-grams have exactly the same distance in all signatures.
Figure 2.7: A complementary “Comparison Mode” view of the relative n-gram signa-tures. The view presents entire signatures with n-grams in each one ordered inde-pendently by their distance in the given signature. The signatures become bar plotsof the share of each range of distances among their n-grams. The same signatures inthe default “Exploration Mode” are depicted in Figure 2.4.
The user of the system can also switch from the default, so far described view
of the signatures (“Exploration Mode” view) to another, complementary view called
“Comparison Mode”. The view is presented in Figure 2.7. The “Comparison Mode”
view presents whole signatures with the n-grams in each of them ordered according
to their distance value (independently for each signature). Thus a signature becomes
a bar plot depicting the share of each range of distances among its n-grams. The
individual n-grams are not recognizable in this mode. When a mouse is hovered over
a particular part of a signature (a part of a given colour), a tooltip with information
about the contribution of the n-grams within the corresponding range of distances to
the final CNG dissimilarity score is visible.
The “Comparison Mode” makes it easier to compare differences between entire
25
signatures. In the default “Exploration Mode” the fact that in each signature n-
grams of different distances (i.e., of different colours) are neighbours of each other, and
the necessity of n-gram sampling, may possibly make the evaluation of the similarity
between entire signatures confusing; these problems are alleviated by the “Comparison
Mode”.
Finally, the current plot can be downloaded by a user as a file in the SVG (Scalable
Vector Graphics) format.
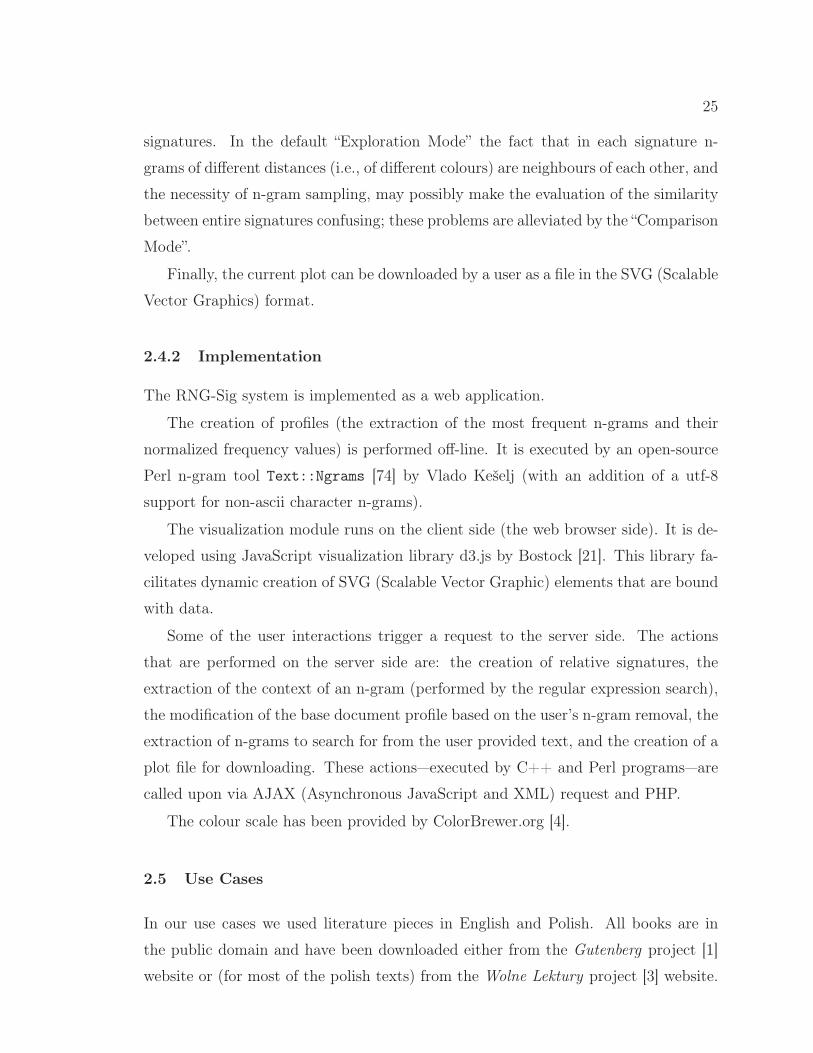
2.4.2 Implementation
The RNG-Sig system is implemented as a web application.
The creation of profiles (the extraction of the most frequent n-grams and their
normalized frequency values) is performed off-line. It is executed by an open-source
Perl n-gram tool Text::Ngrams [74] by Vlado Keselj (with an addition of a utf-8
support for non-ascii character n-grams).
The visualization module runs on the client side (the web browser side). It is de-
veloped using JavaScript visualization library d3.js by Bostock [21]. This library fa-
cilitates dynamic creation of SVG (Scalable Vector Graphic) elements that are bound
with data.
Some of the user interactions trigger a request to the server side. The actions
that are performed on the server side are: the creation of relative signatures, the
extraction of the context of an n-gram (performed by the regular expression search),
the modification of the base document profile based on the user’s n-gram removal, the
extraction of n-grams to search for from the user provided text, and the creation of a
plot file for downloading. These actions—executed by C++ and Perl programs—are
called upon via AJAX (Asynchronous JavaScript and XML) request and PHP.
The colour scale has been provided by ColorBrewer.org [4].
2.5 Use Cases
In our use cases we used literature pieces in English and Polish. All books are in
the public domain and have been downloaded either from the Gutenberg project [1]
website or (for most of the polish texts) from the Wolne Lektury project [3] website.
26
The only cleaning of these texts consisted of removing the parts at the beginning
and/or the end of each book that relate to the above named literary projects.
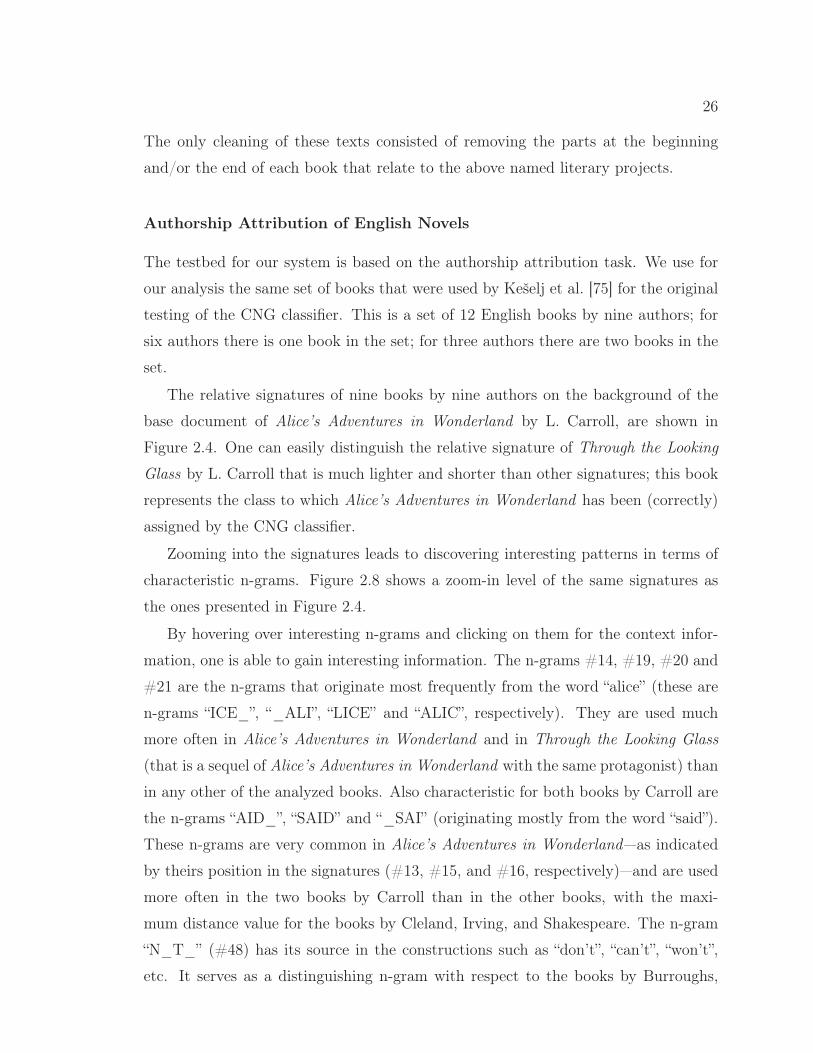
Authorship Attribution of English Novels
The testbed for our system is based on the authorship attribution task. We use for
our analysis the same set of books that were used by Keselj et al. [75] for the original
testing of the CNG classifier. This is a set of 12 English books by nine authors; for
six authors there is one book in the set; for three authors there are two books in the
set.
The relative signatures of nine books by nine authors on the background of the
base document of Alice’s Adventures in Wonderland by L. Carroll, are shown in
Figure 2.4. One can easily distinguish the relative signature of Through the Looking
Glass by L. Carroll that is much lighter and shorter than other signatures; this book
represents the class to which Alice’s Adventures in Wonderland has been (correctly)
assigned by the CNG classifier.
Zooming into the signatures leads to discovering interesting patterns in terms of
characteristic n-grams. Figure 2.8 shows a zoom-in level of the same signatures as
the ones presented in Figure 2.4.
By hovering over interesting n-grams and clicking on them for the context infor-
mation, one is able to gain interesting information. The n-grams #14, #19, #20 and
#21 are the n-grams that originate most frequently from the word “alice” (these are
n-grams “ICE_”, “_ALI”, “LICE” and “ALIC”, respectively). They are used much
more often in Alice’s Adventures in Wonderland and in Through the Looking Glass
(that is a sequel of Alice’s Adventures in Wonderland with the same protagonist) than
in any other of the analyzed books. Also characteristic for both books by Carroll are
the n-grams “AID_”, “SAID” and “_SAI” (originating mostly from the word “said”).
These n-grams are very common in Alice’s Adventures in Wonderland—as indicated
by theirs position in the signatures (#13, #15, and #16, respectively)—and are used
more often in the two books by Carroll than in the other books, with the maxi-
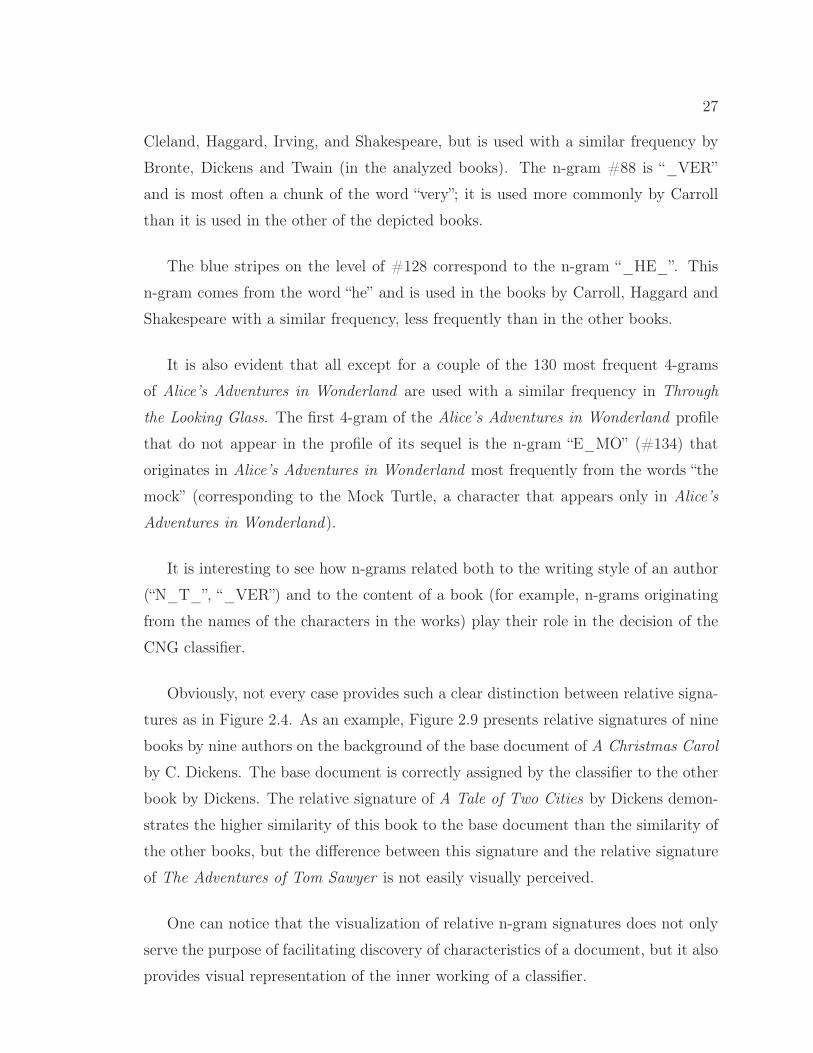
mum distance value for the books by Cleland, Irving, and Shakespeare. The n-gram
“N_T_” (#48) has its source in the constructions such as “don’t”, “can’t”, “won’t”,
etc. It serves as a distinguishing n-gram with respect to the books by Burroughs,
27
Cleland, Haggard, Irving, and Shakespeare, but is used with a similar frequency by
Bronte, Dickens and Twain (in the analyzed books). The n-gram #88 is “_VER”
and is most often a chunk of the word “very”; it is used more commonly by Carroll
than it is used in the other of the depicted books.
The blue stripes on the level of #128 correspond to the n-gram “_HE_”. This
n-gram comes from the word “he” and is used in the books by Carroll, Haggard and
Shakespeare with a similar frequency, less frequently than in the other books.
It is also evident that all except for a couple of the 130 most frequent 4-grams
of Alice’s Adventures in Wonderland are used with a similar frequency in Through
the Looking Glass. The first 4-gram of the Alice’s Adventures in Wonderland profile
that do not appear in the profile of its sequel is the n-gram “E_MO” (#134) that
originates in Alice’s Adventures in Wonderland most frequently from the words “the
mock” (corresponding to the Mock Turtle, a character that appears only in Alice’s
Adventures in Wonderland).
It is interesting to see how n-grams related both to the writing style of an author
(“N_T_”, “_VER”) and to the content of a book (for example, n-grams originating
from the names of the characters in the works) play their role in the decision of the
CNG classifier.
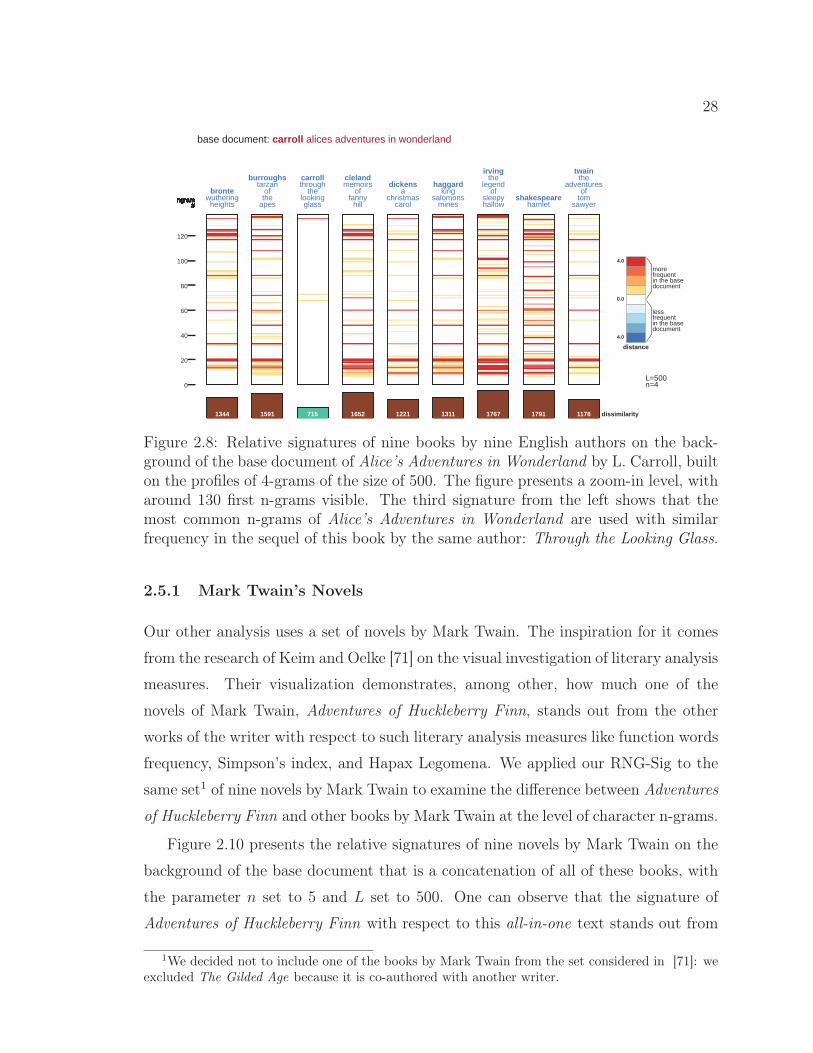
Obviously, not every case provides such a clear distinction between relative signa-
tures as in Figure 2.4. As an example, Figure 2.9 presents relative signatures of nine
books by nine authors on the background of the base document of A Christmas Carol
by C. Dickens. The base document is correctly assigned by the classifier to the other
book by Dickens. The relative signature of A Tale of Two Cities by Dickens demon-
strates the higher similarity of this book to the base document than the similarity of
the other books, but the difference between this signature and the relative signature
of The Adventures of Tom Sawyer is not easily visually perceived.
One can notice that the visualization of relative n-gram signatures does not only
serve the purpose of facilitating discovery of characteristics of a document, but it also
provides visual representation of the inner working of a classifier.
28
�����"�!���#$%&& $��$ �$� $��� $��$ $%$$ $��� $��$ $$��
&�
�
&�
������������ ������������
������������ ������������
������
�������
�����
������ ���� ��� �
�������������� �����
����!! ���� �
�����������
�!�!��������
����� ���
�������
� �����������
��������
�����������
����� �
�������
������ �����
��������� ����
��� �
������������
����������
�����
�
!�
�����
�����
�����
�����
��
�
�����
�����
�
��
��
�����
�����
�����
�����
�����
�����
�����
�
�����������%�����!!���������������������������
Figure 2.8: Relative signatures of nine books by nine English authors on the back-ground of the base document of Alice’s Adventures in Wonderland by L. Carroll, builton the profiles of 4-grams of the size of 500. The figure presents a zoom-in level, witharound 130 first n-grams visible. The third signature from the left shows that themost common n-grams of Alice’s Adventures in Wonderland are used with similarfrequency in the sequel of this book by the same author: Through the Looking Glass.
2.5.1 Mark Twain’s Novels
Our other analysis uses a set of novels by Mark Twain. The inspiration for it comes
from the research of Keim and Oelke [71] on the visual investigation of literary analysis
measures. Their visualization demonstrates, among other, how much one of the
novels of Mark Twain, Adventures of Huckleberry Finn, stands out from the other
works of the writer with respect to such literary analysis measures like function words
frequency, Simpson’s index, and Hapax Legomena. We applied our RNG-Sig to the
same set1 of nine novels by Mark Twain to examine the difference between Adventures
of Huckleberry Finn and other books by Mark Twain at the level of character n-grams.
Figure 2.10 presents the relative signatures of nine novels by Mark Twain on the
background of the base document that is a concatenation of all of these books, with
the parameter n set to 5 and L set to 500. One can observe that the signature of
Adventures of Huckleberry Finn with respect to this all-in-one text stands out from
1We decided not to include one of the books by Mark Twain from the set considered in [71]: weexcluded The Gilded Age because it is co-authored with another writer.
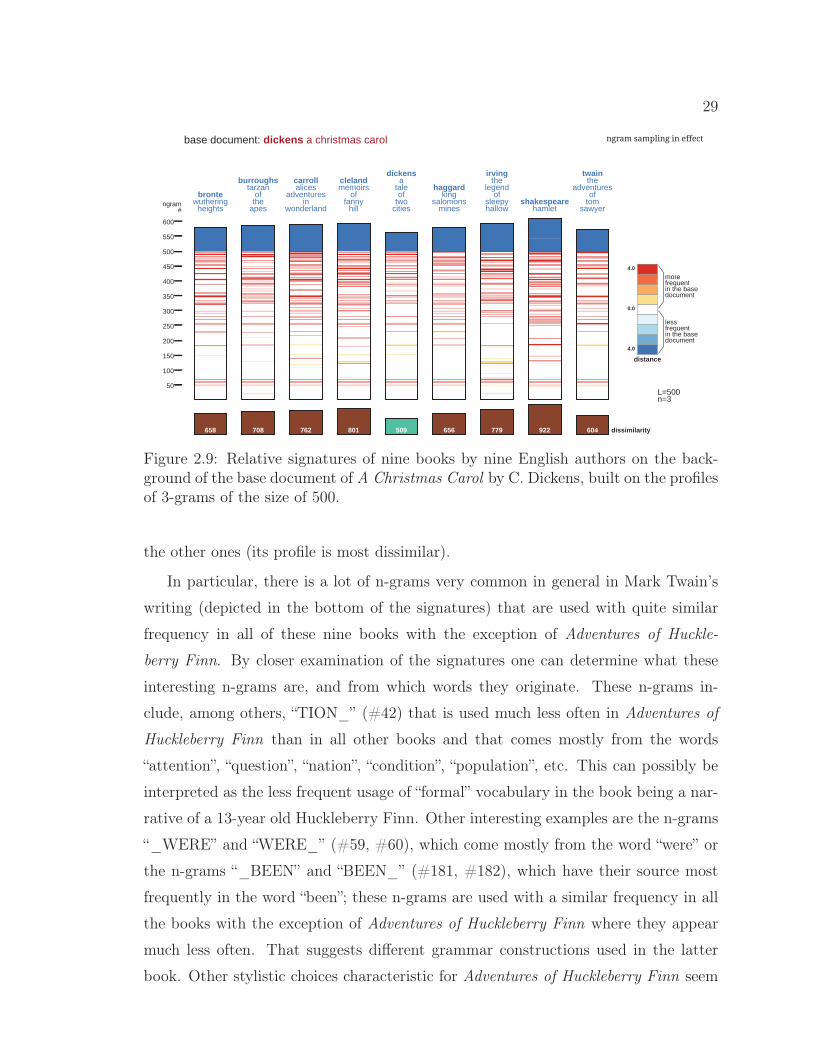
29
�����"�!���#��� ��� ��� ��� �� ��� �� �� ��
� ���� �
��
���
��
����������������������� �!�����
����������������������� �!�����
����� �
������
��
���
���
���
���
���
���
���
���
���
���
���
��������������������
��������������
����
���
���!!�����
���������
� ������
!�!����� ��
��������
�� �����
���� ��� �����
��������
�� � ���
���������
����� �
��������� �
���������������
�������
�������� �
� ������
����� �����%��� ������������������ � ����������������� ���
Figure 2.9: Relative signatures of nine books by nine English authors on the back-ground of the base document of A Christmas Carol by C. Dickens, built on the profilesof 3-grams of the size of 500.
the other ones (its profile is most dissimilar).
In particular, there is a lot of n-grams very common in general in Mark Twain’s
writing (depicted in the bottom of the signatures) that are used with quite similar
frequency in all of these nine books with the exception of Adventures of Huckle-
berry Finn. By closer examination of the signatures one can determine what these
interesting n-grams are, and from which words they originate. These n-grams in-
clude, among others, “TION_” (#42) that is used much less often in Adventures of
Huckleberry Finn than in all other books and that comes mostly from the words
“attention”, “question”, “nation”, “condition”, “population”, etc. This can possibly be
interpreted as the less frequent usage of “formal” vocabulary in the book being a nar-
rative of a 13-year old Huckleberry Finn. Other interesting examples are the n-grams
“_WERE” and “WERE_” (#59, #60), which come mostly from the word “were” or
the n-grams “_BEEN” and “BEEN_” (#181, #182), which have their source most
frequently in the word “been”; these n-grams are used with a similar frequency in all
the books with the exception of Adventures of Huckleberry Finn where they appear
much less often. That suggests different grammar constructions used in the latter
book. Other stylistic choices characteristic for Adventures of Huckleberry Finn seem
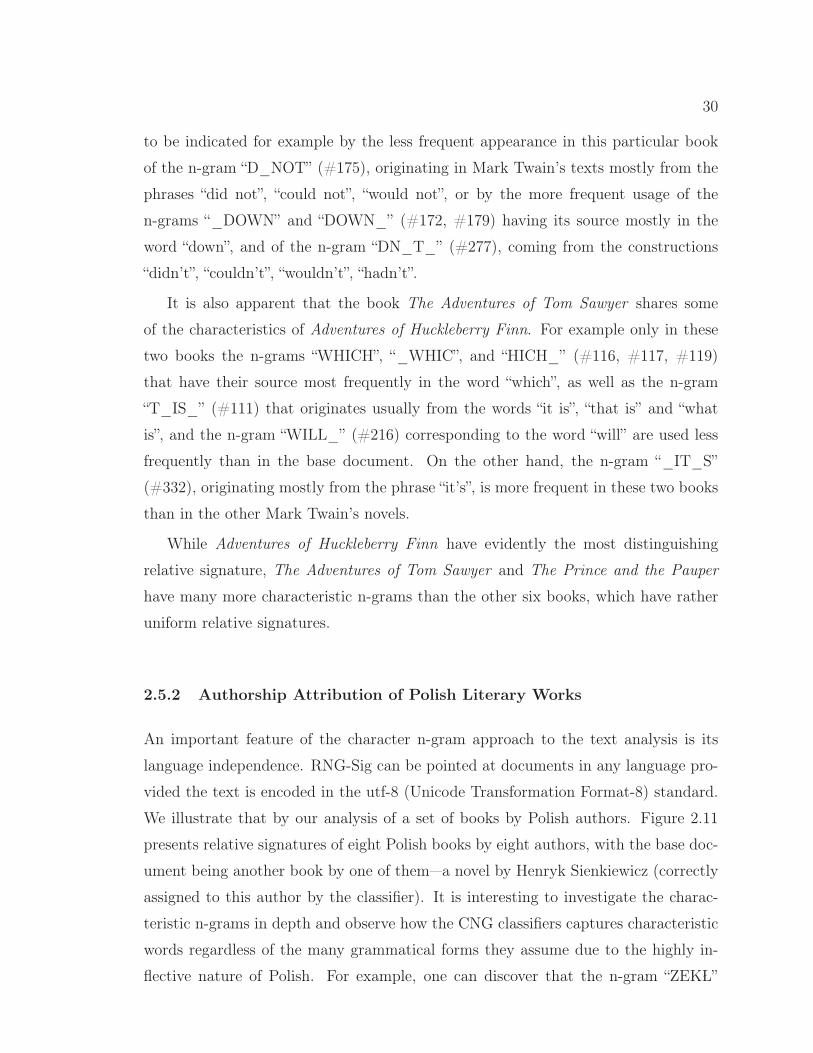
30
to be indicated for example by the less frequent appearance in this particular book
of the n-gram “D_NOT” (#175), originating in Mark Twain’s texts mostly from the
phrases “did not”, “could not”, “would not”, or by the more frequent usage of the
n-grams “_DOWN” and “DOWN_” (#172, #179) having its source mostly in the
word “down”, and of the n-gram “DN_T_” (#277), coming from the constructions
“didn’t”, “couldn’t”, “wouldn’t”, “hadn’t”.
It is also apparent that the book The Adventures of Tom Sawyer shares some
of the characteristics of Adventures of Huckleberry Finn. For example only in these
two books the n-grams “WHICH”, “_WHIC”, and “HICH_” (#116, #117, #119)
that have their source most frequently in the word “which”, as well as the n-gram
“T_IS_” (#111) that originates usually from the words “it is”, “that is” and “what
is”, and the n-gram “WILL_” (#216) corresponding to the word “will” are used less
frequently than in the base document. On the other hand, the n-gram “_IT_S”
(#332), originating mostly from the phrase “it’s”, is more frequent in these two books
than in the other Mark Twain’s novels.
While Adventures of Huckleberry Finn have evidently the most distinguishing
relative signature, The Adventures of Tom Sawyer and The Prince and the Pauper
have many more characteristic n-grams than the other six books, which have rather
uniform relative signatures.
2.5.2 Authorship Attribution of Polish Literary Works
An important feature of the character n-gram approach to the text analysis is its
language independence. RNG-Sig can be pointed at documents in any language pro-
vided the text is encoded in the utf-8 (Unicode Transformation Format-8) standard.
We illustrate that by our analysis of a set of books by Polish authors. Figure 2.11
presents relative signatures of eight Polish books by eight authors, with the base doc-
ument being another book by one of them—a novel by Henryk Sienkiewicz (correctly
assigned to this author by the classifier). It is interesting to investigate the charac-
teristic n-grams in depth and observe how the CNG classifiers captures characteristic
words regardless of the many grammatical forms they assume due to the highly in-
flective nature of Polish. For example, one can discover that the n-gram “ZEK�L”
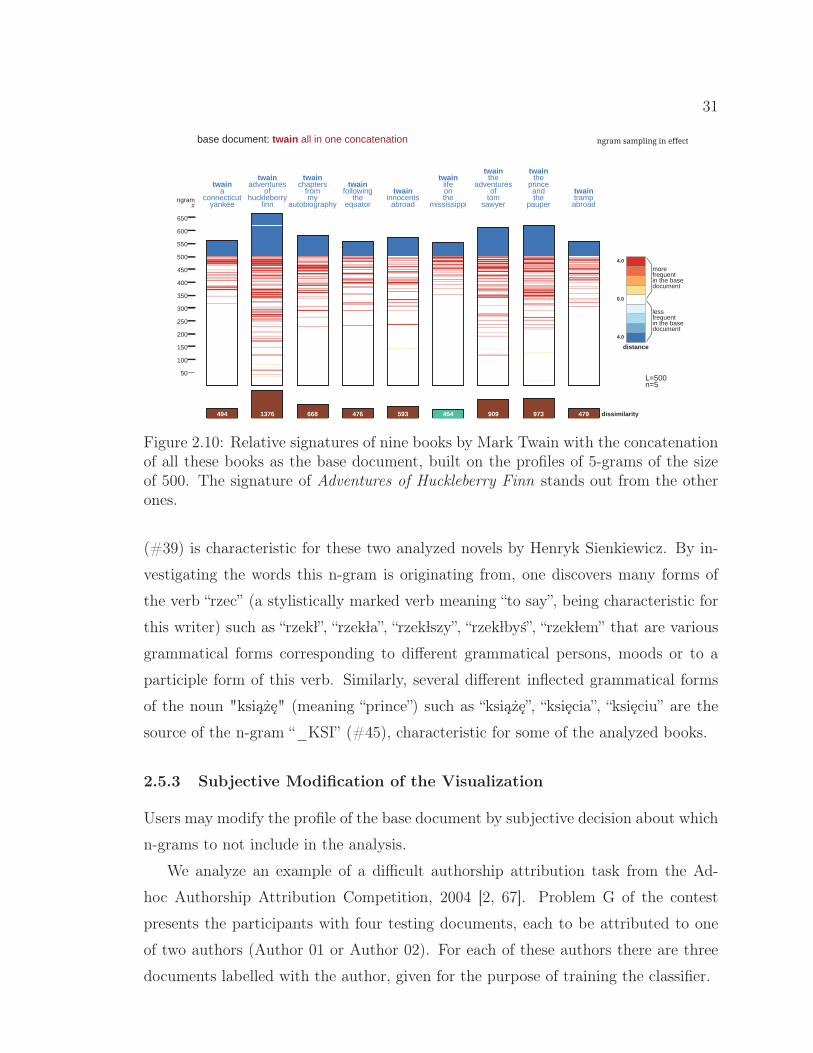
31
�����"�!���#��� ���� ��� ��� ��� ��� �� ��� ���
�
�
������������ ������������
������������ ������������
������
�������
�����
��
���
���
���
���
���
���
���
���
���
���
���
���
�����
������������
�����������
�� ����������
��
����� ����������
��������� �
������������
�������
���������������
��������� �
���������
���� �
�����������
������
���� �
������ �
����
�������������
����������������������������������� ����������������� ���
Figure 2.10: Relative signatures of nine books by Mark Twain with the concatenationof all these books as the base document, built on the profiles of 5-grams of the sizeof 500. The signature of Adventures of Huckleberry Finn stands out from the otherones.
(#39) is characteristic for these two analyzed novels by Henryk Sienkiewicz. By in-
vestigating the words this n-gram is originating from, one discovers many forms of
the verb “rzec” (a stylistically marked verb meaning “to say”, being characteristic for
this writer) such as “rzek�l”, “rzek�la”, “rzek�lszy”, “rzek�lbys”, “rzek�lem” that are various
grammatical forms corresponding to different grammatical persons, moods or to a
participle form of this verb. Similarly, several different inflected grammatical forms
of the noun "ksiaze" (meaning “prince”) such as “ksiaze”, “ksiecia”, “ksieciu” are the
source of the n-gram “_KSI” (#45), characteristic for some of the analyzed books.
2.5.3 Subjective Modification of the Visualization
Users may modify the profile of the base document by subjective decision about which
n-grams to not include in the analysis.
We analyze an example of a difficult authorship attribution task from the Ad-
hoc Authorship Attribution Competition, 2004 [2, 67]. Problem G of the contest
presents the participants with four testing documents, each to be attributed to one
of two authors (Author 01 or Author 02). For each of these authors there are three
documents labelled with the author, given for the purpose of training the classifier.
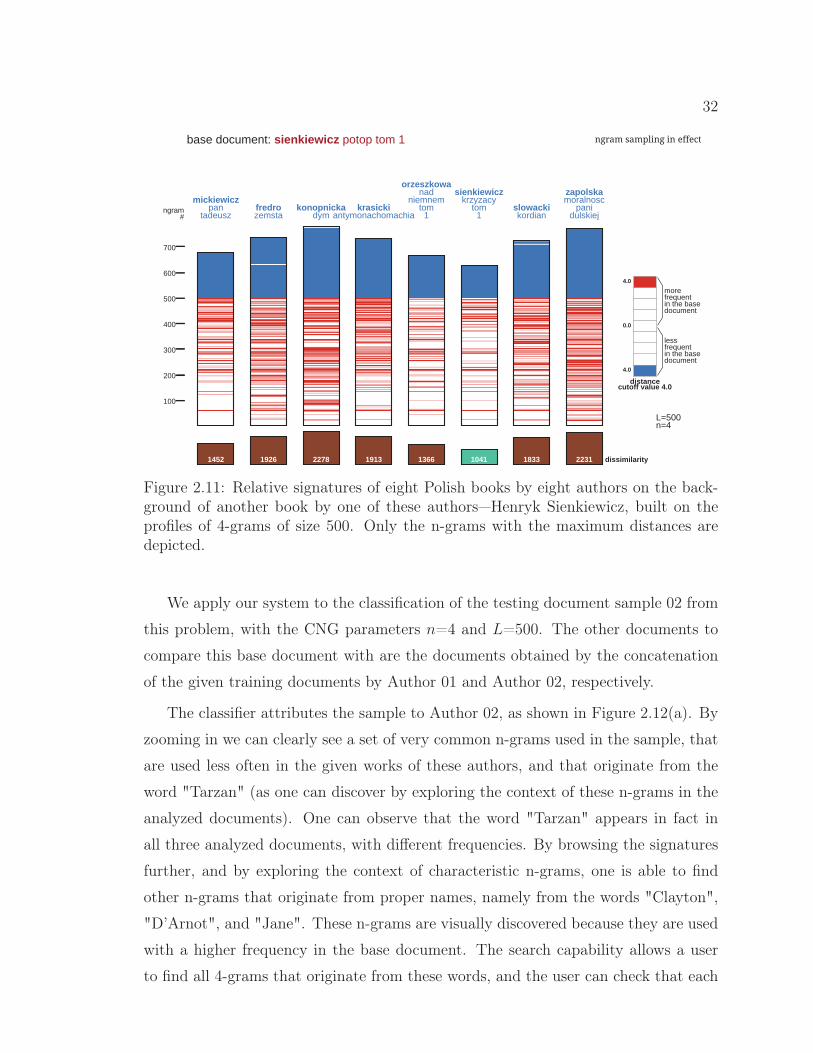
32
�����"�!���#$��� $��� ���� $�$� $��� $�$ $��� ���$
�������
�
��
�
��������������������� �!�"�����
�� ����������������� �!�"�����
������ ��������!� ��
������
���
���
#��
���
���
���
���
"���� ���� ��
������� ��������
���������� �
���������� �������������
��� ��������
�����������
�� ��� ����#�� ���
����
�!�����#������
���!����������
�����#���
�����������%��� ��� ����� ��� ������ ����������������� ���
Figure 2.11: Relative signatures of eight Polish books by eight authors on the back-ground of another book by one of these authors—Henryk Sienkiewicz, built on theprofiles of 4-grams of size 500. Only the n-grams with the maximum distances aredepicted.
We apply our system to the classification of the testing document sample 02 from
this problem, with the CNG parameters n=4 and L=500. The other documents to
compare this base document with are the documents obtained by the concatenation
of the given training documents by Author 01 and Author 02, respectively.
The classifier attributes the sample to Author 02, as shown in Figure 2.12(a). By
zooming in we can clearly see a set of very common n-grams used in the sample, that
are used less often in the given works of these authors, and that originate from the
word "Tarzan" (as one can discover by exploring the context of these n-grams in the
analyzed documents). One can observe that the word "Tarzan" appears in fact in
all three analyzed documents, with different frequencies. By browsing the signatures
further, and by exploring the context of characteristic n-grams, one is able to find
other n-grams that originate from proper names, namely from the words "Clayton",
"D’Arnot", and "Jane". These n-grams are visually discovered because they are used
with a higher frequency in the base document. The search capability allows a user
to find all 4-grams that originate from these words, and the user can check that each
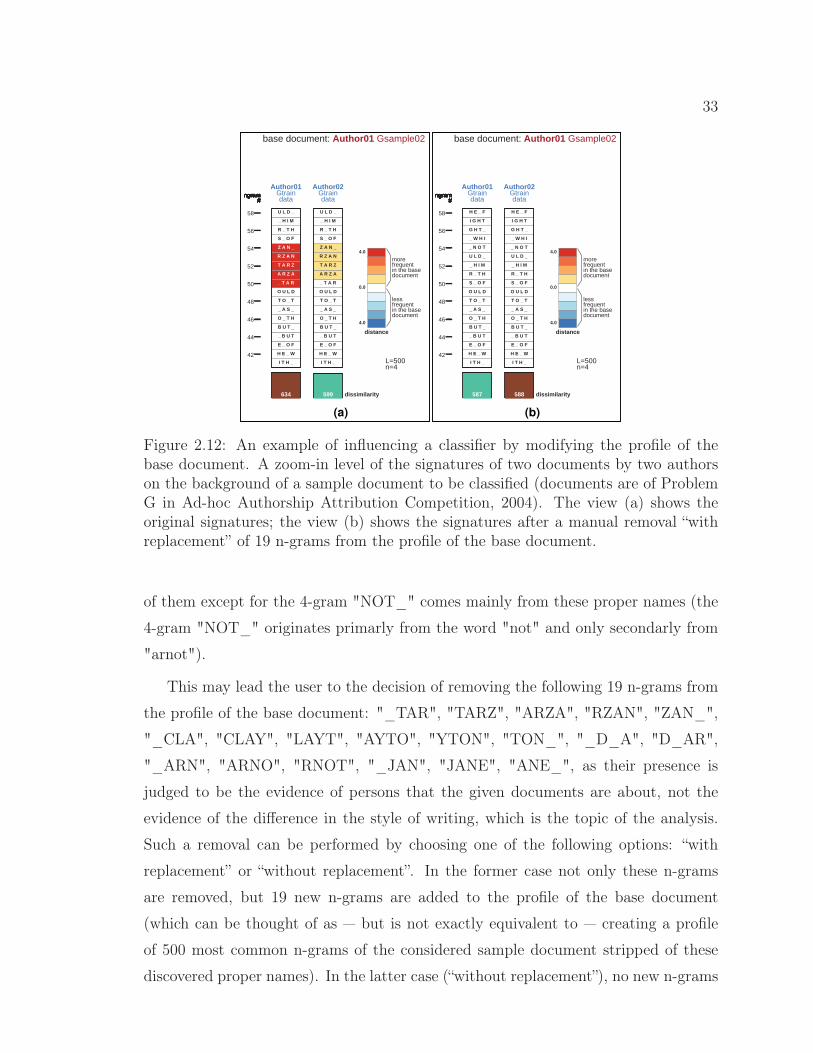
33
�����"�!���#�%& ���
&��
���
&��
������������ ������������
������������ ������������
�������
�������
�����
�������
�������
�����
�������
�������
������
�� ����
������
������
���� ��
�����
�� ����
���� ��
�� ����
�����
�������
������'
�������
(�)*��+�������
�������
�������
�����
�������
�������
������
�� ����
������
������
���� ��
�����
�� ����
���� ��
�� ����
�����
�������
������'
�������
(�)*��,�������
�����
�����
�����
�����
�����
�����
�����
�����
�����
�����
�����
�����
�����
�����
��
�����
��
��
��
��
�����
��
��
��
��
������������� (�)*��+����� ����
�����"�!���#��� ���
���
���
���
������������ ������������
������������ ������������
������
�������
�����
�������
�������
������
������
������
�������
���� ��
�������
�������
�����
�������
�������
�������
�������
�������
�������
�������
������
���������������
�������
�������
������
������
������
�������
���� ��
�������
�������
�����
�������
�������
�������
�������
�������
�������
�������
������
���������������
�����
�����
�����
�����
�����
�����
�����
�����
�����
�����
�����
�����
��
�����
��
��
��
��
�����
��
��
��
��
�������������������������� ����
(a) (b)
Figure 2.12: An example of influencing a classifier by modifying the profile of thebase document. A zoom-in level of the signatures of two documents by two authorson the background of a sample document to be classified (documents are of ProblemG in Ad-hoc Authorship Attribution Competition, 2004). The view (a) shows theoriginal signatures; the view (b) shows the signatures after a manual removal “withreplacement” of 19 n-grams from the profile of the base document.
of them except for the 4-gram "NOT_" comes mainly from these proper names (the
4-gram "NOT_" originates primarly from the word "not" and only secondarly from
"arnot").
This may lead the user to the decision of removing the following 19 n-grams from
the profile of the base document: "_TAR", "TARZ", "ARZA", "RZAN", "ZAN_",
"_CLA", "CLAY", "LAYT", "AYTO", "YTON", "TON_", "_D_A", "D_AR",
"_ARN", "ARNO", "RNOT", "_JAN", "JANE", "ANE_", as their presence is
judged to be the evidence of persons that the given documents are about, not the
evidence of the difference in the style of writing, which is the topic of the analysis.
Such a removal can be performed by choosing one of the following options: “with
replacement” or “without replacement”. In the former case not only these n-grams
are removed, but 19 new n-grams are added to the profile of the base document
(which can be thought of as — but is not exactly equivalent to — creating a profile
of 500 most common n-grams of the considered sample document stripped of these
discovered proper names). In the latter case (“without replacement”), no new n-grams
34
are added to the base document profile (and only ignoring of the n-grams that differ
in their distances in both signatures can affect the classifier result). The removal of
the 19 n-grams “with replacement” is illustrated in Figure 2.12(b): after re-running
the analysis, the bottom part of the signatures is cleared of some red stripes (red
indicating that the n-grams are used more often in the base document) while the
classification result changes: the sample document is now attributed to Author 01
(with a small difference in the dissimilarity value: 587 vs 588). (Using the “without
replacement” option leads to the same reversal of the classification result.)
This modified result is in fact the correct one: the test document 02 is a sample
of Author 01 (the writings of Author 01 and Author 02 being respectively the early
(pre-1914) and late (post-1920) writings of Edgar Rice Burrows [67]).
The method of modifying the profile of the base document based on a particular,
task-dependent interest of a user is of a general use for visual analysis of the charac-
teristics of documents (it can serve the purpose of removing from the visualization the
elements deemed to be not useful or misleading in order to concentrate one’s atten-
tion on other characteristics). As a method to modify the result of the classification
algorithm it may be limited to such specific (and difficult) cases. This process might
increase the trust of expert users in the decision of the classifier, because it allows
them to eliminate at least some input to the decision from features that are in the
users’ opinion not relevant to the task.
2.6 Conclusions
We presented Relative N-Gram Signatures (RNG-Sig), a visual text analytics system
based on the Common N-Gram (CNG) classifier. The system enables users to gain
insight into characteristic n-grams of given documents (relative to other documents)
as well as to visually analyze the classifier algorithm. It also allows to influence the
classification process by a user based on the insight gained from the visualization.
We have demonstrated how this analysis can be performed by using a set of English
literary works and with the analytical task of analyzing authorship style. The lan-
guage independence of the method is demonstrated by using a set of Polish books
in a similar analysis. No specific language knowledge is used. An illustration of a
specific advantage of using character n-grams—a robustness in the context of a highly
35
inflective language, such as Polish—was presented.
The novelty of our visualizations and interactions lies mostly in their being crafted
so that they suit the level of character n-grams. Character n-grams are very pow-
erful features especially for stylistic analysis, but they are difficult to interpret by
humans; we proposed new methods to help to make their frequency differences more
meaningful.
The presented visualization tool is made available online2 by using JavaScript
library d3.js, and it is platform independent, relying only on availability of a recent
version of a Web browser.
2.7 Possible Extensions
Modification of the CNG-based methods and visual analysis to another — and more
difficult — author identification task, namely to the authorship verification, is an
interesting extension of our system. In this task there is no fixed set of candidate
authors, but instead one is given just a set of samples of writing of an author and is
to decide whether another document was written by the same author or not.
There is also a number of possible additions to the current system that can be
made. The function of the distance between profiles with respect to a given n-gram
that is currently used (Equation 2.1) is one of many that can be tested in this context
(some already proposed in the literature [141], [47]). It would be of interest to compare
different distance functions (with the selection being available for the system users)
with respect to both the correctness of the classifier (for example for the authorship
attribution problem) and the effect on the visualization.
Another possible extension would be to to investigate ways of improving the ca-
pability of analyzing long signatures. In the case of other distance functions it may
be possible to add an “overview mode” of a visual relative signature, namely a plot
of a signature with only some fixed number of the most distinguishing n-grams (the
n-grams with the highest distance) depicted, which would help to analyze longer pro-
files. For the currently used distance formula this mode does not limit the number of
depicted n-grams significantly, as all of the quite numerous n-grams that appear only
2The system with preloaded data is available at https://web.cs.dal.ca/~jankowsk/ngram_signatures/
36
in one profile bear the same, maximum value of the distance.
Further research on the ways of selecting the n-grams for profiles is another di-
rection worth exploring. Comparing frequencies of n-grams across documents during
the stage of building a profile (by use of some statistics as χ2 or G) is one possi-
bility; selection of variable length n-grams is another. Yet another approach worth
investigating is to differentiate between n-grams that come from different parts of
speech.
Our visualization method relies on frequencies of n-grams in text documents.
It would be interesting to investigate ways of including a context of character n-
grams within a document into the analysis. It could be done through considering
co-occurrences of character n-grams in the same neighbourhood in an analized text.
Such relationships have been used in authorship analysis for a different type of features
- namely for function words, that is very frequent words such as “the”, “and”, “for”,
which carry little content but have mostly syntactic purpose [13, 126]. For character
n-grams, distances between n-grams have been used in representing text documents
through the “n-gram graph” model proposed by Giannakopoulos et al. [51] and used
for evaluation of summarizing systems [51] and sentiment analysis [10]. Visualization
of such context-related relationships between n-grams could involve methods based
on graphs (e.g., node-link visualizations) or matrices (e.g., heat maps).
Applications of the system to other classification tasks would be worth exploring.
A problem of authorship attribution of parts of a document could be used to analyze
or detect a collaboration between authors. It would also be of interest to employ our
tool for the task of sentiment analysis, for which character n-grams, though not being
commonly used as features, have been previously utilized [8, 10].
Chapter 3
Author Verification Using Common N-Gram Profiles of Text
Documents
3.1 Introduction
In the previous chapter we described a visual system based on the Common N-Gram
classifier [75] — a classifier proposed for the problem of authorship attribution. The
problem of authorship attribution requires a finite set of candidate authors for which
we are given samples of writings; the task consists of attributing a considered text
to one of these candidates. In this chapter we describe our approach to a more
difficult problem of authorship analysis, namely of deciding whether or not a con-
sidered document was written by a person, given samples of writing of that person.
This problem is called authorship verification. The problem is often considered to
better reflect real-life problems related to authorship detection than the authorship
attribution problem, in that it allows a situation when the real author is not among
considered candidates [85]. One can also notice that any instance of authorship at-
tribution problem can be formulated as a set of authorship verification problems, one
for each of the candidates, so an authorship verification solution can also be applied
to authorship attribution problem.
The Common N-Gram classifier, which is the basis of our visual analytical system
RNG-Sig, described in the previous chapter, is a similarity based classifier based on
the CNG dissimilarity between text documents. In tackling the authorship verification
problem, we also utilize the CNG dissimilarity between documents, though relying
not only on character n-grams but also on word n-grams.
We describe our one-class proximity based classification method for authorship
verification. It is an intrinsic method, i.e., it requires only the data of a problem
instance, without acquiring external samples of other authors’ writing. Our algorithm
utilizes the pairs of most distinct documents within the set of documents of known
37
38
authorship.
We evaluate our approach on the multilingual dataset of the Author Identification
competition task of PAN 2013 (Evaluation Lab on Uncovering Plagiarism, Author-
ship, and Social Software Misuse) [70]. A version of our method submitted to the
competition yielded ranking 5th (shared) of 18 according to the accuracy, and was
a winner in the secondary evaluation by the AUC (area under the receiver operat-
ing characteristic curve) of the ordering of instances by the confidence score. In the
ensemble mode our methods leads to competitive results both with respect to the
accuracy and AUC.
We also describe the results of our participation in another competition of au-
thorship verification of PAN 2014 [135]. These results as well as our analysis of the
dependency of our method on the number of documents in the set of writing samples
of known authorship, indicate that our method is best suited to problems with at
least a few (not one or two) documents of known authorship.
The content of this chapter is based extensively on our publications [65, 63, 64].
3.2 Related Work
The author analysis has been studied extensively in the context of the authorship
attribution problem, in which there is a small set of candidate authors out of which
the author of a questioned document is to be selected. There are several papers
[132, 67, 83] presenting excellent surveys of this area.
The two main categories [132] of solutions for the problem of authorship attri-
bution are similarity based approaches and eager learner approaches. In the former
ones, the classification is performed by a lazy learner in a Nearest Neighbour scheme,
attributing the analyzed text to the author whose writing is most similar according
to some measure. In the latter approaches, each document is treated as a data sam-
ple within a class of an author, and a supervised classifier creates a model of that
training data to be used during classification. Several features to capture stylistic
differences have been proposed. Their types include those based on words (all words,
function words/stop words, most common words, as well as word counts in sentences
or documents, word lengths, measures of vocabulary richness, word n-grams), those
based on characters (character n-grams, special characters like punctuation or digits,
39
compression measures), syntactic features based on parts of speech, sentence struc-
tures, etc, semantic features based for example on synonyms, and others (extensive
survey of the features can be found in [132, 83]).
More limited research than on authorship attribution has been performed on an
open-set variant on this problem, in which it is possible that none of the candidate
authors wrote a document in question, with authorship verification being the extreme
case of an open-set problem with only one candidate. The authorship verification
has been first discussed by Stamatatos et al. [136], who proposed a method based
on features extracted from an NLP tool, using regression to produce the response
function for a given author to which a threshold is applied. This approach falls into
the category of intrinsic methods [70]; it uses only the documents present in a given
problem.
Another example of an intrinsic method for authorship verification is the “un-
masking method” by Koppel and Schler [82]. Very successful for novel-length texts, it
has been shown less effective for shorter documents [119]. The ensemble of one-class
classifiers [56], which achieved high accuracy at the PAN 2013 Author Identification
competition, is also an example of such an intrinsic method. It varies from our ap-
proach by using a different scheme of creating the dissimilarity between an unknown
document and the known authorship set of texts, based on the Nearest Neighbour
technique [138], as well as by a different distance measure and features used.
Another way of approaching the author verification problem is to cast it into a
binary or multi-class classification, by creating a class or classes of other authors.
Such approaches can be called extrinsic methods [70]: they use material other than
present in a given problem. Luyckx and Daelemans [90] considered a binary clas-
sification, with negative examples created from all available text by other authors
in their dataset. The “imposters” method by Koppel and Winter [87] automatically
generates a very large set of texts by authors who did not write the questioned doc-
ument, to transform the problem into an open-set author attribution problem with
many candidates, handled by an ensemble-based similarity method [84]. A modified
version of the imposters method by Seidman [127] achieved first ranking in the PAN
2013 Authorship Identification competition [70], and another modified version of the
imposters method by Khonji and Iraqi [76] achieved first ranking in the PAN 2014
40
Authorship Identification competition [135]. The method [143], which achieved the
highest accuracy on the English set in PAN 2013 competition, is also of such an ex-
trinsic type; its first step is a careful selection of online documents similar to the
ones in the problems. The method [50] of PAN 2013 competition, which produces
competitive ordering of verification instances, uses a weighted k-NN approach using
classes of other authors created from other verification instances.
3.3 Methodology
The formulation of the authorship verification task for the Author Identification Task
at PAN 2013 is the following: “Given a set of documents (no more than 10, possibly
only one) by the same author, is an additional (out-of-set) document also by that
author?” [70].
We approach this task with an algorithm based on the idea of proximity based
methods for one-class classification. In a one-class classification framework, an object
is classified as belonging or not belonging to a target class, while only sample examples
of objects from the target class are available during the training phase. Our method
resembles the idea of the k-centers algorithm for one-class classification [148, 138],
with k being equal to the number of all training documents in the target set (i.e.,
written by the given author). The k-centers algorithm is suitable for cases when there
are many data points from the target class; it uses equal radius sphere boundaries
around the target data points and compares the sample document to the closest such
centre. We propose a different classification condition, described below, utilizing the
pairs of most dissimilar documents within the set of known documents.
Let A = {d1, ..., dk}, k ≥ 2, be the input set of documents written by a given
author, which we will call known documents. Let u be the input sample document,
of which the authorship we are to verify, that is return the answer “Yes” or ”No” to
the posed question whether it was written by the given author.
Our algorithm calculates for each known document di, i = 1, 2, ..., k, the maximum
dissimilarity between this document and all other known documents: Dmax(di, A), as
well as the dissimilarity between this document and the sample document u: D(di, u),
41
and finally the dissimilarity ratio defined as follows:
r(di, u, A) =D(di, u)
Dmax(di, A). (3.1)
Thus r(di, u, A) < 1 means that there exists a known document more dissimilar to di
than u, while r(di, u, A) > 1 means that all the known documents are more similar
to di than u.
The average M(u,A) of the dissimilarity ratio over all known documents d1, d2, ..., dkfrom A:
M(u,A) =
∑ki=1 r(di, u, A)
k, (3.2)
is the subject of the thresholding: the sample u is classified as written by the same
person as the known documents if and only if M(u,A) is at most equal to a selected
threshold θ.
Our method requires two known documents, and if only one known document is
provided, we split it in half and treat these two chunks as two known documents.
Notice that in this framework the dissimilarity between the documents does not
need to be a metric distance, i.e., it does not need to fulfill the triangle inequality (as
is the case for the dissimilarity measure we choose).
For the dissimilarity measure between documents we use the Common N-Gram
(CNG) dissimilarity; proposed by Keselj et al. [75] and described in detail in Section
2.2. This dissimilarity (or its variants) used in the Nearest Neighbour classification
scheme (Common N-gram classifier) was successfully applied to authorship classifi-
cation tasks [75, 67, 130]. The CNG dissimilarity is based on the differences in the
usage frequencies of the most common n-grams of tokens (usually characters, but
possibly other tokens) of the documents. Each document is represented by a profile:
a sequence of the most common n-grams, coupled with their frequencies (normalized
by the length of the document). The parameters of the dissimilarity are the length
of the n-grams n and the length of the profile L. The Perl package Text::Ngrams [74]
was used to extract the n-grams and their frequencies.
We experiment with two ways of selecting the length of the profiles. In the
dynamic-length variant, the length of profiles is selected separately for each problem,
based on the number of n-grams in the documents in the given instance (parameter-
ized as a fraction f of all n-grams of the document that contains the least number
42
of them). In the fixed-length variant, we use a selected fixed length L of profiles.
As our method is based on the ratios of dissimilarities between documents, we take
care that the documents in a given problem are always represented by profiles of the
same length. Thus in a situation when some of the documents do not have enough
n-grams to construct a profile of a prescribed length L, we cut all profiles to the same
length, which is the number of all n-grams (for the given n) in the document with
the smallest number of them.
We linearly scale the measure M to represent it as a confidence score in the range
from 0 (the highest confidence in the answer “No” ) to 1 (the highest confidence in
the answer “Yes”), with the answer “Yes” given if and only if the confidence score is at
least 0.5. It is the nature of applications of authorship verification, such as forensics,
that makes the confidence score and not only the binary answer, an important aspect
of a solution [53]. The value of M equal to θ is transformed to the score 0.5, values
greater than θ to the scores between 0 and 0.5, and values less than θ to the scores
between 0.5 and 1 (a cutoff is applied, , i.e., all values of M(u,A) < θ − cutoff are
mapped to the score 1, and all values of M(u,A) > θ+cutoff are mapped to the score
0).
For a one-class classifier we need to select two parameters defining the features used
for dissimilarity (length of the n-grams n, and either the fixed length L of a profile,
or the fraction f defining the profile length), and the parameter θ (for classifying by
thresholding the average dissimilarity ratio M).
Combining many such one-class classifiers, each using different combination of
features defining parameters, into one ensemble, allows us to remove or mitigate
the parameter tuning. We test ensembles of single one-class classifiers based on our
method; an ensemble combines answers of the single classifiers. Each classifier uses a
different combination of parameters n and L defining the features. For ensembles we
experiment not only with n-grams of characters (utf8-encoded) and but also of words
(converted to uppercase).
For ensembles, we test majority voting and voting weighted by the confidence
scores of single classifiers. For each ensemble we combine answers of the classifiers
in order to obtain the confidence score of the ensemble. For majority voting the
confidence score of the ensemble is the ratio of the number of classifiers that output
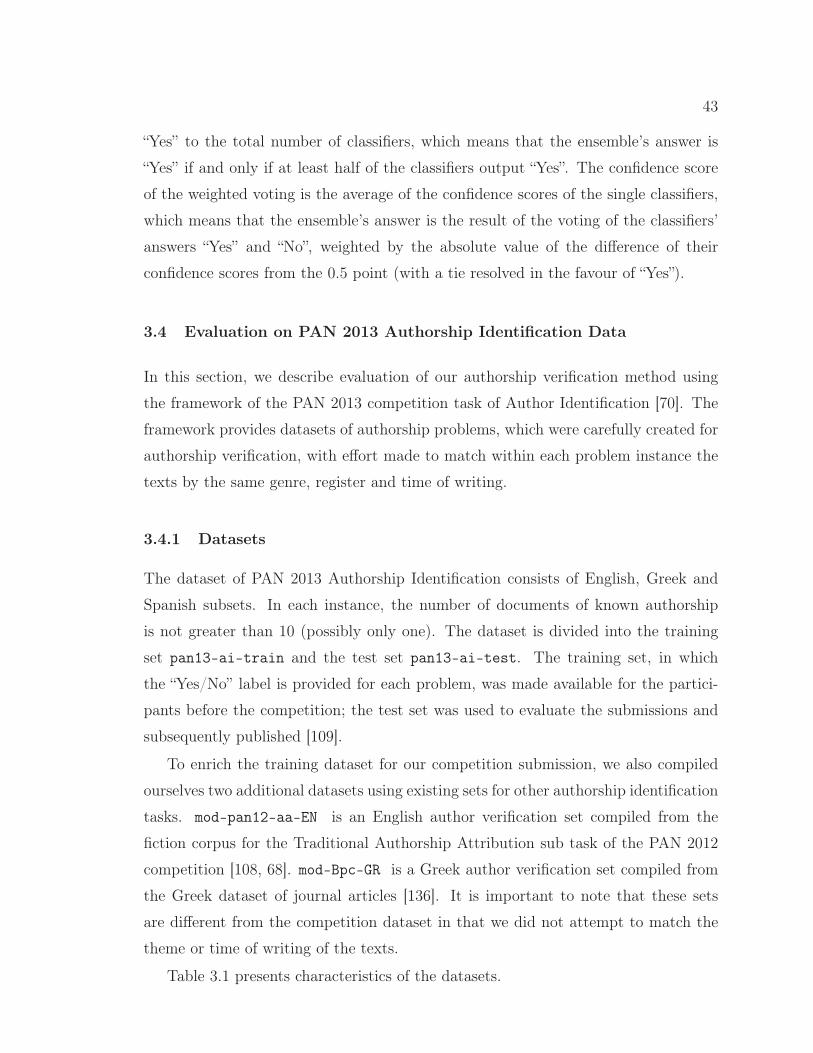
43
“Yes” to the total number of classifiers, which means that the ensemble’s answer is
“Yes” if and only if at least half of the classifiers output “Yes”. The confidence score
of the weighted voting is the average of the confidence scores of the single classifiers,
which means that the ensemble’s answer is the result of the voting of the classifiers’
answers “Yes” and “No”, weighted by the absolute value of the difference of their
confidence scores from the 0.5 point (with a tie resolved in the favour of “Yes”).
3.4 Evaluation on PAN 2013 Authorship Identification Data
In this section, we describe evaluation of our authorship verification method using
the framework of the PAN 2013 competition task of Author Identification [70]. The
framework provides datasets of authorship problems, which were carefully created for
authorship verification, with effort made to match within each problem instance the
texts by the same genre, register and time of writing.
3.4.1 Datasets
The dataset of PAN 2013 Authorship Identification consists of English, Greek and
Spanish subsets. In each instance, the number of documents of known authorship
is not greater than 10 (possibly only one). The dataset is divided into the training
set pan13-ai-train and the test set pan13-ai-test. The training set, in which
the “Yes/No” label is provided for each problem, was made available for the partici-
pants before the competition; the test set was used to evaluate the submissions and
subsequently published [109].
To enrich the training dataset for our competition submission, we also compiled
ourselves two additional datasets using existing sets for other authorship identification
tasks. mod-pan12-aa-EN is an English author verification set compiled from the
fiction corpus for the Traditional Authorship Attribution sub task of the PAN 2012
competition [108, 68]. mod-Bpc-GR is a Greek author verification set compiled from
the Greek dataset of journal articles [136]. It is important to note that these sets
are different from the competition dataset in that we did not attempt to match the
theme or time of writing of the texts.
Table 3.1 presents characteristics of the datasets.
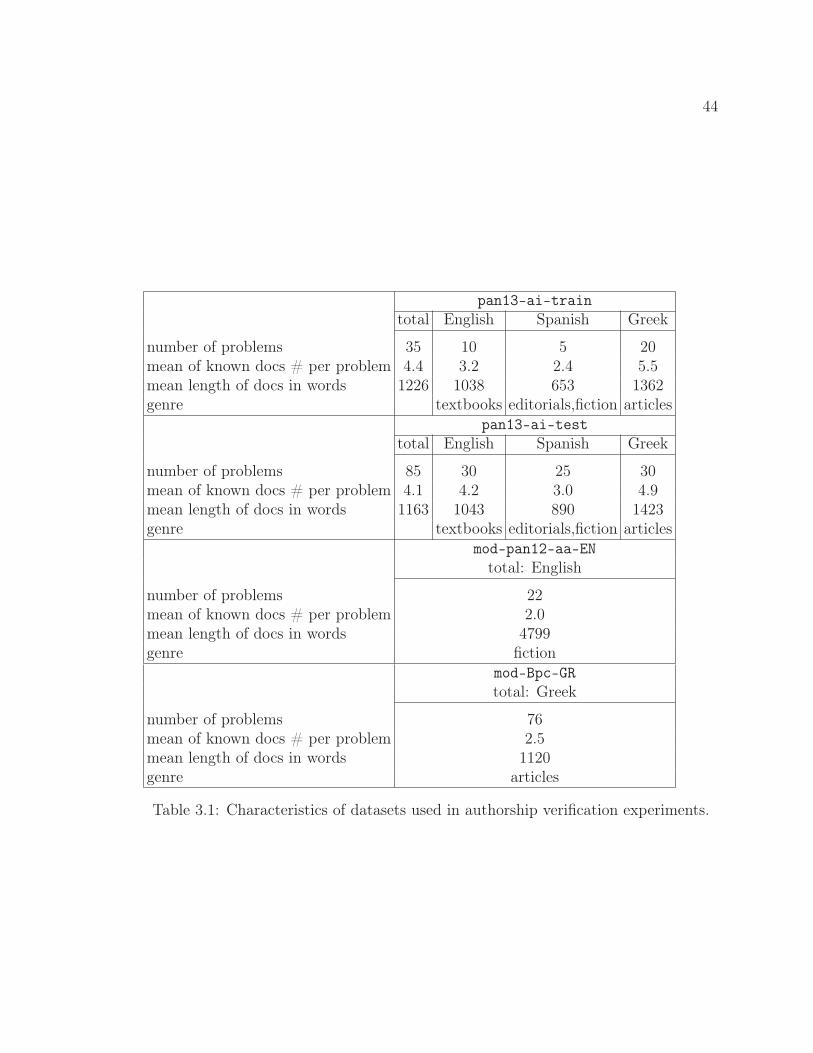
44
pan13-ai-traintotal English Spanish Greek
number of problems 35 10 5 20mean of known docs # per problem 4.4 3.2 2.4 5.5mean length of docs in words 1226 1038 653 1362genre textbooks editorials,fiction articles
pan13-ai-testtotal English Spanish Greek
number of problems 85 30 25 30mean of known docs # per problem 4.1 4.2 3.0 4.9mean length of docs in words 1163 1043 890 1423genre textbooks editorials,fiction articles
mod-pan12-aa-ENtotal: English
number of problems 22mean of known docs # per problem 2.0mean length of docs in words 4799genre fiction
mod-Bpc-GRtotal: Greek
number of problems 76mean of known docs # per problem 2.5mean length of docs in words 1120genre articles
Table 3.1: Characteristics of datasets used in authorship verification experiments.
45
3.4.2 Evaluation Measures
In our experiments we use two measures of evaluation, based on the measures proposed
for the PAN 2013 competition.
The correctness of a classifier is evaluated by accuracy, which is defined by the
following formula:
accuracy =nc
n, (3.3)
where n is the total number of problems and nc is the number of correctly answered
problems.
For our method, accuracy is equivalent to the measure that was used in the com-
petition for the main evaluation. The competition main evaluation measure takes
into account the fact, that it was allowed to withdraw an answer (to leave a problem
unanswered). It is based on measures called recall (R′) and precision (P ′), which are
defined as follows:
R′ =nc
n(3.4)
P ′ =nc
na
, (3.5)
where n is the total number of problems, nc is the number of correctly answered
problems, and na is the number of answered problems. These measures are different
from the standard notions of recall and precision as evaluation measures for classi-
fiers; we use the prime symbol ′ to differentiate them from typically defined recall
and precision. Notice that the recall for a binary classifier, with respect to the “Yes”
class, would be typically defined as a fraction of all problems that have the “Yes” label
according to the ground truth that were answered correctly by a classifier (and ana-
logically for the “No” class), while R′ is a fraction of all problems that were answered
correctly by a classifier. In a similar way, the precision for a binary classifier, with
respect to the “Yes” class, would be typically defined as a fraction of all problems
answered “Yes” by a classifier that were answered correctly (and analogically for the
“No” class), while P ′ is a fraction of all problems answered by a classifier that were
answered correctly. The main evaluation measure of the competition, called F ′1, is
the harmonic mean of precision and recall defined above:
F ′1 = 2 · P ′ ·R′
P ′ +R′ . (3.6)
46
For any method that, as our method, provides the answer “Yes” or “No” for all problem
instances, the accuracy and F ′1 are equivalent (and also equivalent to P ′ and R′).
The ranking of instances according to the confidence scores produced by a method
is evaluated using AUC: area under the receiver operating characteristic (ROC) curve.
A confidence score indicates the confidence of the “Yes” answer (asserting the author-
ship).
A ROC curve of a classifier is a curve on a plot of true positive rate (a fraction of
positive problems that are answered correctly) versus false negative rate (a fraction of
negative problems that are answered incorrectly) for a given value of some parameter
of the classifier, as this parameter changes. AUC is the area under this curve.
AUC can be used for an evaluation of an ordering of instances according to a
produced score, with respect to ground truth binary labels of the instances, and that
is how we use it. Given scores assigned to problems by a method, the ROC curve that
is created, is the ROC curve of a classifier that assigns the “Yes” label to a problem if
and only if the problem has a score above a given threshold, as the threshold changes
from the minimum score to the maximum score. Notice that AUC used in such a way
for an authorship verification method, depends only on confidence scores produced
by the method, not on “Yes/No” labels that the method assigns to problems.
The AUC measure as an evaluation of scoring has an important statistical inter-
pretation: its value is equal to the probability that for a randomly selected pair of a
positive instance and a negative instance, the score assigned to the positive instance
is higher than the score of the negative instance [43].
3.4.3 Classifier Selection
Table 3.2 reports the considered space for feature defining parameters. On a training
set, for a given combination of feature defining parameters (n,L) or (n,f), we use the
accuracy at the optimal threshold (a threshold θ that maximizes the accuracy), as a
measure of performance for these parameters.
For single character n-gram classifiers, we tuned the parameters for each language
separately on training data, by selecting feature defining parameters based on their
performance, and selecting the thresholds to correspond to the optimal thresholds.
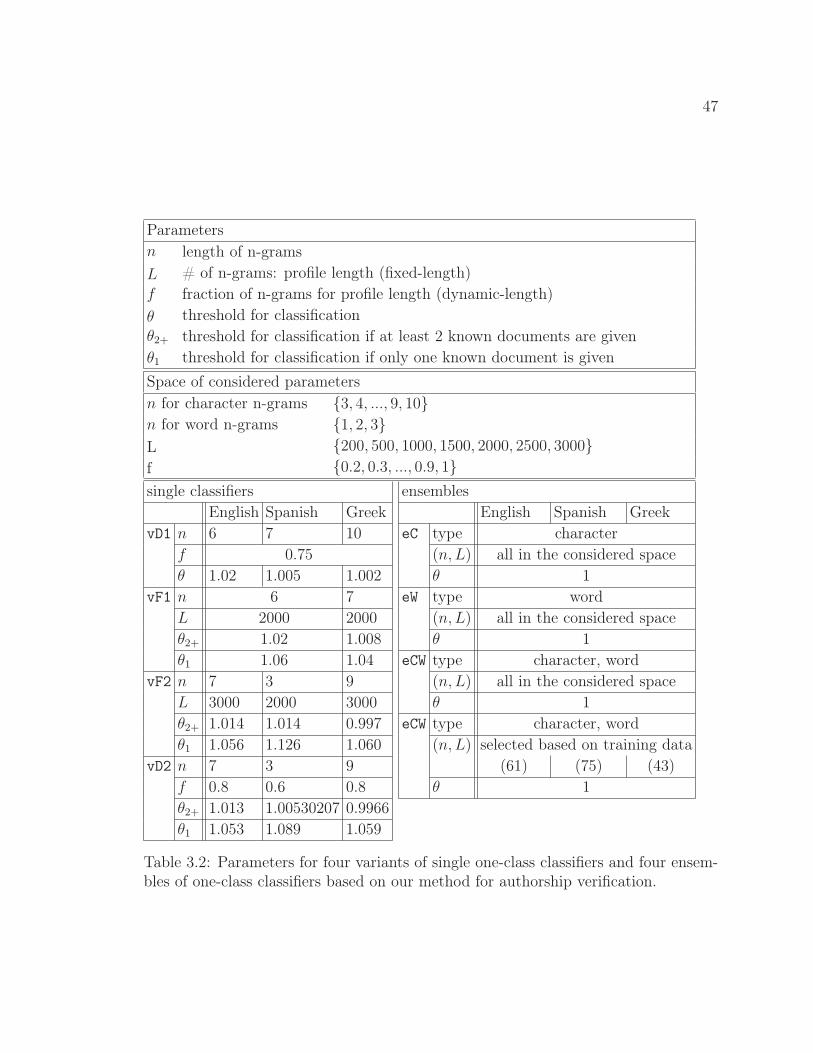
47
Parametersn length of n-gramsL # of n-grams: profile length (fixed-length)f fraction of n-grams for profile length (dynamic-length)θ threshold for classificationθ2+ threshold for classification if at least 2 known documents are givenθ1 threshold for classification if only one known document is givenSpace of considered parametersn for character n-grams {3, 4, ..., 9, 10}n for word n-grams {1, 2, 3}L {200, 500, 1000, 1500, 2000, 2500, 3000}f {0.2, 0.3, ..., 0.9, 1}single classifiers ensembles
English Spanish Greek English Spanish GreekvD1 n 6 7 10 eC type character
f 0.75 (n, L) all in the considered spaceθ 1.02 1.005 1.002 θ 1
vF1 n 6 7 eW type wordL 2000 2000 (n, L) all in the considered spaceθ2+ 1.02 1.008 θ 1θ1 1.06 1.04 eCW type character, word
vF2 n 7 3 9 (n, L) all in the considered spaceL 3000 2000 3000 θ 1θ2+ 1.014 1.014 0.997 eCW type character, wordθ1 1.056 1.126 1.060 (n, L) selected based on training data
vD2 n 7 3 9 (61) (75) (43)f 0.8 0.6 0.8 θ 1θ2+ 1.013 1.00530207 0.9966θ1 1.053 1.089 1.059
Table 3.2: Parameters for four variants of single one-class classifiers and four ensem-bles of one-class classifiers based on our method for authorship verification.
48
Table 3.2 reports the parameters of four variants of single classifiers. We include our
two submissions to the PAN 2013 Authorship Identification competition: the final
submission vF1 and the preliminary submission vD1. The other two classifiers were
tuned and tested after the competition.
Our preliminary submission vD1 (Table 3.2) is tuned on pan13-ai-train, with f
chosen ad-hoc. This is the only classifier among the reported variants that does not
use a preprocessing of truncation of all documents in a given problem instance to the
length of the shortest document, which tend to increase the accuracy for cases of a
significant difference in the length of documents.
For tuning of parameters of the final submission vF1 (Table 3.2) we use not only
pan13-ai-train, but also additional training sets mod-pan12-aa-EN and mod-Bpc-GR.
We also introduce two threshold values: one for cases when there are at least two
known documents, and another one for the cases when there is only one known doc-
ument (which has to be divided in two). The intuition behind this double threshold
approach is that when there is only one known document, the two halves of it can
be more similar to each other than in other cases. After the parameters are selected
based on subsets of training sets with only these problems that contain at least two
known documents, the additional threshold is selected based on the optimal threshold
on a modified “1-only” training set, from the problem of which all known documents
except of a random single one is removed. For Spanish, with only three training
instances with more than one known document, we use the same parameters as for
English.
For tuning of vF2 and vD2 (Table 3.2) we use only competition training data,
without the additional corpora used for vF1. Feature parameters are selected based
on the performance on the subsets containing at least two known documents, and on
the “1-only” modified sets (which allows us to use the Spanish training set for tuning
the Spanish classifiers).
The ensembles are summarized in Table 3.2. In all these ensembles, the threshold
of each classifier is set to 1, which is a natural choice, as it corresponds to checking
whether or not the unknown document is (on average) less similar to each given
known document than the author’s document that is most dissimilar to this given
known document.
49
The ensemble eC is of all character n-gram classifiers in our space of considered
parameters n and L; eW is of all word n-gram classifiers; eCW is of all classifiers of
eC and eW. These ensembles do not use any training data. We also create a classifier
eCW_sel (Table 3.2), which is a subset of the classifiers of eCW, selected based on the
performance of the single classifiers on the training data of the competition. For each
language separately, we remove classifiers that on the training data achieved lowest
accuracies at their respective optimal thresholds, while keeping at least half of the
character based classifiers and at least half of the word based classifiers.
3.4.4 Results
The accuracy and AUC values achieved by the variants of our method on the PAN
2013 Author Identification test dataset are presented in Table 3.3. The table states
also the best PAN 2013 competition results of other participants1 (that is the results
of these participants that achieved the highest accuracy or AUC on any (sub)set).
There were 17 other participants for which there are accuracy (or F ′1) results, 9 of
which submitted also confidence scores evaluated by AUC.
All variants of our method perform better on the English and Spanish subset
than on the Greek one, both in terms of the accuracy and in terms of AUC. On the
Greek subset they are all outperformed by other competition participant(s). This is
most likely due to the fact that the Greek subset was created in a way that makes it
especially difficult for algorithms that are based on CNG character-based dissimilarity
[70], by using a variant of CNG dissimilarity for the character 3-grams in order to
select difficult cases. This particularity of the set may also be the reason why the
ensemble eC of character n-gram classifiers performed worse than other methods on
this set.
The variants of our method are competitive in terms of AUC. During the compe-
tition, our final submission vF1 achieved the first ranking according to the AUC on
the entire set, the highest AUC on the English subset, and the second-highest AUC
values on the Spanish and Greek subset. All variants of our method perform better
1The results of our methods are on the published competition dataset. The results by otherparticipants are the published competition results. The actual competition evaluation set for Spanishmay have some text in a different encoding than the published set; our final submission method vF1yielded on it a different result than on the published dataset.
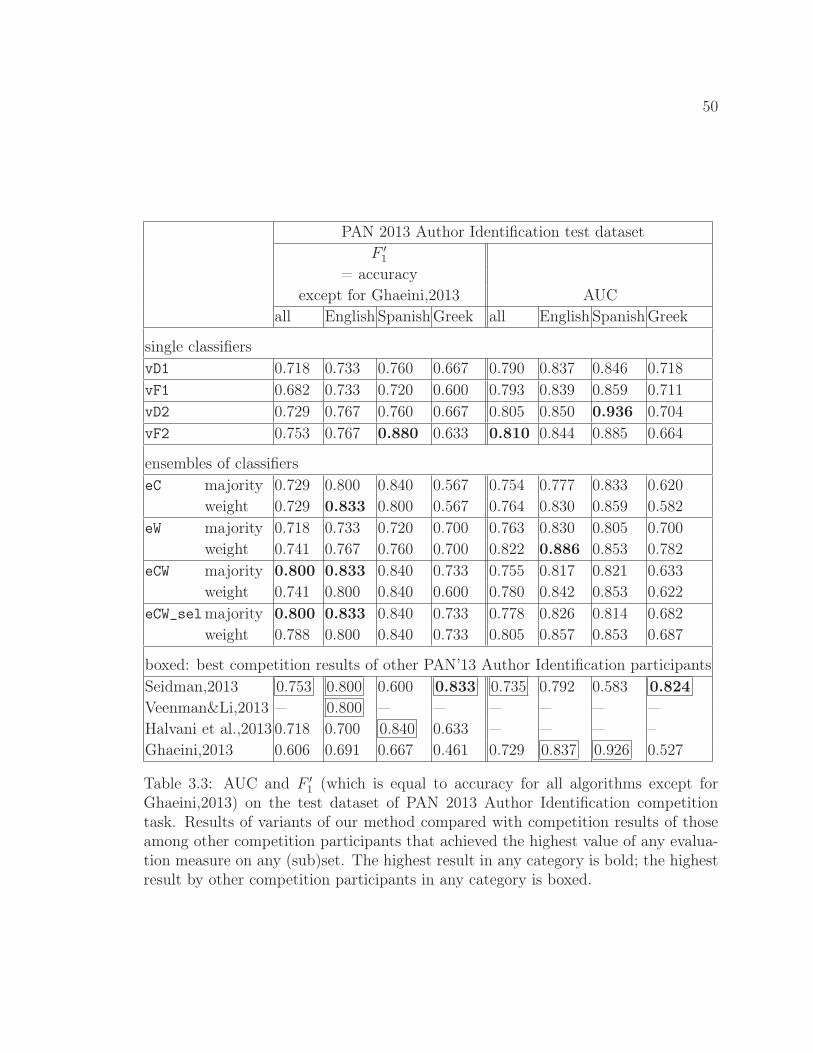
50
PAN 2013 Author Identification test datasetF ′1
= accuracyexcept for Ghaeini,2013 AUC
all English SpanishGreek all English SpanishGreek
single classifiersvD1 0.718 0.733 0.760 0.667 0.790 0.837 0.846 0.718vF1 0.682 0.733 0.720 0.600 0.793 0.839 0.859 0.711vD2 0.729 0.767 0.760 0.667 0.805 0.850 0.936 0.704vF2 0.753 0.767 0.880 0.633 0.810 0.844 0.885 0.664
ensembles of classifierseC majority 0.729 0.800 0.840 0.567 0.754 0.777 0.833 0.620
weight 0.729 0.833 0.800 0.567 0.764 0.830 0.859 0.582eW majority 0.718 0.733 0.720 0.700 0.763 0.830 0.805 0.700
weight 0.741 0.767 0.760 0.700 0.822 0.886 0.853 0.782eCW majority 0.800 0.833 0.840 0.733 0.755 0.817 0.821 0.633
weight 0.741 0.800 0.840 0.600 0.780 0.842 0.853 0.622eCW_selmajority 0.800 0.833 0.840 0.733 0.778 0.826 0.814 0.682
weight 0.788 0.800 0.840 0.733 0.805 0.857 0.853 0.687
boxed: best competition results of other PAN’13 Author Identification participantsSeidman,2013 0.753 0.800 0.600 0.833 0.735 0.792 0.583 0.824Veenman&Li,2013 — 0.800 — — — — — —Halvani et al.,2013 0.718 0.700 0.840 0.633 — — — –Ghaeini,2013 0.606 0.691 0.667 0.461 0.729 0.837 0.926 0.527
Table 3.3: AUC and F ′1 (which is equal to accuracy for all algorithms except for
Ghaeini,2013) on the test dataset of PAN 2013 Author Identification competitiontask. Results of variants of our method compared with competition results of thoseamong other competition participants that achieved the highest value of any evalua-tion measure on any (sub)set. The highest result in any category is bold; the highestresult by other competition participants in any category is boxed.
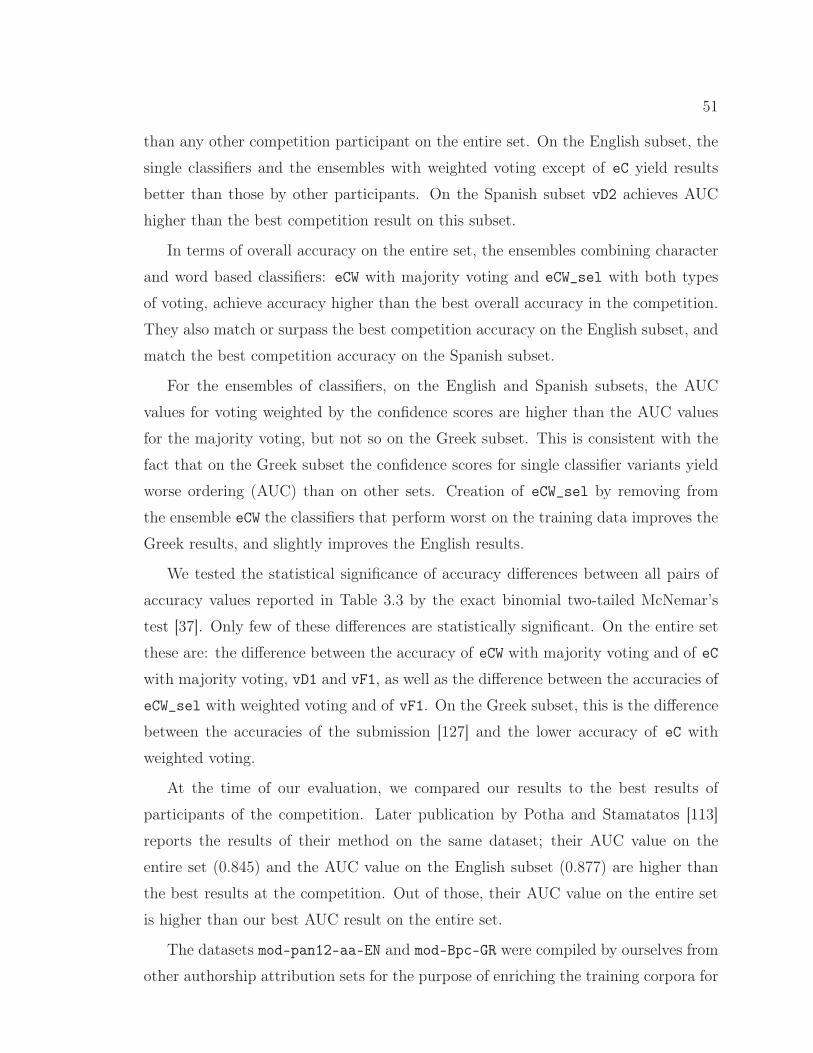
51
than any other competition participant on the entire set. On the English subset, the
single classifiers and the ensembles with weighted voting except of eC yield results
better than those by other participants. On the Spanish subset vD2 achieves AUC
higher than the best competition result on this subset.
In terms of overall accuracy on the entire set, the ensembles combining character
and word based classifiers: eCW with majority voting and eCW_sel with both types
of voting, achieve accuracy higher than the best overall accuracy in the competition.
They also match or surpass the best competition accuracy on the English subset, and
match the best competition accuracy on the Spanish subset.
For the ensembles of classifiers, on the English and Spanish subsets, the AUC
values for voting weighted by the confidence scores are higher than the AUC values
for the majority voting, but not so on the Greek subset. This is consistent with the
fact that on the Greek subset the confidence scores for single classifier variants yield
worse ordering (AUC) than on other sets. Creation of eCW_sel by removing from
the ensemble eCW the classifiers that perform worst on the training data improves the
Greek results, and slightly improves the English results.
We tested the statistical significance of accuracy differences between all pairs of
accuracy values reported in Table 3.3 by the exact binomial two-tailed McNemar’s
test [37]. Only few of these differences are statistically significant. On the entire set
these are: the difference between the accuracy of eCW with majority voting and of eC
with majority voting, vD1 and vF1, as well as the difference between the accuracies of
eCW_sel with weighted voting and of vF1. On the Greek subset, this is the difference
between the accuracies of the submission [127] and the lower accuracy of eC with
weighted voting.
At the time of our evaluation, we compared our results to the best results of
participants of the competition. Later publication by Potha and Stamatatos [113]
reports the results of their method on the same dataset; their AUC value on the
entire set (0.845) and the AUC value on the English subset (0.877) are higher than
the best results at the competition. Out of those, their AUC value on the entire set
is higher than our best AUC result on the entire set.
The datasets mod-pan12-aa-EN and mod-Bpc-GR were compiled by ourselves from
other authorship attribution sets for the purpose of enriching the training corpora for
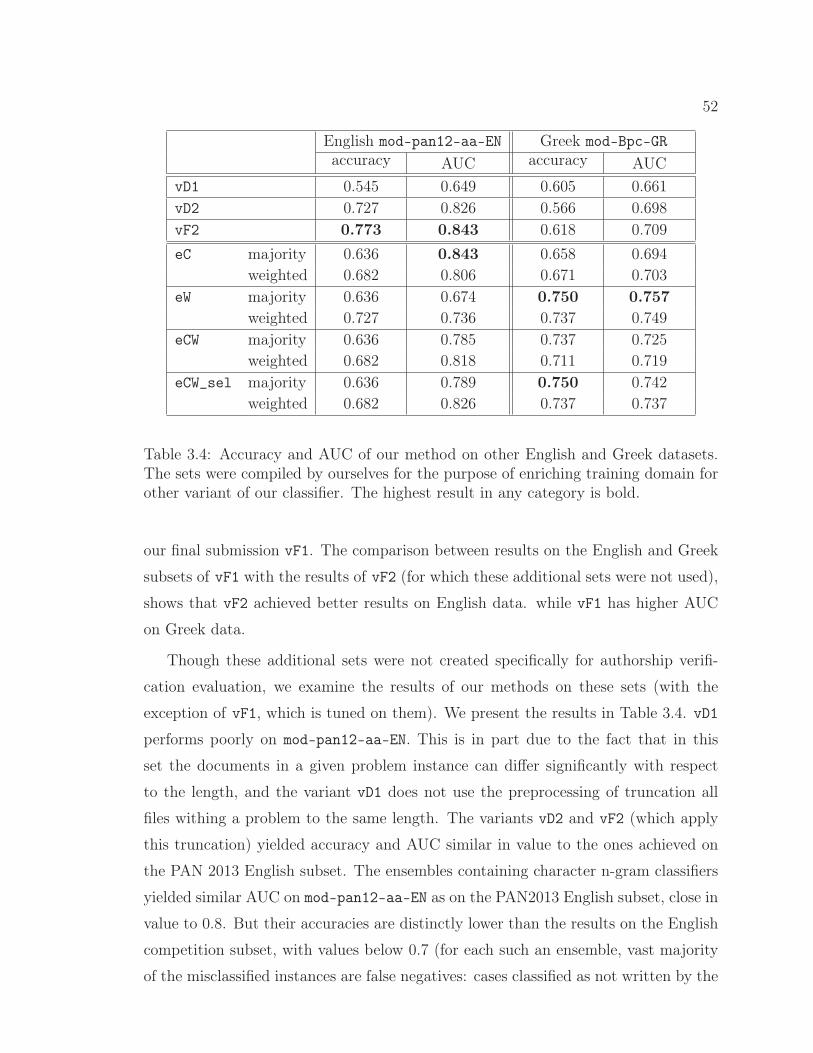
52
English mod-pan12-aa-EN Greek mod-Bpc-GRaccuracy AUC accuracy AUC
vD1 0.545 0.649 0.605 0.661vD2 0.727 0.826 0.566 0.698vF2 0.773 0.843 0.618 0.709eC majority 0.636 0.843 0.658 0.694
weighted 0.682 0.806 0.671 0.703eW majority 0.636 0.674 0.750 0.757
weighted 0.727 0.736 0.737 0.749eCW majority 0.636 0.785 0.737 0.725
weighted 0.682 0.818 0.711 0.719eCW_sel majority 0.636 0.789 0.750 0.742
weighted 0.682 0.826 0.737 0.737
Table 3.4: Accuracy and AUC of our method on other English and Greek datasets.The sets were compiled by ourselves for the purpose of enriching training domain forother variant of our classifier. The highest result in any category is bold.
our final submission vF1. The comparison between results on the English and Greek
subsets of vF1 with the results of vF2 (for which these additional sets were not used),
shows that vF2 achieved better results on English data. while vF1 has higher AUC
on Greek data.
Though these additional sets were not created specifically for authorship verifi-
cation evaluation, we examine the results of our methods on these sets (with the
exception of vF1, which is tuned on them). We present the results in Table 3.4. vD1
performs poorly on mod-pan12-aa-EN. This is in part due to the fact that in this
set the documents in a given problem instance can differ significantly with respect
to the length, and the variant vD1 does not use the preprocessing of truncation all
files withing a problem to the same length. The variants vD2 and vF2 (which apply
this truncation) yielded accuracy and AUC similar in value to the ones achieved on
the PAN 2013 English subset. The ensembles containing character n-gram classifiers
yielded similar AUC on mod-pan12-aa-EN as on the PAN2013 English subset, close in
value to 0.8. But their accuracies are distinctly lower than the results on the English
competition subset, with values below 0.7 (for each such an ensemble, vast majority
of the misclassified instances are false negatives: cases classified as not written by the
53
same person when in fact they are). For mod-Bpc-GR the single classifiers (with pa-
rameters tuned on the competition Greek subset) perform rather poorly, with results
similar but lower in values than the results yielded on the competition Greek test
set. The ensembles containing word n-gram based classifiers perform better than the
ensembles containing only the character n-gram classifiers, yielding both AUC and
accuracy in the range of 0.71 — 0.75.
3.5 Evaluation on PAN 2014 Author Identification Data
In this section we describe leveraging another PAN evaluation framework — PAN
2014 Author Identification shared task [135] — for evaluation of our method.
3.5.1 Datasets
The dataset of PAN 2014 Author Identification competition [135] consists of six cor-
pora: Dutch essays, Dutch reviews, English essays, English novels, Greek articles and
Spanish articles. The dataset is divided into the training set available for partici-
pants before the competition, and the test set on which the submitted approaches are
evaluated. The properties of the datasets are presented in Table 3.5. Each corpus is
balanced in terms of “Yes” and “No” problems.
The main difference between the datasets of PAN 2013 (Table 3.1) and PAN 2014
(Table 3.5) is in the number of known documents per problem, which has been made
lower in 2014 year. The number of known documents per problem in PAN 2014 is
limited to 5, while it is up to 10 in PAN 2015 set; on average there are 2.2 known
documents per problem in PAN 2014 test set, while the average number of known
documents in PAN 2013 test data is 4.1. In terms of separate test corpora, in PAN
2014 two corpora have one known document per problem (Dutch reviews and English
novels), three corpora have an average number of known documents lower than 3 and
greater than 1, and one corpus (Spanish articles) have exactly 5 known documents in
each problem, while in PAN 2014 test set the average number of known documents
in each corpus is at least 3.
Another important difference between the PAN 2013 and PAN 2014 datasets is
in the size of the training corpora. In PAN 2013 set, the numbers of problems per
corpus that are available for training/tuning the approaches are between 5 and 30.
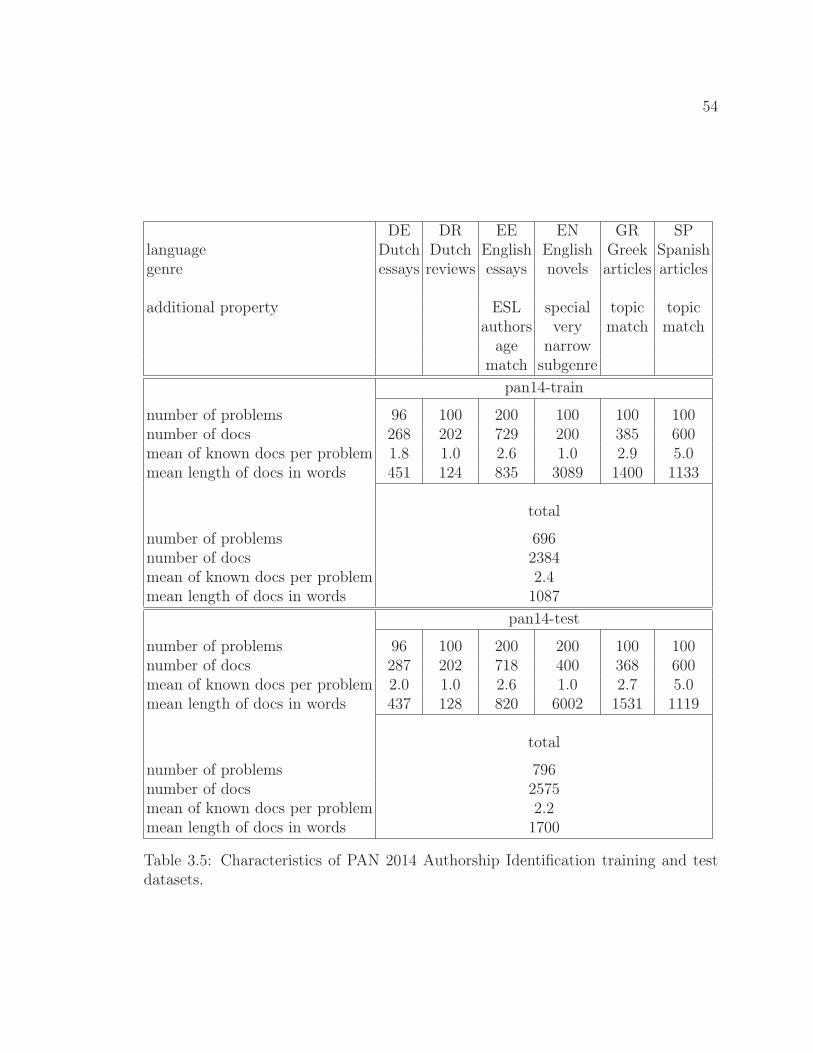
54
DE DR EE EN GR SPlanguage Dutch Dutch English English Greek Spanishgenre essays reviews essays novels articles articles
additional property ESL special topic topicauthors very match match
age narrowmatch subgenre
pan14-train
number of problems 96 100 200 100 100 100number of docs 268 202 729 200 385 600mean of known docs per problem 1.8 1.0 2.6 1.0 2.9 5.0mean length of docs in words 451 124 835 3089 1400 1133
total
number of problems 696number of docs 2384mean of known docs per problem 2.4mean length of docs in words 1087
pan14-test
number of problems 96 100 200 200 100 100number of docs 287 202 718 400 368 600mean of known docs per problem 2.0 1.0 2.6 1.0 2.7 5.0mean length of docs in words 437 128 820 6002 1531 1119
total
number of problems 796number of docs 2575mean of known docs per problem 2.2mean length of docs in words 1700
Table 3.5: Characteristics of PAN 2014 Authorship Identification training and testdatasets.
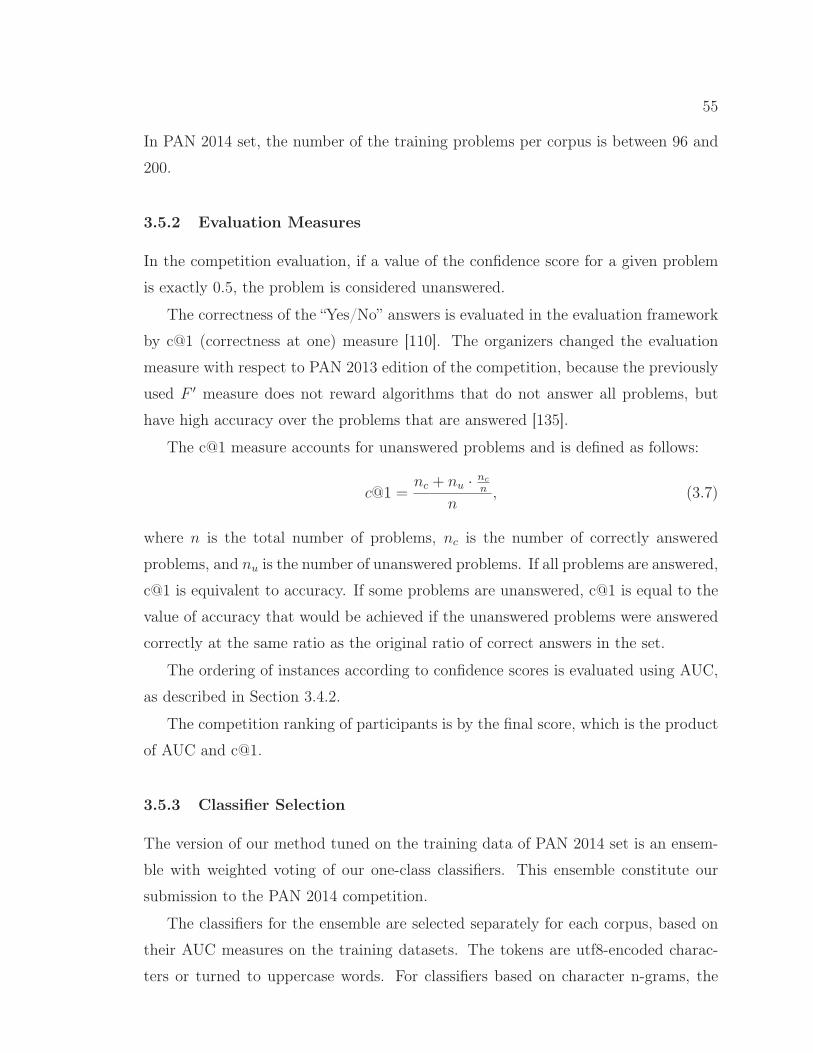
55
In PAN 2014 set, the number of the training problems per corpus is between 96 and
200.
3.5.2 Evaluation Measures
In the competition evaluation, if a value of the confidence score for a given problem
is exactly 0.5, the problem is considered unanswered.
The correctness of the “Yes/No” answers is evaluated in the evaluation framework
by c@1 (correctness at one) measure [110]. The organizers changed the evaluation
measure with respect to PAN 2013 edition of the competition, because the previously
used F ′ measure does not reward algorithms that do not answer all problems, but
have high accuracy over the problems that are answered [135].
The c@1 measure accounts for unanswered problems and is defined as follows:
c@1 =nc + nu · nc
n
n, (3.7)
where n is the total number of problems, nc is the number of correctly answered
problems, and nu is the number of unanswered problems. If all problems are answered,
c@1 is equivalent to accuracy. If some problems are unanswered, c@1 is equal to the
value of accuracy that would be achieved if the unanswered problems were answered
correctly at the same ratio as the original ratio of correct answers in the set.
The ordering of instances according to confidence scores is evaluated using AUC,
as described in Section 3.4.2.
The competition ranking of participants is by the final score, which is the product
of AUC and c@1.
3.5.3 Classifier Selection
The version of our method tuned on the training data of PAN 2014 set is an ensem-
ble with weighted voting of our one-class classifiers. This ensemble constitute our
submission to the PAN 2014 competition.
The classifiers for the ensemble are selected separately for each corpus, based on
their AUC measures on the training datasets. The tokens are utf8-encoded charac-
ters or turned to uppercase words. For classifiers based on character n-grams, the
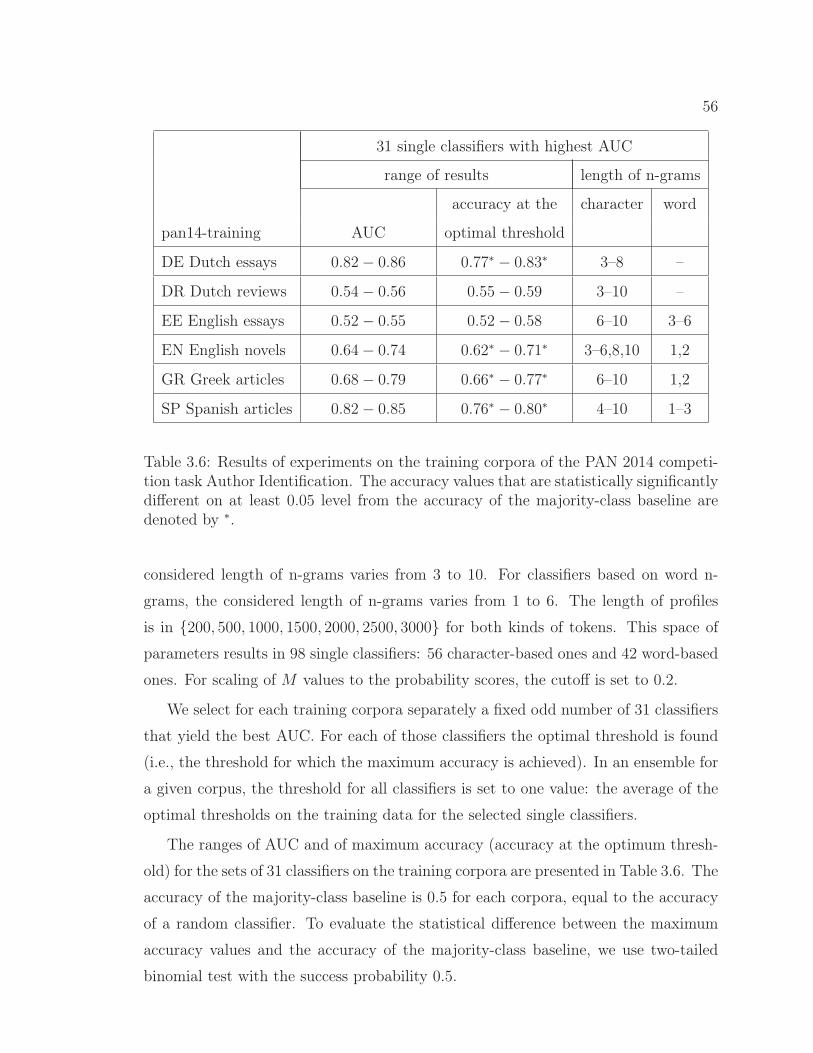
56
31 single classifiers with highest AUC
range of results length of n-grams
accuracy at the character word
pan14-training AUC optimal threshold
DE Dutch essays 0.82− 0.86 0.77∗ − 0.83∗ 3–8 –
DR Dutch reviews 0.54− 0.56 0.55− 0.59 3–10 –
EE English essays 0.52− 0.55 0.52− 0.58 6–10 3–6
EN English novels 0.64− 0.74 0.62∗ − 0.71∗ 3–6,8,10 1,2
GR Greek articles 0.68− 0.79 0.66∗ − 0.77∗ 6–10 1,2
SP Spanish articles 0.82− 0.85 0.76∗ − 0.80∗ 4–10 1–3
Table 3.6: Results of experiments on the training corpora of the PAN 2014 competi-tion task Author Identification. The accuracy values that are statistically significantlydifferent on at least 0.05 level from the accuracy of the majority-class baseline aredenoted by ∗.
considered length of n-grams varies from 3 to 10. For classifiers based on word n-
grams, the considered length of n-grams varies from 1 to 6. The length of profiles
is in {200, 500, 1000, 1500, 2000, 2500, 3000} for both kinds of tokens. This space of
parameters results in 98 single classifiers: 56 character-based ones and 42 word-based
ones. For scaling of M values to the probability scores, the cutoff is set to 0.2.
We select for each training corpora separately a fixed odd number of 31 classifiers
that yield the best AUC. For each of those classifiers the optimal threshold is found
(i.e., the threshold for which the maximum accuracy is achieved). In an ensemble for
a given corpus, the threshold for all classifiers is set to one value: the average of the
optimal thresholds on the training data for the selected single classifiers.
The ranges of AUC and of maximum accuracy (accuracy at the optimum thresh-
old) for the sets of 31 classifiers on the training corpora are presented in Table 3.6. The
accuracy of the majority-class baseline is 0.5 for each corpora, equal to the accuracy
of a random classifier. To evaluate the statistical difference between the maximum
accuracy values and the accuracy of the majority-class baseline, we use two-tailed
binomial test with the success probability 0.5.
57
We observe that on two training sets — English essays and Dutch reviews — the
single classifiers perform very poorly: the best achieved AUC by any classifier on those
sets is 0.56 — not much above the 0.5 AUC value of random ordering of instances; and
the accuracy at the optimal threshold for all classifiers is not statistically significantly
different than that of the random baseline. For one of these two sets — the set of
Dutch reviews — what makes it different from sets we used previously for evaluation
of our method, is the fact that there is only one known document per problem, and
the length of the documents is much shorter than in previously used sets. For the
other training set on which our method does not work — the set of English essays —
what distinguishes it from other sets we used before is the fact that the documents
were written by non-native speakers.
As noted in Table 3.6, classifiers based on word n-grams of length longer than
3 has not been in the selected best classifiers for any dataset, except for the set of
English essays (on which the method does not work, and the selection of classifiers
seems to be close to random). That is what we expected, and it validates our previous
choice of considering only word unigrams, bigrams and trigrams for ensembles.
In addition to our submission to the contest, we also evaluate three versions of
our method not tuned on the training set:
• eCW weight: the weighted voting ensemble of character- and word-based clas-
sifiers with a threshold fixed to 1, which is not tuned on any data,
• two single classifiers tuned on other datasets: vF1 with fixed-length profiles and
vD2 with dynamic-length profiles.
These versions are described in Section 3.4.3. The single classifiers vF1 and vD2 are
tuned on English, Spanish and Greek problems (different from training data of PAN
2014 set). When they are used on PAN 2014 Dutch test sets, the parameters tuned
on English corpora are applied.
3.5.4 Results
Final score, AUC and c@1 of the versions of our method on the test set of PAN 2014
Author Identification task are presented in Table 3.7. The table also includes the
numbers of participants (out of 13) that were outperformed.
58
We compare the performance of our method with the best results of the competi-
tion — that is for each corpus we present results of the competition participants that
achieved the highest final score, the highest AUC or the highest c@1 on that corpus.
These methods are:
• the first place winner [76], which is a version of the imposter method [87],
• the second place winner [48], which represents each problem with several fea-
tures capturing similarity between a set of known documents and a questioned
document, and trains a binary decision tree on training problems with respect
to the “Yes” and “No” problem labels,
• an extrinsic method [103], which uses training corpus to create other candidates
for casting verification problems into authorship attribution problems,
• an intrinsic method [124], which uses LSA on a character n-gram based rep-
resentation to build a similarity measure between a questioned document and
known documents,
• an intrinsic method [103], which uses clustering of a training corpus and the
membership of problem documents in the clusters, for measuring the similarity
between a questioned document and a known document set.
On each corpus, we use two-tailed binomial test with probability of success 0.5 to
test the statistical significance of the difference of c@1 value from the accuracy of a
random (and also majority-class) baseline. In this testing we treat c@1 as accuracy,
by considering its value as the ratio of “successes” in the binomial test.
We also compare each method with our submission, with respect to their correct-
ness of answers, using two-tailed exact sign test. A test statistic for a sign test is
the number of instances on which one classifier produces a better output than the
other classifier, and a null hypothesis is that there is no difference in the number
of instances on which each classifier produces a better output than the other classi-
fier. For a typical situation of all instances being labelled by classifiers, the sign test,
assuming that a correct label is better than an incorrect label, is equivalent to the
McNemar’s test, which we used in our previous evaluation (Section 3.4.4). In this
evaluation, instances can be left unlabelled, and we account for that by considering a
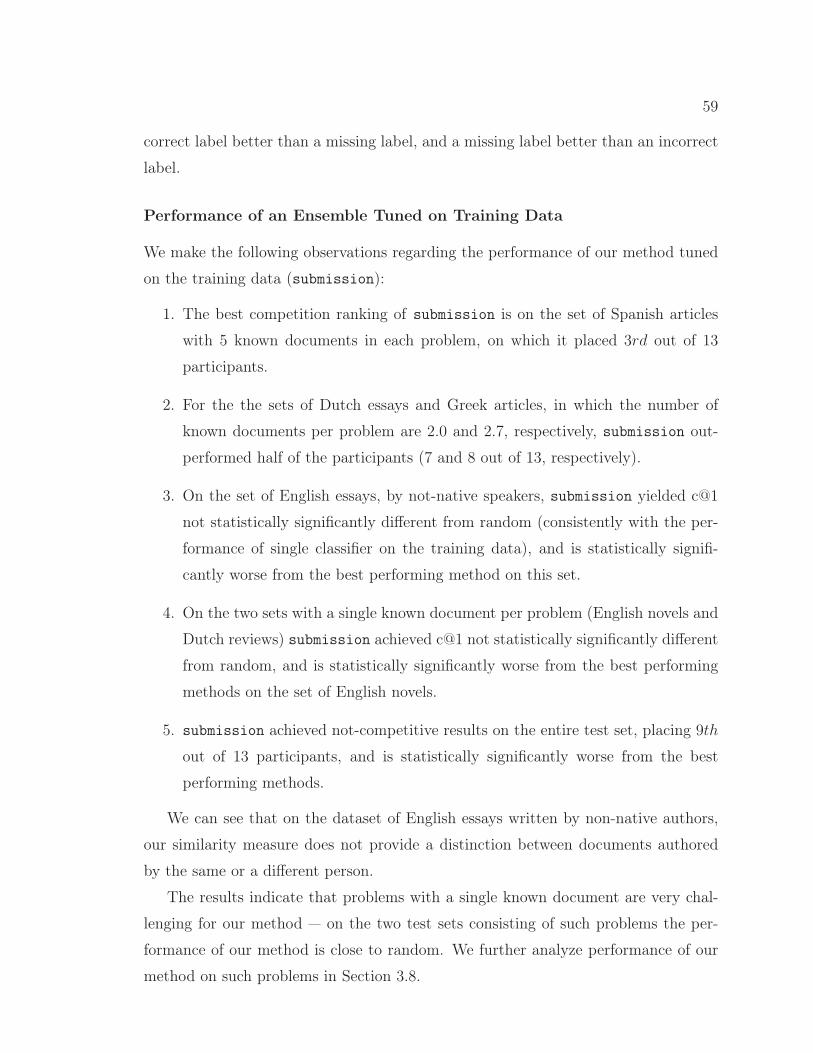
59
correct label better than a missing label, and a missing label better than an incorrect
label.
Performance of an Ensemble Tuned on Training Data
We make the following observations regarding the performance of our method tuned
on the training data (submission):
1. The best competition ranking of submission is on the set of Spanish articles
with 5 known documents in each problem, on which it placed 3rd out of 13
participants.
2. For the the sets of Dutch essays and Greek articles, in which the number of
known documents per problem are 2.0 and 2.7, respectively, submission out-
performed half of the participants (7 and 8 out of 13, respectively).
3. On the set of English essays, by not-native speakers, submission yielded c@1
not statistically significantly different from random (consistently with the per-
formance of single classifier on the training data), and is statistically signifi-
cantly worse from the best performing method on this set.
4. On the two sets with a single known document per problem (English novels and
Dutch reviews) submission achieved c@1 not statistically significantly different
from random, and is statistically significantly worse from the best performing
methods on the set of English novels.
5. submission achieved not-competitive results on the entire test set, placing 9th
out of 13 participants, and is statistically significantly worse from the best
performing methods.
We can see that on the dataset of English essays written by non-native authors,
our similarity measure does not provide a distinction between documents authored
by the same or a different person.
The results indicate that problems with a single known document are very chal-
lenging for our method — on the two test sets consisting of such problems the per-
formance of our method is close to random. We further analyze performance of our
method on such problems in Section 3.8.
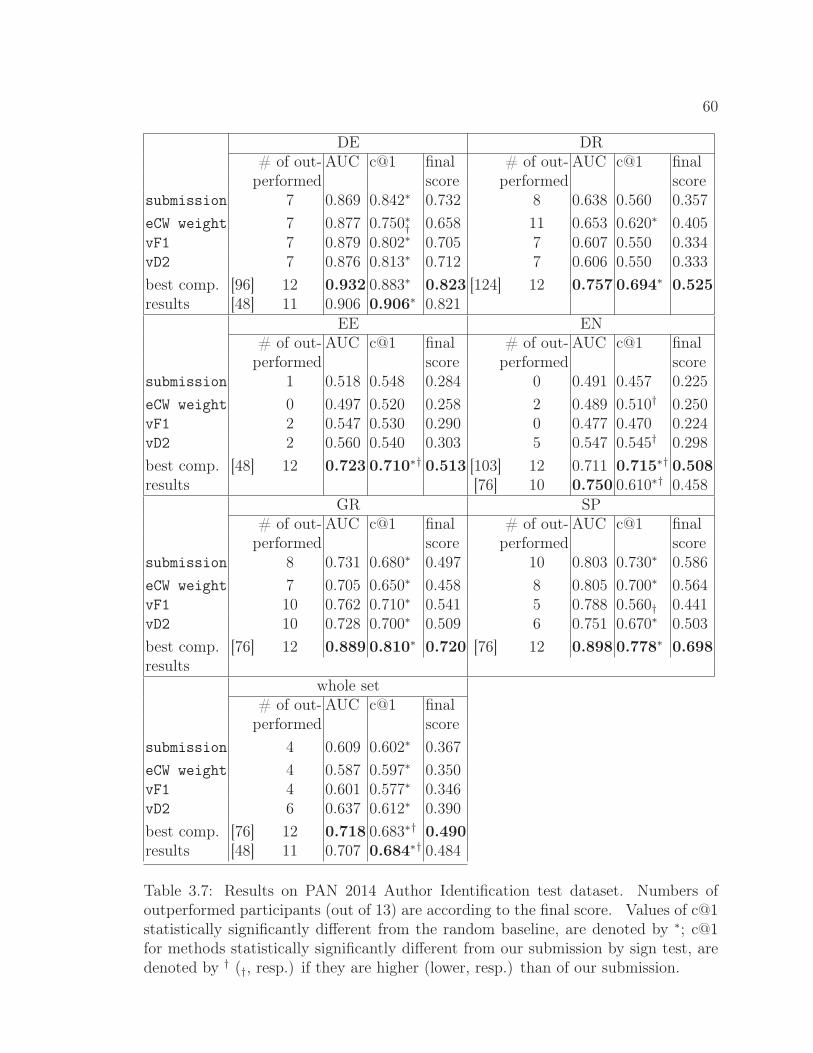
60
DE DR# of out- AUC c@1 final # of out- AUC c@1 final
performed score performed scoresubmission 7 0.869 0.842∗ 0.732 8 0.638 0.560 0.357eCW weight 7 0.877 0.750∗† 0.658 11 0.653 0.620∗ 0.405vF1 7 0.879 0.802∗ 0.705 7 0.607 0.550 0.334vD2 7 0.876 0.813∗ 0.712 7 0.606 0.550 0.333best comp. [96] 12 0.932 0.883∗ 0.823 [124] 12 0.757 0.694∗ 0.525results [48] 11 0.906 0.906∗ 0.821
EE EN# of out- AUC c@1 final # of out- AUC c@1 final
performed score performed scoresubmission 1 0.518 0.548 0.284 0 0.491 0.457 0.225eCW weight 0 0.497 0.520 0.258 2 0.489 0.510† 0.250vF1 2 0.547 0.530 0.290 0 0.477 0.470 0.224vD2 2 0.560 0.540 0.303 5 0.547 0.545† 0.298best comp. [48] 12 0.723 0.710∗† 0.513 [103] 12 0.711 0.715∗† 0.508results [76] 10 0.750 0.610∗† 0.458
GR SP# of out- AUC c@1 final # of out- AUC c@1 final
performed score performed scoresubmission 8 0.731 0.680∗ 0.497 10 0.803 0.730∗ 0.586eCW weight 7 0.705 0.650∗ 0.458 8 0.805 0.700∗ 0.564vF1 10 0.762 0.710∗ 0.541 5 0.788 0.560† 0.441vD2 10 0.728 0.700∗ 0.509 6 0.751 0.670∗ 0.503best comp. [76] 12 0.889 0.810∗ 0.720 [76] 12 0.898 0.778∗ 0.698results
whole set# of out- AUC c@1 final
performed scoresubmission 4 0.609 0.602∗ 0.367eCW weight 4 0.587 0.597∗ 0.350vF1 4 0.601 0.577∗ 0.346vD2 6 0.637 0.612∗ 0.390best comp. [76] 12 0.718 0.683∗† 0.490results [48] 11 0.707 0.684∗† 0.484
Table 3.7: Results on PAN 2014 Author Identification test dataset. Numbers ofoutperformed participants (out of 13) are according to the final score. Values of c@1statistically significantly different from the random baseline, are denoted by ∗; c@1for methods statistically significantly different from our submission by sign test, aredenoted by † (†, resp.) if they are higher (lower, resp.) than of our submission.
61
The lowest performance of our submission is on the set of English novels, with
a single known document per problem, on which it achieved AUC and c@1 below
the random level of 0.5 (but for c@1 it is not statistically significantly different from
random). We checked that for the single classifiers selected to the ensemble, their
better performance on the training data does not generalize to the test data.
The results on PAN 2014 and PAN 2013 sets are also an indication that our
method is best suited for problems with more known documents, and its performance
is not competitive on problems with fewer than 3 known documents. In Section 3.7
we perform an analysis of the dependency of the performance of our method on the
number of known documents, and show that the performance drops when the number
of known documents decreases.
Performance of Versions not Tuned on Training Data
In PAN 2014 set, the size of training data is much larger than on PAN 2013 set, and
we expected that tuning of classifiers will have a larger impact on performance than
on PAN 2013 set.
On the three test corpora, on which our submission yields c@1 above random
level (Spanish articles, Greek articles and Dutch essays), the eCW weight ensemble,
which does not use any training data, yields lower final score than our submission.
For Dutch essays, eCW weight is statistically significantly worse from our submission.
We check that the threshold tuned on the training data of this corpus is higher than
the fixed threshold of 1 used in eCW weight. As a consequence, the majority of
cases that are misclassified by eCW weight on Dutch essays set are false negatives:
questioned documents that are incorrectly classified as not written by the author of
known documents (because the measure M is above the set threshold). With respect
to AUC of our submission and eCW weight on these test sets, the absolute differences
are below 0.03 and not always lower for eCW weight. Notice that AUC does not
depend on the threshold.
These results indicate that tuning of an ensemble in terms of selection of classifiers,
does not have a large impact on the ensemble performance, but tuning the classifiers
threshold can have a significant effect on the correctness of an ensemble.
62
Another two statistically significant differences between correctness of our submis-
sion and of versions not tuned on the training data, are for the test sets of Spanish
articles and English novels. On Spanish articles the single classifier vF1 yields c@1 by
0.17 lower than our submission. In this case, the threshold of vF1, tuned on English
documents from a different set, is higher than that of our submission, tuned on the
Spanish articles training data. Almost all cases misclassified by vF1 on that test set
are false positives. Only on the set of English novels our submission performs statis-
tically significantly worse from non-tuned versions of our method, but those better
performing versions still do not reach a level of c@1 statistically significantly better
than the random value.
The absolute values of differences between AUC values of our submission and of
the versions of our method not tuned on the training data (eCW weight, vF1, and
vD2), are below 0.06.
It is worth noticing that on four evaluation corpora: the corpora other than the
two evaluation sets that are very challenging for any version of our method — the
English essays and the English novel sets — the ensemble eCW weight, without an
access to training data, outperforms more than half of the competition participants,
and yields c@1 that is statistically significantly above the random baseline.
3.6 Our Method as a Baseline for Competition Editions
Our method vF1, submitted to the PAN 2013 Authorship Identification competition,
has been selected by the organizers of the competition as a baseline for the next
two editions of the competition in authorship verification: PAN 2014 [135] and PAN
2015 [134] Authorship Identification tasks. As submissions were done in a form of a
tool installed in a virtual machine, organizers could run a submitted method on their
evaluation data. Our method vF1 was chosen as the PAN 2013 winner in terms of the
overall AUC, as a language independent method, and as a method, which provided
confidence scores [135].
It is important to remember that our method vF1 was tuned on other corpora
than the training corpora for the PAN 2014 and PAN 2015 competition; it did not
have access to the training corpora available for competition participants.
63
Our method provided a strong baseline on three evaluation corpora (Dutch re-
views, Dutch essays, Greek articles), outperforming on each of them 7 out of 13
participants, while on the other three evaluation corpora its results were low, better
than only 2 or none of the participants.2
In PAN 2015 edition of the competition [134], our vF1 method was chosen by the
competition organizers as one of three baselines, together with the method by Frery
et al. [48], which was the second place winner in PAN 2014 Authorship Identification
competition, and the method by Castillo et al. [23], which was the third place winner
in that competition. PAN 2015 authorship verification was on corpora of problems
that are cross-topic or cross-genre (or both), i.e., in a given problem the documents
are on different topics, or of different genres. There are four evaluation corpora: a
cross-genre Dutch corpus, cross-topic English and Greek corpora, and a mixed Spanish
corpus, in which all problems were cross-topic, and some additionally cross-genre.
Our vF1 method used by the organizers as a baseline method outperformed on
the entire set 8 out of 18 teams. On three sets, respectively the English, the Greek,
and the Spanish one, it outperformed respectively 10, 8, and 9 teams, while on the
most difficult cross-genre Dutch set it performed below the random 0.25 value of
final score, outperforming 5 participants. It has been stated by the competition
organizer about our vF1 method (called PAN13-BASELINE), and the baseline of PAN
2014 third-place winner [23] (called PAN14-BASELINE-2): “On average, the PAN13-
BASELINE and the PAN14-BASELINE-2 outperform almost half of the participating
teams, demonstrating their potential as generic approaches that can be used on any
given corpus.” [134].
In contrast, the performance of the third baseline — the second-best submission
to PAN 2014 competition [48] — shows much higher dependency on the similarity of a
test corpus to the corpus it was trained on. This baseline performed on average close
to the random level [134], with the only set on which it performed above the random
baseline being the Spanish set, which resembles in many respects the Spanish set of
PAN 14 Authorship Identification task, on which the method was trained.
2The ranking of vF1 obtained by the competition organizers using our tool installed on a virtualmachine, is slightly different than the one we obtain and present in Table 3.7. This is most likely dueto the older (and not longer available) version of Perl on the virtual machine. The current versionof Perl (as well as the version 2.005 of the library Text::Ngram [74], regardless of the Perl version)fixes an implementation idiosyncrasy that in some situation affects CNG profiles.
64
3.7 Dependency of Performance on the Number of Known Documents
In this section we describe our analysis of the dependency of the performance of our
method on the number of the documents of known authorship (the known docu-
ments). We studied the performance of three variants of our method: the ensemble
eCW weight with a threshold fixed to 1 and weighted voting, and two single classifiers
vF1 and vD2 (see Table 3.2).
3.7.1 Data
We considered two sets of problems: a subset of PAN 13 test set consisting of all
problems that have at least 4 known documents, which consists of 48 problems, and
the PAN 14 training set of Spanish articles, in which each problem contains exactly
5 known documents, and which consists of 100 problems. These problems were not
part of corpora used for tuning any of the considered methods.
Based on those sets we created problems with exactly 1, 2, 3, or 4 known docu-
ments. For any k ∈ {1, 2, 3, 4}, in any such a problem with k known documents, the
questioned document is the same as in the original problem, and for the set of known
documents, exactly k documents are sampled from the set of known documents of the
original problem. We repeated the sampling of the k known documents five times,
creating five batches of problems.
In the cases when k = 4 or k = 1 and an original problem has five known doc-
uments, there are exactly five different ways k documents can be sampled; in these
cases we made sure that a given problem has a different selection of known documents
in each batch. In other cases, we randomly sampled in each problem the prescribed
k number of known documents from the set of known documents of a given original
problem. For the case of k = 4 for the subset of PAN 13 test set, some of the original
problems (16 out of 48) have exactly 4 known documents, so these problems have
identical known documents in all five batches for k = 4.
3.7.2 Results
Figure 3.1 presents for each number of known documents the means of AUC over
the batches with a given number of known documents, and also the (single) AUC
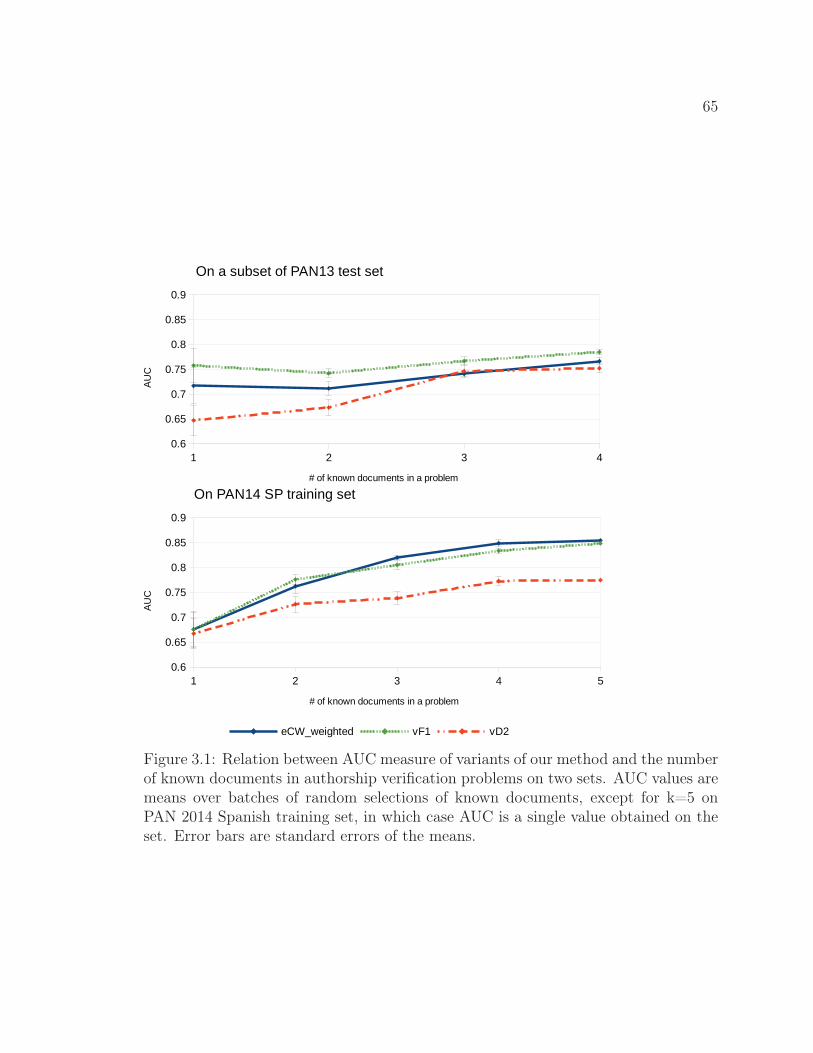
65
� � ��
�� �
���
����
���
����
���
�������������������������
&����' �� ���(�) ��� ���*+��,)
�-
��
� � � � ����
����
���
����
���
����
���
� ������������ � ����
����������� ��� ���
�����' �� ���(��� ��� ��� �!"��
�.��
Figure 3.1: Relation between AUC measure of variants of our method and the numberof known documents in authorship verification problems on two sets. AUC values aremeans over batches of random selections of known documents, except for k=5 onPAN 2014 Spanish training set, in which case AUC is a single value obtained on theset. Error bars are standard errors of the means.
66
value obtained on the PAN 14 training set of Spanish articles with exactly 5 known
documents. For each classifier and each set, we applied the unpaired two-tailed t-test
to test the statistical significance of the differences between each pair of means; for
the PAN 14 Spanish articles set, we also compared for each classifier each mean with
the AUC value for the number of 5 known documents, using the one sample two-tailed
t-test.
Except for the case of one known document on the subset of PAN 13 test set, we
observe a trend of diminishing AUC with diminishing number of known documents.
For the numbers of known documents greater than one, the differences between
two AUC values for numbers of known documents that differ by 1 (e.g., 2 versus 3
known documents) are usually not statistically significant. But when the numbers
of known documents differ at least by 2 (i.e., 2 versus 4, 2 versus 5, 3 versus 5),
the differences in AUC are statistically significantly different at least on the level of
p < 0.05 for each classifier and both sets.
On PAN 2014 Spanish articles set, the value of AUC for a single known document
is for any classifier statistically significantly lower than that for any higher number
of known documents. On the subset of PAN 2013 test set, the AUC mean for a
single known document is statistically significantly lower than for 3 and 4 known
documents for the classifier vD2, but is not statistically different from other means
for the classifiers vF1 and eCW.
Thus this analysis indicate that the performance of our method diminish with the
decreasing number of known documents.
3.8 Performance on Problems with a Single Known Document
Our algorithm requires at least two known documents. When it is presented with
a single known document, it divides the known document in half and use those two
halves as two known documents, as described in Section 3.3. Thus both in the case
when there are two known documents and in the case when there is one known
document, our method effectively uses two known documents, only in the latter case
these two documents are chunks of one original document.
While, as described in Section 3.7, we usually observe a drop in AUC between two
know documents and a single one, effectively the algorithms use two known documents
67
in both cases, and it is unknown if the drop in performance is caused by the decrease
of the length of these documents by half, or (also) the fact that these effective two
known documents are not different documents, but parts of one document.
To investigate that, we compare performance of our method on problems with one
and two known documents that are normalized in terms of the length, so that the
single known document is twice the length of the known documents in a corresponding
problem with two known documents.
We analyze performance of the same versions of our method that are analyzed in
Section 3.7: eCW weight, vF1 and vD2.
The single classifiers vF1 and vD2 use, for each language, a special threshold θ1
for problems with only one document. This special threshold was tuned separately
on problems with one known document, and is higher from the threshold used for
problems with at least two known document. We tested how this special threshold
θ1 affects the accuracy, by additionally performing classification without using the
threshold θ1 (this affects only the results on the sets with 1 known document).
3.8.1 Data
We selected all problems from PAN 14 training corpora except for English essays (on
which our single classifiers perform at the random level) that have at least two known
documents, and kept exactly two random known documents for each of them. We call
this set “2-known-doc set”. The set consists of 215 problems originally from Dutch
essays, Greek articles and Spanish articles corpora.
We created two sets (A1 and B1) of problems with one known document each, by
using in each of them the problems of “2-known-doc set”, but with only one known
document in a problem — for each problem from “2-known-doc set” we divided the
known documents between the sets A1 and B1. We created two corresponding sets
of problems with two known documents, A2 and B2, respectively, that contain the
problems from “2-known-doc set”, but in which the known documents are cut down
to the length of the half of the single known document in the corresponding problem
in the set A1 and B1, respectively.
We divided the sets into 5 folds and performed the classification on the folds.
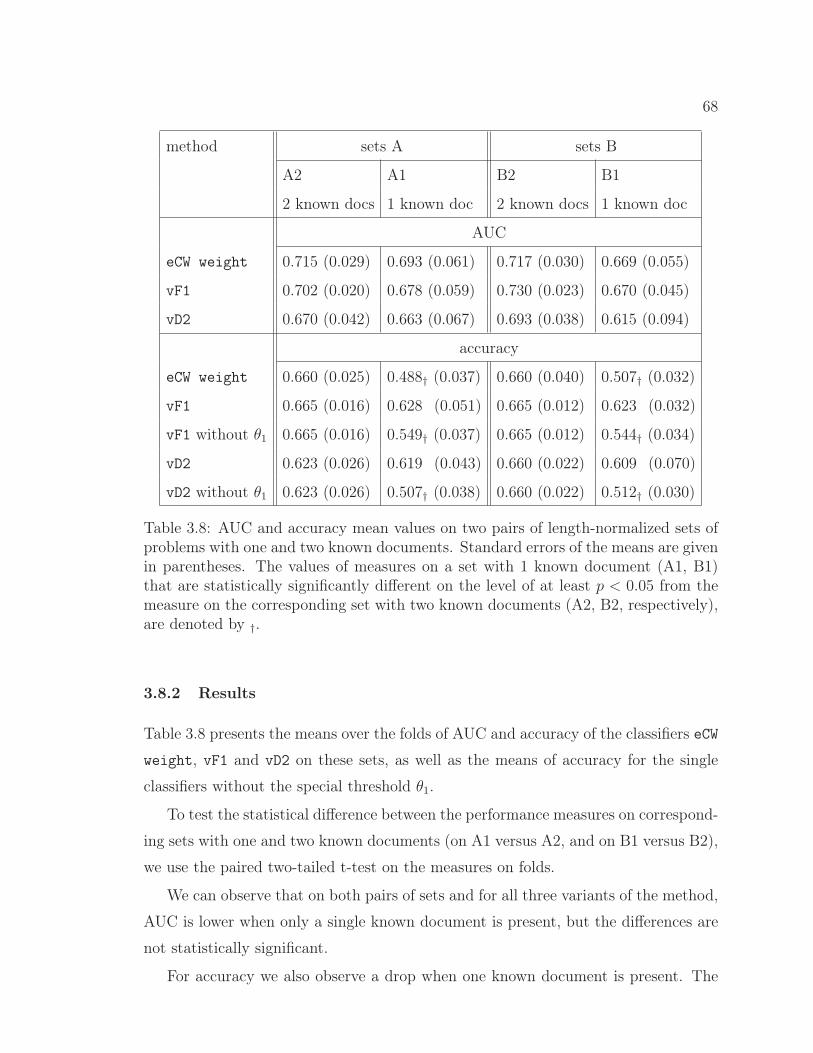
68
method sets A sets B
A2 A1 B2 B1
2 known docs 1 known doc 2 known docs 1 known doc
AUC
eCW weight 0.715 (0.029) 0.693 (0.061) 0.717 (0.030) 0.669 (0.055)
vF1 0.702 (0.020) 0.678 (0.059) 0.730 (0.023) 0.670 (0.045)
vD2 0.670 (0.042) 0.663 (0.067) 0.693 (0.038) 0.615 (0.094)
accuracy
eCW weight 0.660 (0.025) 0.488† (0.037) 0.660 (0.040) 0.507† (0.032)
vF1 0.665 (0.016) 0.628 (0.051) 0.665 (0.012) 0.623 (0.032)
vF1 without θ1 0.665 (0.016) 0.549† (0.037) 0.665 (0.012) 0.544† (0.034)
vD2 0.623 (0.026) 0.619 (0.043) 0.660 (0.022) 0.609 (0.070)
vD2 without θ1 0.623 (0.026) 0.507† (0.038) 0.660 (0.022) 0.512† (0.030)
Table 3.8: AUC and accuracy mean values on two pairs of length-normalized sets ofproblems with one and two known documents. Standard errors of the means are givenin parentheses. The values of measures on a set with 1 known document (A1, B1)that are statistically significantly different on the level of at least p < 0.05 from themeasure on the corresponding set with two known documents (A2, B2, respectively),are denoted by †.
3.8.2 Results
Table 3.8 presents the means over the folds of AUC and accuracy of the classifiers eCW
weight, vF1 and vD2 on these sets, as well as the means of accuracy for the single
classifiers without the special threshold θ1.
To test the statistical difference between the performance measures on correspond-
ing sets with one and two known documents (on A1 versus A2, and on B1 versus B2),
we use the paired two-tailed t-test on the measures on folds.
We can observe that on both pairs of sets and for all three variants of the method,
AUC is lower when only a single known document is present, but the differences are
not statistically significant.
For accuracy we also observe a drop when one known document is present. The
69
ensemble eCW weight with the fixed threshold 1, yields much lower accuracy when
presented with a single known document than with two known documents, and the
differences are statistically significant. For single classifiers with a special (higher)
threshold θ1 (vF1 and vD2), the changes in accuracy are not statistically significant.
When the special threshold for a single known document is removed (vF1 without
θ1 and vD2 without θ1), the decrease in the accuracy between two known documents
and a single known document is much bigger and statistically significant. We tested
that the differences between using and not using the special threshold θ1 on the sets
with one known document are statistically significant, except for vD2 on B1.
These results indicate that problems with a single known document are more
difficult for our method than problems with two known documents, even if the length
of the documents is normalized. When the same threshold is applied to both cases,
the accuracy is significantly lower than when only one known document is present. A
specially tuned, higher threshold for the problems with one known document improves
the accuracy significantly. AUC evaluating ordering of problems by confidence score
also suffers a decline when only one known document is available — the decline,
though not statistically significant, is consistent for both pairs of sets and across all
three analyzed variants of the method.
3.9 Feature Analysis
To study which character or word n-grams perform best, we analyzed the performance
of single classifiers. We considered classifiers based on character n-grams of length
from 3 to 10, and word n-grams of length from 1 to 4, and of the length of profiles
{200, 500, 1000, 1500, 2000, 2500, 3000} for both types of tokens. We analyzed the
AUC values, which evaluate the ordering of instances based on the confidence scores,
and that do not depend on the chosen threshold θ of a classifier.
3.9.1 Data
We used the three PAN 2013 corpora (whole sets, including test and training data),
as well as PAN 2014 training corpora, except for the two sets on which the single
classifier do not work and perform at random (English essays and Dutch reviews).
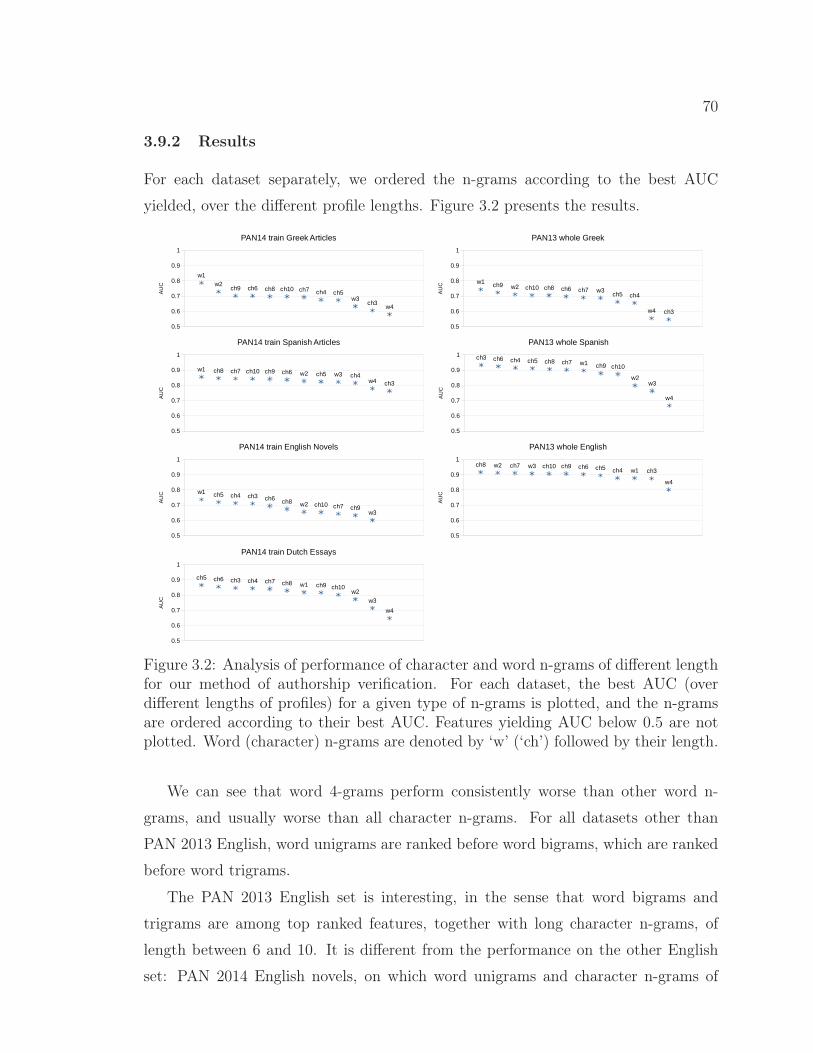
70
3.9.2 Results
For each dataset separately, we ordered the n-grams according to the best AUC
yielded, over the different profile lengths. Figure 3.2 presents the results.
��#
���
��$
��%
��&
'
()# ()� ()* ()+ ()$ ()% �� ��� ������
�
�
�� ��������������������
���
���
���
���
���
���
�
����
��� ��� ��� ���� ��� �� ����
���
�� �������� �!!"������#!�
���
���
���
���
���
���
�
�� ��� �� ���� ��� ��� ��� ���� ��
� ��
�� ����$#!� �!!"
���
���
���
���
���
���
�
�� ��� ��� ���� ��� ��� �� ��� � ��� ��
�� ��������%&�����������#!�
���
���
���
���
���
���
� �� ��� �� ��� ��� ��� �� ��� ����
���
�
�� ����$#!�%&�����
���
���
���
���
���
���
�
�� ��� �� �� ��� ��� �� ���� ��� ����
�� ����������'#���� $(!#�
���
���
���
���
���
���
���� �� ��� � ���� ��� ��� ��� �� �� ��
�
�� ����$#!���'#������
Figure 3.2: Analysis of performance of character and word n-grams of different lengthfor our method of authorship verification. For each dataset, the best AUC (overdifferent lengths of profiles) for a given type of n-grams is plotted, and the n-gramsare ordered according to their best AUC. Features yielding AUC below 0.5 are notplotted. Word (character) n-grams are denoted by ‘w’ (‘ch’) followed by their length.
We can see that word 4-grams perform consistently worse than other word n-
grams, and usually worse than all character n-grams. For all datasets other than
PAN 2013 English, word unigrams are ranked before word bigrams, which are ranked
before word trigrams.
The PAN 2013 English set is interesting, in the sense that word bigrams and
trigrams are among top ranked features, together with long character n-grams, of
length between 6 and 10. It is different from the performance on the other English
set: PAN 2014 English novels, on which word unigrams and character n-grams of
71
the length from 3 to 5 perform best. These sets, both in the same language, are of
different genre: PAN 2013 set is of textbooks in computer science or related fields,
while PAN 2014 is of fiction novels of a special, narrow shared-universe sub-genre. We
can observe that for the technical textbooks from a common field, longer character
n-grams and longer word n-grams perform better than for fiction novels.
For the two Spanish sets, the rankings of features are different. The PAN 2013
set consists of editorials and fiction writing, while PAN 2014 training set contains
newspaper articles chosen to match topically within a problem. We observe that for
the PAN 2014 set, word unigrams and longer character n-grams are ranked at the top,
while for the PAN 2013 set, shorter character n-grams perform best. In particular,
character 3-grams are the top feature set for the PAN 2013 corpus, while they are the
last ranked feature set for the PAN 2014 training corpus.
For Greek sets, word unigrams and bigrams, and longer character n-grams (of
length from 6 to 10) perform best. Both these sets contain newspaper articles from
the same original corpus and with text matched for topic within a problem. While
the problems differ between the sets with respect to the number of known documents,
they also differ in that for PAN 2013 Greek set, the verification problems were made
specifically difficult by stylistic analysis: negative problems have similar documents,
and positive problems have dissimilar documents, based on a version of the CNG
dissimilarity with character 3-grams. That may be the reason why character 3-grams
perform especially bad (worse than word 4-grams) on PAN 2013 Greek set.
For Dutch essays, shorter character n-grams perform best, with word unigrams
ranked only as the seventh top feature.
The results show that the performance of different character and word n-grams
depends on properties of texts. The differences may be related to a language. Different
relative performances of features on sets in the same language indicate a dependence
on genre or topical similarity between texts. The fact that corpora, on which longer
character n-grams and word bigrams rank high, are the corpora of topically matched
documents (PAN 2013 English set, PAN 2014 Spanish training set, both Greek sets),
may suggest an interesting possibility that such features are more beneficial for cases
of higher topical similarity between texts, though the genre and language differences
between the sets make it impossible to draw this conclusion from this analysis.
72
3.10 Conclusions
We presented our proximity based one-class classification method for authorship veri-
fication. The method uses for each document of known authorship the most dissimilar
document of the same author, and examines how much more or less similar is the
questioned document. We use Common N-Gram dissimilarity based on differences in
frequencies of character and word n-grams.
Our method, especially in an ensemble framework, yielded good results on the
multi-language PAN 2013 Author Identification competition corpus. The results are
competitive with respect to the best competition results on the entire set as well
as separately on two out of three language subsets. On these (sub)sets it yields
good ordering of instances by confidence score, as evaluated by the area under the
ROC curve (AUC). Our competition submission was a winner with respect to the
secondary competition evaluation by AUC. On the entire set, AUC by each variant
of our method is higher than the best result by other participants. An ensemble with
weighted voting combining character-based and word-based classifiers, tuned on the
training data of the competition, surpasses best accuracy and best AUC on the entire
set, matches the best accuracy on two out of three subsets, and surpasses the best
AUC on one subset.
As all proximity based one-class classification algorithms, our method relies on a
selected threshold on the proximity between the questioned text and the set of docu-
ments of known authorship. Additionally, a single classifier requires two parameters
defining the features representing documents. Ensembles of classifiers alleviate the
parameter tuning, by using many classifiers for many combinations of parameters,
and using a fixed or single average value for the threshold of all classifiers.
The method is best suited for verification problems with at least a 3 known docu-
ments. Its performance drops as the number of sampling of writing of a given person
becomes lower, and especially problems with a single sample of a given person writ-
ing are very challenging for the method. The results of our method are lower when
tested using the evaluation framework of PAN 2014 Author Identification task with
only 2.2 known documents per problem on average, and the only corpus in this set
of evaluation corpora, on which our method was in the upper quarter of the contest
ranking (yielding 3rd position) was the only set with more than 3 known documents
73
per problem. The results indicate that the method is competitive only for a higher
number of documents of confirmed authorship.
Variants of our method tuned on one corpus, or not tuned at all, performed
above the random level on other (though not all) corpora that differ in properties like
language, genre, or consistency of topics between documents. Our single classifier,
tuned for PAN 2013 competition, was used by organizers of the next two editions
of PAN author verification competition as a baseline. Without an access to these
competitions’ training sets, the method provided a strong baseline on 6 out of 10
corpora, outperforming on these sets about half of the participants. An ensemble of
classifiers based on character n-grams and word n-grams, with weighed voting and
with a fixed threshold, which did not undergo tuning on any training data, is worth
mentioning. On the corpus of PAN 2013 Author Identification competition, in which
a limited amount of training data was available for participants, it outperformed all
other participants in terms of AUC on the entire set, and matched the best accuracy
on two subsets. On the corpus of PAN 2014 Author Identification competition, in
which much larger amount of training data was available for participants, and the
number of documents of known authorship was lower, on four out of six evaluation
corpora it performed better than at least half of the participants, and statistically
significantly above the random baseline. That indicates a special usefulness of our
method in situations when there is limited availability of particular type of data on
which a solution can be trained.
3.11 Possible Extensions
It is worth investigating a better adaptation of our method to the problems with very
few, especially one or two, documents of known authorship. Chunking of the known
documents into parts, and especially dividing a single known document into more
than two chunks, is one possible approach worth trying.
It would also be of interest to explore a better use of large training corpora, by
using variants of our proximity measure to create feature vectors for a supervised
binary classifier. Namely, in cases when a large training corpora is available, one
could represent a problem by features equal to different modifications of our measure,
together with additional features such as the number of known documents, length
74
of the known documents, average CNG dissimilarity between the known documents,
and use these features as an input to a supervised binary classifier labelling a problem
with the “Yes” or “No” label.
An interesting direction, indicated by results of our experiments, is also the anal-
ysis of the role of different word n-grams and character n-grams for authorship verifi-
cation depending on the genre of the texts, and on the topical similarity between the
documents.
Our method utilizes CNG dissimilarity between documents, which is based on fre-
quencies of character and word n-grams. It would be of great interest to investigate
how character- or word-based features could be utilized for the task of authorship
verification using deep convolutional neural networks (CNNs) [89]. Convolutional
neural networks, with layers applying convolting filters on the input, have been found
to yield excellent results for text classification tasks, based on word input [77], char-
acter input [150] or combined word and character input [40]. Recently, they have
been successfully applied to authorship attribution [117]. CNNs allow also to utilize
unsupervised training of word embeddings (vector representations of words), such as
continuous bag-of-words and skip-gram models [102].
Chapter 4
Authorship Attribution with Topically Biased Training Data
4.1 Introduction
In the previous chapter, we dealt with authorship detection without considering top-
ics of analyzed documents. We have seen though, in the use cases of our visual system
RNG-Sig for authorship attribution, described in Chapter 2, that character n-grams
influencing the Common N-Gram classifier, originate both from topic-independent
words, and from words related to topics of documents. Our analysis of feature per-
formance in our method for authorship verification (Chapter 3) suggests a possibility
that different character and word n-grams may perform best depending on the topical
similarity between documents in a verification problem.
In this chapter we examine how similarity and difference in topics between the
considered text documents influence author identification. We concentrate on the
problem of authorship attribution, that is the problem of deciding who among can-
didate authors wrote a questioned text, given samples of writing for each of the
candidates.
The vast majority of authorship attribution studies assume that the considered
texts — the test data (questioned texts) and the training data (the samples of known
authorship) are of the same genre and on the same topic or come from the same
mixture of topics. But real-world author identification is often performed in the
situation, when one has samples of candidate authors’ writing only on topics that
are different from the topic of the document of which authorship is to be identified
(and sometimes of a different genre too). The cross-topic authorship analysis is the
analysis of authorship in the situation when analyzed texts are on different topics,
especially when training data for a supervised method is on a different topic than
test data. Research in this field indicates that such cross-topic authorship analysis is
more difficult than the traditionally studied intra-topic analysis [133, 123, 142, 88].
Our goal is to analyze authorship attribution for a special case of cross-topic
75
76
situation, that we call classification with “topically biased training data”, that is when
samples of writing (training data) for some candidates are topically more similar to
the text being attributed than samples for other candidates. Such a situation may
arise when the access to writing samples of candidate authors is limited, as is often
the case in a real-word authorship attribution, e.g., in forensics or literary research.
The setting of topically biased training data is different from the usually studied
cross-topic authorship attribution, in which training documents of all candidates are
on the same topic (different from the test topic) or come from the same mixture
of topics, and so the topical dissimilarity between training data and a text being
attributed does not differ much between candidates [52, 133, 123, 121, 122].
As one example of authorship attribution with topically biased training data, one
can consider recognizing whether different online aliases (pseudonyms) belong to the
same person, when people use different aliases for different topical online venues, so
that for a given candidate (an alias) there are only posts on one topic [88]. A recent
case of identifying the authorship of a crime novel published under a pseudonym by a
famous writer, who never wrote in this genre before, can also serve as an illustrative
example of the topical bias in training data [69]. In this situation, the authorship
attribution was performed by comparing the crime novel in question with a previous
book by this author (of a different genre and topic) and with crime novels by other
writers (and so arguably more similar topically to the questioned novel).
There are three contributions of our research:
1. We analyze and measure the effect of topically biased training data for author-
ship attribution. Our results indicate that classifiers become biased towards
selecting a candidate with training data topically more similar to the text being
attributed. While this conclusion may be considered not very surprising, to the
best of our knowledge we are first to systematically confirm and evaluate it.
The bias of classifiers appears even when using features that are proven to be
powerful for cross-topic attribution, and for a feature set size tailored for cross-
topic attribution. We show that authorship attribution with topically biased
training data is more difficult than intra-topic attribution.
2. We present a modification of the feature set of character n-grams that reduces
the bias of classifiers caused by topically biased training data.
77
3. We describe a newly compiled dataset for research on topic and authorship,
consisting of blog posts labelled by authors and topics.
4.2 Related Work
Cross-topic authorship analysis, in which considered documents are on different top-
ics, has been studied much less than the traditional case of intra-topic analysis.
The “unmasking” method of stacked classifiers proposed for authorship verification
(confirming whether a given author wrote a given questioned document) by Koppel
and Schler [82], implicitly differentiates between features capturing differences in style
from other features discriminating between two texts, including the ones related to
topics. It has been successfully applied for cross-topic authorship verification [86].
While successful for novel-length texts, it has been shown less effective for shorter
documents [119].
The case of intra-topic and cross-topic unsupervised clustering of internet message
board posts by their authors was studied by Novak et al. [106]. Their method based
on words needed to be modified for cross-topic clustering by discounting words specific
to given topics. A corpus of cross-topic and cross-genre communication samples was
created by Goldstein-Stewart et al. [52]. The authors showed that it is possible to
perform authorship attribution when training data is on diverse topics that do not
include the topic of the test data. For cross-topic attribution the authors removed
from the set of features a few manually identified highly topical words.
The difficulty of author attribution in the cross-topic setting (not topically biased,
using our definition) was the subject of research studies, which confirm that the
content information plays a role in authorship identification. Cross-topic attribution
based on words has been shown to be more difficult than intra-topic one by Schein et
al. [125]. Character n-grams have been shown to be more robust than most frequent
words in cross-topic authorship attribution by Stamatatos [133]. This study also
indicates that for intra-topic analysis, rare character n-grams or rare words (arguably
of rather topical than stylistic origin) are useful, while for the cross-topic setting,
inclusion of rare features leads to a performance drop. Analysis of performance of
different sets of features for intra-topic and cross-topic authorship attribution has been
performed by Sapkota et al. [123]. The results indicate that authorship attribution
78
across topics is more difficult than within a topic, and that holds for each of the
considered set of features: words, character n-grams, stop words, and stylistic features
such as length of words, length of sentences, vocabulary richness. The study also
indicates that character n-grams outperform other considered features for the cross-
topic attribution. An important insight of the study is also a recommendation of
using diverse topics within the training data: training on multiple topics that are
different from the test topic, yielded better results than training on a single topic
that is different from the test topic.
Influence of topics in the case of author verification for Wikipedia comments (de-
ciding whether two comments are by the same author) was studied by van Dam
and Hauff [142]. In this study, an algorithm consisting in thresholding on Common
N-Gram (CNG) dissimilarity [75] based on character n-grams, has been shown to
perform better when considered comments are on similar topics than when the com-
ments are on different topics. This work also bears a similarity to our work in that it
indicates, in the context of author verification, a bias of the algorithm towards recog-
nizing a common authorship of two documents, when the documents are on the same
topic, and rejecting the common authorship of the documents, when the documents
are on different topics; it shows that the character n-gram based CNG dissimilarity
between two documents depends on topics: it tends to be lower when the documents
are on similar topics and higher when the documents are on different topics.
The only work, which we are aware of, that considers the cross-topic authorship
attribution with topically biased training data, is the study by Layton et al. [88]. This
study deals with similarity-based authorship attribution of online posts, when some
candidates have training data on the test topic, and some candidates — including
the real author of the considered posts — have training data on a different topic. It
is shown that such a situation is more difficult than a situation, when training data
of all candidates have the same topical similarity to the questioned text. The study
also shows that in such a case, the CNG dissimilarity based on character n-grams
performs better than other traditional similarity measures based on different stylistic
features.
Different types of character n-grams — n-grams containing punctuation marks,
n-grams from the beginning or the end of a word, n-grams from the middle of a
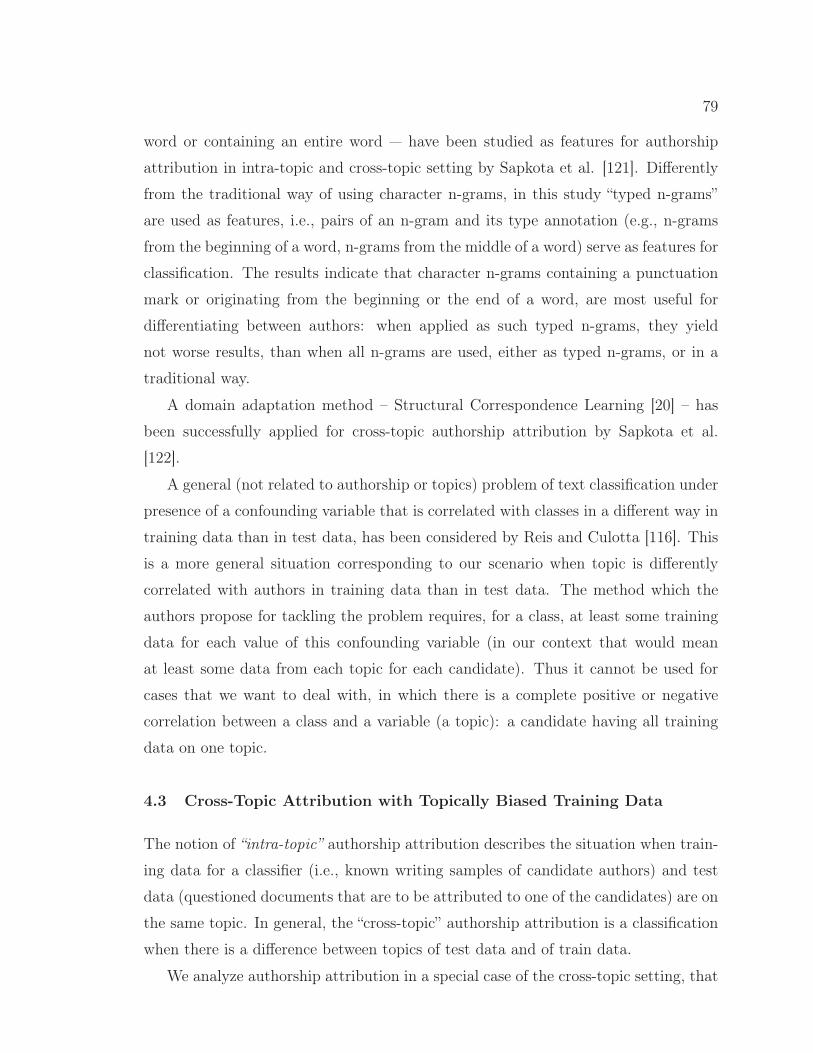
79
word or containing an entire word — have been studied as features for authorship
attribution in intra-topic and cross-topic setting by Sapkota et al. [121]. Differently
from the traditional way of using character n-grams, in this study “typed n-grams”
are used as features, i.e., pairs of an n-gram and its type annotation (e.g., n-grams
from the beginning of a word, n-grams from the middle of a word) serve as features for
classification. The results indicate that character n-grams containing a punctuation
mark or originating from the beginning or the end of a word, are most useful for
differentiating between authors: when applied as such typed n-grams, they yield
not worse results, than when all n-grams are used, either as typed n-grams, or in a
traditional way.
A domain adaptation method – Structural Correspondence Learning [20] – has
been successfully applied for cross-topic authorship attribution by Sapkota et al.
[122].
A general (not related to authorship or topics) problem of text classification under
presence of a confounding variable that is correlated with classes in a different way in
training data than in test data, has been considered by Reis and Culotta [116]. This
is a more general situation corresponding to our scenario when topic is differently
correlated with authors in training data than in test data. The method which the
authors propose for tackling the problem requires, for a class, at least some training
data for each value of this confounding variable (in our context that would mean
at least some data from each topic for each candidate). Thus it cannot be used for
cases that we want to deal with, in which there is a complete positive or negative
correlation between a class and a variable (a topic): a candidate having all training
data on one topic.
4.3 Cross-Topic Attribution with Topically Biased Training Data
The notion of “intra-topic” authorship attribution describes the situation when train-
ing data for a classifier (i.e., known writing samples of candidate authors) and test
data (questioned documents that are to be attributed to one of the candidates) are on
the same topic. In general, the “cross-topic” authorship attribution is a classification
when there is a difference between topics of test data and of train data.
We analyze authorship attribution in a special case of the cross-topic setting, that
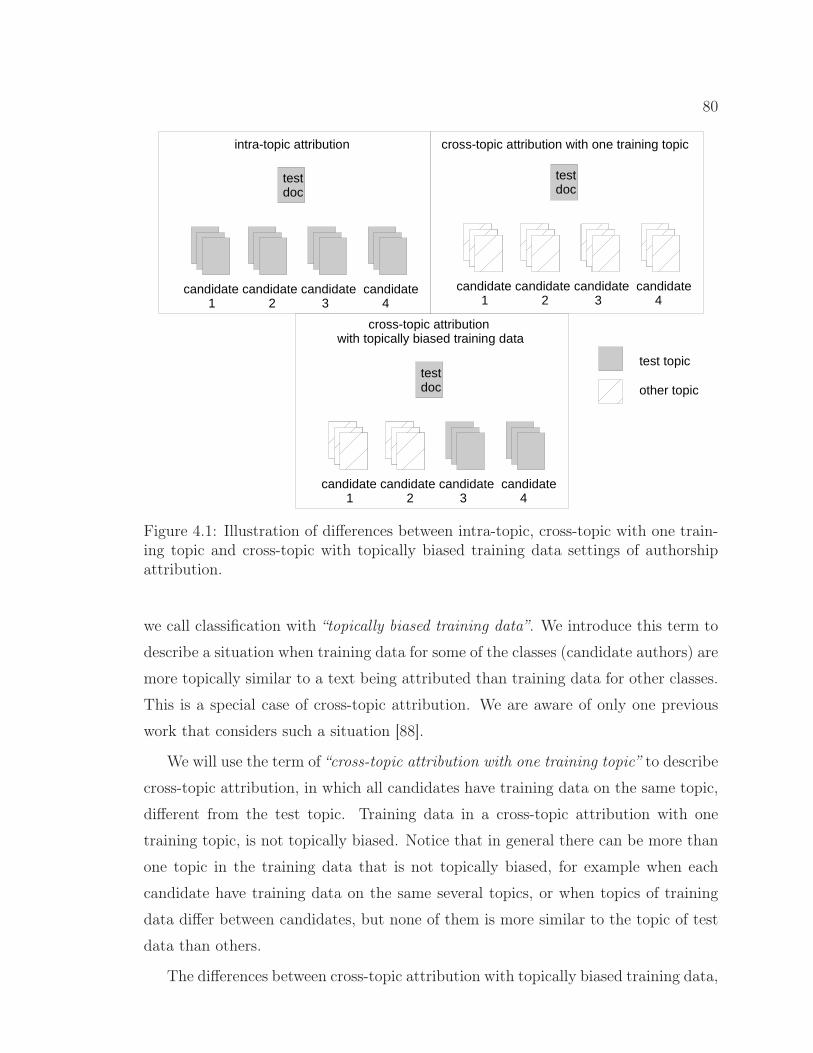
80
�����������������������������������������������������������������������������������������
�������
�������������������������������������������
����������������������������������������������������������������������������������������
�������
����������������������������������������������������������������������������������������
�������
���������������������
��������������������������������������������������������
����������
�����������
Figure 4.1: Illustration of differences between intra-topic, cross-topic with one train-ing topic and cross-topic with topically biased training data settings of authorshipattribution.
we call classification with “topically biased training data”. We introduce this term to
describe a situation when training data for some of the classes (candidate authors) are
more topically similar to a text being attributed than training data for other classes.
This is a special case of cross-topic attribution. We are aware of only one previous
work that considers such a situation [88].
We will use the term of “cross-topic attribution with one training topic” to describe
cross-topic attribution, in which all candidates have training data on the same topic,
different from the test topic. Training data in a cross-topic attribution with one
training topic, is not topically biased. Notice that in general there can be more than
one topic in the training data that is not topically biased, for example when each
candidate have training data on the same several topics, or when topics of training
data differ between candidates, but none of them is more similar to the topic of test
data than others.
The differences between cross-topic attribution with topically biased training data,
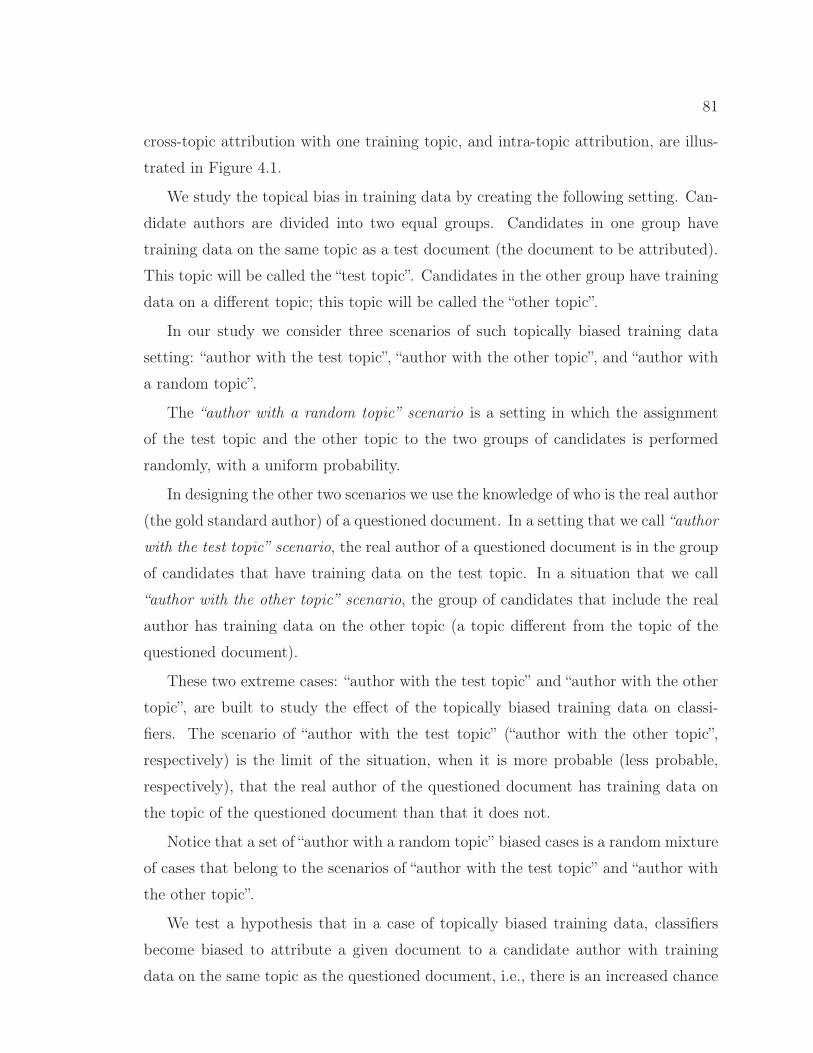
81
cross-topic attribution with one training topic, and intra-topic attribution, are illus-
trated in Figure 4.1.
We study the topical bias in training data by creating the following setting. Can-
didate authors are divided into two equal groups. Candidates in one group have
training data on the same topic as a test document (the document to be attributed).
This topic will be called the “test topic”. Candidates in the other group have training
data on a different topic; this topic will be called the “other topic”.
In our study we consider three scenarios of such topically biased training data
setting: “author with the test topic”, “author with the other topic”, and “author with
a random topic”.
The “author with a random topic” scenario is a setting in which the assignment
of the test topic and the other topic to the two groups of candidates is performed
randomly, with a uniform probability.
In designing the other two scenarios we use the knowledge of who is the real author
(the gold standard author) of a questioned document. In a setting that we call “author
with the test topic” scenario, the real author of a questioned document is in the group
of candidates that have training data on the test topic. In a situation that we call
“author with the other topic” scenario, the group of candidates that include the real
author has training data on the other topic (a topic different from the topic of the
questioned document).
These two extreme cases: “author with the test topic” and “author with the other
topic”, are built to study the effect of the topically biased training data on classi-
fiers. The scenario of “author with the test topic” (“author with the other topic”,
respectively) is the limit of the situation, when it is more probable (less probable,
respectively), that the real author of the questioned document has training data on
the topic of the questioned document than that it does not.
Notice that a set of “author with a random topic” biased cases is a random mixture
of cases that belong to the scenarios of “author with the test topic” and “author with
the other topic”.
We test a hypothesis that in a case of topically biased training data, classifiers
become biased to attribute a given document to a candidate author with training
data on the same topic as the questioned document, i.e., there is an increased chance
82
that classifiers will choose a candidate whose writing samples are on the same topic
as the topic of the questioned document, than a candidate whose writing samples are
on a different topic.
If a classifier is biased towards attributing a test document to a candidate with
training data on the test topic, then in the “author with the test topic” scenario, the
classifier would perform better than in the “author with the other topic” scenario. But
such a fact would not be enough to confirm this hypothesis, because we know from
previous research, that the case when all candidates have training data on the other
topic leads to a lower performance than in the case when all candidates have training
data on the test topic, i.e., without a topical bias in training data, it is more difficult
for classifiers to recognize an author, if the topic of the training data is different from
the test data.
We look for a stronger evidence of the hypothesis. If a classifier tends to choose a
topically similar candidate, then its performance in the topically biased “author with
the test topic” scenario will be better than the performance in the situation when
all candidates have training data on the test topic (the intra-topic scenario). And
similarly, such a biased classifier will perform worse in the “author with the other
topic” scenario than when all candidates have training data on the other topic (the
cross-topic attribution with one training topic).
We also analyze how often a misclassified document is attributed to a candidate
that has training data on the same topic as the topic of the document.
4.4 Features and Classifiers
We study two types of features considered to be best performing features for au-
thorship identification: most frequent character n-grams and most frequent words
[132, 83]. Character n-grams have been also shown to be the most robust features
for cross-topic attribution [133, 123, 88]. We choose character n-grams of the length
three, which are frequently used for authorship analysis [133, 123], and which in
our preliminary experiments on one of evaluation datasets (guardian4a) performed
better than character n-grams of the length 4, 5 or 6.
We use two classifiers in our analysis. The first one is Support Vector Machine
(SVM) [33], frequently used in authorship attribution, also for cross-topic analysis
83
[36, 5, 151, 133, 123, 121]. The second algorithm is Common N-Gram Classifier
(CNG) [75], which is an example of a similarity based classifier successfully used for
authorship identification, including cross-topic attribution [75, 67, 130, 88].
For SVM, we use the Weka [55] system, and their implementation of linear SVM
with default parameters. The implementation uses sequential minimal optimization
(SM0) [112] training, and pairwise extension to multi-class classification, i.e., a bi-
nary SVM is trained for each pair of classes, and the final classification is performed
by voting of the binary classifiers.1 Notice that our aim is not to tune parameters
of the algorithm for the best performance, but rather to study the behaviour of the
algorithm. In using a linear SVM without tuning its parameters, we follow the ap-
proach of previous research of cross-topic authorship attribution [133, 123, 121]. We
use frequency as values of features.
The CNG classifier is described in detail in Section 2.2. It represents each class
separately by a list of its most frequent n-grams of a given type (such a list of n-
grams with their normalized frequency is called an author’s profile). The length of
the profiles is a parameter of the algorithm. If for some class it is impossible to
create a profile of a prescribed length (because the total number of unique n-grams
in the class is less than the prescribed parameter), the classifier becomes sensitive to
that imbalance and more likely to attribute an instance to the class with the shortest
profile [130]. We deal with that by introducing a modification to the original CNG
algorithm: whenever for a given length parameter it is impossible to create a profile
of that length for any of the classes, the profiles of all classes are cut to an equal
length, the maximum one for which it is possible.
The Perl package Text::Ngrams [74] was used to extract utf8-encoded character
n-grams and words, and their frequencies.
4.5 Experiments on the Effect of Topically Biased Training Data
In this section we describe our experimental evaluation of the effect yielded on au-
thorship attribution classifiers by topically biased training data.
1Further details about SVM implementation and parameters are available in Appendix B.
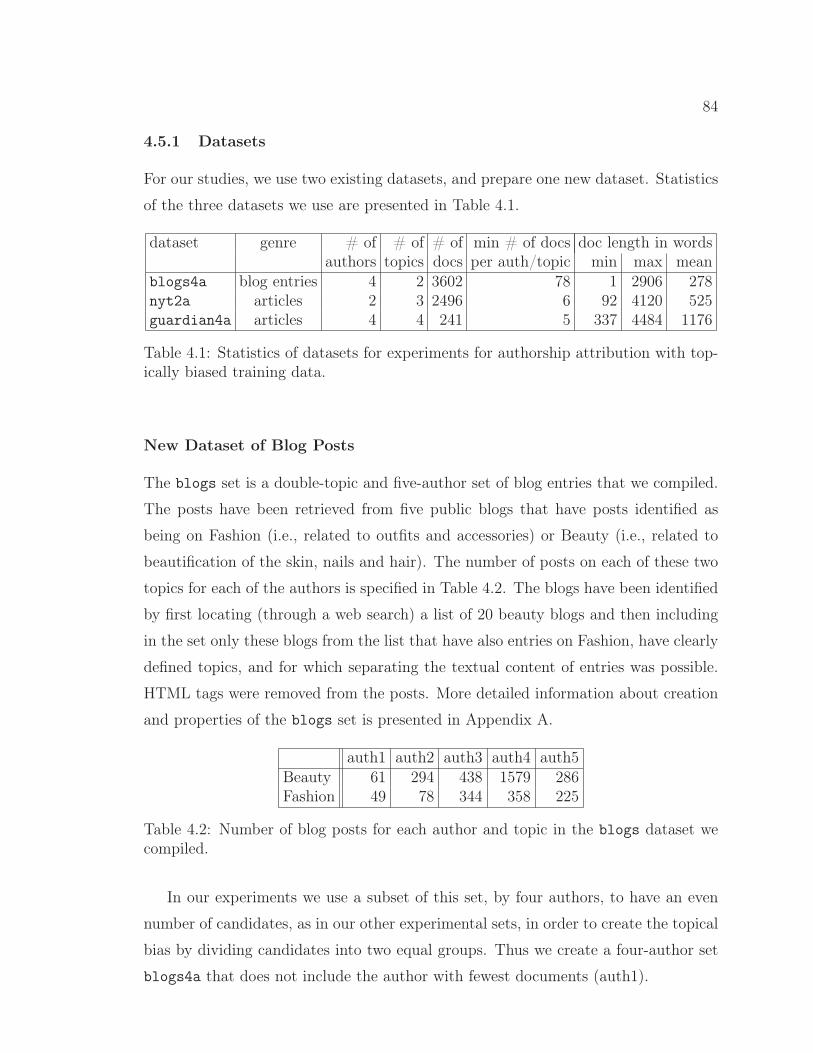
84
4.5.1 Datasets
For our studies, we use two existing datasets, and prepare one new dataset. Statistics
of the three datasets we use are presented in Table 4.1.
dataset genre # of # of # of min # of docs doc length in wordsauthors topics docs per auth/topic min max mean
blogs4a blog entries 4 2 3602 78 1 2906 278nyt2a articles 2 3 2496 6 92 4120 525guardian4a articles 4 4 241 5 337 4484 1176
Table 4.1: Statistics of datasets for experiments for authorship attribution with top-ically biased training data.
New Dataset of Blog Posts
The blogs set is a double-topic and five-author set of blog entries that we compiled.
The posts have been retrieved from five public blogs that have posts identified as
being on Fashion (i.e., related to outfits and accessories) or Beauty (i.e., related to
beautification of the skin, nails and hair). The number of posts on each of these two
topics for each of the authors is specified in Table 4.2. The blogs have been identified
by first locating (through a web search) a list of 20 beauty blogs and then including
in the set only these blogs from the list that have also entries on Fashion, have clearly
defined topics, and for which separating the textual content of entries was possible.
HTML tags were removed from the posts. More detailed information about creation
and properties of the blogs set is presented in Appendix A.
auth1 auth2 auth3 auth4 auth5Beauty 61 294 438 1579 286Fashion 49 78 344 358 225
Table 4.2: Number of blog posts for each author and topic in the blogs dataset wecompiled.
In our experiments we use a subset of this set, by four authors, to have an even
number of candidates, as in our other experimental sets, in order to create the topical
bias by dividing candidates into two equal groups. Thus we create a four-author set
blogs4a that does not include the author with fewest documents (auth1).
85
Other Datasets
In addition to our newly compiled set blogs4a, we perform experiments on two
datasets of newspaper articles: nyt2a and guardian4a.
The guardian4a set consists of editorial articles from “The Guardian”. It is a
subset of the dataset created by Stamatatos [133]. The articles are on four topics:
World, U.K., Politics and Society. The original set is highly unbalanced in terms
of the number of documents per author on different topics. In order to be able to
perform experiments in a setting of training size balance (i.e., of the same amount of
training data for each candidate), we exclude authors that have fewer than 5 articles
on a topic. To have an even number of authors, from the remaining 5 authors we
further exclude one that would make the test set most unbalanced in terms of the
number of documents by an author.2 This results in the guardian4a set of four
authors on four topics.
The nyt2a set contains articles from “The New York Times”, selected from the New
York Times Annotated Corpus [120]. It is a subset of the two-author set compiled by
Schein et. al [125]. In this case also, in order to be able to control for equal training
data amount for each author, we exclude from the original set a topic, on which one
of the authors has only one article. This results in a set of articles of two authors on
three topics: Motion Pictures, Dancing and Theater.
4.5.2 Experimental Measures
Performance Measure
In our datasets, numbers of test documents are not balanced with respect to classes.
Because of that, we choose macro-averaged F1 as a measure of classifiers’ perfor-
mance. Macro-averaged F1 measure is a measure used for evaluating classification on
unbalanced datasets [27].
Macro-averaged F1 is an arithmetic average of F1 values for classes. F1 measure
for a class is defined by the following formula:
F1 = 2 · P ·RP +R
, (4.1)
2The authors included in the guardian4a set, have in the original set the following labels: hugoy-oung, maryriddell, pollytoynbee, willhutton.
86
where P (precision) is the fraction of all instances assigned to the class by a classifier
that are classified correctly, and R (recall) is the fraction of all instances from the
class, according to the ground truth, that are classified correctly.
Topic Match Ratio in Misclassified Documents
To further analyze the behaviour of classifiers, we study instances that are misclas-
sified under the setting of topical bias of the “author with the test topic” and the
“author with the other topic” scenarios. We consider the fraction of misclassified doc-
uments that get attributed to a candidate with training data on the same topic as a
topic of the misclassified document. We call this fraction the “topic match ratio” in
misclassified documents.
For the four-author sets: blogs4a and guardian4a, when a document is misclas-
sified, the incorrect author is selected among the other three candidates. Under the
setting of the topical bias of “author with the test topic”, exactly one of these three
incorrect candidates has training data on the test topic, while under the setting of
the topical bias of “author with the other topic”, exactly two of these candidates have
training data on the test topic. Thus if the topical similarity does not play a role
in the selection of the incorrect candidate, the topic match ratio among misclassified
documents should be close to the random value 1/3 for “author with the test topic”
scenario and 2/3 for “author with the other topic” scenario.
Notice that we cannot analyze topic match ratios on misclassified cases for set
nyt2a. That is because this set has only two candidates, so any misclassified document
is attributed to the single incorrect candidate. And so on that set, for any classifier,
the topic match ratio in misclassified cases is 0 in the “author with the test topic”
scenario — because then the single incorrect candidate has training data on the other
topic, and it is 1 in the “author with the other topic” scenario — because then the
single incorrect candidate has training data on the test topic.
87
4.5.3 Experimental Setting
Controlling for Training Data Size
In order to eliminate the influence of the imbalance of the size of training data on
the effect of the topical bias in training data on classifiers, we control for the size
of training data for each class. The training data is always size-wise balanced: each
candidate has exactly the same number of documents as training data. As for some
authors and topics we have just a few documents (see Table 4.1), we achieve that
by randomly sampling from a given dataset the same number of training documents
for each candidate for each test document separately. That means that a classifier
is trained separately for each document to be attributed, using as training data for
a candidate a fixed number of documents randomly selected from the candidate’s
remaining documents (with given prescribed topic constraints). This is similar to the
leave-one-out framework of testing, with the difference that for a given test docu-
ment, not all remaining data are used for training, but documents sampled from the
remaining data. The number of training documents selected for each candidate is
four in the cases of guardian4a and nyt2a and ten in the case of blogs4a.
Training Data Scenarios
We perform experiments in five scenarios: the intra-topic attribution, the cross-topic
attribution with one training topic, and the three scenarios of cross-topic attribution
with topically biased training data: “author with the test topic”, “author with the
other topic”, and “author with a random topic”.
In the intra-topic scenario, the training documents are selected from the same
topic as the test document. For the cross-topic attribution with one training topic,
the training documents are sampled from one topic different than the topic of the
test document.
For the topically biased scenarios, the candidates are randomly divided into two
equal groups, with one group obtaining training documents selected from the test
topic, the other group obtaining training documents selected from a different topic. In
the “author with a random topic” scenario, the assignment of a group of candidates to
the test topic is performed randomly with a uniform probability, while in the “author
88
with the test topic” and the “author with the other topic” scenarios, it is determined
by the fact, which group of candidates includes the real author.
In sets nyt2a and guardian4a there are respectively 3 and 4 topics, thus there are
respectively 2 and 3 topics to choose as the “other topic” for any given test document
in the cross-topic scenarios. We make use of all of the topics, by creating more than
one batch of training data sets (2 batches for nyt2a and 3 batches for guardian4a).
A given test document has a different “other topic” in the training data in each batch,
with the topics randomly divided between the batches.3 Measures are averaged over
batches.
For each test document in a given batch, there is a match on the “other topic”
training data between the four cross-topic scenarios. Namely, for each test document
within a given batch, the “other topic” is identical across the cross-topic scenarios
(based on one random assignment), and candidates that have training data on the
“other topic”, have the same training files for that test document in that batch, across
the cross-topic scenarios (the files are sampled randomly once).
Numbers of Features
We perform experiments for different numbers of features. For SVM, which uses
vector space representation of documents, the number of features is the number of
dimensions of the vector space. CNG represents classes and a test document using
separate lists of most frequent n-grams (profiles). The number of features of CNG
means the classifier’s profile length parameter.
For most frequent character 3-grams, we investigate the numbers of features start-
ing from 500 with an increase step of 500. For most frequent words the considered
numbers of features start from 100, with an increase step of 100 up to 2000, and with
an increase step of 500 above 2000 words. We carry the analysis up to a number higher
than the maximum possible number of features for a given classifier/dataset/scenario
combination.
3Detailed list of training files for each test file in each scenario and each batch, is available uponrequest.
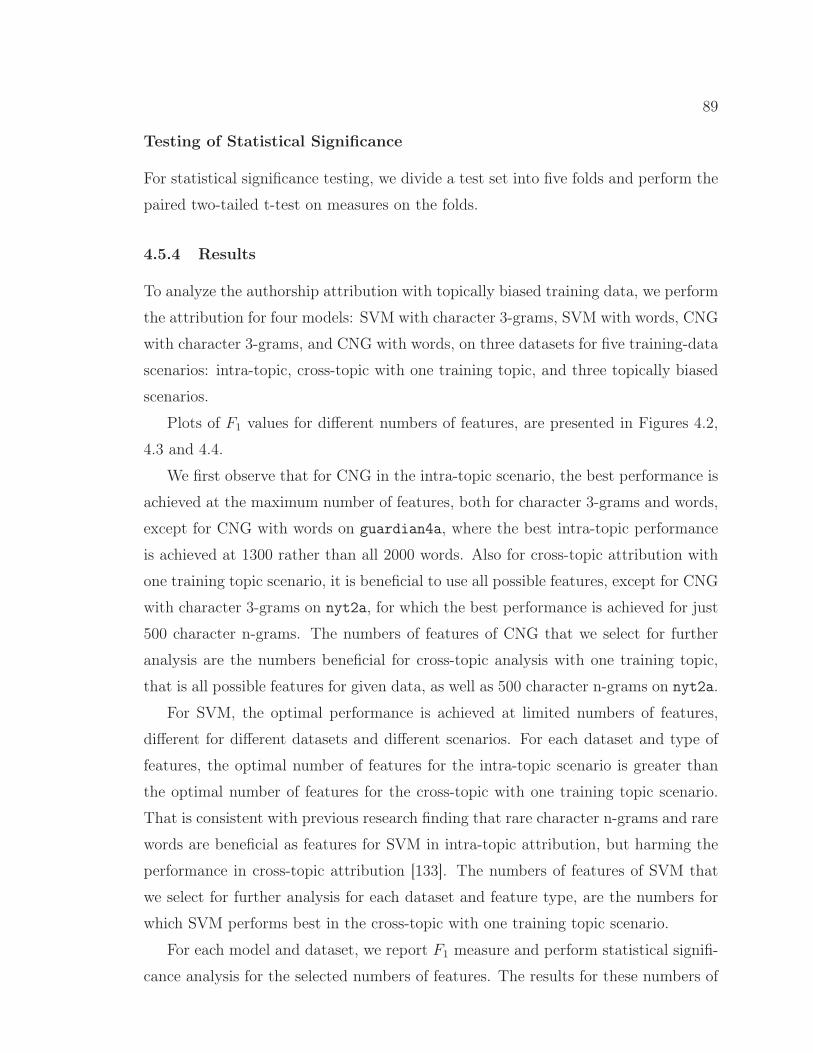
89
Testing of Statistical Significance
For statistical significance testing, we divide a test set into five folds and perform the
paired two-tailed t-test on measures on the folds.
4.5.4 Results
To analyze the authorship attribution with topically biased training data, we perform
the attribution for four models: SVM with character 3-grams, SVM with words, CNG
with character 3-grams, and CNG with words, on three datasets for five training-data
scenarios: intra-topic, cross-topic with one training topic, and three topically biased
scenarios.
Plots of F1 values for different numbers of features, are presented in Figures 4.2,
4.3 and 4.4.
We first observe that for CNG in the intra-topic scenario, the best performance is
achieved at the maximum number of features, both for character 3-grams and words,
except for CNG with words on guardian4a, where the best intra-topic performance
is achieved at 1300 rather than all 2000 words. Also for cross-topic attribution with
one training topic scenario, it is beneficial to use all possible features, except for CNG
with character 3-grams on nyt2a, for which the best performance is achieved for just
500 character n-grams. The numbers of features of CNG that we select for further
analysis are the numbers beneficial for cross-topic analysis with one training topic,
that is all possible features for given data, as well as 500 character n-grams on nyt2a.
For SVM, the optimal performance is achieved at limited numbers of features,
different for different datasets and different scenarios. For each dataset and type of
features, the optimal number of features for the intra-topic scenario is greater than
the optimal number of features for the cross-topic with one training topic scenario.
That is consistent with previous research finding that rare character n-grams and rare
words are beneficial as features for SVM in intra-topic attribution, but harming the
performance in cross-topic attribution [133]. The numbers of features of SVM that
we select for further analysis for each dataset and feature type, are the numbers for
which SVM performs best in the cross-topic with one training topic scenario.
For each model and dataset, we report F1 measure and perform statistical signifi-
cance analysis for the selected numbers of features. The results for these numbers of
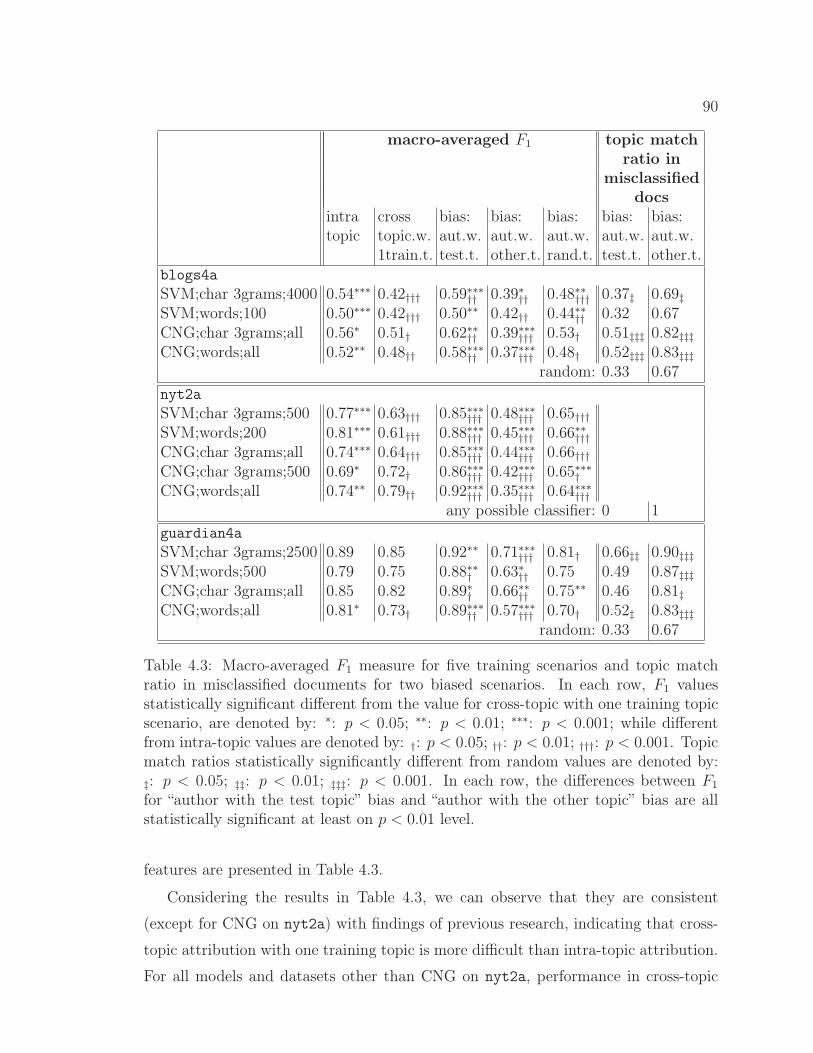
90
macro-averaged F1 topic matchratio in
misclassifieddocs
intra cross bias: bias: bias: bias: bias:topic topic.w. aut.w. aut.w. aut.w. aut.w. aut.w.
1train.t. test.t. other.t. rand.t. test.t. other.t.blogs4aSVM;char 3grams;4000 0.54∗∗∗ 0.42††† 0.59∗∗∗†† 0.39∗†† 0.48∗∗††† 0.37‡ 0.69‡SVM;words;100 0.50∗∗∗ 0.42††† 0.50∗∗ 0.42†† 0.44∗∗†† 0.32 0.67CNG;char 3grams;all 0.56∗ 0.51† 0.62∗∗†† 0.39∗∗∗††† 0.53† 0.51‡‡‡ 0.82‡‡‡CNG;words;all 0.52∗∗ 0.48†† 0.58∗∗∗†† 0.37∗∗∗††† 0.48† 0.52‡‡‡ 0.83‡‡‡
random: 0.33 0.67nyt2aSVM;char 3grams;500 0.77∗∗∗ 0.63††† 0.85∗∗∗††† 0.48∗∗∗††† 0.65†††SVM;words;200 0.81∗∗∗ 0.61††† 0.88∗∗∗††† 0.45∗∗∗††† 0.66∗∗†††CNG;char 3grams;all 0.74∗∗∗ 0.64††† 0.85∗∗∗††† 0.44∗∗∗††† 0.66†††CNG;char 3grams;500 0.69∗ 0.72† 0.86∗∗∗††† 0.42∗∗∗††† 0.65∗∗∗†CNG;words;all 0.74∗∗ 0.79†† 0.92∗∗∗††† 0.35∗∗∗††† 0.64∗∗∗†††
any possible classifier: 0 1guardian4aSVM;char 3grams;2500 0.89 0.85 0.92∗∗ 0.71∗∗∗††† 0.81† 0.66‡‡ 0.90‡‡‡SVM;words;500 0.79 0.75 0.88∗∗† 0.63∗†† 0.75 0.49 0.87‡‡‡CNG;char 3grams;all 0.85 0.82 0.89∗† 0.66∗∗†† 0.75∗∗ 0.46 0.81‡CNG;words;all 0.81∗ 0.73† 0.89∗∗∗†† 0.57∗∗∗††† 0.70† 0.52‡ 0.83‡‡‡
random: 0.33 0.67
Table 4.3: Macro-averaged F1 measure for five training scenarios and topic matchratio in misclassified documents for two biased scenarios. In each row, F1 valuesstatistically significant different from the value for cross-topic with one training topicscenario, are denoted by: ∗: p < 0.05; ∗∗: p < 0.01; ∗∗∗: p < 0.001; while differentfrom intra-topic values are denoted by: †: p < 0.05; ††: p < 0.01; †††: p < 0.001. Topicmatch ratios statistically significantly different from random values are denoted by:‡: p < 0.05; ‡‡: p < 0.01; ‡‡‡: p < 0.001. In each row, the differences between F1
for “author with the test topic” bias and “author with the other topic” bias are allstatistically significant at least on p < 0.01 level.
features are presented in Table 4.3.
Considering the results in Table 4.3, we can observe that they are consistent
(except for CNG on nyt2a) with findings of previous research, indicating that cross-
topic attribution with one training topic is more difficult than intra-topic attribution.
For all models and datasets other than CNG on nyt2a, performance in cross-topic
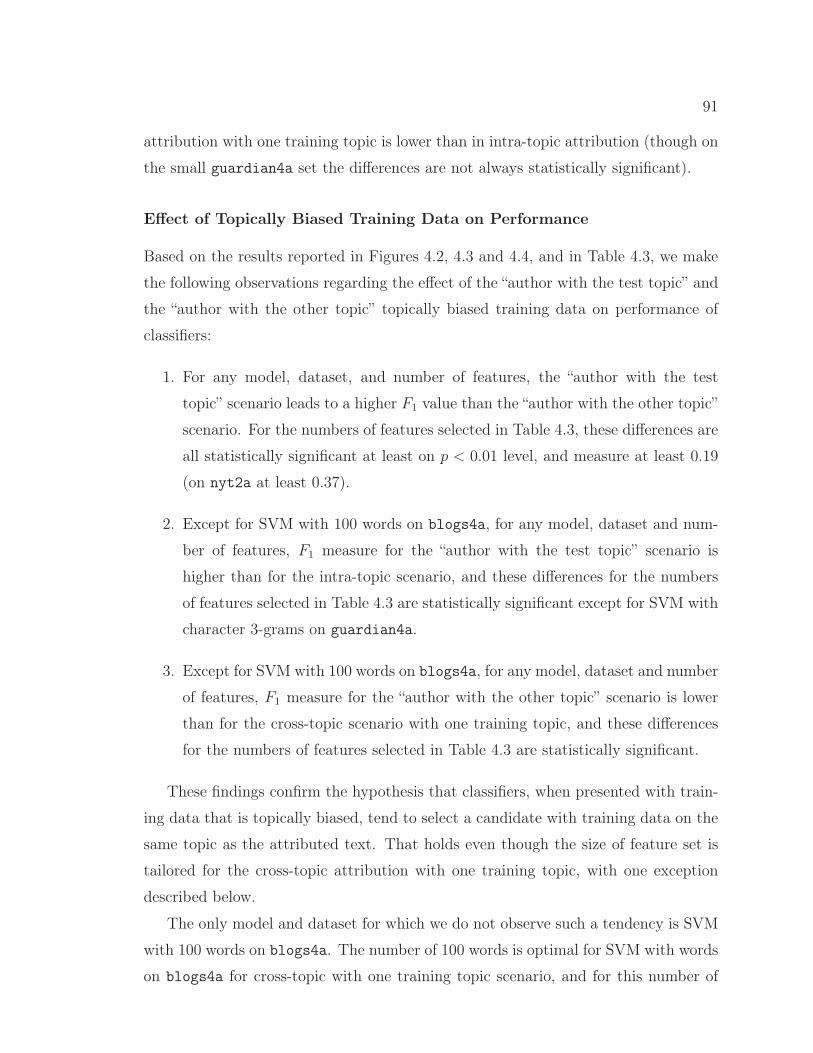
91
attribution with one training topic is lower than in intra-topic attribution (though on
the small guardian4a set the differences are not always statistically significant).
Effect of Topically Biased Training Data on Performance
Based on the results reported in Figures 4.2, 4.3 and 4.4, and in Table 4.3, we make
the following observations regarding the effect of the “author with the test topic” and
the “author with the other topic” topically biased training data on performance of
classifiers:
1. For any model, dataset, and number of features, the “author with the test
topic” scenario leads to a higher F1 value than the “author with the other topic”
scenario. For the numbers of features selected in Table 4.3, these differences are
all statistically significant at least on p < 0.01 level, and measure at least 0.19
(on nyt2a at least 0.37).
2. Except for SVM with 100 words on blogs4a, for any model, dataset and num-
ber of features, F1 measure for the “author with the test topic” scenario is
higher than for the intra-topic scenario, and these differences for the numbers
of features selected in Table 4.3 are statistically significant except for SVM with
character 3-grams on guardian4a.
3. Except for SVM with 100 words on blogs4a, for any model, dataset and number
of features, F1 measure for the “author with the other topic” scenario is lower
than for the cross-topic scenario with one training topic, and these differences
for the numbers of features selected in Table 4.3 are statistically significant.
These findings confirm the hypothesis that classifiers, when presented with train-
ing data that is topically biased, tend to select a candidate with training data on the
same topic as the attributed text. That holds even though the size of feature set is
tailored for the cross-topic attribution with one training topic, with one exception
described below.
The only model and dataset for which we do not observe such a tendency is SVM
with 100 words on blogs4a. The number of 100 words is optimal for SVM with words
on blogs4a for cross-topic with one training topic scenario, and for this number of
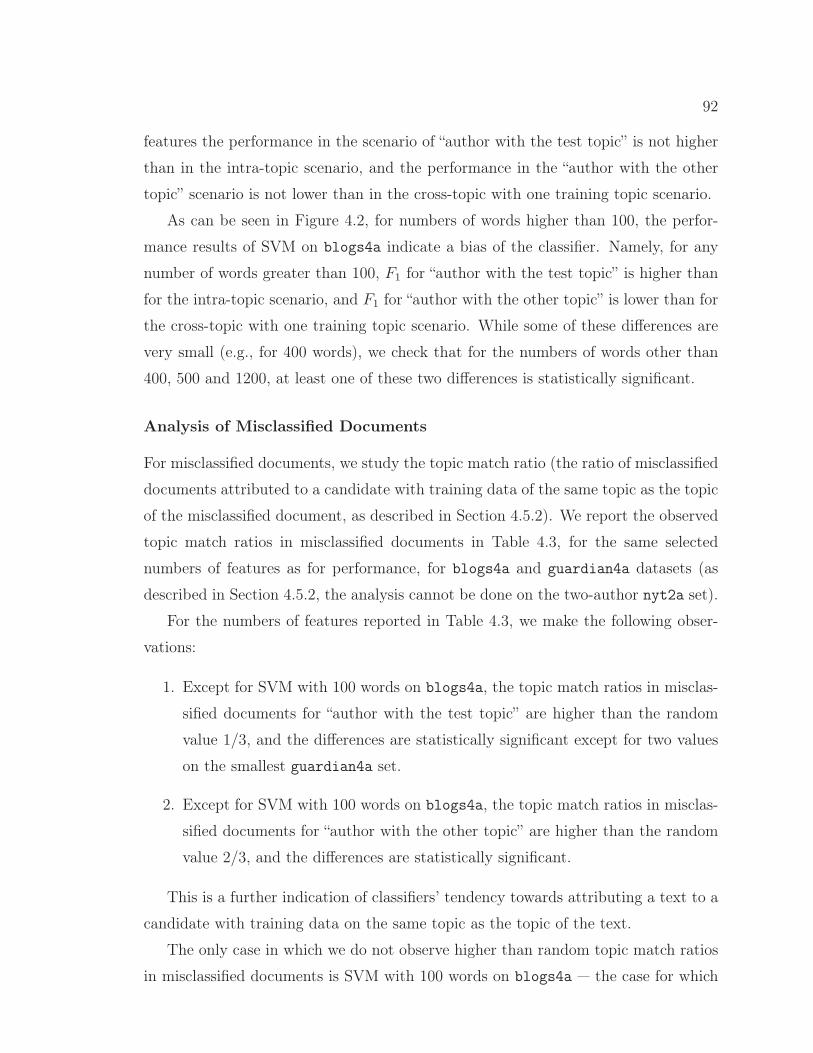
92
features the performance in the scenario of “author with the test topic” is not higher
than in the intra-topic scenario, and the performance in the “author with the other
topic” scenario is not lower than in the cross-topic with one training topic scenario.
As can be seen in Figure 4.2, for numbers of words higher than 100, the perfor-
mance results of SVM on blogs4a indicate a bias of the classifier. Namely, for any
number of words greater than 100, F1 for “author with the test topic” is higher than
for the intra-topic scenario, and F1 for “author with the other topic” is lower than for
the cross-topic with one training topic scenario. While some of these differences are
very small (e.g., for 400 words), we check that for the numbers of words other than
400, 500 and 1200, at least one of these two differences is statistically significant.
Analysis of Misclassified Documents
For misclassified documents, we study the topic match ratio (the ratio of misclassified
documents attributed to a candidate with training data of the same topic as the topic
of the misclassified document, as described in Section 4.5.2). We report the observed
topic match ratios in misclassified documents in Table 4.3, for the same selected
numbers of features as for performance, for blogs4a and guardian4a datasets (as
described in Section 4.5.2, the analysis cannot be done on the two-author nyt2a set).
For the numbers of features reported in Table 4.3, we make the following obser-
vations:
1. Except for SVM with 100 words on blogs4a, the topic match ratios in misclas-
sified documents for “author with the test topic” are higher than the random
value 1/3, and the differences are statistically significant except for two values
on the smallest guardian4a set.
2. Except for SVM with 100 words on blogs4a, the topic match ratios in misclas-
sified documents for “author with the other topic” are higher than the random
value 2/3, and the differences are statistically significant.
This is a further indication of classifiers’ tendency towards attributing a text to a
candidate with training data on the same topic as the topic of the text.
The only case in which we do not observe higher than random topic match ratios
in misclassified documents is SVM with 100 words on blogs4a — the case for which
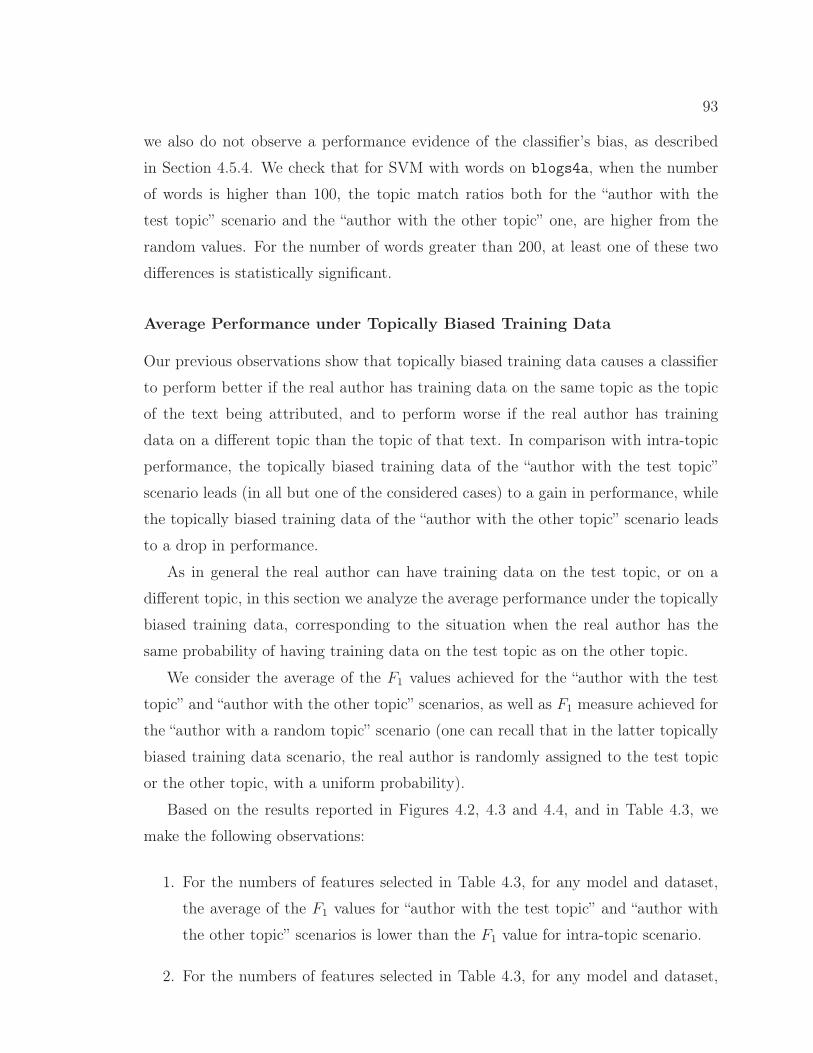
93
we also do not observe a performance evidence of the classifier’s bias, as described
in Section 4.5.4. We check that for SVM with words on blogs4a, when the number
of words is higher than 100, the topic match ratios both for the “author with the
test topic” scenario and the “author with the other topic” one, are higher from the
random values. For the number of words greater than 200, at least one of these two
differences is statistically significant.
Average Performance under Topically Biased Training Data
Our previous observations show that topically biased training data causes a classifier
to perform better if the real author has training data on the same topic as the topic
of the text being attributed, and to perform worse if the real author has training
data on a different topic than the topic of that text. In comparison with intra-topic
performance, the topically biased training data of the “author with the test topic”
scenario leads (in all but one of the considered cases) to a gain in performance, while
the topically biased training data of the “author with the other topic” scenario leads
to a drop in performance.
As in general the real author can have training data on the test topic, or on a
different topic, in this section we analyze the average performance under the topically
biased training data, corresponding to the situation when the real author has the
same probability of having training data on the test topic as on the other topic.
We consider the average of the F1 values achieved for the “author with the test
topic” and “author with the other topic” scenarios, as well as F1 measure achieved for
the “author with a random topic” scenario (one can recall that in the latter topically
biased training data scenario, the real author is randomly assigned to the test topic
or the other topic, with a uniform probability).
Based on the results reported in Figures 4.2, 4.3 and 4.4, and in Table 4.3, we
make the following observations:
1. For the numbers of features selected in Table 4.3, for any model and dataset,
the average of the F1 values for “author with the test topic” and “author with
the other topic” scenarios is lower than the F1 value for intra-topic scenario.
2. For the numbers of features selected in Table 4.3, for any model and dataset,
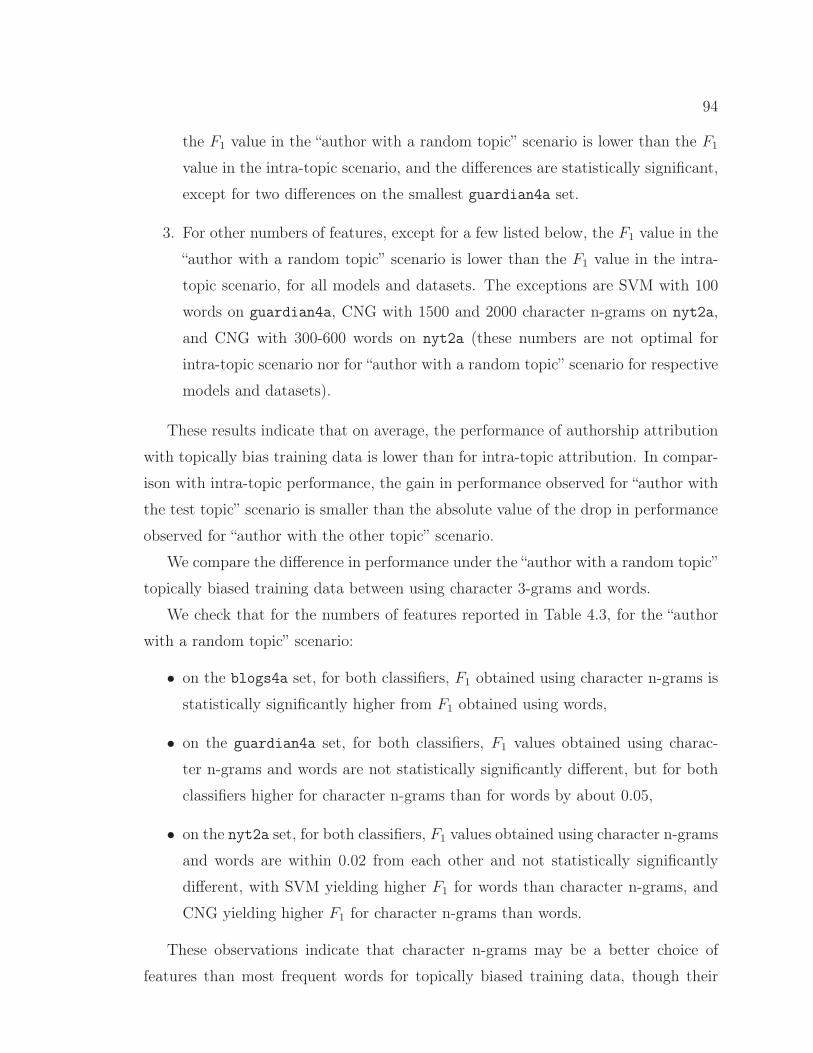
94
the F1 value in the “author with a random topic” scenario is lower than the F1
value in the intra-topic scenario, and the differences are statistically significant,
except for two differences on the smallest guardian4a set.
3. For other numbers of features, except for a few listed below, the F1 value in the
“author with a random topic” scenario is lower than the F1 value in the intra-
topic scenario, for all models and datasets. The exceptions are SVM with 100
words on guardian4a, CNG with 1500 and 2000 character n-grams on nyt2a,
and CNG with 300-600 words on nyt2a (these numbers are not optimal for
intra-topic scenario nor for “author with a random topic” scenario for respective
models and datasets).
These results indicate that on average, the performance of authorship attribution
with topically bias training data is lower than for intra-topic attribution. In compar-
ison with intra-topic performance, the gain in performance observed for “author with
the test topic” scenario is smaller than the absolute value of the drop in performance
observed for “author with the other topic” scenario.
We compare the difference in performance under the “author with a random topic”
topically biased training data between using character 3-grams and words.
We check that for the numbers of features reported in Table 4.3, for the “author
with a random topic” scenario:
• on the blogs4a set, for both classifiers, F1 obtained using character n-grams is
statistically significantly higher from F1 obtained using words,
• on the guardian4a set, for both classifiers, F1 values obtained using charac-
ter n-grams and words are not statistically significantly different, but for both
classifiers higher for character n-grams than for words by about 0.05,
• on the nyt2a set, for both classifiers, F1 values obtained using character n-grams
and words are within 0.02 from each other and not statistically significantly
different, with SVM yielding higher F1 for words than character n-grams, and
CNG yielding higher F1 for character n-grams than words.
These observations indicate that character n-grams may be a better choice of
features than most frequent words for topically biased training data, though their
95
advantage is not definitive: depending on a dataset, character n-grams perform either
better or not worse than most frequent words.
In particular we notice that character n-grams perform statistically significantly
better than words for SVM on blogs4a for “author with a random topic”. That
indicates that even though SVM with 100 words on blogs4a is a model that, as we
have seen before, does not show a bias towards a topically similar candidate, it is a
sub-optimal choice of a model on this dataset with comparison to SVM with character
n-grams.
4.6 Feature Set Modification for Reducing Classifiers’ Bias
We present a modification of a feature set of character n-grams that, in the presence
of a topical bias in training data, reduces the bias of a classifier towards a candidate
with training data topically more similar to a document that is being attributed.
4.6.1 Modification of the Character N-Gram Feature Set
We assume that the information about the topics of training data documents is avail-
able. The information about the topic of test data is not needed and not used.
We propose removing from a feature set, the character n-grams that originate
from stems (the main meaning-bearing morphemes) of topical words characteristic
for the topics present in the training data.
As it is possible that training data for a given topic may be equivalent to training
data for one class (as, for example, in our biased scenarios on nyt2a), we cannot simply
remove n-grams that we find distinctive for a topic, because in this way we could
remove exactly the n-grams that are distinctive for a candidate. That is why we want
to only remove n-grams that come from words that are topical — and characteristic
for the topics in the training data.
To find the characteristic topical stems of words, we remove stop words, apply
stemming to the remaining words (after turning them to lowercase), and then perform
an analysis of differences of frequencies of stems between the topics.
In our experiments we chose G (log-likelihood) statistic [115] to evaluate statistical
significance of a difference of a stem frequencies in topics. The log-likelihood statistic
96
G for a stem is given by the formula:
G = 2((
c1 lnc1E1
)+
(c2 ln
c2E2
)), (4.2)
where Ei = tic1+c2t1+t2
for i = 1, 2, t1 and t2, respectively, are the total counts of stems in
one and the other training topic, and c1 and c2, respectively, are counts of the given
stem in these topics.
To choose the topic-characteristic stems, we calculate p-values corresponding to
the G values (using the χ2 distribution), and select the stems with the statistical
significance of the difference in topic frequencies on the level of p < 0.05.
The n-grams that (when normalized to lowercase) appear within such topic-
characteristic stems, are not used in the sets of features of a classifier.
4.6.2 Evaluation
We apply the modification of the feature set of character n-grams to the three biased
scenarios, for the character n-gram based models considered before (see Table 4.3).
For each character n-gram model, we use the same number of features as in Table
4.3, but without the character n-grams originating from topic-characteristic stems.
In our experiments we use Snowball Stemmer from the nltk platform [19], and the
English set of stop words of nltk stopwords corpus [19], extended by a following set
of clitics: ’s, ’ve, ’d, ’m, ’re, ’ll, n’t.
The changes of F1 values from the original values (from Table 4.3) for the topically
biased scenarios, after the modification of feature sets, are presented in Table 4.4. The
changes of topic match ratios in misclassified documents for the “author with the test
topic” and “author with the other topic” scenarios after the modification, are also
presented in Table 4.4.
Effect of the Feature Set Modification on Performance
We first observe that on the smallest set guardian4a, the changes in performance
after the feature set modification, are not statistically significant.
For the other two datasets: blogs4a and nyt2a, we can make the following ob-
servations about the impact of the modification of the feature set, for the numbers of
character n-grams reported in Table 4.4:
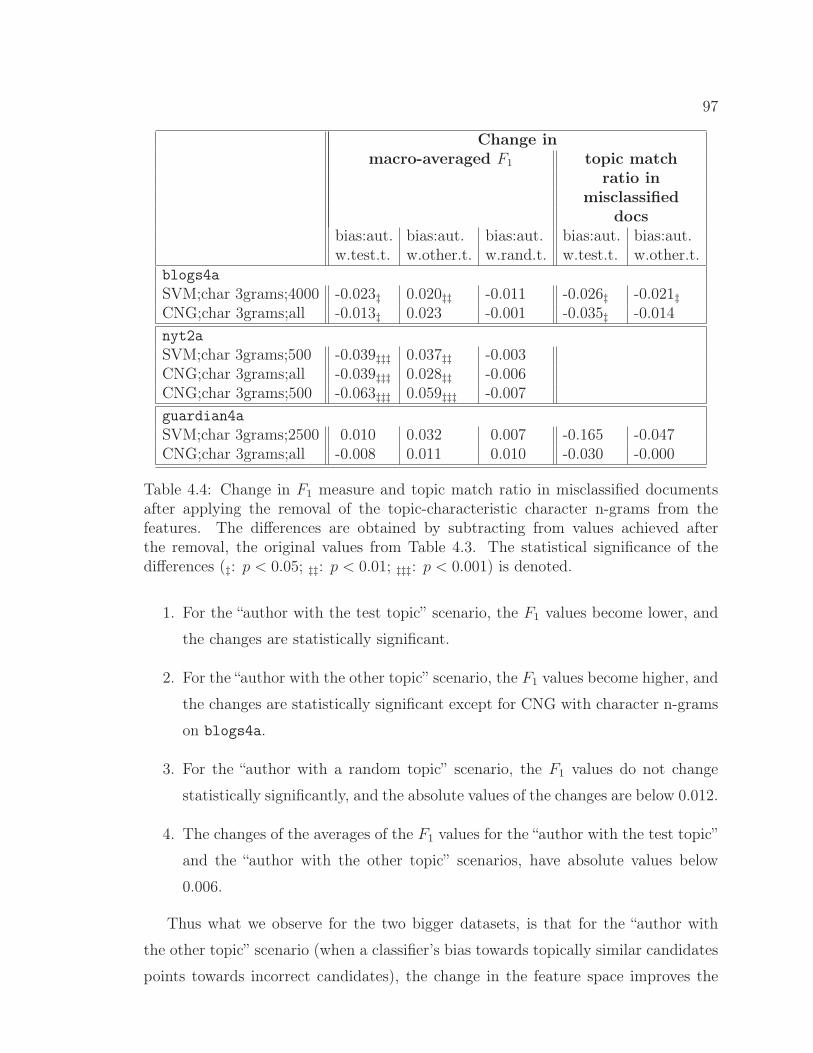
97
Change inmacro-averaged F1 topic match
ratio inmisclassified
docsbias:aut. bias:aut. bias:aut. bias:aut. bias:aut.w.test.t. w.other.t. w.rand.t. w.test.t. w.other.t.
blogs4aSVM;char 3grams;4000 -0.023‡ 0.020‡‡ -0.011 -0.026‡ -0.021‡CNG;char 3grams;all -0.013‡ 0.023 -0.001 -0.035‡ -0.014nyt2aSVM;char 3grams;500 -0.039‡‡‡ 0.037‡‡ -0.003CNG;char 3grams;all -0.039‡‡‡ 0.028‡‡ -0.006CNG;char 3grams;500 -0.063‡‡‡ 0.059‡‡‡ -0.007guardian4aSVM;char 3grams;2500 0.010 0.032 0.007 -0.165 -0.047CNG;char 3grams;all -0.008 0.011 0.010 -0.030 -0.000
Table 4.4: Change in F1 measure and topic match ratio in misclassified documentsafter applying the removal of the topic-characteristic character n-grams from thefeatures. The differences are obtained by subtracting from values achieved afterthe removal, the original values from Table 4.3. The statistical significance of thedifferences (‡: p < 0.05; ‡‡: p < 0.01; ‡‡‡: p < 0.001) is denoted.
1. For the “author with the test topic” scenario, the F1 values become lower, and
the changes are statistically significant.
2. For the “author with the other topic” scenario, the F1 values become higher, and
the changes are statistically significant except for CNG with character n-grams
on blogs4a.
3. For the “author with a random topic” scenario, the F1 values do not change
statistically significantly, and the absolute values of the changes are below 0.012.
4. The changes of the averages of the F1 values for the “author with the test topic”
and the “author with the other topic” scenarios, have absolute values below
0.006.
Thus what we observe for the two bigger datasets, is that for the “author with
the other topic” scenario (when a classifier’s bias towards topically similar candidates
points towards incorrect candidates), the change in the feature space improves the
98
performance. On the other end, for the “author with the test topic” scenario (when
a classifier’s bias increases the correctness of the classifier), the change in the feature
space makes the performance lower. These changes are similar in the absolute value,
and on average the performance under the topically biased training data is not affected
by the feature set modification.
Effect of the Feature Set Modification on Topic Match Ratio in
Misclassified Documents
We observe that topic match ratios in misclassified documents become lower and
closer to the random values. Three out of four of the differences on blogs4a are
statistically significant, while on the smallest set guardian4a the differences are not
statistically significant (and one of them is very close to 0).
Especially for SVM on blogs4a, the topic match ratios become very close to the
random values (less than 0.01 above them, and not statistically significantly different
from them).
Conclusions of the Evaluation
Concluding, the modification of the feature set of character n-grams, reduces the bias
of classifiers towards attributing a given document to a candidate with training data
topically similar to the document, without changing the average performance of the
classifiers under topically biased training data. This effect has been observed on the
two larger datasets, while on the smallest dataset the modification does not have a
statistically significant effect.
It is worth noting that the method of modifying the feature set works on the nyt2a
set, that is in the binary classification case, when the division of training data into
topical sets is equivalent to the division of the data into training data for classes.
4.7 Conclusions
We investigated a special case of cross-topic authorship attribution, which we call
attribution with topically biased training data, when training data for some candidate
authors are more topically similar to a test document than training data for other
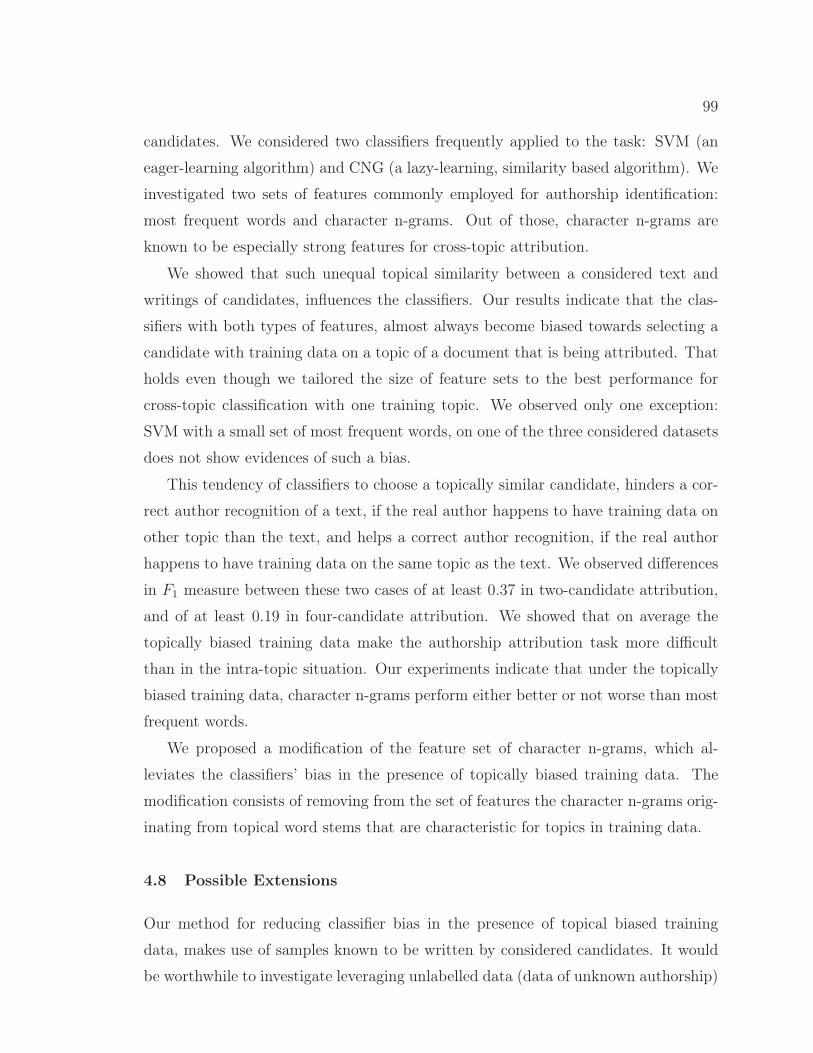
99
candidates. We considered two classifiers frequently applied to the task: SVM (an
eager-learning algorithm) and CNG (a lazy-learning, similarity based algorithm). We
investigated two sets of features commonly employed for authorship identification:
most frequent words and character n-grams. Out of those, character n-grams are
known to be especially strong features for cross-topic attribution.
We showed that such unequal topical similarity between a considered text and
writings of candidates, influences the classifiers. Our results indicate that the clas-
sifiers with both types of features, almost always become biased towards selecting a
candidate with training data on a topic of a document that is being attributed. That
holds even though we tailored the size of feature sets to the best performance for
cross-topic classification with one training topic. We observed only one exception:
SVM with a small set of most frequent words, on one of the three considered datasets
does not show evidences of such a bias.
This tendency of classifiers to choose a topically similar candidate, hinders a cor-
rect author recognition of a text, if the real author happens to have training data on
other topic than the text, and helps a correct author recognition, if the real author
happens to have training data on the same topic as the text. We observed differences
in F1 measure between these two cases of at least 0.37 in two-candidate attribution,
and of at least 0.19 in four-candidate attribution. We showed that on average the
topically biased training data make the authorship attribution task more difficult
than in the intra-topic situation. Our experiments indicate that under the topically
biased training data, character n-grams perform either better or not worse than most
frequent words.
We proposed a modification of the feature set of character n-grams, which al-
leviates the classifiers’ bias in the presence of topically biased training data. The
modification consists of removing from the set of features the character n-grams orig-
inating from topical word stems that are characteristic for topics in training data.
4.8 Possible Extensions
Our method for reducing classifier bias in the presence of topical biased training
data, makes use of samples known to be written by considered candidates. It would
be worthwhile to investigate leveraging unlabelled data (data of unknown authorship)
100
for diminishing the effect of the topical bias in training data on classifiers.
Our method also assumes that topics of training documents are known. An inter-
esting question is how to tackle the classifiers’ bias problem, when topics of training
documents are not directly available. One could approach this problem by automat-
ically identifying different levels of topical similarity between a questioned document
and training data.
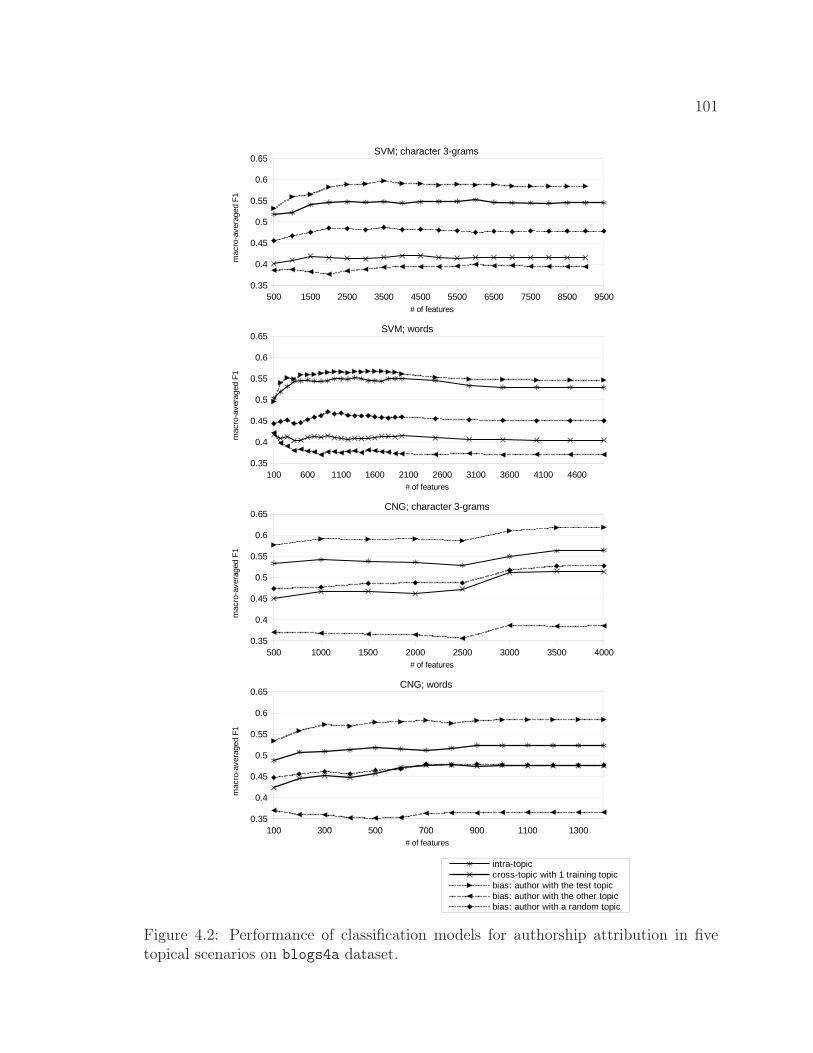
101
��� ���� ���� ���� ���� ���� ���� ��� ��� ��������
���
����
���
����
���
���� ���������������������
�������������
��������������� �
��� ��� ���� ���� ���� ���� ���� ���� ���� ��������
���
����
���
����
���
���� ����!����
�������������
��������������� �
��� ���� ���� ���� ���� ���� ���� ��������
���
����
���
����
���
����"#$�������������������
�������������
��������������� �
���
�"#$��!����
%&������'%���������'%��!%��������%&%&����'%�(%��)��������!%��������������'%�(%��)��������!%���������������'%�(%��)��������!%�������&������'%�
��� ��� ��� �� ��� ���� ��������
���
����
���
����
���
����"#$��!����
�������������
��������������� �
Figure 4.2: Performance of classification models for authorship attribution in fivetopical scenarios on blogs4a dataset.
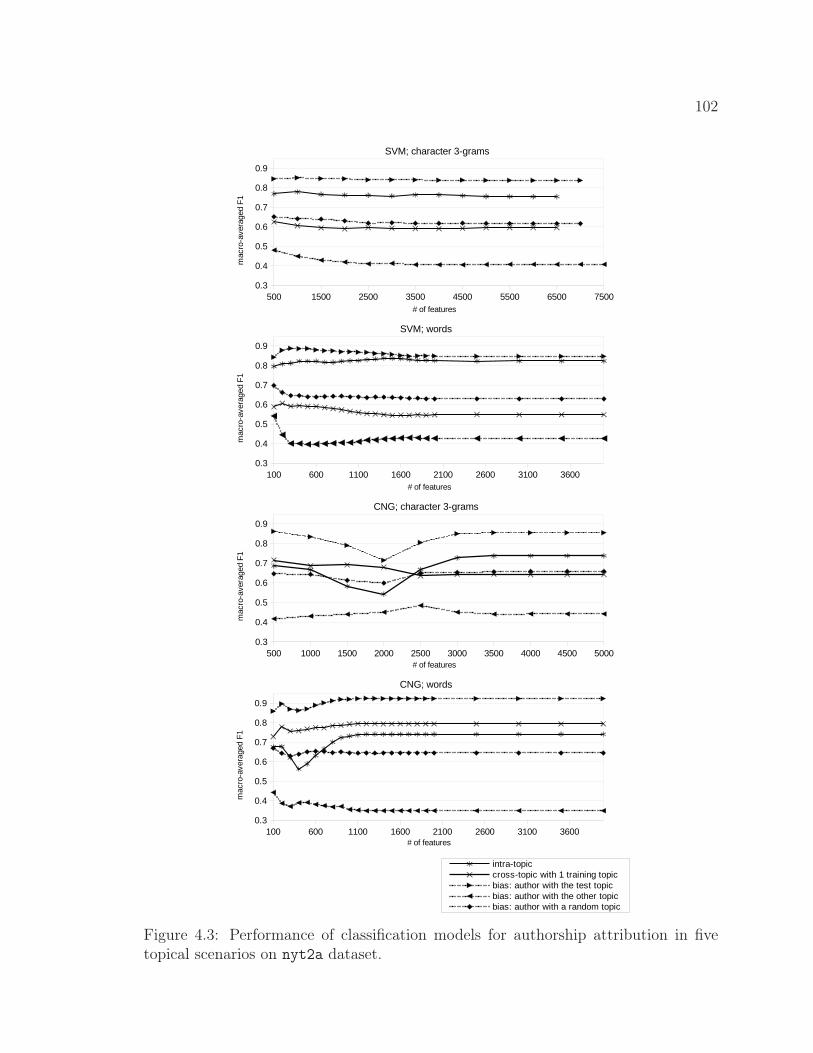
102
��� ���� ���� ���� ���� ���� ���� ������
���
���
���
���
��
��
�� �������������������
�������������
�����������������
��� ��� ���� ���� ��� ��� ���� �������
���
���
���
���
��
��
�� ��!����
�������������
�����������������
��� ���� ���� ��� ��� ���� ���� ���� ���� �������
���
���
���
���
��
��
"#$�������������������
�������������
�����������������
���
�"#$��!����
%&������'%���������'%��!%��������%&%&����'%�(%��)��������!%��������������'%�(%��)��������!%���������������'%�(%��)��������!%�������&������'%�
��� ��� ���� ���� ��� ��� ���� �������
���
���
���
���
��
��
"#$��!����
�������������
�����������������
Figure 4.3: Performance of classification models for authorship attribution in fivetopical scenarios on nyt2a dataset.
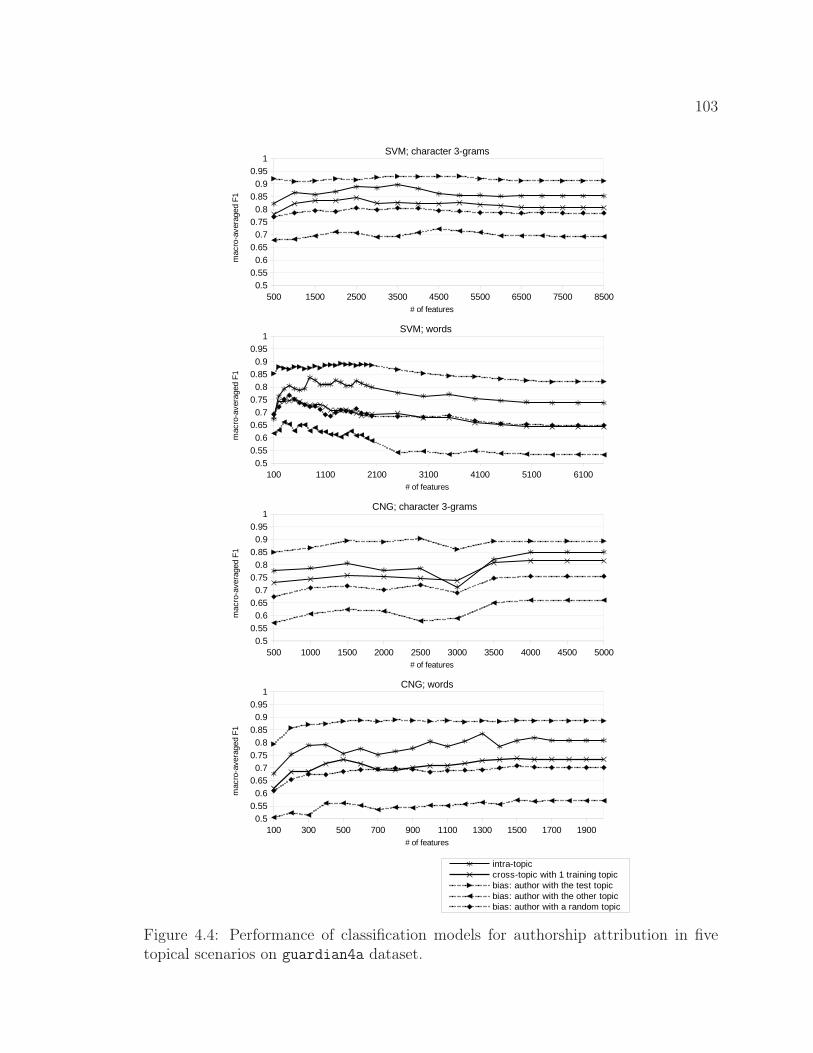
103
��� ���� ��� ���� ���� ���� ���� ���� ��������������������������������������
�� ������������������
�������������
����������������
�� �� ��� ��� �� ��� ��������������������������������������
�� �!����
�������������
����������������
��� ��� ��� ���� ���� ���� ���� ��� ��� ���������������������������������������
"#$ ������������������
�������������
����������������
���
"#$ �!����
%&������'%���������'%��!%�������%&%&����'%�(%��)��������!%��������������'%�(%��)��������!%���������������'%�(%��)��������!%�������&������'%�
�� ��� ��� ��� ��� �� ��� ��� ��� ��������������������������������������
"#$ �!����
�������������
����������������
Figure 4.4: Performance of classification models for authorship attribution in fivetopical scenarios on guardian4a dataset.
Chapter 5
Conclusions
We described our projects in the field of automatic stylistic analysis and interactive
visual analysis of written style.
We presented our exploratory visual analytic tool for stylistic analysis and inter-
active authorship attribution (identification of an author of a questioned document
among candidate authors, based on samples of writing of the candidates), based on
the Common N-Gram classifier. The system offers features for interpreting char-
acteristic n-grams of given documents as well as for analyzing the inner work of the
classification algorithm. It also makes it possible to influence the classification process
by a user utilizing information gained through the visualization. The visualization
method is designed for interpreting character n-grams — features that are known to
be especially useful for style and authorship analysis.
We presented our method for the problem of authorship verification, that is the
problem of verifying, whether an author of some set of documents also wrote another,
questioned document. Our method is a proximity-based one-class classification. It is
an intrinsic method, that is it only utilizes documents presented in a given problem,
without a need to gather additional, external material. Our method, especially in an
ensemble framework, performs well on the PAN 2013 Author Identification competi-
tion corpus, which presents problems in which there are at most 10 (and on average
4) documents known to be authored by a given person. The results are competitive
with respect to the best competition results on the entire set as well as separately
on two out of three language subsets. Performance of our method increases with the
size of the set of documents known to be authored by a given person. The evaluation
within the PAN 2014 Author Identification evaluation framework indicates, that our
method is not competitive for problems in which only one or only two writing samples
of a considered person are available; the method is best suited for problems with at
least three documents known to be authored by a considered person. The method
104
105
shows robustness with respect to lack or limited amount of data similar to considered
verification problems, on which a solution could be tuned.
We also reported on our investigation of performance of classifiers for the prob-
lem of authorship attribution in the case when written samples for some candidates
are more topically similar to a document being attributed than samples of other
candidates. We analyzed two sets of features known to be powerful for authorship
attribution: most frequent words, and character 3-grams (the latter ones being known
to perform especially well for cross-topic author identification). We showed that such
a situation impacts classifiers, as they become biased towards selecting a candidate
with writing samples that are on the same topic as a document being classified (we
observed only one exception: on one of the three analyzed datasets, SVM with a small
set of most frequent words does not undergo such a bias).
Our experimental results indicate that on average the authorship attribution under
the topically biased training data is more difficult than in the intra-topic setting.
We demonstrated that under the topically biased training data, character n-grams
perform either better or not worse than most frequent words.
We proposed a modification of the feature set of character n-grams that reduces
the classifiers’ bias. It consists of removing from the set of features the character
n-grams originating from topical word stems characteristic for the topics.
Bibliography
[1] Gutenberg project. http://www.gutenberg.org/, accessed on Jan 10, 2012.
[2] Ad-hoc Authorship Attribution Competition, 2004. http://www.mathcs.duq.edu/~juola/authorship_contest.html, accessed on June 25, 2012.
[3] Wolne Lektury project . http://www.wolnelektury.pl/, accessed on Mar 15,2012.
[4] Colorbrewer 2.0. http://colorbrewer.org/, accessed on Nov 1, 2012.
[5] Ahmed Abbasi and Hsinchun Chen. Applying authorship analysis to extremist-group web forum messages. IEEE Intelligent Systems, 20(5):67–75, September2005.
[6] Ahmed Abbasi and Hsinchun Chen. Visualizing authorship for identification.In Intelligence and Security Informatics, pages 60–71. Springer, 2006.
[7] Ahmed Abbasi and Hsinchun Chen. Categorization and analysis of text incomputer mediated communication archives using visualization. In Proceedingsof the 7th ACM/IEEE-CS joint conference on Digital libraries, JCDL’07, pages11–18, New York, NY, USA, June 2007. ACM.
[8] Ahmed Abbasi, Hsinchun Chen, and Arab Salem. Sentiment analysis in multiplelanguages: Feature selection for opinion classification in Web forums. ACMTransactions on Information Systems (TOIS), 26:12:1–12:34, June 2008.
[9] Tony Abou-Assaleh, Nick Cercone, Vlado Keselj, and Ray Sweidan. Detectionof new malicious code using n-gram signatures. In Proceedings of the secondAnnual Conference on Privacy, Security, and Trust, PST’04, Fredericton, NewBrunswick, Canada, October 2004.
[10] Fotis Aisopos, George Papadakis, and Theodora Varvarigou. Sentiment Anal-ysis of Social Media Content Using N-Gram Graphs. In Proceedings of the 3rdACM SIGMM International Workshop on Social Media, WSM ’11, pages 9–14,New York, NY, USA, 2011. ACM.
[11] Mihael Ankerst, Martin Ester, and Hans-Peter Kriegel. Towards an effectivecooperation of the user and the computer for classification. In Proceedings ofthe 6th ACM SIGKDD International Conference on Knowledge Discovery andData Mining, KDD’00, pages 179–188, New York, NY, USA, 2000. ACM.
106
107
[12] Shlomo Argamon, Casey Whitelaw, Paul Chase, Sobhan Raj Hota, NavenduGarg, and Shlomo Levitan. Stylistic text classification using functional lexicalfeatures: Research articles. Journal of the American Society for InformationScience and Technology, 58(6):802–822, April 2007.
[13] R. Arun, V. Suresh, and C. E. Veni Madhavan. Stopword Graphs and Author-ship Attribution in Text Corpora. In Proceedings of the 2009 IEEE InternationalConference on Semantic Computing, ICSC ’09, pages 192–196, Washington,DC, USA, 2009. IEEE Computer Society.
[14] H Baayen, H van Halteren, and F Tweedie. Outside the cave of shadows: usingsyntactic annotation to enhance authorship attribution. Literary and LinguisticComputing, 11(3):121, 1996.
[15] Barry Becker, Ron Kohavi, and Dan Sommerfield. Visualizing the simpleBayesian classifier. Information visualization in data mining and knowledgediscovery, 18:237–249, 1997.
[16] Victor Benjamin, Wingyan Chung, Ahmed Abbasi, Joshua Chuang, Cather-ine A. Larson, and Hsinchun Chen. Evaluating text visualization: An exper-iment in authorship analysis. In Intelligence and Security Informatics (ISI),2013 IEEE International Conference on, pages 16–20, June 2013.
[17] William R. Bennett. Scientific and Engineering Problem-solving with the Com-puter (Prentice Hall series in automatic computation). Prentice Hall, first edi-tion edition, 1976.
[18] M. J. Berryman, A. Allison, and D. Abbott. Statistical techniques for textclassification based on word recurrence intervals. Fluctuation and Noise Letters,3(1):1–10, 2003.
[19] Steven Bird, Edward Loper, and Ewan Klein. Natural Language Processing withPython. O’Reilly Media Inc., 2009.
[20] John Blitzer, Ryan McDonald, and Fernando Pereira. Domain adaptation withstructural correspondence learning. In Proceedings of the 2006 Conference onEmpirical Methods in Natural Language Processing, pages 120–128, Sydney,Australia, July 2006. Association for Computational Linguistics.
[21] Mike Bostock. d3.js JavaScript library. http://mbostock.github.com/d3/,accessed on Nov 20, 2011.
[22] John F. Burrows. ‘An ocean where each kind. . .’: Statistical analysis andsome major determinants of literary style. Computers and the Humanities,23(4-5):309–321, 1989.
108
[23] Esteban Castillo, Ofelia Cervantes, Darnes Vilarino, David Pinto, and SaulLeon. Unsupervised Method for the Authorship Identification Task—Notebookfor PAN at CLEF 2014. In Linda Cappellato, Nicola Ferro, Martin Halvey, andWessel Kraaij, editors, CLEF 2014 Evaluation Labs and Workshop – WorkingNotes Papers, 15-18 September, Sheffield, UK. CEUR-WS.org, September 2014.
[24] William B. Cavnar and John M. Trenkle. N-gram-based text categorization. InProceedings of the 3rd Annual Symposium on Document Analysis and Informa-tion Retrieval, SDAIR’94, pages 161–175, 1994.
[25] Carole Chaski. The keyboard dilemma and authorship identification. In PhilipCraiger and Sujeet Shenoi, editors, Advances in Digital Forensics III, volume242 of IFIP — The International Federation for Information Processing, pages133–146. Springer New York, 2007.
[26] Carole E. Chaski. Who’s At The Keyboard? Authorship Attribution in DigitalEvidence Investigations. International Journal of Digital Evidence, 4(1):pagesN/A; internet journal: http://www.utica.edu/academic/institutes/ecii/publications/articles/B49F9C4A--0362--765C--6A235CB8ABDFACFF.pdf,2005.
[27] Nitesh V. Chawla. Data Mining for Imbalanced Datasets: An Overview, pages853–867. Springer US, Boston, MA, 2005.
[28] Hsinchun Chen. Cybergate visualization. In Dark Web, volume 30 of IntegratedSeries in Information Systems, pages 227–256. Springer New York, 2012.
[29] David Chodos and Osmar R. Zaiane. Arc-ui: Visualization tool for associa-tive classifiers. In Proceedings of the 12th International Conference InformationVisualisation, IV’08, pages 296–301, Washington, DC, USA, 2008. IEEE Com-puter Society.
[30] Jonathan H. Clark and Charles J. Hannon. A Classifier System for AuthorRecognition Using Synonym-Based Features. Lecture Notes in Computer Sci-ence, 4827:839–849, 2007.
[31] Christopher Collins, Fernanda B. Viegas, and Martin Wattenberg. Parallel tagclouds to explore and analyze facted text corpora. In Proceedings of the 2009IEEE Symposium on Visual Analytics Science and Technology, VAST’09, pages91 – 98, October 2009.
[32] Dianne Cook, Doina Caragea, and Vasant Honavar. Visualization for classifi-cation problems, with examples using support vector machines. In Proceedingsof the COMPSTAT 2004, 16th Symposium of IASC, 2004.
[33] Corinna Cortes and Vladimir Vapnik. Support-vector networks. Machine Learn-ing, 20(3):273–297, September 1995.
109
[34] Hugh Craig. Authorial attribution and computational stylistics: if you can tellauthors apart, have you learned anything about them? Literary and LinguisticComputing, 14(1):103–113, 1999.
[35] Walter Daelemans. Explanation in computational stylometry. In ComputationalLinguistics and Intelligent Text Processing, pages 451–462. Springer, 2013.
[36] Joachim Diederich, Jorg Kindermann, Edda Leopold, and Gerhard Paass.Authorship attribution with support vector machines. Applied Intelligence,19(1):109–123, 2003.
[37] Thomas G. Dietterich. Approximate statistical tests for comparing supervisedclassification learning algorithms. Neural Computation, 10:1895–1923, 1998.
[38] Steven H. H. Ding, Benjamin C. M. Fung, and Mourad Debbabi. A VisualizableEvidence-Driven Approach for Authorship Attribution. ACM Transactions onInformation and System Security, 17(3):12:1–12:30, March 2015.
[39] Anthony Don, Elena Zheleva, Machon Gregory, Sureyya Tarkan, Loretta Auvil,Tanya Clement, Ben Shneiderman, and Catherine Plaisant. Discovering inter-esting usage patterns in text collections: integrating text mining with visualiza-tion. In Proceedings of the 6th ACM conference on Conference on Informationand Knowledge Management, CIKM’07, pages 213–222, New York, NY, USA,November 2007. ACM.
[40] Cicero dos Santos and Maira Gatti. Deep Convolutional Neural Networksfor Sentiment Analysis of Short Texts. In Proceedings of COLING 2014, the25th International Conference on Computational Linguistics: Technical Papers,pages 69–78, Dublin, Ireland, August 2014. Dublin City University and Associ-ation for Computational Linguistics.
[41] Stephen G. Eick, Joseph L. Steffen, and Erick E. Sumner Jr. Seesoft - a toolfor visualizing line oriented software statistics. IEEE Transactions on SoftwareEngineering, 18:957–968, 1992.
[42] Ward E. Y. Elliott and Robert J. Valenza. And then there were none: Winnow-ing the shakespeare claimants. Computers and the Humanities, 30(3):191–245,1996.
[43] Tom Fawcett. An Introduction to ROC Analysis. Pattern Recognition Letters,27(8):861–874, June 2006.
[44] Jean-Daniel Fekete and Nicole Dufournaud. Compus: visualization and analysisof structured documents for understanding social life in the 16th century. InProceedings of the 5th ACM conference on Digital Libraries, DL’00, pages 47–55, New York, NY, USA, 2000. ACM.
110
[45] Christiane Fellbaum, editor. WordNet An Electronic Lexical Database. TheMIT Press, Cambridge, MA ; London, May 1998.
[46] Vanessa Wei Feng and Graeme Hirst. Patterns of local discourse coherenceas a feature for authorship attribution. Literary and Linguistic Computing,29(2):191–198, 2014. First published online 9 April 2013.
[47] Georgia Frantzeskou, Efstathios Stamatatos, Stefanos Gritzalis, and SokratisKatsikas. Effective identification of source code authors using byte-level infor-mation. In Proceedings of the 28th international conference on Software engi-neering, ICSE’06, pages 893–896, 2006.
[48] Jordan Frery, Christine Largeron, and Mihaela Juganaru-Mathieu. UJM atCLEF in Author Identification—Notebook for PAN at CLEF 2014. In LindaCappellato, Nicola Ferro, Martin Halvey, and Wessel Kraaij, editors, CLEF2014 Evaluation Labs and Workshop – Working Notes Papers, 15-18 September,Sheffield, UK. CEUR-WS.org, September 2014.
[49] Madhavi Ganapathiraju, Deborah Weisser, Judith Klein-Seetharaman, RoniRosenfeld, Jaime Carbonell, and Raj Reddy. Comparative n-gram analysis ofwhole-genome protein sequences. In Proceedings of the second internationalconference on Human Language Technology Research, HLT’02, pages 76–81,2002.
[50] M.R. Ghaeini. Intrinsic Author Identification Using Modified Weighted KNN- Notebook for PAN at CLEF 2013. In Pamela Forner, Roberto Navigli, andDan Tufis, editors, CLEF 2013 Evaluation Labs and Workshop – Working NotesPapers, September 2013.
[51] George Giannakopoulos, Vangelis Karkaletsis, George Vouros, and PanagiotisStamatopoulos. Summarization System Evaluation Revisited: N-gram Graphs.ACM Transactions on Speech and Language Processing, 5(3):5:1–5:39, October2008.
[52] Jade Goldstein-Stewart, Ransom Winder, and Roberta Evans Sabin. Personidentification from text and speech genre samples. In Proceedings of the 12thConference of the European Chapter of the Association for Computational Lin-guistics, EACL ’09, pages 336–344, Stroudsburg, PA, USA, 2009. Associationfor Computational Linguistics.
[53] Tim Gollub, Martin Potthast, Anna Beyer, Matthias Busse, FranciscoM. Rangel Pardo, Paolo Rosso, Efstathios Stamatatos, and Benno Stein. Re-cent trends in digital text forensics and its evaluation - plagiarism detection,author identification, and author profiling. In Pamela Forner, Henning Muller,Roberto Paredes, Paolo Rosso, and Benno Stein, editors, CLEF, volume 8138of Lecture Notes in Computer Science, pages 282–302. Springer, 2013.
111
[54] Tim Grant. Txt 4n6: Method, consistency, and distinctiveness in the analysisof sms text messages. Journal of Law and Policy, 21:467, 2012.
[55] Mark Hall, Eibe Frank, Geoffrey Holmes, Bernhard Pfahringer, Peter Reute-mann, and Ian H. Witten. The WEKA Data Mining Software: An Update.ACM SIGKDD Explorations Newsletter, 11(1):10–18, November 2009.
[56] Oren Halvani, Martin Steinebach, and Ralf Zimmermann. Authorship Verifica-tion via k-Nearest Neighbor Estimation - Notebook for PAN at CLEF 2013. InPamela Forner, Roberto Navigli, and Dan Tufis, editors, CLEF 2013 EvaluationLabs and Workshop – Working Notes Papers, September 2013.
[57] Marti A. Hearst. Tilebars: Visualization of term distribution information in fulltext information access. In Proceedings of the SIGCHI Conference on HumanFactors in Computing Systems, CHI ’95, pages 59–66, New York, NY, USA,1995. ACM Press/Addison-Wesley Publishing Co.
[58] David I. Holmes and Richard S. Forsyth. The federalist revisited: New direc-tions in authorship attribution. Literary and Linguistic Computing, 10(2):111,1995.
[59] David L. Hoover. Another perspective on vocabulary richness. Computers andthe Humanities, 37(2):151–178, 2003.
[60] John Houvardas and Efstathios Stamatatos. N-gram feature selection for au-thorship identification. In Proceeding of the 12th International Conference onArtificial Intelligence: Methodology, Systems, and Applications, AIMSA’06,pages 77–86, September 2006.
[61] Farkhund Iqbal, Hamad Binsalleeh, Benjamin C. M. Fung, and Mourad Deb-babi. Mining writeprints from anonymous e-mails for forensic investigation.Digit. Investig., 7(1-2):56–64, October 2010.
[62] Magdalena Jankowska, Vlado Keselj, and Evangelos Milios. Relative n-gramsignatures: Document visualization at the level of character n-grams. In Pro-ceedings of the 2012 IEEE Conference on Visual Analytics Science and Tech-nology, VAST’12, pages 103–112, 2012.
[63] Magdalena Jankowska, Vlado Keselj, and Evangelos Milios. Proximity BasedOne-class Classification with Common N-Gram Dissimilarity for AuthorshipVerification Task - Notebook for PAN at CLEF 2013. In Pamela Forner, RobertoNavigli, and Dan Tufis, editors, CLEF 2013 Evaluation Labs and Workshop –Working Notes Papers, September 2013.
[64] Magdalena Jankowska, Vlado Keselj, and Evangelos Milios. Ensembles ofProximity-Based One-Class Classifiers for Author Verification – Notebook forPAN at CLEF 2014. In L. Cappellato, N. Ferro, M. Halvey, and W. Kraaij,editors, CLEF 2014 Labs and Workshops, Notebook Papers, 2014.
112
[65] Magdalena Jankowska, Evangelos Milios, and Vlado Keselj. Author verificationusing common n-gram profiles of text documents. In Proceedings of COLING2014, the 25th International Conference on Computational Linguistics: Techni-cal Papers, pages 387–397, Dublin, Ireland, August 2014. Dublin City Universityand Association for Computational Linguistics.
[66] Patrick Juola. Authorship attribution. Found. Trends Inf. Retr., 1(3):233–334,December 2006.
[67] Patrick Juola. Authorship attribution. Foundations and Trends in InformationRetrieval, 1(3):233–334, 2008.
[68] Patrick Juola. An overview of the traditional authorship attribution subtask.In Pamela Forner, Jussi Karlgren, and Christa Womser-Hacker, editors, CLEF(Online Working Notes/Labs/Workshop), 2012.
[69] Patrick Juola. Rowling and "Galbraith": an authorial analysis. http://languagelog.ldc.upenn.edu/nll/?p=5315, accessed on Jan 11, 2017.
[70] Patrick Juola and Efstathios Stamatatos. Overview of the Author IdentificationTask at PAN 2013. In Pamela Forner, Roberto Navigli, and Dan Tufis, editors,CLEF 2013 Evaluation Labs and Workshop – Working Notes Papers, September2013.
[71] Daniel A. Keim and Daniela Oelke. Literature fingerprinting: A new methodfor visual literary analysis. In Proceedings of the 2007 IEEE Symposium onVisual Analytics Science and Technology, VAST’07, pages 115–122, 2007.
[72] Mike Kestemont. Function words in authorship attribution. from black magicto theory? In Proceedings of the 3rd Workshop on Computational Linguisticsfor Literature, CLfL@EACL 2014, April 27, 2014, Gothenburg, Sweden, pages59–66, 2014.
[73] Mike Kestemont, Kim Luyckx, Walter Daelemans, and Thomas Crombez.Cross-genre authorship verification using unmasking. English Studies,93(3):340–356, 2012.
[74] Vlado Keselj. Perl Package Text::Ngrams, 2013.
[75] Vlado Keselj, Fuchun Peng, Nick Cercone, and Calvin Thomas. N-gram-basedauthor profiles for authorship attribution. In Proceedings of the ConferencePacific Association for Computational Linguistics, PACLING’03, pages 255–264, Dalhousie University, Halifax, Nova Scotia, Canada, August 2003.
[76] Mahmoud Khonji and Youssef Iraqi. A Slightly-modified GI-based Author-verifier with Lots of Features (ASGALF)—Notebook for PAN at CLEF 2014.In Linda Cappellato, Nicola Ferro, Martin Halvey, and Wessel Kraaij, editors,CLEF 2014 Evaluation Labs and Workshop – Working Notes Papers, 15-18September, Sheffield, UK. CEUR-WS.org, September 2014.
113
[77] Yoon Kim. Convolutional Neural Networks for Sentence Classification. In Pro-ceedings of the 2014 Conference on Empirical Methods in Natural LanguageProcessing (EMNLP), pages 1746–1751, Doha, Qatar, October 2014. Associa-tion for Computational Linguistics.
[78] Bradley Kjell. Authorship determination using letter pair frequency featureswith neural network classifiers. Literary and Linguistic Computing, 9(2):119–124, 1994.
[79] Bradley Kjell, W. Addison Woods, and Ophir Frieder. Discrimination of au-thorship using visualization. Information Processing and Management: an In-ternational Journal, 30(1):141–150, January 1994.
[80] Moshe Koppel, Navot Akiva, Idan Dershowitz, and Nachum Dershowitz. Unsu-pervised decomposition of a document into authorial components. In Proceed-ings of the 49th Annual Meeting of the Association for Computational Linguis-tics: Human Language Technologies, pages 1356–1364, Portland, Oregon, USA,June 2011. Association for Computational Linguistics.
[81] Moshe Koppel and Jonathan Schler. Exploiting Stylistic Idiosyncrasies for Au-thorship Attribution. IJCAI’03 Workshop on Computational Approaches toStyle Analysis and Synthesis, (2000):69–72, 2003.
[82] Moshe Koppel and Jonathan Schler. Authorship verification as a one-classclassification problem. In Proceedings of the 21st International Conference onMachine Learning, ICML ’04, pages 489–495, Banf, Alberta, Canada, July 2004.ACM.
[83] Moshe Koppel, Jonathan Schler, and Shlomo Argamon. Computational meth-ods in authorship attribution. Journal of the American Society for InformationScience and Technology, 60(1):9–26, 2009.
[84] Moshe Koppel, Jonathan Schler, and Shlomo Argamon. Authorship attributionin the wild. Language Resources and Evaluation, 45(1):83–94, March 2011.
[85] Moshe Koppel, Jonathan Schler, Shlomo Argamon, and Yaron Winter. The“Fundamental Problem” of Authorship Attribution. English Studies, 93(3):284–291, 2012.
[86] Moshe Koppel, Jonathan Schler, and Elisheva Bonchek-Dokow. Measuring dif-ferentiability: Unmasking pseudonymous authors. Journal of Machine LearningResearch, 8:1261–1276, December 2007.
[87] Moshe Koppel and Yaron Winter. Determining if two documents are writtenby the same author. Journal of the Association for Information Science andTechnology, 65(1):178–187, 2014.
114
[88] Robert Layton, Paul A. Watters, and Richard Dazeley. Authorship analysis ofaliases: Does topic influence accuracy? Natural Language Engineering, 21:497–518, 2015.
[89] Y. LeCun, B. Boser, J. S. Denker, D. Henderson, R. E. Howard, W. Hubbard,and L. D. Jackel. Backpropagation Applied to Handwritten Zip Code Recogni-tion. Neural Computation, 1(4):541–551, December 1989.
[90] Kim Luyckx and Walter Daelemans. Authorship attribution and verificationwith many authors and limited data. In Proceedings of the 22Nd InternationalConference on Computational Linguistics - Volume 1, COLING ’08, pages 513–520, Stroudsburg, PA, USA, 2008. Association for Computational Linguistics.
[91] Kim Luyckx and Walter Daelemans. The effect of author set size and datasize in authorship attribution. Literary and Linguistic Computing, 26(1):35–55,2011.
[92] Stefan R. Maetschke, Karin S. Kassahn, Jasmyn A. Dunn, Siew-Ping Han,Eva Z. Curley, Katryn J. Stacey, and Mark A. Ragan. A visual framework forsequence analysis using n-grams and spectral rearrangement. Bioinformatics,26:737–744, March 2010.
[93] C. Mascol. Curves of Pauline and Pseudo-Pauline style I. Unitarian Review,30:452–460, 1888.
[94] C. Mascol. Curves of Pauline and Pseudo-Pauline style II. Unitarian Review,30:539–546, 1888.
[95] Jane E. Mason, Michael Shepherd, Jack Duffy, Vlado Keselj, and Carolyn Wat-ters. An n-gram Based Approach to Multi-labeled Web Page Genre Classifi-cation. In Proceedings of the 43rd Hawaii International Conference on SystemSciences, HICSS’10, pages 1–10, Hawaii, January 2010.
[96] Cristhian Mayor, Josue Gutierrez, Angel Toledo, Rodrigo Martinez, PaolaLedesma, Gibran Fuentes, , and Ivan Meza. A Single Author Style Repre-sentation for the Author Verification Task—Notebook for PAN at CLEF 2014.In Linda Cappellato, Nicola Ferro, Martin Halvey, and Wessel Kraaij, editors,CLEF 2014 Evaluation Labs and Workshop – Working Notes Papers, 15-18September, Sheffield, UK. CEUR-WS.org, September 2014.
[97] David L Mealand. Correspondence analysis of luke. Literary and linguisticcomputing, 10(3):171–182, 1995.
[98] T. C. Mendenhall. The characteristic curves of composition. Science,9(214):237–249, 1887.
[99] Thomas Merriam. Tamburlaine stalks in henry vi. Computers and the Human-ities, 30(3):267–280, 1996.
115
[100] Thomas Merriam. Heterogeneous authorship in early Shakespeare and the prob-lem of Henry V. Literary and Linguistic Computing, 13(1):15–28, 1998.
[101] Thomas V. N. Merriam and Robert A. J. Matthews. Neural computation instylometry ii: An application to the works of shakespeare and marlowe. Literaryand Linguistic Computing, 9(1):1, 1994.
[102] Tomas Mikolov, Ilya Sutskever, Kai Chen, Greg S Corrado, and Jeff Dean.Distributed Representations of Words and Phrases and their Compositionality.In C. J. C. Burges, L. Bottou, M. Welling, Z. Ghahramani, and K. Q. Wein-berger, editors, Advances in Neural Information Processing Systems 26, pages3111–3119. Curran Associates, Inc., 2013.
[103] Pashutan Modaresi and Philipp Gross. A Language Independent Author VerifierUsing Fuzzy C-Means Clustering—Notebook for PAN at CLEF 2014. In LindaCappellato, Nicola Ferro, Martin Halvey, and Wessel Kraaij, editors, CLEF2014 Evaluation Labs and Workshop – Working Notes Papers, 15-18 September,Sheffield, UK. CEUR-WS.org, September 2014.
[104] Frederick Mosteller and David L Wallace. Inference in an authorship problem:A comparative study of discrimination methods applied to the authorship ofthe disputed federalist papers. Journal of the American Statistical Association,58(302):275–309, 1963.
[105] Jamal A. Nasir, Nico Gornitz, and Ulf Brefeld. An off-the-shelf approach toauthorship attribution. In Proceedings of COLING 2014, the 25th Interna-tional Conference on Computational Linguistics: Technical Papers, pages 895–904, Dublin, Ireland, August 2014. Dublin City University and Association forComputational Linguistics.
[106] Jasmine Novak, Prabhakar Raghavan, and Andrew Tomkins. Anti-aliasing onthe web. In Proceedings of the 13th international conference on World WideWeb, pages 30–39, New York, NY, USA, May 2004. ACM.
[107] Giorgio Maria Di Nunzio. Using scatterplots to understand and improve prob-abilistic models for text categorization and retrieval. International Journal ofApproximate Reasoning, 50(7):945 – 956, 2009.
[108] PAN. Dataset of PAN 2012, Author Identification task. http://www.uni-weimar.de/medien/webis/research/events/pan-12/pan12-web/authorship.html, 2012. Accessed on Apr 2, 2013.
[109] PAN. Dataset of PAN 2013, Author Identification task. http://www.uni-weimar.de/medien/webis/research/events/pan-13/pan13-web/author-identification.html, 2013. Accessed on Oct 8, 2013.
116
[110] Anselmo Penas and Alvaro Rodrigo. A Simple Measure to Assess Non-response.In Proceedings of the 49th Annual Meeting of the Association for Co mputa-tional Linguistics: Human Language Technologies - Volume 1, HLT ’11, pages1415–1424, Stroudsburg, PA, USA, June 2011. Association for ComputationalLinguistics.
[111] Catherine Plaisant, James Rose, Bei Yu, Loretta Auvil, Matthew G. Kirschen-baum, Martha Nell Smith, Tanya Clement, and Greg Lord. Exploring eroticsin Emily Dickinson’s correspondence with text mining and visual interfaces.In Proceedings of the 6th ACM/IEEE-CS joint conference on Digital libraries,JCDL’06, pages 141–150, New York, NY, USA, June 2006. ACM.
[112] John Platt. Fast training of support vector machines using sequential minimaloptimization. In B. Schoelkopf, C. Burges, and A. Smola, editors, Advances inKernel Methods - Support Vector Learning. MIT Press, 1998.
[113] Nektaria Potha and Efstathios Stamatatos. A profile-based method for au-thorship verification. In Aristidis Likas, Konstantinos Blekas, and DimitrisKalles, editors, Artificial Intelligence: Methods and Applications, volume 8445of Lecture Notes in Computer Science, pages 313–326. Springer InternationalPublishing, 2014.
[114] Brett Poulin, Roman Eisner, Duane Szafron, Paul Lu, Russ Greiner, D. S.Wishart, Alona Fyshe, Brandon Pearcy, Cam MacDonell, and John Anvik.Visual explanation of evidence in additive classifiers. In Proceedings of the18th conference on Innovative Applications of Artificial Intelligence, IAAI’06 -Volume 2, pages 1822–1829. AAAI Press, 2006.
[115] Paul Rayson and Roger Garside. Comparing corpora using frequency profil-ing. In Proceedings of the Workshop on Comparing Corpora - Volume 9, WCC’00, pages 1–6, Stroudsburg, PA, USA, 2000. Association for ComputationalLinguistics.
[116] Virgile Landeiro Dos Reis and Aron Culotta. Robust text classification in thepresence of confounding bias. In Proceedings of the Thirtieth AAAI Conferenceon Artificial Intelligence, pages 186–193, Phoenix, Arizona, USA., February2016.
[117] Sebastian Ruder, Parsa Ghaffari, and John G. Breslin. Character-level andMulti-channel Convolutional Neural Networks for Large-scale Authorship At-tribution. arXiv preprint arXiv:1609.06686, 2016.
[118] Edoardo Saccenti and Leonardo Tenori. Multivariate Modeling of the collabora-tion between Luigi Illica and Giuseppe Giacosa for the librettos of three operasby Giacomo Puccini. Literary and Linguistic Computing, 2014.
117
[119] Conrad Sanderson and Simon Guenter. Short text authorship attribution viasequence kernels, Markov chains and author unmasking: An investigation. InProceedings of the 2006 Conference on Empirical Methods in Natural LanguageProcessing, pages 482–491, Sydney, Australia, July 2006. Association for Com-putational Linguistics.
[120] Evan Sandhaus. The New York Times Annotated Corpus LDC2008T19. DVD.,2008.
[121] Upendra Sapkota, Steven Bethard, Manuel Montes, and Thamar Solorio. Notall character n-grams are created equal: A study in authorship attribution. InProceedings of the 2015 Conference of the North American Chapter of the As-sociation for Computational Linguistics: Human Language Technologies, pages93–102, Denver, Colorado, May–June 2015. Association for Computational Lin-guistics.
[122] Upendra Sapkota, Thamar Solorio, Manuel Montes, and Steven Bethard. Do-main adaptation for authorship attribution: Improved structural correspon-dence learning. In Proceedings of the 54th Annual Meeting of the Association forComputational Linguistics (Volume 1: Long Papers), pages 2226–2235, Berlin,Germany, August 2016. Association for Computational Linguistics.
[123] Upendra Sapkota, Thamar Solorio, Manuel Montes, Steven Bethard, and PaoloRosso. Cross-topic authorship attribution: Will out-of-topic data help? InProceedings of COLING 2014, the 25th International Conference on Computa-tional Linguistics: Technical Papers, pages 1228–1237, Dublin, Ireland, August2014. Dublin City University and Association for Computational Linguistics.
[124] Satyam, Anand, Arnav Kumar Dawn, and Sujan Kumar Saha. StatisticalAnalysis Approach to Author Identification Using Latent Semantic Analysis—Notebook for PAN at CLEF 2014. In Linda Cappellato, Nicola Ferro, MartinHalvey, and Wessel Kraaij, editors, CLEF 2014 Evaluation Labs and Work-shop – Working Notes Papers, 15-18 September, Sheffield, UK. CEUR-WS.org,September 2014.
[125] Andrew I. Schein, Johnnie F. Caver, Ale J. Honaker, and Craig H. Martell.Author attribution evaluation with novel topic cross-validation. In Proceed-ings of the International Conference on Knowledge Discovery and InformationRetrieval, KDIR’10, pages 206–215, Valencia, Spain, October 2010.
[126] Santiago Segarra, Mark Eisen, and Alejandro Ribeiro. Authorship AttributionThrough Function Word Adjacency Networks. IEEE Transactions on SignalProcessing, 63(20):5464–5478, Oct 2015.
[127] Shachar Seidman. Authorship Verification Using the Impostors Method - Note-book for PAN at CLEF 2013. In Pamela Forner, Roberto Navigli, and Dan
118
Tufis, editors, CLEF 2013 Evaluation Labs and Workshop – Working NotesPapers, September 2013.
[128] Christin Seifert and Elisabeth Lex. A novel visualization approach for data-mining-related classification. In Proceedings of the 13th International Confer-ence Information Visualisation, IV’09, pages 490–495, 2009.
[129] Ian M. Soboroff, Charles K. Nicholas, James M. Kukla, and David S. Ebert.Visualizing document authorship using n-grams and latent semantic indexing.In Proceedings of the 1997 workshop on New paradigms in information visual-ization and manipulation, NPIV’97, pages 43–48, 1997.
[130] Efstathios Stamatatos. Author identification using imbalanced and limitedtraining texts. In Proceeding of the 18th International Workshop on Databaseand Expert Systems Applications, DEXA’07, pages 237–241, Regensburg, Ger-many, September 2007.
[131] Efstathios Stamatatos. Intrinsic Plagiarism Detection Using Character n-gramProfiles. In Benno Stein, Paolo Rosso, Efstathios Stamatatos, Moshe Koppel,and Eneko Agirre, editors, SEPLN 2009 Workshop on Uncovering Plagiarism,Authorship, and Social Software Misuse (PAN 09), pages 38–46. UniversidadPolitecnica de Valencia and CEUR-WS.org, September 2009.
[132] Efstathios Stamatatos. A survey of modern authorship attribution meth-ods. Journal of the American Society for Information Science and Technology,60(3):538–556, 2009.
[133] Efstathios Stamatatos. On the Robustness Of Authorship Attribution Based onCharacter N-Gram Features. Journal of Law and Policy, 21(2):421–439, 2013.
[134] Efstathios Stamatatos, Walter Daelemans, Ben Verhoeven, Patrick Juola, Au-relio Lopez-Lopez, Martin Potthast, and Benno Stein. Overview of the AuthorIdentification Task at PAN 2015. In Linda Cappellato, Nicola Ferro, GarethJones, and Eric San Juan, editors, CLEF 2015 Evaluation Labs and Workshop– Working Notes Papers, 8-11 September, Toulouse, France. CEUR-WS.org,September 2015.
[135] Efstathios Stamatatos, Walter Daelemans, Ben Verhoeven, Benno Stein, MartinPotthast, Patrick Juola, Miguel A. Sanchez-Perez, and Alberto Barron-Cedeno.Overview of the Author Identification Task at PAN 2014. In CLEF 2014 Eval-uation Labs and Workshop – Working Notes Papers, Sheffield, UK, September2014.
[136] Efstathios Stamatatos, George Kokkinakis, and Nikos Fakotakis. Automatictext categorization in terms of genre and author. Computational Linguistics,26(4):471–495, December 2000.
119
[137] Benno Stein, Nedim Lipka, and Peter Prettenhofer. Intrinsic plagiarism analy-sis. Language Resources and Evaluation, 45(1):63–82, 2011.
[138] David Tax. One Class Classification. Concept-learning in the absence ofcounter-examples. PhD thesis, Delft University of Technology, June 2001.
[139] Calvin Thomas, Vlado Keselj, Nick Cercone, Kenneth Rockwood, and ElissaAsp. Automatic detection and rating of dementia of alzheimer type throughlexical analysis of spontaneous speech. In Proceedings of IEEE ICMA 2005,Niagara Falls, Ontario, Canada, July 2005.
[140] James J. Thomas and Kristin A. Cook. Illuminating the Path: The Research andDevelopment Agenda for Visual Analytics. National Visualization and AnalyticsCtr, 2005.
[141] Andrija Tomovic, Predrag Janicic, and Vlado Keselj. n-gram-based Classifica-tion and Unsupervised Hierarchical Clustering of Genome Sequences. ComputerMethods and Programs in Biomedicine, 81:137–153, February 2006.
[142] Michiel van Dam and Claudia Hauff. Large-scale author verification: Temporaland topical influences. In Proceedings of the 37th International ACM SIGIRConference on Research and Development in Information Retrieval, SIGIR ’14,pages 1039–1042, New York, NY, USA, 2014. ACM.
[143] Cor J. Veenman and Zhenshi Li. Authorship Verification with CompressionFeatures. In Pamela Forner, Roberto Navigli, and Dan Tufis, editors, CLEF2013 Evaluation Labs and Workshop – Working Notes Papers, September 2013.
[144] Kira S. Makarova Victor V. Solovyev. A novel method of protein sequenceclassification based on oligopeptide frequency analysis and its application tosearch for functional sites and to domain localization. Computer applicationsin the biosciences : CABIOS, 9(1):17–24, February 1993.
[145] Weka. Weka version 3.6.9. https://sourceforge.net/projects/weka/files/weka-3-6/3.6.9/, accessed on Feb 24, 2017.
[146] Jacek Wolkowicz, Stephen Brooks, and Vlado Keselj. Midivis: Visualizing mu-sic pieces structure via similarity matrices. In Proceedings of the 2009 Interna-tional Computer Music Conference, ICMC’09, pages 53–6, Montreal, Quebec,Canada, August 2009.
[147] Jacek Wolkowicz, Zbigniew Kulka, and Vlado Keselj. n-Gram Based Approachto Composer Recognition. Archives of Acoustics, 33(1):43–55, January 2008.
[148] Alexander Ypma, Er Ypma, and Robert P.W. Duin. Support Objects for Do-main Approximation. In Proceedings of International Conference on ArtificialNeural Networks, pages 2–4, Skovde, Sweden, September 1998. Springer.
120
[149] George Udny Yule. The Statistical Study of Literary Vocabulary. Archon Books,1968.
[150] Xiang Zhang, Junbo Zhao, and Yann LeCun. Character-level ConvolutionalNetworks for Text Classification. In Proceedings of the 28th International Con-ference on Neural Information Processing Systems, NIPS’15, pages 649–657,Cambridge, MA, USA, 2015. MIT Press.
[151] Rong Zheng, Jiexun Li, Hsinchun Chen, and Zan Huang. A framework forauthorship identification of online messages: Writing-style features and clas-sification techniques. J. Am. Soc. Inf. Sci. Technol., 57(3):378–393, February2006.
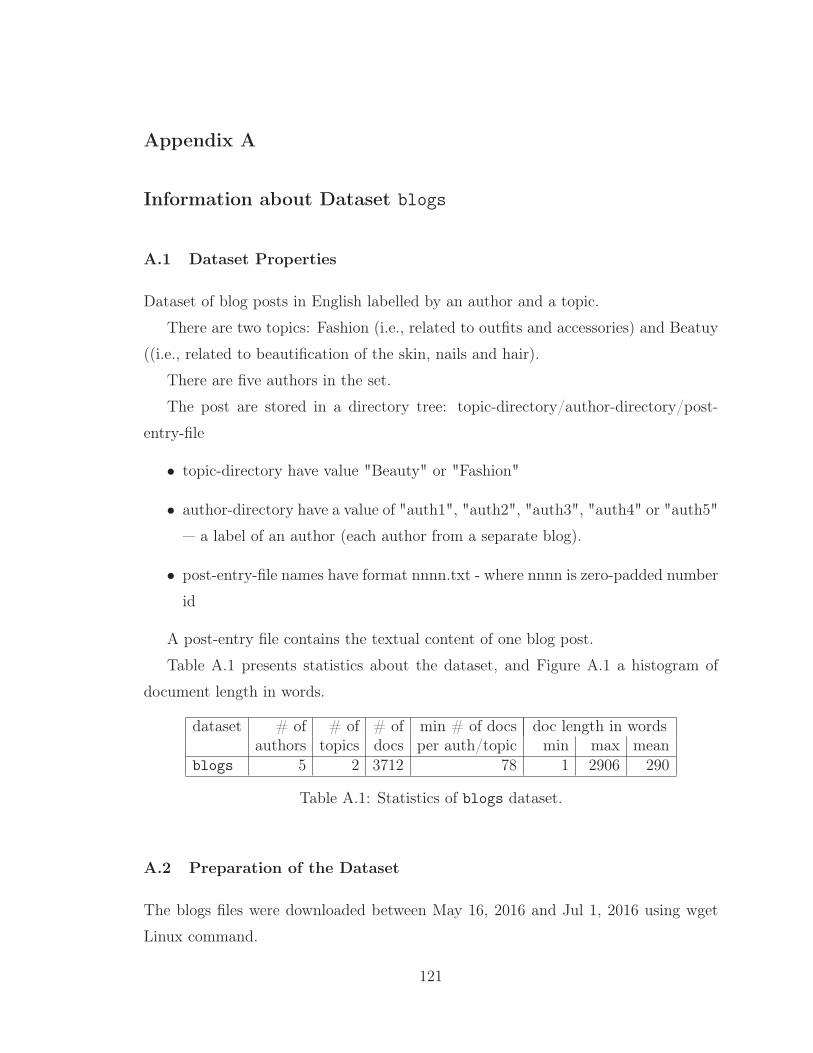
Appendix A
Information about Dataset blogs
A.1 Dataset Properties
Dataset of blog posts in English labelled by an author and a topic.
There are two topics: Fashion (i.e., related to outfits and accessories) and Beatuy
((i.e., related to beautification of the skin, nails and hair).
There are five authors in the set.
The post are stored in a directory tree: topic-directory/author-directory/post-
entry-file
• topic-directory have value "Beauty" or "Fashion"
• author-directory have a value of "auth1", "auth2", "auth3", "auth4" or "auth5"
— a label of an author (each author from a separate blog).
• post-entry-file names have format nnnn.txt - where nnnn is zero-padded number
id
A post-entry file contains the textual content of one blog post.
Table A.1 presents statistics about the dataset, and Figure A.1 a histogram of
document length in words.
dataset # of # of # of min # of docs doc length in wordsauthors topics docs per auth/topic min max mean
blogs 5 2 3712 78 1 2906 290
Table A.1: Statistics of blogs dataset.
A.2 Preparation of the Dataset
The blogs files were downloaded between May 16, 2016 and Jul 1, 2016 using wget
Linux command.
121
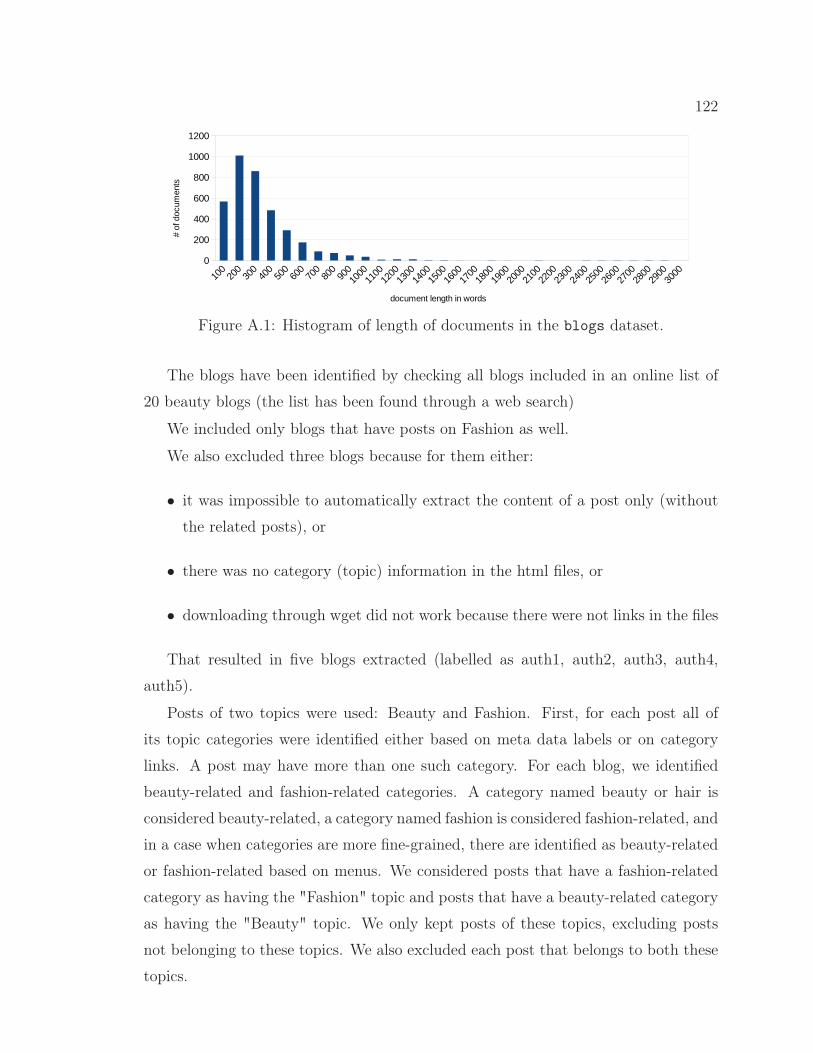
122
�
���
���
���
���
����
����
����� ����� ����������
����
����
��
�
Figure A.1: Histogram of length of documents in the blogs dataset.
The blogs have been identified by checking all blogs included in an online list of
20 beauty blogs (the list has been found through a web search)
We included only blogs that have posts on Fashion as well.
We also excluded three blogs because for them either:
• it was impossible to automatically extract the content of a post only (without
the related posts), or
• there was no category (topic) information in the html files, or
• downloading through wget did not work because there were not links in the files
That resulted in five blogs extracted (labelled as auth1, auth2, auth3, auth4,
auth5).
Posts of two topics were used: Beauty and Fashion. First, for each post all of
its topic categories were identified either based on meta data labels or on category
links. A post may have more than one such category. For each blog, we identified
beauty-related and fashion-related categories. A category named beauty or hair is
considered beauty-related, a category named fashion is considered fashion-related, and
in a case when categories are more fine-grained, there are identified as beauty-related
or fashion-related based on menus. We considered posts that have a fashion-related
category as having the "Fashion" topic and posts that have a beauty-related category
as having the "Beauty" topic. We only kept posts of these topics, excluding posts
not belonging to these topics. We also excluded each post that belongs to both these
topics.
123
Also author labels of posts were identified, based either on meta data info related
to an author or a link related to the author information. In the cases (two out of the
five blogs) in which these labels varied across the posts in a blog, only the posts with
the most frequent label (which was the label of the main author of a blogs) were kept.
The processing of files consisted of:
• extracting only the posts of a blog — one post per document
• extracting only textual content of posts (removing all html tags)
• removing empty posts
• identification of strings related to authors and blogs directly, namely: names
of authors and blogs and links of blogs, emails of authors, links containing
author/blog names, by manually constructed regular expression for each blog.
They were replaced by identical strings across all authors, namely ‘^^’ for names
of authors and blogs and ‘^^^^’ for author- and blog-related links (these strings
were chosen because the character ’^’ does not appears in original texts)
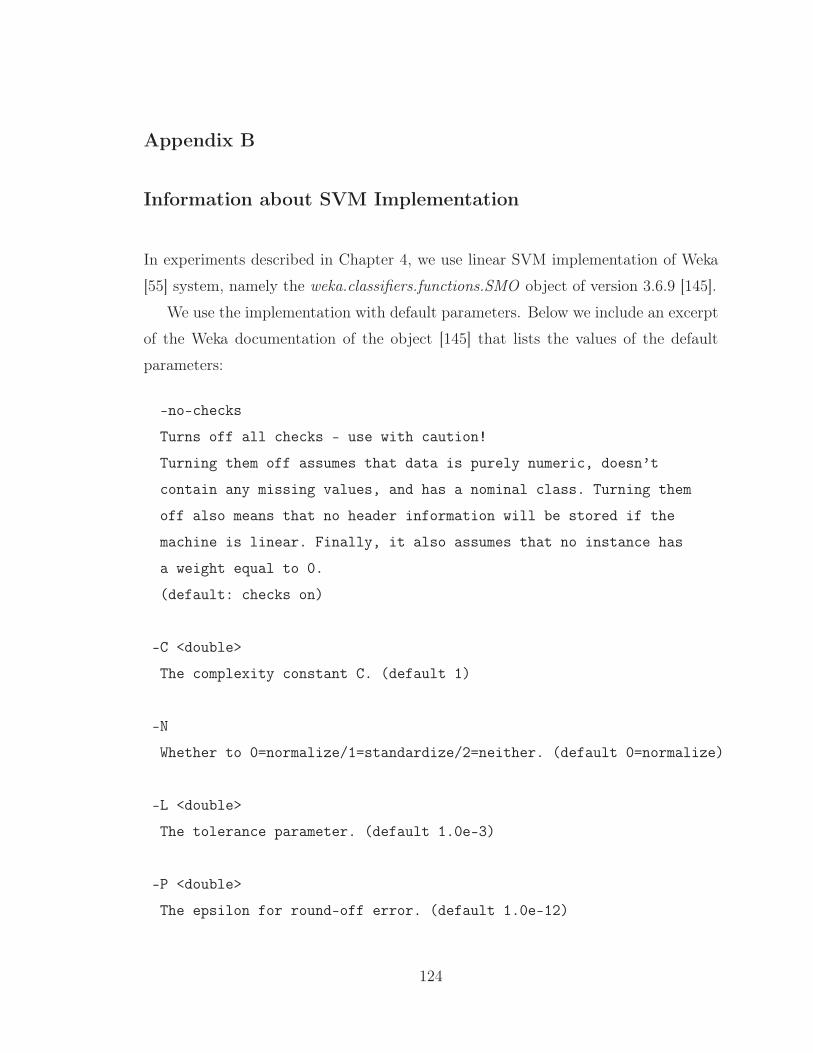
Appendix B
Information about SVM Implementation
In experiments described in Chapter 4, we use linear SVM implementation of Weka
[55] system, namely the weka.classifiers.functions.SMO object of version 3.6.9 [145].
We use the implementation with default parameters. Below we include an excerpt
of the Weka documentation of the object [145] that lists the values of the default
parameters:
-no-checks
Turns off all checks - use with caution!
Turning them off assumes that data is purely numeric, doesn’t
contain any missing values, and has a nominal class. Turning them
off also means that no header information will be stored if the
machine is linear. Finally, it also assumes that no instance has
a weight equal to 0.
(default: checks on)
-C <double>
The complexity constant C. (default 1)
-N
Whether to 0=normalize/1=standardize/2=neither. (default 0=normalize)
-L <double>
The tolerance parameter. (default 1.0e-3)
-P <double>
The epsilon for round-off error. (default 1.0e-12)
124
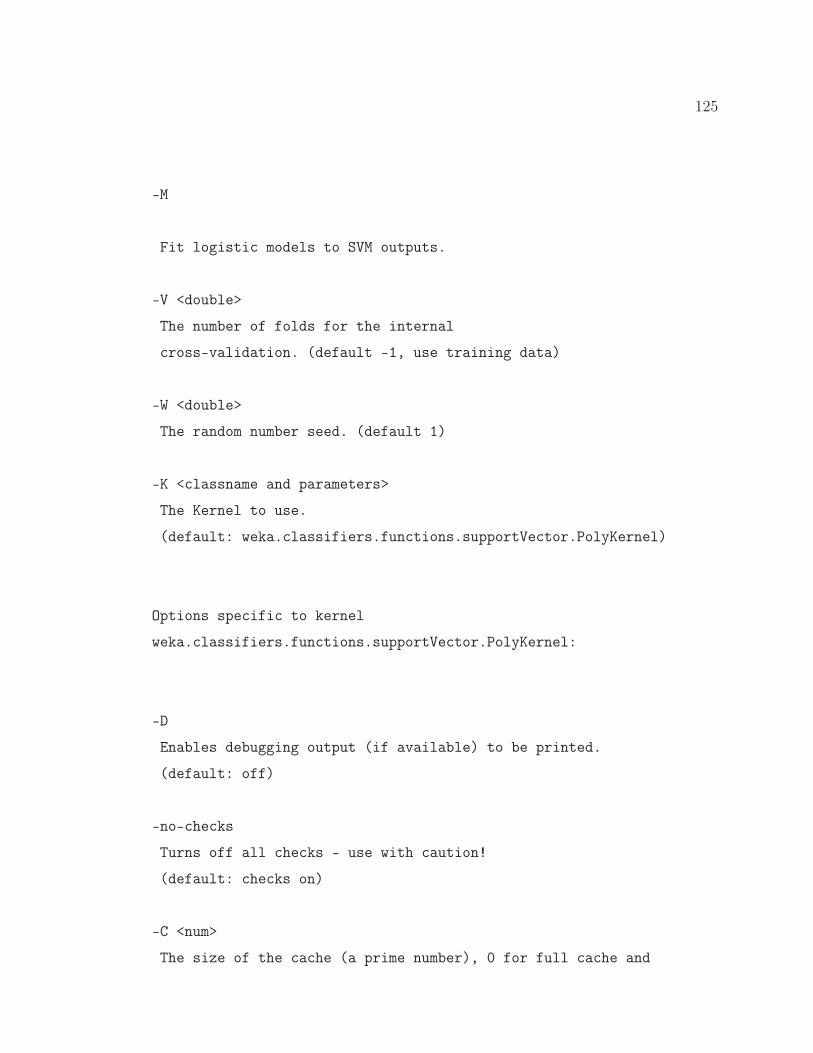
125
-M
Fit logistic models to SVM outputs.
-V <double>
The number of folds for the internal
cross-validation. (default -1, use training data)
-W <double>
The random number seed. (default 1)
-K <classname and parameters>
The Kernel to use.
(default: weka.classifiers.functions.supportVector.PolyKernel)
Options specific to kernel
weka.classifiers.functions.supportVector.PolyKernel:
-D
Enables debugging output (if available) to be printed.
(default: off)
-no-checks
Turns off all checks - use with caution!
(default: checks on)
-C <num>
The size of the cache (a prime number), 0 for full cache and
126
-1 to turn it off.
(default: 250007)
-E <num>
The Exponent to use.
(default: 1.0)
-L
Use lower-order terms.
(default: no)
Appendix C
Copyright Form
This appendix contains the copyright form from IEEE Symposium on Visual Analytics
Science and Technology 2012 for our publication [62].
127
128
IEEE COPYRIGHT AND CONSENT FORM To ensure uniformity of treatment among all contributors, other forms may not be substituted for this form, nor may any wording of the form bechanged. This form is intended for original material submitted to the IEEE and must accompany any such material in order to be published by theIEEE.Please read the form carefully and keep a copy for your files.
TITLE OF PAPER/ARTICLE/REPORT, INCLUDING ALL CONTENT IN ANY FORM, FORMAT, OR MEDIA (hereinafter, "TheWork"):Relative N-Gram Signatures: Document Visualization at the Level of Character N-Grams
COMPLETE LIST OF AUTHORS:Magdalena Jankowska, Vlado Keselj, Evangelos Milios
IEEE PUBLICATION TITLE (Journal, Magazine, Conference, Book):IEEE Symposium on Visual Analytics Science andTechnology 2012
COPYRIGHT TRANSFER
1. The undersigned hereby assigns to The Institute of Electrical and Electronics Engineers,Incorporated (the "IEEE") all rights under copyright thatmay exist in and to: (a) the above Work,including any revised or expanded derivative works submitted to the IEEE by the undersigned based on theWork; and (b) any associated written or multimedia components or other enhancements accompanying the Work.
CONSENT AND RELEASE2. ln the event the undersigned makes a presentation based upon the Work at a conference hosted or sponsored in whole or in part by the IEEE, theundersigned, in consideration for his/her participation in the conference, hereby grants the IEEE the unlimited, worldwide, irrevocable permission touse, distribute, publish, license, exhibit, record, digitize, broadcast, reproduce and archive, in any format or medium, whether now known or hereafterdeveloped: (a) his/her presentation and comments at the conference; (b) any written materials or multimedia files used in connection with his/herpresentation; and (c) any recorded interviews of him/her (collectively, the "Presentation"). The permission granted includes the transcription andreproduction ofthe Presentation for inclusion in products sold or distributed by IEEE and live or recorded broadcast ofthe Presentation during or afterthe conference.
3. In connection with the permission granted in Section 2, the undersigned hereby grants IEEE the unlimited, worldwide, irrevocable right to usehis/her name, picture, likeness, voice and biographical information as part of the advertisement, distribution and sale ofproducts incorporating theWork or Presentation, and releases IEEE from any claim based on right of privacy or publicity.
4. The undersigned hereby warrants that the Work and Presentation (collectively, the "Materials") are original and that he/she is the author of theMaterials. To the extent the Materials incorporate text passages, figures, data or other material from the works of others, the undersigned has obtainedany necessary permissions. Where necessary, the undersigned has obtained all third party permissions and consents to grant the license above and hasprovided copies of such permissions and consents to IEEE.
[ ] Please check this box ifyou do not wish to have video/audio recordings made ofyour conference presentation.
See below for Retained Rights/Terms and Conditions, and Author Responsibilities.
AUTHOR RESPONSIBILITIES
The IEEE distributes its technical publications throughout the world and wants to ensure that the material submitted to its publications is properlyavailable to the readership of those publications. Authors must ensure that their Work meets the requirements as stated in section 8.2.1 of the IEEE
Figure C.1: Page 1 of Copyright Form from IEEE Symposium on Visual AnalyticsScience and Technology 2012.
129
PSPB Operations Manual, including provisions covering originality, authorship, author responsibilities and author misconduct. More information onIEEEs publishing policies may be found at http://www.ieee.org/publications_standards/publications/rights/pub_tools_policies.html. Authors areadvised especially of IEEE PSPB Operations Manual section 8.2.1.B12: "It is the responsibility of the authors, not the IEEE, to determine whetherdisclosure of their material requires the prior consent of other parties and, if so, to obtain it." Authors are also advised of IEEE PSPB OperationsManual section 8.1.1B: "Statements and opinions given in work published by the IEEE are the expression of the authors."
RETAINED RIGHTS/TERMS AND CONDITIONS
General
1. Authors/employers retain all proprietary rights in any process, procedure, or article of manufacture described in the Work.
2. Authors/employers may reproduce or authorize others to reproduce the Work, material extracted verbatim from the Work, or derivative works forthe author's personal use or for company use, provided that the source and the IEEE copyright notice are indicated, the copies are not used in any waythat implies IEEE endorsement of a product or service of any employer, and the copies themselves are not offered for sale.
3. In the case of a Work performed under a U.S. Government contract or grant, the IEEE recognizes that the U.S. Government has royalty-freepermission to reproduce all or portions of the Work, and to authorize others to do so, for official U.S. Government purposes only, if the contract/grantso requires.
4. Although authors are permitted to re-use all or portions of the Work in other works, this does not include granting third-party requests forreprinting, republishing, or other types of re-use.The IEEE Intellectual Property Rights office must handle all such third-party requests.
5. Authors whose work was performed under a grant from a government funding agency are free to fulfill any deposit mandates from that fundingagency.
Author Online Use
6. Personal Servers. Authors and/or their employers shall have the right to post the accepted version of IEEE-copyrighted articles on their ownpersonal servers or the servers of their institutions or employers without permission from IEEE, provided that the posted version includes aprominently displayed IEEE copyright notice and, when published, a full citation to the original IEEE publication, including a link to the articleabstract in IEEE Xplore.Authors shall not post the final, published versions of their papers.
7. Classroom or Internal Training Use. An author is expressly permitted to post any portion of the accepted version of his/her own IEEE-copyrightedarticles on the authors personal web site or the servers of the authors institution or company in connection with the authors teaching, training, or workresponsibilities, provided that the appropriate copyright, credit, and reuse notices appear prominently with the posted material. Examples of permitteduses are lecture materials, course packs, e-reserves, conference presentations, or in-house training courses.
8. Electronic Preprints. Before submitting an article to an IEEE publication, authors frequently post their manuscripts to their own web site, theiremployers site, or to another server that invites constructive comment from colleagues.Upon submission of an article to IEEE, an author is required totransfer copyright in the article to IEEE, and the author must update any previously posted version of the article with a prominently displayed IEEEcopyright notice. Upon publication of an article by the IEEE, the author must replace any previously posted electronic versions of the article witheither (1) the full citation to the IEEE work with a Digital Object Identifier (DOI) or link to the article abstract in IEEE Xplore, or (2) the acceptedversion only (not the IEEE-published version), including the IEEE copyright notice and full citation, with a link to the final, published article in IEEEXplore.
INFORMATION FOR AUTHORSIEEE Copyright Ownership
Figure C.2: Page 2 of Copyright Form from IEEE Symposium on Visual AnalyticsScience and Technology 2012.
130
It is the formal policy of the IEEE to own the copyrights to all copyrightable material in its technical publications and to the individual contributionscontained therein, in order to protect the interests of the IEEE, its authors and their employers, and, at the same time, to facilitate the appropriate re-use of this material by others.The IEEE distributes its technical publications throughout the world and does so by various means such as hard copy,microfiche, microfilm, and electronic media.It also abstracts and may translate its publications, and articles contained therein, for inclusion in variouscompendiums, collective works, databases and similar publications.
Author/Employer Rights
If you are employed and prepared the Work on a subject within the scope of your employment, the copyright in the Work belongs to your employeras a work-for-hire. In that case, the IEEE assumes that when you sign this Form, you are authorized to do so by your employer and that youremployer has consented to the transfer of copyright, to the representation and warranty of publication rights, and to all other terms and conditions ofthis Form. If such authorization and consent has not been given to you, an authorized representative of your employer should sign this Form as theAuthor.
GENERAL TERMS
1. The undersigned represents that he/she has the power and authority to make and execute this form.2. The undersigned agrees to identify and hold harmless the IEEE from any damage or expense that may arise in the event of a breach of any of thewarranties set forth above.3. In the event the above work is not accepted and published by the IEEE or is withdrawn by the author(s) before acceptance by the IEEE, theforegoing grant of rights shall become null and void and all materials embodying the Work submitted to the IEEE will be destroyed.4. For jointly authored Works, all joint authors should sign, or one of the authors should sign as authorized agent for the others.
Magdalena Jankowska 01-08-2012Author/Authorized Agent For Joint Authors Date(dd-mm-yy)
THIS FORM MUST ACCOMPANY THE SUBMISSION OF THE AUTHOR'S MANUSCRIPT.Questions about the submission of the form or manuscript must be sent to the publication's editor.Please direct all questions about IEEE copyrightpolicy to:IEEE Intellectual Property Rights Office, [email protected], +1-732-562-3966 (telephone)
Figure C.3: Page 3 of Copyright Form from IEEE Symposium on Visual AnalyticsScience and Technology 2012.