Author Manuscript NIH Public Access Jon J. Ramsey , and ... · We studied ubiquinone (Q), Q...
19
CALORIE RESTRICTION MODIFIES UBIQUINONE AND COQ TRANSCRIPTS LEVELS IN MOUSE TISSUES Cristina Parrado 1,2 , Guillermo López-Lluch 2 , Elisabet Rodríguez-Bies 2 , Sara Santa-Cruz 2 , Plácido Navas 2 , Jon J. Ramsey 3 , and José M. Villalba 1,* 1 Departamento de Biología Celular, Fisiología e Inmunología, Facultad de Ciencias, Universidad de Córdoba, E-14014, Córdoba, Spain 2 Centro Andaluz de Biología del Desarrollo,Universidad Pablo de Olavide-CSIC, CIBERER, Instituto de Salud Carlos III, E-41013, Sevilla, Spain 3 VM Molecular Biosciences, University of California, Davis, CA 95616 USA Abstract We studied ubiquinone (Q), Q homologue ratio and steady-state levels of mCOQ transcripts in tissues from mice fed ad libitum or under calorie restriction. Maximum ubiquinone levels on a protein basis were found in kidney and heart, followed by liver, brain and skeletal muscle. Liver and skeletal muscle showed the highest Q 9 /Q 10 ratios with significant inter-individual variability. Heart, kidney, and particularly brain exhibited lower Q 9 /Q 10 ratios and inter-individual variability. In skeletal muscle and heart, the most abundant mCOQ transcript was mCOQ7, followed by mCOQ8, mCOQ2, mPDSS2, mPDSS1 and mCOQ3. In non muscular tissues (liver, kidney and brain) the most abundant mCOQ transcript was mCOQ2, followed by mCOQ7, mCOQ8, mPDSS1, mPDSS2, and mCOQ3. Calorie restriction increased both ubiquinone homologues and mPDSS2 mRNA in skeletal muscle, but mCOQ7 was decreased. In contrast, Q 9 and most mCOQ transcripts were decreased in heart. Calorie restriction also modified Q 9 /Q 10 ratio, which was increased in kidney and decreased in heart without alterations of mPDSS1 or mPDSS2 transcripts. We demonstrate for the first time that unique patterns of mCOQ transcripts exist in muscular and non- muscular tissues, and that Q and COQ genes are targets of calorie restriction in a tissue-specific way. Keywords Calorie restriction; COQ transcripts; Ubiquinone; Ubiquinone biosynthesis 1. Introduction Ubiquinone (coenzyme Q, Q) is a prenylated benzoquinone which plays a fundamental role shuttling electrons from Complex I and Complex II to Complex III in the mitochondrial electron transport chain [1,2]. Other functions of Q include the mitochondrial oxidation of © 2010 Elsevier Inc. All rights reserved. * Correspondence to: Departamento de Biología Celular, Fisiología e Inmunología Facultad de Ciencias, Universidad de Córdoba; Campus Rabanales, Edificio Severo Ochoa, 3 a planta; 14014 Córdoba, Spain; Phone: +34-957-218595; Fax: +34-957-218634; [email protected] . Publisher's Disclaimer: This is a PDF file of an unedited manuscript that has been accepted for publication. As a service to our customers we are providing this early version of the manuscript. The manuscript will undergo copyediting, typesetting, and review of the resulting proof before it is published in its final citable form. Please note that during the production process errors may be discovered which could affect the content, and all legal disclaimers that apply to the journal pertain. NIH Public Access Author Manuscript Free Radic Biol Med. Author manuscript; available in PMC 2012 June 15. Published in final edited form as: Free Radic Biol Med. 2011 June 15; 50(12): 1728–1736. doi:10.1016/j.freeradbiomed.2011.03.024. NIH-PA Author Manuscript NIH-PA Author Manuscript NIH-PA Author Manuscript
Transcript of Author Manuscript NIH Public Access Jon J. Ramsey , and ... · We studied ubiquinone (Q), Q...

CALORIE RESTRICTION MODIFIES UBIQUINONE AND COQTRANSCRIPTS LEVELS IN MOUSE TISSUES
Cristina Parrado1,2, Guillermo López-Lluch2, Elisabet Rodríguez-Bies2, Sara Santa-Cruz2,Plácido Navas2, Jon J. Ramsey3, and José M. Villalba1,*
1 Departamento de Biología Celular, Fisiología e Inmunología, Facultad de Ciencias, Universidadde Córdoba, E-14014, Córdoba, Spain2 Centro Andaluz de Biología del Desarrollo,Universidad Pablo de Olavide-CSIC, CIBERER,Instituto de Salud Carlos III, E-41013, Sevilla, Spain3 VM Molecular Biosciences, University of California, Davis, CA 95616 USA
AbstractWe studied ubiquinone (Q), Q homologue ratio and steady-state levels of mCOQ transcripts intissues from mice fed ad libitum or under calorie restriction. Maximum ubiquinone levels on aprotein basis were found in kidney and heart, followed by liver, brain and skeletal muscle. Liverand skeletal muscle showed the highest Q9/Q10 ratios with significant inter-individual variability.Heart, kidney, and particularly brain exhibited lower Q9/Q10 ratios and inter-individual variability.In skeletal muscle and heart, the most abundant mCOQ transcript was mCOQ7, followed bymCOQ8, mCOQ2, mPDSS2, mPDSS1 and mCOQ3. In non muscular tissues (liver, kidney andbrain) the most abundant mCOQ transcript was mCOQ2, followed by mCOQ7, mCOQ8, mPDSS1,mPDSS2, and mCOQ3. Calorie restriction increased both ubiquinone homologues and mPDSS2mRNA in skeletal muscle, but mCOQ7 was decreased. In contrast, Q9 and most mCOQ transcriptswere decreased in heart. Calorie restriction also modified Q9/Q10 ratio, which was increased inkidney and decreased in heart without alterations of mPDSS1 or mPDSS2 transcripts. Wedemonstrate for the first time that unique patterns of mCOQ transcripts exist in muscular and non-muscular tissues, and that Q and COQ genes are targets of calorie restriction in a tissue-specificway.
KeywordsCalorie restriction; COQ transcripts; Ubiquinone; Ubiquinone biosynthesis
1. IntroductionUbiquinone (coenzyme Q, Q) is a prenylated benzoquinone which plays a fundamental roleshuttling electrons from Complex I and Complex II to Complex III in the mitochondrialelectron transport chain [1,2]. Other functions of Q include the mitochondrial oxidation of
© 2010 Elsevier Inc. All rights reserved.* Correspondence to: Departamento de Biología Celular, Fisiología e Inmunología Facultad de Ciencias, Universidad de Córdoba;Campus Rabanales, Edificio Severo Ochoa, 3a planta; 14014 Córdoba, Spain; Phone: +34-957-218595; Fax: +34-957-218634;[email protected] .Publisher's Disclaimer: This is a PDF file of an unedited manuscript that has been accepted for publication. As a service to ourcustomers we are providing this early version of the manuscript. The manuscript will undergo copyediting, typesetting, and review ofthe resulting proof before it is published in its final citable form. Please note that during the production process errors may bediscovered which could affect the content, and all legal disclaimers that apply to the journal pertain.
NIH Public AccessAuthor ManuscriptFree Radic Biol Med. Author manuscript; available in PMC 2012 June 15.
Published in final edited form as:Free Radic Biol Med. 2011 June 15; 50(12): 1728–1736. doi:10.1016/j.freeradbiomed.2011.03.024.
NIH
-PA Author Manuscript
NIH
-PA Author Manuscript
NIH
-PA Author Manuscript

dihydroorotate in the pyrimidine biosynthesis pathway [3,4], protection against oxidativestress as the only lipid-soluble antioxidant which is synthesized in all organisms [1,2], andelectron transport as a carrier in the transplasma membrane redox system [5]. A number ofproposed functions for Q are less defined from a molecular point of view. These includemodulating the sensitivity of mitochondrial uncoupling proteins (UCPs) to purinenucleotides by Q redox state, regulating the mitochondrial permeability transition poreactivity [7], and inhibiting plasma membrane neutral sphingomyelinase [8]. Q is positionedin a privileged position because it links basic aspects of cell physiology such as energymetabolism, antioxidant protection, and the regulation of cell growth and death.
Although dietary Q is incorporated to some extent in particular tissues, under normalconditions its de novo synthesis accounts for the majority of Q present in peripheral tissues[1,2,9,10]. The precursor of the benzoquinone ring is 4-hydroxybenzoate, whereas thesynthesis of the isoprenoid side chain starts from acetyl-coenzyme A to yield farnesylpyrophosphate (FPP) through the mevalonate pathway [1,2,11]. The trans-prenyltransferaseactivity, a tetramer composed of PDSS1 and PDSS2 gene products [12,13], catalyzes thecondensation of FPP with several units of isopentenyl pyrophosphate (IPP), all in transconfiguration, to form a long polyisoprenoid chain whose length, 9 or 10 isoprene units inmammals, determines the actual isoform which is synthesized (Q9 or Q10, respectively)[1,2]. Then, 4-hydroxybenzoate and polyprenyl pyrophosphate are condensed by polyprenyl4-hydroxybenzoate transferase, encoded by COQ2 [14]. After condensation, at least sixenzymes (encoded by COQ3-8) catalyze C-hydroxylations, decarboxylation, O-methylations, and C-methylation to synthesize Q [1,2].
Q distribution is not uniform among different tissues and organs, indicating that Q levels areadapted to the particular physiology of the tissue. Since Q is rapidly broken down, asreflected in its short half-life, actual levels of Q in tissues are likely determined by acoordinated balance between synthesis and degradation, both of which occur in all tissues[1,2]. In mice, rats and humans, maximal Q concentrations are present in kidney and heart,while lower amounts can be detected in liver, brain and skeletal muscle [1,15-19]. Since Qredistribution between organs appears insignificant [2], tissue-specific mechanisms mustexist to determine actual levels of Q in any given tissue. However, the control of Qdistribution in tissues is not fully understood.
Since Q plays a central role in energy metabolism, alterations in Q biosynthesis mayparticipate in adaptive responses to physiological, experimental or pathological conditionsshown to modify Q levels in tissues. Q is increased under cold adaptation and with exercise,while it may be decreased by aging, at least in some tissues [2]. Calorie restriction (CR) isthe most robust intervention that improves healthspan and extends lifespan in many animalmodels [20-22]. Thus, previous investigations have also studied putative changes of Q levelswith CR. In this regard, it has been reported that long-term CR increases total Q inmitochondria from skeletal muscle, liver, heart and kidney [23,24].
Because of the complex pathway leading to Q synthesis, simultaneously examining Q levelsand several COQ mRNAs or proteins in different tissues can give us novel insights tounderstand genetic factors which determine tissue-specific distribution of Q and itsmodulation during metabolic adaptation. However, previous studies have focused on singleCOQ genes under normal conditions, and data are only available for COQ3 [10], COQ2 [14]and COQ7 [25-28]. The possibility that CR influences Q biosynthesis has not yet beeninvestigated, since none of the previous studies examining Q changes with CR were focusedon COQ mRNAs or proteins. We hypothesized that specific patterns of COQ mRNA levelsmight be identified in tissues, and that these mRNA patterns could be modulated by CR. Totest this hypothesis we systematically evaluated the profile of Q9 and Q10 and steady-state
Parrado et al. Page 2
Free Radic Biol Med. Author manuscript; available in PMC 2012 June 15.
NIH
-PA Author Manuscript
NIH
-PA Author Manuscript
NIH
-PA Author Manuscript

COQ mRNAs levels in different tissues of animals fed ad libitum (AL) or under CR. Wedemonstrate for the first time that muscular and non-muscular tissues display uniquepatterns of mCOQ transcripts, and that Q and COQ genes are targets of CR in a tissue-specific way, supporting the idea that alterations of Q biosynthesis are part of the metabolicadaptation to CR in mice.
2. Materials and MethodsUnless otherwise indicated, all chemicals were purchased from Sigma (Spain).
2.1. Animals, tissue samples and ethics statementA cohort of 32 ten week old C57BL/6 were used (Charles River Laboratories, Spain). MaleC57BL/6 mice were bred and raised in a vivarium at the Centro Andaluz de Biología delDesarrollo (CABD) under a 12h light/dark cycle (8:00 AM-8:00 PM) under controlledconditions of temperature (22 ± 3°C) and humidity. The animals were fed an AIN93G diet.Food intake was measured during 1 month to determine the average amount of foodconsumed per day. At 3 months of age, animals were randomly divided into AL (95% ofaverage diary intake) or CR (60% average diary intake) groups. Filtered and acidified waterwas available ad libitum for all groups and food was replaced with every day between8:00-9:00 am. Animals were fed for 1 month under these conditions, and then sacrificedafter an 18 hour fast by cervical dislocation. Samples from liver, kidney, brain, skeletalmuscle (gastrocnemius) and heart were taken, frozen in liquid nitrogen, and stored at −80°Cfor later analysis. Animals were handled in accordance with the Pablo de Olavide UniversityEthical Committee rules, and the 86/609/EEC Directive on the protection of animals usedfor experimental and other scientific purposes.
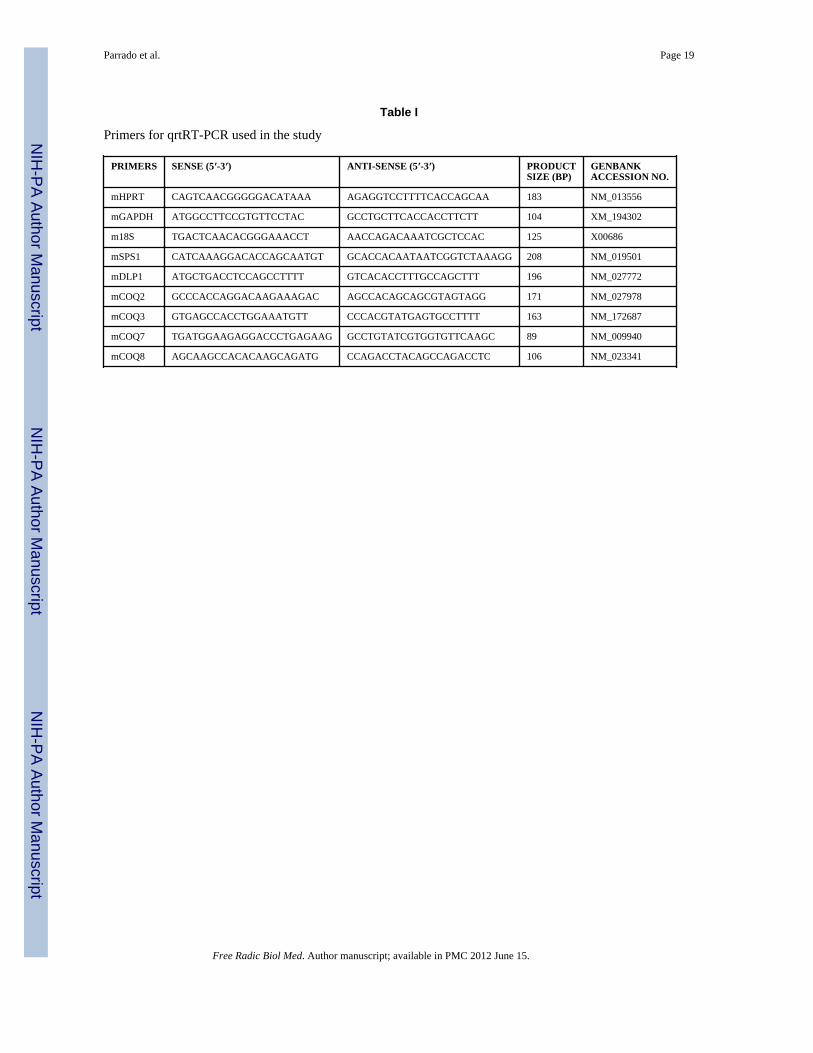
2.2. Quantification of steady-state levels of COQ transcriptsQuantification of mRNA steady-state copy number was carried out by quantitative real timeRT-PCR (qrtRT-PCR), where samples were run against synthetic standards. Total RNA wasobtained from tissues using the Absolutely RNA RT-PCR Miniprep Kit (Stratagene, LaJolla, CA) and then reverse transcribed using the cDNA First Strand Synthesis kit (MRIFermentas, Hanover, MD). Primers were selected using genomic sequences obtained fromGenbank (National Center for Biotechnology Information (NCBI)) and Primer 3 software[29]. Specific primer sequences for COQ and housekeeping genes (glyceraldehyde-3-phosphate dehydrogenase – mGAPDH, hypoxanthine ribosyltransferase – mHPRT, and 18Sribosomal RNA – m18S) measured in this study, with indication of GenBank accessionnumbers and product sizes, are given in Table I.
Primers were used in a standard PCR with cDNA from the tissue of interest as templateusing the 2× Master Mix PCR reagent (MRI Fermentas). Products were run on agarose gelsto confirm that only one band was amplified and no primer dimers were formed. PCRproducts were then column-purified (QIAGEN, Valencia, CA) and sequenced to confirmtarget specificity. The concentration of purified products generated by standard PCR wasthen determined using Molecular Probe’s Picogreen DNA quantification kit, and serialdilutions of PCR products were carried out to obtain standards containing 101, 102, 103, 104,105, 106 and 108 copies of synthetic template. To determine the starting copy number ofcDNA, samples were amplified by qrtRT-PCR using SYBR PCR Master Mix (Bio-RadLaboratories, Hercules, CA). Thermocycling and fluorescence detection was performedaccording to standard protocols using a Bio-Rad real-time PCR machine. The signalobtained from a given tissue cDNA was compared with that of a standard curve run on thesame plate. In addition, total RNA samples that were not reverse transcribed and a no-DNA
Parrado et al. Page 3
Free Radic Biol Med. Author manuscript; available in PMC 2012 June 15.
NIH
-PA Author Manuscript
NIH
-PA Author Manuscript
NIH
-PA Author Manuscript

control were run on each plate to control for genomic DNA contamination and to monitorpotential exogenous contamination, respectively.
To determine if the selected housekeeping genes were appropriate as internal controls, thestability of expression was calculated using the GeNorm 3.3 Visual basic application forMicrosoft Excel (http://medgen.ugent.be/~jvdesomp/genorm/) to calculate the averagepairwise variation of a particular gene with all other control genes (M value) as previouslydeveloped and validated [30]. In our study, calculation of the M values for the three controlgenes assessed revealed that mGAPDH and m18S levels were the least stable under allconditions. Therefore, M values were recalculated using mHPRT where all M values were<1.5. Therefore, the copy numbers for this gene within each sample were used asnormalization factors (NF). Results were then reported as [median (minimum–maximum) ofCOQ genes copy number minus background] / NF.
2.3. Lipid extraction and Q quantificationA total lipid fraction was obtained from the tissues (about 30 mg fresh weight) byhomogenization in 90 μl of Hank’s solution to which 10 μl of 10% SDS had been added tofacilitate disruption of the membranes. Afterwards, two volumes of 95% ethanol–5%isopropanol were added and the mixture was vigorously vortexed. Q was recovered fromSDS-alcoholic solution by extraction with five volumes of hexane. After hexane evaporationunder vacuum, the lipid extract was dissolved in a 1:1 mixture of methanol and n-propanoland then used for quantification of Q9 and Q10 by reversed-phase HPLC separation with aC18 column (25 × 0.45 cm, 5 μm particle size).
HPLC separation was accomplished at 1 ml/min with a mobile phase composed of a mixtureof methanol and n-propanol (1:1) containing lithium perchlorate (2.12 g/L). Monitoring wascarried out with a Coulochem II electrochemical detector (ESA, Chelmsford, MA) fittedwith a Model 5010 analytical cell with the electrodes set at potentials of −500 mV and +300mV. Quinones were detected from the signal obtained at the second electrode.Concentrations were calculated by integration of peak areas and comparison with externalstandards (Sigma, Madrid, Spain).
2.4. SDS-PAGE and immunodetection of Coq2p and Coq3pFor immunodetection of Coq2p and Coq3p polypeptides, protein (about 100 μg) wasdenatured by heating at 45°C during 15 min in SDS-dithiothreitol loading buffer (10%sucrose, 2 mM EDTA, 1.5% (w/v) SDS, 20 mM dithiothreitol, 0.01% (w/v) bromophenolblue and 60 mM Tris–HCl (pH 6.8)) containing 1 mM PMSF and 20 μg/μl each ofchymostatin, leupeptin, antipain and pepstatin A. Proteins were separated by SDS-PAGE(10% acrylamide) and then transferred to nitrocellulose sheets. Blots were stained withPonceau S for visualization of protein lanes. Density of staining with Ponceau’s was used asa control for protein loading as described [31]. Immunostaining of western blots was carriedout with chicken polyclonal anti-sera raised against the protein of interest and diluted at1:2000. A horseradish peroxidase-conjugated anti-chicken IgG secondary antibody (Sigma)diluted at 1:5000 was used to reveal binding sites by enhanced chemiluminiscence.Photographic films and Ponceau S-stained blots were scanned in a GS-800 calibrateddensitometer (Bio-Rad) to obtain digital images. Quantification of intensity reaction wascarried out using Quantity One software (Bio-Rad). Data obtained from quantification ofstained bands (in arbitrary units) were normalized to that of the corresponding lane stainedwith Ponceau S in order to correct for any difference in protein loading between samples.
Parrado et al. Page 4
Free Radic Biol Med. Author manuscript; available in PMC 2012 June 15.
NIH
-PA Author Manuscript
NIH
-PA Author Manuscript
NIH
-PA Author Manuscript
2.5. Statistical analysisFor gene expression and Q quantification studies, samples from all conditions within anexperiment were processed at the same time, and therefore the in vivo effects of diet wereassessed by Student’s t test (vs. corresponding controls). The effects of diet on differenttissues in C57BL/6 mice were assessed by one-way ANOVA followed by analysis ofsignificant differences with Tukey’s test for multiple comparisons. In case this test wasfound inappropriate for our purposes we used Duncan’s non-parametric test. P < 0.05 wasconsidered significant. All values are expressed as mean ± SEM. All statistical analyseswere performed using the SPSS 11.0 software package (Chicago, USA) and STATISTICA8.0. P values less than 0.05 were considered significant.
3. Results and Discussion3.1. Ubiquinone distribution in mouse tissues
We first evaluated Q distribution in different mouse tissues. For this study we chose bothmitotic (liver, kidney) and postmitotic (brain, skeletal muscle, heart) tissues and organs. Asdepicted in Figure 1A, the highest concentration of Q9 on a protein basis was found inkidney, followed by heart, liver, brain and skeletal muscle. In the case of Q10, the order(from maximal to minimal Q concentration) was kidney, heart, brain, liver, and skeletalmuscle (Figure 1B). Differences in Q distribution among tissues were very high, whichagrees with previous reports for the same tissues and organs obtained from mice [16-18] orrats [19]. For instance, when we compared kidney versus skeletal muscle, differences couldbe as high as 20-fold in the case of Q9 and 100-fold in the case of Q10. Lower content of Qin gastrocnemius muscle than in heart was expected since gastrocnemius contains abundantfast-twitch glycolytic fibres and much less mitochondria than heart [32]. In accordance,differences between skeletal muscle and heart are much lower when measuring Q9 and Q10in isolated mitochondria [18,19,23].
Q9/Q10 ratios also displayed significant variability among tissues and organs in the mouse.Highest Q9/Q10 ratios were observed in liver and skeletal muscle (mean values of about 19and 15, respectively), although inter-individual variability was also very high. A lower Q9/Q10 ratio (mean value of 8.6) was found in heart, which also showed lower individualvariability. Kidney and brain exhibited both the lowest Q9/Q10 ratios (mean values of 4.6and 2.7, respectively) and the lowest variability among individuals, particularly in the caseof brain, where all Q9/Q10 values were contained within an extremely narrow range (Figure1C). This observation supports the idea that the homeostatic range for Q isoforms variesamong tissues and organs, and the maintenance of a given Q9/Q10 ratio may be important forproper function of organs, particularly brain, showing a relatively high Q10 content.
3.2. Steady-state levels of COQ transcripts in tissuesOne of our major aims was to systematically evaluate steady-state levels of COQ transcriptsin different mouse tissues. No previous study has applied qrtRT-PCR to provide a reliableestimate of steady-state levels of several COQ transcripts. Previous studies have also notinvestigated the relationship between levels of several COQ transcripts and Q distribution inthe same tissues. We focused our study on genes encoding proteins of known or putativefunction in Q biosynthesis for which inactivating mutations that result in Q deficiency havebeen observed in humans [2]. These included mPDSS1 and mPDSS2, the two subunits ofpolyprenyl diphosphate synthase; mCOQ2, the polyprenyl-4-hydroxybenzoate transferasewhich catalyzes the first enzymatic step that is specific for Q biosynthesis, and mCOQ8 /ADCK3, a putative kinase [1,2]. In addition, we also included in our study two additionalCOQ genes with well-established function in Q biosynthesis: mCOQ3 and mCOQ7. COQ3encodes 2,3-dihydroxy-5-polyprenylbenzoate-methyl transferase, which is responsible for
Parrado et al. Page 5
Free Radic Biol Med. Author manuscript; available in PMC 2012 June 15.
NIH
-PA Author Manuscript
NIH
-PA Author Manuscript
NIH
-PA Author Manuscript
the two O-methylations steps in the production of Q, the last of these yielding the finalproduct [10,33,34]. COQ7/Clk-1 encodes an hydroxylase which catalyzes the conversion of5-demethoxy-Q to hydroxy-Q, the penultimate step of Q biosynthesis [35], and plays aprominent role in determining life span in vertebrate and invertebrate animal models [36].
We demonstrate here for the first time that tissues can be grouped according to steady-statelevels of COQ transcripts (Figure 2) into two basic patterns: muscular and non muscular.Among the transcripts studied, mCOQ7 was the most abundant in gastrocnemius and heart,followed by mCOQ8, mCOQ2, mPDSS2, mPDSS1 and mCOQ3. However, despiteexhibiting a similar pattern of mCOQ transcripts, the two muscular tissues differed byalmost one order of magnitude in Q levels (see Figures 1 and 2). The striking similaritybetween the transcript patterns of gastrocnemius and heart supports the idea that thedifference of Q content is due to post-transcriptional mechanisms which drive Qbiosynthesis rate, the amount of mitochondria, and probably the catabolic rates of Qdegradation [2]. The two mitotic organs studied, liver and kidneys, displayed an almostidentical pattern of steady-state COQ transcripts levels. Maximal abundance was observedfor mCOQ2, followed by mCOQ7, mCOQ8, mPDSS1, mPDSS2, and mCOQ3. The patternof COQ transcripts in brain was similar to those of liver and kidneys, although the absolutenumber of copies of COQ transcripts was lower (Figure 2). Of note, compared with othermCOQ mRNAs, steady-state levels of mCOQ3 transcripts were very low in non musculartissues.
Very few studies have addressed the tissue distribution of COQ transcripts, and none haveanalyzed simultaneously several COQ genes by means of a quantitative and reliabletechnique, such as qrtRT-PCR. Previous studies have focused on single COQ genes, anddata are only available for COQ2, COQ3, and COQ7. Forsgren et al. [14] cloned the humanCOQ2 gene and studied tissue distribution of hCOQ2 transcript using dot blot with aradioactive probe in a commercial array for human mRNA. Maximal levels of hCOQ2mRNA were detected in muscle and heart tissue, which agrees with our results. However,the abundance of hCOQ2 transcript was considerable lower in kidney, as well as in othernon muscular tissues. Here we show that mCOQ2 transcripts can be found at comparablelevels in kidney and muscular tissues. This discrepancy could be due to species specificity(human vs mouse). The study of Marbois et al. [10] was focused on tissue distribution ofCOQ3 mRNA in the rat, using Northern blot with a radioactive probe. Steady-state levels ofCOQ3 mRNA were studied in brain, heart, kidney, liver, skeletal muscle and testis. RatCOQ3 mRNA was particularly abundant in testis, heart and thigh muscle, followed in orderof abundance by kidney, brain and liver, which agrees with our study. Finally, a number ofstudies have addressed the distribution of COQ7 mRNA in several human and mousetissues. These studies have demonstrated that hCOQ7 mRNA is found predominantly inheart and skeletal muscle, whereas very low levels are present in brain, placenta, liver,kidney, pancreas and lung [25,37]. In mice, mCOQ7 mRNA was particularly abundant inheart, skeletal muscle and kidney [27], which also agrees with our results.
We report here that the mRNAs encoding for the two subunits of the polyprenyl diphosphatesynthase (mPDSS1 and mPDSS2) were particularly abundant in muscular tissues. PDSS1and PDSS2 have been proposed to play an important role in determining Q levels becausethe polyprenyl diphosphate synthase is the branch-point enzyme that utilizes FPP in theterminal part of Q biosynthesis, a process which is considered limited by the availability ofpolyisoprenoid chain precursor [2]. However, steady-state levels of mPDSS1 and mPDSS2transcripts were similar in kidney and liver, two organs whose Q content differedsubstantially (see Figure 1), suggesting the existence of post-transcriptional levels ofregulation. It is also possible that a limited amount of mPDSS1 and mPDSS2 transcripts issufficient to provide enough polyisoprenoid chain precursor in these two mitotic organs, the
Parrado et al. Page 6
Free Radic Biol Med. Author manuscript; available in PMC 2012 June 15.
NIH
-PA Author Manuscript
NIH
-PA Author Manuscript
NIH
-PA Author Manuscript

higher concentration of Q in kidney being determined by a higher amount of mitochondria[2]. Transgenic mice harboring an overexpression of mutated PDSS2 isoform showed akidney defect associated with Q deficiency that was partially rescued by Q supplementation[13].
3.3. Tissue patterns of Coq2 and Coq3 polypeptidesOf note, mCOQ3 transcripts varied substantially among the different tissues irrespective oftheir Q levels (see Figures 1 and 2). The lack of correlation between mCOQ3 transcripts andQ levels in tissues has been explained on the basis of the existence of post-transcriptionalcontrols [10]. However, no study has been designed to date to test this hypothesis. Thus, wewere interested in analyzing tissue levels of mCoq3 polypeptide to investigate if proteinlevels followed those of mRNA. Our study at the protein level also included mCoq2p.Although increased in kidney, heart and skeletal muscle, steady-state levels of mCOQ2 intissues were more homogeneous than those of mCOQ3 (see Figure 2).
As depicted in Figure 3, mCoq2p levels were higher in tissues and organs which showed thehighest levels of mCOQ2 transcripts. Maximal levels of Coq2p were detected in heart andkidney, the two organs showing the highest levels of Q, followed by skeletal muscle. Thelowest levels of mCoq2p were detected in brain and liver, which also showed lower steady-state levels of mCOQ2 transcripts. With respect to mCoq3p, maximal levels were detected inheart, while this polypeptide was found at significantly lower amounts in liver, kidney,skeletal muscle and brain. It is noteworthy that differences between the latter four tissues interms of steady-state levels of mCOQ3 transcripts were of up to 3 orders of magnitude (if wecompare skeletal muscle versus brain) whereas similar levels of mCoq3p were found inthese tissues, demonstrating a strong regulation at a post-transcriptional level, as previouslysuggested [10]. The relatively low level of mCoq3p in kidney is very interesting because thisorgan showed by far the highest levels of Q9 and Q10. Although Coq3p catalyzes two stepsin Q biosynthesis, the last of them yielding the final product [10,33,34], the low levels ofmCOQ3 RNA and mCoq3p in kidney is consistent with a non limiting role for Coq3p in Qbiosynthesis. In accordance, it has been suggested that Q levels in tissues are regulated at theinitial steps in the terminal part of Q biosynthesis. Competitive inhibition of Coq2p by p-hydroxybenzoate analogues readily decreases Q levels in cellular systems [38,39],supporting an important role for Coq2p in the overall regulation of Q synthesis.Furthermore, there was no correlation between levels of Coq7p (which catalyzes thepenultimate step of Q biosynthesis) and those of Q in a mouse model of transgene mCOQ7expression [28]. However, the Coq7 reaction is apparently a point of regulation of Qbiosynthesis pathway in yeast by post-transcriptional modification of either Coq7p or anycomponent of the biosynthesis pre-complex [40].
3.4. The effect of calorie restriction on Q tissue levelsOne month of 40% CR produced changes in the absolute levels of Q in muscular tissues(Figure 1). An increase of both Q9 and Q10 was detected in skeletal muscle, whereas adecrease of Q9 with no change in Q10 was detected in heart. In addition, the Q9/Q10 ratiowas increased in kidney but decreased in heart. Previous reports have shown that long-termCR increased Q9 content of mitochondria isolated from skeletal muscle [23], liver, heart andkidney [24], although another study reported that CR induced a decrease of Q9 and Q10 inliver mitochondria [41]. The increase of Q9 by CR in skeletal muscle mitochondria [23]agrees with our results, although we also observed an increase of Q10, and these changeswere detected very early, after one month of CR. Our results are in agreement withBevilacqua et al. [42], who demonstrated that skeletal muscle (but not liver) mitochondriaare rapidly adapted to short-term (2-wk and 2-mo) CR in the rat with a significant decreaseof ROS generation [43]. It is possible that CR effects on Q in liver are a late event since life-
Parrado et al. Page 7
Free Radic Biol Med. Author manuscript; available in PMC 2012 June 15.
NIH
-PA Author Manuscript
NIH
-PA Author Manuscript
NIH
-PA Author Manuscript

long CR attenuated the increase of Q9/Q10 ratio in rat liver plasma membrane from aged rats[44].
Very few pharmacological treatments or physiological conditions are known to producesignificant increases of Q in tissues, and most of them are related with oxidative stressconditions. An early work described increases in the contents of Q in liver and, to someextent, in kidney and muscle of rats treated with peroxisome proliferators, withoutmodifying cholesterol levels [45]. More recently, it was reported that camptothecin andother chemotherapeutic drugs, such as etoposide, doxorubicin, and methotrexate, increasedQ10 levels in tumour cells as part of an antioxidant response [46]. Finally, the mono anddiepoxy derivatives of α- γ-tocotrienols are strong stimulators of Q biosynthesis [2]. TheCR-induced increase of Q9 and Q10 in skeletal muscle is unique because it is associated withdecreased oxidative stress [42]. In addition to alterations in the abundance of mCOQtranscripts (see below), a more reduced status might lead to higher Q levels in skeletalmuscle due to reduced oxidative degradation.
The effects of CR on Q levels and Q9/Q10 ratio in heart are noteworthy because thesemodifications might be associated with alterations in mitochondrial function. Interestingly,ubisemiquinone-derived ROS are believed to be involved in Ca2+-stimulatedpermeabilization of mitochondria due to the opening of the permeability transition pore(PTP) [47], and quinones are well known modulators of the PTP [48,49]. Interestingly,short-term (2 mo) CR produced a small (14%) decrease in ROS production by heartventricular subsarcolemmal mitochondria isolated from 6 mo male F344 rats [50], andcounteracted the age-related loss in their Ca2+ retention capacity [51]. It is tempting tospeculate that the CR-induced changes of the Q system we show here could be related withsome of the beneficial effects of CR on the mitochondrial physiology in heart. However, ithas to be acknowledged that CR produced opposite effects on Q levels in kidney, whichpoints to the existence of different mechanisms of regulation in this mitotic organ comparedwith heart.
The Q9/Q10 ratio is determined by the polyisoprenoid substrate available for the reactioncatalyzed by the polyprenyl 4-hydroxybenzoate transferase. The actual products of thetrans-prenyltransferase activity (nona- or decaprenylpyrophosphate) are determined by theratio between FPP and IPP, giving more decaprenylpyrophosphate in the presence of highIPP-Mg2+ [52]. Thus, our observations that CR increased Q9/Q10 ratio in kidney butdecreased it in heart might indicate the existence of alterations in IPP/FPP ratio under CRconditions.
3.5. Effect of calorie restriction on steady-state COQ transcripts and Coq2 and Coq3polypeptides
We next studied how calorie restriction affected steady-state levels of COQ transcripts intissues. As depicted in Figure 4, the abundance of mCOQ transcripts was affected by CR ina tissue-specific manner. The response of the two mitotic tissues to CR included a modestincrease of some mCOQ transcripts: mCOQ2, mCOQ3, mCOQ7 and mCOQ8 in liver, andmCOQ2 and mCOQ7 in kidney. If we compare these results with those obtained for Qlevels, we can conclude that the limited changes of mRNAs detected in liver and kidneywere not sufficient to produce significant alterations of Q levels. No changes in mPDSS1 ormPDSS2 transcripts were observed in kidney from CR mice. A mutation in PDSS1 has beendemonstrated to decrease significantly Q10 without affecting Q9 levels in humans [53].
Muscular tissues were affected by CR in a different way. In skeletal muscle mPDSS2 wasincreased, whereas COQ7 was decreased. The increase of mPDSS2 in skeletal musclecoincided with a significant increase of Q9 and Q10 levels (see above). Camptothecin-
Parrado et al. Page 8
Free Radic Biol Med. Author manuscript; available in PMC 2012 June 15.
NIH
-PA Author Manuscript
NIH
-PA Author Manuscript
NIH
-PA Author Manuscript

induced increase of Q10 levels in cellular systems was associated with up-regulation ofCoq7p expression, as part of an antioxidant response [46]. Increase of Q10 biosynthesis bychemotherapeutic drugs is dependent on NF-κB that binds specifically to two κB bindingsites present in the 5′-flanking region of the COQ7 gene, inducing both the COQ7expression and Q10 biosynthesis [54]. Here, we show that the CR-induced increase of Qlevels in skeletal muscle is not dependent on increased abundance of mCOQ7 mRNA but, onthe contrary, decreased steady-state levels of mCOQ7 with CR were found in this tissue. Thefact that CR can increase both steady-state levels of mPDSS2 and total Q in skeletal musclemay be of importance because skeletal muscle is one of the specific sites of Q deficiencyand tissue damage caused by a mutation in the PDSS2 gene in humans [55]. In heart, thegeneral response was a decrease in many of the COQ transcripts analyzed, except for COQ7,which showed a slight increase. The decrease of Q9 with CR in heart is consistent withsignificant decreases of mPDSS2, mCOQ2, and mCOQ8 transcripts. A trend towards lowerlevels was also observed for mPDSS1 and mCOQ3 in heart from CR mice, althoughdifferences were not statistically significant. Remarkably, no change in steady-state levels ofany of the COQ transcripts was observed in brain, which coincided with the lack of changeselicited by CR in Q levels.
We also studied putative variations in the amount of Coq2 and Coq3 polypeptides inducedby CR. For this analysis we only included the organs or tissues that exhibited some changeassociated with CR, either in Q or COQ transcripts levels. As depicted in Figure 5, thegeneral tendency was either no change, or decreases of Coq2 and Coq3 polypeptides withCR. Although Coq3p was decreased by CR in kidney, Coq2p was unchanged. As statedabove, steady-state abundance of mCOQ3 or Coq3p do not correlate with Q levels, and thepossibility exists that relatively low levels of Coq3p are sufficient to provide enough Qbiosynthesis. The lack of CR-induced changes for mCOQ2 and mCOQ3 transcripts inskeletal muscle is consistent with the absence of changes at the level of protein, whichagrees with the idea that the increase of Q levels by short-term CR in skeletal muscle isregulated at an early point, most likely by the availability of polyisoprenoid chain precursor[2] and/or by a less oxidant status [42] which leads to decreased oxidative degradation. Inheart, the decrease in most mCOQ transcripts coincided with decreases of Coq2p andCoq3p, suggesting that lower levels of Q9 in heart after 1 mo of CR may be the result ofdecreased biosynthesis.
In summary we demonstrate for the first time that muscular and non-muscular tissuesdisplay unique patterns of mCOQ transcripts, and that Q and COQ genes are targets of CR ina tissue-specific way, supporting the idea that alterations of Q biosynthesis are part of themetabolic adaptation to CR in mice.
AcknowledgmentsThis work was supported by NIH grant 1R01AG028125-01A1 (to JJR, PN and JMV), Junta de AndalucíaProyectos de Excelencia grant CVI-00648 (to PN), Junta de Andalucía Proyectos de Excelencia grant P09-CVI-4887 (to JMV), Junta de Andalucía Proyectos Internacionales grant (to JMV), and BIO-276 (Junta deAndalucía and the University of Córdoba, to JMV). CP was funded by CVI-00648 grant. We thank Raúl Luque forproviding housekeeping genes sequences and for transmitting us his experience with qrtRT-PCR. We thankAlmudena Velázquez for handling of laboratory animals.
6. List of non standard abbreviations
AL Ad libitum
CR calorie restriction
FPP farnesyl pyrophosphate
Parrado et al. Page 9
Free Radic Biol Med. Author manuscript; available in PMC 2012 June 15.
NIH
-PA Author Manuscript
NIH
-PA Author Manuscript
NIH
-PA Author Manuscript

IPP isopentenyl pyrophosphate
NF normalization factor
PTP permeability transition pore
Q coenzyme Q, ubiquinone
UCPs mitochondrial uncoupling proteins
7. References[1]. Turunen M, Olsson J, Dallner G. Metabolism and function of coenzyme Q. Biochim. Biophys.
Acta. 2004; 1660:171–199. [PubMed: 14757233][2]. Bentinger M, Tekle M, Dallner G. Coenzyme Q – Biosynthesis and functions. Biochem. Biophys.
Res. Commun. 2010; 396:74–79. [PubMed: 20494114][3]. González-Aragón D, Ariza J, Villalba JM. Dicoumarol impairs mitochondrial electron transport
and pyrimidine biosynthesis in human myeloid leukemia HL-60 cells. Biochem. Pharmacol.2007; 73:427–439. [PubMed: 17123468]
[4]. López-Martín JM, Salviati L, Trevisson E, Montini G, DiMauro S, Quinzii C, Hirano M,Rodríguez-Hernández A, Cordero MD, Sánchez-Alcázar JA, Santos-Ocaña C, Navas P. Missensemutation of the COQ2 gene causes defects of bioenergetics and de novo pyrimidine synthesis.Hum. Mol. Genet. 2007; 16:1091–1097. [PubMed: 17374725]
[5]. Villalba JM, Navarro F, Córdoba F, Serrano A, Arroyo A, Crane FL, Navas P. Coenzyme Qreductase from liver plasma membrane: purification and role in transplasma membrane electrontransport. Proc. Natl. Acad. Sci. USA. 1995; 92:4887–4892. [PubMed: 7761418]
[6]. Jarmuszkiewicz W, Navet R, Alberici LC, Douette P, Sluse-Goffart CM, Sluse FE, Vercesi AE.Redox state of endogenous coenzyme Q modulates the inhibition of linoleic acid-induceduncoupling by guanosine triphosphate in isolated skeletal muscle mitochondria. J. Bioenerg.Biomembr. 2004; 36:493–502. [PubMed: 15534396]
[7]. Papucci L, Schiavone N, Witort E, Donnini M, Lapucci A, Tempestini A, Formigli L, Zecchi-Orlandini S, Orlandini G, Carella G, Brancato R, Capaccioli S. Coenzyme Q10 preventsapoptosis by inhibiting mitochondrial depolarization independently of its free radical scavengingproperty. J. Biol. Chem. 2003; 278:28220–28228. [PubMed: 12736273]
[8]. Villalba JM, Navas P. Plasma membrane redox system in the control of stress-induced apoptosis.Antiox. Redox Signal. 2000; 2:213–230.
[9]. Elmberger PG, Kalèn A, Appelkvist E–L, Dallner G. In vitro and in vivo synthesis of dolichol andother main mevalonate products in various organs of the rat. Eur. J. Biochem. 1987; 168:1–11.[PubMed: 3665910]
[10]. Marbois BN, Xia Y–R, Lusis AJ, Clarke CF. Ubiquinone biosynthesis in eukaryotic cells: Tissuedistribution of mRNA encoding 3,4-dihydroxy-5-polyprenylbenzoate methyltransferase in the ratand mapping of the COQ3 gene to mouse chromosome 4. Arch. Biochem. Biophys. 1994;313:83–88. [PubMed: 8053692]
[11]. Villalba JM, Parrado C, Santos-González M, Alcaín FJ. Therapeutic use of coenzyme Q10 andcoenzyme Q10-related compounds and formulations. Expert. Opin. Invest. Drugs. 2010; 19:535–554.
[12]. Saiki R, Nagata A, Kainou T, Matsuda H, Kawamukai M. Characterization of solanesyl anddecaprenyl diphosphate synthases in mice and humans. FEBS J. 2005; 272:5606–5622.[PubMed: 16262699]
[13]. Peng M, Falk MJ, Haase VH, King R, Polyak E, Selak M, Yudkoff M, Hancock WW, Meade R,Saiki R, Lunceford AL, Clarke CF, Gasser DL. Primary coenzyme Q deficiency in Pdss2 mutantmice causes isolated renal disease. PLoS Genet. 2008; 4:e1000061. doi:10.1371/journal.pgen.1000061. [PubMed: 18437205]
Parrado et al. Page 10
Free Radic Biol Med. Author manuscript; available in PMC 2012 June 15.
NIH
-PA Author Manuscript
NIH
-PA Author Manuscript
NIH
-PA Author Manuscript

[14]. Forsgren M, Attersand A, Lake S, Grünler J, Swiezewska E, Dallner G, Climent I. Isolation andfunctional expression of human COQ2, a gene encoding a polyprenyl transferase involved in thesynthesis of CoQ. Biochem. J. 2004; 382:519–526. [PubMed: 15153069]
[15]. Aberg F, Appelkvist EL, Dallner G, Ernster L. Distribution and redox state of ubiquinones in ratand human tissues. Arch. Biochem. Biophys. 1992; 295:230–234. [PubMed: 1586151]
[16]. Lass A, Forster MJ, Sohal RS. Effects of coenzyme Q10 and α-tocopherol administration on theirtissue levels in the mouse: Elevation of mitochondrial α-tocopherol by coenzyme Q10. FreeRadic. Biol. Med. 1999; 26:1375–1383. [PubMed: 10401600]
[17]. Tang PH, Miles MV, Miles L, Quinlan J, Wong B, Wenisch A, Bove K. Measurement of reducedand oxidized coenzyme Q9 and coenzyme Q10 levels in mouse tissues by HPLC withcoulometric detection. Clin. Chim. Acta. 2004; 341:173–184. [PubMed: 14967174]
[18]. Sohal RS, Kamzalov S, Sumien N, Ferguson M, Rebrin I, Heinrich KR, Forster MJ. Effect ofcoenzyme Q10 intake on endogenous coenzyme Q content, mitochondrial electron transportchain, antioxidative defenses, and life span of mice. Free Radic. Biol. Med. 2006; 40:480–487.[PubMed: 16443163]
[19]. Kwong LK, Kamzalov S, Rebrin I, Bayne A–CV, Jana CK, Morris P, Forster MJ, Sohal RS.Effects of coenzyme Q10 administration on its tissue concentrations, mitochondrial oxidantgeneration, and oxidative stress in the rat. Free Radic. Biol. Med. 2002; 33:627–638. [PubMed:12208349]
[20]. Hursting SD, Lavigne JA, Berrigan D, Perkins SN, Barrett JC. Calorie restriction, aging, andcancer prevention: mechanisms of action and applicability to humans. Annu. Rev. Med. 2003;54:131–152. [PubMed: 12525670]
[21]. Pollak M. Do cancer cells care if their host is hungry? Cell Metab. 2009; 9:401–403. [PubMed:19416708]
[22]. Witte AV, Fobker M, Gellner R, Knecht S, Floel A. Caloric restriction improves memory inelderly humans. Proc. Natl. Acad. Sci. USA. 2009; 106:1255–1260. [PubMed: 19171901]
[23]. Lass A, Kwong L, Sohal RS. Mitochondrial coenzyme Q content and aging. BioFactors. 1999;9:199–205. [PubMed: 10416032]
[24]. Kamzalov S, Sohal R. Effect of age and caloric restriction on coenzyme Q and α-tocopherollevels in the rat. Exp. Gerontol. 2004; 39:1199–1205. [PubMed: 15288694]
[25]. Asaumi S, Kuroyanagi H, Seki N, Shirasawa T. Orthologues of the Caenorhabditis eleganslongevity gene clk-1 in mouse and human. Genomics. 1999; 58:293–301. [PubMed: 10373327]
[26]. Takahashi M, Asaumi S, Honda S, Suzuki Y–I, Nakai D, Kuroyanagi H, Shimizu T, Honda Y,Shirasawa T. Mouse coq7/clk-1 orthologue rescued slowed rhythmic behavior and extended lifespan of clk-1 longevity mutant in Caenorhabditis elegans. Biochem. Biophys. Res. Commun.2001; 286:534–540. [PubMed: 11511092]
[27]. Jiang N, Levavasseur F, McCright B, Shoubridge EA, Hekimi S. Mouse CLK-1 is imported intomitochondria by an unusual process that requires a leader sequence but no membrane potential. J.Biol. Chem. 2001; 276:29218–29225. [PubMed: 11387338]
[28]. Nakai D, Shimizu T, Nojiri H, Uchiyama S, Koike H, Takahashi M, Hirokawa K, Shirasawa T.Coq7/clk1 regulates mitochondrial respiration and the generation of reactive oxygen species viacoenzyme Q. Aging Cell. 2004; 3:273–281. [PubMed: 15379851]
[29]. Rozen S, Skaletsky H. Primer3 on the WWW for general users and for biologist programmers.Methods Mol. Biol. 2000; 132:365–386. [PubMed: 10547847]
[30]. Vandesompele J, De Preter K, Pattyn F, Poppe B, Van Roy N, De Paepe A, Speleman F.Accurate normalization of real-time quantitative RT-PCR data by geometric averaging ofmultiple internal control genes. Genome Biol. 2002; 3 RESEARCH0034.
[31]. Bello RI, Alcaín FJ, Gómez-Díaz C, López-Lluch G, Navas P, Villalba JM. Hydrogen peroxideand cell density-regulated expression of cytochrome b5 reductase in HeLa cells. J. Bioenerg.Biomembr. 2003; 35:169–179. [PubMed: 12887015]
[32]. Hamalainen N, Pette D. The histochemical profiles of fast fiber types IIB, IID and IIA in skeletalmuscles of mouse, rat and rabbit. J. Histochem. Cytochem. 1993; 41:733–743. [PubMed:8468455]
Parrado et al. Page 11
Free Radic Biol Med. Author manuscript; available in PMC 2012 June 15.
NIH
-PA Author Manuscript
NIH
-PA Author Manuscript
NIH
-PA Author Manuscript

[33]. Poon WW, Barkovich RJ, Hsu AY, Frankel A, Lee PT, Shepherd JN, Myles DC, Clarke CF.Yeast and rat Coq3 and Escherichia coli UbiG polypeptides catalyze both O-methyltransferasesteps in coenzyme Q biosynthesis. J. Biol. Chem. 1999; 274:21665–21672. [PubMed: 10419476]
[34]. Jonassen T, Clarke CF. Isolation and functional expression of human COQ3, a gene encoding amethyltransferase required for ubiquinone biosynthesis. J. Biol. Chem. 2000; 275:12381–12387.[PubMed: 10777520]
[35]. Stenmark P, Grünler J, Mattsson J, Sindelar PJ, Nordlund P, Berthold DA. A new member of thefamily of di-iron carboxylate proteins. Coq7 (clk-1), a membrane bound hydroxylase involved inubiquinone biosynthesis. J. Biol. Chem. 2001; 276:33297–33300. [PubMed: 11435415]
[36]. Liu X, Jiang N, Hughes B, Bigras E, Shoubridge E, Hekimi S. Evolutionary conservation of theclk-1-dependent mechanism of longevity: Loss of mclk1 increases cellular fitness and lifespan inmice. Genes Dev. 2005; 19:2424–2434. [PubMed: 16195414]
[37]. Vajo Z, King LM, Jonassen T, Wilkin DJ, Ho N, Munnich A, Clarke CF, Francomano CA.Conservation of the Caenorhabditis elegans timing gene clk-1 from yeast to human: a generequired for ubiquinone biosynthesis with potential implications for aging. Mammalian Genome.1999; 10:1000–1004. [PubMed: 10501970]
[38]. González-Aragón D, Burón MI, López-Lluch G, Hermán MD, Gómez-Díaz C, Navas P, VillalbaJM. Coenzyme Q and the regulation of intracellular steady-state levels of superoxide in HL-60cells. BioFactors. 2005; 25:31–41. [PubMed: 16873928]
[39]. Forsman U, Sjöberg M, Turunen M, Sindelar PJ. 4-Nitrobenzoate inhibits coenzyme Qbiosynthesis in mammalian cell cultures. Nat. Chem. Biol. 2010; 6:515–517. [PubMed:20526342]
[40]. Padilla S, Tran UC, Jiménez-Hidalgo M, López-Martín JM, Martín-Montalvo A, Clarke CF,Navas P, Santos-Ocaña C. Hydroxylation of demethoxy-Q6 constitutes a control point in yeastcoenzyme Q6 biosynthesis. Cell. Mol. Life Sci. 2009; 66:173–186. [PubMed: 19002377]
[41]. Armeni T, Principato G, Quiles JL, Pieri C, Bompadre S, Battino M. Mitochondrial dysfunctionsduring aging: Vitamin E deficiency or calorie restriction – Two different ways of modulatingstress. J. Bioenerg. Biomembr. 2003; 35:181–191. [PubMed: 12887016]
[42]. Bevilacqua L, Ramsey JJ, Hagopian K, Weindruch R, Harper ME. Effects of short- and medium-term calorie restriction on muscle mitochondrial proton leak and reactive oxygen speciesproduction. Am. J. Physiol. Endocrinol. Metab. 2004; 286:E852–E861. [PubMed: 14736705]
[43]. Ramsey JJ, Hagopian K, Kenny TM, Koomson EK, Bevilacqua L, Weindruch R, Harper ME.Proton leak and hydrogen peroxide production in liver mitochondria from energy-restricted rats.Am. J. Physiol. Endocrinol. Metab. 2004; 286:E31–E40. [PubMed: 14662512]
[44]. De Cabo R, Cabello R, Rios M, López-Lluch G, Ingram DK, Lane MA, Navas P. Calorierestriction attenuates age-related alterations in the plasma membrane antioxidant system in ratliver. Exp. Gerontol. 2004; 39:297–304. [PubMed: 15036389]
[45]. Aberg F, Zhang Y, Teclebrhan H, Appelkvist EL, Dallner G. Increases in tissue levels ofubiquinone in association with peroxisome proliferation. Chem. Biol. Interact. 1996; 99:205–218. [PubMed: 8620569]
[46]. Brea-Calvo G, Rodríguez-Hernández A, Fernández-Ayala DJ, Navas P, Sánchez-Alcázar JA.Chemotherapy induces an increase in coenzyme Q10 levels in cancer cell lines. Free Radic. Biol.Med. 2006; 40:1293–1302. [PubMed: 16631519]
[47]. Kowaltowski AJ, Castilho RF, Vercesi AE. Ca2+-induced mitochondrial membranepermeabilization: role of coenzyme Q redox state. Am. J. Physiol. 1995; 269:C141–C147.[PubMed: 7631741]
[48]. Fontaine E, Ichas F, Bernardi P. A ubiquinone-binding site regulates the mitochondrialpermeability transition pore. J. Biol. Chem. 1998; 273:25734–25740. [PubMed: 9748242]
[49]. Walter L, Nogueira V, Leverve X, Heitz MP, Bernardi P, Fontaine E. Three classes ofubiquinone analogs regulate the mitochondrial permeability transition pore through a commonsite. J. Biol. Chem. 2000; 275:29521–29527. [PubMed: 10889201]
[50]. Judge S, Judge A, Grune T, Leeuwenburgh C. Short-term CR decreases cardiac mitochondrialoxidant production but increases carbonyl content. Am. J. Physiol. Regul. Integr. Comp. Physiol.2004; 286:R254–R259. [PubMed: 14592935]
Parrado et al. Page 12
Free Radic Biol Med. Author manuscript; available in PMC 2012 June 15.
NIH
-PA Author Manuscript
NIH
-PA Author Manuscript
NIH
-PA Author Manuscript
[51]. Hofer T, Servais S, Seo AY, Marzetti E, Hiona A, Upadhyay SJ, Wohlgemuth SE,Leeuwenburgh C. Bioenergetics and permeability transition pore opening in heartsubsarcolemmal and interfibrillar mitochondria: Effects of aging and lifelong calorie restriction.Mech. Ageing Dev. 2009; 130:297–307. [PubMed: 19428447]
[52]. Runquist M, Ericsson J, Thelin A, Chojnacki T, Dallner G. Isoprenoid biosynthesis in rat livermitochondria. J. Biol. Chem. 1994; 269:5804–5809. [PubMed: 8119922]
[53]. Mollet J, Giurgea I, Schlemmer D, Dallner G, Chretien D, Delahodde A, Bacq D, de Lonlay P,Munnich A, Rötig A. Prenyldiphosphate synthase, subunit 1 (PDSS1) and OH-benzoatepolyprenyltransferase (COQ2) mutations in ubiquinone deficiency and oxidative phosphorylationdisorders. J. Clin. Invest. 2007; 117:765–772. [PubMed: 17332895]
[54]. Brea-Calvo G, Siendones E, Sánchez-Alcázar JA, de Cabo R, Navas P. Cell survival fromchemotherapy depends on NF-kappaB transcriptional up-regulation of coenzyme Q biosynthesis.PLoS One. 2009; 4:e5301. [PubMed: 19390650]
[55]. Lopez LC, Schuelke M, Quinzii CM, Kanki T, Rodenburg RJ, Naini A, Dimauro S, Hirano M.Leigh syndrome with nephropathy and CoQ10 deficiency due to decaprenyl diphosphate synthasesubunit 2 (PDSS2) mutations. Am. J. Hum. Genet. 2006; 79:1125–1129. [PubMed: 17186472]
Parrado et al. Page 13
Free Radic Biol Med. Author manuscript; available in PMC 2012 June 15.
NIH
-PA Author Manuscript
NIH
-PA Author Manuscript
NIH
-PA Author Manuscript

Figure 1.Tissue distribution of Q homologues and Q9/Q10 ratio. Tissues (liver, kidney, brain, skeletalmuscle and heart) were taken from 4 mo old mice that had been fed ad libitum or under 1mo CR. Quinones were recovered by organic extraction with hexane, and separated andquantified by HPLC. A) Q9 levels. B) Q10 levels. C) Q9/Q10 ratio. Data are means ± SEM(n=16). Significant differences between diets (ad libitum vs CR) are indicated by asterisks (*p<0.05 ; ** p<0.01 ; ***p<0.001). Open bars, ad libitum; Closed bars : CR.
Parrado et al. Page 14
Free Radic Biol Med. Author manuscript; available in PMC 2012 June 15.
NIH
-PA Author Manuscript
NIH
-PA Author Manuscript
NIH
-PA Author Manuscript

Figure 2.Patterns of steady-state levels of mCOQ transcripts in mouse tissues. RNA samples wereextracted from liver, kidney, brain, skeletal muscle and heart obtained from control animals(fed ad libitum), and then used for reverse transcription and quantification of the absolutenumber of mRNA copies by qrtRT-PCR. Primers are depicted in Table I. Results obtainedfor mCOQ mRNAs were normalized to those of mHPRT as internal control. Data are means± SEM (n=16).
Parrado et al. Page 15
Free Radic Biol Med. Author manuscript; available in PMC 2012 June 15.
NIH
-PA Author Manuscript
NIH
-PA Author Manuscript
NIH
-PA Author Manuscript

Figure 3.Levels of Coq2p and Coq3p in mouse tissues. Samples of liver, kidney, brain, skeletalmuscle and heart were obtained from control animals (fed ad libitum), and then processedfor SDS-PAGE and immunodetection of the polypeptides of interest by Western blot.Staining was repeated in three different preparations. This figure depicts the results of arepresentative blot.
Parrado et al. Page 16
Free Radic Biol Med. Author manuscript; available in PMC 2012 June 15.
NIH
-PA Author Manuscript
NIH
-PA Author Manuscript
NIH
-PA Author Manuscript

Figure 4.The effect of short-term (1 mo) CR on steady-state abundance of mCOQ mRNAs. RNAsamples were extracted from liver, kidney, brain, skeletal muscle and heart obtained fromanimals fed ad libitum or under CR (1 mo). Samples were processed as described in Figure2. Depicted results show the absolute number of copies of mCOQ mRNAs present in tissuesobtained from calorie-restricted animals, normalized to mHPRT and then referred to thevalues obtained for the same tissue obtained from control animals (set to 100% in eachcase). Data are means ± SEM (n=16). Open bars, ad libitum; Closed bars : CR.
Parrado et al. Page 17
Free Radic Biol Med. Author manuscript; available in PMC 2012 June 15.
NIH
-PA Author Manuscript
NIH
-PA Author Manuscript
NIH
-PA Author Manuscript
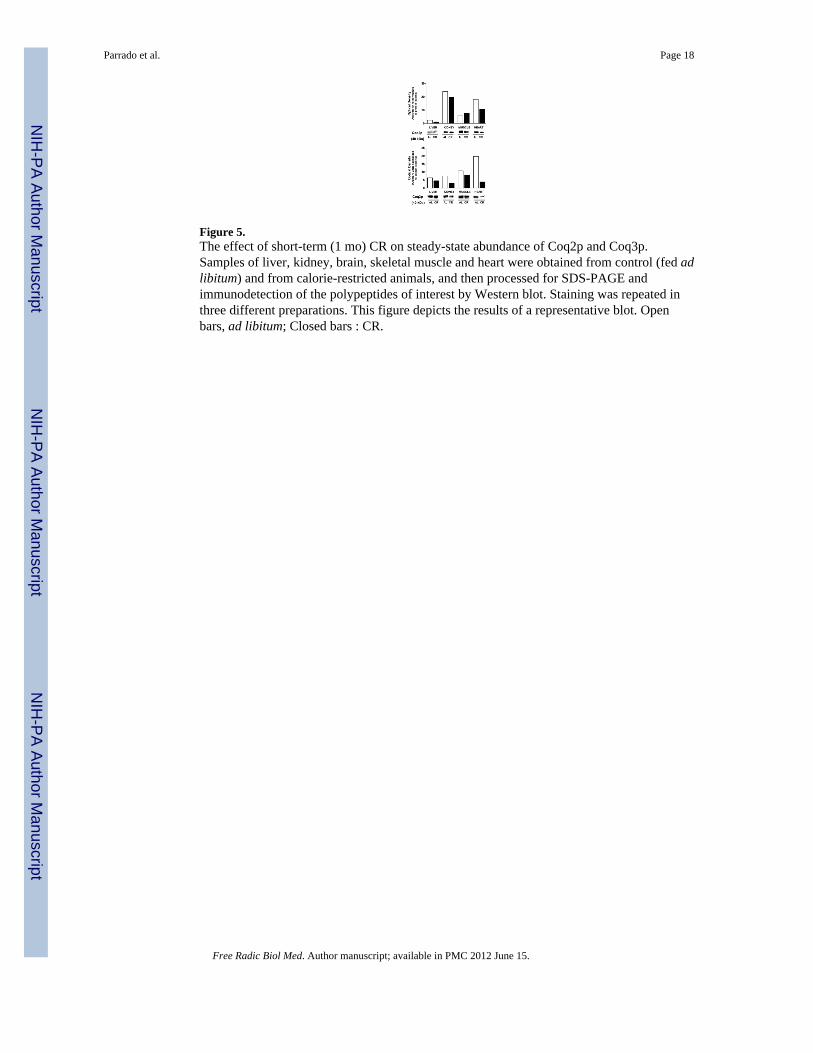
Figure 5.The effect of short-term (1 mo) CR on steady-state abundance of Coq2p and Coq3p.Samples of liver, kidney, brain, skeletal muscle and heart were obtained from control (fed adlibitum) and from calorie-restricted animals, and then processed for SDS-PAGE andimmunodetection of the polypeptides of interest by Western blot. Staining was repeated inthree different preparations. This figure depicts the results of a representative blot. Openbars, ad libitum; Closed bars : CR.
Parrado et al. Page 18
Free Radic Biol Med. Author manuscript; available in PMC 2012 June 15.
NIH
-PA Author Manuscript
NIH
-PA Author Manuscript
NIH
-PA Author Manuscript
NIH
-PA Author Manuscript
NIH
-PA Author Manuscript
NIH
-PA Author Manuscript
Parrado et al. Page 19
Table I
Primers for qrtRT-PCR used in the study
PRIMERS SENSE (5′-3′) ANTI-SENSE (5′-3′) PRODUCTSIZE (BP)
GENBANKACCESSION NO.
mHPRT CAGTCAACGGGGGACATAAA AGAGGTCCTTTTCACCAGCAA 183 NM_013556
mGAPDH ATGGCCTTCCGTGTTCCTAC GCCTGCTTCACCACCTTCTT 104 XM_194302
m18S TGACTCAACACGGGAAACCT AACCAGACAAATCGCTCCAC 125 X00686
mSPS1 CATCAAAGGACACCAGCAATGT GCACCACAATAATCGGTCTAAAGG 208 NM_019501
mDLP1 ATGCTGACCTCCAGCCTTTT GTCACACCTTTGCCAGCTTT 196 NM_027772
mCOQ2 GCCCACCAGGACAAGAAAGAC AGCCACAGCAGCGTAGTAGG 171 NM_027978
mCOQ3 GTGAGCCACCTGGAAATGTT CCCACGTATGAGTGCCTTTT 163 NM_172687
mCOQ7 TGATGGAAGAGGACCCTGAGAAG GCCTGTATCGTGGTGTTCAAGC 89 NM_009940
mCOQ8 AGCAAGCCACACAAGCAGATG CCAGACCTACAGCCAGACCTC 106 NM_023341
Free Radic Biol Med. Author manuscript; available in PMC 2012 June 15.