AUTHOR Fuchs, Lynn,S.;'And Others TITLE INSTITUTION ...Fuchs, Lynn,S.;'And Others Effects of...
61
ED *226 045' AUTHOR TITLE INSTITUTION 'SPONS AGENCY REPORT NO PUB DATE CONTRACT NOTE AVAILABLE FROM PUB tYPE DOCUMENT RESUME TM 830 080 Fuchs, Lynn,S.;'And Others Effects of Frequent Curriculum-Based Measurement and Evaluation .on Student Achievement and Knowledge of Performance: An Experimental Study. Minnesota Univ., Minneapolis. Inst: for Research on *Learning' Disabes. Deparment of Eddcation, Washington, DC. IRLD-RR-96 Nov 82 300-80-0622 65p. . Editor, IRLD, 350 Elliott Hall, 750 East River Road, University of Minneapolis, MN 55455 ($3.00) Reports - liesearch/Technical (143) -- Tests/Evaluation Instruments (160) EDRS PRICE MF01/2CO3 Plus Postage. DESCRIPTORS *Academic Achievement; *Curriculum Development; *Disabilities; Elementary Education; *Evaluat,ion Methods; Federal Legislation; Individualized Education Programs; Pretests Posttests; *Program Development; Program 'Improvement; Rating Scales; *Self'Concept; Special Education Teachers IDENTIFIERS *Stanford Diagnostic Reading Test ABSTRACT In special educationt a merger between assessment and instruction is mandated by Federal law (PL 94-142), wherein teachers, of handicapped pupils are required to specify individualized educational programs that include proCedures for assessing ttudents' progress toward goal attainment. The purpose of tiiis study was to deterMine the effects of technically adequate, repeated curriculum-based measurement and evaluation procedures on students' reading achievement and on their knowledge concerning th'eir sown learning. Thirty-nine teachers, each having three or four students in the study, were ass.igned randomly.to measurement/evaluation groupt. Experimental group teachers employed continuous evaluation procedures 'while contrast group teachers employed conventional speCial education measurement and evaluatlon procedures. Students. were pre- and posttested On an oral Passage reading test and they were posttested on the Stanford Diagnostic Reading Test,,, Structural Analysis and Reading Comprehension subtests. Additionally, students were interviewed at the ena of the study to attest their knowledge about their own progress. Analyses revealed that experimental students achievea more than contrast group students and Were more knowledgeable about their learning. Results tuggest that technically adequate, repeated curriculum-based measurement, when used by oi teachers to evaluate and modify programs, positively affects student achievement. Rating scales, an intervieW form and training schedules, are appended. (Author/PN)
Transcript of AUTHOR Fuchs, Lynn,S.;'And Others TITLE INSTITUTION ...Fuchs, Lynn,S.;'And Others Effects of...
ED *226 045'
AUTHORTITLE
INSTITUTION
'SPONS AGENCYREPORT NOPUB DATECONTRACTNOTEAVAILABLE FROM
PUB tYPE
DOCUMENT RESUME
TM 830 080
Fuchs, Lynn,S.;'And OthersEffects of Frequent Curriculum-Based Measurement andEvaluation .on Student Achievement and Knowledge ofPerformance: An Experimental Study.Minnesota Univ., Minneapolis. Inst: for Research on*Learning' Disabes.Deparment of Eddcation, Washington, DC.IRLD-RR-96Nov 82300-80-062265p. .
Editor, IRLD, 350 Elliott Hall, 750 East River Road,University of Minneapolis, MN 55455 ($3.00)Reports - liesearch/Technical (143) --Tests/Evaluation Instruments (160)
EDRS PRICE MF01/2CO3 Plus Postage.DESCRIPTORS *Academic Achievement; *Curriculum Development;
*Disabilities; Elementary Education; *Evaluat,ionMethods; Federal Legislation; IndividualizedEducation Programs; Pretests Posttests; *ProgramDevelopment; Program 'Improvement; Rating Scales;*Self'Concept; Special Education Teachers
IDENTIFIERS *Stanford Diagnostic Reading Test
ABSTRACTIn special educationt a merger between assessment and
instruction is mandated by Federal law (PL 94-142), wherein teachers,of handicapped pupils are required to specify individualizededucational programs that include proCedures for assessing ttudents'progress toward goal attainment. The purpose of tiiis study was todeterMine the effects of technically adequate, repeatedcurriculum-based measurement and evaluation procedures on students'reading achievement and on their knowledge concerning th'eir sownlearning. Thirty-nine teachers, each having three or four students inthe study, were ass.igned randomly.to measurement/evaluation groupt.Experimental group teachers employed continuous evaluation procedures'while contrast group teachers employed conventional speCial educationmeasurement and evaluatlon procedures. Students. were pre- andposttested On an oral Passage reading test and they were posttestedon the Stanford Diagnostic Reading Test,,, Structural Analysis andReading Comprehension subtests. Additionally, students wereinterviewed at the ena of the study to attest their knowledge abouttheir own progress. Analyses revealed that experimental studentsachievea more than contrast group students and Were moreknowledgeable about their learning. Results tuggest that technicallyadequate, repeated curriculum-based measurement, when used by
oi teachers to evaluate and modify programs, positively affects studentachievement. Rating scales, an intervieW form and training schedules,are appended. (Author/PN)

lnil University of Minne ota .
Reiearch Report No. 96
.41
EFFECTS OF FRO3UENT CURRICULUMBASED MEASUREMENT AND
EVALUATION OWSTUDENT ACHIEUMEWT AND KNOWLEDGE OF PERFQRMANCE;
AN EXPERIMENTAL STUDY
p.
Ilynn S. Fuchs, Stanley L. Deno, and Phyllis tC. Mirkin
r
inStitute. foil*ReseOtch .0h,Learnipg .
SCOPE OF INTEREST NOTICE
The ERIC FseslItyhas asupn*dthus document for procsnsmpto 'TV \
In our judpem*nt, thn documentIs also of unterest to the cleanng.houses noted to the right. Index.In should net lett than spcialpoints of yew.
U.S. DEPARTMENT OF EDUCATIONNATIONAL INSTITUTE OF EDUCATION
EDUCA TIONAL RESOURCES INFORMATION
CENTER IERICI
y Pus document has been teproducedfeterved horn the herSon orstarhzahon
ohqulahng ifktnce,cornes have been made to onprove
reproduct.on oQatlywar
Ponts of .-.....o.op,mons mated .1 thrs docu
ment do hot necessary represent othciat NIE
POSIVOtt or POKY
'PERMISSION TO REPRODUCE THISMATERIAL HAS BEEN GRANTED BY
'L1.14)41-12.5t4
TO THE EDUCATIONAL RESOUR9ESINFORMATION CENTER (ERIC)"

Director: James E. Ysseldyke
- The Institute for Research- on_Le,arnidg Disabilities is supported bya contract (300-80-0622) with the'Office of Special Education,,Depart-
, went of Education, through. Title VI-G of Public Law 91-230. Instituteinvestigators are conducting research on the assessment/decision4alangfintervention procest as it relates to .ledrning disabled students ,
,
During 1980-1983, Institute research focuses on four major areas:
Referral
Identification/Classification
Intervention Punning and Progress Evaluation
Outcome Evaluatihn
Additional informatioo on the Ihstitute's research' objectives andactivities way be obtained by, writing to 'the Editor at the Inst,itute(see Publications list for address).
The research reported herein was condufted under government spon-sorship. Contractors are encouraged to express feeely their .pro-.fessional judgment in the conduct of the oroject. Points of viewor opinions stated do not, therefore, necessarily represent theofficial position of the Office of Special Education.
..-
.

Research Repoft No. 96
EFFECTS OF FREQUENT CURRICULUM7BAHD MEASUREMENT.AND
41 EVALUATION ON, STUDENT ACHTEVEMENT AND KNOWLEDGE OF PERCORMANCE:
AN EXPERIMENTAL STUDY
Lynn-S. Fuchs, Stanley L: Deno, and Phyllis K. Mirkin
- .Institute for Research on Learning,Disabilities
University, of Minnesota .1
Novembpr,, 198?
4
.4
_
A
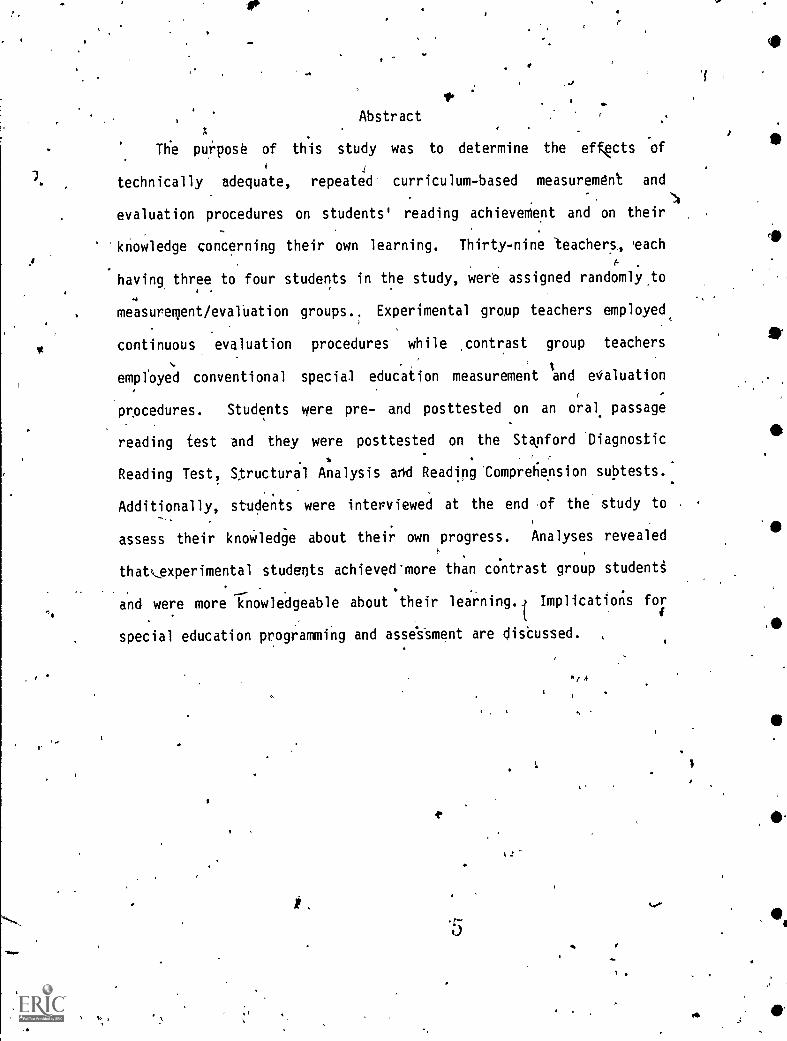
'. Th.e purpose of this study was to determine the eff,&cts 'of
4 J
technically adequate, repeated curriculum-based measurement and
evaluation procedures on students' reading achievement and on their
knowledge concerning their own learning. Thirty-nine teachers., each, 6 .
having three to four students in the study, were assigned randomly.to
Abstract
r
.4
. measurervent/evaluation groups.; Experimental group teachers employed,
* continuous evaluation procedures while contrast group teachers
emptoyed conventional special education measurement and eValuation
pnocedures. Students were pre- and posttested on an oral passage
reading test and they were posttested on the Stapford 'Diagnostic
* . .
Reading Test, Wuctural Analysis and Reading Comprenension subtests..
.
Additionally, students were interviewed at the end .0 the study to--
assess their knoWledge about their own progress. Analyses revealed
thatexperimental students achieved-more than ccintrast group studenti
and were more knowledgeable about their lea.rning.4 Implications forl',.
i
special education programming and asse's-sment are dis'cussed.
4
,
0
e
1 loo.
C7",
t..1
4. r
I
,II
II*
,
II
0.

0
0
a
S.
(
Effects of Frequent Curriculum-based MeasureMent and
Evaluation on Student Achievement and Knowle'dge of, Performance:
An Experimenta.1 Study
The learning principles of educational psychology (Crow & Crow,,
.
1963; Farnham-Diggory, 1972; Gagne, 1964) provide a theoretical
fraMework for integrating measurement and evaluation with instruCtion.
'Properly conducted assessment provides at least tWo types of data that
may be useful in enhancing achievement'. Firsti assessment can help
teachers, better structure Curriculum and teaching. 'strategies to
. .
address s.tudents' individual needs, and rates of progress. Second,
measurement and evaluation can const4tute an impOrtant source of
feedback to-a learner and can help the learner to see graded series of
accomplithments ,and to recognize strategies . for future goal
attainment. ,
In special Aucation, a merger between assessment and instruction
iS mandated by Federal law (PL 94-14,2); .wherein teachers of
'handicapped pupils Jare required to wecify Individualized Edbcational
Programs (IEPO that include Orocedures for assesging students'
progress toward goal attainment. SUbstantive cbmpliance with this law
11
dicta&s that both mea'suring and evaluating student progress be on-.
going so that the aCieqyacy,of individual iirograms Can be monitored
contiTously and improved as required (Deno & Mirkin, 1979). A small
body of research (,Beck, 1981;AHaring, Maddux, & Krug, 1972; Mirkin, .t
41,
.
Deno, Tindal.,.& Kuehnle, (1980) has begun to accumulate th'at stipport
the hypothesis that such on-gqing measurement and*evaluation may, in-.
fact, facilitate studentlevement. In the follawinsodiscussion,
the effects of frOuent testing 'and thereffects of on-going evaluation.

2
\
are reviewed separately. Then,- unified systems for integrating testing,.
and evaluation with instructi-on are discussed. Finally, the purpose
of the current study is presented.
*
Effects of Frequent Testing
Jrequent testina appears to affect student achievement. One of
the earliesCpublisHed studies on the relation between achievement and
testing was conducted by Gates (1917), who found that retention of new
information was greatest when the presentation of ech information
unit.was followed by A test. Gates'. research set the stage for a
series'of' studiess investigating this notion. These studies (Jones,
. .,1923; Keys, 1934; Noll, 1939) .tended 'to support Gates' original
findings. Eanly research on the positive relation,between student
learning and frequent testing has been corroborited by more. recent
'studies. Robin (1976) found that frequent testing accounted far _more.--
variance in student achievement than any other variable in Keller's
(1968) Personalized System of Instruction. Similarly, Omelich and
Covington (1981) demonstrated with a path analysis that frequent
testing was the factor that, contributed most to pupil learning in, the.
,
behavioral paradigm of direct, frequent aSSessMent.
Frequent testing appears to enhance not only achievement but also
'studeqt motivation. eldhusen (1964) studied Pupils who were
administered 14 weekli,quizzes that counted one-fourth of their
'class grades: At least 80% of 'these_students ,repOrted that'frequent
quizzes caused more learning,motivated them to study more than ustiali
and were effective in checking self progress.,' Of those students who
reported that quizzes caused anxiety, 87% approved of thit anxiety 4
.7 ,
0
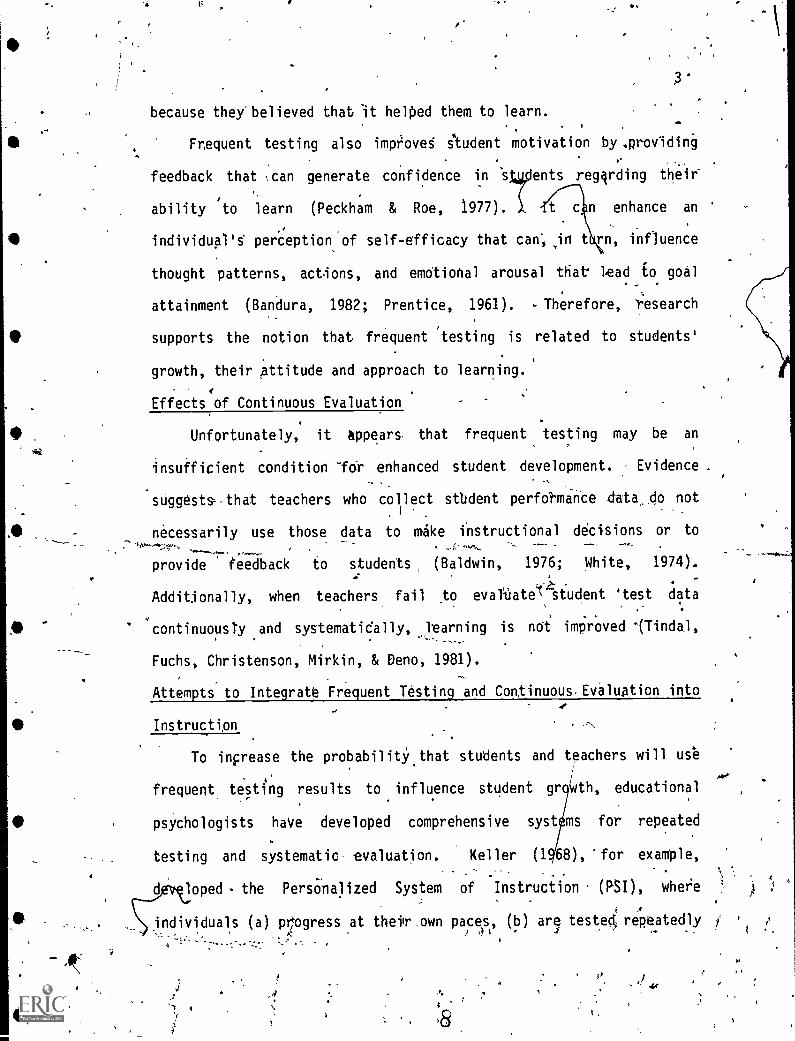
because they'believed that It helped them to learn.
Frequent testing also improveg Audent motivation by .prov1di6
/lb
feedback that can generate confidence in stIents reggrding their
ability 'to learn (Peckh.am & Roe, 1977). t c n enhance an
individual's perception of self-efficacy that can; ,in t rn, influence
thought patterns, actions, and emotional arousal that' lead io goal
attainment (Bandura, 1982; Prentice, 1961). . Therefore, T:esearch
supports the notion that frequent 'testing is related to students'
growth, their Attitude and approach to learning.
Effects of Continuous Evaluation
Unfortunately, it appears that frequent testing may be an
insufficient condition -fdr enhanced student development. Evidence
suggeststhat teachers who coltlect stbdent perf&mince data.do not
necessarily use those data to mike instructional decisions or to
provide feedback to students (Baldwin, 1976; White, 1974).
Additionally, when teachers fail to evaThate student 'test data
continuousTy and systematidally, learning is not improved '(Tindal,
Fuchs, Christenson, Mirkin, & Deno, 1981).
Attempts to Integrate Frequent Testing and Continuous EvaluAtion into
Instructipn ,,,
To increase the probabilitY.that students and teachers will use
frequent testing results to influence student gr Wth, educational,
. .
psYchologists have developed comprehensive syst ms for repeated
testing and systematic evaluation. Keller (1 68), 'for example,
dpçloped . the Personalized System of Instruction ' (PSI), where
i A
individuals (a) progress at theilr.own paces, (b) are tested; repeatedlyz =?
1.0

4
until Unit perfection is attained before being permitted to advance to
new material, and (c) ineryct primarily with proctors whd administer
tests, provide instruction, d deliver immediate feedback. ---"\
Bloom (1971), has developed the model of mastery learning, which
is based_ on Carroll'§ (1963) assumptions that learning can be broken
down into a serie's of small task's and that all students will master a
given task provided thex are given adequate time and instrliction. The
procedures for this mOdel designate that consistent feedback be
provick to students and teachers, and that instructIonal correctives
also be provided as.4required. As with Keller's PSI, frequent testing/
and f edback are intlegral'parts of this learning model.
l'7 9thr.educellonal psychologists have built upon previous work by
incorpohfing into. Keller and Bloom's basic principles the operant\
:000-
'metkiodology'of repeated behavi.or sadpling and time-series analysis.
Lovitt T107), Lindsley (1971), ,and White, and HarirA (1980) have,
. .
develop0 models k.idirect, frequent testing and eveluation where a
teabler collectsorepeated short samples of a student's behavior within
'a curricOruni,.. over a time period, and -under different teaching
strategies. Thee teacher' then abplies the methods of timelseries.
analysis to the data in order to determine the effectiabeSs of
specific program dimensions.
... , . .
UnfortunAely, alT'of th&-cOrriculunNbased testing and evaluation, .
TodOs'r'ilerenced abpve require teaChers continuously to create their
own;
testing meterials;i'liAle : i$ -known regarding 'the technical
characteristics of such self-pepared measurement and testing
procedures. As Popham (1980) illustr"ates, creating a valid, reliable,
4
4

a
4.
0
0
5
criterion-referenced,test is laborious, difficult, and fime consigning.
Addiiionally, since Variations in testing procedures have'a dramatic
bearing on the adequacy of norm-referenced standardized tests
(Sattler-, 1974), vdriations in procedures for repeatedly testing
student performance on currtculum objecti,yes also may affect the
technical adequacy of tne measurement.
Therefore, while the evelopment Of curriculum-based testing and
evaluation procedures may addr,ss the need pi, integrate measurement
and evaluation with instruction, some models may have neglected the
need for edumetrically adequate testing and evaluation instruments and
procedures. Such aPproaches to,pasurement may create unreliable and
inva)id data bases with which to,formulate educational,decisions.
In response to the need for technically adequate measurement and
4
evaluation, Mirkin,-Depo, Fuchs, Wesson, Tindal, Marston, and Kuehnle.
(4981) developed a mociel.of curriculum-based measurement and time-
seHes evaluation that includes flve decision-making steps. At.each
step, the procedures (described belowY demonstrate edumetric adequacy
and, logistical feasibility (Fuchs, Mirkin,' Deno, Marston, & Tindal,
1982). .
Step 1: Selection of the program objective. The
program objective specifies the date and the segment of tHe
curriculum on which the student will perfOrm, and thespecific level of ,proficiency. So, a student's reading .
oVective might specify: By Aune 2, when presented withAories from page 29 to. page 307 in Level 11 for one minute,George will read aloud at least 70 words correctly with 7 orfewer errors. In spelling, a student's objective might
read: By February 15, when dictated words.from Level, 9 fortwo minutes, Henry will mrite at least 10 words correctlywith no more,than 2 errors,
Step 2: Selectqon of' the measurement domain. The,
measurement domain 'is the set of material frOm which test
_to

6
",
saMples aretlrawn.. Once an objective has been established,tg measurement domain is, defined as that level in thecurricillum Are the student is expected to be proficient.Consequentl61,, given the above reading objective, the
measurement domain would be reading passages froM pages 29to 307 in Level 11.. Given the above spelling objective, themeasurement domain would be the words from Level 9.
Step -3: Selection of the measurement task and
procedure. ;The measurement task As-a randomly selectedportion of the measurement domatn. For example, using theobjectives cited-above, apassaga randomly drawn from pages29 to 307 would be the measurement task tm reading; a set ofwords randomly drawn'from Level 9 would .be the measurementtask in spelling. Each time measurement occurs the stimulus
material changes; a new sample frod.the domain is drawn
randomly: The measurement procedgre varies across academic
areas but, within a -Oven area,.'_the _ procedure is
standardized across days'. (See-Mirkin et _al., 1981, for
recommended 'procedures in, reading; spelling, 'written
expression, ,and social bekavior.) Student performance is
measured at least three times per week; measurement occursdaily if possible.
Step 4: Selection of a time-series 'data display.
Student performance data are displayed on atCgrtesian graph,with :"school days" labeled on the horizontal ,axis and
"behavior" on the vertical &xis. A data point representsthe student's performance level- -on the measurement domain
for a given day. An ex'ample of a graph is provided in
Figure 1. In this instance, the graph represents the
"Number.of Words Read Aloud from Text Passages in Lei/el 2
Per Day." Incrgases in the data points across ' the
measurement days indicate reading improveMent and progress'toward the student's objective. Each solid vertical...141e of
the graph represents the introduction of a pro§rakch'ange.07%
'
hisert_Figure 1 about here
Step 5: Selection of tlaXa evaluation Oocedures. Two
alternatives to data analysis exist, experimental and
theraPeutic analysis: In experimental analysis, program
changes are introduced ..regularly and are treated as
exPerimental hypotheses concerning their effect on a
student's performance. The methods of time-,series analysis
TSidman, 1960) are employed to summarize and interpret
student performance data. Within program phases, data-are)summarized with a split-median solution trend line ,(White,
. 11
1971)), an index of.' variability suCh -as total bounce.
(Pennypacker, Koenig, & Lindsley, 1972), and an index ofstep-up or step-down. Data interpretation is relative;effectiveness of a program phase fs evaluated by comparingdescriptive statistics across treatments. Therefore,
changes in median, level, trend, and/or variability betweenadjacent phases are inspected and interpreted to formulatedecisions about the effectimeness of a specific programchange.
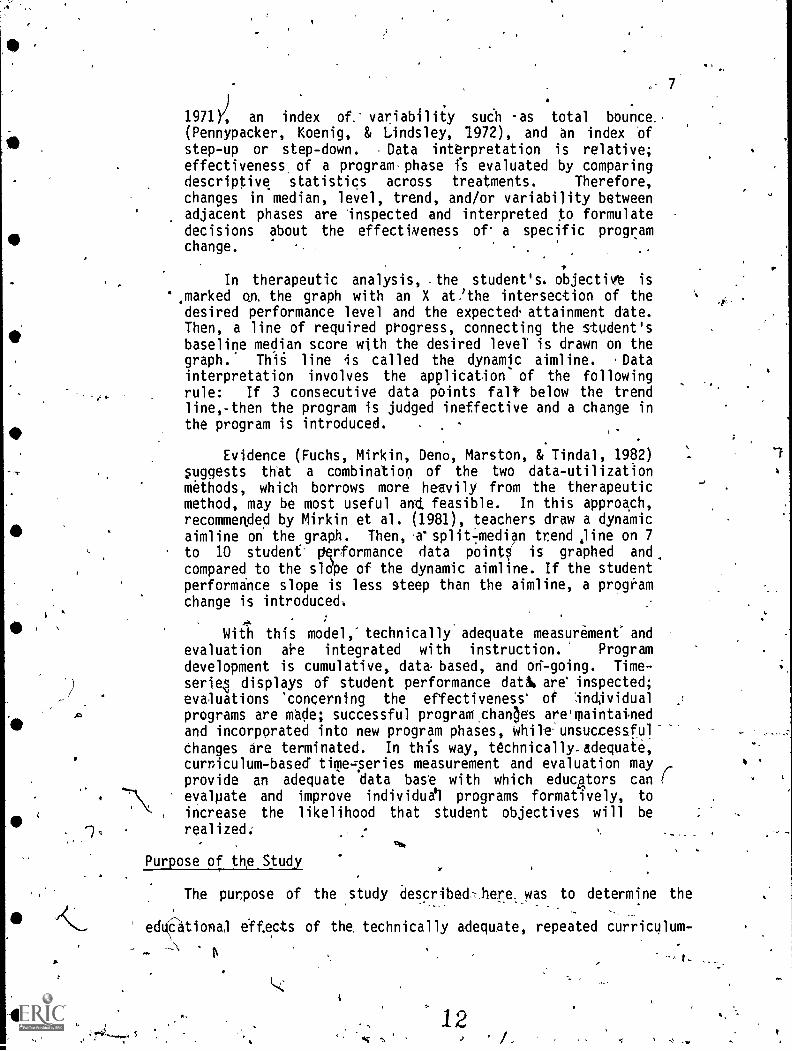
In therapeutic analysis, .the student's objectivg is
marked QM the graph with an X at 'the intersection of thedesired performance level and the expectedattainment date.Then, a line of required progress, connecting the student'sbaseline median score with the desired level' is drawn on thegraph. This line is called the dynamic aimline. .Datainterpretation involves the application of the followingrule: If 3 consecutive data points felt below the trendline,-then the program is judged ineffective and a change inthe program is introduced. -
Evidence (Fuchs, Mirkin, Deno, Marston, & Tindal, 1982)suggests that a combination of the two data-utilization
methods, which borrows more heavily from the therapeuticmethod, may be most useful arid. feasible. In this approach,recommerided by Mirkin et al. (1981), teachers draw a dynamicaimline on the graph. Then, asplit-ledian trend :line on 7to 10 student performance data points is graphed and
compared to the sldpe of the dynamic aimline. If the studentperformance slope is less steep than the aimline, a programchange is introduced:
With this model," technically adequate measurement' andevaluation are integrated with instruction. Program
development is cumulative, data based, and ori-going. Time-
serie,1 displays of student performance datk are' inspected;evaluations 'concerning the effectiveness' of Andjvidualprograms are made; successful programchaqes are'maintatnedand incorporated into new program phases, While-unsuccessful
changes are terminated. In this way, technicallyadequate,curriculum-based time.leries measurement and evaluation mayprovide an adequate data base with which educators can I'
evalpate and improve individuail programs formatively, to
increase the likelihood that student objectives will be
realized:
Purpose of the Study
The purpose of the study described here.,was to determine the
edtional e'ff.ects of the technically adequate, repeated curriculum-
-\
12v

8
, ,
based measurement and evaluation procedures developed by Mirkin'et al.
(1981): .Specifically, ir spqial 'education Programs of a large
metropolitan school district, the effects of such meatueement and
evaluation on students'.,reading' achievement and their knowledge 'about
Atheir own Tearning were explored. t
Method
Sub 'ects
Subjetts were 39 New York City publii school teachers who
'volunteered Ao participtte in the project. From their caseloads,
teachers each selected-three ,pr four students for inclusion in fhe
study; Ahen, within schools, each teacher was assigned randomly .to
either an experjmental or a contrast group. Four teachers in each
4group had pa ticipated in a pilot program.during the -previous academic
year.
.* Inore experimental group, teachers (3 'male,J
15 female) had
taught special .education for an average '3.79 *,ears (SD = 2.85).
Studentt in the experimental ,groUP
average 3.48'. years below grade' leyel (SD = 1.87). Their age .
appropriate grade ayeraged 579 (SD = 1.66); 49% were placed in
programs for emotionally handicapped stbdents, 32% in. programs for
brain-injured students,.and 19% in resource Programs:
tcntrast group teachers (2 male, 19' female) had taught
handicapped children' for an average 3.59 years (SD =,2.72). Students
in the contrast group (57 male, 20 female) read an average 2.35 years
below grade level (SD =' 1.94). 'Their 4e appropriate grade level
averaged 5.45 (SD ='1.65); 51% were placed in programs for emotionally
13
AM-

9 -:
handicapped students, ,..N 'in resource programs, and 5% equallY
distributed acros programs for brain-injuredf physically-handicapped,
and educable mentally retarded.children.
Measures
Accuracy ,of ithplementation rating, scale (AIRS. The AIRS
(Wesson, Deno,. Marukama, Skiba,, King, & Mirkin, 1982; see
1
Appendix A) was employed to measure the accuracy with which the
experimental procedures (Mirkin'et'al., 1981) were implemented. The
ftrst two items of the 13-item ratIng instrument, Administering the
Measurement Task and Selecting the Stimulus Material, are completeda
following direct observation of student-teacher interaction. The next,
,
five items, SamOling for Instructional Level, Baseline, Graphing..
Format, Aimline, and TiOng of Instructional Changes`: are completed0 ,.
after inspecting the Student gt'aph (see Appendix Bl. The Long-range '
.......
6).31, Short-term Objective, atid Meaturemerit System itemt are scored
,after inspecting thg.Goal and OfTjtic-tiv-e-Torm-,4see_AppendLYC,1_,_ The
...* . t,
......
.z.,:.........:..,
InstroctfOnal Plan, Substantial Changes, and Clear Changes scores are
,
based, on inspection'of the rnstructional Change Farm (see Appendix D).
For descriptive purposes, eight items 'were included in one, grodo' 4
called Measurement since they all 'related to :establishing and
conducting meastmement (cf. Wesson'et al., 1982).
Student interview.' 'A feur-item,intOvi& schedule was designed'
to assess students' knowledge of (a) their reading progress, (b) their
reading goals, .and (c) the likelihood that they would attain their4
Teading goals during the current academic year. The last two items
required interviewers to assess the accuracy of ,student responses
14

10' -
against graphs and records_fSee End-of-year Student Questionnaire tit
Appendix E.)
Passage reading test. A series of ttree reading pasiages from a
third grade book of the Ginn 720 reading series (Ginn & Company, 1976)\ .
Was employed in measurement. 'Two paSsages Were sampled randomly from
. -the text and one passage wes chosen to represent the readability level
of the last 25% of the text. (See' Fuchs & Deno, 1981, for the
, selection procedure.)
Stanford Diagnostic Reading Test. Two subtests, Structural
Analysis and Reading Comprehension, of the Stanford Diagnostic Reading
Test (Karlsen, Madden, & Gardner, 1976)', Green Level, Form A, were
ethployed as measures. The Structural Analysis subtest (SA) measures aL.
child's decoding skills through the analysis of word parts. The SA
asks Pupils to (a), identify the first syllable of two-syllable words,
and (b) find meaningful word parts and blend ,those parts into real
words. Internal consistency reliability for the SA, Form A, was .93
Tor grade 3 students, and .95 for grades 4 and 5 children. Criterion-
.
related validity With respect to the reading tests of the St'anford
Achievement Test ranbed from .62 to .85, with . a correlation ,
coefficient of .85 between the SA and the Total Reading Score on the
3,Stanfor.0 Reading Tests.
The Reading Comprehension subtest (RC) assesses literal and4111,
inferential comprehension through,short reading passages presented in
a Multiple choice format .and through 'short passages,followed by
_At
gbestions. The passages'represent different subject matter areas at ft
third through fifth grade readability level. Internal consistency
1 r-xj

f
tos
11
41.
reliability was reported at .96 fdr the. RC, Form A, at grades 3 .
through 5. Criterion validity with l'espect to the reading tests of.
the Stanford Achievement 'Test was reported, .with correlation
coefficients ranging from ..68 to .90.
Procedure
Pretest.. During November, students were pretested on the third
grade Ginn 720 reading passages,1 with on0 ,passage 'administered each
.. .
.-4
week during three suceessive weeks. Each Studen % was, %tested .
-
individually by one of three teacher trdjners who were skilled in the ,
II
reading passage administration procedure (see Mirkin et al., 1981).
In this reading passage test, pupils read orally for one minute; words
correct and errors per minute were scored.'
Treatments. The experimental treatment is des'eribed
Procedures to Develop and Monitor Progress on IEP Goals (Mirkin et
1981). Employing gese procedures in the aga of reading, the
experimental_group teachers first wrote curriculum-based IEP goals an
obSectives. The anrival go0 specified the segment of the curriculum
and the date on which a student would' read at a certain rate and
accuracy. The objective tontained suppldmentary information; it
'indicated the week/y"rate at which the student would improve in order
to meet the annual goal (see Goal and Objective form in ApPendix C).,
.After setting goals and objectives, teachers developed curriculum-7
based measurement systems, fo mfttch specific- goals and' objectives.
. Then, they were to measure students ,at least twice weekly and utilize
those data to;,determine when to intrbsruce program Ehanges to increase
the probabilitY thaestudents would achieve their goals. 8.3, January
t.4
d.

12,
4, all teachers had written goals' abd'objectives, and Were masuring
'and graphing student performance. By February 10, all teachers were
employing data utilization rules to determine when to make
instructional changes (cf. Mirkin et al., 1981).
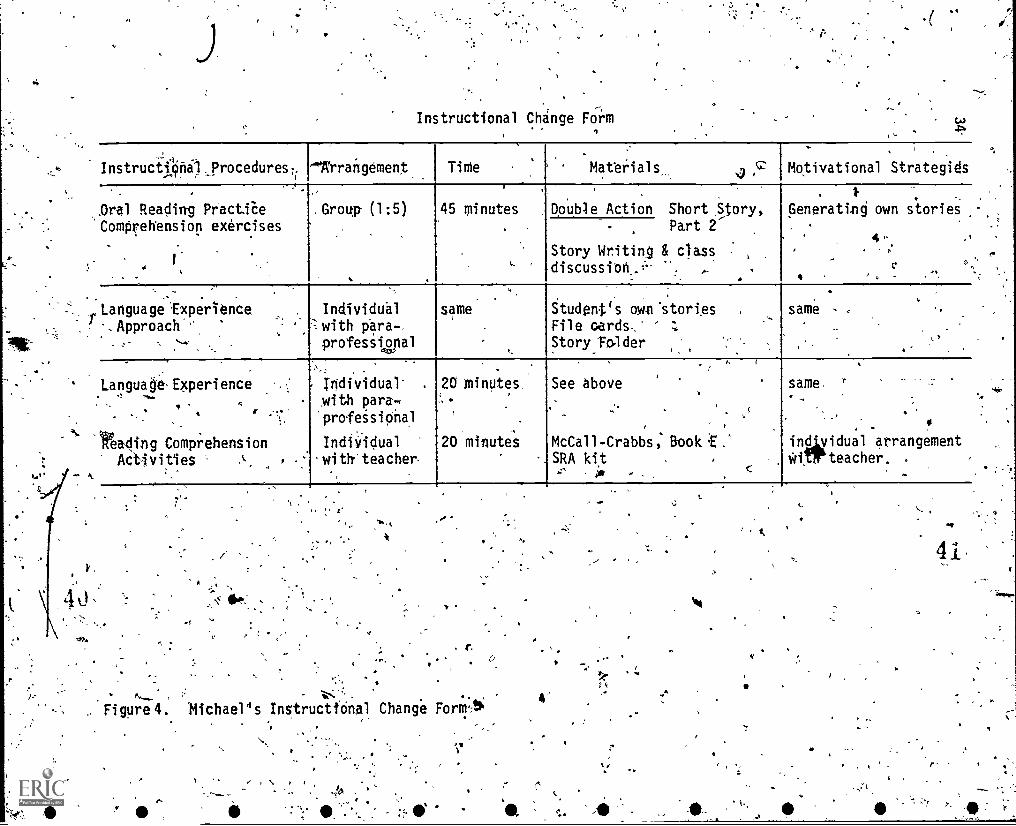
A sample Goal and Ojective Form, Graoh, and Instructional ohange*
Form for Michael appear in Figures 3; 3, and 4, respectively. The
%
Goal and Objective Form states thatl in the 19 weeks remaining in the
scIool year;.Michael mill Amprove his .reading'in Level 2 of the SRA
passages so that Ke'reads 85 v4ords cbrrectly per minute with no more1
than 8 *errors (see Figure 2). Thi's annual .goal represents4
. .
approximately a 2.5 times improvement over Michael's baseline rate of
35 words per minute (see Figure 3). This annual goal then was divided
into 19 weekly improvement rates; Michael's objeCtive.s,tates that he
will improve at an average increase of 2.6 words correct.each week
with no increase in errors.
Insert Figures 2-4.about here
Michael's graph (sge Figurg 3) represents his words read er- 4
minute each school day in Level, 2 'Of the SRA passages. The first
three'days of data depict Michael's baseline performante; the diagonalo
line connecting the baseline 'median performance with the X is the
dynamic aimlind, Which reftesents Michael's Objectiye or the d
rate at which he must perform in order to Meet the annual g
'The vortical lines oh M.ichael's graph signify the introduction of
.program changes, which are indicated,by the letters B, C and D. Each
41.
.

. e
13N'program change is det/ailed on the Instructional Change Form (see
' Figure 4). At least two.times each week. Michael read from a randomly
selected passage from Le4l 2 for one minute; the number of words he.,
read correctly and the nuMber .of errors were scored and graphed on
Figure 34. Every 7 to 10 data points, Michael's teacher inspected the. , .
.graph. If the slope calculated by the split median solution (White,
1971) of M'ichael's petformance.across the 7 to' 10 da34 As less than
the slope of the dynamic aimline, then the teacher introduced a'
'program change.. As Figur:e 3 illustrates, Michael's performance .
. .' .
. improved dramatically over his previous *performance with the .
. , 0
int.roduction of the th.it;Ji program,change. .,. .,
,. ,
.With. the . Gokl and Objective Form, the . praph, and the. .
Instructional Change Form, Michael'i educational prog and progress.
4
,
I. ..
*. toward goals were evaluated formatively. In.response to urement. .
,
data, Michael's program was modified throughoUt the treatment, to
C:f ,Amprove,the likeiihood that Michael would achieve his annUal goal.
e,,_
9, In the contras( treaementteachers meaTured and .evaluated
, ..
,4;students' 1h-ogress toward goals using conventional special ed6cation
. .1
, ,s
. , e ..,. .
. procedures; these typically includ& relatively'infrequent teachee-made.
tests and inforMal observation (Fuchs, Deno, & Mirkin, 1982; Fuchs;
FuchS, & War'ren, 1§82).
Trainihg.' Each of three teacher trainers (TTO was assigned to a
set of schools and,to the experimental and contrast teachers within,
that set of Schoo s. TTs provided training to teichers during weeklyAir\
meetings,fro November through. May. During these meetings, TTs taught-;
, the reatment procedures to the experiOntal group 'teachers. 'They
18
4
.

44+
14
taught the contrast teachers strategies for diagnosing and treating-,
learning and behavior problems, for ,structuring and managing their
instructional geoups, and for Using audio-visual equ'ipment and
paraprofessionals. ,The fTs spent similar amounts of time witlr both
groups of'teachers: Experimental group teachers received an average
23.52 hours of,indiiidual meeting time (SD = 5.9),.whereas contrastk
group teacher§ met,individually with the trainers for an average 20.60
hours (p = 6.22). A t test om thenclifference between'the hours of
training received by .the two groups revealed no statistically
,
significant difference. (See Appendix F for sample experimental andI
contrast training schedules,)
Data 'collection. TTs were taught' to measure experimental
teachers' performance on the AIRS clueing one five-hour training4
sessOn. In January, April, an0- late May, a TT observed a randomly
.
selected student for each experiMental, group teacher while the
*edocator was preparing for and measuring, the student's reading
behavior. Immediatety fo)lo4ing an observation, the trainer scored
items 1 and '2 of. the AIRS. .Then, the trainers collected the
experimental students' Goal and j)bjective Forms, Graphs, and
InstructionarChOO_Formsand gave them to JRLD stil%f who used'the
documents to score itemsn through 13 of the AIRS.
During June, studenis were tested in groups of 4 to 10 children
e-on the Stanford' DiagnostIc Readling Test, SA and RC: subtests.'
Additionally, the three third gradeteading passages were admintstered,
416 '
individua% in standard fashion (Mirkin et al., 1981) during one'
session. All testing was conducted by thTTs. In June, a subsample '
,,,
1
15
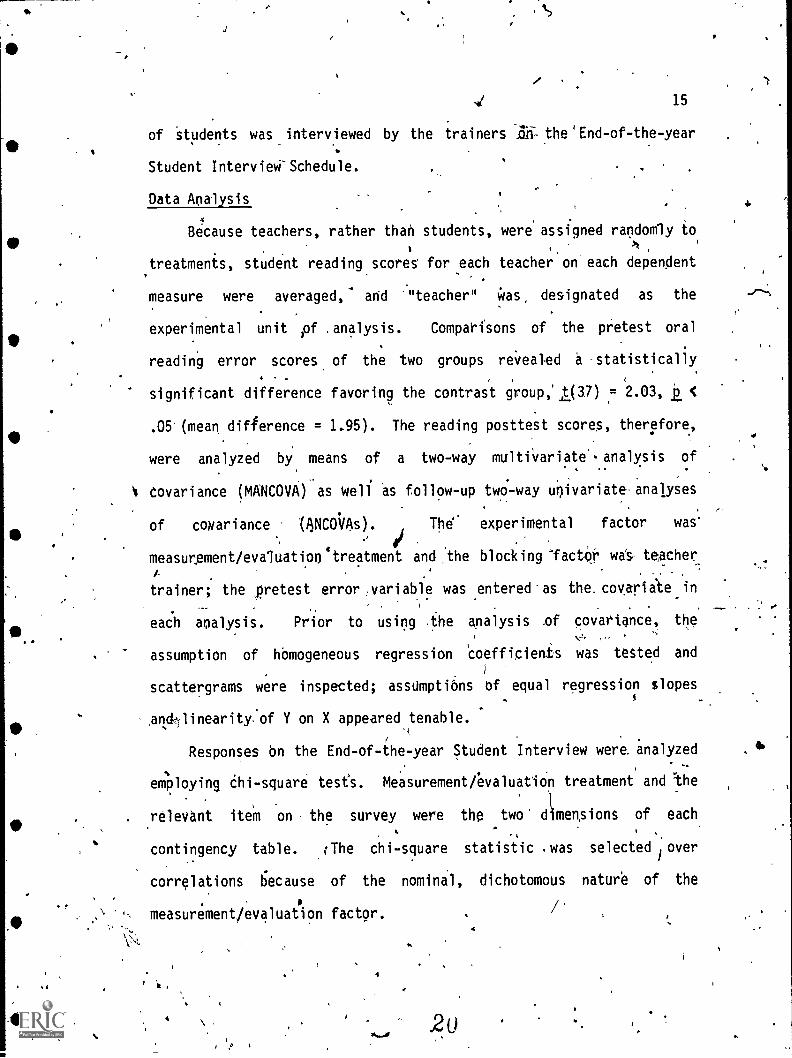
of Students was interviewed by the trainers Tail the'End-of-the-year
Student IntervieW-Schedule.
Data Analysis
Because teachers, rather than students, were' assigned randomly to
treatments, student reading scores for each teacher on each dependent
measure were averaged," and "teacher" Was, designated as the
experimental unit pf ,analysis. Comparfsons of the pretest oral
reading error scores of the two groups reVealed a -statistically
significant difference favoring the contrast group,' .,t.(37) 7 2.03, <
.05 (mean difference = 1.95). The reading posttest scores, therefore,
were analyzed by means of a two-way multiVariate'. analysis of
11 covariance (MANCOVA).as well as follow-up twci-way univariate analyses
of comariance (8NC0VAs). Thd' experimental factor was'of
measurement/evaluation'treatment and 'the blocking lac* was, teacher1-
trainer; the ,,pretest error,variable was entered-as the*covaria*te in
each analysis. Prior to using .the Analysis .of covariance, the
assumption of homogeneous regression Coefficienis was tested and
scattergrams were inspected; assumptiOns of equal regression slopes4
arldOinearity of Y on X appeared tenable.
Responses On the End-of-ihe-year Student Interview wera analyzed
employing Chi-square test's. Measurement/evaluation treatment and 'the
relevant item on the survey were the two d\mensions of each
contingency table. (The chi-square statistic . was selected lover
correlations 6ecause of the nominal, dichotomous natur'e of the
measurement/evaluation factor.
4
4
/

16
. Results
The analysis of ,the results Adressed three questions. First, to
what degree did the teachers implement the measurement and evaluation
system? Second, did the students of the experimental 'and contrast
, teacher's liffde in" their* reading achip,vement? Finally, did' the
students of the experimental and contrast teachers differ with respect
to their knowledge.of their reading goals and progreSs?
System Implementation'
There were three indices of the.extent to whtch, and the accuracy..
with, (which, the, experimental:teachers 'Actually- implemented the. . .
. ,
. , . " .
measurement% and evaluation system: the AIRS,: the weekl number of,
data.points on students' graphs, and the number of chang s teachers
=. introduced into their-students! programs. A
"04
, rY"
Table 1.displays means and standar# deviatidas.,for_ the th ee datae _
' ^4440
collection times on the 13 items of the'AIRS, theMeasurement.g p -Of
items, and the average across the Measurement grdu0 and the other fiveI
items (the:: Overall total), For the odi'all total, ratings of.the.
teachers On the 5-pdint scale"were 3.32, 3.66,,and 3.85, respectively,
for the three data collection times.
Insert Table about here
. . Teachers measured students' 'reading performinCe an average 2.14 1,4
Ovies per week (SD = .44) during the first six weeks of the treatment.
They measured students' reading performance an average 1.87 tiMes'per
'
week (SD = .40) during the secohd six weeks, and an average 1;37 times4 s
2.1
.
cat
17
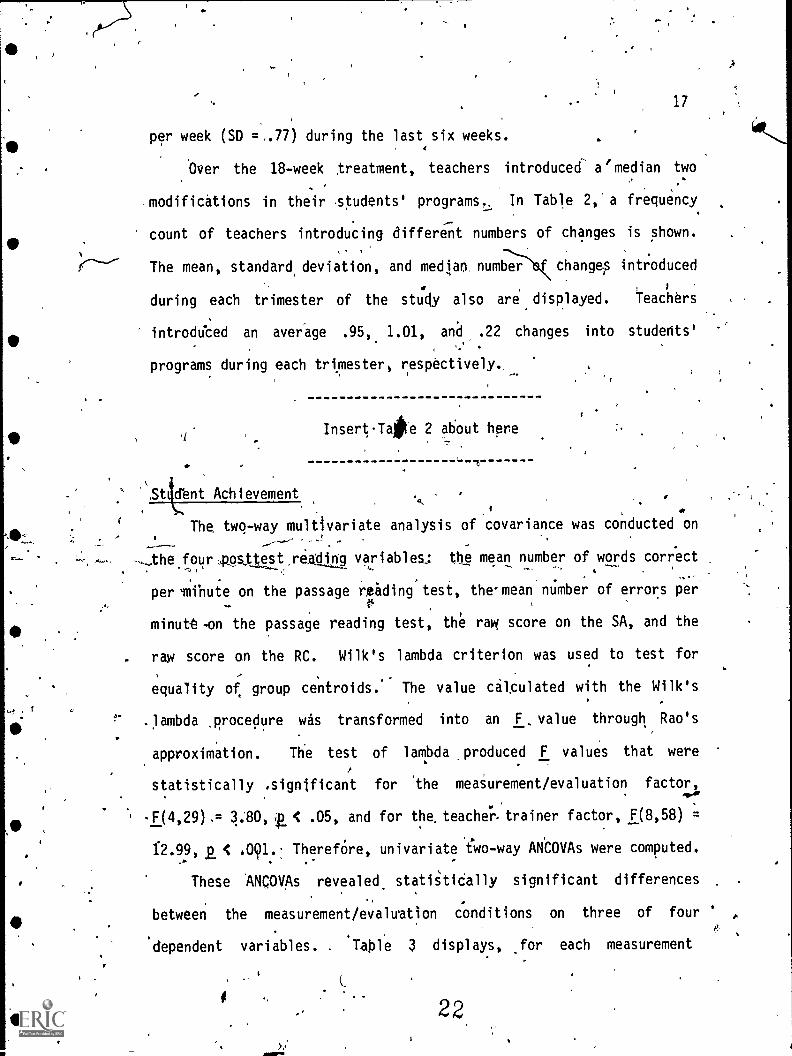
per week (S0 =,.77) during the last six weeks.
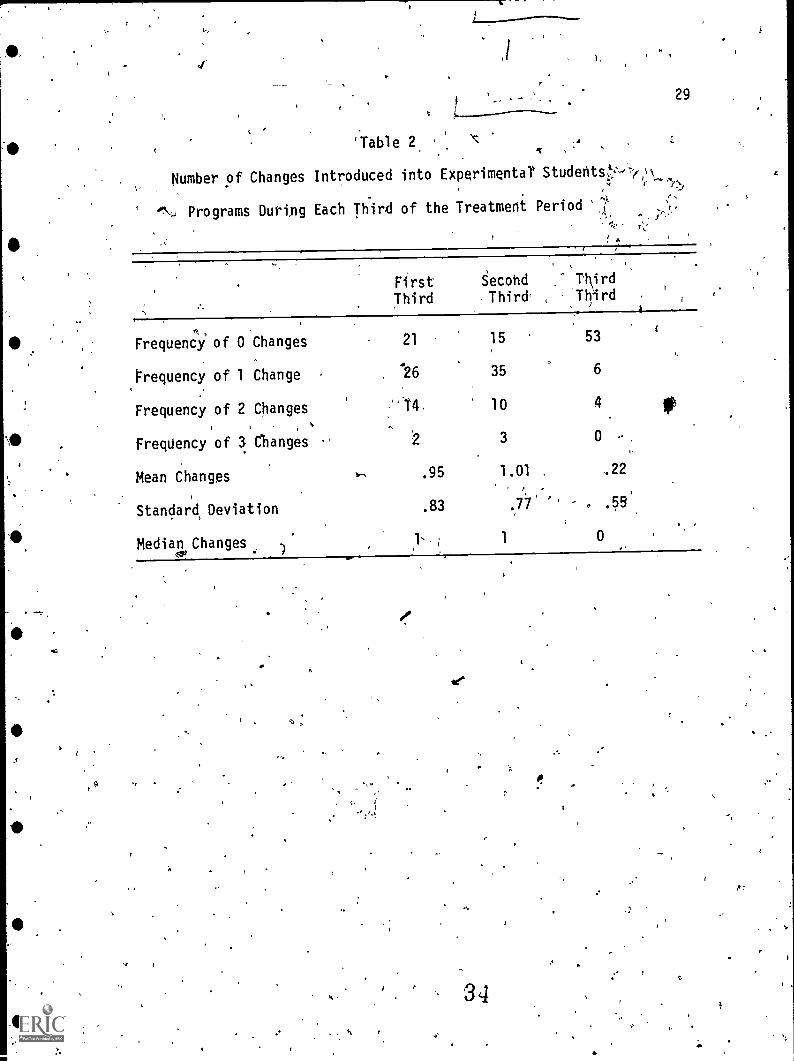
bver the 18-week treatment, teachers introduced- almedian two
, modifications in their students' programs, In Table 2, a frequency
count of teachers introducing different numbers of changes is shown.
The mean, standard.deviation, and median number change,s intr:oduced
,
during each trimester of the stjdy also are. displayed. Teachers
introddced an aver:age .95,. 1.01, and. .22 changes into students'
programs during each trimesters respectively.
Insert .Taile atiout here
Stid:ent Achievement
The two-way multivariate analysis of covariance was conducted on
---- .
,... the four gosttest re460 variables; the mean number of words correct,
per nihute on the passage reading test, the-mean number of errors per
minute-on the passage reading test, the rav( score on the SA, and the
raw score on the RC. Wilk's lambda criterion was used to test for
equality of group centroids..- The value cálgulated with the Wilk's
.lambda .brocedure was transformed into an F. value through Rao's
approximation. The test of lambda produced F values that were
statistically 'significant for 'the meaSurement/evaluation factor,
-F(4,29),= 3...80,111 .05, and for theteachir:trainer factor, F(8,58) =
f2.99, .001.. TherefOre, univariate 'fwo-way ANCOVAs were computed.
These ANCOVAs revealed, statiitically significant differences
between the measurement/evalwation conditions on three of four.1
dependent variables. . Table 3 displays, .for each measurement
22
e.

18
evaluation group -an& for eachOiepeOent variAl;e, the mean, the
standard deviatiOn, the mean 'adjus'ted for the independent and,
covariate, and the F and 21.-valuet.
Insert Table 3 about'here
The univariate ANCOVAs included teacher trainer as a 'second,
. .
...j0oclOng fac,tor to increase the statistical 'power of the analysis
rather than to explore an interestin§, related reSeardi question.
I. 4,
Therefdre, although Were were statistically si6nificant,differences
between teacher trainer group% on two of four variables, those results,--
are not presented further or discussed. .The absence of any
statistically' sAgnificant interaction between,.the measurement
evaluation and teacher 'trainer factbrs renders any dditional
discustion f the teacher trainer conditions extraneous, to the, :----
purposes-of t is paper.
Students' KnoWledge about their Learning
A final set of analyses was conducted to ascertairt differences
between experimental and contrast conditions with respect to student
knowledge'of their own gdals and Progress. Figure 5. is-a display of
the percehtages of experimental and, contrast group student resporises,
when they .were asked during the End-of-the-yeae' Student interview,
"What kind of progress have you made in reading this year?" As one
can see., the.Ntrend of respqnses, for each group was similar. 'A chi-
square analysis, on the proportional,responding' of experimental 'and
contrast groups to, this queticin revealed no s-OnifIcant difference. -
I
23 "40
19
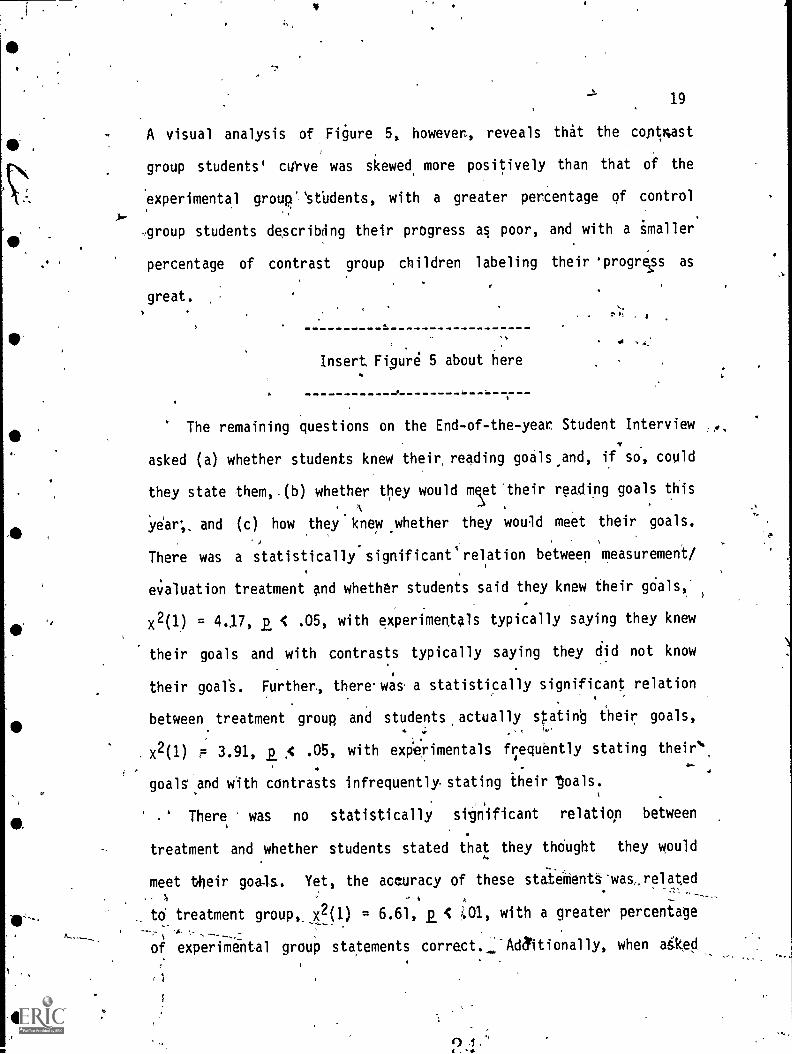
A visual analysis of F-6ure 5, howeven, reveals that the coptnast
group students' curve was skewed, more positively than that of the
experimental group"stUdents, with a greater percentage of control
,group students describang their progress al poor, and with a imaller
percentage of contrast group children labeling their 'progrep as
great.
Insert Figure 5 about here
The remaining questions on the End-of-the-year Student Interview
asked (a) whether students knew their, reading goils.and, if so, could
they state them,.(b) whether they would mTt their reading goals thisk
'year,. and (c) how they knew whether they would meet their goals.
There was a statistically significant relation between measurement/
evaluation treatment ond whether students said they knew their gOals
x2(1) = 4.17, IL < .05, with experimentals typically saying they knew
their goals and with contrasts typically saying they did not know
their goal's. Further, there-was a statistically significant relation,
between treatment group and students,actually statinb their goals,
x2(1) 3.91, .05, with experimentals frequently stating their`,
goals .and with contrasts infrequentlystating their "goals:
meet their goals. Yet, the accuracy of these staleentS-was,related
treatment and whether students stated that they thought they would
There was no statistically sig nnificant relatio
-
to' treatment group x2(1) = 6.61, 11 .0 401, with a greater percentage
of experim6tal groub statements correct.:AOtionally, when aMted

4P,20
how they knew whether they would meet their goals, experimental
..studentS tended to say that they relied on their graphed data whereas
contrast students tended to say that they "just thought so,'1 x2(1) ..
9.47,, 2. < .005.
Discussion
The purpose of* this study- wo to determine the* educatiOnal
effects of technically adequate, repeated curriculum-based measurement
and 'evaluation' procedures. Using these procedures, the experimental
teachers were (a) to measure, and graph studentS' proficiency in
reading aloud from text passages at :least twice weekly, and (b) to
compare, at frequent intervals, the students' actual increases in
proficiency with increments required to achieve the level Of
'proficiency.specified in the IEP goal. When *students' actual progress
trends compared unfavorably with their required increases, teachers
were to introddce a new dimension into the students' programs in an
attempt to stimulate better student'progress. aomparison teachers
employed typical special education measurement and.' evaluation
proceduees.
%
The findings indicated that experimental teacher§ implemented
their treatment, moderately well for most of the treatment period.'
Although teachers conformed to the prescribed measurement Schedule
'
fairly well during 'the first 12 weeks of the stu6, their rate of
. measuring fell during ,the last six weeks of the treatment.
Analogously, the mean number of changes introduced by teachers into
students' programs dropped sharply during the last trimestei- of the
study. These findihgs corroborated prior research (Tindal 'et al.,
2-5

J.
21
1981), whicfi'suggested that teachers tend to measure students less
frequently and evaluate ddta less' 'responsively than prescribed.
Neverthe/ess, the eZtent of. teachers' implementatiOn was adequate
during most of this study, and their accuracy in implementing
experimental procedures remained fairly stable across the entireof
treatment period.
The results indicate that implementation of the frequent, direct
measurement and evaluation procedures affected positively, bothistUtent
achievement and student awareness of their own achievement. Students
of experimental teachers performed better than students of comparison
teachers on virtually all achievement measures, rate and accuraCy. in
reading aloud from text ,maferials, and the SfruOural Analysis and
Reading ComPrehension subtesis ofthe Stanford Diagnostic Reading
test. It is worth noting that while the former measure (reading aloud
from text) was used throughout the study, the 'latter two were not
ditectly measured by the teachers' as part of the evaluation system.. :
The findings suggest that when teachers repeatedly,employ the simple
one-minute test of reading aloud from text passages,to index student
progress, they can interpret student gains, is representing general '
reading achievement; that is, the data` apparently validly reflect
fluency, decoding, and comprehension. the only measure on which
experimental and contrast group performance was undifferentiated wis
'error: scores on the third grade oral reading passages. This may be
.
explained by the poor reliability of such error scores (Deno, Mirkin,. .
; -
Chiang, & Lowry, 1980; Fuchs & Deno, 1981; Fuchs, Deno', & Marston,
1982). Consequently, the results of this stt;Y\fsudgest that
4f,

22
technically adequate, repeated curriculum-based measurement, when used
by teachers to eyaluate and modify programs, positively affects
student achievement.
In addition to achieving better, the students in this study were
',more Inowledgeable abOut their own learning when their teachers Used
systeMatic meallIrement and evalOation procedures. As compared to
pupils whose progress was measured .and evaluated via conventional
, special education practice, students mho were measured and evaluated
repeatedly,and systematically in' their curricula'(a) more ftequently
said -fhey knew their goals, (b) more often actually stated their-
(c) were.more accurate in their estimates of whether they would
meet their goals, and (d), more typically reoorted that they relied on
data to..formulate estimates of'whetner they would meet their goals.
=The results revealed,that repeatea, direct systematic measurement and
evaluation enhances not only students' reading achieveMent,, but also
their knowledge concerning their own learning. These outcomes are'
theoretically and socially important. 06 the one.hand, they support .
the hypothesis of many edlationalspsychologists (Bandup, 1982; Crow
& Crow, 1963; Farnham-Diggory,'.197?; Prentice, 1961), thai'students!
.knowledge of their learning may improve academic Oerformance. 06 the
other hand, increased participation by .sfudents, in their own,
education, itself, is often regasrded,as an important educational goal.
This study ,generally provides support for incteased,use of,
systematic, on-going,measurement and'evaluation of Student prógress'by
teachers ,It provides 'eOden.de that *.individual stpecial edgCation
programs can be monitored continuously and improvecOas requited fo
. .
#/
001,
.,
27

23
increase the likelihood of student Rains. The findings of this
research contradict the conventional argument that tea0ers do not
need to use frequent measurement and evaluation because (a) they ane
already sufficiently aware of '..ttudent Achievement; and .(b). such
procedures are inefficient. Teachers'who used frRquent measurement
and systematic evaluation were more effective in enhancing student
growth And student awareness of their educational.programs.
7
4
ftc
0 v. - 41, 0
28V.

24
References
Baldwin, V. Curriculum concerns. In M. A. Thomas (Ed.), Hey, don'tforget about me. Reston, VA: Council for Exceptional Children,1976.,
Bandura, A. Self-efficacy mechanism in hilman agency. AmericanPsychologfst, 1982, 37(2), 122-147.
' Beck, R. Curriculum management through a data base. Great Falls,MT: Great Falls Public Schools, 1981.
Bloom, B. S. Mastery learning. In J. H. Block (Ed.), Masterylearning: Theory and practice. New York: Holt, Rinehart, &Winston, 1971.
Carroll, J. B. A modelrof school learnibg. ,Teithers tollege Record, ,
1963, 64, 723-733.
Crow, L. D., & Crbw, A. Readings in human learning. New York:David McKay, 1963.
Deno, S. L., & Mirkin, P, K Data-based IEP development: An approachto substantive compliance (Monograph No. ).31. Minneapolis:
' University of Minnesota, Institute,for Reiearch on LearningDisabilities, 1979.- (ERIC Document,Reproduction,Service No.ED 185 770)
Deno, S. L., Mirkin, P. K., Chia* B., & Lowry,1 1 Relationshipsamong simple measures of reading and performance onqandardiled achievement tests (Research Report No. 20).Minneapolis: University of Minnesota, Institute for Research
'on Learning Ditabilities, 1980. (WC Document-Reproduction, Service No. ED 197 507) /
Farnham-Diggory, S. CognitiOe processes in education: Apsychological preparation for:teaching and curriculumdevelopment. New York: ,Harpér:.& Row, 1972.
Feldhusen, J. F. Student perceptions of frequent quizzes and''post-mortem discussion of tests, Journal of EducationalMeasurement, 1964, 1, 51-54.
Fuchs; L. S., & Deno, S. L. The relationship between curriculpm-bated mastery measures and standardiZed achievementtests inreading (ResearchlReport No. 57). Minneapolis: University ofMtnnesota, InstitUte for Research on Learning Disabilities,-1981. (ERIC Document Reproduction Service No. ED 212 662)
.
29
41'

25
Fuchs, L. S., & Deno, S. L., & Marston, D. Use of aggregation toimprove the reliability of simple direct measures of academicperformance (Research Report No. 94). Minneapolis: Universityof Minnesota, Institute for Research on Learning Disabilities,1982.
Fuchs, L. S., Deno, S. L., & Mirkin, P. K. The effect of continuousevaluation procedures on special education teacher dedisionmaking,(Research Report No.. 97). Minneapolis: University ofMinnesota, Institute for Research on Learning Disabilities, 1982.
Fuchs, L. S., Fuchs, D., & Warren, L. M. Special education practitein evaluating student progress toward goals (Research Report No.81). Minneapolis: University of Minnesota, Institute forResearch on Learning Disabilities, 1982...
Fuchs, L. S., Mirkin, P. K., Deno, S. L., Marston, D.,41 Tindal, G.Considerations for designing a continuous evaluation system: An
integrative review (MOnograph, in preparation),. Minneapolis:.University of Minnesota, Institute for Research on Learning.Disabilities, 1982.
Gagne, R. M. Thejmplications of instructional objectOes for. learning. . Ih C. M. Lindvall (Ed.),. Defining educational
objectives. Pittsburgh: University of Pittsbut:gh, 1964.
Gates,,A. Recitation as a factor in memorizing. Archives of "
Psychology, 1917, 40, 1-104.
dinn and Company. Reading 720. Lexington, MA: Ginn (Xerox Corp.),1976,
Haring, N., Maddux, L., &Krug, D. A. Investi ation of s stematicfnstrOctional Orocédures to facilitate academic achievementin mentally 'retarded disadvantaged children (Final Report).Seattle: University of Washington, Experimental,Ed ation Unit;1972.
/.:
Jones, H. E. Experimental studies of college teaching. ArChives ofPsychology, 1923,-68, 5-70.
Karlsen, B., Madden, R., & Gardner, E. F. Stanford diagnosticreadinttest. 'New-York: Harcourt Brace Jovanovich, 1976.
Keller, F. S: .Goodbyejteacher.... Journal of Behavior Analysis,/ 19680 179-89.
Keys, N. The influence on learning al retention of mon tests...
Journal of Educational ?sychology, 1934, 25, 427-436.

26
Lindsley, O. R. Precision teaching in,perspective: An interview with ,
Ogden R. Lindsley. Teachilip Exceptional Children, 1971, 3(3),114-119.
Lovitt, T. In spite.of my resistance, I've learned from childColumbus, OH: Char:les'E. Merrill, 1977.
Mirkin, P. K., Deno, S. 4. Fuchs, L. S'WeSspn, C.Tindal, G.,Marston, D., & Kuehnle, K. Procedures to develop and monitor*progress toward IEP goals. Minneapolis: University of
1
Minnesota,'Institute for Research on Learning Disabilities,1981.
Mirkin, P. K., Deno, S. L., Tindal, G., & Kuehnle, K. -Formativeevaluation: Continued development of data iitilization systems(Research Report No. 23). Minneapolis: University ofMinnesotau; Institute for Research on Learning pisabiTities,1980. (ERIC Document Reproduction Service No. ED 10510)
4-
Noll, V. H. The effect of written tests upon achievement in collegeclasses: An experiment and a summary of evidence. .Journal of
, Educational Research, 1939, 32, 351-357.
Omelich, C. L., & Covington, M. V. Why behavioral instructionworks? A components analysis of performance and motivatRonaloutcomes. Paper presented at the meeting of the AmericanEducational Research Association, Lis Angeles, April,1981.
Peckham, P. D., & Roe, M. D. Theeffects of frequent testing.* Journal of Research and Development in Education,'1977, 10(3),
40-50.
. Pennypacker, H. S., Koenig, C. H., & Lindsley, O. R. ,Handbook of thestandard behavior chart (prelim. ed.). Kansas City, KS:Precision Media, 1972.
PophaM, W. J. Domain specification strategies. n R. A. Beck (Ed.),Criterion-referenced measurement: The state of the art;Baltimore: 'Johns Hopkins University Press', 1980.
Prentice, W. Ce H. Some cognitive aspects of motivatton. American.Psychologist, 1961, 16, 503-511.
Robin, A. L. Behavioral instruction in the college classroom. ReviewOf Educational Research, 1976, 46, 313-354.
Sattler, J. M. Assessment of children's intelligence. POLiladelphia:W. B. Saunders, 1974..
Sidman, M. Scientific research: Evaluating experimental data inpsychology. New York: Basic Books 1960.:
3.
qt.

27
Tindal, G., 1uchs, L. S., Christenson, S., Mirkin, POK., tit
The relationship between student aChievement andteacher assessment of short- or long-term goals (Rekarch Report
- No. 611. Minneapolis: University of Minnesota, Institute forResearch on Learninlg Disabilities, 1981.
sr
Wesson, C., Deno, S., Maruyamai G. Sevcik; B., Skiba, R.,1 King, R., &Mirk-in,). The relationOips among implementation,of an on-goingevaluation system, structure of instructional programs, andachievement (Research Report, in preparation). Minneapolis:
, University of Minnesota, Institute for Research on LearningDisabilities, 1982.
White; 0. R. A pragmatic approach to the description of progress inthe single case. Unpublished doctoral dissertatioq, Universityof Oregon; 1971.
White, 0; R. Evaluating education process (Working-paper). Seattle:University of Washington, Child Development and MentalRetardation Center, aperimental Education Unitv 1974.
. White, O. R., & Haring, N. G. Exceptional teaching (2ndted.,).?z, Co1umbusr0H: Charles E. Merrill, 1980.
r
,
,

1
1
28- ,
TOle V
-Means vid Standard Deviations on th'e Accuracy of Implementation
Rafing :Scale (AIRS) During Three Data Collection Timesa
Items
Time 1 Time,2 Time 3
SD SD
'Administration of Task.4.78 .43 4..83 1 .38 4.78 .64
Sampling Instructional Level 3.11 1.32 3.28 1.41 3.28 1.41.'
((taking Baseline 1.56 1 .20': 3.50 1.15 3.50 1.15
Graphing 4.28 .57 4.17 '.51 ( 4.17 .51
Drawing Aimline ,4 , 4.44 1.291 4.44 1,29 4.44 1.29
Writing Gpal 4.94 .24 4.94 . ,.24 4.94 4.247.
Writihg Objective ''. 4.78 .94 4.78 . .94 4.78 .94
Describing Measurement System 5.q0 .00 5.00 .00 4.89 .47
Measure ntb 4.36 .39 4.36 .38 4.28 .33
Writin Instructional Plan 2.11 1.32 2.67 1.28 2.64 1.36
(N=11),
Creating Substantial.Changes 3.31 .75 3.94 .85 3.00 2.82
(N=13) (N=16) . (N=2)441
. ...
Describin.g Clear Changes 2.77 1.17 2.88 1.20 5.00. .00
(N=13) (N=16). (N=2)
Tiniing Instructional Changes 2.61 1.58 3.83 .92 3.35 1.69, (N=17)
Selecting'Stimulus Mpterial 4.61 .70 / 4.91 .24 4.89 .64.
Overall Totalc .
3.32 .62' . 3.66 .52 3.-85 .68
aN=1§ teachers, except as indicatea in parentheies.
bThe measurement group combined eight items related to establishing.tbemeasurement system and conducting measurement. . ,f
cThe overall total was based upon the addition of the measurement '..group
and each of the remaining five items.
33
,/
29
'Table 2.
Number of Changes Introduced into Experimental Studehts ,
r
."'°\J Programs During Each Third of the Treatment Period '1
First Secohd TirdThird Third' Third ,
t
Frequency,
of 0 Changes 21 15 53
Prequency of 1 Change . 426 35 6
Frequency of 2 Changes .:'14, 10 4
,
Frequency of 3 Changes .' 2 3 0
Mean Changes ,-, .95 1.01 ..22
,,
Standard, Deviation .83 .77 , .W.
Median Changes 1 0
op :,
k . 34

Table.3 .
,
'Means, Standard,Deviations, Adjusted Means, and ANCOVA Results on Four nependent Variables
\Measurement/Evaluation Treatment
4 i
Experimental Contrast
SD,
Words correct 70.23 45.75.
-o,per minute, ..
,Errors per4 5.63 2.08 ', ,
minute'
SA 39.79 12.28
RC 43.95 10.52''
Adjusted 7 I78.91 51%29
5.21 5.64
40.74 29.65
45.37 33.02,
SD
38,18, t'
. 2,75
15.34
15c39
Adjusted 7 F(1,32) a
,t
4381 4.221 .048
'5.99 .001 .1k2
28.84 7.1.94 .011,
31,81 4.222 .048
I
3

Correct
'So
40
30
20
10
IA; }..gi 1.18 t-1,6 2.1 2.8 246 t-I2. 34 3-8 545 3-1.4 3-29 4-5 4-1/ 4-n 4,24, 5-3School Rays
t
Figur0. Exampla of a graph o# studAf'performance data.
36

32 ,
-4, )
GOAL. In 19 weeks. , when provided with
.7. # school weeks until year's, end
stories from grade level 2 - SRA passages , Michael ,
(Level #, series) (student's name),
will read aloud at the rate of 85 , with no more
(wpm covii-ect)
than 8 errors.
(#)
OBJECTIVE Each sutcessive week, when presented with a randowselection
from Grade level 2 - SRA passages , the student will reacj
(same level # and series as above)
aloud at an'average increae of 2.6 wpm and no increase
errors.
;
rigure,2. Michael's .Go6l and-.Objective Form
0-

ce0
CORRECT
o ERRORS
38
100-
44,
50 -
,
3 4
MONTHS
,
Figure 3. Number of Correct Words. (s) and Errors (o) POr Minute Read.;by Michael from Pages
in SRA, Level 2 Across Time, Under Baseline (A) and Three Instructional Strategtes
(B, C, and D). 39
(43(43
Instructional Change Form
( 4
InstructIonal Proceduresri elVrrangement Time Materials.
Tv),
,
Motivational Strategids
Oral Reading PractiCeComprehension exercises
.
.1
-
Group (1:5)
. ,
45 minutes Double Action Short Story,
-
.
Generating own stories
. 4-. . ,
'.
4 -
Part 2'
Story Writing c1ass.
discussiOn.,--
Language Experience-.Approach '
. . ,
,
Individual
'-with para-
professiopal
.
same Studen's ma-storiesFile oards. 1
Story Folder
,
f.same
.
LanguageExperience
4 .,
&ding ComprehensionACtivities
.
, Individual" .
with para-
professiOnal
Individual
-with. teacher
20 minutes,.
20 minutes
.
,
,
See above
.
McCall-Crabbs, Book E.SRA kit
.
.
same r.,
., .
.
,, -
indiyidual arrangement
WITteacher, .
7.-
..
m-e.
.
-
Figure4.. Michael's ,Instructianal Change Form-,
-4*
1.
4i

Sr
40
19,
t,
l
20
10
,
. Experimental ,
Contrast.
I t.' / t
t / 1 %
I 1
'1/ t
t / 1
t I ,1
I tt I
I, ttt 1
.
1
'6'
t% I .1 t
- t / t, /
1 1/. 4 t/ t
1 / t/ I/ t
H--L----f-------2(:--f÷ta-IPoor 'Not so Pretty Good Great
good Good
ltudent Descriptions
Figure 5. Percentage of Student Descxiptions of Progress During'
the Current Academic Year.
42

Appendix A.
Accuracy of Implementation Rating ,Scale, .
School: i Student:
Date: Teacher:
Observer (Items 1 and 2):
.Rater (Items 3-13):
.Number of observations prior to rating:
I
Time observation. begins : Time observation ends:
Time allocated to-reading instruction per day:
-Curriculumi used for measurement: Publisher
. Series Level
Instruetions
Circle the number that,accurately reflects your rating for eachvariable. Only one number may be circled per variable. 1 reflects alow level of implementation and 5 means total implementation of theProcedures to Develop and Monitor Progress on IEP Goals. See Operation-
'al Definitions. Items 1 and 2 require 'direct observation of the measure-
ment administration. Items -3, 4, 5, 6, and 7 require insp-ection- ot the:
student graph. Items 6, 91_ and 10 require inspection of the student's
IEP form. The Instructional-Tlan must be inspected to rate item 11.The Change Record must be inspected to rate items 12 and 13.
,1. Administering the Measurement 'Task
tifa s .2. Selecting the Stimulus Material
3. Sampling for, Instructional Level
4 . Basel i
5.:Tria ph-Set-up.
6 . Aiiril i ne
7. Timing of Instetictional Changes
. Long-Range Goal
. Shori- Term Objecti ve
Measurement System
CInstructional Planc c
Cloi '12. Substantial ChangesC t,
g4 1 3 One, Clear ChantU
-1
1
1
2
2
.2
3
3
3
4 5
4 5
4 5
,2 3 4 51 2 3 4
2 , 3 . 4. 5
'1 2_ 3 4 5
1 2 3 .4 5
1 2 3 4 5
1 2 3 4 '5
1 2 3' 4 5
1 2 3 4 . 5
1 2 3 4 5
4 3

A-2
AIRS
Operational Definitions.
' Accuracy of Implementation Rating Scale
1. Administering the Measurement Task
5 - The measurement task is administered correctly: teacherbrings stopwatch and pencil to measurement area; givescorrect direqii-ons for the task; administers the measure-ment proadrife for one minute; correctlY marks the teachercopy; correctly,counts words correct and incorrect; cor-rectly counts words correct and incorrect; correctlyplots the data point.
1 - the teacher: forgets necessary materials; does not give. directions; does not time the task,accurately; fails to
mark the teacher copy or incorrectly marks errors; miscountscorrect and incorrect words; and inaccurately plots the datapoint.
2. Selecting the Stimulus Material
5 - The teacher has followed these procedures: Uses passages_selected from the Ievel,tbat repeesents the annual goal.Observers should record the book.from _which the passagewas selected and later checic this with the long-range goallevel. 'At this level find the pages in these stories that ;
do not have eRcessixe,dialogue, indentations, and/or unusualpronouns. Write these page numbers on equal size slips ofTapir.
- Put the slips of paper into a drawbag and shake it.
- Randomly pick a slid of paper.
- The page number chosen is the page where the student- begins reading. If tbe page chosen is'a passage thai'
was read earlier during the week, Araw another pagenumber.
Other completely random procedures are also rated a 5. If,
however, not all passages have an equal chance of beingselected, a 4.rating would be indicated.
1 - The teacher fails to randomly pick the passage or the sample istaken from a domainrwhich is greater or smaller than the oneindicated in the goal.
Sampling for Instructional Level
5 - The teacher has sampled from higher or lower readinglevelsto'find the level in which the student reads 20-29 wpm(grades 1 & 2) or 30-39 wpm (grades 3 and up).
,4

A-3
1 - The teacher is measuring at a level which is too high or
too low.
Baseline
5 - The student's performance has been measured at least 3 ti es to
establish a stable baseline. A stable baseline ?means thalt 611
data points fall within a range of 10:
I - The teacher has not found a level for which a stable baselinehas been established or has failed to collect 3 data ploints
during the baseline phase.
.5. Graph Set-Up
5 - The groph is accurately set Up: The dates filled in on the
horizontal axis; the vertical axis is correctly 16beled words
read.pefminute from material; the units of measure-
ment are specified; the student's name and,subject area are
certified; a key identifies the symbols for:* correct (.) anA
incorrect (x); symbols are,placed at the'inters'ection of date
and score; the data points'are connected with straight lines;
and absences are recorded on the'graph as (abs'.).
1 - The graph does not include many of the items mentioned above.'
6. Aimline
5 - The l'ong-rnge goal is marked on the graph with an X at the
intersection of the desired perforMance level and date of
attainment and,a line,of desired progress connects the
point representing the student's median.score of the last
3 data points from baseline and the LRG.
1 - The long-range goal is not marked on the graphand/or the
median and np are not connected. ,
.7.. Timing of instructional Changes
5 - All the adjustments in-the student's program are made et the,
appropriate time giveh t4e rules for data utilization:
(I) Corpare the actual slope based on 7 o 10 data points
to the.slope required to attain the Annual Goal.
(2) Jf the actual slckpe is equal to, or steeper than, the
Annual Goal slople, continue the program.
(3) If the actual slope is flatter than.the Annual Goal .
slope, change the program'.
1 - None of the adjustments in the student:s program are made
at the appropriate time. '
A
4 5 ,
_

A-4
8. Long-Range Goal
... 45 . The long-range goal is accurately written; goal specifies
the number of weeks until next review; stimulus materialsfor the goal represents the level in which the studentis performing at entry level criterion; goal specifiesstudent behavior; goal specifies mastery criterion of50 wpm with fewer than 5 errors (grades 1 & 2) or 70 wpmwith fewer than 7 errors (grades 3-5) when there are 36weeks until the annual review. If there are'fewer than 36weeks, the criteria can be lowered proportionately.
1 - The long-range goal contains none of the above criteria.
9. Short-Term Objective ID
5 - The short-term objective is accurately written; stimulusmaterial and behavior ts specified; and the average increasetn performance.is the desired performance cinus the actualperformance divided by the number of weeks until the annualreview.
1 - The short-term objective contains none of the above criteria.
10. Measurement System
5 - The teacher has indicated how the material is organized, thefrequency of measurement, and what is to be recorded on the
graph.
1 - The measurement system is not specified.
11., Ih§tructional Plan
5 - The instructional plan includes clear and speciffc descriptionsof theinstrUctional procedures, the time spent in each acti-.vity, the pertinent materials, the arrangements, and themotivational strategies
. 1 - The instructional plan is unclear and lacks specific descrip-tiorrs of the instructional procedures, the time s'pent in eachactivity, the pertinentThiaterials, the areangements, and themotivational strategies.'
12. Substantial Changes
5 - The adjustments in the student's program are always substantial(have a,good chance of being effective; see Unit XIV).
- The adjustments are never substantial.
4 6
_

t2;
13. Clear ChangetI
A-5
5 - All the adjustments made introduce only one, clear program
. change. : . ,
- All the 'adjustments made introduce more than one char*
and/or the change is,unclear..
4 7.
4
1

1111111111M1111.111SMIIIIIIRS
=2_

Appendix q
'00AL AND OBJECTIVE FORM .
GOAL In , ,when presented with stories from
(# school weeks until year's end)
will read aloud at the
(Level #, series) (student's name)
rate of .with no more than errors.
(wpm correct) (#)
OBJECTIVE Each successive week, when presented with a random selection fro,Q..
,student will read aloud at
(same level # and series as above)
an average increase of wpm and no increase in errors.
(#)
MEASUREMENT SYSTEM Frequency: at least 2X/week; stimulus format: oral
reading passages; Test administration procedure: same as manual; Scoring
procedure: .same as manual; charting conventions: same as manual%

Student. .
NameIEP Gdal Time AvailableArea foiInstruct
Location
Changn joithe Instructional P:an of I nstru dion
- I nstructional-Procedures
. A r r a n g e m e n t
.
Time Materials MotivationalStrategies .
DATE :
. ..
.
..
, .
w.
-
.
. . .
-...e
D ATE:
. ,
,
.
. .
.
....
.
,
.
.
..
0.
,
.
.
.
._
.
DATE:
4
.,
.
,,
.
f
.
.' 6
,
,
.,
.-1
\
,
D ATE:t
1 %
.
,1
\
4
t
0
.
.
I
*
, .
i
,
.,
..
0 (
,i
1
DATE:
,
.
.
. _
.
,
,
,
5 2,
9

4peridix E
M4F-YEAR-STUDENT INTERVIEW
Student's Name Date .
Data Collector't Name
4.
1) What kind of progress haie you made in,reading this year?
0 'El 0 .v0Poor Not-to- Pretty (ood, Great Don't
Good Good Know
2) Do you know'what your goal is réading for this year?
Yes No
If yes, can you tell it to me. '(Write.below)
'Will you meet your reeding goal this year?El
Yes
4) How do you. know i..f'Yo(i'are goingto meet your reading goal this year?
Student's Accuracy
Pleese,indicate the accnracY of the student's responses by ansmeringthe following questions:*
1) Did the student name correctly fiit/her reading goal? - 1-1
If no, how was it wrong?
,Yes No
..
53
,04,

se
4.. .
-*
DAd the,student indicate coerectly whether he/she will.meet his/hergoal in readinv? ,
1:771
Yes. No
If no, what was wrong? .
K.
42'
1/4
1
1
C.

.
1.
Appendix F
1
Sample Ei(perimental Training Schedule
7.,
Teacher Trainer
Teacher
School
Date ,
Below, p1ease: (al descri6e the nature of the,training you. have*prOvidedthis teacher during the study, (b) indicate,the administrative arrangement-untier which the training was provided (individual, 1-3 ratio, etc.), and(c) estimate_ the number of hours-you-spent with,the teacher on each trainingarea..
DE§CRIFTION OF TRAINING ARRANGEMENT' 1 UMBER OF HOURS
data-based monitoring proceduret
..
,.
. :individual'
,
. ,,
)115.hrS.
,
.
!.. .
meeting the-indkidual.heedsof 'the students.
.
f
.
.
. .--
inaiVidual
. ....
. ,.
1 hr.....
.
.
.
.
.
.,
.
teaching decoding and --'- .
comprehension (literal andtnferential) skills-
.
.
individuala,'
.
-
,
3 hrs..
..
.
classroom management for ,
,reading.
,
.
,
.
irrdiyidual
.,
..
_
_
1 Kr.
,
, ,
T
.k .
)*
. 1
. .
.
' \
.
.
.
,
.
1
.
.
.z.:
.
.
.
. .
'
.
.
1
.
.
.
.
.r

V 1,
er.
Teacher Trainer
cp
Sample Control Training Schedulze
Date,
Teacher
Sthdol .
Below, please: (a) describe the nature of the training you have provided,this teacher during the,study, (b) indicate the administrative arrangementpnder which the training was Orovided Ondividual, 1-3 ratio,'etc.), and
ir(c) estimate the number of hours you spent w.fth the teacher on each trainingarea. d
DESCRIPTION OF TRAINING
" 4
ARRAIsiGEMENT NUMRER OF HOURS
Jsing the language '
experience approach.
,
.
.
.
indiVidua1 ,. ,
,
,
,
10 hrs. 4
,
Individualizing
.
,
.
1
.
%
,
individual -. .
.
5 'hrs
.
, . ,.
Jsing audio-viival equipmentfor teaching and motivating
.
''
.
individual
, . .
.
.
'2 hrs.
,
Diagnostic assessment tools. ,,
p
.
.
,
. .,
.
.
indiviaual ':
,
'
.
.
,.
.3 hrs:, , .
..
,
',
.
.
,- .
.
4
,
. .
a
a
.w
r
4
,.
4
I
5 6
A
6.
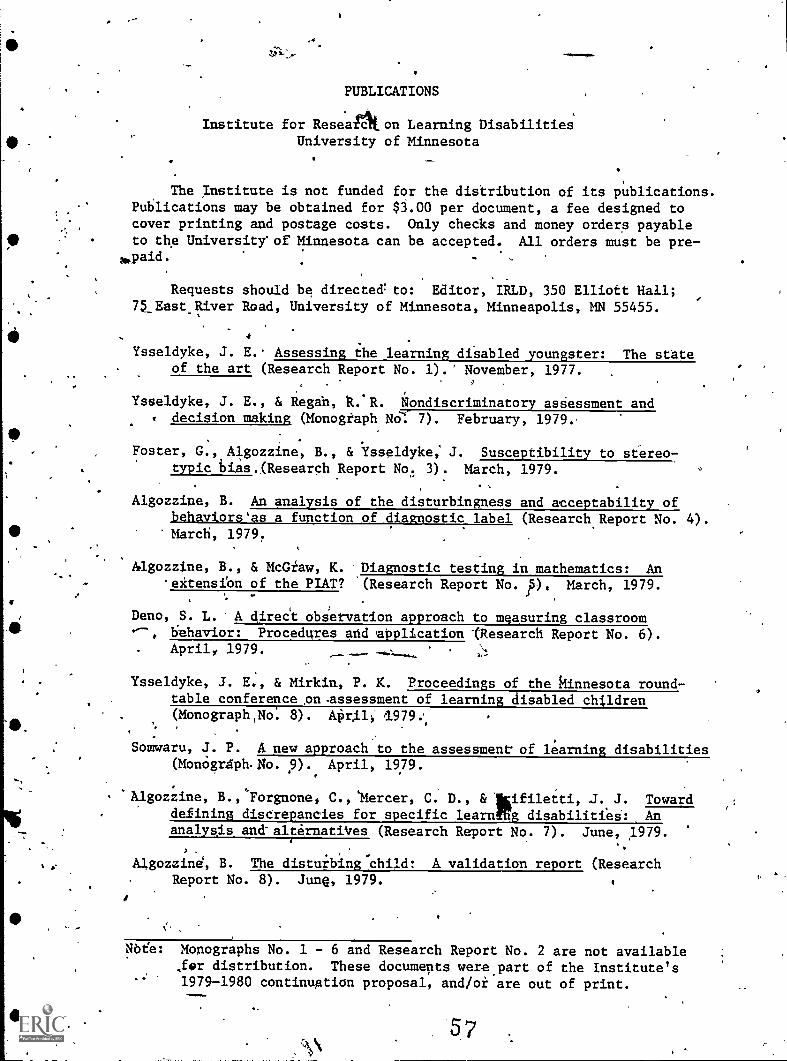
PUBLICATIONS
Institute for Reseaeilion Learning DisabilitiesUniversity of Minnesota
The Institute is not funded for the distribution of its publications.Publications may be obtained for $3.00 per document, a fee designed tocover printing and postage costs. Only checks and money orders payableto the University'of Minnesota can be accepted. All orders must be pre-
Requests shouId be directed:to: Editor, IRLD, 350 Elliott Hall;75 East_River Road, University of Minnesota, Minneapolis, MN 55455.
4
Ysseldyke, J. E. Assessing the learning disabled youngster: The stateof the art (Research Report No. 1).' November, 1977.
Ysseldyke, J. E., & Regah, 11..R. Nondiscriminatory asSessment and. decision making (Monogtaph NO: 7). February, 1979.,
Foster, G., Algozzine, B., & "Isseldyke; J. Susceptibility to stereo-typic bias.,(Research Report No,.. 3). March, 1979.
Algozzine, B. An analysis of the disturbingness and acceptability ofbehaviors'as a function of diagnostic label (Research Report No. 4).March, 1979.
Algozzine, B., & McGiaw, K. Diagnostic testing in mathematics: Aneictensihn of the PIAT? '(Research Report No. /5), March, 1979.
Deno, S. L. 'A direc't observation approach to measuring classroomr, hehavior: ProcedIres and application (Research Report No. 6).. Aprily 1979.
Ysseldyke, J. E., & Mirkin, P. K. Proceedings of the kinnesota round-table conference on-assessment of learning disabled children(Monograph,No: 8). APrili
Somwaru, J. P. A new approach to the assessment of learning disabilities(Montigraph.No. p).. April, 1979.
'Algozzine, B., Forgnone, C., 'Mercer, C. D., & l'ifiletti, J. J. Towarddefining discrepancies for specific learnfUg disabilities: Ananalysis and-alternatiVes (Research Report No. 7). June, 1979.
Algozgine, B. The distubing'child: A validation report (ResearchReport No. 8). June, 1979.
Nbee: Monographs No. 1 - 6 and Research Report No. 2 are not available,for distribution. These documents were,part of the Institute's1979-1980 continuation proposal, and/or are out of print.
37 .

41k
....
Ysseldyke, J. E., Algozzine, B., Regan, R., & Potter, M. Technicaladequacy of tests used by professionals in simulated decisionmaking (Research Report No. 9). July, 1979.
Jenkins, J.toward theAugust, 197
Mirkin, P. K., &approach to1979:
Deno, S. L., & Mirkin, P. K. Measuring pupil progrepsleast restrictive environthent (Monograpfi No. 10).9.
Deno, S. L. Formative evaluation'in the classroom: 'An
improving instruction .(Research Report No. 10). August,
Thurlow,'M. L., & Ysseldyke, J. E. Current assessment and decision-makingpractices in model programs for the learning disabled (Research ReportNo. 11). August, 1979.
Deno, S. L.; Chiang, B., Tindal, G., 6,131ackburn, M. Experimental analysisof program components: -An.approach to research in CSDC's (ResearchReport No. 12). August, 1979.
Ysseldyke, J. E., Algozzine, B., Shinn, M.,'& McGue, M. Similarities,anddifferences between underachievers and students labeled learningdisabled: Identical twins with different mothers (Research RepartNo. 13), September, 1979.
Ysseldyke, J., & Algozzine, R. Perspectives vti assessment of learningdisabled students (Monograph No. 11). October, 1979.
Poland', S. F., Ysseldyke,.J, E., Thurlow, M. L., & Mirkin, P. K. Currentassessment and decision-making practices in school settings as reportedby directors of special education (Research*Report No. 14). November,1979.
McGue, M., Shinn, M., "& Ysseldyke, J. Validity of the Woodcock-Johnsonpsycho-educational battery with learning disabled students (ResearchReport No. 15). November, 1979.,
Deno, S., Mirkin, P., & Shinn, M. Behavioral perspectives on the,asgess-ment of learning disabled children (MonograPh No. 12). November, 1979.
Sutherland, J. HA, Algozzinet B., Ysseldyke, J. E., &'Young, S. What, can I say after I say LD? (Research Report No. 16).' December, 1979.
Deno, S. L., & Mirkin, P. K. Data-based,IEP development: An approachto substantive compliance (Monograph No. 13). December, 1979.
Ysseldyke, J., Algozzine, B., Regar & McGue, M. The influence pftest 13cores and naturally-occurring pupil characteristics on paycho-educational decision making with'children (Research 17).
December, 1979.
Algozzine, B., & Ysseldyke, J. E. Decision makers' prediction ofstudents) academic datic ties as a function of referraltinforma-tion (Research Report No. 18). December, 1979.
58

441114..,-
Ysseldyke, J. E., & Algozzine, B. Diagnostic classification decisions
as a function of referral information (Research Report No. 19).January, 1980.
Deno, S. L,, Mirkin-, P. K., Chiang, B., & Lowry, L. Relationships
arming simple measures of reading and performance'on standardized -achievementttests ,(Research Retort No. 20). January, 1980.
Deno, S. L., Mirkin,,P. K., .I.pwry, L., & Kuehnle, K. Relationships
amons simple measures of spelling and performance on standardizedachievement tests (Research Report No. 21). January, 1980.
Deno, S. L., Mirkin, P. K., & Marston, D. Relationships among simplemeasures of writtenftxpression and performance on standardizedachievement tests Otesearch Report No. 22). January, 1980.
Mirkin, P. K., Deno, S. L., Tindal, G., & Kuehnle, K. Formative evalua-
tion: Continued development of data utilization systems (ResearchReport No. 23). .January,.1980,
Deno, S. L., Mitkin, P. K., Robinson, S., & Evans, P. Relationships
amonsclassroom observations of social adjustment and sociometricrating scales (Research Report No. 24). Ja5maxy, 1980.
,
ThurloW, M. L., & Ysseldyke,'J. E. Factors influential on the piycho-
educational decisiOn reached by teama of educators (Research Report
No. 25). February, 80.\
tYsseldyke, J. E., & Al zzine, B. Diagnostic decision making in indivi-
duals susceptible t biasing information_presented in the referral
'case folder (Research eport No. 26). March, 1980.
'Thi low, M. L.& Greener, J. V. Preliminary evidence on information .
\
considered useful in instructional planning (Research Report No. 27')
March, 1980.
dyke'! J. E., Regan, R. R., & Schwartz, S. Z. The Use of technically,
dequate tests in psychoeducational decision making (Research Report. April, 1980.
, Potter, M., & Ysseldyke, J. Teachers' expectations for the
s. in s of learnin disabled and non-learnin disabled'students:lot stud/ (Research Report No. 29). May, 1980.
. L,, & Ysseldyke, J. E. Instructional planning: Informat/on
collected by school psychoftgists vs. information considered use-\ ul by teachers (Research Report No. 30). June, 1980.
'Algogzine, B., Webber, J., Campbell, M., Moore', S., & Gilliam; J.
Classroom decision making as a function of diagnostic labels and
Perceived competence (Research Report No. 11). June, 1980;
,)5
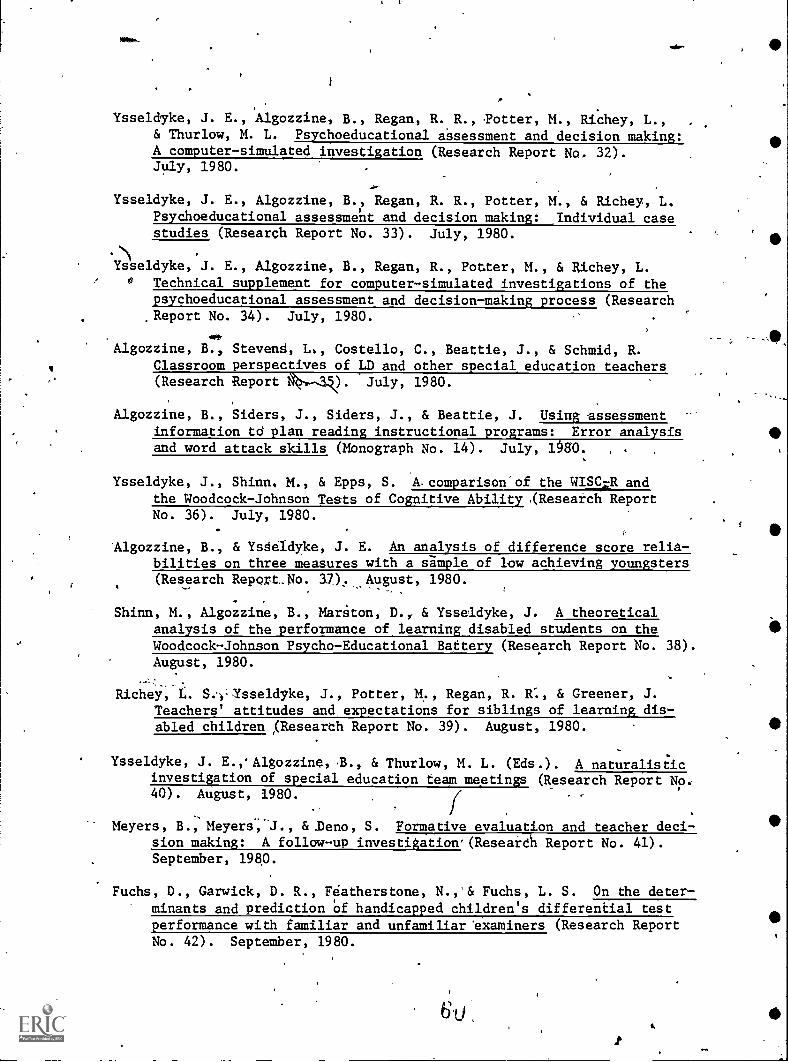
Ysseldyke, J. E., Algozzine, B., Regan, R. R., otter, M., Richey, L., .
& Thurlow, M. L. Psychoeducational assessment and decision making:A computer-simulated investigation (Research Report No. 32).July, 1980.
Ysseldyke, J. E., Algozzine, B., Regan, R. R., Potter, M., & Richey, L.Psychoeducational assessmeht and decision making: Individual casestudies (Research Report No. 33). July, 1980.
Ysseldyke, J. E., Algozzine, B., Regan, R., Potter, M., & Richey, L.0 Technical supplement for computer-simulated investigations of the
psychoeducational assessment and decision-making process (ResearchReport No. 34). July, 1980.
AMA
Algozzine, B., Stevend, Lb, Costello, C., Beattie, J., & Schmid, R.Classroom perspectkves of LD and other special education teachers(Research Report k.--.34). July, 1980.
Algozzine, B., Siders, J., Siders, J., & Beattie, J. Using assessmentinformation td plan reading instructional programs: Error analysisand word attack skills (Monograph No. 14). July, 1§80. ,
Ysseldyke, J., Shinn. M., & Epps, S. A.comparison of the WISC:cR andthe Woodcock-Johnson Tests of Cognitive Ability ,(Research ReportNo. 36). July, 1980.
Algozzine, B., & YsSeldyke, J. E. An analysis of difference score rens-bilities on three measures with a sample of low achieving youngsters(Research Report.No. 37). August, 1980.
- -
Shinn, M., Algozzine, B., Mariton, D., & Ysseldyke, J. A theoreticalanalysis of the performance of learning disabled stu4ents on theWoodcock-Johnson Psycho-Educational Battery (Research Report No. 38).August, 1980.
Richey, t. S.'4-Ysseldyke, J., Potter, M., Regan, R. R, & Greener, J.Teachers' attitudes and expectations for siblings of learning dis-abled children r(Researth Report No. 39). August, 1980.
Ysseldyke, J. E.,Algozzine, ., & Thurlow, M. L. (Eds.). A naturalishcinvestigation of special education team meetings (Research Report No.40). August, 1980.
I(
.
-Meyers, B., Meyers.;-J., &Deno, S. Formative evaluation and teacher deci-
sion making: A follow-up_investigatiow(ResearCh Report No. 41).September, 1980.
Fuchs, D., Garwick, D. R., Featherstone, N.,'& Fuchs, L. S. On the deter-minants and prediction Of handicapped children's differential testperformance with familiar and unfamiliar 'examiners (Research ReportNo. 42). September, 1980.

Algozzine, B., & Stoller, L. Effects of labels and competence onteachers' attributions for a student,(Research Report No. 43).September, 1980.
Ysseldyke, J. E., & Thurlow, M. L. (Eds.). The special educationassessment and decision-making process: Seven case studies(Research Report No. 44). September,.1980.
'Ysseldyke, J. E., Algozzine, B., Potter, M., & Regan, R. A descO.ptivestudy of students enrplled in a program for the severely learningdisabled (Research Report No. 45).. September, 1980.
Marston, D. Analysis of subtest scatter on the tests of cognitiveability from the Woodcock-Johnson Psycho-Educational Battery(Research Report No. 46): October, 1980.
Algozzine, B., Ysseldyke, J. E., & Shirai, M. Identifying children withlearning disabilities: When is a discrepandy severe? (Research .
Report No. 47). November, 1980.
Fuchs, L., Tindal, J., & Deno, S. Effects of varying item domain and .
sample duration on technical characteristics of daily measuresin reading,(Research Report No. 48). January, 1981T
Marston, D.T. Lawry, L., Deno, S., & Mirkin, P. -fiiin analsearnintrendtin simple measures of reading, spelling, and written expression:A longitudinal study (Research Report No. 49). January, 1981.
Marston, D., & Deno, S. The relkabilitywritten expression (Research Report
Epps, S., McGu4 M., & Ysseldyke, J. E.Lying studenep as leaining disabledruary, 1981.
of simple, direct measures ofNo. 50). January, 1981.
Inter-judge agreemgnt in classi-(Research Repore No. 51). Feb-
, I
Epps, S., Ysseldyke, J.,E., Sc. McGue, M. Differentiating LD and non-LD
stUdents: "I knaW one when I see'one" (Research Report-No. 52).Match, 1981. '
Evans, P. R., & Peham, M. A. S, Testing and measurement in occupational
therapy. A review of current practie with special emphasis on theSouthern California Sensory Integration Tests (Monograph No. 15).
April, 1981.
Fuchs, L., Wesson, C., Tindal, & Mirkin, P. Teacher efficiency incontinuous evaluation of IEP goals (Research Report No. 53). June,
,1981.
Fuchs, D., Featherstone, N., Garwick,A?. R., & Fuchs, L..S. The impor-
tance of situaSional factors and task demands to handicapped chil-dren's test performance (Research Report No..54)., June, 1981.

INC
Tindal, G., 4 Deno, S. 1. Daily measurement of reading: Effects of. .
varying-the size of the item'pool (Research Report No'. 55)) July,1981.
Fuchs, L. S., & Deno, g.'14, A comparison of teacher judgment,42standard-ized tests, and curriculum-based approaches to reading placement(Research Report Nb. 56). August, 1981.
Fuchs, L., & Deno, S. The relationship between curriculum-based mastery 1
measures and standardized achievement tests tn reading (ResearchReport No. 57), August, 1981.
Christenson, S., Graden, J., Potter, M., & Ysseldyke,.J, Current researchorOpSychoeducational aSsessment and decision making: Implicationsfor training and practice (Monograph No. 16), September, /981.
Christenson, S., Ysseldyke, J., & Algozzine, B. Institutional coristraintsand external pressuree influencing referral decisions (ResearchReport No. 58). October, 1981.
Fuchs,'L., Fuchs, D., & Deno, S. , Reliability and validity of curriculum-based informal reading inventories (Research Report No. 59). Octo-
ber' 1981.
.
Algozzine, B., Christenson, S., & Ysseldyke, J. Probabilities associatedwith the refereal-to-placeMent process (Research Report 'No. 60).'November, 1981.
Tindal, G., Fuchs, L. Christenson, S., Mirkin, P., & Deno, S.., The rela-tionship between student achievement and teacher assessment of shoff-or long-term-goals'(Research Report No. 61). November,,.1981.
Mifkin, g., Fuchs, L., Tindal, G., Christensqn, S., & Deno, S. The effectofTEP monitoring strategies on teacher behavior (Research Report No.62). December, 1981. .
Wesson, C., Mirkin, P., & Deno; S. Teachers' dse of self instructionalmaterials for learning procedures for developing and monitoring
- progress on IEP goals (Research,Report No. 63). January, 1982.
Fuchs, L., Wesson, C., Tindal, G., Mirkin, P., & Deno, S. Instructional,changes, student performance, and teacher Preferences: The effectsof specific measureMent and evaluation proceduree (Research ReportNo. .64). January, 1982.
Potter, M., & Arkin, P. Instructidnal planning and implementationpractices of elementary and secondary resource room teachers:Is therea difference? (Research Report No, 65). January,'1-982.
62
9

S.
Thurlow, M. L., & Ysseldyke, J. E. Teachers' beliefs about LD students
(Research RepoirtrNo. 66). January, 1982.
Graden, J., Thur1ow;..M. L., & Ysseldyke, J. E. Acgdemic,enga0d timeand its relationship to learning: A review of the literature
(Monograph No, 17). January, 1982.
King, R., Wesson,'C., & Deno,'S.student performance: DoesReport-No. 67). February,
Greener, J. W., & Thurlow, M. L.education training programs1982.
Direqt and frequent measurement ofit take too.much timey (Research
1982.
Teadher opinions about professional(Research Report No. -68). March,
4
Algozzine; B., & Ysseldyke, J. Learning disabilities as a subset of
school failure: The oversophistication of a concept (ResearchReport No. 69). March, 19821'
Fuchs, D., Zern, D. S., & Fuchs, L. S. A mioroanalysis of participantbehaVior in familiar and unfamiliar test conditions (ResearchReport No. 70). March, 1982.
Shinn, M. R., Ysseldyke, J., Deno, S., & Tindal, G. A compatison ofpsychometric and functional differences between students labeledlearning disabled and low achieving (Research Report No. 71).March, 1982.
Thurlow, M. 1% Graden, J., Greener, J. W., & Ysseldyke, J. E. Academic. responding time for LD and hon-LD students (Research Report.No.
72). April, 1982.
,
Graden, J.,-Thurlow, M., & Ysseldyke, J. Instructional ecOlogy andacademic responding time for students at three levels of teacher-perceived behavioral competence (Research Report No. 73). April,1982.
Algozzine, B., Ysseldfte, J.,teachers' tolerances forratinApril, 1982.
& Christenson; S. The influence ofspecific 'kinds of behaviors on their
p of a third grade student (Research Report No. 74).
7esson, C., Dpno, S., & Mirkina, P. Research on developing and monitor-ing progress' or! IEP goals: Current findings and implications' forpractice (Monograph No. 18). Aptil, 1982.
Mirkin, P., Merston, & Deno, S. L. Direct and repeateemeasurementof academic skills:, An alternative tO traditional screenidg, re-ferral,-and identification of learning disabled students (ResearchReport No. 75). May, 1982.
6 3,
`7:

Algozzine, BT; Ysseldyke,'J., Christenson, S., & Thurlow, M. Teachers'intervention Choices for children exhibiting different behaviorsin school (Research Report No. 76), June, 1:982,y,_4..,
Tucker, J., Stevens, L. J., & Ysseldyke, J.E. Learning disabilities:The experts speak out (Research Report No. q7). June, 1982.
Thurlow, M. L., YAseldyke, J. E., Graden, J., Greener, J. W., &Mecklenberg, C. Academic responding time for LD students receivingdifferent levels of special eduEation services (Research ReportNo. 78). June, 1982.
Graden, J. L., Thurlow, M. L., Ysseldyke, J. E., & Algozzine, B. Instruc-tional ecology and academic responding time for students in differ-ent reading groups (Research Report No. 79). July, 1982.
Mirkin, P. K., & Potter, M. L. A survey of program planning and imple-mentation practices of LD teachers (Research Report No. 80). July,1982.
Fuchs', L. S., & Warren, L. M. Special education practicein evaluating stUdent progress towatd goals (Research'Report No.-81). July, 1982.
Kuehnle, K., Deno, S. L., & Mirkin, P, K. Behavioral measurement ofsocial adjustment: What behaviors? What setting? (Research ,
Report No. 82). July, 1982.
o.eCFuchs, D., Dailey, Ann Madsen, & Fuchs, L. S. Examiner familiarity and
the relation between qualitative and quantitative indices of ex-pressive language (Research Report No. 83). July, 1982. ,
Videen, J., Deno, S., & Marston; D. Correct, word sequences: A validindicator of proficiency in written elpressioni(Research ReportNo. 84). July, 1982.
Potter, M. L. Application of a decision theory model to eligibility,and classification decisions in special education (Research ReportNo., 85). July, 1982.
dreener, J. E.., Thurlow, M. L., Graden, J. L., Ysseldyke,,J. E. Theeducational environment and students' responding times as a functionof students' teacher-perceived academic competence (Research ReportNo. 86). August, 1982.
Deno, S., Marston, D.,. Mirkin, E., Lowry,The use of standard tasks to measureand written expression: A normativeReport No. 87). August, 1982.
Skiba, R., Wesson, & Deno, S. L.the use of formative evaluation
'compatison (Research Report No.
L., Sindelar, P., & Jenkins, j.achievement in reading, spelling,and developmental study (Research
The effects of training teachers inin reading: An experimental-control88). September, 1982.
/

0
Martson, D., Tindal, G.,,& Deno, S. L. Eligibility for learning disa-bility services: A direct and repeated measurement approach(Research Report No. 89). September, 1982.
Thurlow; M. L., Ysseldyke, J. E., & Graden, J. L. LD itudents activeacademic responding in regular an,0 resource classrooms (Rea.,earchReport No. 90).. September, 19821
Ysseldyke, J. E., Christenson,-8., Pianta, R., Thurlow, M. L., & Algozzine,B. An analysis of current practice in referring s'tudents for psycho-educational evaluation: Implication& for change (ResearCh Repqrt No.91). October,,1982.
Ysseldyke, J. E., Algozzine, B., & Epps', S. A logical and empiricalanalysis of current practices in classifying students as handicapped(Research Report No. 92). October, 1982.
Tindal, G.,'Marston, D., Deno, S. L., & Germann, G. Curriculum differ-ences in direct repeated measures of reading (Research Report No%93). October, 1982.
Fuchs, 12:^S., Deno, S. L., & Marston, D. Use of aggregation to improvethe,reliability of simple direct measures of academic performance-(Research Report No. 94). October,(1982.
Ysseldykr, J. E., Thurlow, M. L., Mecklenburg, C., & Graden, J. Observedchanges in inStruction and student responding as a function ofreferral and special education placement (Research Report No. 95).October, 1982.
Fuchs, L. S., Deno, S. L., & Mirkin, P. K. Effects of frequent curricu-lum-based measuremene and evaluation on student achievement anaknowledge of performance: ,An experimental stud (Research ReportNo. 96). November, 1982.-:-
65