Austroads Improving Australian and New Zealand transport outcomes.

AP-R319/08
Analysis of the Safety Benefits of Heavy Vehicle Accreditation Schemes
AUSTROADS RESEARCH REPORT

Analysis of the Safety Benefits of Heavy Vehicle Accreditation Schemes

Analysis of the Safety Benefits of Heavy Vehicle Accreditation Schemes
First Published May 2008
© Austroads Inc. 2008
This work is copyright. Apart from any use as permitted under the Copyright Act 1968, no part may be reproduced by any process without the prior written permission of Austroads.
Analysis of the Safety Benefits of Heavy Vehicle Accreditation Schemes
ISBN 978-1-921329-54-8
Austroads Project No. SS1057
Austroads Publication No. AP–R319/08
Project Manager Peter Rufford, National Transport Commission
Prepared by Peter Baas, Neon Taramoeroa, TERNZ Ltd
Published by Austroads Incorporated Level 9, Robell House 287 Elizabeth Street
Sydney NSW 2000 Australia Phone: +61 2 9264 7088
Fax: +61 2 9264 1657 Email: [email protected]
www.austroads.com.au
Austroads believes this publication to be correct at the time of printing and does not accept responsibility for any consequences arising from the use of information herein. Readers should
rely on their own skill and judgement to apply information to particular issues.

Analysis of the Safety Benefits of Heavy Vehicle Accreditation Schemes
Sydney 2008
Austroads profile Austroads’ purpose is to contribute to improved Australian and New Zealand transport outcomes by:
providing expert advice to SCOT and ATC on road and road transport issues facilitating collaboration between road agencies promoting harmonisation, consistency and uniformity in road and related operations undertaking strategic research on behalf of road agencies and communicating outcomes promoting improved and consistent practice by road agencies.
Austroads membership Austroads membership comprises the six state and two territory road transport and traffic authorities and the Australian Department of Transport and Regional Services in Australia, the Australian Local Government Association and Transit New Zealand. It is governed by a council consisting of the chief executive officer (or an alternative senior executive officer) of each of its eleven member organisations: Roads and Traffic Authority New South Wales Roads Corporation Victoria Department of Main Roads Queensland Main Roads Western Australia Department for Transport, Energy and Infrastructure South Australia Department of Infrastructure, Energy and Resources Tasmania Department of Planning and Infrastructure Northern Territory Department of Territory and Municipal Services Australian Capital Territory Department of Infrastructure, Transport, Regional Development and Local Government Australian Local Government Association Transit New Zealand
The success of Austroads is derived from the collaboration of member organisations and others in the road industry. It aims to be the Australasian leader in providing high quality information, advice and fostering research in the road sector.
Analysis of the Safety Benefits of Heavy Vehicle Accreditation Schemes
A u s t r o a d s 2 0 0 8
— i —
SUMMARY The purpose of this investigation was to determine the safety benefits of heavy vehicle accreditation. Accreditation is a formal process for recognising operators who have good safety and other management systems in place. Those management systems include vehicle maintenance, driver fatigue, driver training, vehicle loading and the many other factors that affect heavy vehicle safety and sustainability.
There are a number of heavy vehicle accreditation schemes operating in Australia. Initially operators who wanted to differentiate themselves in the marketplace did so through accreditation to the ISO 9000 group of quality management standards. In 1996 the Australian Trucking Association (ATA) introduced Trucksafe as a means of raising the profile and safety of the trucking industry. The National Heavy Vehicle Accreditation Scheme (NHVAS) was offered to industry in 1999 as an alternative means of operators demonstrating compliance with certain aspects of the law. A number of concessions have become attached to NHVAS mass management and maintenance management modules. Some of those concessions, especially those that offer higher mass limits, have resulted in accreditation becoming virtually mandatory for many operators. Accreditation is also increasingly being used to show compliance with the chain of responsibility and duty of care requirements. In 2002 Western Australia introduced its own heavy vehicle accreditation scheme (WA HVA), which is mandatory for all restricted access vehicles and those operating on permits or concessions. There are also a number of sector specific schemes in Australia, for example, PACIA (Plastics and Chemicals industries Association), Truckcare (Australian Livestock Transport Association) and HACCAP (a risk management programme for the food industry). In New Zealand some operators are certified to the ISO 9000 family of standards and the Q-Base quality management system, a derivative of ISO 9001 developed for specifically for small and medium sized businesses.
All of these schemes are based on the premise that the adoption of good management practices will lead to improved safety and other benefits. Current risk management theory accepts that humans make errors but that errors and their impact can be reduced though having appropriate defences in place. Governments have the ability to encourage the adoption of safety risk management practices though the use of incentives and privileges in conjunction with the use of education/communication strategies. The traditional use of penalties and deterrents continue to have the important role of ensuring the less scrupulous operators do not gain a competitive advantage through non-compliance.
Additional strategies to those used traditionally are required if the road toll is to be reduced by the extent proposed in the Australia and New Zealand transport strategies (ATC 2003), (MOT NZ 2002). Heavy vehicles were involved in 14% of the fatal crashes in Australia in 2004 and 22% in New Zealand in 2006 in spite of only accounting for approximately 7% of the total distance travelled by motor vehicles. They accounted for approximately 8% of the injury crashes in New Zealand (MOT NZ 2006). In New Zealand 38% of the fatal crashes and 59% of the injury crashes were primarily or partially attributable to the fault of the heavy vehicle (MOT NZ 2006).
The safety benefits of accreditation have been estimated by:
determining the crash rates of combination vehicles (tractor-semitrailers, B-doubles, etc.) accredited to TruckSafe and NHVAS and those not accredited. For this, crash data, accreditation status and other data obtained from the jurisdictions in Queensland, New South Wales and Victoria; TruckSafe; National Transport Insurance (NTI), and the Australian Bureau of Statistics (ABS) were analysed. The analysis was limited to Victoria, New South Wales and Queensland because of the difficulties in combining data from different jurisdictions given that each state has its own data collection protocols and has its own

Analysis of the Safety Benefits of Heavy Vehicle Accreditation Schemes
A u s t r o a d s 2 0 0 8
— ii —
unique data field definitions. Victoria, New South Wales and Queensland were selected because they border each other; they are the most populous states with approximately 75% of all registered combination vehicles, and there is limited interstate travel with other states and territories. Only 6% of crashes in Victoria, NSW and Queensland involved combination vehicles registered in other States and Territories. The confounding influence of inter-state travel was reduced further by deleting from the data all crashes that involved vehicles not registered in Victoria, NSW or Queensland. The analysis was restricted to combination vehicles (Tractor-semis, B-doubles, road-trains etc.) because approximately 85% of the NHVAS accredited vehicles were of this type in 2005. Only a small proportion of the rigid vehicle fleet is accredited and those vehicles are generally confined to specialist fleets such as concrete delivery. The datasets included over 48,000 combination vehicles, of which 20,000 were accredited to TruckSafe and/or NHVAS at the end of 2005.
interviewing a wide range of stakeholders including transport operators, jurisdictions, auditors, insurers and industry associations across Australia and in New Zealand
reviewing the international literature (both published and un-published) and through direct contact with jurisdictions in North America and the UK.
From the data available, it would appear that vehicles accredited to TruckSafe or NHVAS are, on average, significantly safer than vehicles that were not accredited. The calculated difference in average crash rates was substantial with vehicles accredited to the schemes having between ½ and ¾ fewer crashes on average than non-accredited vehicles.
It was not possible to determine if operators accredited to Trucksafe were any safer than those accredited to NHVAS or vice versa because of the number of vehicles accredited to both schemes. Approximately ½ of TruckSafe accredited vehicles were also accredited to NHVAS.
The analysis of insurance claims also showed substantial differences in crash rates for operators accredited to TruckSafe. The widely held view of operators that were accredited was that the benefits of accreditation far out-weighed the costs. The scale of the benefits was also consistent with overseas studies.
The analysis found that operators improved through the process of becoming accredited. An analysis of insurance data found that the claims rate in the 2 years after TruckSafe accreditation was 57% lower than during the 2 years before. This was with a small sample but is supported by the anecdotal evidence. Operators reported a noticeable change in company culture which had a direct impact on, for example, drivers’ attitude to speeding. In the U.S. reductions in the average crash rates of up to 50% were reported following the review of the safety management practices of 9,172 transport operators (John A. Volpe National Transportation Systems Center 2005). An analysis of the performance of ISO 9000 certified transport operators in the U.S. found that a significant improvement in safety occurred through the process of becoming certified (Naveh and Marcus 2006). They also found a significant improvement in financial performance in terms of return on assets.
U.S. data suggests that fleet size has a major influence on the scale of the benefits with fleets of 1 to 5 vehicles improving by approximately 50%, fleets with 6 to 10 vehicles improving by 30%, fleets with 21 to 100 vehicles improving by 9% and fleets of over 100 vehicles experiencing no significant change following an audit of their safety management practices ((John A. Volpe National Transportation Systems Center 2005). Another study found that the largest operators had crash rates 2/3rds lower than the smallest operators (Moses and Savage 1994).
It is recommended that greater use be made of heavy vehicle accreditation in Australia and New Zealand as it is arguably the most effective means available to jurisdictions and industry for advancing heavy vehicle safety.
Analysis of the Safety Benefits of Heavy Vehicle Accreditation Schemes
A u s t r o a d s 2 0 0 8
— iii —
CONTENTS 1 INTRODUCTION....................................................................................................................... 1
2 RATIONALE FOR ACCREDITATION...................................................................................... 5
2.1 Compliance model........................................................................................................... 5 2.2 Privileges and incentives................................................................................................. 9 2.3 Accreditation.................................................................................................................. 10
3 ACCREDITATION SCHEMES................................................................................................ 12
3.1 Accreditation schemes in Australia ............................................................................... 12 3.1.1 National Heavy Vehicle Accreditation Scheme (NHVAS) ................................ 12 3.1.2 Western Australian Heavy Vehicle Accreditation scheme ............................... 14 3.1.3 TruckSafe......................................................................................................... 15
3.2 Comparison of NHVAS, WA HVA and TruckSafe ......................................................... 16 3.3 Australian national scheme for auditing ........................................................................ 18
4 ANALYSIS OF THE SAFETY BENEFITS OF ACCREDITATION ......................................... 20
4.1 Method used to determine the safety benefits .............................................................. 20 4.1.1 Assumptions..................................................................................................... 22 4.1.2 Results ............................................................................................................. 23
4.2 Safety benefits of TruckSafe based on Insurance claims data ..................................... 24 4.3 Anecdotal evidence of the safety benefits of NHVAS and TruckSafe ........................... 25
5 INTERNATIONAL INDICATORS OF THE BENEFITS OF ACCREDITATION...................... 27
5.1 Voluntary schemes........................................................................................................ 27 5.1.1 ISO 9000 quality management......................................................................... 27 5.1.2 American Chemistry Council Responsible Care programme........................... 28 5.1.3 CSA carrier safety management system.......................................................... 29
5.2 Mandatory schemes ...................................................................................................... 30 5.2.1 Mandatory safety management in Canada ...................................................... 30 5.2.2 U.S. compliance reviews.................................................................................. 30
5.3 Summary of the benefits of overseas schemes ............................................................ 32
6 DISCUSSION.......................................................................................................................... 34
7 CONCLUSIONS...................................................................................................................... 37
APPENDIX A: SECTOR SPECIFIC ACCREDITATION SCHEMES............................................. 39
APPENDIX B: STATISTICAL ANALYSIS OF NHVAS DATA...................................................... 43
APPENDIX C: NHVAS CRASH COUNTS .................................................................................... 48
BIBLIOGAPHY ............................................................................................................................... 51

Analysis of the Safety Benefits of Heavy Vehicle Accreditation Schemes
A u s t r o a d s 2 0 0 8
— iv —
ACKNOWLEDGEMENTS This investigation would not have been possible without the assistance of a large number of people and organisations. We would like to especially thank Ian Wright of Ian Wright and Associates of Melbourne for arranging and participating in the interviews with stakeholders and for assisting with the background research and data gathering. The study would not have been possible without the support and assistance of VicRoads, Roads and Traffic Authority of NSW, Queensland Transport and TruckSafe Inc. These organisations spent a considerable amount of time and resources extracting the data, which required many hours of manual data processing, and provided assistance in many other ways. We thank National Transport Commission and Main Roads Western Australia for their invaluable assistance and guidance. We also really appreciate the assistance provided by Owen Driscoll and National Transport Insurance, especially in providing access to their claims data and other records. Finally we would like to thank the operators, auditors, industry associations, accreditation scheme providers, officials, transport users, and the many other people and organisations who agreed to be interviewed and gave freely of their time.

Analysis of the Safety Benefits of Heavy Vehicle Accreditation Schemes
A u s t r o a d s 2 0 0 8
— v —
ABBREVIATIONS ABS Australian Bureau of Statistics Combination vehicles Tractor-semi trailers, B-doubles, road trains etc. NHVAS National Heavy Vehicle Accreditation Scheme NTC National Transport Commission NTI National Transport Insurance NSW New South Wales Powered units All powered heavy vehicles (rigid trucks, rigid trucks towing trailers and
prime movers in combinations) Qld Queensland RTA Roads and Traffic Authority, NSW TruckSafe TruckSafe Inc, the accreditation scheme owned by the Australian
Trucking Association Vic Victoria WA HVA Heavy Vehicle Accreditation Scheme of Western Australia

Analysis of the Safety Benefits of Heavy Vehicle Accreditation Schemes
A u s t r o a d s 2 0 0 8
— 1 —
1 INTRODUCTION The numbers of fatal crashes and those involving heavy vehicles in Australia and New Zealand, are shown in table 1. In Australia, heavy vehicle safety appears to have improved in line with the overall downward trend in the road toll with the percentage of fatal crashes involving heavy vehicles remaining, statistically; no different than what it was a decade ago. For New Zealand there is no discernable trend, statistically, however MOT NZ (2007) reports that, on a distance travelled basis, the heavy vehicle involved fatal crash rate has halved since the early 1990’s.
Table 1: Fatal crashes involving heavy vehicles in Australia and New Zealand (data supplied by DoTRS and the MOT NZ)
Australia New Zealand
Year Fatal crashes
Fatal crashes involving a heavy truck (rigid and
articulated)
Per cent involving a heavy truck
Involving an articulated
truck
Per cent involving an articulated
truck
Fatal crashes
Fatal crashes involving truck
(rigid and articulated)
Per cent involving
heavy vehicle (rigid and
articulated)
1996 1970 250 13% 161 8% 457 79 17%
1997 1767 255 14% 146 8% 468 88 19%
1998 1755 241 14% 151 9% 435 77 18%
1999 1764 262 15% 163 9% 434 96 22%
2000 1817 279 15% 165 9% 383 71 19%
2001 1737 235 14% 146 8% 395 79 20%
2002 1715 NA 171 10% 365 66 18%
2003 1620 NA 142 9% 405 66 16%
2004 1583 223 14% 137 9% 375 85 23%
2005 1627 NA 132 8% 340 74 22%
2006 1598 NA 144 9% 348 76 22%
It is often argued that most fatal crashes involving heavy vehicles are not the fault of the truck driver. An analysis of coroners’ reports in Australia found that articulated truck drivers were either partly or fully responsible for about 25 per cent of the multiple-vehicle crashes in 1999 (ATSB 2003). This proportion was the same in New Zealand between 2001 and 2005 for crashes involving a heavy vehicle and another road user (MOT NZ 2006). When single vehicle crashes are included, 38% of the fatal crashes in Australia and New Zealand and 59% of the injury crashes in New Zealand were primarily or partially attributable to the fault of the heavy vehicle (MOT NZ 2006), (ATC 2006). Even for crashes where the heavy vehicle is not at fault, improvements to the vehicle (for example by ensuring the brakes are in good condition) and driving practices can help to avoid or mitigate the effects of crashes.
Between 1991 and 2001 in Australia:
articulated truck numbers increased by 18%
kilometres travelled by articulated trucks increased by 34%
articulated truck tonne-kilometres increased by 62%.
Analysis of the Safety Benefits of Heavy Vehicle Accreditation Schemes
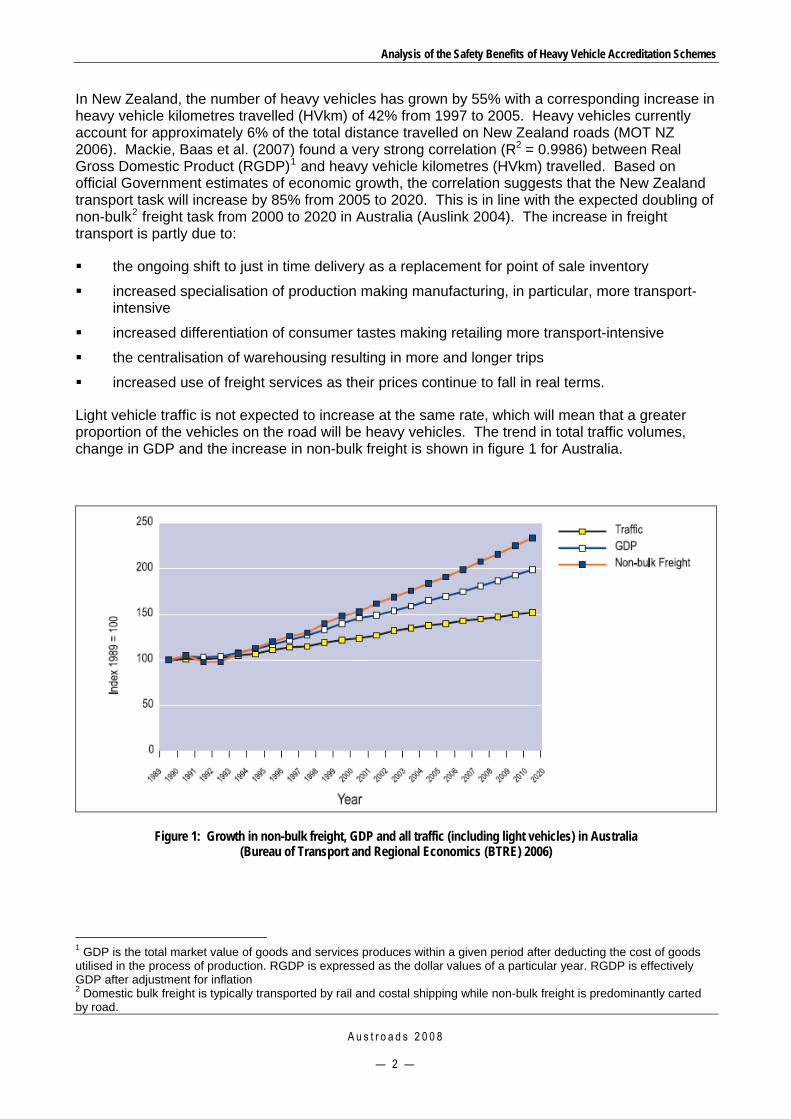
In New Zealand, the number of heavy vehicles has grown by 55% with a corresponding increase in heavy vehicle kilometres travelled (HVkm) of 42% from 1997 to 2005. Heavy vehicles currently account for approximately 6% of the total distance travelled on New Zealand roads (MOT NZ 2006). Mackie, Baas et al. (2007) found a very strong correlation (R2 = 0.9986) between Real Gross Domestic Product (RGDP)1 and heavy vehicle kilometres (HVkm) travelled. Based on official Government estimates of economic growth, the correlation suggests that the New Zealand transport task will increase by 85% from 2005 to 2020. This is in line with the expected doubling of non-bulk2 freight task from 2000 to 2020 in Australia (Auslink 2004). The increase in freight transport is partly due to:
the ongoing shift to just in time delivery as a replacement for point of sale inventory
increased specialisation of production making manufacturing, in particular, more transport-intensive
increased differentiation of consumer tastes making retailing more transport-intensive
the centralisation of warehousing resulting in more and longer trips
increased use of freight services as their prices continue to fall in real terms.
Light vehicle traffic is not expected to increase at the same rate, which will mean that a greater proportion of the vehicles on the road will be heavy vehicles. The trend in total traffic volumes, change in GDP and the increase in non-bulk freight is shown in figure 1 for Australia.
Figure 1: Growth in non-bulk freight, GDP and all traffic (including light vehicles) in Australia (Bureau of Transport and Regional Economics (BTRE) 2006)
1 GDP is the total market value of goods and services produces within a given period after deducting the cost of goods utilised in the process of production. RGDP is expressed as the dollar values of a particular year. RGDP is effectively GDP after adjustment for inflation 2 Domestic bulk freight is typically transported by rail and costal shipping while non-bulk freight is predominantly carted by road.
A u s t r o a d s 2 0 0 8
— 2 —

Analysis of the Safety Benefits of Heavy Vehicle Accreditation Schemes
A u s t r o a d s 2 0 0 8
— 3 —
The predicted “doubling” of the freight task is a ‘business as usual” model. It is possible that major increases in oil prices or other events could dramatically reduce the demand for freight transport. However, given the strong correlation between GDP and freight demand, external events that reduce freight growth are also likely to adversely affect the economy. The likelihood of such an event occurring is not known.
Assuming the “business as usual” prevails, the above trends would mean that improving heavy vehicle safety will become increasingly important.
Both the Australian National Heavy Vehicle Safety Strategy (NHVSS) (ATC 2003) and the New Zealand Transport Strategy (NZTS). MOT NZ (2002) stress the need to continue to improve heavy vehicle safety. One of the strategic objectives of the National Heavy Vehicle Safety Action Plan (ATC 2006) is to enhanced driver and industry management. One mechanism available to regulators for achieving this is operator accreditation.
TruckSafe was introduced in 1996 by the Australian Trucking Association as a means of raising the profile and safety performance of the trucking industry. The policy underpinning NHVAS was approved a year later as an alternative means of demonstrating compliance with mass limits and vehicle roadworthiness. The scheme itself was offered to industry in 1999 and contained modules for both mass and maintenance management. A fatigue module is currently being finalised and will be added to the scheme in 2008. WA HVA was introduced in Western Australia in 2002 as a means of promoting higher levels of safety amongst restricted access vehicles. There are also a number of commodity-specific schemes in the plastics and chemical industry, food transport industry and livestock transport industry (See Appendix A for specific details of these schemes).
The application of NHVAS accreditation as a prerequisite to granting regulatory concessions (particularly mass) was an integral part of the scheme when first introduced. This use of NHVAS continued with the Concessional Mass Limits policy in 2006 and is a central feature of the new fatigue management module, which will be available to industry in 2008. The trend of using accreditation for this purpose is expected to continue well into the future, making accreditation less than voluntary for those operators wanting to remain competitive.
Since the introduction of accreditation, a comprehensive programme of road transport reform has been developed by NTC. Those reforms include a broad range of measures aimed at enhancing compliance as an adjunct to traditional sanctions-based enforcement. Anecdotally, accreditation is considered as an effective compliance tool, although it has been difficult to accurately quantify the range of benefits.
This project was commissioned by Austroads to determine the safety benefits of accreditation. That information is required to support a package of road transport reforms that are being developed in Australia and New Zealand.
The specific objectives of the project were to:
develop an understanding of the extent to which accreditation is used by regulatory agencies as a means of improving heavy vehicle safety.
encourage a safe systems approach to the way agencies interact with the road transport industry.
foster a greater emphasis on road safety through industry management schemes.
This report is primarily aimed at achieving the first objective and by doing so assists road agencies to further the second and third objectives.

Analysis of the Safety Benefits of Heavy Vehicle Accreditation Schemes
A u s t r o a d s 2 0 0 8
— 4 —
In order to achieve the objective, transport operators, jurisdictions and other stakeholders were interviewed, data on crash rates of accredited operators and non-accredited operators were obtained and analysed, and a literature review was undertaken to determine what the experience has been in other countries and industries where accreditation schemes operate.
This report is divided into the following sections:
a rationale for the use of accreditation and how it fits within the context of broader road transport reforms
a description of the currently available accreditation schemes
an analysis of the safety benefits of accreditation
international experience with accreditation and the level of benefits that have been achieved
discussion and conclusions.

Analysis of the Safety Benefits of Heavy Vehicle Accreditation Schemes
A u s t r o a d s 2 0 0 8
— 5 —
2 RATIONALE FOR ACCREDITATION
2.1 Compliance model The transport industry is regulated to help minimise the adverse impact of heavy vehicles on road safety, the environment and road infrastructure. An additional objective is to ensure fair competition across the industry and, through enforcement and monitoring activities, prevent less scrupulous operators from gaining a competitive advantage through non-compliance. To achieve these objectives regulation and enforcement in road transport has focussed on vehicle registration, driver licensing, speed, driver behaviour, fatigue, drug and alcohol use, vehicle roadworthiness, vehicle standards and operational characteristics.
Historically, enforcement practice in road transport has employed a deterrent approach, focussing on the imposition of penalties and sanctions to achieve compliance. The effectiveness of this approach has been subject to some criticism as there has been concern that a strictly sanctions-based regime does not develop an industry culture interested in innovation and alternative approaches for improving compliance. McIntyre and Moore (2002) noted that traditional regulatory responses have not proved effective in improving compliance because:
the effectiveness of enforcement in changing behaviour depends on the perceived risk of being caught and the likely consequences. Road users know very well that the chances of apprehension are low as enforcement officers cannot cover the whole network.
fines have only a small deterrent effect on overall levels of offending as the chances of detection are low and the potential profits from offending are high3.
targeting only drivers and owners has no deterrent effect on the many “off-road” parties, such as freight forwarders and dispatchers, who have a significant influence on compliance. This leads to the perception amongst drivers that they are being treated unfairly.
the industry is characterised by high levels of competition because of the low barrier to entry.
a culture founded on confrontation between regulator and the regulated is not conducive to promoting voluntary compliance.
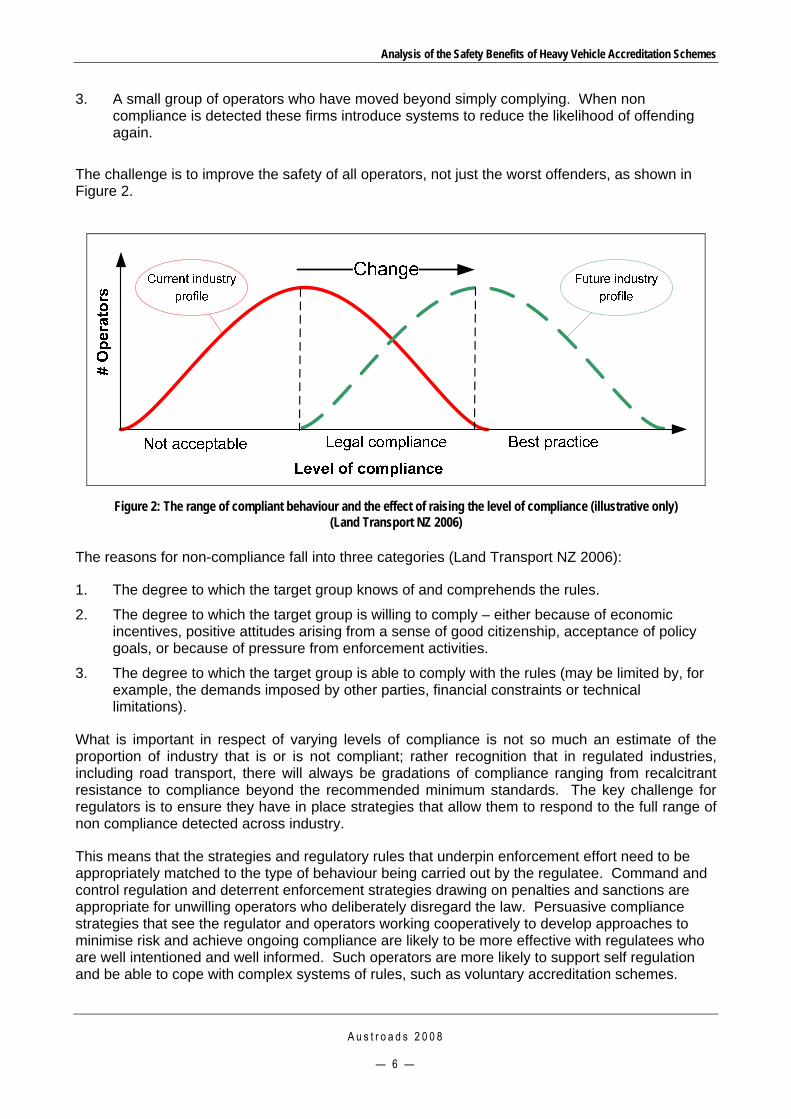
NTC and Land Transport NZ have, over a number of years, been examining ways to improve compliance levels across the industry and, as a result, are developing a range of measures that include promoting a culture of responsible or willing compliance. The reviews recognise a continuum of transport operator performance that ranges from those who criminally flout the law for commercial gain to those who adopt best practice and are industry leaders in terms of safety and sustainability. Figure 1 shows this continuum with the red line illustrating the current industry profile (Land Transport NZ 2006).
Operators can be divided into 3 broad groups:
1. A small group of operators who systematically flout the law and view compliance with the law as an avoidable overhead.
2. A large group of operators (perhaps 80% or more) who generally try to comply most of the time. Enforcement officers have found that operators in this group will, to varying degrees, break the law when it is commercially expedient to do so.
3 Most of the costs of operating a heavy vehicle are fixed at the time of purchase (finance costs, depreciation etc) and net average profits of approximately 2–7% per year are typical. Consequently overloading by 5% (about 1.5 tonne on a tractor-semi trailer) can affect profit margins by 50% or more.
Analysis of the Safety Benefits of Heavy Vehicle Accreditation Schemes
3. A small group of operators who have moved beyond simply complying. When non compliance is detected these firms introduce systems to reduce the likelihood of offending again.
The challenge is to improve the safety of all operators, not just the worst offenders, as shown in Figure 2.
Figure 2: The range of compliant behaviour and the effect of raising the level of compliance (illustrative only)
(Land Transport NZ 2006) The reasons for non-compliance fall into three categories (Land Transport NZ 2006):
1. The degree to which the target group knows of and comprehends the rules.
2. The degree to which the target group is willing to comply – either because of economic incentives, positive attitudes arising from a sense of good citizenship, acceptance of policy goals, or because of pressure from enforcement activities.
3. The degree to which the target group is able to comply with the rules (may be limited by, for example, the demands imposed by other parties, financial constraints or technical limitations).
What is important in respect of varying levels of compliance is not so much an estimate of the proportion of industry that is or is not compliant; rather recognition that in regulated industries, including road transport, there will always be gradations of compliance ranging from recalcitrant resistance to compliance beyond the recommended minimum standards. The key challenge for regulators is to ensure they have in place strategies that allow them to respond to the full range of non compliance detected across industry.
This means that the strategies and regulatory rules that underpin enforcement effort need to be appropriately matched to the type of behaviour being carried out by the regulatee. Command and control regulation and deterrent enforcement strategies drawing on penalties and sanctions are appropriate for unwilling operators who deliberately disregard the law. Persuasive compliance strategies that see the regulator and operators working cooperatively to develop approaches to minimise risk and achieve ongoing compliance are likely to be more effective with regulatees who are well intentioned and well informed. Such operators are more likely to support self regulation and be able to cope with complex systems of rules, such as voluntary accreditation schemes.
A u s t r o a d s 2 0 0 8
— 6 —

Analysis of the Safety Benefits of Heavy Vehicle Accreditation Schemes
A u s t r o a d s 2 0 0 8
— 7 —
Accreditation schemes aim to integrate compliance practice into the firm’s internal management systems.
Compliance is likely to be more effective where regulation and enforcement demonstrate a capacity to respond to different situations. This requires a raft of strategies ranging from strict punitive measures to training and persuasive engagement. Since the mid 1990s the compliance and enforcement environment in Australia and New Zealand has developed to include a broader range of strategies beyond strict command and control regulation. In their summary of approaches McIntrye and Moore (2002) note that heavy vehicle compliance strategies now include:
consistent, effective and well-targeted enforcement (enforcement-based strategies). In Australia this is being advanced through the Compliance and Enforcement Bill, which includes chain of responsibility provisions. In New Zealand this strategy is being advanced primarily through the development of the Operator Rating Scheme.
training-based strategies
privileges and incentives-based strategies, which encourage industry to take responsibility for its own performance (includes performance-based standards and accreditation-based compliance schemes)
education and communication-based strategies.
Table 2 shows the inter-relationships between types of operators, the reasons for non-compliance and potential strategies for improving safety.

Analysis of the Safety Benefits of Heavy Vehicle Accreditation Schemes
Table 2: Behaviour, compliance and strategies for improving heavy vehicle safety
Com
plian
t be
havio
ur
1. Operators who systematically flout the law
2. Operators who comply except when expediency gets in the way
3. Operators who strive for industry best practice, beyond minimum compliance levels
a). Knowledge and comprehension of the Rules
Likely to have high level of disinterest and disregard for the rules
Excellent understanding of the Rules
b). Willingness to comply
Unwilling to comply
Highly motivated to comply
Reas
ons f
or n
on-c
ompl
iance
c). Ability to comply Covert pressure from clients not to comply in order to minimise transport costs
Culture of compliance that is supported by clients
i). Enforcement-based strategies
Targeted enforcement Conventional enforcement Monitoring and self regulation
ii). Training-based strategies Training as part of restorative justice measures
Training support and enticement
Likely to have well developed training schemes
iii). Privileges/ incentives-based strategies
Limited but could form part of a restorative justice initiative
Accreditation to individual modules that only directly relate to immediate business interest
Accreditation schemes can readily be accommodated into existing management systems
Poss
ible
stra
tegi
es
iv). Education and communication-based strategies
Needs to be part of enforcement strategy to change culture of non-compliance
Advice, guidance and support to encourage compliance to higher standards
Role models / case studies for other operators. Likely to lead in initiatives of industry associations
Privileges/incentives-based and enforcement-based strategies are aimed at ensuring operators are motivated to comply by providing both positive and negative (carrot and stick) measures that encourage operators to move beyond meeting the minimum regulatory standards (Maxwell 2004), (McIntyre and Moore 2002).
The training and education/communication-based strategies are aimed at ensuring participants at all levels have the necessary skills required to comply and an understanding of how to achieve best practice.
Safety Management, Safety Systems and Safety Culture System defects need to be overcome through management effort aimed at achieving best practice. Best practice has been defined by Maxwell (2004) as requiring a “proactive and vigilant approach to eliminating and minimising risk. Duty holders must be engaged in a process of continuous improvement in health and safety. This can not be solely achieved by punishment”
A u s t r o a d s 2 0 0 8
— 8 —

Analysis of the Safety Benefits of Heavy Vehicle Accreditation Schemes
A u s t r o a d s 2 0 0 8
— 9 —
A combination of punishment and incentives is required to engender a safety culture within most organisations. Some are motivated by good corporate citizenship, however KPMG (2001) found that the most significant consequences that motivated most Chief Executive Officers (CEOs) and supervisors was the threat of company fines, personal prosecutions, the time and cost of legal action, work being stopped if safety standards were not met, lost time through workplace injuries and poor publicity. KPMG (2001) concluded that the most significant requirements that motivated CEOs and supervisors were: health and safety codes of practice and guidelines, requirements set by government, company policy on health and safety management, documented safety procedures and advice given by health and safety inspectors. These measures all engender a safety culture within the organisation.
At the most fundamental level, the stated aim of safety management systems is to improve safety through proactive management rather than reactive compliance with regulatory requirements. Safety management is seen as an integrated set of work practices, beliefs and procedures for monitoring and improving the safety and health of all aspects of an operation. It recognises the potential for errors and the need to establish robust defences to ensure that errors do not result in incidents or accidents.
The Australian Civil Aviation Safety Authority (CAVA 2002), in their work on aviation safety, noted that errors can occur at the management level – in the development of policy and procedures – in the same way that errors can occur on the flight deck, the hangar or the workshop. Safety management provides a systematic, explicit and comprehensive process for managing risks. As with all management systems, it involves goal setting, planning, documentation and the measuring of performance against goals. It becomes part of the organisation’s culture and the way people go about their work (Reason 2001) cited in (CAVA 2002).
Regardless of the size of the operation, all successful safety management systems include (but are not limited to) four key elements:
top-level management is committed to safety
systems are in place to ensure hazards are reported in a timely manner
action is taken to manage risks
the effects of safety actions are evaluated.
It is a process of closing the loop that ensures risks are identified, rectified and their re-occurrence minimised.
2.2 Privileges and incentives Governments can draw on a range of strategies in designing regulatory regimes. Different approaches to the structure of regulatory regimes influence the resources required by government and the extent to which regulation may influence economic and social activity. The most common approach to regulatory design is the command and control strategy. Here legal authority and the command of law are used to pursue policy objectives. This has been the traditional approach adopted in the regulation of the heavy vehicle industry.
An alternative, complementary, approach is to use incentives as a means of encouraging higher levels of compliance and a positive safety culture within transport operations. The types of incentives and privileges that have been used are generally:
commercial in nature resulting in benefits that include insurance discounts, marketing opportunities and as a precondition for freight contracts

Analysis of the Safety Benefits of Heavy Vehicle Accreditation Schemes
A u s t r o a d s 2 0 0 8
— 1 0 —
regulatory concessions that provide benefits such as flexibility in driving hours, less frequent roadworthiness inspections, increased weights and dimensions and reduced compliance costs
operational benefits through improved staff recruitment and retention and improved profitability.
A major judicial review of the Occupational Health and Safety Act in Victoria makes a strong case for the use of privileges and incentives as a means of encouraging the adoption of safety management practices (Maxwell 2004). The two key reasons given are:
without strong managerial support, policies aimed at preventing injuries will not be implemented within an organisation
by identifying the factors that motivate CEOs and supervisors, regulators will be able to more effectively promote health and safety.
Maxwell (2004) concluded that it does not matter if incentives:
“encourage compliance for the wrong reasons. Overwhelmingly, the public interest lies in encouraging compliance, however it is achieved”.
Maxwell (2004) found uniform support for incentives irrespective of the size of the enterprise. Organisations encouraged through the use of incentives are less demanding of enforcement resources and they avoid unnecessary antagonism between regulator and regulatee.
KPMG (2001) noted that systems-based incentives have “particular merit” for both small and large firms. These incentives would provide financial rewards based on the adoption of health and safety management systems. Rewards are, however, only ever one part of the compliance framework.
2.3 Accreditation Accreditation is a formal means of recognising operators who have good safety and other (e.g. mass) management systems in place. Those systems need to be properly documented and audited by third parties to verify that the systems have been implemented and are used on a routine basis. Third party auditing provides regulators with the confidence to grant or extend privileges and incentives.
Safety management systems include the processes required to ensure that: safe vehicles are selected, vehicles are well maintained, drivers are not fatigued and fit for duty, drivers have the required skills, vehicles are not overloaded, loads are secure and the many other factors that affect heavy vehicle safety are addressed.
Accreditation is acknowledged as an effective compliance tool in the following situations (Starrs and Moore 2003):
there are imperfect links between required safety outcomes (objectives) and legislated requirements (standards). For example, speed and hours of driving limits are prescribed for safety reasons but it is difficult to measure the actual effects on the road. What is enforced and measured is the number of breaches, which may or may not be related to safety outcomes, depending on a whole range of other factors.
Analysis of the Safety Benefits of Heavy Vehicle Accreditation Schemes
A u s t r o a d s 2 0 0 8
— 1 1 —
enforcement is difficult or costly. For example, truck use is so widespread that the cost of checking all or even a proportion sufficient to influence behaviour would involve very high costs, and the costs may not be justified depending on compliance levels. On-road enforcement is difficult in congested areas because of the effects on traffic flow or because of the means of checking (e.g. weighing vehicles).
there are limited incentives to comply if the only method of detection is on-road enforcement.
legislated standards are minimums while a high level of compliance may be desirable but difficult to achieve using legislated requirements (standards). The one size fits all approach may not produce the best results for all operators.
A number of accreditation schemes have been introduced in the transport industry in Australia. The purpose of this study is to determine what safety benefits can be derived from accreditation as a tool for improving compliance.

Analysis of the Safety Benefits of Heavy Vehicle Accreditation Schemes
A u s t r o a d s 2 0 0 8
— 1 2 —
3 ACCREDITATION SCHEMES
3.1 Accreditation schemes in Australia The three accreditation schemes of primary interest for this study are:
1. National Heavy Vehicle Accreditation Scheme (NHVAS), which is administered by the state jurisdictions and linked to the granting of regulatory concessions
2. Western Australian Heavy Vehicle Accreditation scheme (WA HVA), which is available to all operators and mandatory for B-doubles, road trains and over-dimension vehicles in Western Australia
3. TruckSafe, which is owned by the Australian Trucking Association and is primarily focused on improving road safety and business performance of operators.
A number of operators are accredited to the ISO 9000 series of standards. In New Zealand the only forms of accreditation available to transport operators are to the ISO 9000 quality system standards and Q-Base, a simplified version ISO 9000.
There are a number of sector specific schemes in Australia including PACIA (Plastics and Chemicals Industries Association), Truckcare (Australian Livestock Transport Association) and HACCAP (Hazard Analysis Critical Control Points system for food hygiene). More information on these and other accreditation schemes is included in Appendix A. Operators accredited to those schemes are often also accredited to NHVAS or TruckSafe.
3.1.1 National Heavy Vehicle Accreditation Scheme (NHVAS) NHVAS was first offered to industry in 1999 and was intended to provide transport operators with a voluntary means of demonstrating compliance with aspects of road transport law and in return accredited operators were to be subjected to less conventional enforcement.
NHVAS is currently offered in Queensland, NSW, Victoria, South Australia and Tasmania. The Northern Territory and ACT do not offer NHVAS accreditation; however, they mutually recognise and accept the accreditation of vehicles and operators from other jurisdictions. The Northern Territory is intending to offer NHVAS later in 2007. Western Australia introduced its own accreditation scheme (WA HVA) in 2002 and recognises the NHVAS maintenance management module.
Two modules have been introduced under NHVAS: mass management and maintenance management, and a third module addressing fatigue management is to be added in 2008.
Operators who are accredited to the maintenance management module must be able to demonstrate their vehicles are continuously maintained in a safe and roadworthy condition. To become accredited the operator needs to have a maintenance management system in place and provide evidence that the operation is complying with the maintenance management standards, which covers areas such as daily checks, fault reporting and fault repairs.
Operators who are accredited to the mass management module must be able to demonstrate that they are compliant 100% of the time with the relevant mass limits.
Operators accredited under the mass management and maintenance management schemes must be independently audited before accreditation can be granted and must be re-audited at regular interviews to maintain their accreditation.

Analysis of the Safety Benefits of Heavy Vehicle Accreditation Schemes
A u s t r o a d s 2 0 0 8
— 1 3 —
The claimed benefits of accreditation include:
vehicles are roadworthy
reduced infrastructure damage from overweight vehicles
improved accountability of drivers and mechanics
increased life of vehicles and reduced repairs and maintenance costs
improved safety as scheme members make regulatory compliance part of everyday operations
improved relationship with enforcement agencies
improved targeting of enforcement resources towards non-scheme operators
improved driver morale
reduced vehicle downtime.
Significant regulatory concessions are attached to NHVAS. The concessions include a 2.5-tonne increase in gross mass when operating 6-axle semi-trailer combination vehicles. When introduced, the fatigue module will provide greater flexibility in driving hours provided steps are taken to manage driver fatigue.
NHVAS is modular in nature and operators can apply for one or a number of modules. A separate application is required for each module. Because NHVAS is a national scheme, accreditation granted in one State is recognised in other States and Territories.
The schemes were designed to be voluntary with as few barriers to entry as possible. However, because of the significance of the regulatory concessions it has become less than truly voluntary for some operators.
Under the 1997 Australian Transport Council (ATC) decision to introduce accreditation, accrediting agencies have the right to recover reasonable costs. However the fees actually charged to operators for National Heavy Vehicle Accreditation range from being free in South Australia to an annual fee of $100 per operator and $27 per vehicle in New South Wales, as shown in Table 3. The jurisdictions reported that they do not recover their costs but considered that the overall public benefit to the operator and the community outweighed the costs. Some agencies reported that a proportion of annual enforcement hours previously put into heavy vehicle inspections are now allocated to other enforcement tasks.
The operators interviewed for this research were not able to quantify accreditation costs. However, all of the operators that were accredited reported benefits to their operations, arguing better management and operational effectiveness out-weighted the costs of accreditation.
Analysis of the Safety Benefits of Heavy Vehicle Accreditation Schemes
A u s t r o a d s 2 0 0 8
— 1 4 —
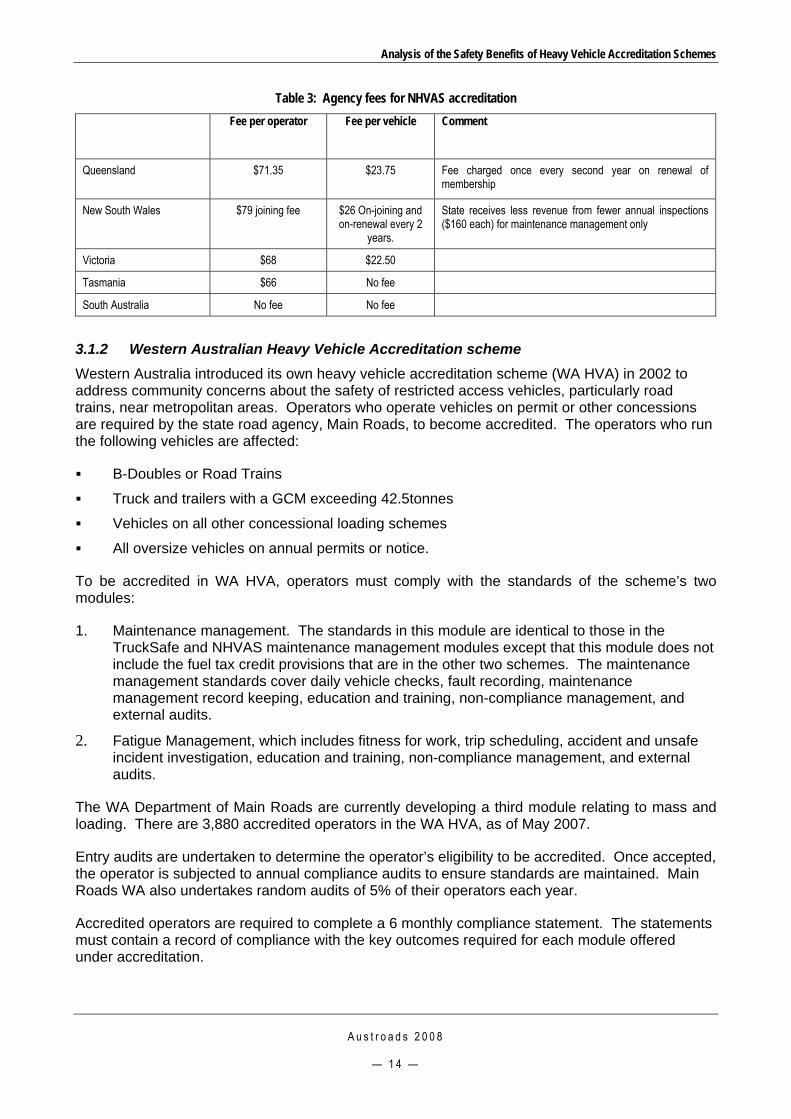
Table 3: Agency fees for NHVAS accreditation Fee per operator Fee per vehicle Comment
Queensland $71.35 $23.75 Fee charged once every second year on renewal of membership
New South Wales $79 joining fee $26 On-joining and on-renewal every 2
years.
State receives less revenue from fewer annual inspections ($160 each) for maintenance management only
Victoria $68 $22.50
Tasmania $66 No fee
South Australia No fee No fee
3.1.2 Western Australian Heavy Vehicle Accreditation scheme Western Australia introduced its own heavy vehicle accreditation scheme (WA HVA) in 2002 to address community concerns about the safety of restricted access vehicles, particularly road trains, near metropolitan areas. Operators who operate vehicles on permit or other concessions are required by the state road agency, Main Roads, to become accredited. The operators who run the following vehicles are affected:
B-Doubles or Road Trains
Truck and trailers with a GCM exceeding 42.5tonnes
Vehicles on all other concessional loading schemes
All oversize vehicles on annual permits or notice.
To be accredited in WA HVA, operators must comply with the standards of the scheme’s two modules:
1. Maintenance management. The standards in this module are identical to those in the TruckSafe and NHVAS maintenance management modules except that this module does not include the fuel tax credit provisions that are in the other two schemes. The maintenance management standards cover daily vehicle checks, fault recording, maintenance management record keeping, education and training, non-compliance management, and external audits.
2. Fatigue Management, which includes fitness for work, trip scheduling, accident and unsafe incident investigation, education and training, non-compliance management, and external audits.
The WA Department of Main Roads are currently developing a third module relating to mass and loading. There are 3,880 accredited operators in the WA HVA, as of May 2007.
Entry audits are undertaken to determine the operator’s eligibility to be accredited. Once accepted, the operator is subjected to annual compliance audits to ensure standards are maintained. Main Roads WA also undertakes random audits of 5% of their operators each year.
Accredited operators are required to complete a 6 monthly compliance statement. The statements must contain a record of compliance with the key outcomes required for each module offered under accreditation.

Analysis of the Safety Benefits of Heavy Vehicle Accreditation Schemes
A u s t r o a d s 2 0 0 8
— 1 5 —
3.1.3 TruckSafe TruckSafe was established in 1996 by the Australian Trucking Association (previously the Road Transport Forum) with the aim of raising the profile and safety performance of the trucking industry (Trucksafe 2006). It is administered by TruckSafe Pty Ltd - a wholly owned subsidiary company of the Australian Trucking Association.
TruckSafe has four modules:
1. Workplace and driver health, which is aimed at ensuring that drivers are fit for duty and that the injury prevention requirements are met. It covers the Workplace Health and Safety requirements, driver health screening (including medicals), the role of the medical practitioner, rehabilitation and fatigue management.
2. Vehicle maintenance, which is aimed at ensuring vehicles and trailers are kept in a safe and roadworthy condition. It includes the requirements for daily checks, fault reporting and recording, fault repair, scheduled maintenance, documentation, responsibilities, internal reviews, training and education. The TruckSafe maintenance module is very similar to the NHVAS maintenance management module.
3. Training, aimed at ensuring drivers are licensed and trained for the tasks that they are required to undertake.
4. Management, which is aimed at ensuring that a trucking operator has a documented business system that covers each of the standards.
TruckSafe views its modules as being the minimum a trucking business should meet for it to be a safe, responsible operation. For operators, accreditation shows that they are meeting due diligence and meeting their duty of care obligations.
Following a mandatory entry audit, audits are undertaken every two years by auditors selected and allocated by TruckSafe. TruckSafe rules require that the auditor is changed after two audits by the same auditor. Operators who fail the audits can have their accreditation removed. TruckSafe and the Plastics and Chemical Industry Association (PACIA) recently formed an alliance that will see both industry accreditation schemes enter into a process of mutual recognition of auditing standards, methodologies and skills.
Membership of TruckSafe enables operators to verify to customers and regulatory agencies that they are operating within an audited and structured business management system. This includes ensuring trucks are correctly maintained and roadworthy, driver and employee health management systems are in place and general OH&S and workplace regulatory compliance and responsibilities are followed. Having such operational and business systems in place is expected to deliver a range of benefits to the trucking firm including:
reduced maintenance costs
lower insurance costs
lower workers’ compensation costs
standardisation within the operation
duplication eliminated
reduced downtime, roadside breakdowns and re-work.
improved employee health
increased productivity
Analysis of the Safety Benefits of Heavy Vehicle Accreditation Schemes
A u s t r o a d s 2 0 0 8
— 1 6 —
improved road safety
evidence for clients that the operator has good management systems in place and is managing its Chain of Responsibility and Duty of Care obligations.
Evidence from the industry that TruckSafe delivers benefits is reflected by the fact that National Transport Insurance (NTI) (a strong supporter of TruckSafe) offers significant premium discounts to accredited operators.
TruckSafe is not able to offer the regulatory concessions that are available to those accredited to the NHVAS accreditation scheme.
3.2 Comparison of NHVAS, WA HVA and TruckSafe Table 4 compares the main features of NHVAS, WA HVA and TruckSafe.

Analysis of the Safety Benefits of Heavy Vehicle Accreditation Schemes
A u s t r o a d s 2 0 0 8
— 1 7 —
Table 4: Comparison of the main schemes
Name NHVAS WA HVA TruckSafe
Purpose Alternative means of showing compliance
Based on OHS approach to managing safety through regulatory means
Improve the road safety performance of trucking operations.
Principles Voluntary although becoming less so as access to regulatory concessions is linked to accreditation status.
Mandatory for B-doubles, ODs and road trains. Voluntary for all other trucks
Voluntary scheme
Scheme inception 1999 2002 1996
Ownership National scheme administered by each State Western Australia (State) Industry (nationwide)
Modules
Fundamentals of Safety Yes Yes Yes
Regulatory Yes Yes No
Maintenance Yes Yes Yes
Driving Hours To be introduced in 2008 Yes No
Driver skill (including load security) No
No
(WA intends to add a load management module (mass, dimensions and load restraint)
Yes
Driver wellness No Yes Yes
Mass management Yes No No
Workplace OHS No Yes Yes
Incentives Exemption from NSW periodic vehicle inspections if maintenance accredited
Mandatory for restricted access vehicles Insurance premium discounts
Lower vehicle maintenance costs Lower vehicle maintenance costs Lower vehicle maintenance costs
Increased route access Route access Lower worker compensation costs
Driving hours flexibility from 2008 Driving hours flexibility Marketing advantage
Increased mass limits
Fees $0 to $100 per operator and $0 to $22.50 per vehicle depending on the jurisdiction. Audit fee $60 to $770 for 10 vehicle fleet
$225 administration fee for a 3 year period irrespective of fleet size plus audit costs
Fleet of 10 trucks: application $984, Admin $837, Audit $693
The number of powered units accredited to NHVAS and TruckSafe on the 31st December 2005 are shown in Table 5 and Figure 3. The NHVAS vehicle counts are based on the accreditation records of RTA NSW, VicRoads and Queensland Transport and include vehicles that are registered in all Australian States and Territories. TruckSafe vehicle counts were extracted from the accreditation data supplied by TruckSafe Pty Ltd.

Analysis of the Safety Benefits of Heavy Vehicle Accreditation Schemes
Table 5: Number of powered units accredited on 31st December 2005
Accreditation status (total in each scheme and module) Powered units
TruckSafe accredited 6,632
NHVAS Mass Management accredited 6,844
NHVAS Maintenance Management accredited 11,856
Accredited to one or more of the schemes 19,998
Discrete subsets of the 19,998 powered units accredited (see figure 3)
TruckSafe only 3,328
Mass only 4,535
Maintenance only 7,574
Mass and Maintenance only 1,257
TruckSafe and Mass only 279
TruckSafe and Maintenance only 2,252
TruckSafe, Mass and Maintenance only 773
Figure 3 shows the proportion of powered units accredited to the combinations of schemes and their modules. An analysis of these results shows that 83% of the accredited powered units are accredited to one or more NHVAS modules and 33% are accredited to TruckSafe. Approximately ½ of TruckSafe accredited powered units are also accredited to one or both of the NHVAS modules.
Powered units accredited to NHVAS and/or TruckSafe on 31 Dec 2005
Trucksafe and Maintenance
11%
Trucksafe, Mass and
Maintenance4%Trucksafe and
Mass1%
Mass and Maintenance
6%
Maintenance only38%
Mass only23%
Trucksafe only17%
Figure 3: Proportion of powered units accredited to TruckSafe and NHVAS
3.3 Australian national scheme for auditing The supply and quality of audits has been an issue for the NHVAS, WA HVA and TruckSafe scheme owners. Each scheme had its own auditor certification process and many of the auditors were limited to the one scheme. This resulted in the lack of a robust process for maintaining the quality of the auditors and the audits they undertake. It also resulted in duplicate audits for the operators that belonged to more than one accreditation scheme.
A u s t r o a d s 2 0 0 8
— 1 8 —

Analysis of the Safety Benefits of Heavy Vehicle Accreditation Schemes
A u s t r o a d s 2 0 0 8
— 1 9 —
Following a review by NTC, a single national scheme for the certification of heavy vehicle auditors has been established. RABQSA International has been appointed as the manager of the scheme. This arrangement commenced from October 2006. The collaboration between the scheme owners to reach agreement on a new national auditor certification scheme highlighted the degree of commonality between the maintenance management modules of the three main schemes (NHVAS, WA HVA and TruckSafe). In fact, a single auditor-reporting format was developed for use by all three schemes and introduced with the new auditor certification arrangements.

Analysis of the Safety Benefits of Heavy Vehicle Accreditation Schemes
4 ANALYSIS OF THE SAFETY BENEFITS OF ACCREDITATION
4.1 Method used to determine the safety benefits The safety benefits of NHVAS and TruckSafe accreditation have been estimated through the use of the accreditation and crash data supplied by VicRoads, RTA, Queensland Transport, TruckSafe, NTI and the Australian Bureau of Statistics (ABS). Extraction of some of the data required manual data matching and was supplied to the researchers on a confidential basis.
The analyses was limited to Vic, NSW and Qld because of the difficulties in combining data from different jurisdictions given that each state has its own data collection protocols and has its own unique data field definitions. Vic, NSW and Qld were selected because they border each other; they are the most populous states with approximately 75% of all registered combination vehicles, and there is limited interstate travel with other states and territories. Only 6% of crashes in Vic, NSW and Qld involved combination vehicles registered in other States and Territories. The confounding influence of inter-state travel was reduced further by deleting from the data all crashes that involved vehicles not registered in Vic, NSW or Qld.
The analysis was restricted to combination vehicles because approximately 85% of the NHVAS accredited vehicles were of this type in 2005. Only a small proportion of the rigid vehicle fleet is accredited and those vehicles are generally confined to specialist fleets such as concrete delivery.
Figure 4 shows the relationships between the datasets used in the analysis.
NHVAS accreditation data combined for NSW, VIC and Qld
TruckSafe accreditation data
Crash data NSW, VIC and Qld combined
Matched through vehicle registration number
Australian Bureau of Statistics exposure data
Calculation of crash rates
Figure 4: Schematic diagram showing inter-relationships between data sets Vehicle registration numbers were used to link the crash and accreditation data sets across the three jurisdictions. The crash data sets each contained a small proportion of crashes where the vehicle registration numbers were not known. In those cases the crash data was removed from the crash set irrespective of vehicle type or accreditation status. These vehicles are unlikely to be different to the general population except their registration numbers were not available.
Accredited vehicle crashes were identified by matching vehicle registration numbers in the crash data sets with the registration numbers of the accredited vehicles. When a match was made, the entry and/or exit accreditation dates were checked to see if the vehicle was accredited at the time of the crash. If the vehicle was not accredited, or if the vehicle registration number of the crashed vehicle was not in any of the accreditation sets, the crash was counted as a non-accredited crash.
A u s t r o a d s 2 0 0 8
— 2 0 —

Analysis of the Safety Benefits of Heavy Vehicle Accreditation Schemes
A u s t r o a d s 2 0 0 8
— 2 1 —
The Trucksafe data was made available very late in the project, when time and resource constraints meant that it was no longer possible to combine the Trucksafe and NHVAS datasets. As a result TruckSafe and NHVAS have been analysed on their own and compared against the crash rate of non-NHVAS accredited vehicles. Approximately 7% of the non-NHVAS accredited group were Trucksafe accredited. The inclusion of TruckSafe-only accredited vehicles in the non-accredited group will improve the crash rate of the non-accredited group if TruckSafe accredited vehicles were, on average, safer than vehicles not accredited. The crash rates of both NHVAS and TruckSafe accredited vehicles included vehicles accredited to the other scheme. The effect of this interdependency or ‘cross pollination’ will tend to further average the results, especially when comparing TruckSafe with NHVAS.
Data for the three year period from 1st January 2003 to 31st December 2005 was used in the analysis. Accreditation entry and exit dates were used to determine the number of years (or parts there of) that a vehicle had been accredited. Vehicle-years was used as the measure of exposure, which means that, for example, a vehicle accredited for the full three years has a vehicle-year value of three. The exposure of the total population was calculated from the ABS Motor Vehicle Census 9309.0 (2005) data by summing the number of combination vehicles over the years and jurisdictions studied. ABS data for a gross combination mass (GCM) range from 3 tonnes to 100 tonnes and over was used. Ninety five percent of these vehicles have a GCM of between 20 tonnes and 100 tonnes (ABS 2005). The non-accredited vehicle-years is equal to the difference between the total vehicle-years less the accredited combination vehicle-years. The crash rates were calculated by using the total number of crashes involving accredited (or non-accredited vehicles) over the three-year period divided by the total number of accredited (or non-accredited) vehicle-years in the three states.
Figure 5 provides an overview of the methodology used to estimate the accredited and non-accredited crash rates. The raw accreditation and crash sets were pre-processed by removing most of the dependencies and by rearranging the data into a standard format. Note that the ‘cross pollination’ of accredited vehicles between accreditation schemes did still exist. Removing the dependencies means that any duplicate accredited vehicle entry and any accreditation across multiple jurisdictions were identified and sorted uniquely. Also duplicate crashes were identified and sorted uniquely. The former ensures that the exposure term for a particular accredited vehicle was counted only once. The latter ensures that a crashed vehicle is only counted once. The pre-processed accreditation and crash data sets were then filtered by jurisdiction-dependent combination vehicle types.
Statistical hypothesis tests were conducted to determine if the differences between accredited and non-accredited crash-rates were statistically significant. The hypothesis was tested with the z-test using a 95% level of significance.

Analysis of the Safety Benefits of Heavy Vehicle Accreditation Schemes
Accreditation SetsVic, NSW, Qld
PreprocessRemove dependencies
Standardise format
PreprocessRemove dependencies
Standardise format
Cross-Match Articulated VehicleRegistration Numbers
Count ArticulatedVehicle Crashes
Accredited & Non-accredited
Count ArticulatedVehicle.Years
Accredited
Crash RatesAccredited & Non-accredited
95% confidence intervals
Crash SetsVic, NSW, Qld
Total Articulated Vehicle.YearsABS Motor Vehicle Census 9309.0
Vic, NSW, Qld
Hypothesis Testsz-Tests @ 95% level of significance
Articulated Vehicle TypeCrash FiltersVic, NSW, Qld
Articulated Vehicle TypeAccreditation Filters
Vic, NSW, Qld
Figure 5: Schematic diagram of the methodology
4.1.1 Assumptions Due to the incompleteness of information in some of the accreditation and crash sets, the following three assumptions were made:
1. All non-accredited combination vehicle crashes in Qld were assumed to be non-accredited combination vehicles from Vic, NSW or Qld.
2. All NHVAS accredited vehicles in NSW were assumed to be maintenance management accredited.
A u s t r o a d s 2 0 0 8
— 2 2 —
Analysis of the Safety Benefits of Heavy Vehicle Accreditation Schemes
A u s t r o a d s 2 0 0 8
— 2 3 —
3. The vehicle types deduced from the VINs were representative of the actual vehicle types in the NSW NHVAS accreditation set.
The first assumption was necessary because the Queensland crash data did not include the jurisdiction in which a crashed vehicle was registered. It was possible to determine the jurisdiction for accredited vehicles from the accreditation records. This assumption will only have a minor effect on the results because nearly all of the crashes in Victoria, NSW and Qld involved vehicles registered in one of those States. An analysis of the 5,285 combination vehicle crashes in Vic and NSW found that 94% of those vehicles were registered in Victoria, NSW, and Qld. NSW and Victoria are likely to have more inter-state traffic than Qld because of Qld’s location. Other than NSW, the only other jurisdiction bordering Qld is the Northern Territory which had only 1% of the total combination vehicles in Australia for the years studied (ABS 2005).
The second assumption applies only to the statistical analysis comparing the crash rate of NHVAS mass management and maintenance management accredited vehicles. It was necessary because the NSW accreditation database did not include fields that indicated whether the vehicle was mass or maintenance accredited. The assumption does not have a major effect because, for the years 2003 and 2004, 91% of the NHVAS accredited combination vehicles in NSW were maintenance accredited (RTA 2004).
The third assumption was necessary because the NSW NHVAS accreditation data set did not include a vehicle type descriptor. However it did include the vehicle identification number (VIN). The VIN number includes a vehicle manufacturer’s identifier, which enabled powered units to be separated from trailers. Combination vehicles could then be deduced from the number of powered units and trailers. Using this method it was estimated that in 2004, 53% of the NHVAS accredited vehicles were combination vehicles. The RTA advised that analysis of their own records indicates that 55% of the NSW accredited vehicles in NSW were combination vehicles (RTA, 2004). Given this level of corroboration, it seems reasonable to assume that the VIN data could be used to estimate the number of combination vehicles in 2003 through 2005.
The equations and variables used in the analysis are defined in Appendix B.
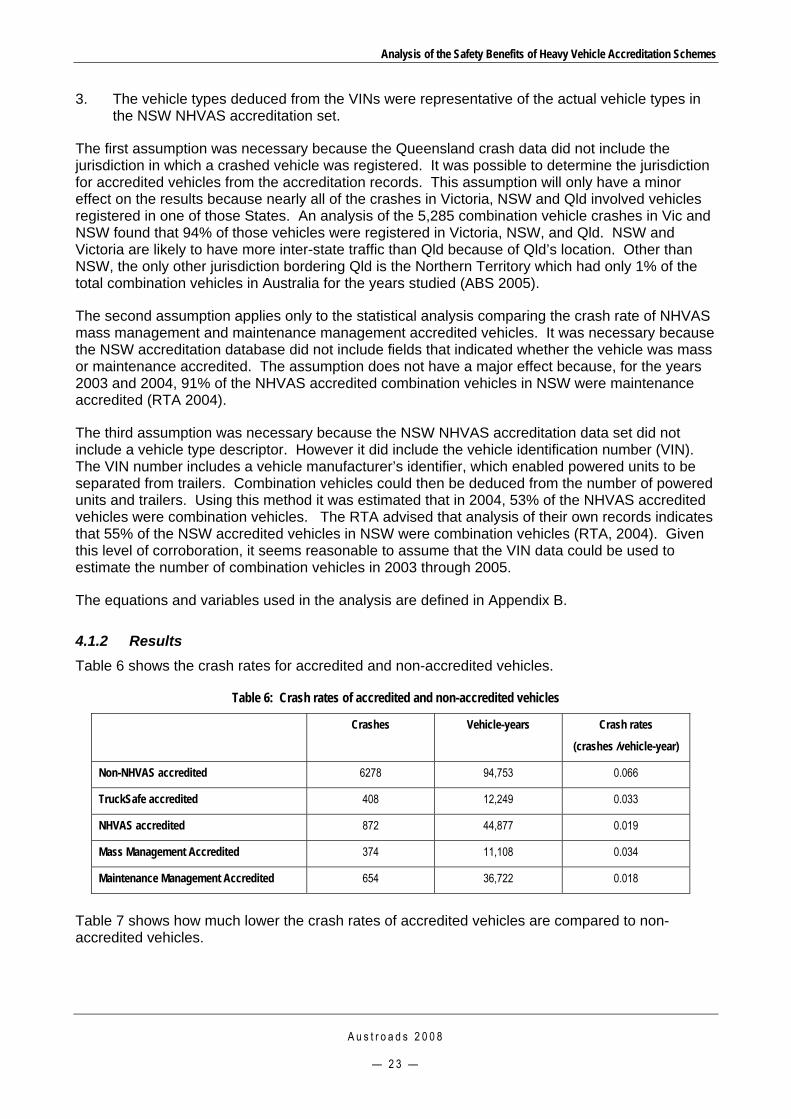
4.1.2 Results Table 6 shows the crash rates for accredited and non-accredited vehicles.
Table 6: Crash rates of accredited and non-accredited vehicles
Crashes Vehicle-years Crash rates
(crashes /vehicle-year)
Non-NHVAS accredited 6278 94,753 0.066
TruckSafe accredited 408 12,249 0.033
NHVAS accredited 872 44,877 0.019
Mass Management Accredited 374 11,108 0.034
Maintenance Management Accredited 654 36,722 0.018
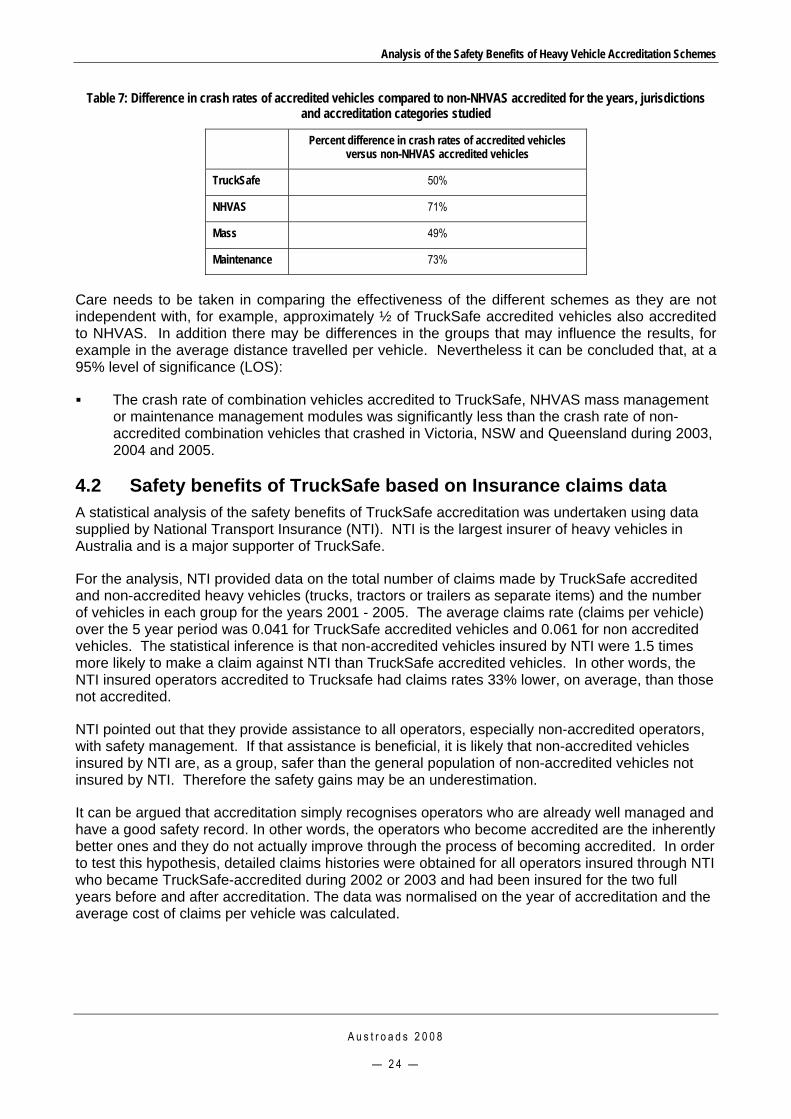
Table 7 shows how much lower the crash rates of accredited vehicles are compared to non-accredited vehicles.
Analysis of the Safety Benefits of Heavy Vehicle Accreditation Schemes
A u s t r o a d s 2 0 0 8
— 2 4 —
Table 7: Difference in crash rates of accredited vehicles compared to non-NHVAS accredited for the years, jurisdictions and accreditation categories studied
Percent difference in crash rates of accredited vehicles versus non-NHVAS accredited vehicles
TruckSafe 50%
NHVAS 71%
Mass 49%
Maintenance 73%
Care needs to be taken in comparing the effectiveness of the different schemes as they are not independent with, for example, approximately ½ of TruckSafe accredited vehicles also accredited to NHVAS. In addition there may be differences in the groups that may influence the results, for example in the average distance travelled per vehicle. Nevertheless it can be concluded that, at a 95% level of significance (LOS):
The crash rate of combination vehicles accredited to TruckSafe, NHVAS mass management or maintenance management modules was significantly less than the crash rate of non-accredited combination vehicles that crashed in Victoria, NSW and Queensland during 2003, 2004 and 2005.
4.2 Safety benefits of TruckSafe based on Insurance claims data A statistical analysis of the safety benefits of TruckSafe accreditation was undertaken using data supplied by National Transport Insurance (NTI). NTI is the largest insurer of heavy vehicles in Australia and is a major supporter of TruckSafe.
For the analysis, NTI provided data on the total number of claims made by TruckSafe accredited and non-accredited heavy vehicles (trucks, tractors or trailers as separate items) and the number of vehicles in each group for the years 2001 - 2005. The average claims rate (claims per vehicle) over the 5 year period was 0.041 for TruckSafe accredited vehicles and 0.061 for non accredited vehicles. The statistical inference is that non-accredited vehicles insured by NTI were 1.5 times more likely to make a claim against NTI than TruckSafe accredited vehicles. In other words, the NTI insured operators accredited to Trucksafe had claims rates 33% lower, on average, than those not accredited.
NTI pointed out that they provide assistance to all operators, especially non-accredited operators, with safety management. If that assistance is beneficial, it is likely that non-accredited vehicles insured by NTI are, as a group, safer than the general population of non-accredited vehicles not insured by NTI. Therefore the safety gains may be an underestimation.
It can be argued that accreditation simply recognises operators who are already well managed and have a good safety record. In other words, the operators who become accredited are the inherently better ones and they do not actually improve through the process of becoming accredited. In order to test this hypothesis, detailed claims histories were obtained for all operators insured through NTI who became TruckSafe-accredited during 2002 or 2003 and had been insured for the two full years before and after accreditation. The data was normalised on the year of accreditation and the average cost of claims per vehicle was calculated.

Analysis of the Safety Benefits of Heavy Vehicle Accreditation Schemes
A u s t r o a d s 2 0 0 8
— 2 5 —
It was found that the total cost of claims during the two years after accreditation was 57% lower than during the two years before accreditation. For the operators with 10 or fewer powered units, the reduction was 38%. The average cost of a claim did not change i.e. it cost as much to repair an accredited vehicle as a non-accredited vehicle. These results suggest that operators improve through the process of becoming accredited. However some care is required with these results as the sample size was small (13 operators, of whom 10 had 10 or fewer powered units).
4.3 Anecdotal evidence of the safety benefits of NHVAS and TruckSafe
Anecdotal evidence of the safety benefits of accreditation were obtained by interviewing a wide range of stakeholders. The stakeholders that were interviewed included:
Transport operators ranging from single truck owner-drivers through to large transport operators with over 1,000 employees. The goods they transported included general freight, livestock, fresh produce, logs, dairy produce, building supplies and dangerous goods. Their operations ranged from local urban delivery using single trucks, interstate freight distribution using articulated vehicles to road trains operating in remote areas.
Senior officials from Queensland Transport, VicRoads, RTA NSW, Main Roads WA, Department of Infrastructure Victoria, South Australian Department of Transport, Energy and Infrastructure (DTEI), Department of Transport and Regional Services (DOTARS) and Land Transport NZ
auditors involved in auditing accreditation schemes
consultants advising the industry
scheme providers (TruckSafe, NHVAS, WA HVA and PACIA)
insurers
industry associations (ATA and VTA)
purchasers of transport services.
In addition a project review meeting was held at NTC with representatives from state and federal transport authorities, the transport industry, TruckSafe, and insurers.
The operators who were contacted were generally very supportive of accreditation as a concept but concerned about the current administrative arrangements. The level of support for accreditation is demonstrated by the number of operators accredited by TruckSafe, a self-funded voluntary scheme that offers few inducements other than insurance discounts.
Operators join TruckSafe and the other industry schemes because accreditation helps to differentiate them in the marketplace from the low cost operators who gain commercial advantage by flouting the law. One accredited operator reported that even with good systems in place, good operators are still at a 3% to 5% commercial disadvantage to those that flagrantly flout the law by, for example overloading, ignoring maintenance and exceeding driver hours. By being accredited they could claim to be operating safely and within the law. This has become increasingly important with the introduction of the chain of responsibility requirements.
Operators who became accredited noted improvements in company culture and their management systems. Accreditation made internal processes easier to manage and the external audits helped to drive change within their companies. Some operators have noticed major changes in the behaviour of their subcontractors who have become accredited. After accreditation the sub-contracted operators tended to be more open, better at communicating, more professional and willing to exchange information with their peers.
Analysis of the Safety Benefits of Heavy Vehicle Accreditation Schemes
A u s t r o a d s 2 0 0 8
— 2 6 —
Most of the operators interviewed were not able to quantify the actual costs or benefits of accreditation. They all, however, were of the view that the benefits outweighed the costs including the cost of implementation and audits. The benefits they mentioned were often largely intangible and included improvements to other, non-safety related, aspects of the business that resulted from having more formal management systems in place.
The reasons stated for joining industry schemes such as TruckSafe included:
being required to be accredited as part a cartage contract requirement. This is often driven by their client’s concerns about legal liability under the duty of care and chain of responsibility requirements.
to improve safety
to reduce costs including insurance
to reduce breakdowns. Breakdowns are expensive and upset clients through late deliveries
to improve company image, which helped to retain and attract new business
to ensure subcontractors are up to standard thereby minimising risk to their own reputation
to managing their legal and financial risks by adopting good management practices.
The primary reason why operators became NHVAS accredited rather than TruckSafe was to gain the regulatory concessions. WA HVA is mandatory for certain classes of vehicles. Very few operators of other vehicle classes join voluntarily although there is the provision for them to become accredited.
The purchasers of transport services reported that, for them, accreditation provided a means of managing risk, especially the legal burdens associated with the chain of responsibility, duty of care, food safety, animal welfare, dangerous goods and other provisions.
Insurance providers reported that the benefits to them were in managing potential losses and by providing a form of market differentiation. A recent National Transport Commission (NTC) report on speed behaviour of heavy vehicle drivers highlighted the influence company management practices have on speeding (AMR Interactive 2006). A survey of drivers found that at least a quarter of the drivers frequently experienced pressure to drive over the speed limit. “Pressure to meet deadlines” was by far the most common reason raised in the survey as to why drivers speed, by two-thirds of the drivers. As many as 20% of the drivers reported that they were speeding on at least half of their trips even though the vehicle was supposed to be speed limited. Operators promoting safe driving were found to be an effective way to influence the speed behaviour of drivers on the road. In the survey only half of the drivers reported that their company promoted a “do not speed” policy. A similar proportion promoted to drivers that “you must be on time for your deliveries”. This suggests that company policy has a significant influence on on-road driving behaviour.

Analysis of the Safety Benefits of Heavy Vehicle Accreditation Schemes
A u s t r o a d s 2 0 0 8
— 2 7 —
5 INTERNATIONAL INDICATORS OF THE BENEFITS OF ACCREDITATION
There are a number of audit-based schemes in use in other countries that are also aimed at improving safety through better operator management practices. Those schemes fall into two groups:
1. Voluntary schemes (similar to TruckSafe and ISO 9000 certification)
2. Mandatory schemes that are part of regulatory environment (similar to the Western Australian approach).
5.1 Voluntary schemes A major synthesis study undertaken by the U.S. Federal Motor Carrier Safety Administration (FMCSA) that used a panel of experts and surveys of industry found that voluntary certification programmes hold much promise. However the effectiveness of such schemes has not been thoroughly evaluated (FMCSA 2003).
The evidence that is available on the effectiveness of some of the voluntary schemes is summarised below.
5.1.1 ISO 9000 quality management A number of transport operators are certified to one or more of the ISO 9000 family of international quality management standards that are administered by ISO, a world-wide non-governmental organization (http://www.iso.org/iso/en/ISOOnline.frontpage). ISO 9000 currently includes three quality standards: ISO 9000:2005, ISO 9001:2000, and ISO 9004:2000. ISO 9001:2000 presents requirements, while ISO 9000:2005 and ISO 9004:2000 present guidelines. All of these are process standards (not product standards). Conforming to these standards provides proof that a company has implemented state-of-the-art management practices. In the past transport operators were typically certified to ISO 9002:1994 but that standard has been superseded by the three standards mentioned above.
A recent statistical analysis of U.S. transport operators (called motor carriers in the U.S.) compared the safety and financial performance of operators before and after they had become ISO 9002: 1994 certified (Naveh and Marcus 2006). Only a small percentage of transport operators were ISO 9002: 1994 certified in the U.S. and carted mainly for the automotive and dangerous goods industries. These operators generally have good management systems in place because of the demands set by their customers. ISO 9002:1994 required them to be externally audited twice per year. Each of the ISO certified operators were compared to 20 un-certified operators that had the closest matching characteristics in terms of the type of goods transported, distance travelled and company size.
The datasets were:
The Federal Department of Transportation SAFER data set, which included the safety performance of all U.S. operators.
The American Trucking Association financial data on all U.S. operators.
The McGraw-Hill data on all ISO 9000 registered companies in the U.S.

Analysis of the Safety Benefits of Heavy Vehicle Accreditation Schemes
A u s t r o a d s 2 0 0 8
— 2 8 —
The final data set contained forty ISO 9002: 1994 certified operators and 1,742 non-certified operators. The study found that:
Before certification, the operators were not significantly safer than the control group of non-certified operators.
After certification the certified operators were significantly safer than the non-certified operators.
Naveh and Marcus (2006) found that in the two years after ISO certification, 90% of the operators had significantly improved their financial performance (return on assets). The remainder stayed the same and none became significantly worse. Of the control group, between 11% and 27% improved while the remainder did not change or worsened their financial performance.
It would appear that the improvements flow primarily from the overall ISO 9002: 1994 process affecting all of the operator’s management and operational practices including driver training, vehicle maintenance and overall safety management.
Operators with better financial performance are more likely to become certified.
The overriding conclusion is that quality standards such as ISO 9000 can play a useful role in improving safety and financial performance.
The report notes that the effect on safety does depend on a variety of factors including: the reason the company became certified, the auditors and consultants used, and the process and contents of the certification. The size and viability of the company are also likely to be important.
In the view of the authors:
“With ISO 9000 in place, motor carrier regulators can feel more confident that a carrier is likely to exhibit good driving practices and fewer accidents” (Naveh and Marcus 2006).
5.1.2 American Chemistry Council Responsible Care programme Responsible Care is a global chemical industry initiative that has been implemented in the United States through the American Chemistry Council. Every American Chemistry Council member must adhere to the requirements of Responsible Care, which includes ensuring that their management systems are certified by independent, accredited auditors.
Responsible Care members are required to evaluate transport operators prior to hiring and must then work with the transport operators they use to ensure safe and secure delivery of their chemical products. Since 1995, the total number of incidents that were reported to the US Department of Transport involving vehicles transporting goods for Responsible Care members has declined by 35 percent. At the same time the volume of chemicals shipped increased 11 percent as shown in figure 6.

Analysis of the Safety Benefits of Heavy Vehicle Accreditation Schemes
Figure 6: Reduction in crashes experienced by American Chemistry Council
Responsible Care programme
5.1.3 CSA carrier safety management system The Canadian Standards Association (CSA) has developed an operator safety management certification programme (FMCSA 2003). It is a voluntary programme designed to evaluate and qualify a transport operator’s safety management system to an established set of requirements based on CSA’s B619-00 Carrier Safety Management Systems standard. The standard applies basic management system principles, but from a safety management perspective. To complement this standard, CSA has also designed a qualification programme, so that safety management efforts can be audited by an independent third party; CSA International.
The CSA Carrier Safety Management Systems Program is relatively new (Drew 2002). CSA supports its potential effectiveness with evidence of positive safety results in other industries where CSA certification is applicable. It has completed two case studies of operators that implemented a Carrier Safety Management System. The case studies indicate that the operators experienced improvements in quantitative measures obtained from the Commercial Vehicle Operator Registration data after implementing the Carrier Safety Management System. The measures relate to driver performance, vehicle condition and convictions, and are derived from safety inspections conducted by the Ministry of Transportation. Information on relative improvements in crash rates were not included in the case study summaries.
A u s t r o a d s 2 0 0 8
— 2 9 —

Analysis of the Safety Benefits of Heavy Vehicle Accreditation Schemes
A u s t r o a d s 2 0 0 8
— 3 0 —
5.2 Mandatory schemes
5.2.1 Mandatory safety management in Canada Canadian law requires transport operators to have good safety management systems in place. The Canadian requirements are similar to aspects of TruckSafe and NHVAS, e.g. requiring drivers to undertake daily vehicle checks and requiring operators to go through third-party fleet audits. The Canadian requirements are specified in their National Safety Code, which is administered by the Canadian Council of Motor Transport Administrators (CCMTA), a non-profit organisation set up by the provincial, territorial and federal ministries of transport (CCMTA 1988). The National Safety Code was created to ensure that commercial vehicle safety did not deteriorate in a deregulated environment. It has the mandate from, and reports to, the Canadian Council of Ministers responsible for transportation and highway safety. The provinces and territories of Canada are progressively introducing the code as a mandatory requirement.
In implementing the National Safety Code, Ontario has taken a four-pronged approach, involving:
safety standards
detection
deterrents
incentives.
The programmes that have been implemented aim to identifying both safe and unsafe carriers so enforcement resources can be targeted. Strong deterrents have been introduced as a means of encouraging compliance. Sanctions include the removal of the operator’s operating privileges and plates and the impoundment of vehicles with critical defects. Fines of up to $50,000 can be imposed if a truck or trailer wheel comes loose.
Meaningful incentives have been introduced as a means of making safety pay. This includes: pre-clearance at borders for safe operators, fee exemptions, and the names of operators with ‘excellent’ and ‘unsatisfactory’ ratings being published on the internet (www.carriersafetyrating.com). The insurance industry has responded by rewarding operators that have better safety records with reduced insurance premiums. Some contracts (eg contracts with the big three automakers) now require a satisfactory or excellent rating.
Ontario now has the lowest number of fatalities per 10,000 drivers in North America (MTO Ontario 1993; MTO 2003). Truck-related fatalities are historically at their lowest level, reducing from 300 in 1996 to 99 in 2004. Vehicle out-of service level defects recorded during the annual RoadCheck campaign have reduced from 43% to 22%. Wheel separations are down from 215 in 1996 to 61 in 2004.
5.2.2 U.S. compliance reviews In the US, enforcement and compliance centres on the North American Commercial Vehicle Safety Alliance requirements (CVSA, www.cvsa.org). Those requirements are risk-based, with out-of-service level faults being a primary indicator of poor safety performance.
The two primary enforcement activities are roadside inspections and compliance reviews. Over two million roadside inspections are undertaken each year by the state enforcement agencies at fixed sites (mainly at weigh stations) and roadside locations e.g. public rest areas. Approximately half of the inspections are undertaken at fixed sites (Lantz 1994).

Analysis of the Safety Benefits of Heavy Vehicle Accreditation Schemes
A u s t r o a d s 2 0 0 8
— 3 1 —
Using data from roadside inspections, public complaints, crash history and other sources, operators are targeted for in-depth FMCSA compliance reviews (audits). In addition, some reviews are undertaken on a random basis. The compliance reviews are aimed at ensuring that operators have in place good safety management systems.
Moses and Savage (1996) found that roadside inspections and compliance reviews are complementary in identifying the worst operators. Operators who do poorly during a roadside inspection do not necessarily perform poorly during a compliance review (and vice versa). Moses and Savage (1996) found that the 2.5% of the operators who were the worst offenders in the US had crash rates that were twice the mean of all trucking operations.
Moses and Savage (1995) found that FMCSA compliance reviews were cost–effective, with a benefit-to-cost ratio of 4:1, compared to roadside inspections, which had a benefit-to-cost ratio of, at best, 1.6:1. The difference is primarily because of the review’s focus on the safety management system used by the operator. Any improvements initiated as a result of the review tend to deliver long-term safety benefits.
A study undertaken by the John A. Volpe National Transportation Systems Center (2005) evaluated the effectiveness of the 12,000 compliance reviews undertaken in 2002. The evaluation compared the crash rates of operators in the 12 months before they received the compliance review with their crash rates in the 12 months after. Table 8 shows the change in crash rate by operator size. They found that the benefits are likely to continue beyond the 12 month period.
Table 8: Effectiveness of FMCSA compliance reviews by fleet size
Size of operation (number of powered units)
Number of operators Pre-compliance review crash rate
(crashes/vehicle)
Percentage reduction in average crash rates
1 – 5 3,497 0.0920 49.8
6 – 20 3,503 0.0567 30.2
21 – 100 1,810 0.0453 9.1
≥101 362 0.0306 -1.4
All operators 9,172 0.0403 12.6
Source: (John A. Volpe National Transportation Systems Center 2005)
These results show significant reductions in the crash rates, especially for smaller operators, as a result of the compliance reviews. The largest operators did not show the same gains as they already had low crash rates.
Moses and Savage (1994) have undertaken an analysis of data on 75,000 operators to determine the effects of operator characteristics on crash rates. They reported that a group of operators that, on average, travel 800,000km per year had a crash rate about half that of the smallest operators who travel less than 120,000km per year. The largest operators had crash rates about one third of those of the smallest operators. Because of the relatively short distance the small operators travel, their individual crash rate per million km was found to be an unreliable indicator of their safety, as statistically each one could drive for a number of years without being involved in a crash.
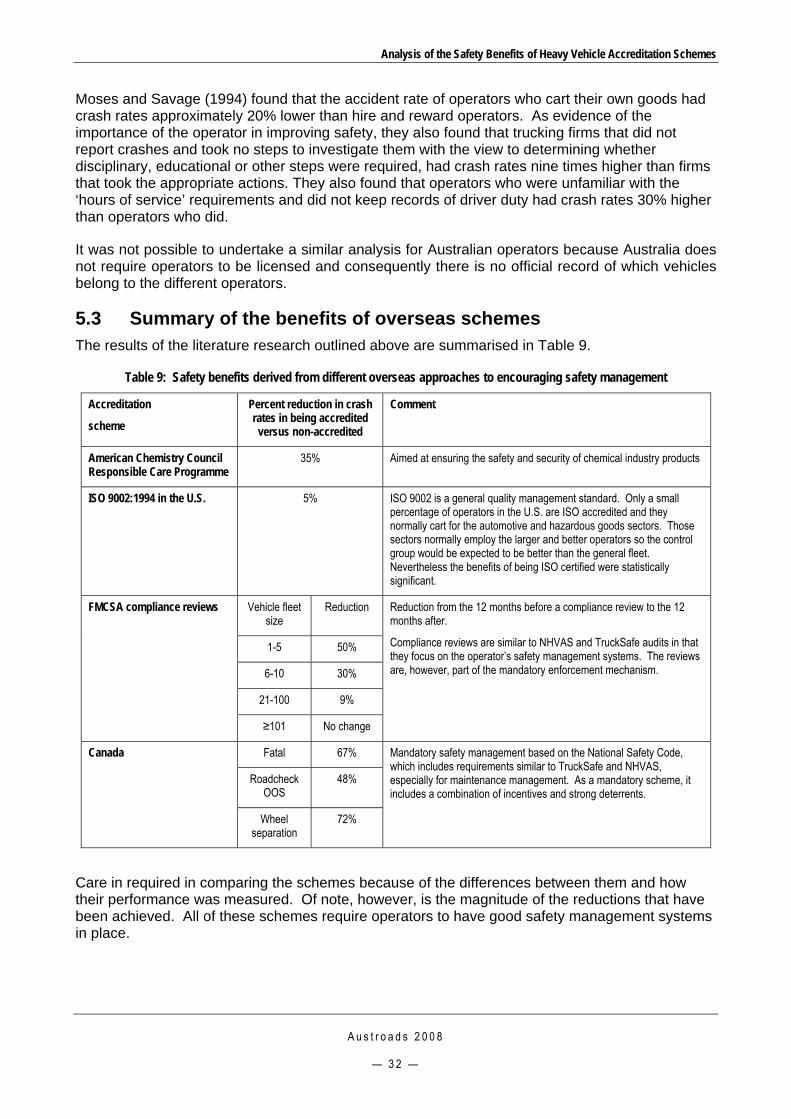
Analysis of the Safety Benefits of Heavy Vehicle Accreditation Schemes
A u s t r o a d s 2 0 0 8
— 3 2 —
Moses and Savage (1994) found that the accident rate of operators who cart their own goods had crash rates approximately 20% lower than hire and reward operators. As evidence of the importance of the operator in improving safety, they also found that trucking firms that did not report crashes and took no steps to investigate them with the view to determining whether disciplinary, educational or other steps were required, had crash rates nine times higher than firms that took the appropriate actions. They also found that operators who were unfamiliar with the ‘hours of service’ requirements and did not keep records of driver duty had crash rates 30% higher than operators who did.
It was not possible to undertake a similar analysis for Australian operators because Australia does not require operators to be licensed and consequently there is no official record of which vehicles belong to the different operators.
5.3 Summary of the benefits of overseas schemes The results of the literature research outlined above are summarised in Table 9.
Table 9: Safety benefits derived from different overseas approaches to encouraging safety management
Accreditation
scheme
Percent reduction in crash rates in being accredited versus non-accredited
Comment
American Chemistry Council Responsible Care Programme
35% Aimed at ensuring the safety and security of chemical industry products
ISO 9002:1994 in the U.S. 5% ISO 9002 is a general quality management standard. Only a small percentage of operators in the U.S. are ISO accredited and they normally cart for the automotive and hazardous goods sectors. Those sectors normally employ the larger and better operators so the control group would be expected to be better than the general fleet. Nevertheless the benefits of being ISO certified were statistically significant.
Vehicle fleet size
Reduction
1-5 50%
6-10 30%
21-100 9%
FMCSA compliance reviews
≥101 No change
Reduction from the 12 months before a compliance review to the 12 months after.
Compliance reviews are similar to NHVAS and TruckSafe audits in that they focus on the operator’s safety management systems. The reviews are, however, part of the mandatory enforcement mechanism.
Fatal 67%
Roadcheck OOS
48%
Canada
Wheel separation
72%
Mandatory safety management based on the National Safety Code, which includes requirements similar to TruckSafe and NHVAS, especially for maintenance management. As a mandatory scheme, it includes a combination of incentives and strong deterrents.
Care in required in comparing the schemes because of the differences between them and how their performance was measured. Of note, however, is the magnitude of the reductions that have been achieved. All of these schemes require operators to have good safety management systems in place.

Analysis of the Safety Benefits of Heavy Vehicle Accreditation Schemes
A u s t r o a d s 2 0 0 8
— 3 3 —
Also of note is the relationship between fleet size and the reduction in crash rates reported by the John A. Volpe National Transportation Systems Center (2005) in their analysis of FMCSA compliance reviews. Moses and Savage (1994) found a similar relationship between fleet size and crash rates with the largest operators having a crash rates about one third of that of the smallest operators.
Naveh and Marcus (2006) found that before becoming ISO 9002: 1994 certified, the operators as a group were no different to the matching group of operators that had the most similar characteristics. After certification the ISO certified operators were significantly safer and had better financial results. This suggests that accreditation produces double benefits: better safety and improved financial performance. This was echoed in the views of the Australian operators interviewed who generally supported accreditation not just for safety reasons.
There is a perception, certainly in New Zealand, that most trucks are in small fleets. In New Zealand, approximately 80% of transport operators have up to three vehicles. However this group only operates 30% of the vehicles as shown in table 10. The largest 2% of operators are responsible for a similar number of vehicles (32% of the heavy vehicle fleet).
Table 10: New Zealand transport fleet size (unpublished data provided by Land Transport NZ 2007)
Number of Vehicles % of Vehicles Number of Licensed
Operators % of Licensed
Operators
1 - 3 vehicles 29,543 30.10% 20,307 79.60% 4 - 10 vehicles 20,998 21.40% 3,645 14.30% 11 - 25 vehicles 16,313 16.60% 1,044 4.10% 26 - 99 vehicles 19,794 20.20% 433 1.70% 100+ vehicles 11,482 11.70% 68 0.30%

Analysis of the Safety Benefits of Heavy Vehicle Accreditation Schemes
A u s t r o a d s 2 0 0 8
— 3 4 —
6 DISCUSSION As outlined in section 1, further improvements in heavy vehicle safety have been called for. Traditionally command and control regulations and deterrent enforcement strategies have been used to ensure compliance with minimum standards. Improved understanding of injury prevention and risk management has resulted in the introduction of additional strategies for improving safety that focus on the management systems employed by transport operators.
Governments have the ability to encourage the adoption of safety management practices through the combined use of incentives/privileges, education, communication and deterrents. An important part of encouraging the adoption of robust safety management systems is the auditing and accreditation of the systems operators have implemented.
The analysis and literature review has enabled a number of questions to be answered:
Are accredited operators safer than non accredited operators? The statistical analysis found that TruckSafe and NHVAS accredited combination vehicles were, on average, significantly safer than vehicles not accredited to NHVAS. The calculated difference in average crash rates was substantial with vehicles accredited to the schemes having between ½ and ¾ fewer crashes on average than non-accredited vehicles. The analysis of insurance claims also showed that the claims rates for TruckSafe accredited vehicles were 33% less than non-accredited vehicles insured by NTI.
This finding was supported by the anecdotal evidence provided by the stakeholders. Operators found that the benefits of accreditation outweighed the cost, including the cost of implementation, administration, agency fees and audits.
This finding was also consistent with the experience of overseas accreditation schemes. The American Chemistry Council reported reductions in crash rates of 35% for operators accredited to their programme. Ontario in Canada experienced reductions of 67% in fatal crashes, 48% in out of service orders and 72% in wheel losses through the introduction of mandatory safety management practices that included aspects that are similar to the TruckSafe and NHVAS standards (MTO Ontario 1993).
Do operators improve through the process of becoming accredited? The analysis of NTI data found that operators do improve. The total cost of claims during the 2 years after TruckSafe accreditation was 57% lower than for the 2 years before accreditation. The sample size was small, but the finding is supported by anecdotal evidence and the experience from overseas. Operators noted a change in culture with an observable improvement in professionalism and a greater willingness to share information with their peers.
An analysis of the effectiveness of the U.S. compliance reviews of operator’s safety management systems found that operators had crash rates of up to 50% lower in the 12 months after the review compared to the 12 months before. The U.S. compliance reviews have a number of similarities with NHVAS maintenance management and Trucksafe audits, including, for example, the need to have formal daily driver inspections, fault reporting and fault rectification processes.
An analysis of the safety of ISO 9000 accredited operators in the U.S. found that the operators were significantly safer after they were accredited than before (Naveh and Marcus 2006). Before accreditation they were no safer than other non-accredited operators. Other schemes such as the American Chemistry Council Responsible Care programme and the Canadian Standards Association Carrier Safety Management Scheme also reported that operators become safer through the process of becoming accredited.

Analysis of the Safety Benefits of Heavy Vehicle Accreditation Schemes
A u s t r o a d s 2 0 0 8
— 3 5 —
Does fleet size have an influence on the level of benefits that can be achieved? It was not possible to look at the influence of fleet size in Australia as there is no requirement for operators to report how many vehicles they have. The study undertaken by the John A. Volpe National Transportation Systems Center (2005) on the effectiveness of the U.S. compliance reviews found that operators with 1 to 5 vehicles experienced a 50% reduction in crashes. The safety improvement reduced to 30% for fleets with 5 to 20 heavy vehicles, 9% with 21 to 100 vehicles and no significant change for fleets with more than 100 vehicles. The larger operators did not show the same gain as they already had low crash rates.
Moses and Savage (1994) also found that the largest operators were safer with crash rates 2/3rds lower than that of the smallest operators. Generally the largest operators need good quality and safety management systems that meet or exceed accreditation standards in order to successfully manage their operations. It would appear that the process of accreditation may lift the safety performance of the smaller operators to the level of the larger ones.
Does the nature of the scheme make a difference to its effectiveness? It is not possible to say whether operators accredited to TruckSafe are any safer than those accredited to NHVAS or vice versa. This is because of the amount of cross-over in the populations with, for example approximately ½ of TruckSafe accredited vehicles also accredited to NHVAS. The U.S. compliance reviews showed similar improvements to Trucksafe and NHVAS (John A. Volpe National Transportation Systems Center 2005). ISO 9000 accreditation in the U.S. showed a significant but relatively small reduction in crash rates (Naveh and Marcus 2006). These results suggest that schemes that are more focused on transport safety may be more effective in improving safety than the more generic quality assurance schemes.
Does accreditation have an effect on operator financial performance?
The only study that was able to be located was the work of Naveh and Marcus (2006) that looked at the effects of accreditation on financial performance. That study found that both the safety and financial performance (return on assets) of operators improved as a result of the process of becoming accredited. While anecdotal, the stakeholder interviews tended to support this support this finding for Australia.
Accreditation appears to be effective because it institutionalises a safety culture within transport operations, which in turn has an influence on driver behaviour.
The vast majority of all traffic crashes can be attributed partially or completely to some form of human error ((Rothengatter 1997); (Sabey and Taylor 1980)). Driving errors however are not confined to bad drivers or drivers with a lack of ability. In fact distance travelled is a key factor in determining how many collisions a driver will have (Persaud and Bahar 1999). All drivers are at risk of causing a crash, albeit some more than others depending on their abilities, attitudes and circumstances, driving conditions, quality of the road and the behaviour of their vehicles. It is not simply a case of “the nut behind the wheel” who just needs to drive more carefully, pay more attention or undertake more driver training. There is also no well-defined boundary when driving is safe or unsafe. Rather it is a continuum with multiple factors contributing to the level of risk. For example, unrealistic schedules result in pressure to speed and hence a higher level of risk. Similarly poorly performing brakes increase the degree of difficulty in stopping a vehicle and narrow roads reduce the margin for error.
Analysis of the Safety Benefits of Heavy Vehicle Accreditation Schemes
A u s t r o a d s 2 0 0 8
— 3 6 —
In many ways it is surprising that crashes are relatively infrequent events given the complexity of the driving task.
While most crashes are a result of a driver making an error while driving, the chances of making such an error is very dependent on the road being driven on, the performance and condition of the vehicle, the attitude and behaviour of the driver, the safety systems employed by the operator and the pressures brought to bear by the user of the transport services (Baas, Mueller et al. 2000).
The NTC study on speed behaviour of heavy vehicle drivers described in section 5.3 highlighted the influence company management practices have on driver behaviour (AMR-Interactive 2006). A driver who is told not to speed will behave very differently to one who is given the message that meeting delivery schedules is of paramount importance. Requiring drivers to undertake daily maintenance checks of their vehicles and management systems that ensure any faults detected are repaired in a timely manner promotes a safety awareness amongst drivers, which is likely to influence their whole attitude to driving, not just the condition of the vehicle. Similarly the purpose of fatigue management is to ensure drivers understand the nature and cause of fatigue and have the schedules that ensure they have adequate opportunities to rest. Good management systems also enable managers to monitor driver behaviour and to take appropriate disciplinary action against drivers who flout company policy and the law.
While a strong link between accreditation, safety management and driver on-road behaviour appears to exist, very little research has been undertaken on how company management influences driver behaviour and road safety. Further research on this is recommended.

Analysis of the Safety Benefits of Heavy Vehicle Accreditation Schemes
A u s t r o a d s 2 0 0 8
— 3 7 —
7 CONCLUSIONS The following conclusions can be drawn from the analysis of the performance of NHVAS and TruckSafe accreditation, interviews with stakeholders, the literature and experience from overseas:
Operators who have safety management practices that meet accreditation standards are, on average, significantly safer than non-accredited operators.
Operators generally show substantial improvements through the process of becoming accredited.
Accredited operators reported that the process of becoming accredited made internal processes easier to manage and the external audits helped to drive positive change within their companies.
Improvements appear to be driven by a change in safety culture. An example of this occurring was reported by operators who noted that, after their sub-contracted operators became accredited they tended to be more open with information, better at communicating, more professional and willing to exchange information with their peers.
The influence operators can have on speed behaviour suggests that drivers can be encouraged to drive more defensively. “Pressure to meet deadlines” was by far the most common reason raised as to why drivers speed (AMR-Interactive 2006). As many as 20% of the drivers reported that they were speeding on at least half of their trips even though the vehicle was supposed to be speed limited. Only half of the drivers reported that their company promoted a “do not speed” policy.
Accreditation appears to produce both safety and financial benefits for operators (Naveh and Marcus 2006).
While not specifically explored during this project, accreditation is also likely to lead to fuel savings if appropriate modules are introduced. This is because of the strong links between driver behaviour, speed and energy use.
Smaller fleets are likely to see greater benefits from becoming accredited.
The analysis suggested that NHVAS Maintenance Management produced greater safety benefits than NHVAS Mass Management. This is consistent with overseas experience where general schemes such as ISO certification do not produce the same level of benefits as safety specific schemes. This would suggest that making NHVAS Maintenance Management accreditation a pre-condition to incentives attached to NHVAS Mass Management could improve safety.
Both mandatory approaches (such as those used in North America) and voluntary schemes produce safety benefits. It was not possible from the information available to determine which approach is more effective.
The corollary of the safety benefits of accreditation is that those not accredited are less safe and should be encouraged to become accredited or targeted through enforcement.

Analysis of the Safety Benefits of Heavy Vehicle Accreditation Schemes
A u s t r o a d s 2 0 0 8
— 3 8 —
In developing accreditation, it is important to consider the different perspectives and needs of the stakeholders especially of the regulators and operators. This is reflected in the different purposes of TruckSafe and NHVAS. For the regulators, accreditation has some parallels to the issuing of drivers licences in that operators must demonstrate, through an external audit (examination), that they can operate their vehicles safely without adversely affecting the public investment in the infrastructure. The regulators are concerned about risk to government’s desired economic, social and environmental outcomes, not how operators’ manage their business, which is an issue for industry. TruckSafe maintain that their scheme is more robust in improving operator management and safety culture. However it does not provide the level of impartiality and assurance regulators require to manage the risks associated with the granting of concessions to the legal requirements.
It is recommended that greater use be made of heavy vehicle accreditation in Australia and New Zealand as it is arguably the most effective means available to jurisdictions and industry for improving heavy vehicle safety.
Analysis of the Safety Benefits of Heavy Vehicle Accreditation Schemes
A u s t r o a d s 2 0 0 8
— 3 9 —
APPENDIX A: SECTOR SPECIFIC ACCREDITATION SCHEMES ISO 9002 Quality Assurance A number of operators, especially specialist transport operators, have adopted ISO 9002 quality assurance standards, often in order to comply with client requirements. These standards are broad-based and require:
control of service and service delivery
continuous review for improvements of service levels
training and development of personnel at all levels
client assurance that their required levels of service will be met
documentation systems, controls and records, including audits
standards of business that are of a consistent level through all operations
to improve all work processes, efficiencies, morale and reduce waste
service performance analysis and evaluation.
Because of their broad nature, the development and preparation costs as well as the ongoing management control disciplines have caused several companies to discontinue with ISO and to adopt one of the transport specific schemes instead, such as TruckSafe.
PACIA Carrier Accreditation Scheme The Plastics and Chemicals Industries Association (PACIA) Carrier Accreditation Scheme (PCAS) has over 270 corporate members in Australia. Members include chemical, petrochemical, water treatment, adhesives, plastic resins, paint, explosives and colorants companies. Plastics companies range from auto-parts manufacturers to the manufacturers of bottles, containers, mattresses, tanks, toys and medical devices. PACIA also includes importers of chemicals and plastics, service companies, consultancies, storage, transport and distribution companies.
All chemical company members of PACIA are required to commit themselves to the Global Chemical Industry’s Responsible Care programme. The Responsible Care programme commenced in 1989 and was one of the first initiatives in industry self-regulation.
The six Responsible Care Codes are:
Community Right to Know
Manufacturing Process Safety
Employee Health & Safety
Environment Protection
Storage & Transportation Safety
Product Stewardship.
PCAS was set up to reduce the duplication and audit costs imposed on carriers who are contracted to PACIA members who comply with the Responsible Care Storage and Transport Safety Code of Practice.
As noted above PACIA and TruckSafe entered into a Memorandum of Understanding and partnership in April 2005 to enable mutual recognition of auditing standards and methodologies.
Analysis of the Safety Benefits of Heavy Vehicle Accreditation Schemes
A u s t r o a d s 2 0 0 8
— 4 0 —
HACCAP HACCAP is a risk management system for the food industry. Some transport operators who cart foodstuffs for human consumption are required by their clients to obtain HACCAP accreditation as transport is seen as part of the food supply chain. HACCAP accreditation is managed by HACCAP Australia while regulatory responsibility for food safety is covered by Food Standards Australia and New Zealand, an independent statutory authority.
Typical standards include:
transport & handling equipment specifications, design, cleanliness
food harvesting, handling, packaging, transport, storage procedures and methods
temperature and air controls and management procedures
food safety training programs
cleaning processes and certification systems.
Regular QSA audits are conducted by qualified auditors.
TruckCare Accreditation – Livestock Carriers TruckCare is a voluntary accreditation scheme that is managed by the Australian Livestock Transporters Association. Many of the features of the scheme are based on and include HACCP standards and principles of delivering high quality, consistent and reliable levels of services. The scheme is also designed to integrate with other QA programs, including CattleCare, FlockCare, National Saleyards QA and TruckSafe.
Scheme Objectives: improved regulatory compliance with transport, livestock handling and food safety standards
improved business management systems and procedures for all staff
increased productivity through best practice management
systems must provide documentary evidence of compliance with standards. TruckCare Standards include: driver hours & fatigue management system
customer management procedures
document controls and record keeping
staff training & education
subcontractor & supplier management procedures
vehicle & equipment maintenance
livestock handling, loading & unloading
livestock identification & traceability procedures
internal audit reviews (required at least annually, with some quarterly records). In January 2005 there were 64 TruckCare accredited fleets operating 519 heavy vehicles.
TFMS – Transitional Fatigue Management Scheme

Analysis of the Safety Benefits of Heavy Vehicle Accreditation Schemes
A u s t r o a d s 2 0 0 8
— 4 1 —
The TFMS scheme, which is in use in Queensland, New South Wales, Victoria and South Australia, has been designed to help address problems with managing driver fatigue. The scheme gives drivers and operators more flexibility with driving, work and rest hours in exchange for a commitment to manage driver fatigue during long distance heavy vehicle driving.
Both employers and drivers benefit from registering with the TFMS. Drivers can drive up to 14 hours in any 24 hour period and spread their driving over a longer 14 day cycle. Employers must ensure their drivers follow the scheme’s requirements and must monitor performance. This includes:
keeping driver records
maintaining systems such as rosters, to ensure drivers comply with driving, work and rest requirements
recording the certification of drivers and responsible employees involved in rostering and trip scheduling who have completed the approved training course in fatigue management
ensuring that drivers have had the required medical examinations
conducting regular reviews of each driver’s performance in the TFM scheme. To participate in the TFMS, drivers must get their employer to register in the scheme. Once an employer agrees to participate, a driver must:
have regular medical examinations
complete an approved training course in fatigue management
carry a validated Driver Certification Manual when driving a heavy vehicle and be able to present it to an authorised officer.
Bus Operator Accreditation Various states have introduced mandatory accreditation of bus operators as a means of improving the safety and service of bus and coach operators.
In Victoria the Public Transport Competition Act 1995 requires operators of vehicles with more than 12 seats (including the driver) to be accredited with the Department of Infrastructure. Buses used purely for private domestic purposes are excluded. It covers all buses and coaches including school buses owned by schools and buses owned by community groups and sports clubs. It replaced the previous system of licensing buses with a scheme that accredits operators. It allows for increased competition between transport operators in the provision of road-based public transport by removing unnecessary regulatory restrictions to the entry of competent transport operators and to enable competitive tendering of contracts.
The accreditation process is aimed at ensuring that each operation has the capacity to meet prescribed standards relating to;
the ability to provide road transport passenger service
the safety of passengers
the safety of vehicles and equipment
provision of an efficient and effective network of road transport passenger services within the State
the observance of appropriate legislative conditions by operators of road transport passenger services.

Analysis of the Safety Benefits of Heavy Vehicle Accreditation Schemes
A u s t r o a d s 2 0 0 8
— 4 2 —
There are approximately 1,800 accredited operators running approximately 7,000 vehicles.
Analysis of the Safety Benefits of Heavy Vehicle Accreditation Schemes
APPENDIX B: STATISTICAL ANALYSIS OF NHVAS DATA Accreditation & Crash Data Table B-1 and Table B-2 summarise the features of the accreditation and crash sets respectively. The accreditation sets for Vic, NSW and Qld are denoted as , , and respectively. Similarly, the crash sets for Vic, NSW and Qld are denoted as , and respectively.
AccredVic AccredNSW AccredQld
CrashesVic CrashesNSW
CrashesQld
Accreditation Set Table B-1: Feature composition (Yes/No) for the given accreditation sets
Feature vector AccredVic AccredNSW AccredQld
vehicle registration number Yes Yes Yes
vehicle type Yes No Yes
date of entry Yes Yes Yes
date of entry Yes Yes Yes
registration jurisdiction Yes Yes Yes
Mass/Maintenance accredited Yes No Yes
The NSW accreditation set did not have vehicle type information – but it did have the vehicle identification number (VIN) for a given vehicle. For a given VIN, the Truck vehicle type classification was inferred from the VIN by identifying the vehicle manufacturer coded within the VIN sequence. The vehicle type of all other VINs that did not specify a vehicle manufacturer were classified as Trailer.
The NSW accreditation set did not identify whether the vehicles were mass or maintenance accredited vehicles – only that they were NHVAS accredited. All vehicles in the NSW accreditation set were assumed to be maintenance management accredited rather than mass management accredited.
Crash Set Table B-2: Feature composition (Yes/No) for the given crash sets
Feature vector CrashesVic CrashesNSW CrashesQld Comment
vehicle registration number Yes Yes Yes Unknowns removed
vehicle type Yes Yes Yes
date of crash Yes Yes Yes
registration jurisdiction Yes Yes No
The crash sets contained a small proportion of crashes where the vehicle registration numbers where not known. All crashes having unknown vehicle registration numbers were removed from the crash sets. The crash sets had some vehicles that were involved in more than one crash for the years and jurisdictions studied.
A u s t r o a d s 2 0 0 8
— 4 3 —

Analysis of the Safety Benefits of Heavy Vehicle Accreditation Schemes
The registration jurisdiction was able to be resolved for all of the accredited vehicles in the QLD crash set, but a significant proportion of non-accredited vehicles were not able to be classified by registration jurisdiction and were assumed to be non-accredited vehicles from either Vic, NSW or Qld.
Jurisdiction dependent filters The jurisdictions used different definitions for vehicle type from one another and between their own crash and accreditation data sets. Tables B-3 and B-4 show the filters that were used to identify the combination vehicles (Tractor-semis, B-doubles, Roadtrains etc) for the analysis.
Table B-3: Jurisdiction-dependent vehicle type accreditation filters
VT accreditation filters Jurisdiction
Used in analysis Not used in analysis
Victoria Artic
B Double
-
NSW Trailer Powered unit
Queensland Artic
B Double
Trailer
Rigid
Truck and trailer (note 1)
Note 1: There were very few (<3%) “truck and trailers” recorded in Queensland and to avoid double counting it was assumed they were included in the “trailer” count.
Table B-4: Jurisdiction-dependent vehicle type crash filters
VT crash filters Jurisdiction
Used in analysis Not used in analysis
Victoria Semi-trailer Truck
NSW Semi-trailer
Articulated Tanker
B Double
Road Train
Large Rigid Lorry
Rigid Tanker
Queensland Articulated truck
Road train/Bdouble/triple
Rigid truck
Towed device
Statistical Analysis
The crash rates can be formalised in terms of the combined or unified accreditation ( ) and crash (C ) sets for the years and jurisdictions studied, i.e.:
aA
}{ AccredAccredAccreda QldNSWVicA UU≡ }{ CrashesCrashesCrashes QldNSWVicC UU≡
A u s t r o a d s 2 0 0 8
— 4 4 —

Analysis of the Safety Benefits of Heavy Vehicle Accreditation Schemes
The accredited crash rate ( ) and non-accredited crash rate ( ) are thus defined as: ap np
||||
><≡
a
aa A
ACp I
||||||
||||
||||
><−><=
><−><=
><≡
a
a
a
a
a
an AT
ACAT
ACA
ACp III
where denotes the function used to calculate the exposure in vehicle-years, and where | denotes the function used to calculate the number or magnitude of the variable being accessed, i.e. the number of crashes; exposure in vehicle-years. T denotes the ABS Motor Vehicle Census 9309.0 data used to calculate the total exposure of combination vehicles in vehicle-years for the years and jurisdictions studied.
>< o | o
The accreditation categories studied satisfy the following relationship: },,{ MainMassNHVAS AAA
MainMassMainMassNHVAS AAAAA I−+= .
Henceforth, the accredited crash rates studied were },,{ MainMassNHVASa pppp = .
The crash rate involving the intersection of mass and maintenance accredited vehicles was not analysed separately due to the increased complexity of dealing with vehicles belonging to more than one accreditation set. However the uncertainty in the statistical outcome is likely to be minor because of the relatively small number of crashes and vehicles in this group.
Table B-5 gives the accredited vehicle-years (v.y) for the years, jurisdictions, and accreditation categories studied. Note the 2,953 of vehicle-years exposure added to the total mass management and maintenance management accreditation exposure terms. The additional exposure is the contribution from combination vehicles that were both mass and maintenance accredited.
Table B-6 gives the total number of combination vehicles (v) over the years (y) and jurisdictions studied. For example, 139,630v.y and =>< || T =>< || NHVASA 44,877v.y. Note that the Vic crash set only contained crash data from the 1st January 2003 through to the 30th June 2005 – or 5/6 of the three year period studied. All other crash sets contained the full three years of crash data. In other words, a total of 8.5 jurisdiction-years of crash data was analysed.
Table B-5: Accredited vehicle-years (2003-2005)
Accreditation Vic (v.y) NSW (v.y) Qld (v.y) Maintenance & mass (v.y)
Total (v.y)
NHVAS 8,113 8,233 28,531 44,877
Mass only 6,206 0 1,949 2,953 11,108
Maintenance only 1,531 8,233 24,005 2,953 36,722
A u s t r o a d s 2 0 0 8
— 4 5 —
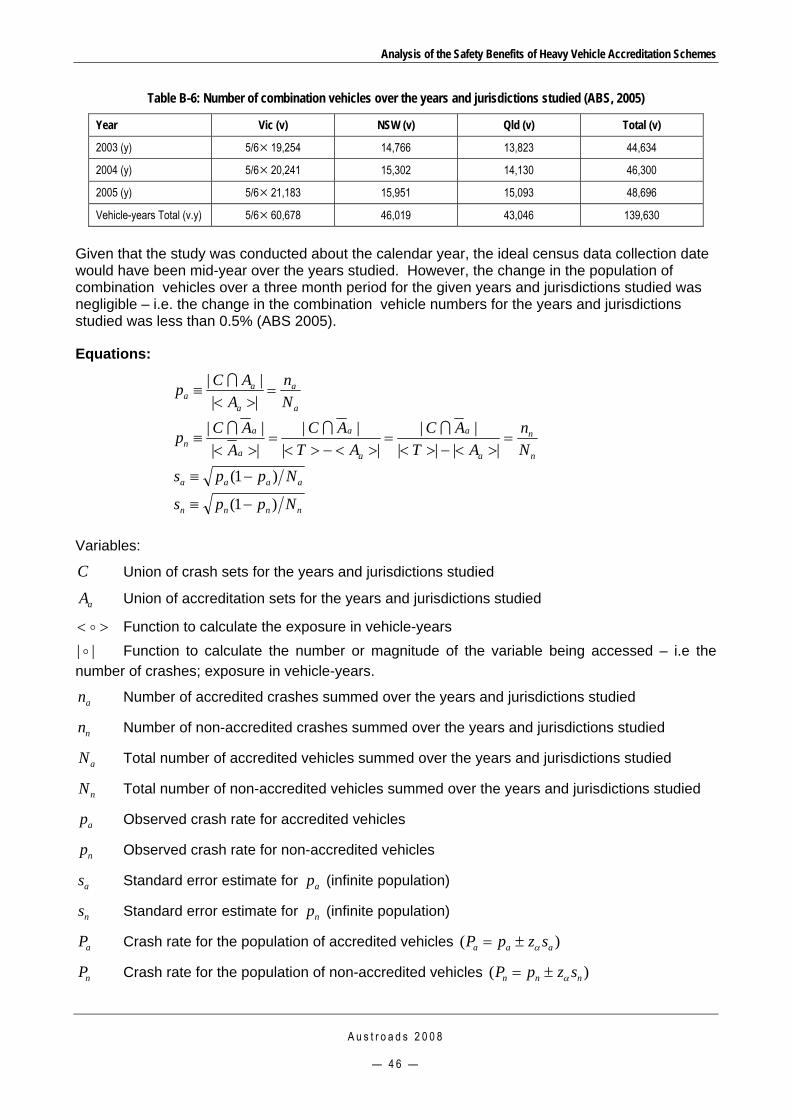
Analysis of the Safety Benefits of Heavy Vehicle Accreditation Schemes
Table B-6: Number of combination vehicles over the years and jurisdictions studied (ABS, 2005)
Year Vic (v) NSW (v) Qld (v) Total (v)
2003 (y) 5/6× 19,254 14,766 13,823 44,634
2004 (y) 5/6× 20,241 15,302 14,130 46,300
2005 (y) 5/6× 21,183 15,951 15,093 48,696
Vehicle-years Total (v.y) 5/6× 60,678 46,019 43,046 139,630
Given that the study was conducted about the calendar year, the ideal census data collection date would have been mid-year over the years studied. However, the change in the population of combination vehicles over a three month period for the given years and jurisdictions studied was negligible – i.e. the change in the combination vehicle numbers for the years and jurisdictions studied was less than 0.5% (ABS 2005).
Equations:
a
a
a
aa N
nA
ACp =><
≡|||| I
n
n
a
a
a
a
a
an N
nAT
ACAT
ACA
ACp =><−><
=><−><
=><
≡||||
||||
|||||| III
aaaa Npps )1( −≡
nnnn Npps )1( −≡
Variables:
C Union of crash sets for the years and jurisdictions studied
aA Union of accreditation sets for the years and jurisdictions studied
>< o Function to calculate the exposure in vehicle-years || o Function to calculate the number or magnitude of the variable being accessed – i.e the
number of crashes; exposure in vehicle-years.
an Number of accredited crashes summed over the years and jurisdictions studied
nn Number of non-accredited crashes summed over the years and jurisdictions studied
aN Total number of accredited vehicles summed over the years and jurisdictions studied
nN Total number of non-accredited vehicles summed over the years and jurisdictions studied
ap Observed crash rate for accredited vehicles
np Observed crash rate for non-accredited vehicles
as Standard error estimate for (infinite population) ap
ns Standard error estimate for (infinite population) np
aP Crash rate for the population of accredited vehicles )( aaa szpP α±=
nP Crash rate for the population of non-accredited vehicles )( nnn szpP α±=
A u s t r o a d s 2 0 0 8
— 4 6 —

Analysis of the Safety Benefits of Heavy Vehicle Accreditation Schemes
A u s t r o a d s 2 0 0 8
— 4 7 —
Results Table B-7 shows the crashes rates for accredited and non-accredited vehicles. Also shown are the 95% confidence intervals, which do not take into account the three assumptions discussed in section 4.2.2.
Table B-7: Crash rates of accredited and non-accredited vehicles and 95% confidence intervals.
Crashes Vehicle-years Crash rates
(crashes /vehicle-year)
95% confidence intervals
Non-accredited 6278 94,753 0.066 0.001
NHVAS accredited 872 44,877 0.019 0.001
Mass Accredited 374 11,108 0.034 0.003
Maintenance Accredited 654 36,722 0.018 0.001

Analysis of the Safety Benefits of Heavy Vehicle Accreditation Schemes
APPENDIX C: NHVAS CRASH COUNTS Table C1: NHVAS accredited (A) and non-accredited (NA) interstate and intrastate crash counts
for Vic, NSW, and Qld from 2003 – 2005 Crash Jurisdiction Vic Vic Vic Vic Vic Vic
Registration Jurisdiction Vic Vic NSW NSW Qld Qld
NHVAS A NA A NA A NA
2003 23 325 1 25 0 14
2004 41 316 4 15 0 11
2005 24 145 4 9 1 2
Total 88 786 9 49 1 27
Crash Jurisdiction NSW NSW NSW NSW NSW NSW
Registration Jurisdiction Vic Vic NSW NSW Qld Qld
NHVAS A NA A NA A NA
2003 10 252 8 869 27 144
2004 21 249 69 848 34 146
2005 35 199 120 801 47 104
Total 66 700 197 2518 108 394
Crash Jurisdiction Qld Qld Qld Qld Qld Qld Qld
Registration Jurisdiction Vic Vic NSW NSW Qld Qld Vic/NSW/Qld1
NHVAS A NA A NA A NA NA
2003 3 4 0 4 70 81 511
2004 9 5 8 3 125 79 522
2005 11 2 9 4 168 56 533
Total 23 11 17 11 363 216 1566
1 Assumed
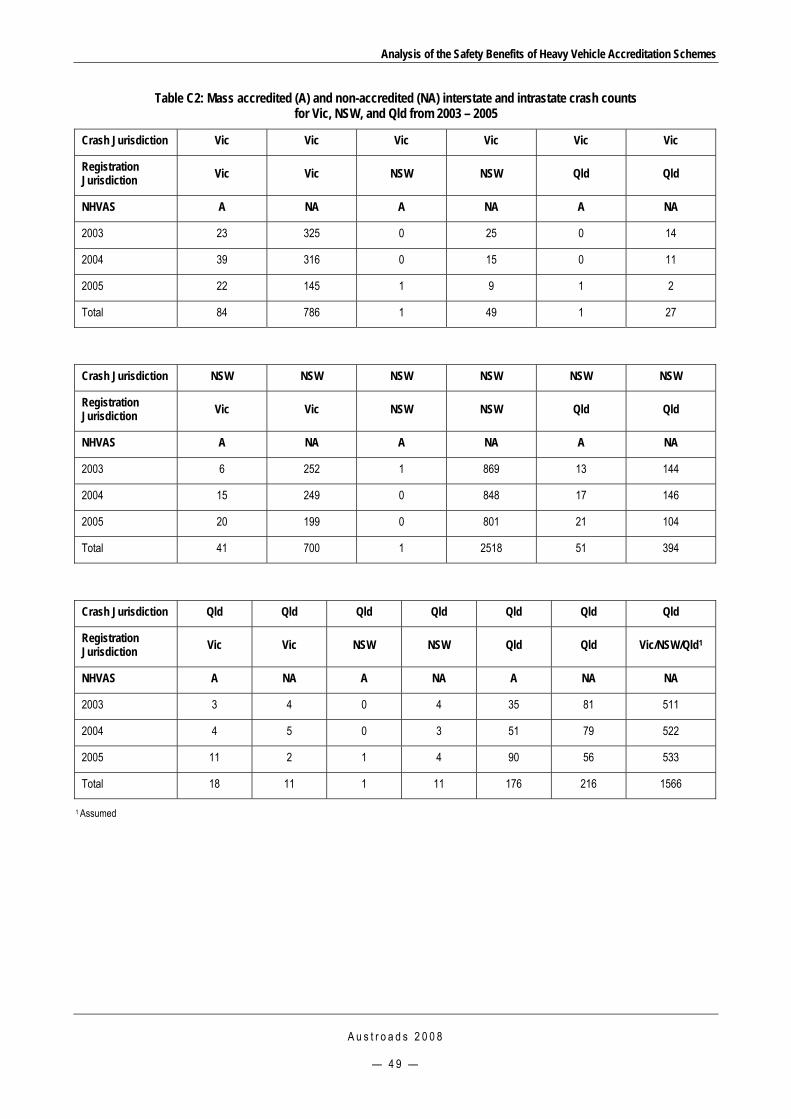
Analysis of the Safety Benefits of Heavy Vehicle Accreditation Schemes
A u s t r o a d s 2 0 0 8
— 4 9 —
Table C2: Mass accredited (A) and non-accredited (NA) interstate and intrastate crash counts for Vic, NSW, and Qld from 2003 – 2005
Crash Jurisdiction Vic Vic Vic Vic Vic Vic
Registration Jurisdiction Vic Vic NSW NSW Qld Qld
NHVAS A NA A NA A NA
2003 23 325 0 25 0 14
2004 39 316 0 15 0 11
2005 22 145 1 9 1 2
Total 84 786 1 49 1 27
Crash Jurisdiction NSW NSW NSW NSW NSW NSW
Registration Jurisdiction Vic Vic NSW NSW Qld Qld
NHVAS A NA A NA A NA
2003 6 252 1 869 13 144
2004 15 249 0 848 17 146
2005 20 199 0 801 21 104
Total 41 700 1 2518 51 394
Crash Jurisdiction Qld Qld Qld Qld Qld Qld Qld
Registration Jurisdiction Vic Vic NSW NSW Qld Qld Vic/NSW/Qld1
NHVAS A NA A NA A NA NA
2003 3 4 0 4 35 81 511
2004 4 5 0 3 51 79 522
2005 11 2 1 4 90 56 533
Total 18 11 1 11 176 216 1566
1 Assumed

Analysis of the Safety Benefits of Heavy Vehicle Accreditation Schemes
A u s t r o a d s 2 0 0 8
— 5 0 —
Table C3: Maintenance accredited (A) and non-accredited (NA) interstate and intrastate crash counts for Vic, NSW, and Qld from 2003 – 2005
Crash Jurisdiction Vic Vic Vic Vic Vic Vic
Registration Jurisdiction Vic Vic NSW NSW Qld Qld
NHVAS A NA A NA A NA
2003 1 325 1 25 0 14
2004 2 316 4 15 0 11
2005 4 145 4 9 1 2
Total 7 786 9 49 1 27
Crash Jurisdiction NSW NSW NSW NSW NSW NSW
Registration Jurisdiction Vic Vic NSW NSW Qld Qld
NHVAS A NA A NA A NA
2003 4 252 7 869 21 144
2004 6 249 69 848 29 146
2005 17 199 120 801 39 104
Total 27 700 196 2518 89 394
Crash Jurisdiction Qld Qld Qld Qld Qld Qld Qld
Registration Jurisdiction Vic Vic NSW NSW Qld Qld Vic/NSW/Qld1
NHVAS A NA A NA A NA NA
2003 1 4 0 4 55 81 511
2004 5 5 8 3 103 79 522
2005 2 2 9 4 142 56 533
Total 8 11 17 11 300 216 1566
1 Assumed
Analysis of the Safety Benefits of Heavy Vehicle Accreditation Schemes
A u s t r o a d s 2 0 0 8
— 5 1 —
BIBLIOGAPHY ABS (2005). ABS Motor Vehicle Census 9309.0 - 31st March 2005. Canberra, Australian Bureau of
Statistics. AMR Interactive (2006). Speed behaviours of heavy vehicle driver`s : a national study. Melbourne, VIC,
National Transport Commission: 76 p. AMR-Interactive (2006). Speed Behaviours of Heavy Vehicle Drivers: A National Study. Melbourne, National Transport Commission: 90. ATC (2003). National Heavy Vehicle Safety Strategy 2003 - 2010. Melbourne, Australian Transport Council
and National Transport Commission: 29. ATC (2006). National Heavy Vehicle Safety Action Plan. Melbourne, Australian Transport Council and
National Transport Commission: 22. ATSB (2003). Monograph 15: Articulated Truck Fatalities, Australian Transport Safety Bureau: 4. Auslink (2004). AUSLINK - Building Our National Transport Future, Australian Department of Transport and
Regional Services,. Baas, P. H., T. H. Mueller, et al. (2000). Review of Truck Safety: Overview. Auckland, TERNZ Ltd: 34. Bureau of Transport and Regional Economics (BTRE) (2006). Freight Measurement and Modelling in
Australia. Canberra ACT: 377. CAVA (2002). An introductory guide to aviation Safety Management Systems suitable for: Aerial work
operators, Charter operators, Air transport operators, Maintenance organisations, Aerodromes. CCMTA (1988). National Safety Code for Motor Carriers. Ottawa, Ontario, Canadian Council of Motor
Transport Administrators. Drew, T. (2002). Carrier Safety Management Systems. A Collaborative Approach to Carrier Safety.
International Truck and Bus Safety Research and Policy Symposium, Knoxville. FMCSA (2003). Effective Commercial Truck and Bus Safety Management Techniques. Washington,
Transportation Research Board. John A. Volpe National Transportation Systems Center (2005). FMCSA Safety Program Effectiveness
Measurement: Complinace Review Effectiveness Model, Results for Carriers with Complinance Reviews in 2002. Cambridge MA, John A. Volpe National Transportation Systems Center.
KPMG (2001). Key management motivators in occupational health and safety: Research for the CEO and
Supervisor Drivers Project, NOSHC. Land Transport NZ (2006). Land Transport Compliance Strategy. Wellington, Land Transport NZ. Lantz, B. (1994). Evaluation of the differences between spontaneous and anticipated roadside inspections of
motor carriers. Fargo, North Dakota, The Upper Great Plains Transportation Institute. North Dakota State University.: 20 p.
Mackie, H., P. Baas, et al. (2007). Prediction of freight growth by 2020 and rail's ability to share the load.
IPENZ Transportation Conference, Christchurch.

Analysis of the Safety Benefits of Heavy Vehicle Accreditation Schemes
A u s t r o a d s 2 0 0 8
— 5 2 —
Maxwell, C. (2004). Occupational Health and Safety Act Review. Melbourne, State of Victoria, Australia: 415. McIntyre, K. and B. Moore (2002). National road transport compliance and enforcement reforms: on the road
to a new national culture of compliance. Enforcement and compliance conference, Melbourne, Australian Institute of Criminology.
Moses, L. M. and I. Savage (1996). Identifying Dangerous Trucking Firms. Evanston IL., Department of
Economics, Northwestern University. Moses, L. N. and I. Savage (1994). "The Effect of Firm Characteristics on Truck Accidents." Accident,
Analysis and Prevention 26(2): 173-179. Moses, L. N. and I. Savage (1995). A Cost -Benefit Analysis of United States Motor Carrier Safety Programs.
Evanston, Il, Northwestern University. MOT NZ (2002). New Zealand Transport Strategy. Wellington, Ministry of Transport. MOT NZ (2006). Truck Crashes. Wellington, Ministry of Transport NZ. MOT NZ (2007). Sustainable Transport: Update of the New Zealand Transport Strategy Discussion Paper.
Wellington, Ministry of Transport: 64. MTO (2003). Ontario Road Safety Annual Report. Otawa, Ministry of Tranportation: 101. MTO Ontario (1993). "Ontario Road Safety Annual Report." Naveh, E. and A. Marcus (2006). "Financial Performance, ISO 9000 standard and safe driving practices
effects on accident rates in the U.S. motor carrier industry." Accident Analysis and Prevention 39: 731-742.
Persaud, B. and G. Bahar (1999). "Applying the science of Highway Design to effect highway improvements
- a multi-disciplinary approach." Mobility, The Traffic Expert. Reason, J. (2001). "In search of resilience." Flight Safety Australia(September-October 2001). Rothengatter, T. (1997). "Errors and violations as factors in accident causation." Traffic and Transport
Psychology: Theory and Application: Pergamon: Oxford, England. RTA, N. (2004). Mass/Maintenance accredited and total vehicle counts by vehicle type for 2003 and 2004.
Sydney, Road Transport Authority, New South Wales. Sabey, B. E. and H. Taylor (1980). The known risks we run: The highway. Crowthorne, Transport Research
Laboratory. Starrs, M. and B. Moore (2003). Internal paper for NTC on Accreditation. Melbourne, NTC. Trucksafe (2006). Trucksafe - 10 years on. March 2006 Newsletter,, Trucksafe Pty Ltd.