Sales Design: Vom Point-of-Sale zum Point-of-Interest (Vorwort)

AUSTRIA'S ANNUALNATIONAL GREENHOUSE GAS
INVENTORY 1990 - 2003Submission under Decision 280/2004/EC
SERIESBE-262
Vienna, 2005

Project Manager Michael Anderl
Authors Michael Anderl
Andrea Edelmann
Alexandra Freudenschuß
Doris Halper
Agnes Kurzweil
Stephan Poupa
Daniela Wappel
Peter Weiss
Manuela Wieser
Editing Manfred Ritter
For further information about the publications of the Umweltbundesamt please go to: http://www.umweltbundesamt.at/
Imprint Owner and Editor: Umweltbundesamt GmbH
Spittelauer Lände 5, 1090 Vienna/Austria
Printing by: Umweltbundesamt GmbH
Printed on recycling paper
© Umweltbundesamt GmbH, Vienna, 2005 All rights reserved ISBN 3-85457-762-1

Austria's Annual National Greenhouse Gas Inventory 1990-2003 – Vorwort
i
VORWORT
Der vorliegende Bericht präsentiert die neueste Entwicklung an Treibhausgasemissionen (THG-Emissionen) in Österreich. Er folgt in Format und Inhalt den verbindlichen Anforderun-gen des THG-Überwachungssystems 280/2004/EG1 der EU zur Umsetzung des Kyoto-Protokolls an die europäischen Mitgliedstaaten. Dieses System umfasst die jährliche Über-mittlung von aktualisierten THG-Emissionsdaten mit 15. Jänner an die Europäische Kommis-sion. Mit diesem Bericht wird der dafür notwendige Emissionsbericht in englischer Sprache im dafür geforderten CRF2-Berichtsformat zusammenfassend wiedergegeben. Eine detaillier-te Darstellung der Daten wird der Europäischen Kommission außerdem in digitaler Form ü-bermittelt3. Die Gesamtmenge an Treibhausgasemissionen steigt im Jahr 2003 auf 91,6 Millionen Tonnen CO2 Äquivalente an. Dies entspricht einer Steigerung um 5,1 Millionen oder 5,9% gegenüber dem Vorjahr und einem Anstieg von 16,6% gegenüber dem Kyoto-Basisjahr 1990. Treibende Kraft gegenüber dem Vorjahr ist der Anstieg des wichtigsten Treibhausgases Kohlendioxid (CO2) in den Sektoren Energieversorgung (CRF-Sektor 1 A 1 + 1 B) um 2,7 Millionen Tonnen, Verkehr (CRF-Sektor 1 A 3 + 1 A 5) um 1,7 Millionen Tonnen und Kleinverbrauch (CRF-Sektor 1 A 4) um 1,0 Millionen Tonnen. Die Entwicklung im Sektor Energieversorgung ist gekoppelt mit einem Anstieg beim Stromverbrauch und einer Verschiebung der Stromerzeugung im Jahr 2003 von Wasserkraft zu den kalorischen Kraftwerken. Die Entwicklung beim Verkehr ist verbunden mit einem stetigen Anstieg der gefahrenen Kilometer von LKW und PKW – verstärkt durch einen hohen Anteil an Tanktourismus aufgrund der niedrigen Kraftstoffpreise in Österreich. Der Anstieg bei der Zahl und Größe der beheizten Wohnungen in Österreich und der relativ kühle Winter im Jahr 2003 sind die wichtigsten treibenden Kräfte im Sektor Kleinverbrauch. Eine detaillierte Analyse der treibenden Kräfte dieser Inventur wird im sogenannten „Kyoto-Fortschrittsbericht“, dem Folgebericht zur Inventur, vorraussichtlich im März veröffentlicht werden. Diese Daten wurden entsprechend den Beschlüssen der Vertragstaatenkonferenzen des Rahmenübereinkommens der Vereinten Nationen über Klimaänderungen (BGBl. Nr. 414/1994, UN Framework Convention on Climate Change - UNFCCC) erhoben. Sie umfassen Emissionen und Senken bezüglich der direkten Treibhausgase CO2, CH4, N2O, HFC, PFC und SF6, sowie der indirekten Treibhausgase NOx, NMVOC, CO und SO2. Die Erhebung der Daten berücksichtigt außerdem die Ergebnisse der jährlichen Überprüfung durch die UNFCCC im Rahmen einer sogenannten UNFCCC-Tiefenprüfung. Im Oktober 2004 fand die vorläufig Letzte dieser UNFCCC-Tiefenprüfung der Österreichischen Treib-hausgas-Inventur durch internationale Fachexperten statt. Die Ergebnisse dieser Prüfung liegen noch nicht vor, werden aber in das Inventurverbesserungsprogramm 2005 einfließen. Das UMWELTBUNDESAMT bereitet sich auf zukünftige Anforderungen vor, die sich aus der Klimarahmenkonvention und vor allem aus dem Inkrafttreten des Kyoto-Protokolls am 16. Februar 2005 ergeben. Entsprechend Artikel 5.1 des Kyoto-Protokolls wird ein Nationales System eingerichtet, dessen Ziel es u.a. ist, die Qualität der Inventur sicherzustellen und kontinuierlich zu verbessern. Dazu wurde ein Gesamtkonzept für das Nationale Inventur Sys- 1 Entscheidung Nr. 280/2004/EG des Europäischen Parlaments und des Rates vom 11. Februar 2004 über ein
System zur Überwachung der Treibhausgasemissionen in der Gemeinschaft und zur Umsetzung des Kyoto-Protokolls
2 Common Reporting Format der UNFCCC 3 Der vorliegende Bericht beinhaltet ausserdem die folgenden Elemente des THG-Überwachungssystems
280/2004/EG: Zusammenfassung des Nationalen Inventur-Berichtes im Sinne des Artikels 3 (1) f, Artikel 3 (1) i: methodische Verbesserungen („Recalculations“), Artikel 3 (1) j: Indikatoren und Artikel 3 (1) k: Informationen zu Änderungen des Nationalen Inventursystems.

Austria's Annual National Greenhouse Gas Inventory 1990-2003 – Vorwort
ii
tem Austria (NISA) entwickelt, das auf der OLI als zentralem Kern aufbaut und diesen Kern erweitert um ein umfassendes Inventurverbesserungsprogramm und der Einführung eines Qualitätsmanagementsystems entsprechend EN 45004. Der vorliegende Bericht wurde vom UMWELTBUNDESAMT auf Grundlage des Umweltkon-trollgesetzes BGBl. Nr. 152/1998 erstellt. Dem UMWELTBUNDESAMT wird in diesem Bun-desgesetz in § 6 (2) Z.15 unter anderem die Aufgabe übertragen, fachliche Grundlagen zur Erfüllung des Rahmenübereinkommens der Vereinten Nationen über Klimaänderungen zu erstellen. In § 6 (2) Z.20 werden die Entwicklung und Führung von Inventuren und Bilanzen zur Dokumentation des Zustandes und der Entwicklung der Umwelt sowie der Umweltbelas-tungen und ihrer Ursachen ausdrücklich als besondere Aufgaben des UMWELTBUNDESAMTES genannt. Diese Aufgabe wird mit der Erstellung sowie der jährlichen Aktualisierung der Österreichi-schen Luftschadstoff-Inventur (OLI) gemäß den in den relevanten internationalen Überein-kommen vereinbarten Richtlinien vom UMWELTBUNDESAMT nachgekommen. Die OLI deckt sowohl Treibhausgasemissionen, als auch Emissionen sonstiger Luftschadstoffe ab und ist damit u.a. die Datenbasis für die Erstellung des vorliegenden Berichts.
Datengrundlage
Das UMWELTBUNDESAMT führt jährlich eine Inventur des Ausstoßes von Luftschadstoffen durch, die als Grundlage für die Erfüllung der nationalen und internationalen Berichtspflichten herangezogen wird. Diese Österreichische Luftschadstoff-Inventur (OLI) wird erforderlichen-falls auch für zurückliegende Jahre aktualisiert, um eine vergleichbare Zeitreihe zur Verfügung zu haben. Die in diesem Bericht dargestellten Emissionsdaten ersetzen somit die publizierten Daten vorhergehender Berichte. Tabelle 1 fasst den Stand der Daten und das Berichtsformat des vorliegenden Berichtes zu-sammen.
Tabelle 1: Datengrundlage des vorliegenden Berichts
Inventur Datenstand Berichtsformat
OLI 2004 Dezember 2004 IPCC Common Reporting Format (CRF)

Austria's Annual National Greenhouse Gas Inventory 1990-2003
1
AUSTRIA'S ANNUAL NATIONAL GREENHOUSE GAS
INVENTORY 1990 - 2003 Submission under Decision 280/2004/EC of the
European Parliament and of the Council concerning a mechanism for monitoring Community greenhouse gas
emissions and for implementing the Kyoto Protocol
Vienna, January 2005
Prepared by UMWELTBUNDESAMT
Austria's Annual National Greenhouse Gas Inventory 1990-2003
2
Title of Inventory Austria's Annual National Greenhouse Gas Inventory 1990-2003
Contact Name Manfred Ritter Organisation UMWELTBUNDESAMT
Address Spittelauer Lände 5 A-1090 Vienna AUSTRIA
Fax + 43 - 1 - 31304 - 5400 Phone + 43 - 1 - 31304 - 5951 E-mail [email protected]

Austria's Annual National Greenhouse Gas Inventory 1990-2003 - Table of Contents
3
TABLE OF CONTENTS
1 INTRODUCTION.................................................................................................5
2 EMISSION TRENDS...........................................................................................7 2.1 Energy (IPCC Category 1)..........................................................................................9 2.2 Industrial Processes (IPCC Category 2).................................................................10 2.3 Solvent and Other Product Use (IPCC Category 3)...............................................10 2.4 Agriculture (IPCC Category 4).................................................................................10 2.5 LUCF (IPCC Category 5) ..........................................................................................11 2.6 Waste (IPCC Category 6) .........................................................................................11
3 INDICATORS....................................................................................................11
4 METHOD OF REPORTING AND DATA BASIS...............................................13 4.1 Relation with earlier reported data .........................................................................14 4.2 Information on Completeness.................................................................................16 4.3 National Inventory System Austria (NISA).............................................................16 4.4 Sources of data ........................................................................................................16 4.5 Methodological changes with respect to the previous submission....................18 4.5.1 Energy (IPCC Category 1) .........................................................................................18 4.5.2 Industrial Processes (IPCC Category 2) ....................................................................19 4.5.3 Agriculture (IPCC Category 4)....................................................................................21 4.5.4 LUCF (IPCC Category 5) ...........................................................................................22 4.5.5 Waste (IPCC Category 6)...........................................................................................22 4.6 Quality Assurance and Quality Control (QA/QC) ..................................................23 4.7 Uncertainty Assessment .........................................................................................23 4.8 Comparison of the Sectoral Approach with the Reference Approach................23
ANNEX I: EMISSION TRENDS
ANNEX II: UNCERTAINITY ASSESSMENT FOR KEY SOURCES
ANNEX III: INFORMATION ON METHODOLOGIES FOR EC KEY SOURCES
ANNEX IV: INDICATORS


Austria's Annual National Greenhouse Gas Inventory 1990-2003 - Introduction
5
1 INTRODUCTION
This report summarises the Austrian greenhouse gas inventory for the years 1990-2003. The greenhouse gas inventory is submitted to the European Commission by the Austrian Federal Government in fulfilment of Austria's obligations under article 3 of Decision 280/2004/EC (“Monitoring Decision”; replacing Decision 389/1992/EEC amended by Deci-sion 296/1999/EEC) concerning a mechanism for monitoring Community greenhouse gas emissions and for implementing the Kyoto Protocol. The purpose of this decision is to moni-tor all anthropogenic greenhouse gas emissions not controlled by the Montreal Protocol and to evaluate the progress towards meeting the greenhouse gas reduction commitments under the UNFCCC and the Kyoto Protocol. According to the above mentioned decision and guidelines the reporting requirements are the same as under the United Nations Framework Convention on Climate Change (UNFCCC), Member States are obliged to determine their anthropogenic emissions by sources and removals by sinks in accordance with the methodologies accepted by the IPCC and agreed upon by the Conference of the Parties to the UNFCCC. The greenhouse gas inventory has to be submitted to the Commission each year, no later than 15 January. Furthermore, Member States have to submit by 15 January elements of their National Inventory Reports (NIRs) relevant for preparation of the community inventory report (Article 3 (1) f). The elements of the so called “Short-NIR” are further specified in Arti-cle 4 of the Implementing Provisions to 280/2004/EC (Commission Decision in preparation). This report was prepared to fulfil the reporting obligations of Article 3 (1) f (“Short-NIR”) and of Article 3 (1) i-k (Information on recalculations, reporting on indicators and information on changes of the national systems) of the Monitoring Decision.


Austria's Annual National Greenhouse Gas Inventory 1990-2003 – Emission Trends
7
2 EMISSION TRENDS
Under the burden sharing agreement of the European Union, Austria is committed to a re-duction of its greenhouse gases by 13% below 1990 levels by 2008-2012. Table 1 shows the summary of Austria’s anthropogenic greenhouse gas emissions 1990-2003.
Table 1: Austria's anthropogenic greenhouse gas emissions by gas
Base year(1) 1990 1995 1996 1997 1998 1999 2000 2001 2002 2003 CO2 equivalent (Gg)
CO2 emissions (without LUCF) (6) 61.263 61.263 63.115 66.562 66.527 66.218 64.614 65.454 69.280 70.994 76.213CH4 9.798 9.798 9.143 8.959 8.681 8.557 8.366 8.146 8.021 7.856 7.807N2O 5.712 5.712 6.138 5.795 5.891 5.974 5.808 5.759 5.731 5.636 5.542HFCs 555 219 555 637 730 813 867 1.019 1.122 1.219 1.308PFCs 69 1.079 69 66 97 45 65 72 82 87 103SF6 1.139 503 1.139 1.218 1.120 908 684 633 637 641 594Total (without CO2 from LUCF) (6) 78.535 78.573 80.159 83.237 83.046 82.514 80.403 81.084 84.872 86.434 91.566
GREENHOUSE GAS EMISSIONS
(1) Base year 1990: CO2, CH4, N2O; base year 1995: HFC, PFC, SF6 (6) The information in these rows is requested to facilitate comparison of data, since Parties differ in the way they report CO2 emissions and removals from Land-Use Change and Forestry.
Austria’s total greenhouse gases showed an increase of 16.6% from the base year to 2003 (CO2: +24.4%). In the period from 2002 to 2003 Austria’s total greenhouse gases increased by 5.9%, CO2 emissions increased by 7.4%. The following figure presents the trend in total GHG emissions 1990-2003 in comparison to Austria’s Kyoto reduction target of 13% from the base year 1990 (BY). This figure excludes emissions and removals from land-use change and forestry (LUCF).
0
10.000
20.000
30.000
40.000
50.000
60.000
70.000
80.000
90.000
100.000
1990
1992
1994
1996
1998
2000
2002
2004
2006
2008
2010
2012
Emis
sion
s [G
g C
O2e
]
Total GHG Emissions (w/o LUCF)
Target 2008-2012 (13% reduction from BY)
Figure 1: Trend in total GHG emissions 1990-2003
Table 2 (CRF Table 10, sheet 5 of 5) presents a summary of Austria’s anthropogenic green-house gas emissions by sector for the period from 1990 to 2003:

Austria's Annual National Greenhouse Gas Inventory 1990-2003 – Emission Trends
8
Table 2: Summary of Austria’s anthropogenic greenhouse gas emissions by sector
GREENHOUSE GAS SOURCE Base year(1) 1990 1995 1996 1997 1998 1999 2000 2001 2002 2003AND SINK CATEGORIES CO2 equivalent (Gg)1. Energy 54.946 54.946 57.201 61.019 60.283 60.287 58.865 59.015 62.928 64.026 69.3312. Industrial Processes 10.115 10.153 9.876 9.752 10.345 9.897 9.591 10.329 10.234 10.964 11.0463. Solvent and Other Product Use 515 515 422 405 423 405 391 414 426 426 4264. Agriculture 8.456 8.456 8.558 8.089 8.145 8.146 7.860 7.724 7.754 7.553 7.3495. Land-Use Change and Forestry (7) -9.013 -9.013 -7.046 -5.192 -11.690 -12.707 -12.637 -13.646 -13.345 -11.311 -12.7736. Waste 4.503 4.503 4.102 3.972 3.850 3.778 3.696 3.602 3.530 3.465 3.4157. Other NO NO NO NO NO NO NO NO NO NO NO
(1) Base year 1990: CO2, CH4, N2O; base year 1995: HFC, PFC, SF6 (7) Net emissions
Austria’s greenhouse gas emissions by sector in the base year and in 2003 as well as their share and trend are presented in the following table.
Table 3: Austria’s greenhouse gas emissions by sector in the base year and in 2003 as well as their share and trend.
Base year* 2003 Base year* 2003 GHG
Emissions [Gg CO2e] Trend BY*-
2003 Share [%]
Total 78.535 91.566 16,6% 100% 100%
1 Energy 54.946 69.331 26,2% 70% 76%
2 Industry 10.115 11.046 9,2% 13% 12%
3 Solvent 515 426 -17,3% 1% 0%
4 Agriculture 8.456 7.349 -13,1% 11% 8%
5 LUCF -9.013 -12.773 41,7% -11% -14%
6 Waste 4.503 3.415 -24,2% 6% 4%
Total emissions without LUCF *1990 for CO2, CH4 and N2O and 1995 for HFC, PFC, and SF6
The dominant sectors are the energy sector, which caused 76% of total greenhouse gas emissions in Austria in 2003 (70% in 1990), followed by the Sector Industrial Processes, which caused 12% of greenhouse gas emissions in 2003 (13% in 1990). The trend of Austria’s greenhouse gas emissions by sector is presented in Figure 2 relative to emissions in the base year 1990.

Austria's Annual National Greenhouse Gas Inventory 1990-2003 – Emission Trends
9
60
70
80
90
100
110
120
130
1990
1991
1992
1993
1994
1995
1996
1997
1998
1999
2000
2001
2002
2003
Emis
sion
s [B
Y=10
0]
1 Energy 2 Industrial Processes3 Solvent and Other Product Use4 Agriculture 6 Waste
Figure 2: Trend in emissions 1990-2003 by sector in index form (base year = 100)
2.1 Energy (IPCC Category 1)
The trend for greenhouse gas emissions from IPCC category 1 (energy) shows that emis-sions stabilized between 1996 and 2000, but emissions increased strongly since from 54 946 Gg CO2 equivalent to 69 331 Gg in 2003, which corresponds to an increase of 26.2%. 99.2% of emissions from this sector in 2003 originated from fossil fuel combustion (Sector 1 A), fugitive emissions from fuels (Sector 1 B) are of minor importance. CO2 contributes 97.9% to total GHG emissions from Energy, N2O 1.2% and CH4 0.9%. The most important energy sub-sectors in 2003 are 1 A 3 Transport with a share of 33%, fol-lowed by 1 A 1 Energy Industries (23%), 1 A 4 Other Sectors (22%), and 1 A 2 Manufactur-ing Industries and Construction (21%). The increasing trend from IPCC Category 1 (Energy) is mainly due to a strong increase of emissions from sub-sector 1 A 3 Transport, which almost doubled from 1990 to 2003 with 82%. Apart from an increase of road performance (miles driven) in Austria, another main reason for this strong increase is tank tourism. In the beginning of the 1990s fuel prices in Austria were higher compared to neighbouring countries, whereas since the middle of the 1990s it is the other way round. Emissions from sub-sector 1 A 1 Energy Industries show an increase of 18% from the base year to 2003. The main drivers for emissions from this sector are total electricity production (which increased about 30% from 1990 to 2003; where consumption increased by 40% over this period) and an increase in heat production, which doubled over this period due to an in-crease of district heating demand in the residential and commercial sector. Furthermore, the share of biomass used as a fuel in this sector and the contribution of hydro plants to total electricity production, which is generally about 75% and varied from 67% to 78% in the ob-served period (depending on the annual water situation), are important drivers. Also the cli-matic circumstances influence emissions from this sector: a “cold winter” leads to an in-crease of heat production.

Austria's Annual National Greenhouse Gas Inventory 1990-2003 – Emission Trends
10
The increase of heating space, warmwater heat demand, climatic circumstances and the change of fuel mix are the most important drivers for emissions from 1 A 4 Other Sectors. However, the effects compensated each other, and emissions in 2003 are on the level of the base year. Emissions from 1 A 2 Manufacturing Industries and Construction increased by 9.1% from 1990 to 2003, mainly due to an increase of natural gas and fuel waste consumption, whereas consumption of solid and liquid fossil fuels is quite stable.
2.2 Industrial Processes (IPCC Category 2)
Greenhouse gas emissions from the industrial processes sector fluctuated during the period 1990-2003 and show a minimum in 1993. In 2003 they were 9.2% above the level of the base year. In 2003 greenhouse gas emissions from Category 2 Industrial Processes amounted to 11 046 Gg CO2 equivalent. The main sources of greenhouse gas emissions in the industrial processes sector are Metal Production and Mineral Products, which caused 41% respectively 28% of the emissions from this sector in 2003. The emission trend in this sector follows production figures to a large ex-tent. The most important GHG of the industry sector was carbon dioxide with 73.8% of emissions from this category, followed by HFCs with 11.8%, N2O with 8.0%, SF6 with 5.4%, PFCs with 0.9% and finally CH4 with 0.1%.
2.3 Solvent and Other Product Use (IPCC Category 3)
In the year 2003, 0.5% of total GHG emissions in Austria (426 Gg CO2 equivalent) took place in the Solvent and Other Product Use sector. Greenhouse gas emissions in this sector decreased by almost 20% from 1990 to 1992 and then remained on that level. In 2002 greenhouse gas emissions from Solvent and Other product Use were 17.3% below the level of the base year (emissions for 2002 have been re-ported as a first estimate of emissions from the year 2003). 55% of these emissions were CO2 emissions, N2O emissions contributed 45%.
2.4 Agriculture (IPCC Category 4)
Greenhouse gas emissions from the agricultural sector fluctuated at the beginning of the 90ties, since 1995 they show a steady downward trend. In the year 2003 emissions from this category were 13.1% below base year. The decrease is mainly due to decreasing livestock numbers. The fluctuations result from variation of mineral fertilizer sales used as activity data for calculating N2O emissions from agricultural soils, which is an important sub source. Emissions from Agriculture amounted to 7 349 Gg CO2 equivalent in 2003, which corre-sponds to 8% of national total emissions. In 2003 the most important sub sector Enteric Fer-mentation contributed 42% to total greenhouse gas emissions from the agricultural sector, the second largest sub source Agricultural Soils had a share of 36%. Agriculture is the largest source for both N2O and CH4 emissions: 61% of all N2O emissions and 51% (190.0 Gg CH4) of all CH4 emissions in Austria in 2003 originated from this sector. N2O emissions from Agriculture amounted to 10.8 Gg in 2003 (3 360 Gg CO2 equivalent), which corresponds to 46% of the GHG emissions from this sector, methane contributed 54%.

Austria's Annual National Greenhouse Gas Inventory 1990-2003 – Indicators
11
2.5 LULUCF (IPCC Category 5)
Land use change and forestry is a net sink in Austria. CO2 removals from that category amounted to 9 013 Gg CO2 in the base year, which corresponds to 11% of national total GHG emissions (without LULUCF) compared to 14% in the year 2003. The trend in net re-movals from LULUCF is plus 42% over the observed period. The main sink is subcategory 5 A Forest Land with net removals of 13 060 Gg CO2 in 2003. Small emissions arise from the other subcategories, where emissions from all other subcate-gories together amounted to 287 Gg CO2 in 2003.
2.6 Waste (IPCC Category 6)
Greenhouse gas emissions from Category 6 Waste decreased steadily during the period, mainly as a result of waste management policies: the amount of land filled waste has de-creased as well as methane recovery . In 2003 the greenhouse gas emissions from the waste sector amounted to 3 415 Gg CO2 equivalent. This was 24% below the level of the base year. The share of emissions from this category in national total emissions was 4% in the year 2003. The main source of greenhouse gas emissions in the waste sector is solid waste disposal on land, which caused 83% of the emissions from this sector in 2003. 92.4% of all greenhouse gas emissions in 2003 from Waste are CH4 emissions, 7.2% are N2O and 0.3% CO2.
3 INDICATORS
Indicators pursuant to article 3 (1) j of the Monitoring Decision are reported in Annex IV. Emission data is consistent with the CRF, denominators are taken from official Austrian sta-tistics.


Austria's Annual National Greenhouse Gas Inventory 1990-2003 – Method of Reporting and Data Basis
13
4 METHOD OF REPORTING AND DATA BASIS
The Austrian greenhouse gas inventory for the period 1990 to 2003 was compiled according to the recommendations for inventories set out in the UNFCCC reporting guidelines accord-ing to Decision 3/CP.5, the Common Reporting Format (CRF), the IPCC 1996 Guidelines for National Greenhouse Gas Inventories and the IPCC Good Practice Guidance which specify the reporting obligations according to Articles 4 and 12 of the UNFCCC. Regulations under the UNFCCC and the Kyoto Protocol define the new standards for na-tional emission inventories. These standards include more stringent requirements related to transparency, consistency, comparability, completeness and accuracy of inventories. Each Party shall have in place a national system, no later than one year prior to the start of the first commitment period (2008-2012). This national system shall include all institutional, legal and procedural arrangements made within a Party for estimating anthropogenic emissions by sources and removals by sinks of all greenhouse gases not controlled by the Montreal Proto-col, and for reporting and archiving inventory information. In Austria, emissions of greenhouse gases are estimated together with emissions of air pol-lutants in a data base based on the CORINAIR (CORe INventory AIR)/ SNAP (Selected No-menclature for sources of Air Pollution) systematic. This nomenclature is designed to esti-mate not only emissions of greenhouse gases but all kind of air pollutants. To comply with the reporting obligations under the UNFCCC, emissions are transformed according to the IPCC Guidelines into the UNFCCC Common Reporting Format. The Austrian greenhouse gas inventory is subject of continuous improvements, resulting in recalculations as outlined in Chapters 2 and 4. Issues identified in the reviews of the inven-tory by the UNFCCC are considered for the inventory improvement program, the last in-depth review took place in October 2004. Annex 1 to this report presents Austria's greenhouse gas inventory data (CO2-emissions, CO2-removals, CH4, N2O, HFC, PFC and SF6) in the format of the CRF Summary Table 10 (Emission Trends) IPCC Table 7A. The complete tables of the Common Reporting Format, including in particular Sectoral Re-ports, Sectoral Background Tables and a Reference Approach for CO2 are submitted sepa-rately in digital form only (excel files). Following table summarises the status of the present report:
Table 4: Status of the present report
Reporting Obligation Format Inventory Version
Mechanism for monitoring Com-munity greenhouse gas emissions
Common Reporting Format (CRF)
OLI 2004 December 2004

Austria's Annual National Greenhouse Gas Inventory 1990-2003 – Method of Reporting and Data Basis
14
4.1 Relation with earlier reported data
As a result of the continuous improvement of Austria’s GHG inventory, emissions of some sources have been recalculated based on updated data or revised methodologies, thus emission data for the years 1990 to 2002 submitted this year differ from previously reported data. The following table presents the recalculation difference with respect to last year’s submis-sion by gas (positive values indicate that this year’s estimate is higher).
Table 5: Recalculation difference of Austria’s greenhouse gas emissions compared to the previous submission
Base year* 2002 Recalculation Difference
[%]
TOTAL +0.7% +2.1%
CO2 +0.6% +1.9%
CH4 +4.5% +5.2%
N2O -4.6% -2.0%
HFC, PFC, SF6 +1.5% +12.2%
Total emissions without LUCF *1990 for CO2, CH4 and N2O and 1995 for
The main reason for the increase of reported CO2 emissions are
• An improved estimation methodology of category 1 A 1 b Petroleum Refining.
• and higher emissions from Industrial Processes mainly due to update of activity data for 2 A 1 Cement Production.
The main reason for the increase of reported methane emissions are higher emissions from 6 A 1 Solid Waste disposal on Land which is mainly due to the use of the IPCC default value for methane oxidation instead of a country-specific value previously used. The main reason for the decrease of reported N2O emissions are lower emissions from 1 A 3 b Road Transport. The emission factors have been updated (updated handbook of emission factors (version 2.1). The main reason for an increase of reported emissions of fluorinated compounds is that dur-ing an internal audit several mistakes and inconsistencies were identified and corrected and the data quality could be improved for some sub-sectors using information from industry. Fur-thermore emissions from 2001 and 2002 were updated using extrapolation techniques and data from industries (previously the same estimated as for 2000 was used for these years). Furthermore, in this year’s submission emissions from industrial electricity and heat autopro-ducers were shifted from category 1 A 2 f Other to the corresponding industrial branches of subcategories 1 A 2 a to 1 A 2 e, 1 A 1 b, 1 A 1 c and 1 A 4 a. A description of these recalculations by sector is given in Chapter 4.5. Improvements made in response to the issues raised in the UNFCCC review process are summarized in the following table.
Austria's Annual National Greenhouse Gas Inventory 1990-2003 – Method of Reporting and Data Basis
15
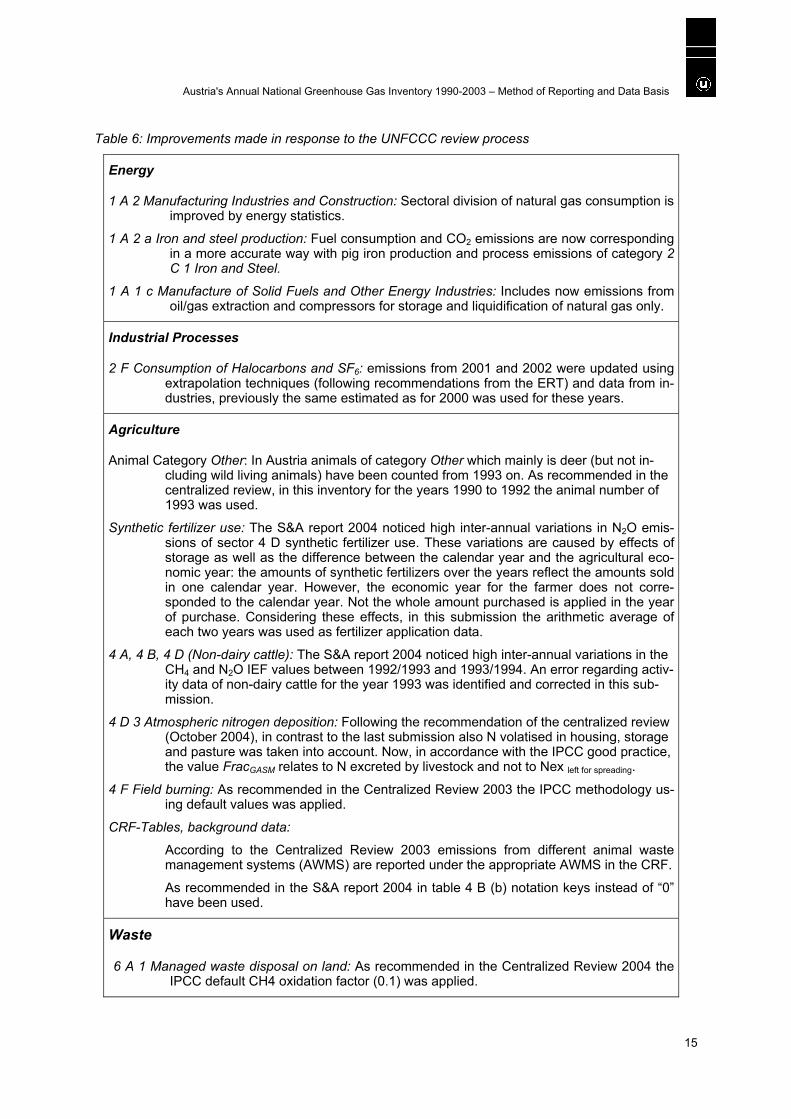
Table 6: Improvements made in response to the UNFCCC review process
Energy
1 A 2 Manufacturing Industries and Construction: Sectoral division of natural gas consumption is improved by energy statistics.
1 A 2 a Iron and steel production: Fuel consumption and CO2 emissions are now corresponding in a more accurate way with pig iron production and process emissions of category 2 C 1 Iron and Steel.
1 A 1 c Manufacture of Solid Fuels and Other Energy Industries: Includes now emissions from oil/gas extraction and compressors for storage and liquidification of natural gas only.
Industrial Processes
2 F Consumption of Halocarbons and SF6: emissions from 2001 and 2002 were updated using extrapolation techniques (following recommendations from the ERT) and data from in-dustries, previously the same estimated as for 2000 was used for these years.
Agriculture
Animal Category Other: In Austria animals of category Other which mainly is deer (but not in-cluding wild living animals) have been counted from 1993 on. As recommended in the centralized review, in this inventory for the years 1990 to 1992 the animal number of 1993 was used.
Synthetic fertilizer use: The S&A report 2004 noticed high inter-annual variations in N2O emis-sions of sector 4 D synthetic fertilizer use. These variations are caused by effects of storage as well as the difference between the calendar year and the agricultural eco-nomic year: the amounts of synthetic fertilizers over the years reflect the amounts sold in one calendar year. However, the economic year for the farmer does not corre-sponded to the calendar year. Not the whole amount purchased is applied in the year of purchase. Considering these effects, in this submission the arithmetic average of each two years was used as fertilizer application data.
4 A, 4 B, 4 D (Non-dairy cattle): The S&A report 2004 noticed high inter-annual variations in the CH4 and N2O IEF values between 1992/1993 and 1993/1994. An error regarding activ-ity data of non-dairy cattle for the year 1993 was identified and corrected in this sub-mission.
4 D 3 Atmospheric nitrogen deposition: Following the recommendation of the centralized review (October 2004), in contrast to the last submission also N volatised in housing, storage and pasture was taken into account. Now, in accordance with the IPCC good practice, the value FracGASM relates to N excreted by livestock and not to Nex left for spreading.
4 F Field burning: As recommended in the Centralized Review 2003 the IPCC methodology us-ing default values was applied.
CRF-Tables, background data:
According to the Centralized Review 2003 emissions from different animal waste management systems (AWMS) are reported under the appropriate AWMS in the CRF.
As recommended in the S&A report 2004 in table 4 B (b) notation keys instead of “0” have been used.
Waste
6 A 1 Managed waste disposal on land: As recommended in the Centralized Review 2004 the IPCC default CH4 oxidation factor (0.1) was applied.

Austria's Annual National Greenhouse Gas Inventory 1990-2003 – Method of Reporting and Data Basis
16
The figures presented in this report replace data reported earlier by Austria under the report-ing framework of the UNFCCC. Such earlier data were included in particular in the inventory chapter of the 2001 Third National Climate Report of the UMWELTBUNDESAMT (Austria's Third National Communication, Chapter 4) and in Austria's 2003 and 2004 submissions to the UNFCCC (Austrian Greenhouse Gas Emissions 1990 to 2001, and 1990-2002 respec-tively).
4.2 Information on Completeness
Geographical coverage is complete. Austria has no territory not covered by the Inventory. Emissions from most sources specified in the CRF have been estimated. For information on sources not estimated (“NE”) and emissions included in other sources than intended by the CRF (“IE”) please refer to Table 9 Completeness of the CRF. Compared to last year’s submission, some additional sources have been included in the in-ventory; please refer to Chapter 4.5 Methodological Changes for details.
4.3 National Inventory System Austria (NISA)
No changes with respect to the National Inventory System in Austria have occurred since the last reporting period, for a description of NISA please refer to Austria’s NIR 2004. Here only a short summary is given: The Umweltbundesamt is designated as single national entity responsible for preparation of the annual greenhouse gas inventory by law: the Environmental Control Act (“Umweltkontrollgesetz”; Federal Law Gazette 152/ 1998) regulates responsibilities of envi-ronmental control in Austria and lists the tasks of the Umweltbundesamt. One task is the preparation of technical expertise and the data basis for fulfilment of the obligations under the UNFCCC and the UNECE LRTAP Convention. Thus the Umweltbundesamt prepares and annually updates the Austrian air emissions inventory (“Österreichische Luftschadstoff-Inventur OLI”), which covers greenhouse gases and emissions of other air pollutants as stipulated in the above mentioned conventions and their protocols. Within the Umweltbundesamt the department of air emissions, with its head Manfred Ritter, is responsible for preparation of the inventory and all work related to inventory preparation. The department for climate change, with its head Klaus Radunsky, is responsible for the quality management of the greenhouse gas inventory. Main data sources used as well as information on who did the actual calculations is pre-sented in the following chapter
4.4 Sources of data
The following table presents the main data sources used for activity data as well as informa-tion on who did the actual calculations:

Austria's Annual National Greenhouse Gas Inventory 1990-2003 – Method of Reporting and Data Basis
17
Table 7: Main data sources for activity data and emission values
Sector Data Sources for Activity Data Emission Calculation
Energy Energy Balance from STATISTIK AUSTRIA, Steam boiler database; UMWELTBUNDESAMT, plant operators
Industry National production statistics, import/export statistics, direct information from industry or associa-tions of industry;
UMWELTBUNDESAMT, plant operators
Study on emissions of FCs contracted out in 2001 (Contractor: EcoEfficient Technologies, Vienna);
Waste Database on landfills UMWELTBUNDESAMT
LUCF National forest inventory obtained from the Austrian Federal Office and Research Centre for Forest
UMWELTBUNDESAMT
Solvent Import/ export statistics, production statistics, consumption statistics;
Contractor: Forschungsinstitut für Energie und Umweltplanung, Wirtschaft und Marktanaly-sen GmbH and Institut für industrielle Ökolo-gie4
Agriculture National Studies, national agricultural statis-tics obtained from STATISTIK AUSTRIA;
Contractors: University of Natural Resources and Applied Life Sciences, Research Center Seibersdorf
The main sources for emission factors are:
• National studies for country specific emission factors
• plant specific data reported by plant operators
• IPCC GPG
• Revised IPCC 1996 Guidelines
• EMEP/CORINAIR Guidebook A complete list of data sources for activity and emission data or emission factors used by sector can be found in the National Inventory Report 2004 to be published in April 2005. Table Summary 3 of the CRF (Summary Report for Methods and Emission Factors Used) presents the methods applied and the origin of emission factors used in the present Austrian GHG-inventory. Additionally, Annex III presents methodologies for sources that contribute to EC key sources.
4 Research Institute for Energy and Environmental Planning, Economy and Market Analysis Ltd. / Institute for In-
dustrial Ecology

Austria's Annual National Greenhouse Gas Inventory 1990-2003 – Method of Reporting and Data Basis
18
4.5 Methodological changes with respect to the previous submission
This chapter describes the methodological changes made to the inventory since the previous submission to the UNFCCC (April 2004). Further background information and a complete description of the 2004 inventory are given in Austria’s National Inventory Report 2005 which will be published in spring 2005.
4.5.1 Energy (IPCC Category 1)
Combustion Activities (1 A)
Update of activity data: 1 A 1 a Public Electricity and Heat Production: Decrease of liquid and solid fuel consumption
due to harmonisation with the energy statistics. In the previous submission activity data from the steam boiler database was taken which was higher than energy statis-tics. For the years 1990 and 1991 plant specific data is updated according to an publication from the “Bundeslastverteiler”. In the previous submission this overhead of plant specific activity data was subtracted from industrial autoproducers which means that this adjustment does not imply changes in total CO2 emissions from liq-uid fuels.
1 A 1 b Petroleum Refining: Shift of liquid fuel consumption to industrial autoproducers. In-crease of natural gas consumption due to shift of consumption for autoproduction from 1 A 2 f.
1 A 1 c Manufacture of Solid Fuels and Other Energy Industries: Error correction of double counting emissions from liquid fuel transformation into gasworks gas. Increase of natural gas consumption due to shift of consumption for autoproduction from 1 A 2 f. Correction of natural gas consumption for oil/gas extraction and storage for 2001 an 2002 which is based on improved energy statistics.
1 A 2 a Iron and Steel: Activity data is now fully taken from the energy balance which is con-sistent with plant operators information. In the previous submission information about activity data was partly taken from plant operator. Especially for the year 2002 coke oven coke consumption has been corrected and is now consistent with pig iron production.
1 A 2 b, c, d, e: Each subcategory includes consumption for electricity and heat autoproduc-tion which was included in category 1 A 2 f Other in the previous submission.
1 A 2 f Manufacturing Industries and Construction-Other-Stationary: Now includes consump-tion for electricity and heat autoproduction not allocated to subcategories 1 A 1 b, 1 A 1 c, 1 A 2 a to 1 A 2 e, 1 A 4 a and 1 a 4 c.
1 A 3 e Other Transportation (Pipeline compressors): Natural gas consumption is corrected from 1999 on.
1 A 4 a Commercial/Institutional-Stationary 1 A 4 c Agriculture/Forestry/Fishing-Stationary: Both subcategories include consumption for
electricity and heat autoproduction which was included in category 1 A 2 f Other in the previous submission. Revision of final energy consumption for space and warmwater heating based on new statistical surveys of STATISTIK AUSTRIA.
1 A 4 b Residential-Stationary: Revision of final energy consumption for space and warmwa-ter heating.

Austria's Annual National Greenhouse Gas Inventory 1990-2003 – Method of Reporting and Data Basis
19
1 A 2 f Manufacturing Industries and Construction-Other-Stationary: Update of activity data of off road machinery (mainly in construction sector)
1 A 4 c Agriculture/Forestry/Fishing-Mobile: Update of activity data of off road machinery (1990 mainly in forestry sector) due to a new study [Handler, Abschätzung des Dieselverbrauchs in der österreichischen Landwirtschaft, Bundesanstalt für Land-technik, BLT-Wieselburg 2003]
Improvements of methodologies and emission factors: 1 A 1 b Petroleum Refining: Improved methodology for CO2 which is now based upon plant
specific emission factors and consistent with the energy balance. The new method-ology has been approved and checked with the plant operator.
1 A 3 a Civil Aviation: The splitting of the energy data into national and international aviation of 2001 and 2002 has been updated according to the energy balance. The splitting of the energy data of 2003 into national and international aviation has been done according to the flight numbers of arrival and departure flights (Statistic Austria)
1 A 3 b Road Transport: The emission factors used in the inventory for have been updated using the updated handbook of emission factors (version 2.1). The handbook is the result of new measurements.
Fugitive Emissions (1 B)
Update of activity data: 1 B 1 a Coal Mining and 1 B 2 b ii Natural Gas Distribution: Activity data for 2002 has been updated. 1 B 2 a Refining/Storage: Activity data for the whole time series have been updated with data from the national
energy balance
4.5.2 Industrial Processes (IPCC Category 2)
Addition of source categories: 2 C 2 Ferroalloys (CO2) has been added to the inventory.
Changes in the use of Notation Keys: 2 A 5 Asphalt Roofing and 2 A 6 Road Paving with Asphalt: emissions are now reported as “IE”, as emissions are already included in the Sol-
vents Sector.

Austria's Annual National Greenhouse Gas Inventory 1990-2003 – Method of Reporting and Data Basis
20
2 A 4 Soda Ash Production and Use: CO2 Emissions from Soda Ash Production are now reported as “IE”, as coke used in
the process is already considered as fuel in the Energy Sector (1 A 2 c Chemical In-dustries).
Update of activity data: 2 B 5 Chemical Industries - Other: CO2 emissions from fertilizer production for 1992-1994 have been updated using in-
formation from Industry. Emissions from 1990-1991 were recalculated using the av-erage EF from 1993-2003.
2 A 1 Cement Production: activity and emission data for CO2 emissions from Cement Production 1998-2002
have been updated using data from a study based on plant specific data. 2 A 7 a Bricks: activity data for 2002 has been updated. 2 C 1 Iron and Steel:
Activity data for 2002 has been updated.
Improvements of methodologies and emission factors: 2 B 5 Chemical Industries - Other: As indicated in the NIR 2004, there had been an inconsistency of the time series for
CH4 emissions from urea production; now the time series has been recalculated to improve time series consistency.
2 C 1 Iron and Steel: For calculating CO2 emissions electric arc furnaces now a country specific emission
factor is used (previously an emission factor taken from a Swiss publication was ap-plied).
Process specific CO2 emissions from pig iron production have been recalculated as the underlying activity data used for the calculation (non-energy use of coke) has been updated in the national energy balance.
2 C 3 Aluminium Production: Activity data used for calculation of PFC and CO2 emissions from Aluminium Pro-
duction has been harmonized. 2 F Consumption of Halocarbons and SF6: During an internal audit several mistakes and inconsistencies were identified and
corrected and the data quality could be improved for some sub-sectors using infor-mation from industry. Furthermore emissions from 2001 and 2002 were updated us-ing extrapolation techniques (following recommendations from the ERT) and data from industries, previously the same estimated as for 2000 was used for these years.

Austria's Annual National Greenhouse Gas Inventory 1990-2003 – Method of Reporting and Data Basis
21
4.5.3 Agriculture (IPCC Category 4)
Update of activity data: Animal Category Other: In Austria animals of category Other which mainly is deer (but not wild living ani-
mals) have been counted from 1993 on. As recommended in the centralized review, the animal number of 1993 was used for the years 1990 to 1992.
Animal Category Soliped: In the last submissions the number of soliped of the years 2000 to 2002 was based
on expert judgement. For transparency reasons in this inventory the 1999 value was held constant until 2002. In the current inventory a new 2003 value of animal cate-gory Soliped is available.
Improvements of methodologies and emission factors: Synthetic fertilizer use: The S&A report 2004 noticed high inter-annual variations in N2O emissions of sector
4 D synthetic fertilizer use. These variations are caused by effects of storage as well as the difference between the calendar year and the agricultural economic year: the amounts of synthetic fertilizers over the years reflect the amounts sold in one calen-dar year. However, the economic year for the farmer does not corresponded to the calendar year. Not the whole amount purchased is applied in the year of purchase. Considering these effects, in this submission the arithmetic average of each two years was used as fertilizer application data.
4 A, 4 B, 4 D (Non-dairy cattle): The S&A report 2004 noticed high inter-annual variations in the CH4 and N2O IEF
values between 1992/1993 and 1993/1994. An error regarding activity data of non-dairy cattle for the year 1993 was identified and corrected in this submission.
4 B In the last submissions, the Nex and VSex values from 1999 to 2003 were extrapo-lated on the basis of the published Nex and VSex data with a corresponding milk yield of 5000 kg. In this year’s calculations also the corresponding Nex and VSex values of a milk yield of 6000 kg published in [GRUBER & STEINWIDDER, 1996] were con-sidered. The values were calculated via interpolation.
4 D 3 Atmospheric nitrogen deposition: Following a recommendation of the centralized review (October 2004), in contrast to
the last submission also N volatised in housing, storage and pasture was taken into account. Now, in accordance with the IPCC good practice, the value FracGASM re-lates to N excreted by livestock and not to Nex left for spreading.
4 F 1 a Field burning (Cereals / Wheat): As recommended in the Centralized Review 2003 the IPCC methodology using de-
fault values was applied. CRF-Tables, background data: According to the Centralized Review 2003 emissions from different animal waste
management systems (AWMS) are reported under the appropriate AWMS in the CRF.
As recommended in the S&A report 2004 in table 4.B (b) notation keys instead of “0” have been used.

Austria's Annual National Greenhouse Gas Inventory 1990-2003 – Method of Reporting and Data Basis
22
4.5.4 LULUCF (IPCC Category 5)
Addition of source or sink categories: 5 B 1, 5 C 1:
CO2 emissions and removals from cropland and grassland management (categories 5 B 1 and 5 C 1) including liming have been added to the inventory, the estimate for 1990 was reported for all years.
Update of activity data: Activity data for forest areas since 1997 have been updated according to the data of a new forest inventory (period 2000/2002).
Improvements of methodologies and emission factors: Land use changes from and to forest land have been considered in the inventory, based on results of the new forest inventory.
4.5.5 Waste (IPCC Category 6)
Update of activity data 6 A 1 Managed waste disposal on land: The Activity data was updated. According to the Austrian Landfill Ordinance the op-
erators of landfill sites have to report their activity data annually. Due to reports after the due date there are minor changes of the activity data in this submission com-pared to previous submission.
An error in the calculation of the formation potential of landfill gas was identified and corrected.
6 B Waste Water Handling: The number of inhabitants and the daily protein intake were updated according to
STATISTIK AUSTRIA and FAO statistics respectively. 6 D Compost production: Activity data was updated and interpolated for years where no data was available.
Improvements of methodology: 6 A 1 Managed waste disposal on land: As recommended in the Centralized Review 2004 the IPCC default CH4 oxidation
factor (0.1) was applied. 6 B Waste Water Handling Emissions of N2O have been recalculated taking into account the increasing amount
of waste water treated in waste water treatment plants and the increasing amount of denitrification. The data were taken from the Austrian reports on water pollution con-trol (GEWÄSSERSCHUTZBERICHTE 1993 –1996).

Austria's Annual National Greenhouse Gas Inventory 1990-2003 – Method of Reporting and Data Basis
23
4.6 Quality Assurance and Quality Control (QA/QC)
A quality management system (QMS) has been designed to ensure conformity with IPCC-GPG quality requirements. The QMS has been drawn up according to the European Stan-dard ISO EN 45004:1995: general Criteria for the operation of various types of bodies per-forming inspections. The QMS ensures that all requirements of a type A inspection body as stipulated in ISO EN 45004 are met, which include strict independence, impartiality and in-tegrity. The Quality Assurance and Quality Control (QA/QC) procedures within the QMS cor-respond to the QA/QC system outlined in the IPCC-GPG Chapter 8. With the Kyoto Protocol entering into force, pressure upon national GHG emission invento-ries is assumed to increase, for this reason a management system in the form of a QMS ac-cording to ISO EN 45004 is believed to ensure accuracy and credibility of emission data which form the basis for the international emissions trading scheme. The Austrian Quality Management System is described in detail in Austria’s NIR 2004. Since the last submission, the application for accreditation has been made - accreditation is ex-pected for 2005.
4.7 Uncertainty Assessment
A first comprehensive uncertainty analysis was performed in the form of a pilot study by WINIWARTER & RYPDAL5, 2001 on greenhouse gases CO2, CH4, and N2O for the years 1990 and 1997. Information on this uncertainty estimate using Monte Carlo Analysis can be found in Austria’s NIR 2004. This year updated uncertainty estimates for all key sources of the inventory are provided. They are based on estimates made in the first uncertainty analysis as described in the NIR 2004 and on expert judgement by experts preparing the relevant part of the inventory (refer-ences and detailed explanations will be provided in the NIR 2005). They are presented in Annex II.
4.8 Comparison of the Sectoral Approach with the Reference Approach
At the following CO2 emissions from the sectoral and reference approach are compared and explanations for the differences are provided. Table 8 shows the comparison of CO2 emissions from the two approaches. Note that in rela-tion to previous submission the fractions of carbon stored were changed from 100% to IPCC default values except for coke oven coke, for which a fraction of 0.7% of total consumption is considered to be stored in steel. This leads to a significant deviation of the two approaches.
5 WINIWARTER, W.; RYPDAL, K. (2001): Assessing the Uncertainty Associated with National Greenhouse Gas
Emission Inventories: A Case Study for Austria, Atmospheric Environment 35 (2001) 5425-5440.

Austria's Annual National Greenhouse Gas Inventory 1990-2003 – Method of Reporting and Data Basis
24
Table 8: Comparison of CO2 emissions of the two approaches
Reference Approach Sectoral Approach Year Liquid
[Gg CO2] Solid
[Gg CO2] Gaseous [Gg CO2]
Total [Gg CO2]
Liquid [Gg CO2]
Solid [Gg CO2]
Gaseous [Gg CO2]
Other [Gg CO2]
Total [Gg CO2]
1990 28 565 15 914 12 238 56 716 28 051 13 907 11 088 379 53 425
1991 30 984 16 770 12 939 60 693 30 551 14 515 11 686 373 57 126
1992 30 072 12 952 12 705 55 729 29 323 10 683 11 749 551 52 306
1993 31 114 11 649 13 399 56 163 30 742 9 563 12 250 371 52 926
1994 30 359 11 808 13 782 55 950 30 114 9 488 12 868 430 52 900
1995 30 919 13 496 15 048 59 463 30 315 10 844 13 957 423 55 540
1996 33 392 13 665 16 017 63 073 32 941 10 827 15 109 482 59 359
1997 32 869 14 446 15 437 62 752 32 147 11 416 14 573 542 58 677
1998 35 144 12 634 15 848 63 626 34 290 9 022 14 887 467 58 666
1999 33 179 12 678 16 125 61 982 32 332 9 325 15 038 535 57 229
2000 32 305 14 240 15 388 61 934 31 689 10 685 14 461 617 57 452
2001 34 704 14 765 16 309 65 778 33 863 11 305 15 371 754 61 292
2002 35 534 15 048 16 494 67 076 35 013 11 272 15 340 754 62 420
2003 38 645 15 684 17 834 72 163 38 166 12 131 16 569 754 67 624
Table 9 shows the percentual difference of the two approaches which yearly average is 6.9% for total CO2.
Table 9: Deviation of CO2 emissions of the two approaches
Year Liquid Solid Gaseous Total
1990 1.82% 14.44% 10.37% 6.16%
1991 1.41% 15.54% 10.72% 6.24%
1992 2.55% 21.24% 8.14% 6.54%
1993 1.21% 21.82% 9.38% 6.12%
1994 0.82% 24.45% 7.10% 5.76%
1995 1.99% 24.45% 7.81% 7.06%
1996 1.37% 26.21% 6.01% 6.26%
1997 2.25% 26.55% 5.93% 6.94%
1998 2.49% 40.03% 6.46% 8.46%
1999 2.62% 35.99% 7.23% 8.31%
2000 1.94% 33.27% 6.42% 7.80%
2001 2.49% 30.61% 6.10% 7.32%
2002 1.49% 33.50% 7.52% 7.46%
2003 1.25% 29.29% 7.63% 6.71%
Positive numbers indicate that CO2 emissions from the reference approach are higher than emissions from the sectoral approach.

Austria's Annual National Greenhouse Gas Inventory 1990-2003 – Method of Reporting and Data Basis
25
Reasons for deviation of CO2 emissions:
• In the reference approach the IPCC default net calorific values are used. In the sec-toral approach country specific net calorific values are taken to calculate the energy consumption.
• The selected emission factors (carbon content) of the two approaches are different.
• Liquid Fuels: Energy balance is mass balanced but not carbon balanced. Fuel cate-gory Other Oil is an aggregation of several fuel types and therefore it is difficult to quantify a reliable carbon emission factor for the reference approach. The reference approach considers a share of feed stocks used for plastics production and solvent production as non-carbon-stored. In the sectoral approach a share of emissions from waste incineration of plastics is included in category 1 A 1 a Public Electricity and Heat Production. Emissions from solvents use are included in category 3 Solvent an Other Products Use. In the sectoral approach a share of municipal solid waste with-out energy recovery is considered in category 6C for the years 1990 and1991.
• Solid fuels: Reference Approach includes process emissions from blast furnaces and steel production which are included in category 2 C Metal Production as well as proc-ess emissions from carbide production which are included in category 2 B 4 Carbide Production.
• Gaseous fuels: National approach uses sector specific carbon contents and heating values different to IPCC default factors. Process emissions from ammonia-production are included in category 2 B 1 Ammonia Production.
• Other fuels: The sectoral approach considers waste as an additional fuel type (e.g. municipal solid waste, hazardous waste and industrial fuel waste)
Simple approach of quantification the deviation: By quantifying the deviation between the two approaches with a simple approach it may be seen that the resulting rest-difference of total CO2 emissions is less than -3 % for all years. Note that this may be interpreted that the sectoral approach plus the process emissions would be even higher than the reference approach. At current is not possible to quantify the amount of solvents and plastics products which are imported or exported by products, bulk or waste. Furthermore it is known that petrol coke is imported and used for carbide production but not considered in the energy bal-ance.

Austria's Annual National Greenhouse Gas Inventory 1990-2003 – Method of Reporting and Data Basis
26
Table 10: Quantification of deviation between the two approaches
Year Natural Gas (1)
2 B Chemi-cal Indus-
try(3) 2 C Metal Production
3 Solvent Use Total
Remaining total devia-
tion(2)
1990 376 427 3 725 283 4 811 -2.7%
1991 422 436 3 688 237 4 783 -2.0%
1992 418 409 3 158 188 4 173 -1.3%
1993 374 437 3 143 187 4 141 -1.6%
1994 420 404 3 398 172 4 394 -2.4%
1995 576 489 3 908 190 5 163 -2.1%
1996 383 484 3 694 173 4 734 -1.6%
1997 343 475 4 083 190 5 091 -1.6%
1998 449 521 3 887 172 5 029 -0.1%
1999 571 492 3 749 158 4 970 -0.4%
2000 416 484 4 185 181 5 266 -1.3%
2001 154 462 4 144 194 4 954 -0.7%
2002 350 469 4 637 194 5 650 -1.5%
2003 390 518 4 532 194 5 634 -1.5%
(1) Deviation due to the use of different carbon emissions factors, losses and statistical dif-
ferences. (2) Negative numbers indicate that CO2 emissions from the reference approach are lower
than emissions from the sectoral approach. (3) Excluding carbide production.

Austria's Annual National Greenhouse Gas Inventory 1990-2003 – ANNEX I: Emission Trends
27
ANNEX I: EMISSION TRENDS
This Annex presents emission trends for CO2, CH4, N2O and FCs. This report uses the following UNFCCC notation keys for all tables: NE (not estimated): for existing emissions by sources and removals by sinks of green-
house gases which have not been estimated. IE (included elsewhere): for emissions by sources and removals by sinks of greenhouse
gases estimated but included elsewhere in the inventory instead of the expected source/sink category.
NO (not occurring): for emissions by sources and removals by sinks of greenhouse gases that do not occur for a particular gas or source/sink category.
NA (not applicable): for activities in a given source/sink category that do not result in emissions or removals of a specific gas.
C (confidential): for emissions which could lead to the disclosure of confidential in-formation if reported at the most disaggregated level. In this case a minimum of aggregation is required to protect business information.
Austria's Annual National Greenhouse Gas Inventory 1990-2003 – ANNEX I: Emission Trends
28
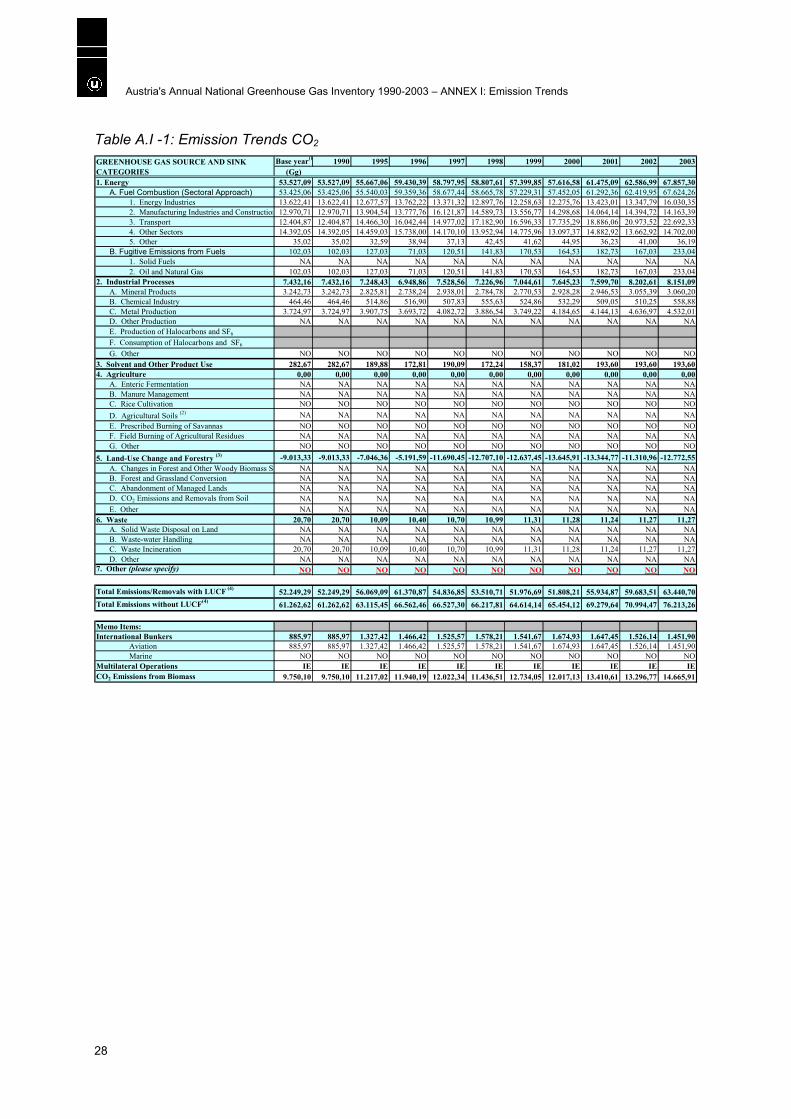
Table A.I -1: Emission Trends CO2
Base year(1 1990 1995 1996 1997 1998 1999 2000 2001 2002 2003(Gg)
1. Energy 53.527,09 53.527,09 55.667,06 59.430,39 58.797,95 58.807,61 57.399,85 57.616,58 61.475,09 62.586,99 67.857,30A. Fuel Combustion (Sectoral Approach) 53.425,06 53.425,06 55.540,03 59.359,36 58.677,44 58.665,78 57.229,31 57.452,05 61.292,36 62.419,95 67.624,26
1. Energy Industries 13.622,41 13.622,41 12.677,57 13.762,22 13.371,32 12.897,76 12.258,63 12.275,76 13.423,01 13.347,79 16.030,352. Manufacturing Industries and Construction 12.970,71 12.970,71 13.904,54 13.777,76 16.121,87 14.589,73 13.556,77 14.298,68 14.064,14 14.394,72 14.163,393. Transport 12.404,87 12.404,87 14.466,30 16.042,44 14.977,02 17.182,90 16.596,33 17.735,29 18.886,06 20.973,52 22.692,334. Other Sectors 14.392,05 14.392,05 14.459,03 15.738,00 14.170,10 13.952,94 14.775,96 13.097,37 14.882,92 13.662,92 14.702,005. Other 35,02 35,02 32,59 38,94 37,13 42,45 41,62 44,95 36,23 41,00 36,19
B. Fugitive Emissions from Fuels 102,03 102,03 127,03 71,03 120,51 141,83 170,53 164,53 182,73 167,03 233,041. Solid Fuels NA NA NA NA NA NA NA NA NA NA NA2. Oil and Natural Gas 102,03 102,03 127,03 71,03 120,51 141,83 170,53 164,53 182,73 167,03 233,04
2. Industrial Processes 7.432,16 7.432,16 7.248,43 6.948,86 7.528,56 7.226,96 7.044,61 7.645,23 7.599,70 8.202,61 8.151,09A. Mineral Products 3.242,73 3.242,73 2.825,81 2.738,24 2.938,01 2.784,78 2.770,53 2.928,28 2.946,53 3.055,39 3.060,20B. Chemical Industry 464,46 464,46 514,86 516,90 507,83 555,63 524,86 532,29 509,05 510,25 558,88C. Metal Production 3.724,97 3.724,97 3.907,75 3.693,72 4.082,72 3.886,54 3.749,22 4.184,65 4.144,13 4.636,97 4.532,01D. Other Production NA NA NA NA NA NA NA NA NA NA NAE. Production of Halocarbons and SF6
F. Consumption of Halocarbons and SF6
G. Other NO NO NO NO NO NO NO NO NO NO NO3. Solvent and Other Product Use 282,67 282,67 189,88 172,81 190,09 172,24 158,37 181,02 193,60 193,60 193,604. Agriculture 0,00 0,00 0,00 0,00 0,00 0,00 0,00 0,00 0,00 0,00 0,00
A. Enteric Fermentation NA NA NA NA NA NA NA NA NA NA NAB. Manure Management NA NA NA NA NA NA NA NA NA NA NAC. Rice Cultivation NO NO NO NO NO NO NO NO NO NO NOD. Agricultural Soils (2) NA NA NA NA NA NA NA NA NA NA NAE. Prescribed Burning of Savannas NO NO NO NO NO NO NO NO NO NO NOF. Field Burning of Agricultural Residues NA NA NA NA NA NA NA NA NA NA NAG. Other NO NO NO NO NO NO NO NO NO NO NO
5. Land-Use Change and Forestry (3) -9.013,33 -9.013,33 -7.046,36 -5.191,59 -11.690,45 -12.707,10 -12.637,45 -13.645,91 -13.344,77 -11.310,96 -12.772,55A. Changes in Forest and Other Woody Biomass St NA NA NA NA NA NA NA NA NA NA NAB. Forest and Grassland Conversion NA NA NA NA NA NA NA NA NA NA NAC. Abandonment of Managed Lands NA NA NA NA NA NA NA NA NA NA NAD. CO2 Emissions and Removals from Soil NA NA NA NA NA NA NA NA NA NA NAE. Other NA NA NA NA NA NA NA NA NA NA NA
6. Waste 20,70 20,70 10,09 10,40 10,70 10,99 11,31 11,28 11,24 11,27 11,27A. Solid Waste Disposal on Land NA NA NA NA NA NA NA NA NA NA NAB. Waste-water Handling NA NA NA NA NA NA NA NA NA NA NAC. Waste Incineration 20,70 20,70 10,09 10,40 10,70 10,99 11,31 11,28 11,24 11,27 11,27D. Other NA NA NA NA NA NA NA NA NA NA NA
7. Other (please specify) NO NO NO NO NO NO NO NO NO NO NO
Total Emissions/Removals with LUCF (4) 52.249,29 52.249,29 56.069,09 61.370,87 54.836,85 53.510,71 51.976,69 51.808,21 55.934,87 59.683,51 63.440,70Total Emissions without LUCF(4) 61.262,62 61.262,62 63.115,45 66.562,46 66.527,30 66.217,81 64.614,14 65.454,12 69.279,64 70.994,47 76.213,26
Memo Items:International Bunkers 885,97 885,97 1.327,42 1.466,42 1.525,57 1.578,21 1.541,67 1.674,93 1.647,45 1.526,14 1.451,90
Aviation 885,97 885,97 1.327,42 1.466,42 1.525,57 1.578,21 1.541,67 1.674,93 1.647,45 1.526,14 1.451,90Marine NO NO NO NO NO NO NO NO NO NO NO
Multilateral Operations IE IE IE IE IE IE IE IE IE IE IECO2 Emissions from Biomass 9.750,10 9.750,10 11.217,02 11.940,19 12.022,34 11.436,51 12.734,05 12.017,13 13.410,61 13.296,77 14.665,91
GREENHOUSE GAS SOURCE AND SINK CATEGORIES

Austria's Annual National Greenhouse Gas Inventory 1990-2003 – ANNEX I: Emission Trends
29
Table A.I -2: Emission Trends CH4
Base year(1 1990 1995 1996 1997 1998 1999 2000 2001 2002 2003(Gg)
Total Emissions 466,56 466,56 435,37 426,61 413,40 407,48 398,37 387,92 381,93 374,11 371,741. Energy 35,56 35,56 33,46 35,35 30,76 30,15 30,32 28,89 30,27 29,70 31,11
A. Fuel Combustion (Sectoral Approach) 22,34 22,34 19,51 20,43 15,94 15,36 15,32 14,31 15,53 14,82 15,821. Energy Industries 0,15 0,15 0,16 0,19 0,19 0,19 0,16 0,17 0,19 0,21 0,312. Manufacturing Industries and Construction 0,39 0,39 0,45 0,46 0,50 0,47 0,46 0,47 0,47 0,49 0,473. Transport 2,91 2,91 1,99 1,82 1,63 1,56 1,40 1,29 1,19 1,14 1,074. Other Sectors 18,88 18,88 16,90 17,96 13,63 13,13 13,30 12,38 13,68 12,98 13,965. Other 0,00 0,00 0,00 0,00 0,00 0,00 0,00 0,00 0,00 0,00 0,00
B. Fugitive Emissions from Fuels 13,22 13,22 13,96 14,92 14,82 14,80 15,01 14,58 14,74 14,88 15,291. Solid Fuels 0,52 0,52 0,28 0,24 0,24 0,24 0,24 0,27 0,26 0,39 0,392. Oil and Natural Gas 12,70 12,70 13,68 14,68 14,58 14,55 14,76 14,31 14,49 14,49 14,91
2. Industrial Processes 0,36 0,36 0,34 0,35 0,36 0,39 0,35 0,35 0,32 0,36 0,35A. Mineral Products NA NA NA NA NA NA NA NA NA NA NAB. Chemical Industry 0,35 0,35 0,33 0,34 0,35 0,38 0,34 0,35 0,32 0,35 0,34C. Metal Production 0,00 0,00 0,00 0,00 0,00 0,00 0,00 0,00 0,00 0,00 0,00D. Other Production NA NA NA NA NA NA NA NA NA NA NAE. Production of Halocarbons and SF6
F. Consumption of Halocarbons and SF6
G. Other NO NO NO NO NO NO NO NO NO NO NO3. Solvent and Other Product Use NA NA NA NA NA NA NA NA NA NA NA4. Agriculture 219,15 219,15 211,77 208,45 206,11 205,52 201,19 197,73 195,49 191,25 189,97
A. Enteric Fermentation 170,15 170,15 164,02 161,60 159,25 158,15 156,28 154,15 151,58 148,74 147,32B. Manure Management 48,60 48,60 47,25 46,34 46,35 46,86 44,39 43,06 43,41 42,02 42,16C. Rice Cultivation NO NO NO NO NO NO NO NO NO NO NOD. Agricultural Soils 0,33 0,33 0,44 0,45 0,45 0,45 0,45 0,45 0,43 0,43 0,43E. Prescribed Burning of Savannas NO NO NO NO NO NO NO NO NO NO NOF. Field Burning of Agricultural Residues 0,07 0,07 0,07 0,06 0,07 0,07 0,07 0,06 0,07 0,07 0,06G. Other NO NO NO NO NO NO NO NO NO NO NO
5. Land-Use Change and Forestry NA NA NA NA NA NA NA NA NA NA NAA. Changes in Forest and Other Woody Biomass St NA NA NA NA NA NA NA NA NA NA NAB. Forest and Grassland Conversion NA NA NA NA NA NA NA NA NA NA NAC. Abandonment of Managed Lands NA NA NA NA NA NA NA NA NA NA NAD. CO2 Emissions and Removals from Soil NA NA NA NA NA NA NA NA NA NA NAE. Other NA NA NA NA NA NA NA NA NA NA NA
6. Waste 211,49 211,49 189,80 182,46 176,17 171,42 166,51 160,94 155,84 152,80 150,31A. Solid Waste Disposal on Land 197,34 197,34 174,64 167,23 160,94 156,13 151,14 145,55 140,39 137,27 134,71B. Waste-water Handling 13,64 13,64 14,12 14,14 14,15 14,17 14,19 14,23 14,28 14,36 14,42C. Waste Incineration 0,00 0,00 0,00 0,00 0,00 0,00 0,00 0,00 0,00 0,00 0,00D. Other 0,52 0,52 1,04 1,09 1,08 1,12 1,18 1,16 1,17 1,17 1,19
7. Other (please specify) NO NO NO NO NO NO NO NO NO NO NO
Memo Items:International Bunkers 0,01 0,01 0,02 0,02 0,03 0,03 0,03 0,03 0,03 0,03 0,02
Aviation 0,01 0,01 0,02 0,02 0,03 0,03 0,03 0,03 0,03 0,03 0,02Marine NO NO NO NO NO NO NO NO NO NO NO
Multilateral Operations IE IE IE IE IE IE IE IE IE IE IECO2 Emissions from Biomass
GREENHOUSE GAS SOURCE AND SINK CATEG

Austria's Annual National Greenhouse Gas Inventory 1990-2003 – ANNEX I: Emission Trends
30
Table A.I -3: Emission Trends N2O Base year(1 1990 1995 1996 1997 1998 1999 2000 2001 2002 2003
(Gg)Total Emissions 18,43 18,43 19,80 18,69 19,00 19,27 18,73 18,58 18,49 18,18 17,881. Energy 2,17 2,17 2,68 2,73 2,71 2,73 2,67 2,55 2,64 2,63 2,65
A. Fuel Combustion (Sectoral Approach) 2,17 2,17 2,68 2,73 2,71 2,73 2,67 2,55 2,64 2,63 2,651. Energy Industries 0,15 0,15 0,16 0,16 0,15 0,17 0,17 0,18 0,20 0,20 0,222. Manufacturing Industries and Construction 0,51 0,51 0,55 0,54 0,59 0,57 0,58 0,55 0,55 0,55 0,533. Transport 0,55 0,55 1,02 1,00 0,94 0,99 0,91 0,89 0,88 0,91 0,914. Other Sectors 0,95 0,95 0,94 1,03 1,03 0,99 1,01 0,93 1,00 0,96 0,985. Other 0,00 0,00 0,00 0,00 0,00 0,00 0,00 0,00 0,00 0,00 0,00
B. Fugitive Emissions from Fuels 0,00 0,00 0,00 0,00 0,00 0,00 0,00 0,00 0,00 0,00 0,001. Solid Fuels NA NA NA NA NA NA NA NA NA NA NA2. Oil and Natural Gas IE IE IE IE IE IE IE IE IE IE IE
2. Industrial Processes 2,94 2,94 2,77 2,82 2,78 2,89 2,98 3,07 2,54 2,60 2,85A. Mineral Products NA NA NA NA NA NA NA NA NA NA NAB. Chemical Industry 2,94 2,94 2,77 2,82 2,78 2,89 2,98 3,07 2,54 2,60 2,85C. Metal Production 0,00 0,00 0,00 0,00 0,00 0,00 0,00 0,00 0,00 0,00 0,00D. Other Production NA NA NA NA NA NA NA NA NA NA NAE. Production of Halocarbons and SF6
F. Consumption of Halocarbons and SF6
G. Other NO NO NO NO NO NO NO NO NO NO NO3. Solvent and Other Product Use 0,75 0,75 0,75 0,75 0,75 0,75 0,75 0,75 0,75 0,75 0,754. Agriculture 12,43 12,43 13,26 11,97 12,31 12,36 11,73 11,52 11,77 11,41 10,84
A. Enteric Fermentation NA NA NA NA NA NA NA NA NA NA NAB. Manure Management 2,54 2,54 2,50 2,45 2,43 2,42 2,38 2,34 2,32 2,28 2,27C. Rice Cultivation NO NO NO NO NO NO NO NO NO NO NOD. Agricultural Soils 9,90 9,90 10,76 9,52 9,88 9,93 9,34 9,18 9,44 9,13 8,57E. Prescribed Burning of Savannas NO NO NO NO NO NO NO NO NO NO NOF. Field Burning of Agricultural Residues 0,00 0,00 0,00 0,00 0,00 0,00 0,00 0,00 0,00 0,00 0,00G. Other NO NO NO NO NO NO NO NO NO NO NO
5. Land-Use Change and Forestry NA NA NA NA NA NA NA NA NA NA NAA. Changes in Forest and Other Woody Biomass St NA NA NA NA NA NA NA NA NA NA NAB. Forest and Grassland Conversion NA NA NA NA NA NA NA NA NA NA NAC. Abandonment of Managed Lands NA NA NA NA NA NA NA NA NA NA NAD. CO2 Emissions and Removals from Soil NA NA NA NA NA NA NA NA NA NA NAE. Other NA NA NA NA NA NA NA NA NA NA NA
6. Waste 0,13 0,13 0,34 0,42 0,45 0,54 0,61 0,68 0,79 0,79 0,80A. Solid Waste Disposal on Land NA NA NA NA NA NA NA NA NA NA NAB. Waste-water Handling 0,05 0,05 0,19 0,26 0,30 0,38 0,44 0,51 0,62 0,62 0,62C. Waste Incineration 0,00 0,00 0,00 0,00 0,00 0,00 0,00 0,00 0,00 0,00 0,00D. Other 0,08 0,08 0,15 0,16 0,15 0,16 0,17 0,17 0,17 0,17 0,18
7. Other (please specify) NO NO NO NO NO NO NO NO NO NO NO
Memo Items:International Bunkers 0,03 0,03 0,05 0,05 0,05 0,06 0,05 0,06 0,06 0,05 0,05
Aviation 0,03 0,03 0,05 0,05 0,05 0,06 0,05 0,06 0,06 0,05 0,05Marine NO NO NO NO NO NO NO NO NO NO NO
Multilateral Operations IE IE IE IE IE IE IE IE IE IE IECO2 Emissions from Biomass
GREENHOUSE GAS SOURCE AND SINK CATEG

Austria's Annual National Greenhouse Gas Inventory 1990-2003 – ANNEX I: Emission Trends
31
Table A.I -4: Emission Trends HFCs, PFCs and SF6
Base year(1) 1990 1995 1996 1997 1998 1999 2000 2001 2002 2003(Gg)
Emissions of HFCs(5) - CO2 equivalent (Gg)
555,26 219,16 555,26 637,15 729,62 812,53 866,99 1.019,00 1.122,34 1.218,92 1.308,22
HFC-23 0,0011 0,0002 0,0011 0,0014 0,0015 0,0012 0,0014 0,0017 0,0019 0,0021 0,0022HFC-32 0,0001 0,0000 0,0001 0,0002 0,0004 0,0007 0,0010 0,0019 0,0026 0,0034 0,0041HFC-41 0,0000 0,0000 0,0000 0,0000 0,0000 0,0000 0,0000 0,0000 0,0000 0,0000 0,0000HFC-43-10mee 0,0000 0,0000 0,0000 0,0000 0,0000 0,0000 0,0000 0,0000 0,0000 0,0000 0,0000HFC-125 0,0015 0,0000 0,0015 0,0057 0,0110 0,0143 0,0151 0,0198 0,0276 0,0349 0,0415HFC-134 0,0000 0,0000 0,0000 0,0000 0,0000 0,0000 0,0000 0,0000 0,0000 0,0000 0,0000HFC-134a 0,4128 0,1671 0,4128 0,4576 0,5068 0,5594 0,5941 0,6348 0,6720 0,7065 0,7386HFC-152a 0,0001 0,0000 0,0001 0,0003 0,0006 0,0007 0,0006 0,4897 0,4991 0,5085 0,5191HFC-143 0,0000 0,0000 0,0000 0,0000 0,0000 0,0000 0,0000 0,0000 0,0000 0,0000 0,0000HFC-143a 0,0004 0,0000 0,0004 0,0025 0,0056 0,0079 0,0089 0,0125 0,0200 0,0269 0,0332HFC-227ea 0,0000 0,0000 0,0000 0,0001 0,0001 0,0002 0,0004 0,0005 0,0008 0,0011 0,0014HFC-236fa 0,0000 0,0000 0,0000 0,0000 0,0000 0,0000 0,0000 0,0000 0,0000 0,0000 0,0000HFC-245ca 0,0000 0,0000 0,0000 0,0000 0,0000 0,0000 0,0000 0,0000 0,0000 0,0000 0,0000Emissions of PFCs(5) - CO2 equivalent (Gg)
68,74 1.079,24 68,74 66,27 96,83 44,75 64,54 72,33 82,15 86,87 102,54
CF4 0,0060 0,1410 0,0060 0,0058 0,0085 0,0027 0,0048 0,0063 0,0063 0,0064 0,0069C2F6 0,0032 0,0177 0,0032 0,0031 0,0045 0,0029 0,0036 0,0033 0,0044 0,0041 0,0051C 3F8 0,0000 0,0000 0,0000 0,0000 0,0000 0,0000 0,0000 0,0000 0,0000 0,0011 0,0014C4F10 0,0001 0,0000 0,0001 0,0001 0,0001 0,0001 0,0001 0,0001 0,0001 0,0001 0,0001c-C4F8 0,0000 0,0000 0,0000 0,0000 0,0000 0,0000 0,0000 0,0000 0,0000 0,0000 0,0000C5F12 0,0000 0,0000 0,0000 0,0000 0,0000 0,0000 0,0000 0,0000 0,0000 0,0000 0,0000C6F14 0,0000 0,0000 0,0000 0,0000 0,0000 0,0000 0,0000 0,0000 0,0000 0,0000 0,0000Emissions of SF6
(5) - CO2 equivalent (Gg)
1.139,16 502,58 1.139,16 1.218,05 1.120,15 907,99 683,96 633,31 636,62 640,83 593,52
SF6 0,05 0,02 0,05 0,05 0,05 0,04 0,03 0,03 0,03 0,03 0,02
GREENHOUSE GAS SOURCE AND SINK


Austria's Annual National Greenhouse Gas Inventory 1990-2003 – ANNEX II: Uncertainity Assessment for Key Sources
33
ANNEX II: UNCERTAINITY ASSESSMENT FOR KEY SOURCES
This annex presents activity data and emission factor uncertainty and/or uncertainty of the emission estimate (“combined uncertainty”) for key sources of the Austrian GHG inventory, based on the key source assessment of the 2004 submission. The key source analysis of the 2005 submission will be presented in the NIR 20056. Sources of uncertainties will be explained in the NIR 2005. Furthermore, it is planned to in-clude a Tier 1 uncertainty estimate to estimate the total uncertainty of the National Total in the NIR.
Table A.II: Uncertainties for Key Sources of the Austrian GHG Inventory (KS Assessment 2004)
AD EF Combined IPCC Category Description Gas
Uncertainty7 [%]
1 A 1 a gaseous Public Electricity and Heat Production CO2 2 0.5 2.1
1 A 1 a liquid Public Electricity and Heat Production CO2 0.5 0.5 0.7
1 A 1 a other Public Electricity and Heat Production CO2 10 20 22.4
1 A 1 a solid Public Electricity and Heat Production CO2 0.5 0.5 0.7
1 A 1 b gaseous Petroleum refining CO2 2 0.5 2.1
1 A 1 b liquid Petroleum refining CO2 0.5 0.5 0.7
1 A 1 c liquid Manuf. of Solid fuels and Other Energy Ind. CO2 0.5 0.5 0.7
1 A 1 c gaseous Manuf. of Solid fuels and Other Energy Ind. CO2 2 0.5 2.1
1 A 2 gaseous Manufacturing Industries and Construction CO2 2 0.5 2.1
1 A 2 mob-liquid Manufacturing Industries and Construction CO2 0.5 0.5 0.7
1 A 2 solid Manufacturing Industries and Construction CO2 0.5 0.5 0.7
1 A 2 stat-liquid Manufacturing Industries and Construction CO2 0.5 0.5 0.7
1 A 2 other Manufacturing Industries and Construction CO2 10 20 22.4
1 A 3 b diesel oil Road Transportation CO2 0.5 0.5 0.7
1 A 3 b gasoline Road Transportation CO2 0.5 0.5 0.7
1 A 3 b gasoline Road Transportation N2O 10 40 41.2
1 A 3 e gaseous Transport-Other CO2 2 0.5 2.1
1 A 4 mob-diesel Other Sectors CO2 0.5 0.5 0.7
1 A 4 biomass Other Sectors CH4 10 50 51.0
1 A 4 gaseous Other Sectors CO2 2 0.5 2.1
1 A 4 stat-liquid Other Sectors CO2 0.5 0.5 0.7
1 A 4 solid Other Sectors CO2 0.5 0.5 0.7
2 A 1 Cement Production CO2 5 5 7.1
2 A 2 Lime Production CO2 5 5 7.1
2 A 3 Limestone and Dolomite Use CO2 15 2 15.1
6 Austria’s National Inventory Report 2005, submission under the United Nations Framework Convention on Cli-
mate Change (the NIR is due for reporting under the Monitoring Mechanism (280/2004/EC) by March 15 and will be reported under the UNFCCC by April 15 – it will be published in April).
7 referring to 2 standard deviations (95% confidence interval)

Austria's Annual National Greenhouse Gas Inventory 1990-2003 – ANNEX II: Uncertainity Assessment for Key Sources
34
AD EF Combined IPCC Category Description Gas
Uncertainty7 [%]
2 A 7 b Magnesite Sinter Plants CO2 5 5 7.1
2 B 1 Ammonia Production CO2 5.0
2 B 2 Nitric Acid Production N2O 3.0
2 C 1 Iron and Steel Production CO2 5 5 7.1
2 C 4 SF6 used in Al and Mg Foundries SF6 20 0 20.0
2 C 3 Aluminium production PFCs 5 2 5.4
2 C 3 Aluminium production CO2 5 20 20.6
2 F 6 Semiconductor Manufacture FCs 5 10 11.2
2 F 1/2/3 ODS Substitutes HFCs 20 50 53.9
2 F 8 Other Sources of SF6 SF6 25 50 55.9
3 Solvent and Other Product Use CO2 15 10 18.0
3 Solvent and Other Product Use N2O 50 0 50.0
4 A 1 Cattle CH4 8.0
4 B 1 Cattle N2O 10 75 75.7
4 B 1 Cattle CH4 10 69 70.1
4 B 8 Swine CH4 10 70 70.7
4 D Agricultural Soils N2O 24.0
6 A 1 Managed Waste disposal CH4 15 30 33.5 Note: Uncertainties for activity data for stationary combustion of IPCC Category 1 A Fuel Combustion were estimated for gross inland consumption.

Austria’s Annual National G
reenhouse Gas Inventory 1990-2003 –
ANN
EX III Methodologies for EC
Key Sources
35
ANNEX III: INFORMATION ON METHODOLOGIES FOR EC KEY SOURCES
This annex presents methodologies, data sources and emission factors used in the Austrian GHG Inventory for EC key sources for the purpose of Article 4(1)(b) of the Monitoring Decision. Abbreviations used are explained at the end of the table. Table A.III -1: Summary report for methods, activity data and emission factors used (Energy)
GREENHOUSE GAS SOURCE AND SINK CO2 CH4 N2O
CATEGORIES Key source (1)
Method applied (2)
Activity data (3)
Emission factor (4)
Key source (1)
Method applied (2)
Activity data (3)
Emission factor (4)
Key source (1)
Method applied (2)
Activity data (3)
Emission factor (4)
1. Energy
A. Fuel Combustion
1. Energy Industries
a. Public Electricity and Heat Production Yes C NS, PS CS No Yes C NS,PS CS
b. Petroleum Refining Yes C NS, PS PS No No
c. Manufacture of Solid Fuels and Other Energy Industries Yes C NS CS No No

Austria’s Annual National G
reenhouse Gas Inventory 1990-2003 –
ANN
EX III Methodologies for EC
Key Sources
36
Table A.III -1: Summary report for methods, activity data and emission factors used (Energy)
GREENHOUSE GAS SOURCE AND SINK CO2 CH4 N2O
CATEGORIES Key source (1)
Method applied (2)
Activity data (3)
Emission factor (4)
Key source (1)
Method applied (2)
Activity data (3)
Emission factor (4)
Key source (1)
Method applied (2)
Activity data (3)
Emission factor (4)
2. Manufacturing Industries and Construction Yes C NS CS, PS No No
a. Iron and Steel No No No
b. Non-Ferrous Metals No No No
c. Chemicals No No No
d. Pulp, Paper and Print No No No
e. Food Processing, Beverages and Tobacco No No No
f. Other (as specified in table 1.A(a)s2) No No No
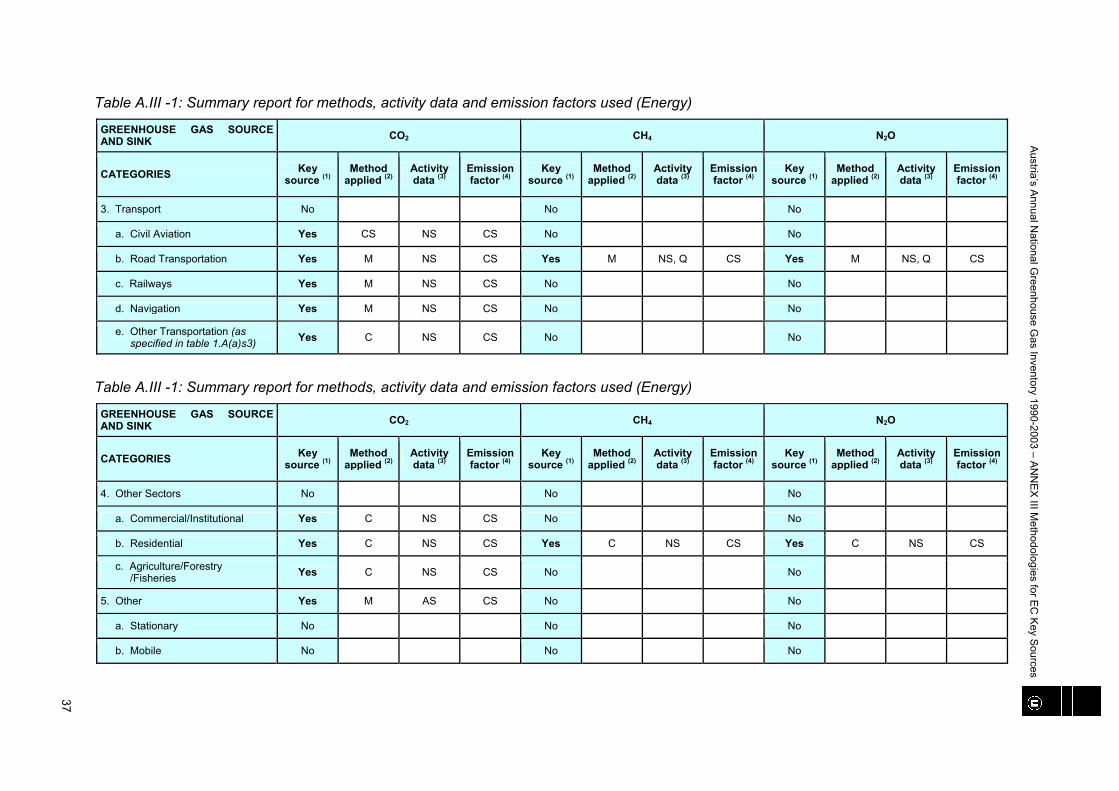
Austria’s Annual National G
reenhouse Gas Inventory 1990-2003 –
ANN
EX III Methodologies for EC
Key Sources
37
Table A.III -1: Summary report for methods, activity data and emission factors used (Energy)
GREENHOUSE GAS SOURCE AND SINK CO2 CH4 N2O
CATEGORIES Key source (1)
Method applied (2)
Activity data (3)
Emission factor (4)
Key source (1)
Method applied (2)
Activity data (3)
Emission factor (4)
Key source (1)
Method applied (2)
Activity data (3)
Emission factor (4)
3. Transport No No No
a. Civil Aviation Yes CS NS CS No No
b. Road Transportation Yes M NS CS Yes M NS, Q CS Yes M NS, Q CS
c. Railways Yes M NS CS No No
d. Navigation Yes M NS CS No No
e. Other Transportation (as specified in table 1.A(a)s3) Yes C NS CS No No
Table A.III -1: Summary report for methods, activity data and emission factors used (Energy)
GREENHOUSE GAS SOURCE AND SINK CO2 CH4 N2O
CATEGORIES Key source (1)
Method applied (2)
Activity data (3)
Emission factor (4)
Key source (1)
Method applied (2)
Activity data (3)
Emission factor (4)
Key source (1)
Method applied (2)
Activity data (3)
Emission factor (4)
4. Other Sectors No No No
a. Commercial/Institutional Yes C NS CS No No
b. Residential Yes C NS CS Yes C NS CS Yes C NS CS
c. Agriculture/Forestry /Fisheries Yes C NS CS No No
5. Other Yes M AS CS No No
a. Stationary No No No
b. Mobile No No No

Austria’s Annual National G
reenhouse Gas Inventory 1990-2003 –
ANN
EX III Methodologies for EC
Key Sources
38
Table A.III -1: Summary report for methods, activity data and emission factors used (Energy)
GREENHOUSE GAS SOURCE AND SINK CO2 CH4 N2O
CATEGORIES Key source (1)
Method applied (2)
Activity data (3)
Emission factor (4)
Key source (1)
Method applied (2)
Activity data (3)
Emission factor (4)
Key source (1)
Method applied (2)
Activity data (3)
Emission factor (4)
B. Fugitive Emissions from Fuels No No No
1. Solid Fuels No No No
a. Coal Mining No Yes C NS C No
b. Solid Fuel Transformation Yes IE IE IE No No
c. Other (as specified in table 1.B.1) No No No
2. Oil and Natural Gas No No No
a. Oil No Yes T1 NS D No
b. Natural Gas No Yes D AS D No
c. Venting and Flaring Yes IE IE IE No No
d. Other (as specified in table 1.B.2) No No No

Austria’s Annual National G
reenhouse Gas Inventory 1990-2003 –
ANN
EX III Methodologies for EC
Key Sources
39
Table A.III 2: Summary report for methods, activity data and emission factors used (industrial processes)
GREENHOUSE GAS SOURCE AND SINK CO2 CH4 N2O HFCs PFCs SF6
CATEGORIES
Key source
(1)
Method ap-plied (2)
Activity
data (3)
Emission
factor (4)
Key source
(1)
Method ap-plied (2)
Activity
data (3)
Emission
factor (4)
Key source
(1)
Method ap-plied (2)
Activity
data (3)
Emission
factor (4)
Key source
(1)
Method ap-plied (2)
Activity
data (3)
Emission
factor (4)
Key source
(1)
Method ap-plied (2)
Activity
data (3)
Emission
factor (4)
Key source
(1)
Method ap-plied (2)
Activity
data (3)
Emission
factor (4)
2. Industrial Processes
A. Mineral Products No No No
1. Cement Production Yes TS PS PS No No
2. Lime Production Yes CS PS PS No No
3. Limestone and Dolomite Use No No No
4. Soda Ash Production and Use No No No
5. Asphalt Roofing No No No
6. Road Paving with Asphalt No No No
7. Other (as specified in table 2(I)A-G) No No No

Austria’s Annual National G
reenhouse Gas Inventory 1990-2003 –
ANN
EX III Methodologies for EC
Key Sources
40
Table A.III -2: Summary report for methods, activity data and emission factors used (industrial processes)
GREENHOUSE GAS SOURCE AND SINK CO2 CH4 N2O HFCs PFCs SF6
CATEGORIES
Key source
(1)
Method ap-plied (2)
Activity
data (3)
Emission
factor (4)
Key source
(1)
Method ap-plied (2)
Activity
data (3)
Emission
factor (4)
Key source
(1)
Method ap-plied (2)
Activity
data (3)
Emission
factor (4)
Key source
(1)
Method ap-plied (2)
Activity
data (3)
Emission
factor (4)
Key source
(1)
Method ap-plied (2)
Activity
data (3)
Emission
factor (4)
Key source
(1)
Method ap-plied (2)
Activity
data (3)
Emission
factor (4)
B. Chemical Industry No No No No No No
1. Ammonia Production Yes CS PS PS No No No No No
2. Nitric Acid Production No No Yes CS PS PS No No No
3. Adipic Acid Production No No Yes NO NO NO No No No
4. Carbide Production No No No No No No
5. Other (as specified in table 2(I)A-G) No No Yes No No No
C. Metal Production No No No Yes T3b NS PS No
1. Iron and Steel Production Yes T2 NS PS/D No No No No
2. Ferroalloys Production No No No No No
3. Aluminium Production No No No No No
4. SF6 Used in Aluminium and Magnesium Foundries No No No No No
5. Other (as specified in table 2(I)A-G) No No No No No
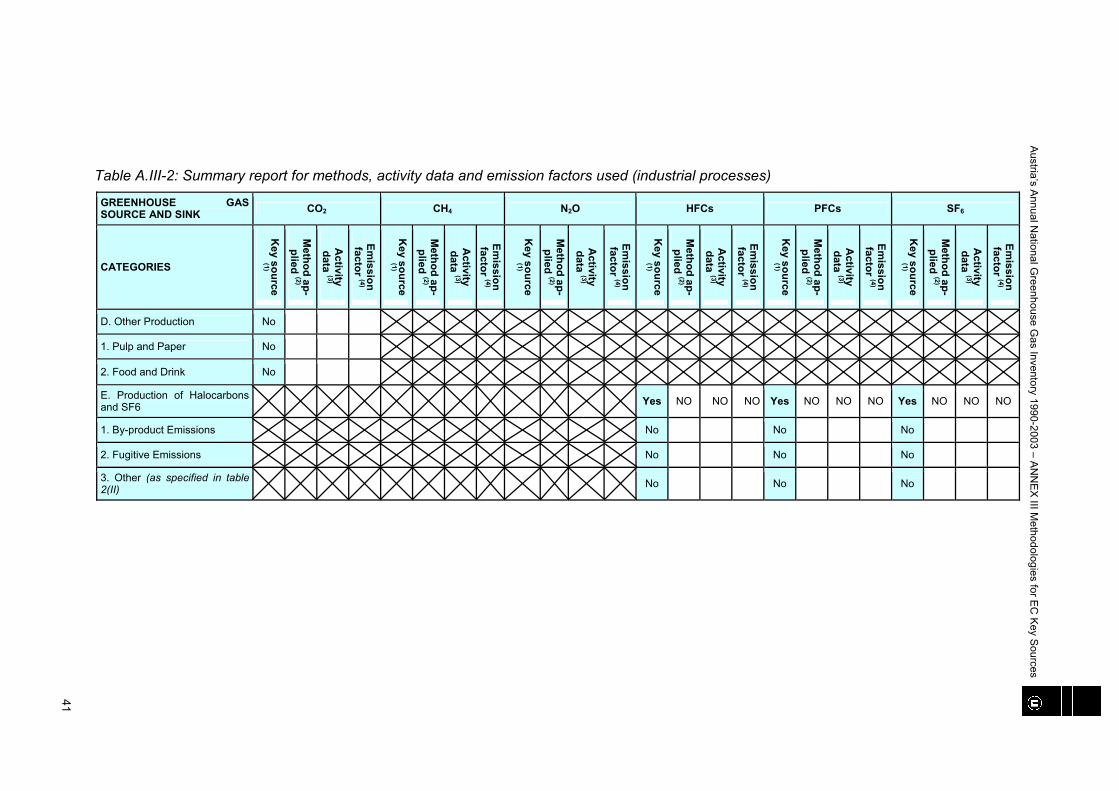
Austria’s Annual National G
reenhouse Gas Inventory 1990-2003 –
ANN
EX III Methodologies for EC
Key Sources
41
Table A.III-2: Summary report for methods, activity data and emission factors used (industrial processes)
GREENHOUSE GAS SOURCE AND SINK CO2 CH4 N2O HFCs PFCs SF6
CATEGORIES
Key source
(1)
Method ap-plied (2)
Activity
data (3)
Emission
factor (4)
Key source
(1)
Method ap-plied (2)
Activity
data (3)
Emission
factor (4)
Key source
(1)
Method ap-plied (2)
Activity
data (3)
Emission
factor (4)
Key source
(1)
Method ap-plied (2)
Activity
data (3)
Emission
factor (4)
Key source
(1)
Method ap-plied (2)
Activity
data (3)
Emission
factor (4)
Key source
(1)
Method ap-plied (2)
Activity
data (3)
Emission
factor (4)
D. Other Production No
1. Pulp and Paper No
2. Food and Drink No
E. Production of Halocarbons and SF6 Yes NO NO NO Yes NO NO NO Yes NO NO NO
1. By-product Emissions No No No
2. Fugitive Emissions No No No
3. Other (as specified in table 2(II) No No No

Austria’s Annual National G
reenhouse Gas Inventory 1990-2003 –
ANN
EX III Methodologies for EC
Key Sources
42
Table A.III -2: Summary report for methods, activity data and emission factors used (industrial processes)
GREENHOUSE GAS SOURCE AND SINK CO2 CH4 N2O HFCs PFCs SF6
CATEGORIES
Key source
(1)
Method ap-plied (2)
Activity
data (3)
Emission
factor (4)
Key source
(1)
Method ap-plied (2)
Activity
data (3)
Emission
factor (4)
Key source
(1)
Method ap-plied (2)
Activity
data (3)
Emission
factor (4)
Key source
(1)
Method ap-plied (2)
Activity
data (3)
Emission
factor (4)
Key source
(1)
Method ap-plied (2)
Activity
data (3)
Emission
factor (4)
Key source
(1)
Method ap-plied (2)
Activity
data (3)
Emission
factor (4)
F. Consumption of Halo-carbons and SF6 Yes CS Q CS No Yes CS Q CS
1. Refrigeration and Air Condi-tioning Equipment No No No
2. Foam Blowing No No No
3. Fire Extinguishers No No No
4. Aerosols/ Metered Dose In-halers No No No
5. Solvents No No No
6. Other applications using ODS substitutes No No No
7. Semiconductor Manufacture No No No
8. Electrical Equipment No No No
9. Other (as specified in table 2(II) No No No
G. Other Yes No No No No No
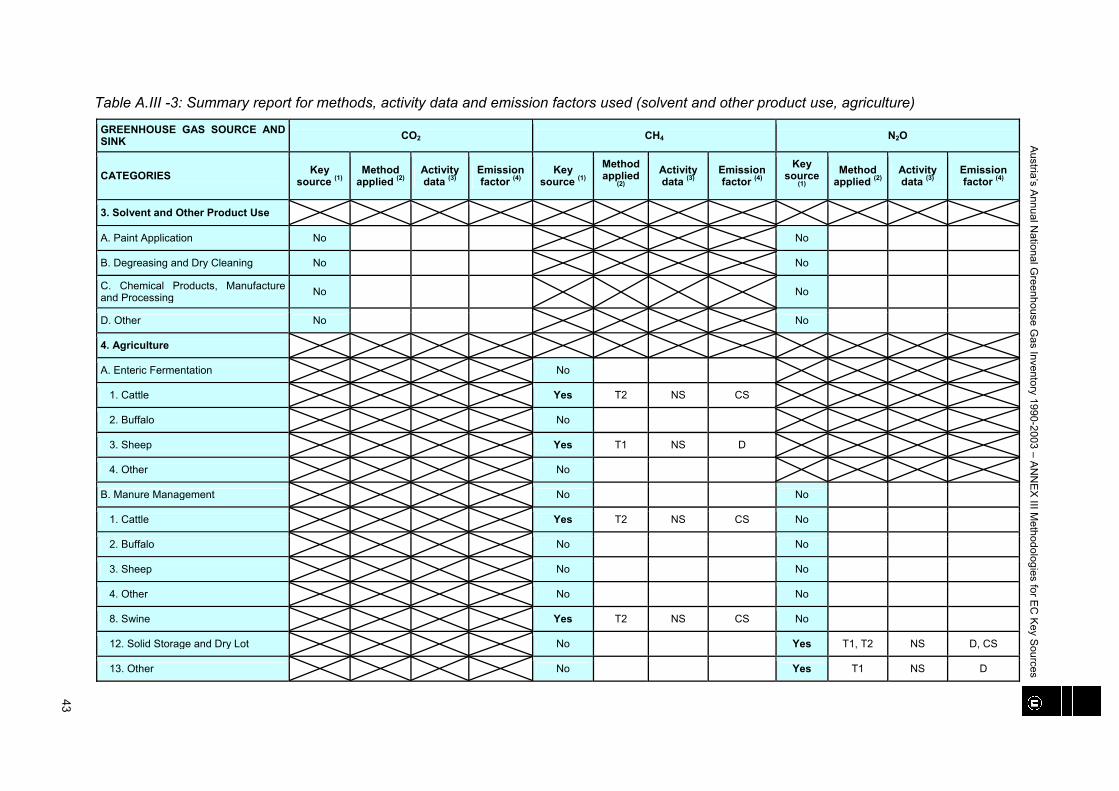
Austria’s Annual National G
reenhouse Gas Inventory 1990-2003 –
ANN
EX III Methodologies for EC
Key Sources
43
Table A.III -3: Summary report for methods, activity data and emission factors used (solvent and other product use, agriculture)
GREENHOUSE GAS SOURCE AND SINK CO2 CH4 N2O
CATEGORIES Key source (1)
Method applied (2)
Activity data (3)
Emission factor (4)
Key source (1)
Method applied
(2) Activity data (3)
Emission factor (4)
Key source
(1) Method
applied (2)Activity data (3)
Emission factor (4)
3. Solvent and Other Product Use
A. Paint Application No No
B. Degreasing and Dry Cleaning No No
C. Chemical Products, Manufacture and Processing No No
D. Other No No
4. Agriculture
A. Enteric Fermentation No
1. Cattle Yes T2 NS CS
2. Buffalo No
3. Sheep Yes T1 NS D
4. Other No
B. Manure Management No No
1. Cattle Yes T2 NS CS No
2. Buffalo No No
3. Sheep No No
4. Other No No
8. Swine Yes T2 NS CS No
12. Solid Storage and Dry Lot No Yes T1, T2 NS D, CS
13. Other No Yes T1 NS D

Austria’s Annual National G
reenhouse Gas Inventory 1990-2003 –
ANN
EX III Methodologies for EC
Key Sources
44
Table A.III -3: Summary report for methods, activity data and emission factors used (agriculture)
GREENHOUSE GAS SOURCE AND SINK CO2 CH4 N2O
CATEGORIES Key source (1)
Method applied (2)
Activity data (3)
Emission factor (4)
Key source (1)
Method applied
(2) Activity data (3)
Emission factor (4)
Key source
(1) Method
applied (2)Activity data (3)
Emission factor (4)
C. Rice Cultivation No
D. Agricultural Soils Yes T 1 a/b NS D No No
1. Direct Soil Emissions No No Yes T 1 a/b NS D
2. Pasture, range and paddock ma-nure No No Yes T 1 a/b NS D
3. Indirect Emissions No No Yes T 1 a NS D
4. Other (as specified in table 4.D) No No Yes T 1 b NS D
E. Prescribed Burning of Savannas No No
F. Field Burning of Agricultural Resi-dues No No
G. Other No No

Austria’s Annual National G
reenhouse Gas Inventory 1990-2003 –
ANN
EX III Methodologies for EC
Key Sources
45
Table A.III -4: Summary report for methods, activity data and emission factors used (land-use change and forestry, waste, other)
GREENHOUSE GAS SOURCE AND SINK CO2 CH4 N2O
CATEGORIES Key source (1)
Method applied (2)
Activity data (3)
Emission factor (4)
Key source (1)
Method applied
(2) Activity data (3)
Emission factor (4)
Key source
(1) Method
applied (2)Activity data (3)
Emission factor (4)
5. Land-Use, Land-Use Change and Forestry
A. Forest Land No No No
1. Forest Land remaining Forest Lands No No No
2. Land converted to Forest Lands No No No
B. Cropland No No No
1. Cropland remaining Cropland No No No
2. Land converted to Cropland No No No
C. Grassland No No No
1. Grassland remaining Grassland No No No
2. Land converted to Grassland No No No
D. Wetlands No No No
1. Wetlands remaining Wetlands No No No
2. Land converted to Wetlands No No No
E. Settlements No No No
1. Settlements remaining Settle-ments No No No
2. Land converted to Settlements No No No

Austria’s Annual National G
reenhouse Gas Inventory 1990-2003 –
ANN
EX III Methodologies for EC
Key Sources
46
Table A.III -4: Summary report for methods, activity data and emission factors used (land-use change and forestry, waste, other)
GREENHOUSE GAS SOURCE AND SINK CO2 CH4 N2O
CATEGORIES Key source (1)
Method applied (2)
Activity data (3)
Emission factor (4)
Key source (1)
Method applied
(2) Activity data (3)
Emission factor (4)
Key source
(1) Method
applied (2)Activity data (3)
Emission factor (4)
5. Land-Use, Land-Use Change and Forestry
F. Other Land No No No
1. Other Land remaining Other Land No No
2. Land converted to Other Land No No No
G. Other (please specify) No No No
Harvested Wood Products No No No
6. Waste
A. Solid Waste Disposal on Land No No
1. Managed Waste Disposal on Land No Yes CS PS, Q CS
2. Unmanaged Waste Disposal Sites No Yes NO NO NO
3. Other (as specified in table 6.A) No No

Austria’s Annual National G
reenhouse Gas Inventory 1990-2003 –
ANN
EX III Methodologies for EC
Key Sources
47
Table A.III -4: Summary report for methods, activity data and emission factors used (land-use change and forestry, waste, other)
GREENHOUSE GAS SOURCE AND SINK CO2 CH4 N2O
CATEGORIES Key source (1)
Method applied (2)
Activity data (3)
Emission factor (4)
Key source (1)
Method applied
(2) Activity data (3)
Emission factor (4)
Key source
(1) Method
applied (2)Activity data (3)
Emission factor (4)
5. Land-Use, Land-Use Change and Forestry
6. Waste
B. Wastewater Handling No No
1. Industrial Wastewater No No
2. Domestic and Commercial Wastewater Yes CS Q CS No
3. Other (as specified in table 6.B) No No
C. Waste Incineration Yes C AS CS No No
D. Other Yes No No
7. Other (as specified in Summary 1.A)
Memo Items: (8)
International Bunkers No No No
Aviation No No No
Marine No No No
CO2 Emissions from Biomass No No No

Austria’s Annual National G
reenhouse Gas Inventory 1990-2003 –
ANN
EX III Methodologies for EC
Key Sources
48
Legend for tables A.III -1 to A.III -4
(1) Key sources of the Community. To be completed by Commission/EEA with results from key category analysis from previous inventory submission. (2) Use the following notation keys to specify the method applied:
D (IPCC default), T1a, T1b, T1c (IPCC Tier 1a, Tier 1b and Tier 1c, respectively),
C (CORINAIR), COPERT X (Copert Model X = Ver-sion)
RA (Reference Approach), T2 (IPCC Tier 2), CS (Country Specific). T1 (IPCC Tier 1), T3 (IPCC Tier 3), M (Model)
If using more than one method within one source category, enumerate the relevant methods. Explanations regarding country-specific methods or any modifications to the default IPCC methods, as well as information regarding the use of
Different methods per source category where more than one method is indicated, should be provided in the documentation box.
(3) Use the following notation keys to specify the sources of activity data used :
NS (national statistics), IS (International statistics), AS (associations, business organi-
zations)
RS (regional statistics), PS (Plant Spe-cific data). Q (specific questionnaires, surveys)
If keys above are not appropriate for national circumstances, use additional keys and explain those in the documentation box.
Where a mix of AD sources has been used, use different notations in one and the same cells with further explanations in the documentation box.
(4) Use the following notation keys to specify the emission factor used:
D (IPCC default), CS (Country Specific),
C (CORINAIR), PS (Plant Spe-cific).
Where a mix of emission factors has been used, use different notations in one and the same cells with further explanations in the documentation box.
Documentation box:
* The full information on methodological issues, such as methods, activity data and emission factors used, can be found in the relevant sector sections of chapter 5 of the NIR. If any additional information is needed
To understand the content of this table, use this documentation box to provide references to the relevant section of the NIR where further details can be found.
* Where a mix of methods/ emission factors has been used within one source category, use this documentation box to specify those methods/emission factors for the vari-ous sub-sources where they have been applied
(see also footnotes 2 to 4 to this table).
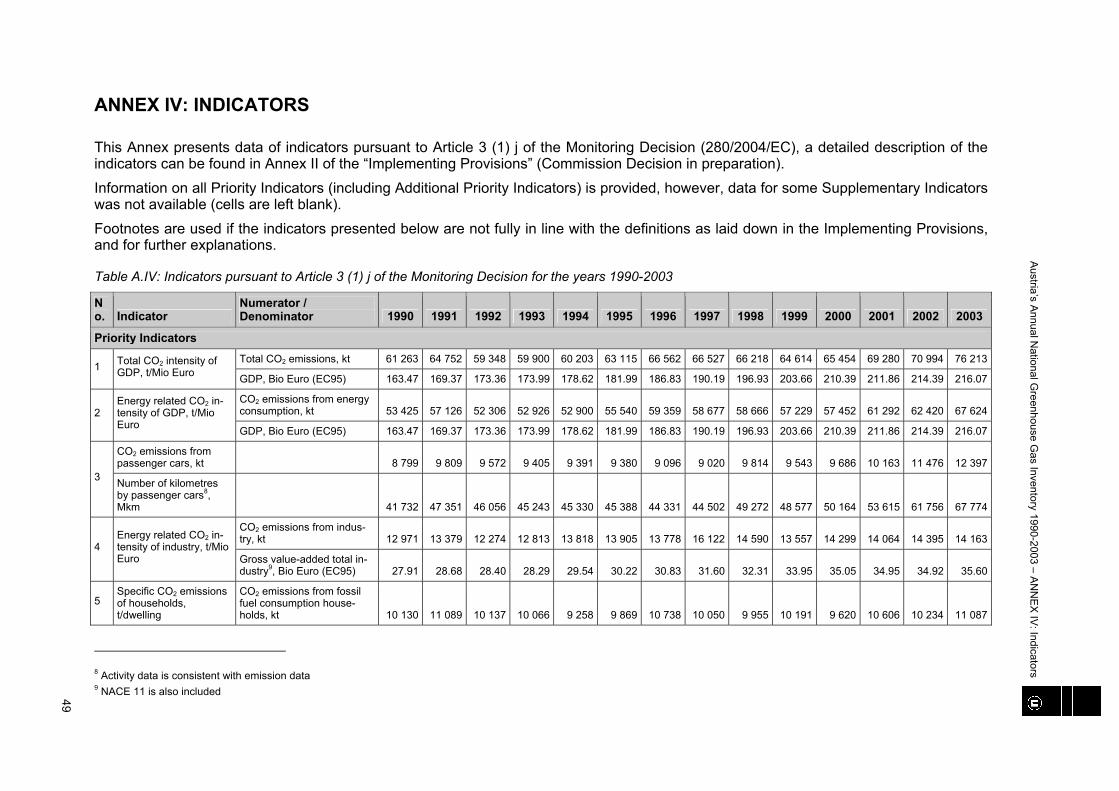
Austria’s Annual National G
reenhouse Gas Inventory 1990-2003 – AN
NEX IV: Indicators
49
ANNEX IV: INDICATORS
This Annex presents data of indicators pursuant to Article 3 (1) j of the Monitoring Decision (280/2004/EC), a detailed description of the indicators can be found in Annex II of the “Implementing Provisions” (Commission Decision in preparation). Information on all Priority Indicators (including Additional Priority Indicators) is provided, however, data for some Supplementary Indicators was not available (cells are left blank). Footnotes are used if the indicators presented below are not fully in line with the definitions as laid down in the Implementing Provisions, and for further explanations.
Table A.IV: Indicators pursuant to Article 3 (1) j of the Monitoring Decision for the years 1990-2003
No. Indicator
Numerator / Denominator 1990 1991 1992 1993 1994 1995 1996 1997 1998 1999 2000 2001 2002 2003
Priority Indicators Total CO2 emissions, kt 61 263 64 752 59 348 59 900 60 203 63 115 66 562 66 527 66 218 64 614 65 454 69 280 70 994 76 213
1 Total CO2 intensity of GDP, t/Mio Euro GDP, Bio Euro (EC95) 163.47 169.37 173.36 173.99 178.62 181.99 186.83 190.19 196.93 203.66 210.39 211.86 214.39 216.07
CO2 emissions from energy consumption, kt 53 425 57 126 52 306 52 926 52 900 55 540 59 359 58 677 58 666 57 229 57 452 61 292 62 420 67 624 2
Energy related CO2 in-tensity of GDP, t/Mio Euro GDP, Bio Euro (EC95) 163.47 169.37 173.36 173.99 178.62 181.99 186.83 190.19 196.93 203.66 210.39 211.86 214.39 216.07
CO2 emissions from passenger cars, kt 8 799 9 809 9 572 9 405 9 391 9 380 9 096 9 020 9 814 9 543 9 686 10 163 11 476 12 397
3 Number of kilometres by passenger cars8, Mkm 41 732 47 351 46 056 45 243 45 330 45 388 44 331 44 502 49 272 48 577 50 164 53 615 61 756 67 774
CO2 emissions from indus-try, kt 12 971 13 379 12 274 12 813 13 818 13 905 13 778 16 122 14 590 13 557 14 299 14 064 14 395 14 163
4 Energy related CO2 in-tensity of industry, t/Mio Euro Gross value-added total in-
dustry9, Bio Euro (EC95) 27.91 28.68 28.40 28.29 29.54 30.22 30.83 31.60 32.31 33.95 35.05 34.95 34.92 35.60
5 Specific CO2 emissions of households, t/dwelling
CO2 emissions from fossil fuel consumption house-holds, kt 10 130 11 089 10 137 10 066 9 258 9 869 10 738 10 050 9 955 10 191 9 620 10 606 10 234 11 087
8 Activity data is consistent with emission data 9 NACE 11 is also included

Austria’s Annual National G
reenhouse Gas Inventory 1990-2003 –
ANN
EX IV: Indicators
50
No. Indicator
Numerator / Denominator 1990 1991 1992 1993 1994 1995 1996 1997 1998 1999 2000 2001 2002 2003
Stock of permanently occu-pied dwellings, 1000 2 947 2 998 3 016 3 028 3 072 3 109 3 142 3 163 3 191 3 230 3 261 3 284 3 296 3 302
CO2 emissions from fossil fuel consumption in com-mercial and institutional sec-tor, kt 2 214 2 367 2 757 2 835 2 404 3 007 3 263 2 381 2 302 2 818 1 798 2 505 1 656 1 823 6
CO2 intensity of the commercial and institu-tional sector, t/Mio Euro
Gross value-added services, Bio Euro (EC95) 91.51 94.97 98.53 99.38 101.60 103.95 106.12 107.23 111.11 113.76 117.90 119.16 120.29 121.00
CO2 emissions from public and autoproducer thermal power stations10, kt 11 849 12 205 9 208 9 199 10 151 12 010 12 848 12 601 11 527 11 407 10 529 11 753 11 261 13 459
7 Specific CO2 emissions of public and autopro-ducer power plants, t/TJ All products –output bypub-
lic and autoproducer thermal power stations, PJ 81.26 88.58 74.17 74.17 81.15 88.23 103.12 101.69 100.89 102.75 94.72 106.82 105.73 123.76
10 SNAP 0101 + 0301 Auto-Producers

Austria’s Annual National G
reenhouse Gas Inventory 1990-2003 – AN
NEX IV: Indicators
51
No. Indicator
Numerator / Denominator 1990 1991 1992 1993 1994 1995 1996 1997 1998 1999 2000 2001 2002 2003
Additional Priority Indicators
CO2 emissions from freight transport on road, kt 3 081 3 655 3 836 4 183 4 145 4 529 6 388 5 382 6 665 6 225 7 115 7 869 8 577 9 398 1 Freight transport on road8, Mtkm 5 912 6 735 7 048 7 534 7 625 8 228 10 982 9 727 11 767 11 314 12 781 13 985 15 090 16 331
Total CO2 emissions from iron and steel, kt 8 512 8 151 7 036 7 364 7 887 8 727 8 384 9 482 8 682 8 635 9 445 9 349 10 126 9 675
2 Total CO2 intensity - iron and steel industry, t/Mio Euro Gross value-added - iron
and steel industry11, Bio Euro (EC95) 1.97 1.99 1.77 1.51 1.53 1.63 1.63 1.92 1.89 2.15 2.11 2.34 2.16 2.15
Energy related CO2 emis-sions chemical industries, kt 705 696 784 866 835 889 856 1 069 977 1 232 1 199 1 252 1 224 1 251
3 Energy related CO2 in-tensity - chemical indus-try, t/Mio Euro Gross value-added chemical
industry, Bio Euro (EC95) 1.59 1.63 1.67 1.78 1.70 1.77 1.82 1.83 1.90 2.06 2.35 2.12 2.24 2.30
Energy related CO2 emis-sions glass, pottery and building materials12, kt 1 443 1 440 1 464 1 415 1 475 1 267 1 261 1 355 1 286 1 269 1 338 1 354 1 362 1 304
4 Energy related CO2 in-tensity - glass, pottery and building materials industry, t/Mio Euro
Gross value-added - glass, pottery and buildings mate-rials industry, Bio Euro (EC95) 2.29 2.22 2.16 2.10 2.25 2.10 2.18 2.27 2.12 2.17 2.29 2.34 2.38 2.38
Total CO2 emissions from iron and steel, kt 8 512 8 151 7 036 7 364 7 887 8 727 8 384 9 482 8 682 8 635 9 445 9 349 10 126 9 675
5 Specific CO2 emissions of iron and steel indus-try, t/t Production of oxygen steel,
kt 3 921 3 896 3 592 3 738 3 968 4 538 4 032 4 718 4 801 4 722 5 183 5 346 5 647 5 707
Energy related CO2 emis-sions from glass, pottery and building materials13, kt 1 055 1 038 1 107 1 038 1 089 867 861 958 888 871 938 954 976 878 6
Specific energy related CO2 emissions of ce-ment industry, t/t
Cement production, kt 4 679 4 821 4 822 4 858 4 763 3 839 3 779 3 909 3 668 3 658 4 047 4 035 4 061 4 061
11 Total NACE 27 (thus also including non-ferrous metal industries) 12 SNAP 030311, 030317, 030319 13 SNAP 030311

Austria’s Annual National G
reenhouse Gas Inventory 1990-2003 –
ANN
EX IV: Indicators
52
No. Indicator
Numerator / Denominator 1990 1991 1992 1993 1994 1995 1996 1997 1998 1999 2000 2001 2002 2003
Supplementary Indicators
CO2 emissions of diesel-driven passenger cars, kt 1 453 1 666 1 783 1 927 2 179 2 402 2 651 2 909 3 370 3 575 3 903 4 311 5 133 5 876
1 Specific diesel related CO2 emissions of pas-senger cars, g/100km
Number of kilometres of diesel-driven passenger cars8, Mio km 7 543 8 771 9 381 10 153 11 487 12 657 14 098 15 647 18 337 19 738 21 890 24 550 29 645 34 276
CO2 emissions of petrol-driven passenger cars, kt 7 346 8 143 7 789 7 478 7 212 6 978 6 445 6 110 6 443 5 969 5 782 5 852 6 343 6 521
2 Specific petrol related CO2 emissions of pas-senger cars, g/100km
Number of kilometres of pet-rol-driven passenger cars8, Mio km 34 189 38 580 36 674 35 091 33 843 32 731 30 233 28 855 30 935 28 839 28 274 29 065 32 110 33 498
CO2 emissions from pas-senger cars, kt 8 799 9 809 9 572 9 405 9 391 9 380 9 096 9 020 9 814 9 543 9 686 10 163 11 476 12 397
3 Specific CO2 emissions of passenger cars, t/pkm Passenger transport by
cars8, Mpkm 63 787 72 375 70 350 68 657 68 675 68 762 67 161 67 287 74 352 73 157 75 397 80 422 92 448101 254
CO2 emissions from domes-tic air transport, kt 32 38 43 49 54 58 63 71 77 81 82 67 75 67
4 Specific air-transport emissions, t/passenger Domestic air-passengers14,
Mio 365 425 735 049 674 699 697 589 714 178 697 822 747 313 749 781 857 149 917 267 1 007 048 1 070 863 1 045 706 1 082 194
Energy related CO2 emis-sions food industries, kt 834 906 848 863 916 925 870 1 104 971 930 1 153 1 072 1 241 1 262
5 Energy related CO2 in-tensity - food, drink and tobacco industry, t/Mio Euro
Gross value-added – food, drink and tobacco industry, Mio Euro (EC95) 2.76 2.89 3.09 2.99 3.11 3.27 3.14 3.18 3.42 3.72 3.67 3.59 3.69 3.58
Energy related CO2 emis-sions paper and printing, kt 2 124 2 566 2 124 2 165 2 620 2 231 2 148 2 925 2 677 2 025 2 176 2 012 1 917 1 857
6 Energy related CO2 in-tensity - paper and printing industry, t/Mio Euro
Gross value-added – paper and printing industry, Mio Euro (EC95) 2.66 2.50 2.24 2.43 2.68 2.92 2.83 3.04 3.03 3.52 3.80 4.00 3.81 3.70
14 Number of passengers is not used as activity data for estimating emissions

Austria’s Annual National G
reenhouse Gas Inventory 1990-2003 – AN
NEX IV: Indicators
53
No. Indicator
Numerator / Denominator 1990 1991 1992 1993 1994 1995 1996 1997 1998 1999 2000 2001 2002 2003 CO2 emissions for space heating in households, kt 9 002 9 828 8 944 8 831 8 099 8 637 9 394 8 738 8 632 8 826 8 292 9 154 8 823 9 540
7 Specific CO2 emissions of households for space heating, t/m² Surface area of permanently
occupied dwellings, Mio m2 249 255 258 259 265 272 277 281 284 290 295 298 303 307
CO2 emissions from space heating in commercial and institutional, kt 8
Specific CO2 emissions of commercial and insti-tutional sector for space heating, kg/m² Surface area of services
buildings, Mio m2
CO2 emissions from public thermal power stations15, kt 8 857 9 198 6 275 5 997 6 463 7 546 9 243 9 010 8 047 7 950 7 618 8 873 8 590 10 796
9 Specific CO2 emissions of public power plants, t/TJ All products output by public
thermal power stations, PJ 61.1 64.0 48.5 50.6 56.3 62.0 75.2 73.2 73.2 73.4 66.2 79.0 79.7 98.8
CO2 emissions from auto-producers, kt
10
Specific CO2 emissions of autoproducer plants, t/TJ All products output by auto-
producer thermal power sta-tions, PJ
CO2 emissions from classi-cal power production, kt
11 Carbon intensity of total power generation, t/TJ All products output by public
and autoproducer power stations, PJ
CO2 emissions from trans-port, kt 12 405 13 997 13 941 14 119 14 082 14 466 16 042 14 977 17 183 16 596 17 735 18 886 20 974 22 692
12 Carbon intensity of transport, t/TJ Total final energy consump-
tion from transport16, PJ 195.8 215.8 216.2 219.8 220.5 224.5 243.9 233.8 260.0 253.6 267.6 280.3 301.8 321.7
Energy related CO2 emis-sions paper and printing in-dustries, kt 2 124 2 566 2 124 2 165 2 620 2 231 2 148 2 925 2 677 2 025 2 176 2 012 1 917 1 857 13
Specific energy related CO2 emissions of paper industry, t/t
Physical output of paper, kt 2 932 3 090 3 252 3 301 3 603 3 599 3 653 3 817 4 009 4 142 4 385 4 250 4 419 4 564
15 SNAP 0101 16 Including Off-Road Transport, Pipelines and International Aviation

Austria’s Annual National G
reenhouse Gas Inventory 1990-2003 –
ANN
EX IV: Indicators
54
No. Indicator
Numerator / Denominator 1990 1991 1992 1993 1994 1995 1996 1997 1998 1999 2000 2001 2002 2003
CO2 emissions from the industry sector, kt 12 971 13 379 12 274 12 813 13 818 13 905 13 778 16 122 14 590 13 557 14 299 14 064 14 395 14 163
14 Total final energy con-sumption from indus-try17, PJ
295 301 294 293 295 298 316 354 340 337 360 375 379 401
CO2 emissions from households, kt 10 130 11 089 10 137 10 066 9 258 9 869 10 738 10 050 9 955 10 191 9 620 10 606 10 234 11 087
15 Total final energy con-sumption from house-holds18, PJ
301.8 333.9 315.6 322.2 301.8 324.1 354.2 336.1 333.6 340.5 327.7 365.0 354.2 381.2
17 Including Heat 18 Including District heating and Solar thermal