AUSTRIAN POST - Zonebourse.com€¦ · ARAS KARGO Change in reporting for stake held in Aras Kargo...
30
INVESTOR PRESENTATION FY 2016 AUSTRIAN POST Georg Pölzl/CEO, Walter Oblin/CFO Vienna, March 9, 2017
Transcript of AUSTRIAN POST - Zonebourse.com€¦ · ARAS KARGO Change in reporting for stake held in Aras Kargo...
INVESTOR PRESENTATION FY 2016
AUSTRIAN POST
Georg Pölzl/CEO, Walter Oblin/CFO
Vienna, March 9, 2017

1. HIGHLIGHTS AND OVERVIEW
2. Strategy Implementation
3. Group Results 2016
4. Outlook 2017
2INVESTOR PRESENTATION | Investor Relations | Vienna, March 9, 2017
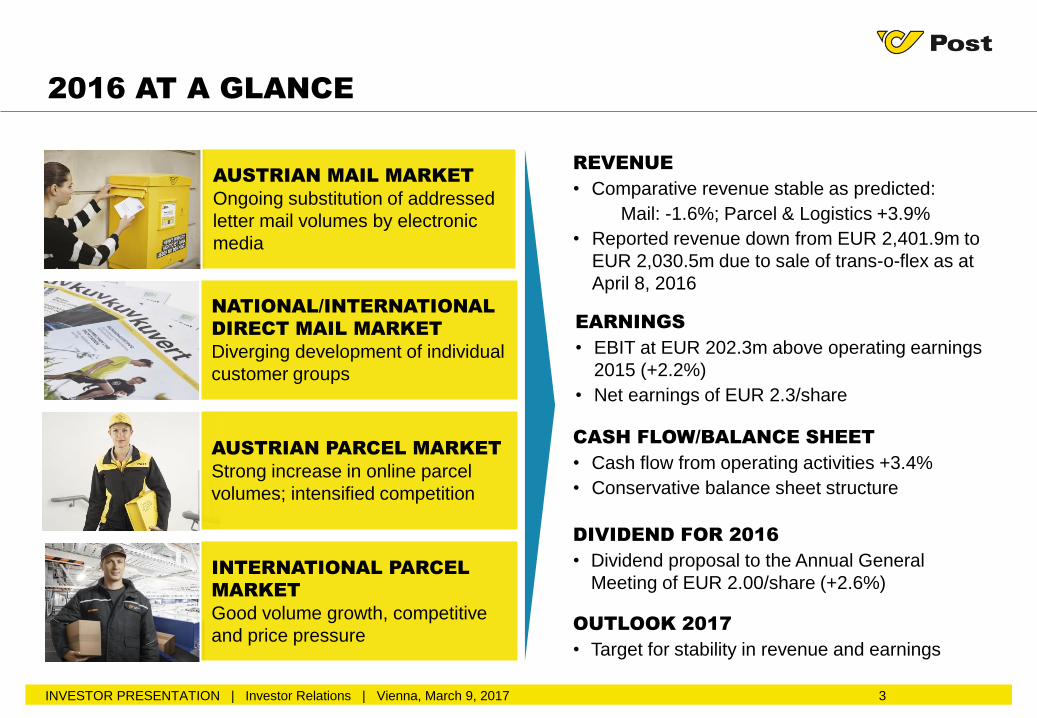
OUTLOOK 2017
• Target for stability in revenue and earnings
2016 AT A GLANCE
NATIONAL/INTERNATIONAL
DIRECT MAIL MARKET
Diverging development of individual
customer groups
REVENUE
• Comparative revenue stable as predicted:
Mail: -1.6%; Parcel & Logistics +3.9%
• Reported revenue down from EUR 2,401.9m to
EUR 2,030.5m due to sale of trans-o-flex as at
April 8, 2016
EARNINGS
• EBIT at EUR 202.3m above operating earnings
2015 (+2.2%)
• Net earnings of EUR 2.3/share
CASH FLOW/BALANCE SHEET
• Cash flow from operating activities +3.4%
• Conservative balance sheet structure
3INVESTOR PRESENTATION | Investor Relations | Vienna, March 9, 2017
AUSTRIAN MAIL MARKET
Ongoing substitution of addressed
letter mail volumes by electronic
media
INTERNATIONAL PARCEL
MARKET
Good volume growth, competitive
and price pressure
AUSTRIAN PARCEL MARKET
Strong increase in online parcel
volumes; intensified competition
DIVIDEND FOR 2016
• Dividend proposal to the Annual General
Meeting of EUR 2.00/share (+2.6%)
INVESTOR PRESENTATION | Investor Relations | Vienna, March 9, 2017
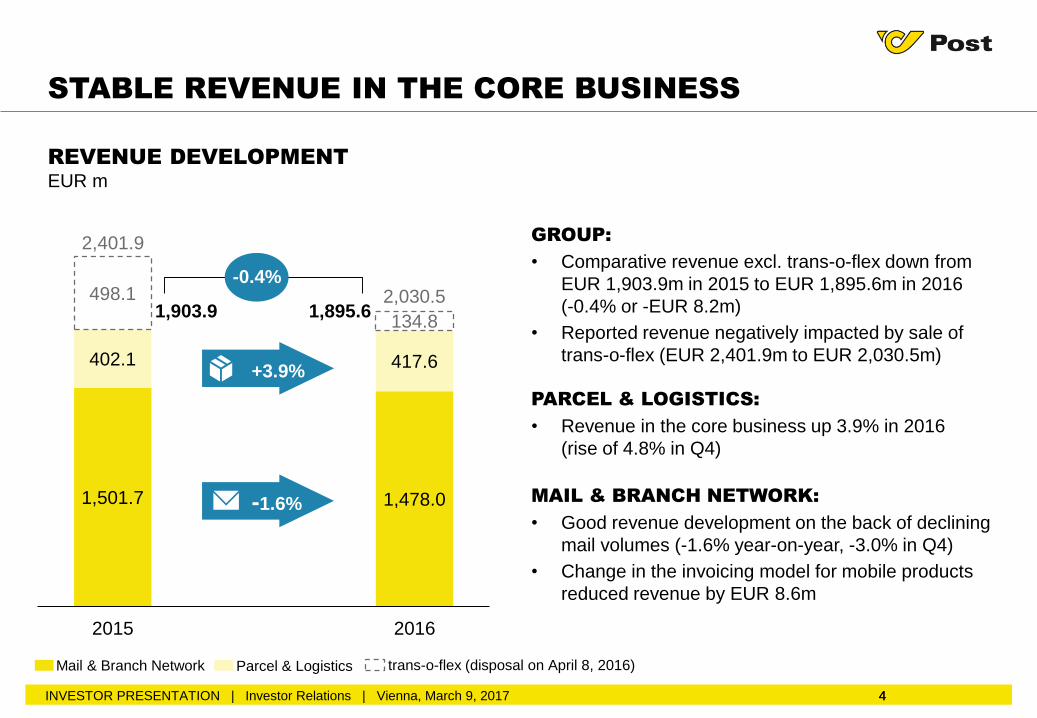
REVENUE DEVELOPMENT
EUR m
4
STABLE REVENUE IN THE CORE BUSINESS
1,501.7 1,478.0
402.1 417.6
498.1
134.8
2015 2016
+3.9%
4
2,401.9
Parcel & Logistics
1,903.9
-1.6%
-0.4%2,030.5
trans-o-flex (disposal on April 8, 2016)
GROUP:
• Comparative revenue excl. trans-o-flex down from
EUR 1,903.9m in 2015 to EUR 1,895.6m in 2016
(-0.4% or -EUR 8.2m)
• Reported revenue negatively impacted by sale of
trans-o-flex (EUR 2,401.9m to EUR 2,030.5m)
PARCEL & LOGISTICS:
• Revenue in the core business up 3.9% in 2016
(rise of 4.8% in Q4)
MAIL & BRANCH NETWORK:
• Good revenue development on the back of declining
mail volumes (-1.6% year-on-year, -3.0% in Q4)
• Change in the invoicing model for mobile products
reduced revenue by EUR 8.6m
1,895.6
Mail & Branch Network
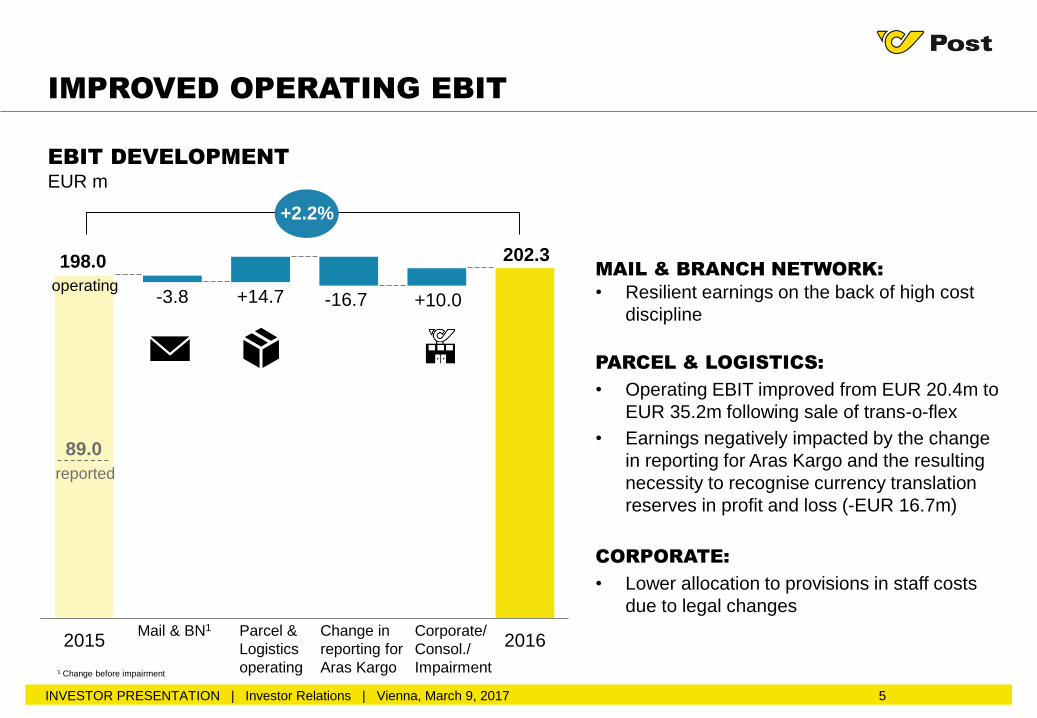
-3.8 +14.7 -16.7 +10.0
2015 2016
reported
5INVESTOR PRESENTATION | Investor Relations | Vienna, March 9, 2017
MAIL & BRANCH NETWORK:
• Resilient earnings on the back of high cost
discipline
PARCEL & LOGISTICS:
• Operating EBIT improved from EUR 20.4m to
EUR 35.2m following sale of trans-o-flex
• Earnings negatively impacted by the change
in reporting for Aras Kargo and the resulting
necessity to recognise currency translation
reserves in profit and loss (-EUR 16.7m)
CORPORATE:
• Lower allocation to provisions in staff costs
due to legal changes
IMPROVED OPERATING EBIT
Parcel &
Logistics
operating
Mail & BN1 Corporate/
Consol./
Impairment
202.3198.0
EBIT DEVELOPMENT
EUR m
+2.2%
operating
Change in
reporting for
Aras Kargo
89.0
1 Change before impairment
6
1. Highlights and Overview
2. STRATEGY IMPLEMENTATION
3. Group Results 2016
4. Outlook 2017
INVESTOR PRESENTATION | Investor Relations | Vienna, March 9, 2017

ENHANCING EFFICIENCY AND
OPTIMISING THE COST STRUCTURE
Logistics infrastructure and process optimisation
7
CLEAR STRATEGIC PRIORITIES
PROFITABLE GROWTH IN SELECTED
MARKETS
Focusing and performance enhancement
DEFENDING MARKET LEADERSHIP IN
THE CORE BUSINESS
Safeguarding of market position in a competitiveenvironment
1. 2.
3. 4.CUSTOMER ORIENTATION AND
INNOVATION
Promotion of self-service solutions and serviceimprovements
4.
INVESTOR PRESENTATION | Investor Relations | Vienna, March 9, 2017
8
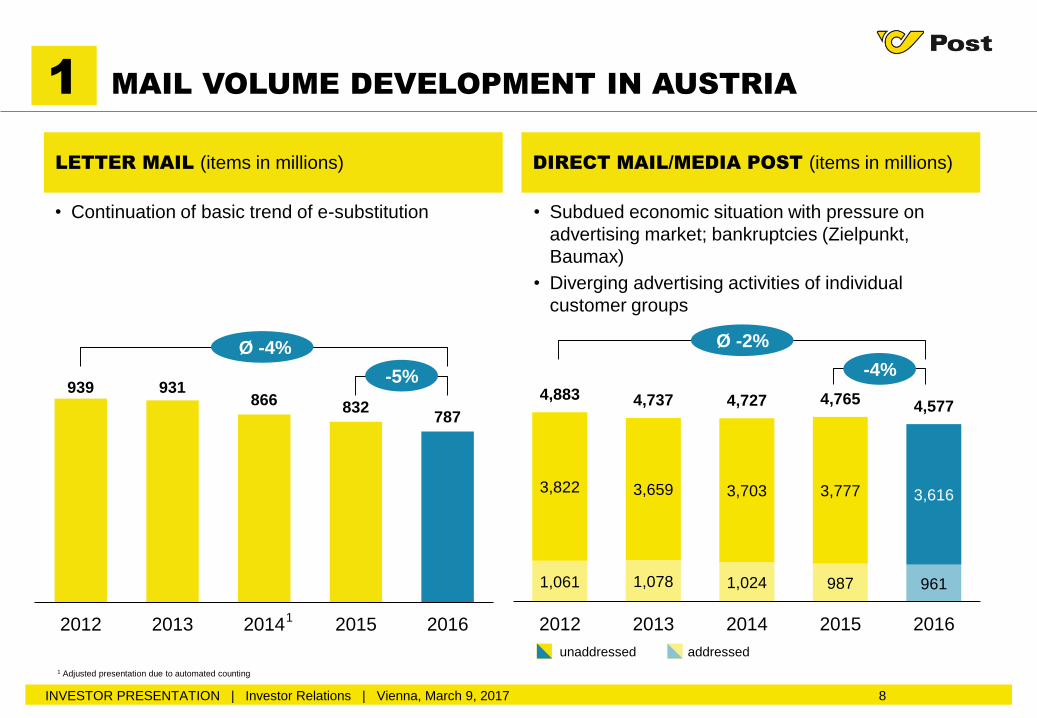
LETTER MAIL (items in millions)
• Continuation of basic trend of e-substitution
939 931866 832
787
2012 2013 2014 2015 2016
-5%
Ø -4%
1 Adjusted presentation due to automated counting
1
1 MAIL VOLUME DEVELOPMENT IN AUSTRIA
DIRECT MAIL/MEDIA POST (items in millions)
• Subdued economic situation with pressure on
advertising market; bankruptcies (Zielpunkt,
Baumax)
• Diverging advertising activities of individual
customer groups
1,061 1,078 1,024 987 961
3,822 3,659 3,703 3,777 3,616
4,883 4,737 4,727 4,765 4,577
2012 2013 2014 2015 2016
-4%
Ø -2%
unaddressed addressed
INVESTOR PRESENTATION | Investor Relations | Vienna, March 9, 2017

9
+7.2%
VOLUME DEVELOPMENT ON THE ENTIRE
AUSTRIAN MARKET (millions of parcels)
B2C
C2C
B2B
MARKET SHARES
BY VOLUME IN 2016
32%
68%
B2C/C2C
(93m parcels)
B2B
(89m parcels)
Competitors
Austrian Post
• Market leadership in the private customer business
with a 57% market share, increasing competition
• Ongoing rise in market share for business parcels
to 32% in 2016
57%
43%
• Strong volume growth in the private parcel
business due to the online shopping trend
• Hardly any impetus from the B2B segment
+34.6%
+0.8%
+1.7%
151.1157.3
181.9
+15.7%
1 AUSTRIAN PARCEL MARKET ENVIRONMENT
Reported data contained in a Kreutzer Fischer & Partner study
INVESTOR PRESENTATION | Investor Relations | Vienna, March 9, 2017
+4.1%
64.4 69.193.0
86.7 88.2
88.9
2014 2015 2016
10
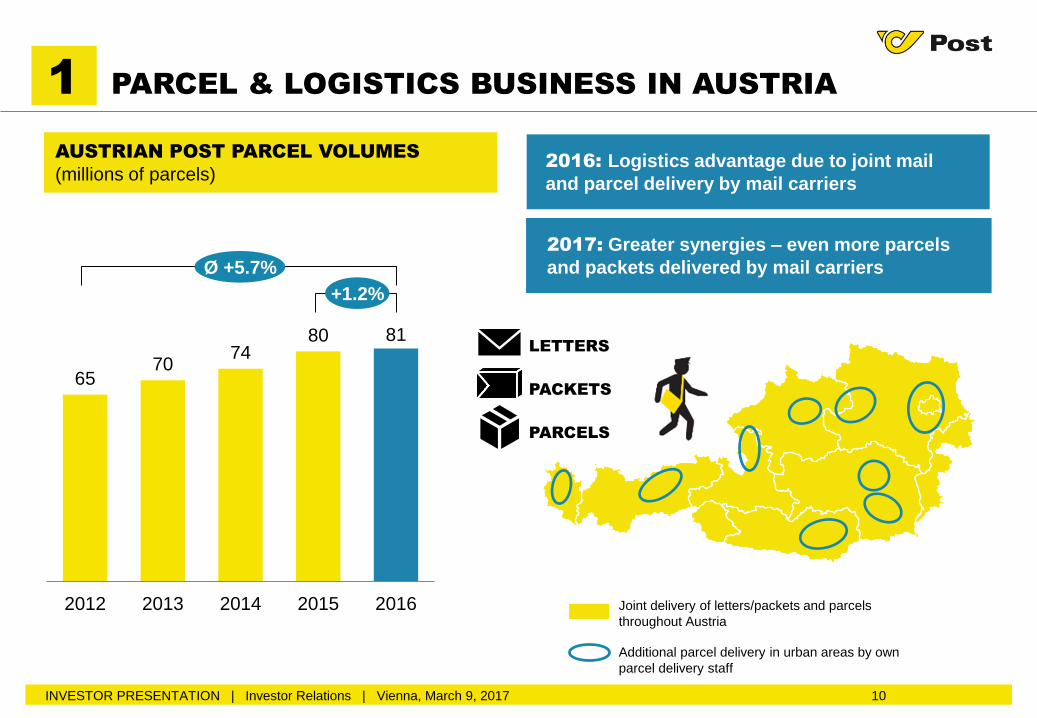
AUSTRIAN POST PARCEL VOLUMES
(millions of parcels)
6570
7480 81
2012 2013 2014 2015 2016
+1.2%
Ø +5.7%
2016: Logistics advantage due to joint mail
and parcel delivery by mail carriers
1 PARCEL & LOGISTICS BUSINESS IN AUSTRIA
2017: Greater synergies – even more parcels
and packets delivered by mail carriers
Additional parcel delivery in urban areas by own
parcel delivery staff
Joint delivery of letters/packets and parcels
throughout Austria
LETTERS
PACKETS
PARCELS
INVESTOR PRESENTATION | Investor Relations | Vienna, March 9, 2017
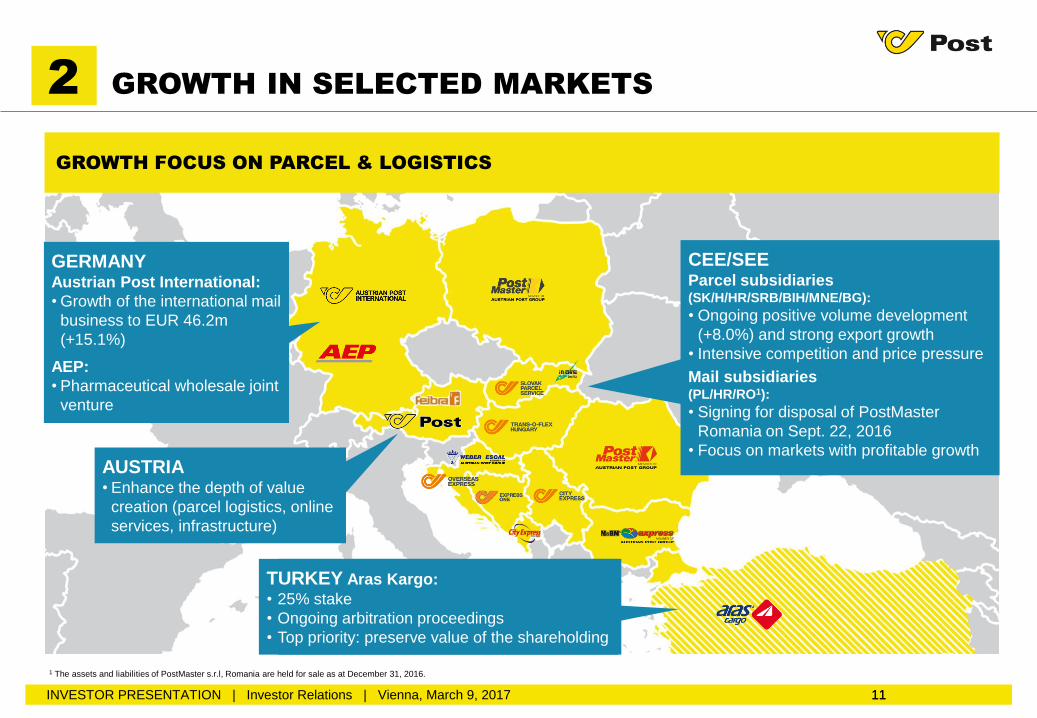
GERMANYAustrian Post International:
• Growth of the international mail
business to EUR 46.2m
(+15.1%)
AEP:
• Pharmaceutical wholesale joint
venture
11
TÜRKEI Aras Kargo:
• 25% Anteil
• Laufendes Schiedsgerichtsverfahren
• Oberste Priorität Werterhaltung des Anteils
2 GROWTH IN SELECTED MARKETS
11
GROWTH FOCUS ON PARCEL & LOGISTICS
CEE/SEE Parcel subsidiaries(SK/H/HR/SRB/BIH/MNE/BG):
• Ongoing positive volume development
(+8.0%) and strong export growth
• Intensive competition and price pressure
Mail subsidiaries (PL/HR/RO1):
• Signing for disposal of PostMaster
Romania on Sept. 22, 2016
• Focus on markets with profitable growth
TURKEY Aras Kargo:
• 25% stake
• Ongoing arbitration proceedings
• Top priority: preserve value of the shareholding
INVESTOR PRESENTATION | Investor Relations | Vienna, March 9, 2017
AUSTRIA• Enhance the depth of value
creation (parcel logistics, online
services, infrastructure)
1 The assets and liabilities of PostMaster s.r.l, Romania are held for sale as at December 31, 2016.

12
3 STAFF STRUCTURE IN AUSTRIA
FULL TIME EQUIVALENTS IN THE CORE BUSINESS IN AUSTRIA (average for the period)
New collective wage agreement
(CWA) since 2009
Old CWA
Civil servants
Change
2015/2016:
– 398 Civil servants
– 494 Old CWA
+ 352 New CWA
– 541 Employees
12,039 11,229 10,480 9,926 9,329 8,625 8,042 7,644
9,397
7,8837,247
6,7886,230
5,7925,416
4,922
490
1,8912,490
3,3503,858
4,3744,775
5,127
21,92621,003
20,217 20,06419,417
18,79018,233
17,692
2009 2010 2011 2012 2013 2014 2015 2016
-541 FTE
INVESTOR PRESENTATION | Investor Relations | Vienna, March 9, 2017
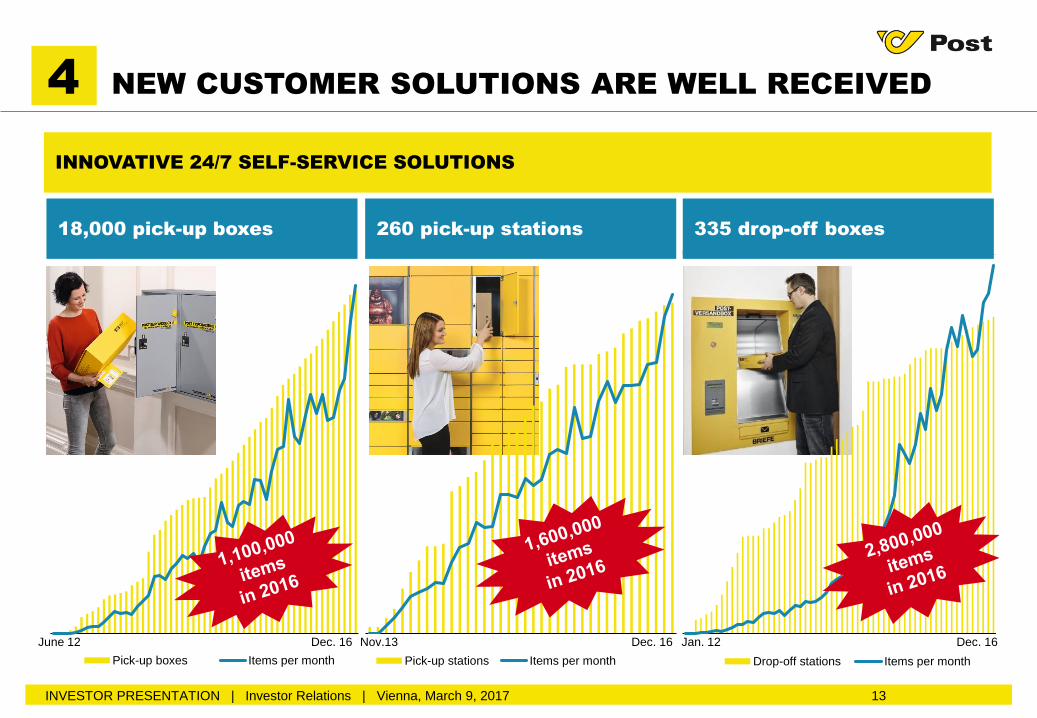
Drop-off stations Items per monthPick-up stations Items per monthPick-up boxes Items per month
13
4 NEW CUSTOMER SOLUTIONS ARE WELL RECEIVED
INNOVATIVE 24/7 SELF-SERVICE SOLUTIONS
260 pick-up stations18,000 pick-up boxes 335 drop-off boxes
Dec. 16Dec. 16 Nov.13June 12 Jan. 12
INVESTOR PRESENTATION | Investor Relations | Vienna, March 9, 2017
Dec. 16
14
1. Highlights and Overview
2. Strategy Implementation
3. GROUP RESULTS 2016
4. Outlook 2017
INVESTOR PRESENTATION | Investor Relations | Vienna, March 9, 2017

15
FINANCIAL INDICATORS 2016 AT A GLANCE
Revenue (EUR m)Revenue below the previous year due todeconsolidation of trans-o-flex 2,401.9 2,030.5
EBITDA margin Improved EBITDA margin of 13.6%12.6% 13.6%
EBIT margin Higher profitability following sale of trans-o-flex3.7% 10.0%
Earnings/share (EUR)Earnings per share above the previous year
(negative special effects in 2015)1.06 2.26
Equity ratioConservative balance sheet structure with a low
level of debt, higher equity ratio39.8% 43.5%
Cash flow (EUR m) Increase in cash flow from operating activities216.2 223.6
2015 2016
Revenue excl. trans-o-flex (EUR m)
Stable revenue (-0.4%) in the core business1,903.9 1,895.6
INVESTOR PRESENTATION | Investor Relations | Vienna, March 9, 2017
INVESTOR PRESENTATION | Investor Relations | Vienna, March 9, 2017 16
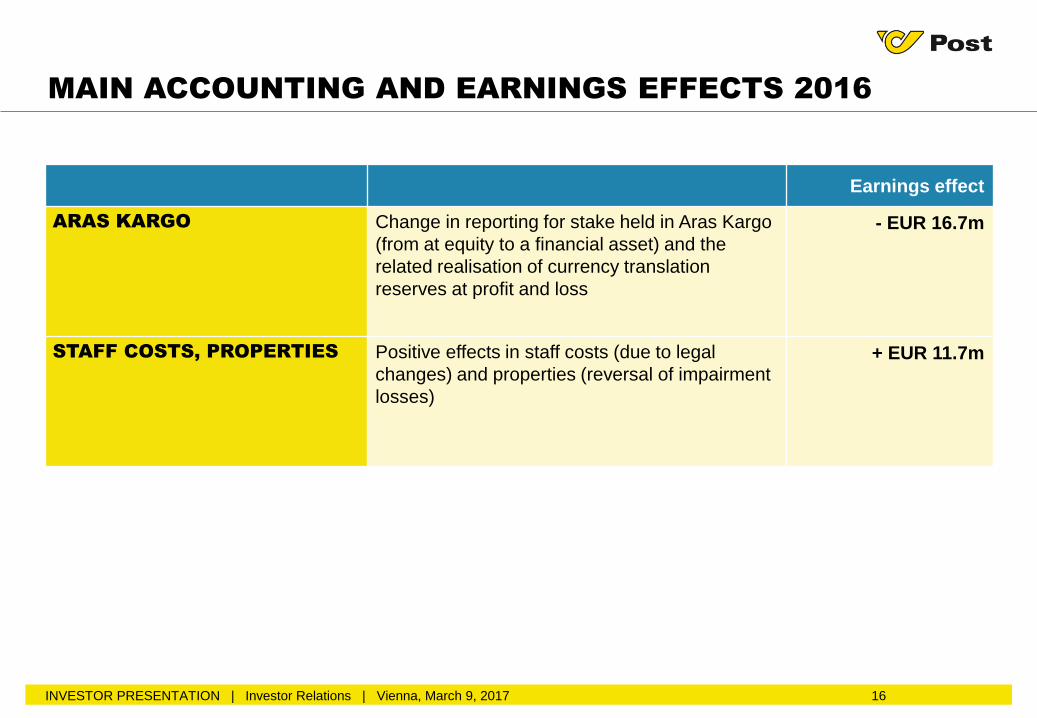
MAIN ACCOUNTING AND EARNINGS EFFECTS 2016
Earnings effect
ARAS KARGO Change in reporting for stake held in Aras Kargo
(from at equity to a financial asset) and the
related realisation of currency translation
reserves at profit and loss
- EUR 16.7m
STAFF COSTS, PROPERTIES Positive effects in staff costs (due to legal
changes) and properties (reversal of impairment
losses)
+ EUR 11.7m
17
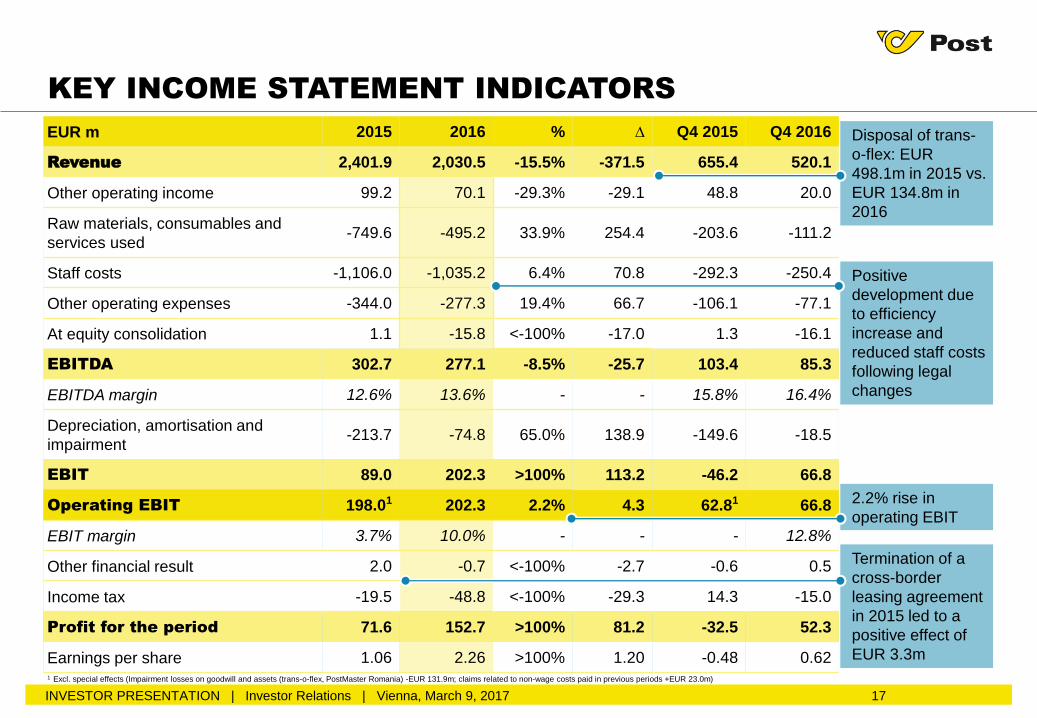
KEY INCOME STATEMENT INDICATORS
2.2% rise in
operating EBIT
EUR m 2015 2016 % ∆ Q4 2015 Q4 2016
Revenue 2,401.9 2,030.5 -15.5% -371.5 655.4 520.1
Other operating income 99.2 70.1 -29.3% -29.1 48.8 20.0
Raw materials, consumables and
services used-749.6 -495.2 33.9% 254.4 -203.6 -111.2
Staff costs -1,106.0 -1,035.2 6.4% 70.8 -292.3 -250.4
Other operating expenses -344.0 -277.3 19.4% 66.7 -106.1 -77.1
At equity consolidation 1.1 -15.8 <-100% -17.0 1.3 -16.1
EBITDA 302.7 277.1 -8.5% -25.7 103.4 85.3
EBITDA margin 12.6% 13.6% - - 15.8% 16.4%
Depreciation, amortisation and
impairment-213.7 -74.8 65.0% 138.9 -149.6 -18.5
EBIT 89.0 202.3 >100% 113.2 -46.2 66.8
Operating EBIT 198.01 202.3 2.2% 4.3 62.81 66.8
EBIT margin 3.7% 10.0% - - - 12.8%
Other financial result 2.0 -0.7 <-100% -2.7 -0.6 0.5
Income tax -19.5 -48.8 <-100% -29.3 14.3 -15.0
Profit for the period 71.6 152.7 >100% 81.2 -32.5 52.3
Earnings per share 1.06 2.26 >100% 1.20 -0.48 0.62
Positive
development due
to efficiency
increase and
reduced staff costs
following legal
changes
Termination of a
cross-border
leasing agreement
in 2015 led to a
positive effect of
EUR 3.3m
Disposal of trans-
o-flex: EUR
498.1m in 2015 vs.
EUR 134.8m in
2016
INVESTOR PRESENTATION | Investor Relations | Vienna, March 9, 2017
1 Excl. special effects (Impairment losses on goodwill and assets (trans-o-flex, PostMaster Romania) -EUR 131.9m; claims related to non-wage costs paid in previous periods +EUR 23.0m)

18
• Diverging development of advertising activities on
the part of individual customer groups; bankruptcies
(Zielpunkt, Baumax)
• Positive effect from international mail items
• Decline in CEE due to sale of subsidiaries
(-EUR 3.0m)
MAIL & BRANCH NETWORK DIVISION:
REVENUE DEVELOPMENT IN 2016
DIRECT MAIL/MEDIA POST (EUR m)LETTER MAIL & MAIL SOLUTIONS (EUR m)
• Decline in letter mail volume of about 5%
• Positive revenue contribution from elections and
international e-commerce shipments
-0.9%
-2.0%
+2.2%
-0.7%
+1.7%
-3.9%
808.4 801.3
569.5 558.3
-3.1%
-1.9%
-1.9%
-3.5%
INVESTOR PRESENTATION | Investor Relations | Vienna, March 9, 2017
Q1 206.4
Q1 204.9
Q2 194.3
Q2 198.6
Q3 186.7
Q3 181.0
Q4 221.0
Q4 216.8
2015 2016
Q1 142.7
Q1 137.2
Q2 137.1
Q2 139.4
Q3 132.0
Q3 129.5
Q4 157.7
Q4 152.2
2015 2016

19
MAIL & BRANCH NETWORK DIVISION:
INCOME STATEMENT
EUR m 2015 2016 % ∆ Q4 2015 Q4 2016
Revenue 1,501.7 1,478.0 -1.6% -23.7 412.2 399.6
• Letter Mail & Mail-Solutions 808.4 801.3 -0.9% -7.1 221.0 216.8
• Direct Mail 428.7 416.7 -2.8% -12.0 117.4 112.4
• Media Post 140.8 141.6 0.6% 0.8 40.3 39.8
• Branch Services 123.8 118.4 -4.4% -5.4 33.5 30.6
Total revenue1 1,585.8 1,565.8 -1.3% -20.0 435.6 424.7
At equity consolidation -0.5 0.0 >100% 0.5 -0.1 0.0
EBITDA 322.9 319.7 -1.0% -3.3 90.4 95.8
EBITDA margin2 20.4% 20.4% - - 20.8% 22.6%
Depreciation, amortisation and
impairment-38.2 -34.6 9,5% 3,6 -14,3 -8.4
EBIT 284.7 285.1 0.1% 0.3 76.1 87.4
EBIT margin2 18.0% 18.2% - - 17.5% 20.6%
1 Incl. revenue with other segments2 EBIT margin, EBITDA margin in relation to total revenue
Revenue held at a
solid level despite
negative volume
development
Positive
development for
mobile products
overshadowed by
change in the
invoicing model
(-EUR 8.6m)
Impairment for
PostMaster
Romania of EUR
6.1m in 2015 vs.
EUR 2.0m in 2016
Stable earnings on
the back of strict
cost discipline
INVESTOR PRESENTATION | Investor Relations | Vienna, March 9, 2017

REVENUE (EUR m)
20
PARCEL & LOGISTICS DIVISION:
REVENUE DEVELOPMENT 2016
+2.7%
900.2
552.5
2015 2016
Austria
CEE/SEE
+4.1%
PARCEL & LOGISTICS DIVISION:
• Comparative revenue in 2016 up 3.9% following
sale of trans-o-flex (Q4: +4.8%)
GERMANY:
• Sale of former subsidiary trans-o-flex as at April 8,
2016 (EUR 498.1m in 2015; EUR 134.8m in 2016)
CEE/SEE: +2.7% (Q4: +3.0%)
• Solid revenue growth, high price pressure
• Good development in Hungary and Serbia
AUSTRIA: +4.1% (Q4: +5.2%)
• Intensified competition in the Austrian parcel
market
• Double-digit market growth due to e-commerce
1 Incl. revenue of trans-o-flex ThermoMed Austria GmbH
402.1 417.6
+3.9%
Germany1
INVESTOR PRESENTATION | Investor Relations | Vienna, March 9, 2017
325.4 338.8
76.7 78.8
498.1
134.8

21
EUR m 2015 2016 % ∆ Q4 2015 Q4 2016
Revenue excl. trans-o-flex 402.1 417.6 3.9% 15.5 114.9 120.5
Revenue 900.2 552.5 -38.6% -347.7 243.2 120.5
• Premium 668.4 337.8 -49.5% -330.7 178.3 60.9
• Standard 195.4 184.9 -5.4% -10.5 55.4 52.9
• Other Parcel Services 36.4 29.8 -18.1% -6.6 9.4 6.7
Total revenue1 908.4 564.0 -37.9% -344.4 245.7 124.0
At equity consolidation 3.9 -14.6 <-100% -18.5 1.7 -15.9
EBITDA 37.9 29.8 -21.2% -8.0 5.4 -3.3
EBITDA margin2 4.2% 5.3% - - 2.2% -
Depreciation, amortisation and
impairment-143.3 -11.4 92.1% 131.9 -127.3 -2.9
EBIT -105.4 18.5 >100% 123.9 -121.9 -6.3
EBIT margin2 - 3.3% - - - -
PARCEL & LOGISTICS DIVISION:
INCOME STATEMENT
1 Incl. revenue with other segments2 EBIT margin/EBITDA margin in relation to total revenue
Comparative
revenue up 3.9%,
positive
development
despite intense
competition
EBIT 2015
impacted by
impairment loss for
trans-o-flex of
EUR 125.8m
Change in reporting
for Aras Kargo and
realisation of
currency translation
reserves in profit
and loss to the
amount of
-EUR 16.7m
Operating EBIT improved from
EUR 20.4m to EUR 35.2m after
sale of trans-o-flex
INVESTOR PRESENTATION | Investor Relations | Vienna, March 9, 2017

0.9
670.0
503.3
361.9
5.6
EQUITY & LIABILITIES
48
91
168
196
BALANCE SHEET AS AT DECEMBER 31, 2016
EUR m
22
SOLID BALANCE SHEET STRUCTURE
2.4
597.6
77.5
385.9
139.8
338.6
ASSETS
Cash and cash equivalents/
Securities1
Financial assets/
Investment property
Receivables/
Inventories/Other
Intangible
assets
Property, plant and equipmentEquity
Provisions
Liabilities/
Other
Other financial liabilities1,541.8
Liquid financial
resources of
EUR 339m
Equity ratio of 43.5%
Structure of provisionsEUR m
Employee under-utilisation
Other staff-related provisions
Staff-related provisions
(termination/jubilee benefits)
Other provisions
27%
11%62%>3 years>1 year
Financial liabilities of only
EUR 6m
→ No pension obligations!
1,541.8
Provisions by term
Liabilities held for saleAssets held for sale
INVESTOR PRESENTATION | Investor Relations | Vienna, March 9, 2017
<1 year
1 Securities are reported under other financial assets in the balance sheet

Operating
free CF
before acq./
securities
223.6
-69.9 +3.1
156.8
-33.5 -4.8
118.5
23
CASH FLOW DEVELOPMENT
EUR m
ROBUST CASH FLOW 2016
CAPEX
new corporate
headquarters
Cash flow
from operating
activities
216.2 -71.9 -11.1 167.2
Acquisitions/Changes in securities
Free cash flow
2015
Operating free cash flow
exceeds dividend level
OtherCAPEX excl. new
corporate
headquarters
160.5 1 +27.12+6.9
232.2 -75.8 +11.0 162.82014 158.5 -6.7+2.1
Cash flow from operating
activities above prior-year level
1 Excl. tax payments of EUR 9.2m in connection with the sale of former corporate headquarters2 Incl. remaining purchase price old corporate headquarters (EUR 60m)
INVESTOR PRESENTATION | Investor Relations | Vienna, March 9, 2017
INVESTOR PRESENTATION | Investor Relations | Vienna, March 9, 2017 24
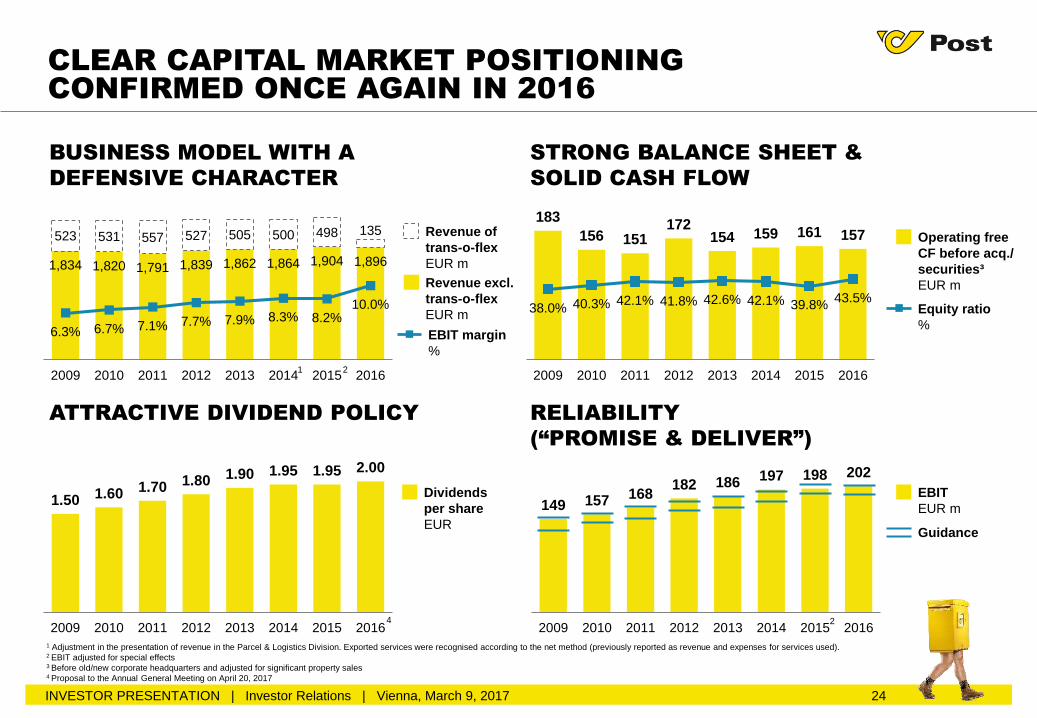
CLEAR CAPITAL MARKET POSITIONING
CONFIRMED ONCE AGAIN IN 2016
1.50 1.60 1.70 1.80 1.90 1.95 1.95 2.00
2009 2010 2011 2012 2013 2014 2015 2016
183
156 151172
154 159 161 157
38.0% 40.3% 42.1% 41.8% 42.6% 42.1% 39.8%43.5%
2009 2010 2011 2012 2013 2014 2015 2016
1,834 1,820 1,791 1,839 1,862 1,864 1,904 1,896
523 531 557 527 505 500 498 135
6.3% 6.7% 7.1% 7.7% 7.9% 8.3% 8.2%10.0%
2009 2010 2011 2012 2013 2014 2015 2016
BUSINESS MODEL WITH A
DEFENSIVE CHARACTER
149 157 168182 186 197 198 202
2009 2010 2011 2012 2013 2014 2015 2016
STRONG BALANCE SHEET &
SOLID CASH FLOW
RELIABILITY
(“PROMISE & DELIVER”)
ATTRACTIVE DIVIDEND POLICY
Revenue of
trans-o-flex
EUR m
EBIT margin
%
Operating free
CF before acq./
securities³
EUR m
Equity ratio
%
Dividends
per share
EUR
EBIT
EUR m
Guidance
2
Revenue excl.
trans-o-flex
EUR m
2
1 Adjustment in the presentation of revenue in the Parcel & Logistics Division. Exported services were recognised according to the net method (previously reported as revenue and expenses for services used). 2 EBIT adjusted for special effects3 Before old/new corporate headquarters and adjusted for significant property sales4 Proposal to the Annual General Meeting on April 20, 2017
4
1
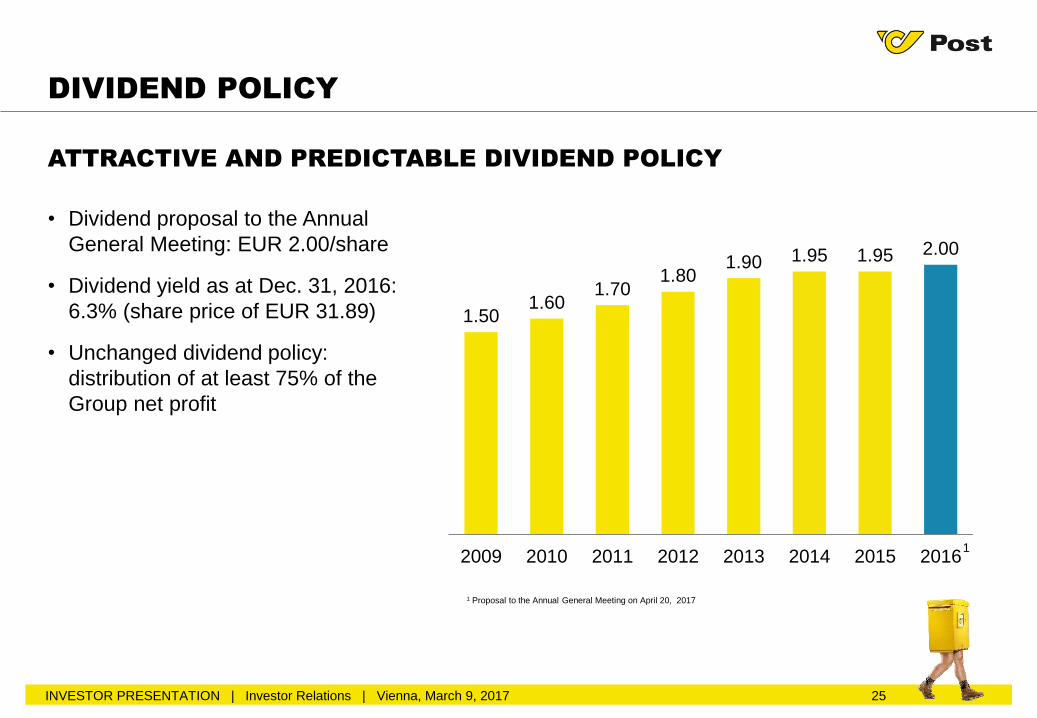
1.501.60
1.701.80
1.90 1.95 1.95 2.00
2009 2010 2011 2012 2013 2014 2015 2016
• Dividend proposal to the Annual
General Meeting: EUR 2.00/share
• Dividend yield as at Dec. 31, 2016:
6.3% (share price of EUR 31.89)
• Unchanged dividend policy:
distribution of at least 75% of the
Group net profit
ATTRACTIVE AND PREDICTABLE DIVIDEND POLICY
DIVIDEND POLICY
1 Proposal to the Annual General Meeting on April 20, 2017
INVESTOR PRESENTATION | Investor Relations | Vienna, March 9, 2017 25
1

26
1. Highlights and Overview
2. Strategy Implementation
3. Group Results 2016
4. OUTLOOK 2017
INVESTOR PRESENTATION | Investor Relations | Vienna, March 9, 2017

27
TOP PRIORITIES 2017/2018
PARCEL
• Further strengthening of quality leadership on the core markets
• Expansion of service offering (same-day delivery, desired delivery in a
specified time slot)
• Uniform level of service in the international network
• Best logistics performance in Austria for letters and direct mail
items as well as e-commerce orders
• Promotion of international and transnational shipment volumes
• Cost discipline in logistics and delivery
INFRASTRUCTURE
• Make the branch network more viable for the future: definition of future
postal and financial services
• CAPEX investments: enhance sorting efficiency for increasing parcel
volumes
• Property portfolio: Optimisation of efficiency and profitability in 900,000m²
of logistics and office space
INVESTOR PRESENTATION | Investor Relations | Vienna, March 9, 2017

SORTING CENTRE
VIENNA NORTH
INVESTOR PRESENTATION | Investor Relations | Vienna, March 9, 2017 28
INVESTMENTS AND PROJECT DEVELOPMENT 2017
NEW CORPORATE
HEADQUARTERS
PROJECT DEVELOPMENT
NEUTORGASSE
• Completion Q3 2017
• 49,300 m² total floor space;
26,000 m² office space;
5,500 m² shopping and catering
space
• Implementation
“in time & under budget”
• New parcel logistics centre to
handle growing parcel volumes in
Austria
• Location: Langenzersdorf (north
of Vienna)
• 100,000m² property area
• Construction in 2017/18
• Development/expansion of an
historic property in Vienna’s 1st
district in its current state
• Apartments with a total floor area
of 4,400m²
• Sale of 25 units started in
October 2016
• www.cotton-residence.at
•

29INVESTOR PRESENTATION | Investor Relations | Vienna, March 9, 2017
Market
environment
OUTLOOK 2017
Revenue
Earnings
Investments
• 5% volume decline p.a. of traditional letter mail due to electronic substitution
expected
• Advertising business with diverging development of product/customer groups
• Growing parcel volumes due to online shopping, intensified competition
• The objective is to maintain 2017 revenue at a stable level
(2016 revenue of EUR 1.9bn excl. trans-o-flex)
• Improved services on the basis of current customer requirements (e.g. value-
added physical/electronic services, “Packet“)
• Investments in efficiency increases, service improvement and capacity
expansion
• Operating CAPEX of about EUR 70-80m planned in 2017
• Further process and structural optimisation
• Target of achieving stable operating EBIT at the level of 2016
(EBIT 2016 of EUR 202.3m)
Dividends • Proposal to the Annual General Meeting of EUR 2.00/share
• Maintain the objective of distributing at least 75% of the Group net profit

30
CONTACT
Financial calendar 2017
April 20, 2017 Annual General Meeting
May 2/4, 2017 Ex-dividend day/Dividend payment date
May 12, 2017 Interim Report Q1 2017
August 10, 2017 Half-Year Financial Report 2017
November 15, 2017 Interim Report Q1-3 2017
Disclaimer
This presentation contains forward-looking statements, based on the currently held beliefs and assumptions of the management of Austrian Post, which are
expressed in good faith and, in their opinion, reasonable. These statements may be identified by words such as “expectation“ or “target“ and similar expressions, or
by their context. Forward-looking statements involve known and unknown risks, uncertainties and other factors, which may cause the actual results, financial
condition, performance, or achievements of Austrian Post, or results of the postal industry generally, to differ materially from the results, financial condition,
performance or achievements expressed or implied by such forward-looking statements. Given these risks, uncertainties and other factors, recipients of this
document are cautioned not to place undue reliance on the forward-looking statements. Austrian Post disclaims any obligation to update these forward-looking
statements to reflect future events or developments.
Austrian Post | Legal form: limited company under Austrian law | Registered seat in the Municipality of Vienna | Commercial register number
FN 180219d of the Commercial Court of Vienna
This presentation can contain legally protected and confidential information and is protected by copyright. The reproduction, dissemination or
duplication of this presentation, either in part or as a whole, requires the express written permission of Austrian Post.
Austrian Post
Investor Relations
Haidingergasse 1, 1030 Vienna
Website: www.post.at/ir
E-mail: [email protected]
Telephone: +43 57767-30401
Fax: +43 57767-30409
INVESTOR PRESENTATION | Investor Relations | Vienna, March 9, 2017