GLOBAL SEAFOOD TRADE The Role of Aquaculture and Consumer Needs
Australia’s seafood tradeUPDATED JANUARY 2015
Department of Agricultureand Water Resources

© Commonwealth of Australia 2015
Ownership of intellectual property rights
Unless otherwise noted, copyright (and any other intellectual property rights, if any) in this publication is owned by the Commonwealth of Australia (referred to as the Commonwealth).
Creative Commons licence
All material in this publication is licensed under a Creative Commons Attribution 3.0 Australia Licence, save for content supplied by third parties, logos and the Commonwealth Coat of Arms.
Creative Commons Attribution 3.0 Australia Licence is a standard form licence agreement that allows you to copy, distribute, transmit and adapt this publication provided you attribute the work. A summary of the licence terms is available from creativecommons.org/licenses/by/3.0/au/deed.en. The full licence terms are available from creativecommons.org/licenses/by/3.0/au/legalcode.
This publication (and any material sourced from it) should be attributed as: Department of Agriculture 2015, Australia’s seafood trade. CC BY 3.0
Cataloguing data
Department of Agriculture 2015, Australia’s seafood trade, Department of Agriculture, Canberra.
Internet
Australia’s seafood trade is available at agriculture.gov.au
Contact
Department of Agriculture
Postal address GPO Box 858 Canberra ACT 2601 Australia Web agriculture.gov.au
Inquiries regarding the licence and any use of this document should be sent to [email protected]
The Australian Government acting through the Department of Agriculture has exercised due care and skill in the preparation and compilation of the information and data in this publication. Notwithstanding, the Department of Agriculture, its employees and advisers disclaim all liability, including liability for negligence, for any loss, damage, injury, expense or cost incurred by any person as a result of accessing, using or relying upon any of the information or data in this publication to the maximum extent permitted by law.
ContentsFast Facts 1
Australia’s seafood trade 3
Seafood consumption 5
Seafood production and trade 5
Sustainable seafood production 13
Seafood certification and labelling 16
Marine reserves 17
References 18

1Department of AgricultureAustralia’s seafood trade
Fast facts
• Australia’s seafood comes from wild capture and aquaculture sources.• The amount of seafood (edible and non-edible) produced in Australia has remained
relatively stable over the last 20 or so years at around 230 000 tonnes per year.
ሲ Australia’s apparent consumption of seafood (processed weight) increased from 13 kilograms in 2000-01 to 15 kilograms in 2012–13 (Stephan and Hobsbawn 2014).
ሲ It is estimated that Australians consumed around 345 000 tonnes of edible seafood products in 2012–13 (Stephan and Hobsbawn 2014). By volume, imported seafood accounted for around 66 per cent of this consumption.
• The value of Australian fisheries and aquaculture production is around $2.4 billion each year.
ሲ Australia exports around $1.2 billion of seafood products annually.
• In 2012–13, the Australian export value of fisheries products (edible and non-edible) declined by 4 per cent ($52 million) to $1.18 billion in 2012–13.
• The total value of Australian imports of fisheries products (edible and non-edible) increased by 3 per cent ($42 million) to $1.65 billion in 2012–13.
• Australia has the world’s third largest Exclusive Economic Zone. However, the low productivity of our marine waters limits wild capture fisheries production.
• In developed countries, demand for seafood is often greater than domestic production can support. The United States, Japan and European Union, including the United Kingdom, are all net importers of seafood products.
• Australia differs from many other developed countries in that a significant proportion of Australian product, which could otherwise supply the domestic market, is sold to export markets due to price.
• These products are generally still available in Australia, but Australian consumers are often unwilling to pay as high a price as export markets for the volumes produced.
2 Department of AgricultureAustralia’s seafood trade
Fast facts
ሲ Australia exports high value products such as rock lobster, abalone, and tuna.
ሲ Australia exports little of lower value staples such as white fish and canned fin fish products.
• Over the last six years aquaculture has expanded greatly in East Asia, particularly in China, Vietnam and Indonesia. Australia’s high dollar and labour costs means that farmed seafood can be imported at very low prices.
• Australian aquaculture production is growing, particularly in terms of volume, although it faces strong competition from cheap imports, particularly from Asia.
• Australia’s seafood imports largely consist of lower-value products such as frozen fillets, frozen prawns and canned fish.
ሲ Imported products, predominantly from Thailand, New Zealand, Vietnam and China, meet Australian consumers’ demand for low-cost seafood products.
• The canned fish consumed in Australia generally consists of low-value tuna products, such as skipjack tuna.
ሲ Almost all canned tuna sold in Australia comes from Thailand, which produces around half of the canned tuna traded in the world.
ሲ The low production and labour costs of canning in South East Asian countries makes it difficult for Australia to compete. These countries also have geographical advantages over Australia, being closer to tuna stocks and having preferred access to major markets.
ሲNo significant canning of tuna has taken place in Australia since May 2010.
• In Australia, frozen and thawed basa (catfish) fillets from farms in Vietnam are now the most commonly and widely eaten import.
ሲ The low cost, white boneless flesh and neutral flavour of basa makes it attractive to a large cross section of the Australian community.
3Department of AgricultureAustralia’s seafood trade
Australia’s seafood trade
Australians love seafood. We eat more and more of it each year. This is a good thing as fish are a healthy source of protein and essential fatty acids and are recommended as an important part of a good diet (Heart Foundation 2008; NHRMC 2013).
People sometimes question why Australia imports so much seafood (66 per cent of consumption). With such a long coastline and a relatively small population, why don’t we produce enough seafood to feed ourselves, as we do with many other food products? People are also sometimes confused by the role and prospects of wild capture fisheries and aquaculture in Australian seafood production.
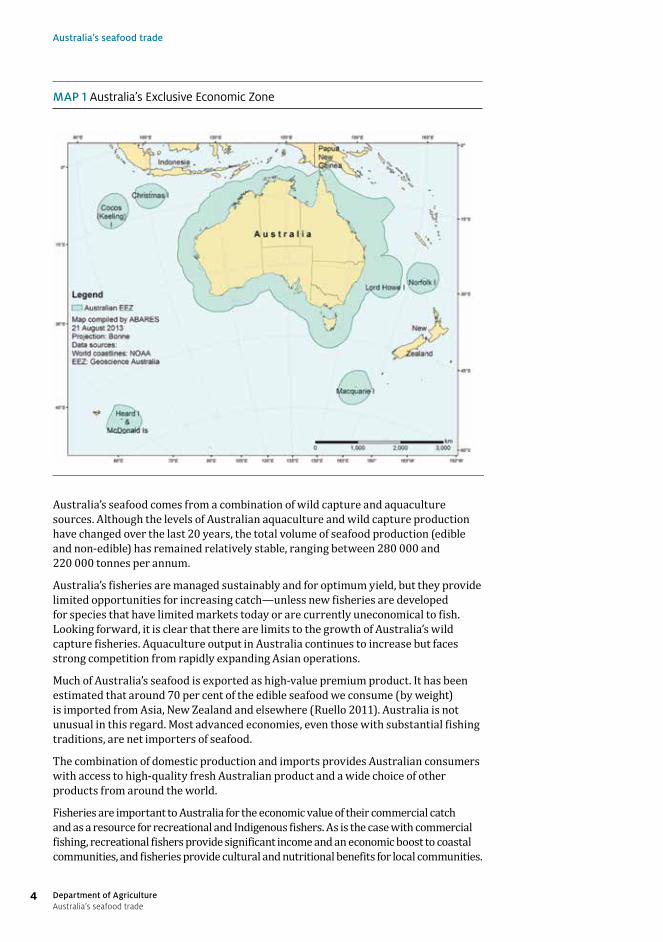
Australia has the world’s third largest Exclusive Economic Zone, which generally extends 200 nautical miles out from the Australian coast. The fisheries resources in these waters are reserved almost exclusively for our fishing fleets. However, our waters are not very productive by world standards. Unlike other countries, the Australian continent does not have large offshore upwellings or sufficient runoff from the landmass to provide nutrients that naturally support larger fish stocks (Hobday et al. 2006).
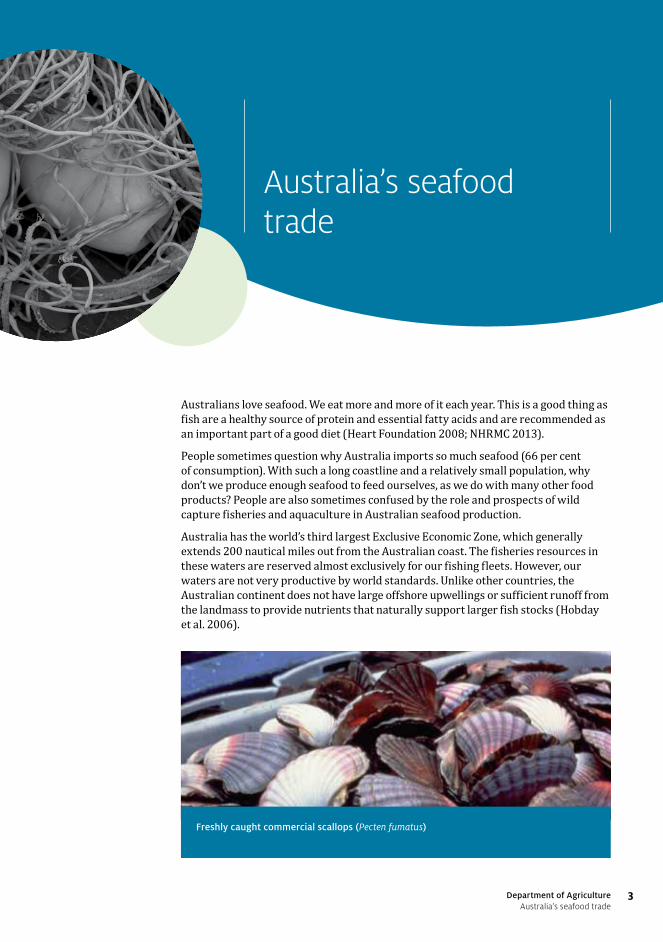
Freshly caught commercial scallops (Pecten fumatus)
Australia’s seafood trade
4 Department of AgricultureAustralia’s seafood trade
MAP 1 Australia’s Exclusive Economic Zone
Australia’s seafood comes from a combination of wild capture and aquaculture sources. Although the levels of Australian aquaculture and wild capture production have changed over the last 20 years, the total volume of seafood production (edible and non-edible) has remained relatively stable, ranging between 280 000 and 220 000 tonnes per annum.
Australia’s fisheries are managed sustainably and for optimum yield, but they provide limited opportunities for increasing catch—unless new fisheries are developed for species that have limited markets today or are currently uneconomical to fish. Looking forward, it is clear that there are limits to the growth of Australia’s wild capture fisheries. Aquaculture output in Australia continues to increase but faces strong competition from rapidly expanding Asian operations.
Much of Australia’s seafood is exported as high-value premium product. It has been estimated that around 70 per cent of the edible seafood we consume (by weight) is imported from Asia, New Zealand and elsewhere (Ruello 2011). Australia is not unusual in this regard. Most advanced economies, even those with substantial fishing traditions, are net importers of seafood.
The combination of domestic production and imports provides Australian consumers with access to high-quality fresh Australian product and a wide choice of other products from around the world.
Fisheries are important to Australia for the economic value of their commercial catch and as a resource for recreational and Indigenous fishers. As is the case with commercial fishing, recreational fishers provide significant income and an economic boost to coastal communities, and fisheries provide cultural and nutritional benefits for local communities.
Australia’s seafood trade
5Department of AgricultureAustralia’s seafood trade
Seafood consumptionSeafood demand in Australia has steadily increased over the last decade. In 2012–13 Australians each consumed an average of 15 kilograms (process weight) of seafood, compared with 13 kilograms in 2000-01 (Stephan and Hobsbawn 2014).
In 2012–13 Australia’s wild fisheries and aquaculture operations produced around 229 000 tonnes of seafood (live weight). Around 38 000 tonnes of this was Australian sardines (pilchards or mulies) used mostly for purposes other than human consumption. In the same year Australia exported around 35 000 tonnes of edible seafood products—ranging from processed products, such as frozen fillets, to whole fish—and imported around 228 000 tonnes of mostly processed seafood products (Stephan and Hobsbawn 2014).
While the majority of fisheries products are used for human consumption, a sizeable proportion are used for other purposes, such as pet food, as well as for fish meal and fish oil for use in livestock and aquaculture feeds (De Silva & Turchini 2008). Fish meal and fish oil are predominantly produced from species with limited appeal for human consumption and, to a much smaller extent, from fish processing waste. Australia’s consumer demand for seafood exceeds the supply from current domestic production, with imports accounting for around 66 per cent of domestic consumption (Stephan and Hobsbawn 2014).
The capacity for growth in Australia’s wild fisheries production is limited by the relatively low natural productivity of our marine waters. Domestic aquaculture may be able to expand to reduce the deficit in the long term. To do this the industry would need to build considerable capability to produce high-tonnage species that meet Australian consumers’ requirements for inexpensive, boneless, skinless white-flesh fillets (Dundas-Smith & Huggan 2006). As in many advanced economies, seafood imports will continue to be necessary to meet domestic demand in Australia in the foreseeable future.
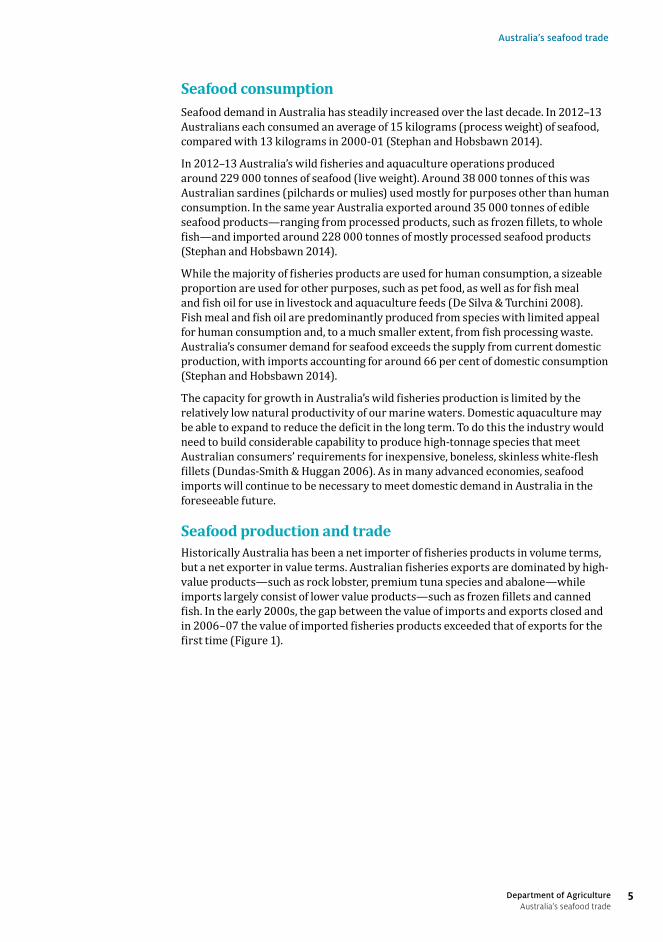
Seafood production and tradeHistorically Australia has been a net importer of fisheries products in volume terms, but a net exporter in value terms. Australian fisheries exports are dominated by high-value products—such as rock lobster, premium tuna species and abalone—while imports largely consist of lower value products—such as frozen fillets and canned fish. In the early 2000s, the gap between the value of imports and exports closed and in 2006–07 the value of imported fisheries products exceeded that of exports for the first time (Figure 1).
Australia’s seafood trade
6 Department of AgricultureAustralia’s seafood trade
FIGURE 1 Real value of Australian seafood imports and exports, 2000–01 to 2012–13
Imports
Exports
$m A$/US$
Exchange rate(right axis)
Source: ABARES
800
1600
2400
3200
0.5
1.0
1.5
2.0
2012–13
2009–10
2006–07
2003–04
2000–01
In developed countries it is common for domestic production to be unable to keep up with demand. The European Union, the United States and Japan are all net importers of seafood products, together taking over half of all global imports (FAO 2014). Seafood consumption per capita is considerably higher in the developed world (FAO 2012b), as are the costs of production. Environmental standards also tend to be higher in the developed world, which can constrain production, particularly from aquaculture.
The difference between Australia and many other developed countries is that a large proportion of Australian product is sold to export markets, rather than being used to supply domestic demand. The value of Australian seafood exports, at around $1.2 billion in real terms, is around 49 per cent of the value of production. These products are generally still available in Australia, but Australian consumers are often unwilling to pay as high a price as export markets for the volumes produced.
As long as Australian products receive a premium price in export markets, producers will continue to sell a large amount of their seafood product overseas. This pattern also occurs in the United Kingdom, which is a net importer of seafood despite being a traditional fishing nation and a major seafood exporter (principally to the rest of Europe).
Australia’s seafood trade
7Department of AgricultureAustralia’s seafood trade
Australian seafood production
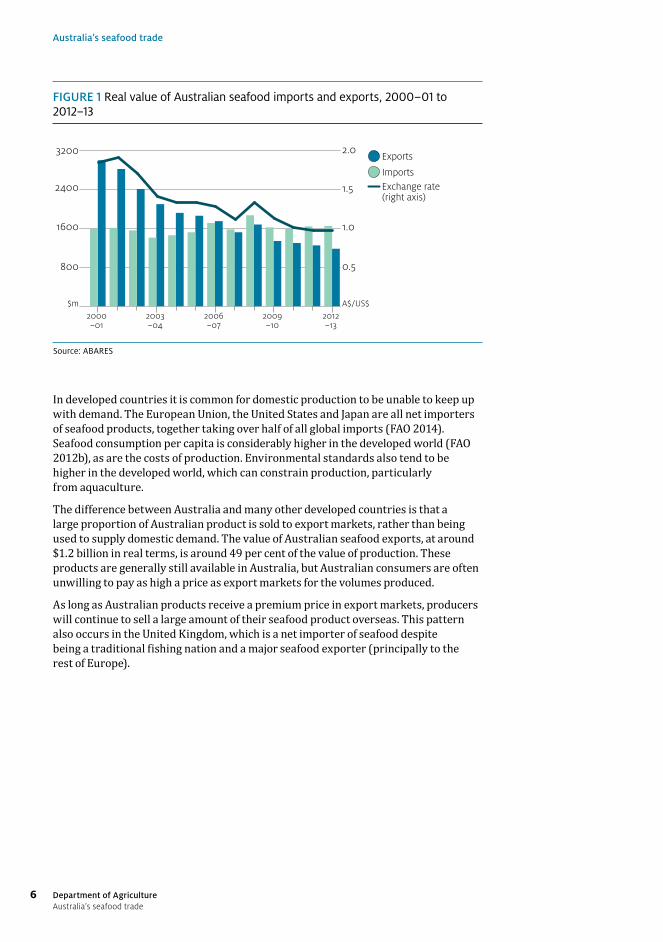
The combined volume of Australian fisheries and aquaculture production has been relatively stable over the past two decades, as lower production volumes from Australia’s wild capture sector have been offset by strong growth in the volume of aquaculture production (Figure 2).
FIGURE 2 Volume of Australian fisheries and aquaculture production, 1992–93 to 2012–13
Aquaculture
Wild-caught
’000tonnes
Source: ABARES
50
100
150
200
250
300
2012–13
2009–10
2006–07
2003–04
2000–01
1997–98
1994–95
However, in recent years total Australian production has declined, from a peak of 279 000 tonnes in 2004-05 to about 229 000 tonnes in 2012–13. There are a number of reasons for this. Total catches in Commonwealth fisheries fell during this time, with production decreasing from around 72 000 tonnes to 39 000 tonnes. This was mostly due to reductions in the Southern and Eastern Scalefish and Shark Fishery and the Small Pelagic Fishery following the introduction in 2006 of measures to improve the economic and biological condition. These measures included a government-funded buy-back of fishing concessions in major fisheries and a reduction in catch levels to allow stocks to rebuild to levels that would maximise economic yield.
Declines have also occurred in some state fisheries. Major reductions in catches occurred in the Western Australian rock lobster fishery (from 12 000 tonnes in 2004-05 to 6000 tonnes in 2012- 13 after a period of low larval settlement) and scallop fisheries (from over 7000 tonnes in 2005 to less than 292 tonnes in 2012–13). In South Australia, the catch of Australian sardines was about 11000 tonnes lower in 2013 than in 2004-05.
Australia’s seafood trade
8 Department of AgricultureAustralia’s seafood trade
Imports and exports
The value of Australian seafood exports has declined from its peak in 2000–01, although this decline may be slowing in recent years (Figure 1).
The main reasons for the decline were falling unit export prices (in Australian dollar terms) for most major export products and a 47 per cent decrease in the volume of edible exports. The decline in prices was the result, in part, of an appreciation in the Australian dollar between 2000-01 and 2012 -13 (Figure 1). While the prices paid in other currencies may remain constant, the value in Australian dollars declines when the Australian dollar appreciates against foreign currencies. The strong appreciation of the Australian dollar also tends to make exports less competitive and reduces the price of imports for domestic consumers.
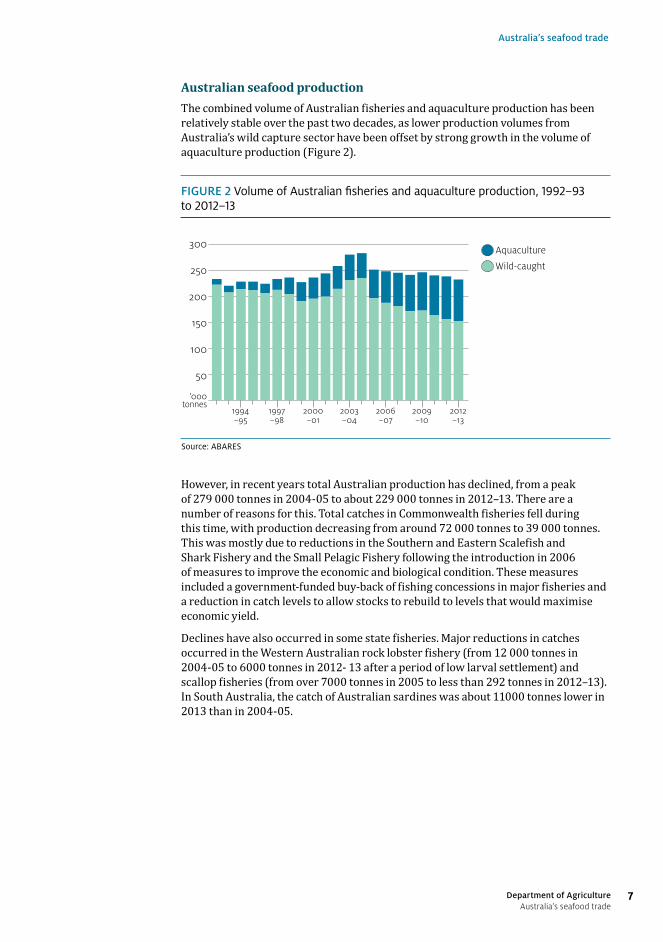
The total volume of edible exports of fisheries products fell from their peak of 66 400 tonnes in 2000–01 to around 35 300 tonnes in 2012–13 (Figure 3). The reasons for this decline include a reduction in total catches for some species groups (such as rock lobster), an appreciation in the Australian dollar (which resulted in a more competitive trading environment for Australian exporters) and increased volumes of competitive Asian aquaculture products on world markets. For example, prawn exports declined from around 12 100 tonnes to around 3 900 tonnes between 2000–01 and 2012–13 following a reduction in sales to Japan, Hong Kong and the United States.
The total value of Australian fisheries imports (edible and non-edible) has been relatively stable overall, staying around $1.5–$1.6 billion per year in real terms since 2000–01 to 2012–13, despite some year-to-year variation (Figure 1). Edible seafood products made up around 87 per cent of the value of fisheries imports in 2012–13, at around $1.4 billion in real terms.
While the value of imports has remained fairly consistent since 2000-01 to 2012–13, the volume of edible seafood has increased by around 59 per cent (Figure 3).
FIGURE 3 Volume of edible seafood imports and exports, 1992–93 to 2012–13
Imports
Exports
’000tonnes A$/US$
Exchange rate(right axis)
Source: ABARES
50
100
150
200
250
1
2
3
4
5
2012–13
2009–10
2006–07
2003–04
2000–01
1997–98
1994–95
Australia’s seafood trade
9Department of AgricultureAustralia’s seafood trade
The appreciation of the Australian dollar against foreign currencies over this time has enabled larger volumes of product to be imported without increasing national expenditure. The success of aquaculture in South East Asia and China is also likely to have contributed to the increase in import tonnages.
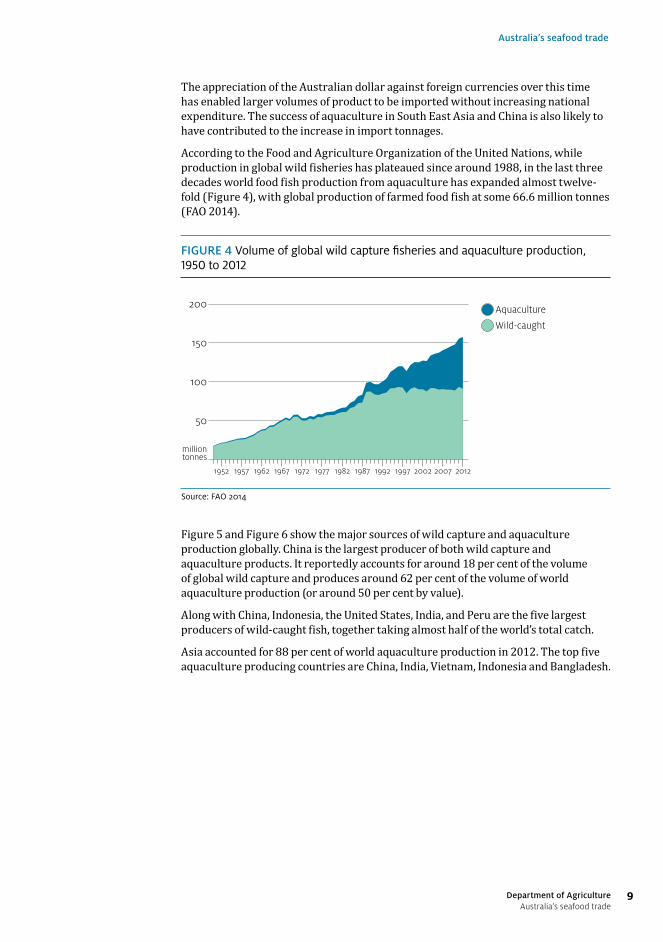
According to the Food and Agriculture Organization of the United Nations, while production in global wild fisheries has plateaued since around 1988, in the last three decades world food fish production from aquaculture has expanded almost twelve-fold (Figure 4), with global production of farmed food fish at some 66.6 million tonnes (FAO 2014).
FIGURE 4 Volume of global wild capture fisheries and aquaculture production, 1950 to 2012
Aquaculture
Wild-caught
milliontonnes
Source: FAO 2014
50
100
150
200
2012200720021997199219871982197719721967196219571952
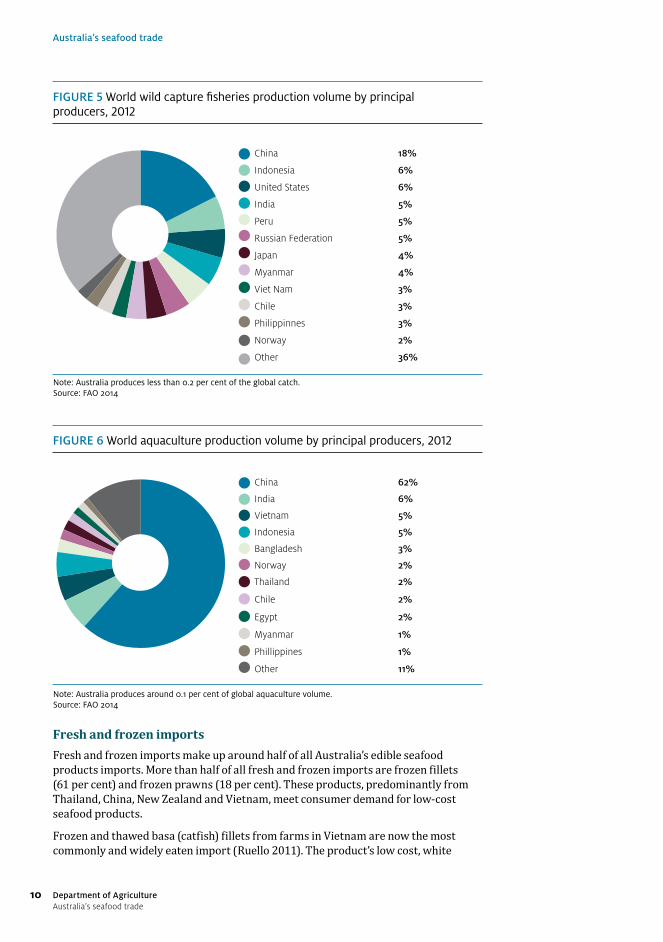
Figure 5 and Figure 6 show the major sources of wild capture and aquaculture production globally. China is the largest producer of both wild capture and aquaculture products. It reportedly accounts for around 18 per cent of the volume of global wild capture and produces around 62 per cent of the volume of world aquaculture production (or around 50 per cent by value).
Along with China, Indonesia, the United States, India, and Peru are the five largest producers of wild-caught fish, together taking almost half of the world’s total catch.
Asia accounted for 88 per cent of world aquaculture production in 2012. The top five aquaculture producing countries are China, India, Vietnam, Indonesia and Bangladesh.
Australia’s seafood trade
10 Department of AgricultureAustralia’s seafood trade
FIGURE 5 World wild capture fisheries production volume by principal producers, 2012
China 18%
Indonesia 6%
India 5%
United States 6%
Peru 5%
Russian Federation 5%
Japan 4%
Myanmar 4%
Note: Australia produces less than 0.2 per cent of the global catch.Source: FAO 2014
Chile 3%
Philippinnes 3%
Viet Nam 3%
Norway 2%
Other 36%
FIGURE 6 World aquaculture production volume by principal producers, 2012
China 62%
India 6%
Vietnam 5%
Indonesia 5%
Bangladesh 3%
Thailand 2%
Norway 2%
Egypt 2%
Chile 2%
Note: Australia produces around 0.1 per cent of global aquaculture volume.Source: FAO 2014
Myanmar 1%
Phillippines 1%
Other 11%
Fresh and frozen imports
Fresh and frozen imports make up around half of all Australia’s edible seafood products imports. More than half of all fresh and frozen imports are frozen fillets (61 per cent) and frozen prawns (18 per cent). These products, predominantly from Thailand, China, New Zealand and Vietnam, meet consumer demand for low-cost seafood products.
Frozen and thawed basa (catfish) fillets from farms in Vietnam are now the most commonly and widely eaten import (Ruello 2011). The product’s low cost, white
Australia’s seafood trade
11Department of AgricultureAustralia’s seafood trade
boneless flesh and neutral flavour make this fish attractive for a large cross section of the Australian community and provides an alternative to other forms of protein such as chicken and beef. Its low cost has also meant it does not compete directly with more expensive, premium domestic white flesh fish (Ruello 2011).
The vast majority of fresh imported whole fish comes from New Zealand, as does a large proportion of frozen fish fillets. While New Zealand’s waters are only around half the size of Australia’s, its fishing grounds are much more productive. The total catch harvested from Australian waters in 2012–13 was around 160 000 tonnes (Stephan and Hobsbawn 2014) compared with 441 000 tonnes from New Zealand in 2012 (FAO 2014). A large proportion of the New Zealand catch is whitefleshed fish species familiar to Australian consumers, such as snapper and blue grenadier (hoki). New Zealand’s history of sustainable fisheries management, its close trade relationship with Australia and proximity also contribute to the attractiveness and availability of products from New Zealand.
Canned fish products
Canned fish consumed in Australia consists mostly of relatively low-value tuna products. No significant canning of tuna has taken place in Australia since May 2010 when the tuna cannery in Port Lincoln closed.
The vast majority of tuna canning in the broader Asia-Pacific region occurs in Thailand, the Philippines and Indonesia. Thailand alone produces around half of the world’s traded canned tuna.
The low production and labour costs for canning in these South East Asian countries make it difficult for Australia to compete against their products. South East Asian canning countries also have geographical advantages over Australia, being close to areas that supply fish, and they often have preferential trade agreements for foreign fleets supplying their canneries.
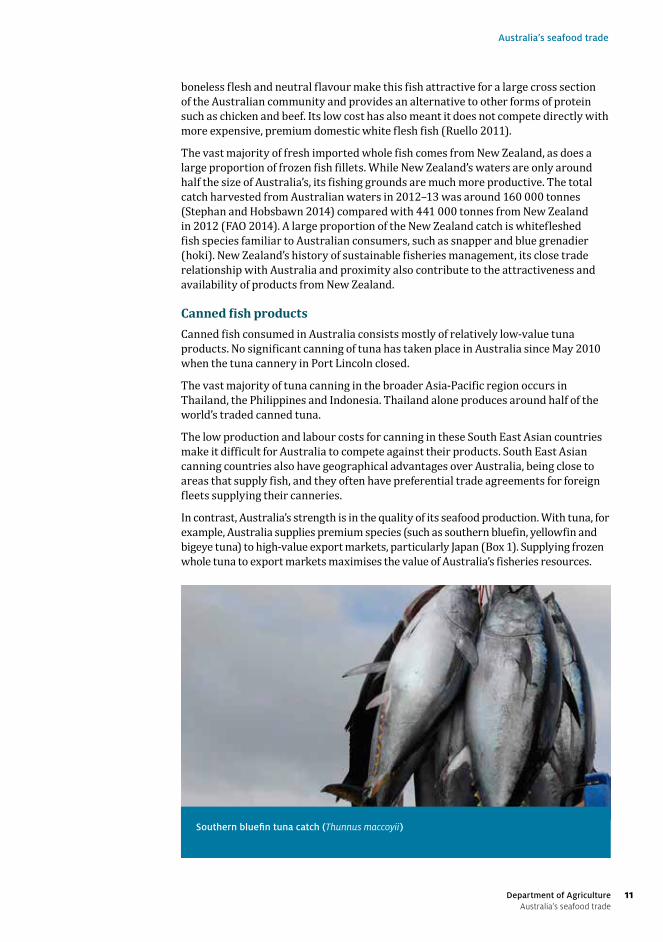
In contrast, Australia’s strength is in the quality of its seafood production. With tuna, for example, Australia supplies premium species (such as southern bluefin, yellowfin and bigeye tuna) to high-value export markets, particularly Japan (Box 1). Supplying frozen whole tuna to export markets maximises the value of Australia’s fisheries resources.
Southern bluefin tuna catch (Thunnus maccoyii)
Australia’s seafood trade
12 Department of AgricultureAustralia’s seafood trade
Box 1 Southern bluefin tuna
Almost all of Australia’s commercial catch of southern bluefin tuna is ranched in aquaculture cages. Ranching involves transferring wild-caught tuna to sea cages where they are fattened up for several months before sale to increase the fish’s size and hence the price received. All ranching of southern bluefin tuna occurs in a small region of the Spencer Gulf off Port Lincoln, South Australia. The ranching industry began in 1991 and has now grown to be one of the most valuable seafood sectors in Australia.
Ranching of southern bluefin tuna began in response to declines in the wild fishery after overfishing by international fleets. The global catch of southern bluefin tuna peaked at over 80 000 tonnes in 1961, while Australia’s catch of this species peaked in 1982 at 21 500 tonnes. Responding to concerns about sustainability, Australia, Japan and New Zealand formed the Commission for the Conservation of Southern Bluefin Tuna (CCSBT) in 1994, to limit and manage the total allowable catch. Membership of the Commission has since grown to include Indonesia and the Republic of Korea, while the Fishing Entity of Taiwan is a member of the Extended Commission for the Conservation of Southern Bluefin Tuna. The Philippines, South Africa and the European Union are cooperating non-members.
The Australian share of the global total allowable catch was 5265 tonnes from 1990 to 2009, 4015 tonnes in 2010 and 2011, 4528 tonnes in 2012, 4663 tonnes in 2013 and 5151 tonnes in the 2014 fishing season (AFMA 2014). The CCSBT determines the total allowable catch for the fishery using a formal rebuilding strategy (also known as a management procedure) that relies on regularly updated fishery-dependent and fishery-independent information.
Australian–caught southern bluefin tuna was once mostly canned, but this is no longer the case. Most product is now sold as frozen whole fish, gilled and gutted for high-value uses—particularly sashimi.
The tuna are now mainly caught between December and March when they are present along the continental shelf in the Great Australian Bight. They are caught in ‘purse-seine’ nets (nets that are set around schools of fish and then closed to prevent fish escaping). The tuna are transferred from the purse-seine nets to tow pontoons through underwater panels. These pontoons are then towed back at very slow speeds (around two kilometres an hour) to the farm areas adjacent to Port Lincoln. The process can take several weeks.
On arrival at the farm sites, the tuna are transferred into sea cages. They are generally fed twice a day, six days a week. The fish are fed a combination of high-fat sardines, anchovies, mackerel, redbait and squid. This feed comes from both domestic and international sources. The tuna are fattened in the sea cages for around three to five months.
In the winter months, when they have reached their optimal size and condition, the tuna are harvested. Australian farmed tuna is sold almost exclusively to the Japanese market. Some growers are beginning to look further afield to other markets such as the United States.
Australia’s seafood trade
13Department of AgricultureAustralia’s seafood trade
Sustainable seafood productionWhile Australia has the third largest fishing zone in the world, covering an area larger than the Australian mainland, Australian fisheries do not harvest as much fish as some other countries. In many cases other countries have more productive fishing grounds which enable larger volumes to be harvested. Some overseas producers also have lower environmental standards compared to Australia which allows for higher yields, at least in the short term. However, if fishing is not done in a sustainable way ecosystems can become degraded, catch compositions can change, catches of many stocks will eventually decline, species can become threatened and the benefits derived from fishing can decrease.
Increasing production in Australian wild capture fisheries is limited by strict management arrangements put in place to maintain fish stocks at sustainable levels. Production volumes in wild-capture fisheries have remained steady over the last five years and production is not predicted to increase considerably, although there is some scope for growth in some fisheries if the costs of fishing fall or fish prices increase.
Australian aquaculture production is expanding in volume terms. This expansion is mostly driven by a significant increase in salmon production. As with wild capture fisheries, Australia’s strength in aquaculture is in producing high-quality seafood products such as southern bluefin tuna, salmon and edible oysters.
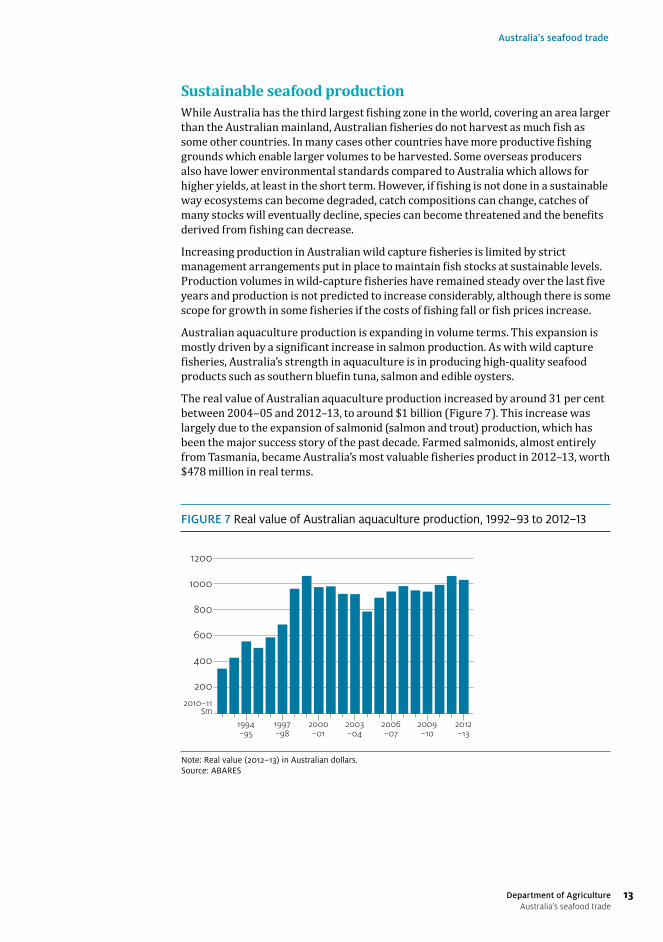
The real value of Australian aquaculture production increased by around 31 per cent between 2004–05 and 2012–13, to around $1 billion (Figure 7). This increase was largely due to the expansion of salmonid (salmon and trout) production, which has been the major success story of the past decade. Farmed salmonids, almost entirely from Tasmania, became Australia’s most valuable fisheries product in 2012–13, worth $478 million in real terms.
FIGURE 7 Real value of Australian aquaculture production, 1992–93 to 2012–13
2010–11$m
Note: Real value (2012–13) in Australian dollars.Source: ABARES
200
400
600
800
1000
1200
2012–13
2009–10
2006–07
2003–04
2000–01
1997–98
1994–95
Australia’s seafood trade
14 Department of AgricultureAustralia’s seafood trade
In Australia, aquaculture operators—particularly those that operate in, or discharge into, public waters—are required to comply with stringent environmental controls monitored on an ongoing basis by state agencies. Strict food health standards also apply to both aquaculture and wild capture products. These environmental and food safety standards ensure fish grown in Australian waters are safe to eat and seafood production does not unduly affect aquatic environments.
The Australian Government also applies strict food safety requirements for imported seafood (Box 2).
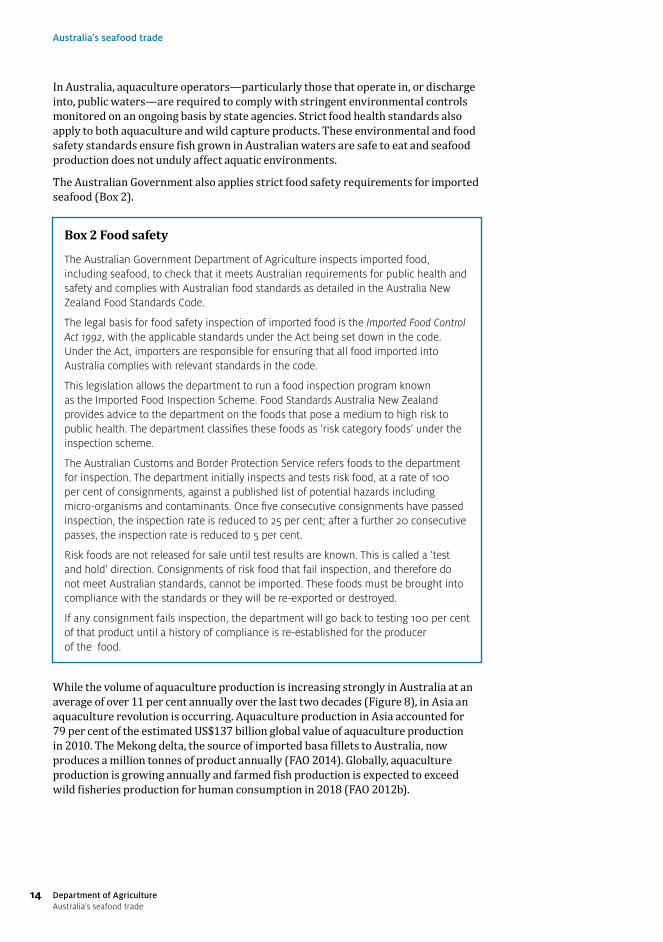
While the volume of aquaculture production is increasing strongly in Australia at an average of over 11 per cent annually over the last two decades (Figure 8), in Asia an aquaculture revolution is occurring. Aquaculture production in Asia accounted for 79 per cent of the estimated US$137 billion global value of aquaculture production in 2010. The Mekong delta, the source of imported basa fillets to Australia, now produces a million tonnes of product annually (FAO 2014). Globally, aquaculture production is growing annually and farmed fish production is expected to exceed wild fisheries production for human consumption in 2018 (FAO 2012b).
Box 2 Food safety
The Australian Government Department of Agriculture inspects imported food, including seafood, to check that it meets Australian requirements for public health and safety and complies with Australian food standards as detailed in the Australia New Zealand Food Standards Code.
The legal basis for food safety inspection of imported food is the Imported Food Control Act 1992, with the applicable standards under the Act being set down in the code. Under the Act, importers are responsible for ensuring that all food imported into Australia complies with relevant standards in the code.
This legislation allows the department to run a food inspection program known as the Imported Food Inspection Scheme. Food Standards Australia New Zealand provides advice to the department on the foods that pose a medium to high risk to public health. The department classifies these foods as ‘risk category foods’ under the inspection scheme.
The Australian Customs and Border Protection Service refers foods to the department for inspection. The department initially inspects and tests risk food, at a rate of 100 per cent of consignments, against a published list of potential hazards including micro-organisms and contaminants. Once five consecutive consignments have passed inspection, the inspection rate is reduced to 25 per cent; after a further 20 consecutive passes, the inspection rate is reduced to 5 per cent.
Risk foods are not released for sale until test results are known. This is called a ‘test and hold’ direction. Consignments of risk food that fail inspection, and therefore do not meet Australian standards, cannot be imported. These foods must be brought into compliance with the standards or they will be re-exported or destroyed.
If any consignment fails inspection, the department will go back to testing 100 per cent of that product until a history of compliance is re-established for the producer of the food.
Australia’s seafood trade
15Department of AgricultureAustralia’s seafood trade
FIGURE 8 Volume of Australian aquaculture production, 1992–93 to 2012–13
’000tonnes
Source: ABARES
20
40
60
80
100
2012–13
2009–10
2006–07
2003–04
2000–01
1997–98
1994–95
Unsustainable aquaculture practices can degrade marine and freshwater environments. In many countries where aquaculture production has rapidly expanded, the environmental impacts of aquaculture have not always been managed to a standard equivalent to that required in Australia (Beveridge et al. 1997; Hishamunda et al. 2009; Lenfest 2010; Primavera 1997, 2005).
Fishing vessel
Australia’s seafood trade
16 Department of AgricultureAustralia’s seafood trade
Seafood certification and labellingAustralian consumers prefer domestic seafood and are often prepared to pay a little more for Australian products (Calogeras et al. 2011; PIRSA 2011). Legislation requires all seafood sold in Australian retail outlets, both packaged and unpackaged, to be labelled with the country of origin. This means that Australian consumers can tell the difference between domestic and imported seafood products and make informed purchases.
Retailers are increasingly looking to independent third-party certification schemes to demonstrate that seafood comes from sustainable sources. By purchasing seafood products from sustainable fisheries, retailers show they are committed to community values. While a range of schemes are available, arguably the most widely used and recognised is the Marine Stewardship Council scheme.
Certification lets retailers and consumers identify sustainable fishing practices in both foreign and domestic fisheries. For example, the South African hake fishery and the New Zealand hoki fishery, which provided $9.1 million and $6.3 million in imports respectively in 2010–11, have been certified by the Marine Stewardship Council.
Australian fisheries independently certified by the Marine Stewardship Council include the Commonwealth-managed Northern Prawn Fishery, Macquarie Island Toothfish Fishery and mackerel icefish and toothfish from the Heard Island and McDonald Islands Fishery. A number of state-managed fisheries are also Marine Stewardship Council certified: the Western Rock Lobster Fishery, the South Australian Lakes and Coorong Fishery and the Spencer Gulf Prawn Fishery. These fisheries sought certification, in part, to differentiate their products from those from other fisheries.
The Australian Government supports the fishing industry, retailers and the Australian community by providing independent evaluation of major fish stocks. The Status of key Australian fish stocks reports 2014 undertook 238 stock assessments, covering 68 key species or species complexes. The species included represent around 85 per cent of the annual catch and 90 per cent of the value of Australian wild-capture fisheries in 2012–13. The report provides a comprehensive independent evaluation of the biological status of major Australian fisheries stocks. It is produced by the Australian Bureau of Agricultural and Resource Economics and Sciences in collaboration with state and Northern Territory government fishery research agencies. The report was able to classify 170 of the stocks assessed, with insufficient data for the remaining 68. The report classified only eleven of the 170 classified stocks as overfished. Only 4.9 per cent of Australia’s seafood catch is estimated to come from overfished stocks.
Fresh seafood for sale
Australia’s seafood trade
17Department of AgricultureAustralia’s seafood trade
Illegal, unregulated and unreported fishingAustralia is party to a range of conventions that establish global, regional and subregional management organisations that manage highly migratory, straddling, pelagic and demersal fish stocks. These instruments include the Convention on the Conservation of Southern Bluefin Tuna, which establishes the Commission for the Conservation of Southern Bluefin Tuna, the Agreement for the Establishment of the Indian Ocean Tuna Commission, which establishes the Indian Ocean Tuna Commission, and the Convention for the Conservation of Antarctic Marine Living Resources, which establishes the Commission for the Conservation of Antarctic Marine Living Resources. Australia plays an active role in these organisations. Australia has also signed the Convention on the Conservation and Management of Highly Migratory Fish Stocks in the Western and Central Pacific.
Many of these organisations are now focusing on the problem of Illegal, Unreported and Unregulated (IUU) fishing as a major threat to the effective management and conservation of regional fish stocks and are consequently seeking to identify vessels engaged in IUU fishing within respective areas of competence in order to effectively combat and eliminate these operations.
Australia continues to seek the strengthening of existing fisheries management and conservation arrangements, to pursue the development and adoption of new measures (where appropriate) to combat IUU fishing and urge other countries not to support IUU fishing operations, and to fully implement key international instruments to ensure that their vessels do not act in contravention of their international obligations.
Marine reserves Commonwealth marine protected areas have been created adjacent to the Australian coast to protect representative samples of marine ecosystems and to protect marine biodiversity – they also provide for sustainable use. Protection of listed species is provided for under the Environment Protection and Biodiversity Conservation Act 1999 and the Fisheries Management Act 1991. While marine reserves may incidentally contribute to reducing pressure on commercial stocks, the responsibility for managing stock sustainability and the impacts of fishing on listed species rests with the regulator, the Australian Fisheries Management Authority.
The Commonwealth marine protected areas are part of the Commonwealth component of the National Representative System of Marine Protected Areas. There are now 60 marine reserves, including the Great Barrier Reef Marine Park, in Commonwealth waters (generally waters more than three nautical miles off the Australian coast). The Commonwealth marine reserve estate covers some 3.1 million square kilometres.
Australia’s seafood trade
18 Department of AgricultureAustralia’s seafood trade
ReferencesAFMA 2014, Southern Bluefin Tuna Fishery, Australian Fisheries and Management Authority 2014, available at http://www.afma.gov.au/managing-our-fisheries/fisheries-a-to-z-index/southern-bluefin-tuna/
Beveridge, MCM, Phillips, MJ & Macintosh, DJ 1997, ‘Aquaculture and the environment: the supply of and demand for environmental goods and services by Asian aquaculture and the implications for sustainability’, Aquaculture Research, vol. 28, issue 10, pp. 797–807.
Calogeras, C, Morgan, S, Sarneckis, K, Cooper, L & Lee, TY 2011, Tracking the impacts on seafood consumption at dining venues arising from the Northern Territory’s seafood labelling laws: final report, FRDC project no. 2009/216, Northern Territory Seafood Council and Fisheries Research and Development Corporation, Canberra.
De Silva, SS & Turchini, GM 2008, ‘Towards understanding the impacts of the pet food industry on world fish and seafood supplies’, Journal of Agricultural and Environmental Ethics, vol. 21, issue 5, pp. 459–67.
Dundas-Smith, P & Huggan C 2006, An overview of the Australian seafood industry: a quick reference guide to the essential characteristics of an unusually complex industry and its business environment, China Council for the Promotion of International Trade, Shanghai, available at aaa.ccpit.org/Category7/mAttachment/2006/Dec/13/asset000070002007202file1.pdf (pdf 333kb).
FAO 2013, FAOSTAT, Food and Agriculture Organization of the United Nations, Rome, available at faostat3.fao.org/home/index.html#DOWNLOAD.
—— 2014, Fishery and aquaculture statistics 2012, Food and Agriculture Organization of the United Nations, Rome, available at fao.org/docrep/015/ba0058t/ba0058t00.htm.
—— 2012a, Fishery and aquaculture statistics 2010, Food and Agriculture Organization of the United Nations, Rome, available at fao.org/docrep/015/ba0058t/ba0058t00.htm.
—— 2012b, The state of world fisheries and aquaculture 2012, Food and Agriculture Organization of the United Nations, Rome, available at fao.org/docrep/016/i2727e/i2727e00.htm.
Hishamunda, N, Ridler, NB, Bueno, P & Yap, WG 2009, ‘Commercial aquaculture in Southeast Asia: some policy lessons’, Food Policy, vol. 34, issue 1, pp. 102–7, available at sciencedirect.com/science/article/pii/S0306919208000584.
Hobday, AJ, Okey, TA, Poloczanska, ES, Kunz, TJ & Richardson, AJ 2006, Impacts of climate change on Australian marine life—Part A: Executive summary, report to the Australian Greenhouse Office, CSIRO, Hobart, available at cmar.csiro.au/climateimpacts/documents/Impacts-of-Climate-Change-on-Australian-Marine-Life-PartA.pdf (pdf 2mb).
Larcombe, J & Marton, N 2012, Final Commonwealth marine reserves network proposal: ABARES social and economic assessment, Australian Bureau of Agricultural and Resource Economics and Sciences, Canberra, August, available at data.daff.gov.au/anrdl/metadata_files/pe_cmrnpd9aame001SaEI20120926_11a.xml.
Australia’s seafood trade
19Department of AgricultureAustralia’s seafood trade
Lenfest 2010, New tool for assessing the environmental performance of marine aquaculture—GAPI: Global Aquaculture Performance Index, Lenfest Ocean Program Research Series, October, Lenfest Ocean Program, Washington DC, available at lenfestocean.org/publication/gapiglobabal-aquaculture-performanance-index.
Heart Foundation 2008, Position statement—Fish, fish oils, n-3 polyunsaturated fatty acids and cardiovascular health, National Heart Foundation of Australia, Canberra, available at www.heartfoundation.org.au/SiteCollectionDocuments/Fish-position-statement.pdf (pdf 241kb).
NHMRC 2013, Australian Dietary Guidelines summary, National Health and Medical Research Council, Canberra, available at nhmrc.gov.au/_files_nhmrc/publications/attachments/n55a_australian_dietary_guidelines_summary_130530.pdf (pdf 2.82mb).
PIRSA 2011, South Australian seafood market overview 2012, Primary Industries and Regions SA, Government of South Australia, Adelaide, available at pir.sa.gov.au/food/food_markets_and_consumers/market_intelligence/market_summary_sa_seafood_2012.
Primavera, JH 2005, ‘Mangroves, fishponds, and the quest for sustainability’, Science, vol. 310, no. 5745, pp. 57–9, available at sciencemag.org/content/310/5745/57.1.full.
—— 1997, ‘Socio-economic impacts of shrimp culture’, Aquaculture Research, vol. 28, issue 10, pp. 815–27, available at repository.seafdec.org.ph/handle/10862/1597.
Ruello, NV 2011, A study of the composition, value and utilisation of imported seafood in Australia: project final report, Ruello & Associates Pty Ltd for the Fisheries Research and Development Corporation, Canberra.
Stephan, M, & Hobsbawn,P 2014, Australian fisheries and aquaculture statistics 2013, Australian Bureau of Agricultural and Resource Economics and Sciences, Canberra, available at www.agriculture.gov.au/abares/display?url=http://143.188.17.20/anrdl/DAFFService/display.php?fid=pb_afastats13d9abmd20141121_11a.xml.

The ‘Biosphere’ Graphic ElementThe biosphere is a key part of the department’s visual identity. Individual biospheres are used to visually describe the diverse nature of the work we do as a department, in Australia and internationally.
DA
1827
_011
5
Department of Agriculture
Postal address GPO Box 858 Canberra ACT 2601
Switchboard +61 2 6272 3933
agriculture.gov.au