ALPHA Fund Background Australia Global Benchmark Report 2010 Australian Trade Commission
AustralianTrade CommissionAnnual Report 2011–12
Agency statement
The Australian Trade Commission (Austrade) is
the Australian Government’s trade, investment
and international education promotion agency.
Austrade assists Australian enterprises to increase
international business, attracts productive
foreign direct investment into Australia and
promotes Australia’s education and training
sector internationally. Austrade also has consular
management responsibilities in a number of
international locations and provides consular and
passport services, travel advice, contingency
planning and crisis response in those areas.
Ministerial responsibility
The Hon Dr Craig Emerson MP held the
position of Minister for Trade for the duration
of the reporting period. In March 2012,
Dr Emerson’s responsibilities were expanded
and he became the Minister for Trade and
Competitiveness. For consistency, Dr Emerson
is referred to as the Minister for Trade and
Competitiveness throughout this report.
The Hon Justine Elliot MP held the position
of Parliamentary Secretary for Trade for
the duration of the reporting period.
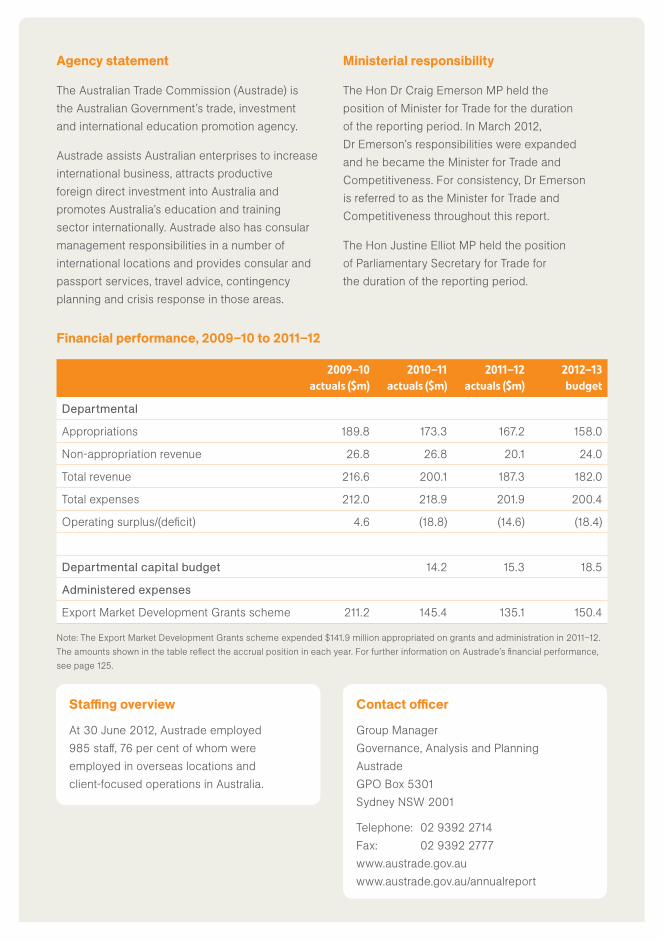
Staffi ng overview
At 30 June 2012, Austrade employed
985 staff , 76 per cent of whom were
employed in overseas locations and
client-focused operations in Australia.
Contact offi cer
Group Manager
Governance, Analysis and Planning
Austrade
GPO Box 5301
Sydney NSW 2001
Telephone: 02 9392 2714
Fax: 02 9392 2777
www.austrade.gov.au
www.austrade.gov.au/annualreport
Financial performance, 2009–10 to 2011–12
2009–10
actuals ($m)
2010–11
actuals ($m)
2011–12
actuals ($m)
2012–13
budget
Departmental
Appropriations 189.8 173.3 167.2 158.0
Non-appropriation revenue 26.8 26.8 20.1 24.0
Total revenue 216.6 200.1 187.3 182.0
Total expenses 212.0 218.9 201.9 200.4
Operating surplus/(defi cit) 4.6 (18.8) (14.6) (18.4)
Departmental capital budget 14.2 15.3 18.5
Administered expenses
Export Market Development Grants scheme 211.2 145.4 135.1 150.4
Note: The Export Market Development Grants scheme expended $141.9 million appropriated on grants and administration in 2011–12.
The amounts shown in the table refl ect the accrual position in each year. For further information on Austrade’s fi nancial performance,
see page 125.
Australian Trade Commission Annual Report 2011–12 > i
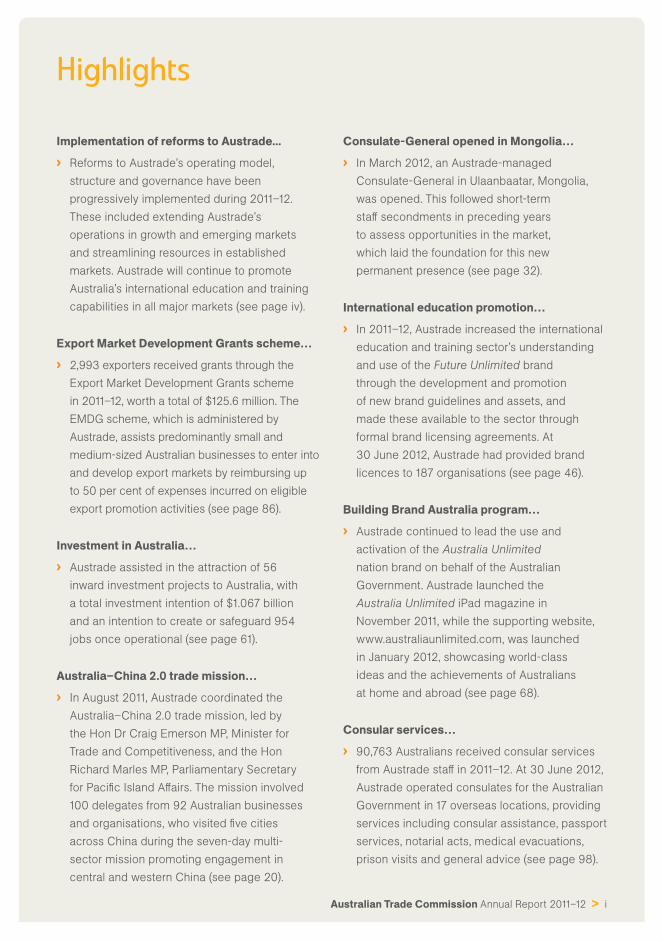
Implementation of reforms to Austrade...
› Reforms to Austrade’s operating model,
structure and governance have been
progressively implemented during 2011–12.
These included extending Austrade’s
operations in growth and emerging markets
and streamlining resources in established
markets. Austrade will continue to promote
Australia’s international education and training
capabilities in all major markets (see page iv).
Export Market Development Grants scheme…
› 2,993 exporters received grants through the
Export Market Development Grants scheme
in 2011–12, worth a total of $125.6 million. The
EMDG scheme, which is administered by
Austrade, assists predominantly small and
medium-sized Australian businesses to enter into
and develop export markets by reimbursing up
to 50 per cent of expenses incurred on eligible
export promotion activities (see page 86).
Investment in Australia…
› Austrade assisted in the attraction of 56
inward investment projects to Australia, with
a total investment intention of $1.067 billion
and an intention to create or safeguard 954
jobs once operational (see page 61).
Australia–China 2.0 trade mission…
› In August 2011, Austrade coordinated the
Australia–China 2.0 trade mission, led by
the Hon Dr Craig Emerson MP, Minister for
Trade and Competitiveness, and the Hon
Richard Marles MP, Parliamentary Secretary
for Pacifi c Island Aff airs. The mission involved
100 delegates from 92 Australian businesses
and organisations, who visited fi ve cities
across China during the seven-day multi-
sector mission promoting engagement in
central and western China (see page 20).
Consulate-General opened in Mongolia…
› In March 2012, an Austrade-managed
Consulate-General in Ulaanbaatar, Mongolia,
was opened. This followed short-term
staff secondments in preceding years
to assess opportunities in the market,
which laid the foundation for this new
permanent presence (see page 32).
International education promotion…
› In 2011–12, Austrade increased the international
education and training sector’s understanding
and use of the Future Unlimited brand
through the development and promotion
of new brand guidelines and assets, and
made these available to the sector through
formal brand licensing agreements. At
30 June 2012, Austrade had provided brand
licences to 187 organisations (see page 46).
Building Brand Australia program…
› Austrade continued to lead the use and
activation of the Australia Unlimited
nation brand on behalf of the Australian
Government. Austrade launched the
Australia Unlimited iPad magazine in
November 2011, while the supporting website,
www.australiaunlimited.com, was launched
in January 2012, showcasing world-class
ideas and the achievements of Australians
at home and abroad (see page 68).
Consular services…
› 90,763 Australians received consular services
from Austrade staff in 2011–12. At 30 June 2012,
Austrade operated consulates for the Australian
Government in 17 overseas locations, providing
services including consular assistance, passport
services, notarial acts, medical evacuations,
prison visits and general advice (see page 98).
Highlights
ii > Australian Trade Commission Annual Report 2011–12
Letter of transmittal
Chief Executive Offi cer
3 September 2012
The Hon Dr Craig Emerson MP
Minister for Trade and Competitiveness
Parliament House
Canberra ACT 2600
Dear Minister
I am pleased to present to you the Australian Trade Commission’s Annual Report for the fi nancial
year 2011–12.
This report has been prepared in accordance with section 92 of the Australian Trade Commission Act 1985.
Subsection 92(1) of the Act requires the Chief Executive Offi cer to, as soon as practicable after 30 June
in each fi nancial year, prepare and give to the Minister a report on the Commission’s operations during
that fi nancial year.
In presenting this report, I would like to acknowledge the contribution made by my colleagues in Austrade.
Yours sincerely
Peter Grey
Chief Executive Offi cer
Australian Trade Commission (Austrade)
Level 23, Aon Tower, 201 Kent Street, Sydney NSW 2000
GPO Box 5301, Sydney NSW 2001 Australia
Telephone: 61 2 9392 2102 | Facsimile: 61 2 9392 2777 | www.austrade.gov.au
ABN 11 764 698 227
Peter Grey
Contents
Highlights i
Letter of transmittal ii
Reform of Austrade — delivering greater value iv
Part OneAgency overview 1
Chief Executive Offi cer’s report 2
Organisational structure 5
About Austrade 6
Austrade’s network 8
Performance framework 10
Part TwoPerformance reporting 11
Outcome 1Program 1.1: Trade and investment development 12Delivering opportunities to Australian
businesses 13
Delivering services to individual
enterprises 39
Marketing Australian education
internationally 46
Delivering targeted trade and
investment strategies 54
Attracting productive foreign direct
investment to Australia 61
Promoting Australia internationally
and raising awareness of the
benefi ts of trade and investment 68
Contributing to the whole-of-
government policy agenda and
collaborating with key stakeholders 76
Contributions to the policy agenda 77
Program 1.2: Trade development schemes — Export Market Development Grants 85Administering the Export Market
Development Grants scheme 86
Outcome 2Program 2.1: Consular and passport services 97Delivering consular and passport services 98
Part ThreeManagement and accountability 101
Accountability and management
of resources 102
Corporate governance 102
Risk management 109
Legislative framework and
external scrutiny 110
Management of human resources 111
Financial management and
business assurance 118
Managing knowledge and information 122
Part FourFinancial statements 125
Financial performance 126
Independent auditor’s report 127
Certifi cation of fi nancial statements 131
Financial statements 132
Part FiveAppendixes 199A: Staffi ng overview 200
B: Austrade locations in Australia
(including TradeStart) 206
C: Client Service Charter 209
D: Work health and safety 211
E: Consultancies 214
F: Financial and staffi ng resources 215
G: Ecologically sustainable development
and environmental performance 217
H: Advertising and market research 220
I: List of requirements 223
Abbreviations and acronyms 227
Index 229
Auditors 237
iv > Australian Trade Commission Annual Report 2011–12
Reform of Austrade — delivering greater value
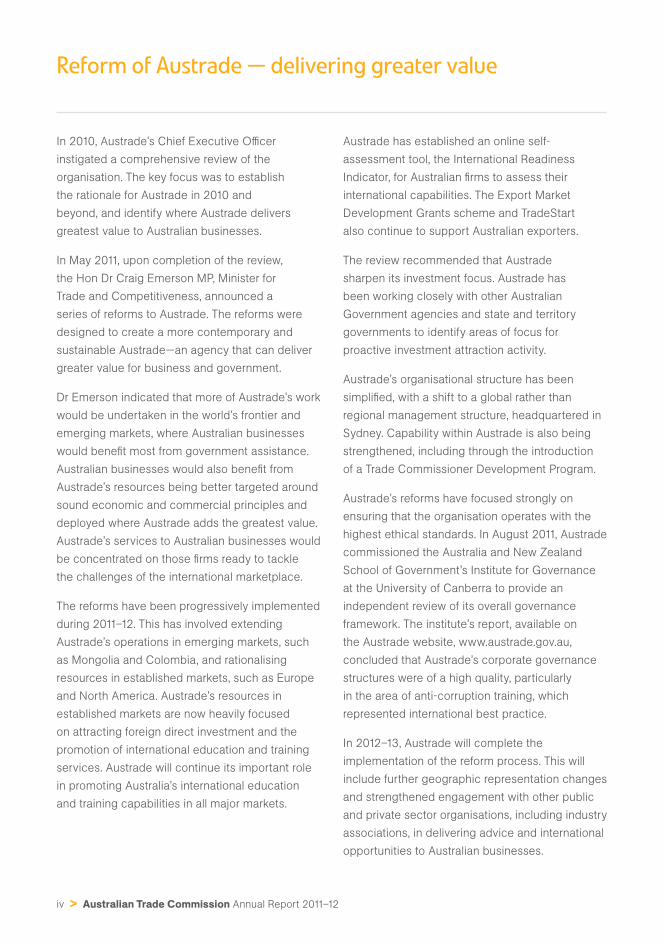
In 2010, Austrade’s Chief Executive Offi cer
instigated a comprehensive review of the
organisation. The key focus was to establish
the rationale for Austrade in 2010 and
beyond, and identify where Austrade delivers
greatest value to Australian businesses.
In May 2011, upon completion of the review,
the Hon Dr Craig Emerson MP, Minister for
Trade and Competitiveness, announced a
series of reforms to Austrade. The reforms were
designed to create a more contemporary and
sustainable Austrade—an agency that can deliver
greater value for business and government.
Dr Emerson indicated that more of Austrade’s work
would be undertaken in the world’s frontier and
emerging markets, where Australian businesses
would benefi t most from government assistance.
Australian businesses would also benefi t from
Austrade’s resources being better targeted around
sound economic and commercial principles and
deployed where Austrade adds the greatest value.
Austrade’s services to Australian businesses would
be concentrated on those fi rms ready to tackle
the challenges of the international marketplace.
The reforms have been progressively implemented
during 2011–12. This has involved extending
Austrade’s operations in emerging markets, such
as Mongolia and Colombia, and rationalising
resources in established markets, such as Europe
and North America. Austrade’s resources in
established markets are now heavily focused
on attracting foreign direct investment and the
promotion of international education and training
services. Austrade will continue its important role
in promoting Australia’s international education
and training capabilities in all major markets.
Austrade has established an online self-
assessment tool, the International Readiness
Indicator, for Australian fi rms to assess their
international capabilities. The Export Market
Development Grants scheme and TradeStart
also continue to support Australian exporters.
The review recommended that Austrade
sharpen its investment focus. Austrade has
been working closely with other Australian
Government agencies and state and territory
governments to identify areas of focus for
proactive investment attraction activity.
Austrade’s organisational structure has been
simplifi ed, with a shift to a global rather than
regional management structure, headquartered in
Sydney. Capability within Austrade is also being
strengthened, including through the introduction
of a Trade Commissioner Development Program.
Austrade’s reforms have focused strongly on
ensuring that the organisation operates with the
highest ethical standards. In August 2011, Austrade
commissioned the Australia and New Zealand
School of Government’s Institute for Governance
at the University of Canberra to provide an
independent review of its overall governance
framework. The institute’s report, available on
the Austrade website, www.austrade.gov.au,
concluded that Austrade’s corporate governance
structures were of a high quality, particularly
in the area of anti-corruption training, which
represented international best practice.
In 2012–13, Austrade will complete the
implementation of the reform process. This will
include further geographic representation changes
and strengthened engagement with other public
and private sector organisations, including industry
associations, in delivering advice and international
opportunities to Australian businesses.
PART ONEAgency overview
› Chief Executive Offi cer’s report 2
› Organisational structure 5
› About Austrade 6
› Austrade’s network 8
› Performance framework 10
2 > Australian Trade Commission Annual Report 2011–12
Chief Executive Offi cer’s report
The year in review
I am pleased to present the Australian Trade
Commission (Austrade) Annual Report for 2011–12.
During the past year, Austrade has undertaken
a coordinated program of change in
response to the outcomes of a review of
the organisation completed in 2011.
As I indicated in my report last year, the review
revealed that Austrade provides the most value to
business through the commercial connections and
insights of its overseas network, where language
and business culture can be a barrier; where there
is less openness of regulatory frameworks and
transparency of business processes; where there
are diffi culties accessing distribution channels
and commercial connections; and where the
value of the ‘badge of government’ is highest.
The reforms undertaken in 2011–12 have
fundamentally reshaped Austrade’s strategy,
priorities and structure. These reforms have
encompassed Austrade’s service delivery
and initiatives to strengthen its governance
framework. The majority of the changes required
have been progressively implemented during
the last year, with completion of the reform
process due in 2012–13. The reforms have been
undertaken within Austrade’s existing budget,
and within the context of Austrade’s contribution
to whole-of-government savings requirements.
A stronger focus on delivering commercial opportunities
Implementation of the new operating
model commenced on 1 July 2011, with
the realigned organisational management
structure in place on 1 October 2011.
Austrade’s network of 90 offi ces across
50 countries is now weighted towards growth and
emerging markets that have high growth potential.
During 2011–12, the Government extended
Austrade’s emerging market presence to include
an Austrade-managed consulate in Mongolia.
Austrade has also prepared for further extension of
its representation in growth and emerging markets
in 2012–13. This will include an Austrade-managed
consulate to be opened in Colombia, and further
strengthening of representation in Africa and
Latin America through placement of a Trade
Commissioner in Accra, Ghana, and an additional
Trade Commissioner in Sao Paulo, Brazil.
Austrade’s activities in growth and emerging
markets have a strong focus on trade
development, as well as on the marketing
of Australia’s international education and
training services. In line with the fi ndings of the
review, Austrade’s off shore offi ces now have a
stronger emphasis on identifying and delivering
international commercial opportunities to
Australian businesses. In established markets,
such as North America and Europe, Austrade’s
activity is now predominantly focused on
opportunities for inward investment and
international education and training services,
delivered through a smaller number of locations.
Australian Trade Commission Annual Report 2011–12 > 3
1AG
ENC
Y OVERVIEW
C
hie
f Executiv
e O
ffi cer’s
rep
ort
During 2011–12, Austrade continued to support the
marketing of Australia’s international education
and training sector. This work included the
development of the new Future Unlimited brand
in conjunction with the sector. Austrade also
continued to lead the Australian Government’s
Building Brand Australia program, including
the promotion of the Australia Unlimited nation
brand. During this third year of the program,
the Australia Unlimited brand has been
used to demonstrate Australian capability
through innovative digital content channels,
including a monthly iPad magazine, as well as
a diverse range of international activities.
This year marked the fi nal year of funding
for Austrade’s contribution to both the Clean
Energy Trade and Investment Strategy and the
Automotive Market Access Program (AMAP).
Austrade continued to attract inward investment
and identify export opportunities to assist the
growth of a sustainable clean energy sector.
Under AMAP, Austrade supported the Australian
automotive components sector to integrate
into global supply chains and increase its
share of markets in Asia and North America.
Austrade also continued to deliver consular
services on behalf of the Australian Government
in a range of overseas locations. In 2011–12,
Austrade delivered consular advice and
information to more than 90,000 people. These
services included consular assistance, passport
services, notarial acts and general advice.
The year ahead
For the year ahead, Austrade’s trade facilitation
activities will continue to focus on growth and
emerging markets that off er commercial potential,
provide opportunities that align with Australia’s
interests, and where there is a clear role for
government assistance. Austrade will deliver
practical in-market support, advice and insights,
and will place increased emphasis on seeking
tangible opportunities for Australian companies.
Austrade will make greater use of referrals to
other service providers and online information
and services to support Australia’s exporters.
Austrade’s service delivery model will be
strengthened through collaboration and
partnerships with other government and private
service organisations, focusing on shared
objectives and areas in which these organisations
are either better placed to assist Australian fi rms
or can extend Austrade’s reach. This will achieve a
more contemporary approach to service delivery.
Austrade’s investment work will focus on
priorities that have been developed in
consultation across government. These include
tourism infrastructure, innovation, economic
infrastructure and clean energy (each supported
by the relevant Commonwealth agency); and
digital economy, including ICT, agricultural
science and food technology and processing,
technology, services and processing for
the resources sector (each supported by a
number of state and territory governments).
4 > Australian Trade Commission Annual Report 2011–12
Austrade will continue to work closely with
institutions and associations across the
international education and training sector to
support their activities. In the context of a wide
range of proactive work across the Austrade
network, emerging areas of focus for the year
ahead will include vocational skills development
and transnational education delivery in Asia,
higher education linkages with Brazil and
corporate human capital development in Japan.
Austrade will also continue to lead the Australia
Unlimited nation brand activity on behalf of the
Government. Throughout the fourth and fi nal
year of the current funding for the Building Brand
Australia program, Austrade will work with industry
to encourage the use of the Australia Unlimited
brand and support activities that showcase
Australia’s credentials in international markets.
In addition to trade, international education and
investment activities, the establishment of new
Austrade-managed consulates in Mongolia
and Colombia will increase Austrade’s focus
on consular activities in its overall priorities.
In 2012–13, Austrade will also continue its
governance improvement program, with key
areas of focus to include security (personal,
information and facilities) and work health and
safety. In addition, Austrade will continue to
place a major focus on anti-bribery policies
and practices, including communicating
these to Australian businesses.
The global trade and investment outlook has some
continued sources of uncertainty in 2012–13.
As a result of the substantial work Austrade has
completed on the reform process in the past
year, the agency is now better prepared in terms
of strategic direction and resource allocation to
capture opportunities in areas of high growth.
I extend my recognition and thanks to my
colleagues within Austrade for their work
and dedication in 2011–12 and look forward
to working together in the coming year to
contribute to the important role that Austrade
plays in increasing Australia’s prosperity.
Peter Grey Chief Executive Offi cer
Australian Trade Commission Annual Report 2011–12 > 5
1AG
ENC
Y OVERVIEW
O
rganis
atio
nal s
tructu
re
Organisational structure
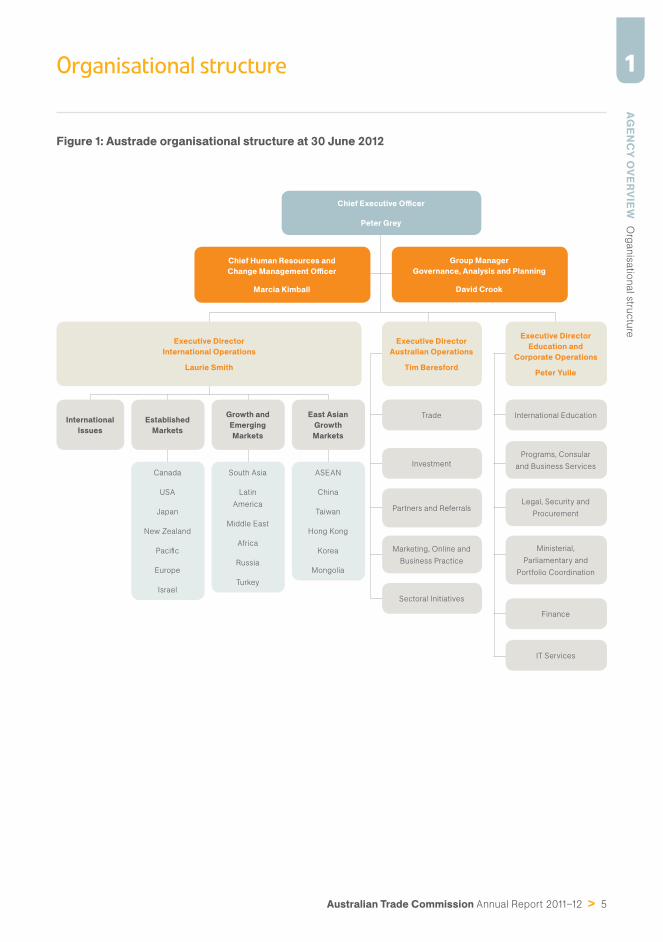
Figure 1: Austrade organisational structure at 30 June 2012
Chief Human Resources and Change Management Offi cer
Marcia Kimball
Chief Executive Offi cer
Peter Grey
Group ManagerGovernance, Analysis and Planning
David Crook
Executive Director Australian Operations
Tim Beresford
Executive Director Education and
Corporate Operations
Peter Yuile
International EducationTrade
Executive DirectorInternational Operations
Laurie Smith
International Issues
Established Markets
Canada
USA
Japan
New Zealand
Pacifi c
Europe
Israel
Growth and Emerging Markets
South Asia
Latin
America
Middle East
Africa
Russia
Turkey
East Asian Growth Markets
ASEAN
China
Taiwan
Hong Kong
Korea
Mongolia
Programs, Consular
and Business ServicesInvestment
Legal, Security and
ProcurementPartners and Referrals
Ministerial,
Parliamentary and
Portfolio Coordination
Marketing, Online and
Business Practice
Finance
Sectoral Initiatives
IT Services
6 > Australian Trade Commission Annual Report 2011–12
About Austrade
Austrade’s role
The Australian Trade Commission (Austrade)
is the Australian Government’s agency for
promoting trade, investment and international
education. Through a global network of
offi ces, Austrade assists Australian enterprises
to increase international business, attracts
productive foreign direct investment
into Australia and promotes Australia’s
international education and training sector.
Specifi cally, Austrade helps Australian businesses
reduce the time, cost and risk of exporting,
including through the administration of the
Export Market Development Grants scheme
and the TradeStart program. Austrade works
closely with state and territory governments
to attract and facilitate productive foreign
direct investment into Australia. Austrade has
responsibility for promoting the Australian
international education and training sector in
overseas markets and assists Australian education
providers with market information and services.
Austrade provides advice to the Australian
Government on its trade and investment
policy agenda and delivers Australian
consular, passport and other government
services in specifi c overseas locations.
Austrade also manages the Building Brand
Australia program to enhance awareness of
contemporary Australian skills and capability
and enrich Australia’s global reputation through
the Australia Unlimited nation brand.
Legislation
Austrade was established by the Australian
Trade Commission Act 1985. It is a Prescribed
Agency subject to the Financial Management
and Accountability Act 1997 and the Public
Service Act 1999 and is part of the Foreign Aff airs
and Trade portfolio. Austrade is responsible to
the Minister for Trade and Competitiveness.
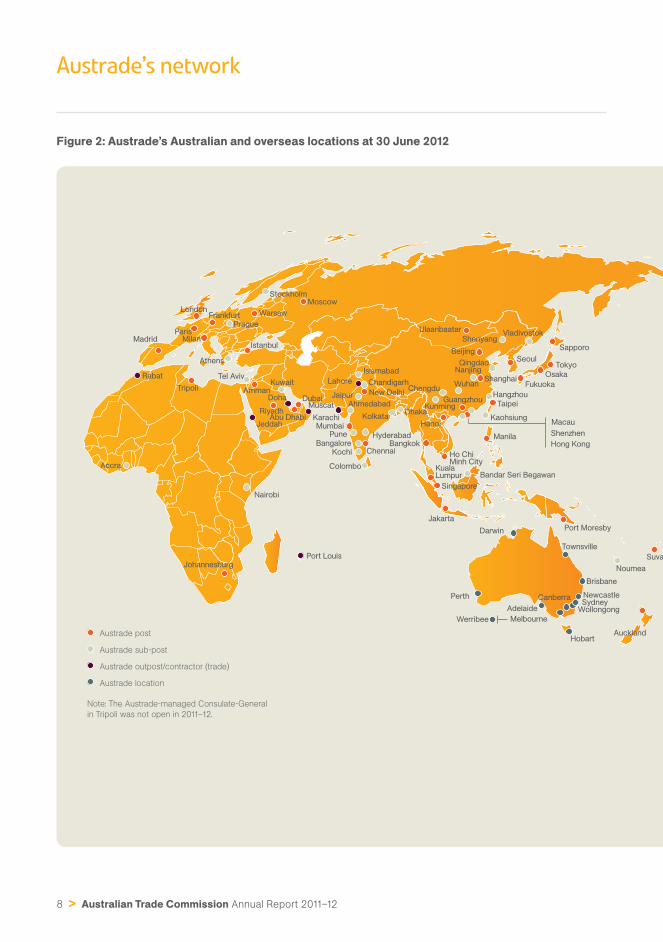
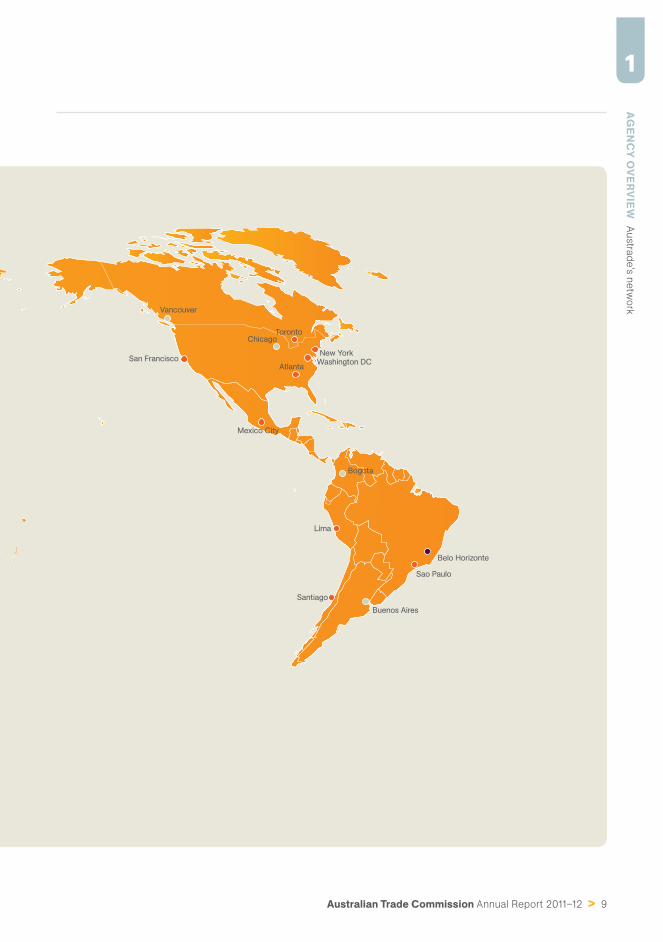
Austrade’s network
At 30 June 2012, Austrade operated in
90 locations in 50 countries. Austrade
delivered consular, passport and other
government services in 17 consulates.1 The
Australian and overseas locations in which
Austrade operates are shown in Figure 2.
Following the review of Austrade in 2010,
Austrade’s overseas network is now weighted
towards growth and emerging markets that off er
commercial potential, provide opportunities
that align with Australia’s interests, and where
there is a clear role for government assistance.
Austrade pursues investment promotion and
attraction activities in markets where there are
major sources of investible funds, predominantly
in the established markets of North America and
Europe and increasingly in other major growth
economies in Asia and the Middle East. The
promotion of Australia’s international education
and training sector remains a priority in all
markets. For more information on the review of
Austrade and subsequent reforms, see page iv.
1 The Austrade-managed Consulate-General
in Tripoli was not open in 2011–12.
Australian Trade Commission Annual Report 2011–12 > 7
1AG
ENC
Y OVERVIEW
A
bo
ut A
ustra
de
Austrade has realigned its market teams into
three divisions: Established Markets; Growth
and Emerging Markets; and East Asian Growth
Markets. For more information on Austrade’s
work in international markets, see page 19.
Within Australia, Austrade’s services and
programs were delivered through 12 Austrade
locations and through a network of 31 TradeStart
advisers in metropolitan and regional areas.
TradeStart operates in partnership with state
and territory governments, industry associations
and regional development bodies. Austrade’s
Australian offi ces, including TradeStart
locations, are shown in Appendix B.
Staffi ng and fi nancial performance
At 30 June 2012, Austrade employed 985
staff , 76 per cent of whom were employed
in overseas locations and client-focused
operations in Australia. Further staffi ng
information is provided in Appendix A.
In a challenging fi nancial environment, Austrade
achieved its fi nancial targets while implementing
many of the structural changes associated with
the review of Austrade, and responding to the
changing international business environment.
Financial performance and funding information
are detailed in Part 4 of this report (see page
125 and Table 1 on inside front cover).
8 > Australian Trade Commission Annual Report 2011–12
Austrade’s network
Austrade sub-post
Austrade outpost/contractor (trade)
Note: The Austrade-managed Consulate-General
in Tripoli was not open in 2011–12.
Austrade location
Austrade post
Johannesburg
Accra
Nairobi
Rabat
Tripoli
Madrid
Jeddah
RiyadhKunming
Hong Kong
Werribee
Shenzhen
Macau
Vladivostok
Noumea
Auckland
Suva
Port Moresby
Bandar Seri Begawan
Singapore
Jakarta
KualaLumpur
BangkokManila
Ho ChiMinh City
HanoiMumbaiPune
Chennai
Colombo
Bangalore
Kochi
Hyderabad
Islamabad
New Delhi
Lahore
Karachi
Chandigarh
DhakaKolkata
Ahmedabad
Jaipur
Seoul
Osaka
Tokyo
Fukuoka
SapporoBeijing
QingdaoNanjing
Hangzhou
WuhanShanghai
MuscatDubaiDoha
Abu Dhabi
AmmanKuwait
Tel Aviv
Istanbul
Athens
MilanParis
LondonFrankfurt
Prague
Moscow
Warsaw
Stockholm
Darwin
Townsville
Newcastle Sydney
Brisbane
Wollongong
Canberra
Melbourne
Perth
Hobart
Adelaide
Port Louis
Taipei
Kaohsiung
Chengdu
Guangzhou
Ulaanbaatar
Shenyang
Figure 2: Austrade’s Australian and overseas locations at 30 June 2012
Australian Trade Commission Annual Report 2011–12 > 9
1AG
ENC
Y OVERVIEW
A
ustra
de’s
netw
ork
a
Lima
Sao Paulo
Buenos Aires
Santiago
Belo Horizonte
Bogota
Mexico City
San Francisco
Vancouver
AtlantaWashington DC
New York
TorontoChicago
10 > Australian Trade Commission Annual Report 2011–12
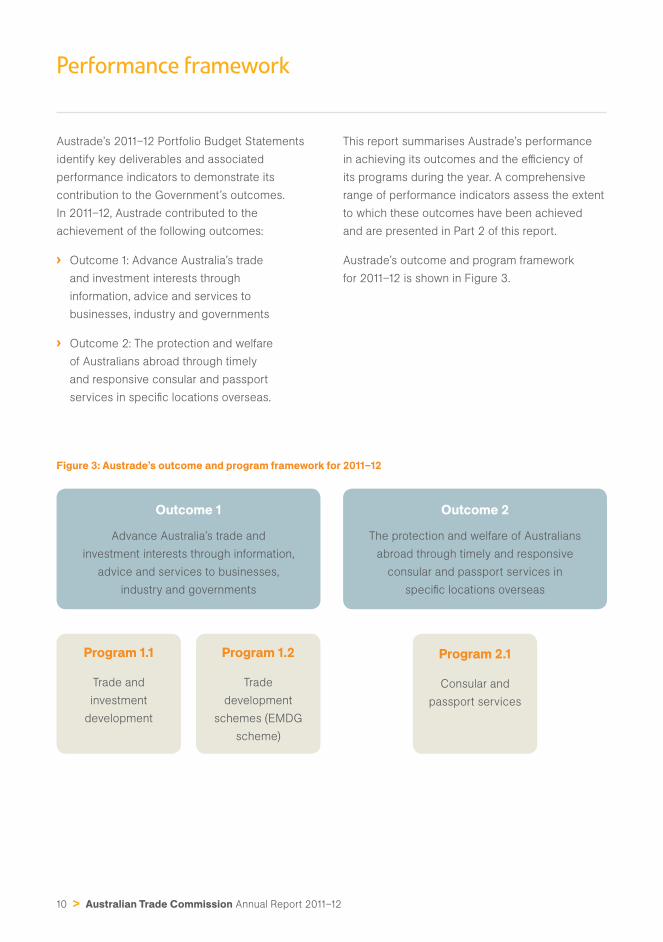
Performance framework
Austrade’s 2011–12 Portfolio Budget Statements
identify key deliverables and associated
performance indicators to demonstrate its
contribution to the Government’s outcomes.
In 2011–12, Austrade contributed to the
achievement of the following outcomes:
› Outcome 1: Advance Australia’s trade
and investment interests through
information, advice and services to
businesses, industry and governments
› Outcome 2: The protection and welfare
of Australians abroad through timely
and responsive consular and passport
services in specifi c locations overseas.
This report summarises Austrade’s performance
in achieving its outcomes and the effi ciency of
its programs during the year. A comprehensive
range of performance indicators assess the extent
to which these outcomes have been achieved
and are presented in Part 2 of this report.
Austrade’s outcome and program framework
for 2011–12 is shown in Figure 3.
Figure 3: Austrade’s outcome and program framework for 2011–12
Outcome 1
Advance Australia’s trade and
investment interests through information,
advice and services to businesses,
industry and governments
Outcome 2
The protection and welfare of Australians
abroad through timely and responsive
consular and passport services in
specifi c locations overseas
Program 1.1
Trade and
investment
development
Program 1.2
Trade
development
schemes (EMDG
scheme)
Program 2.1
Consular and
passport services
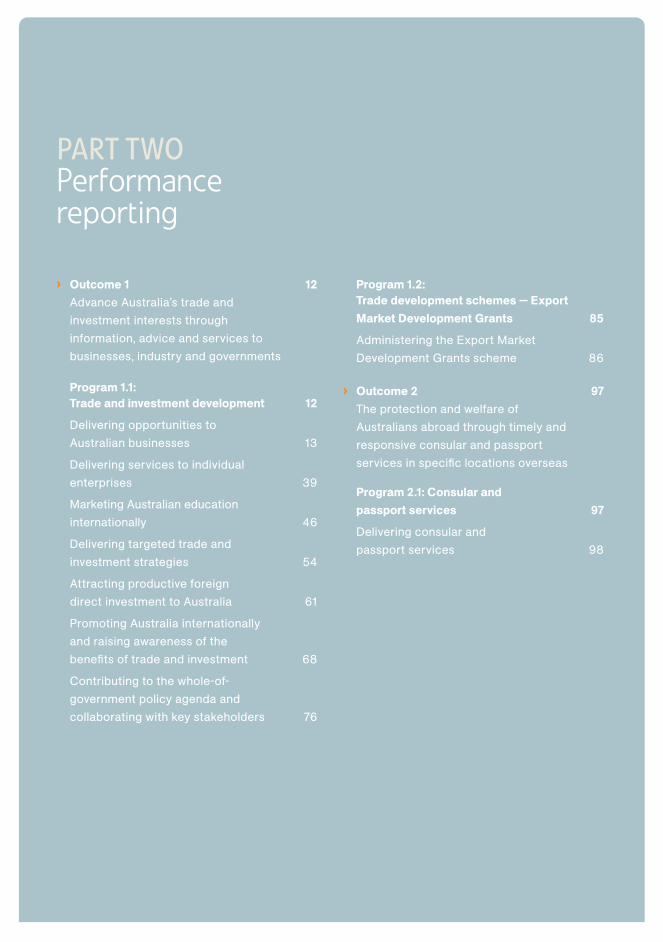
PART TWOPerformance reporting
› Outcome 1 12Advance Australia’s trade and
investment interests through
information, advice and services to
businesses, industry and governments
Program 1.1: Trade and investment development 12
Delivering opportunities to
Australian businesses 13
Delivering services to individual
enterprises 39
Marketing Australian education
internationally 46
Delivering targeted trade and
investment strategies 54
Attracting productive foreign
direct investment to Australia 61
Promoting Australia internationally
and raising awareness of the
benefi ts of trade and investment 68
Contributing to the whole-of-
government policy agenda and
collaborating with key stakeholders 76
Program 1.2: Trade development schemes — Export Market Development Grants 85
Administering the Export Market
Development Grants scheme 86
› Outcome 2 97The protection and welfare of
Australians abroad through timely and
responsive consular and passport
services in specifi c locations overseas
Program 2.1: Consular and passport services 97
Delivering consular and
passport services 98
12 > Australian Trade Commission Annual Report 2011–12
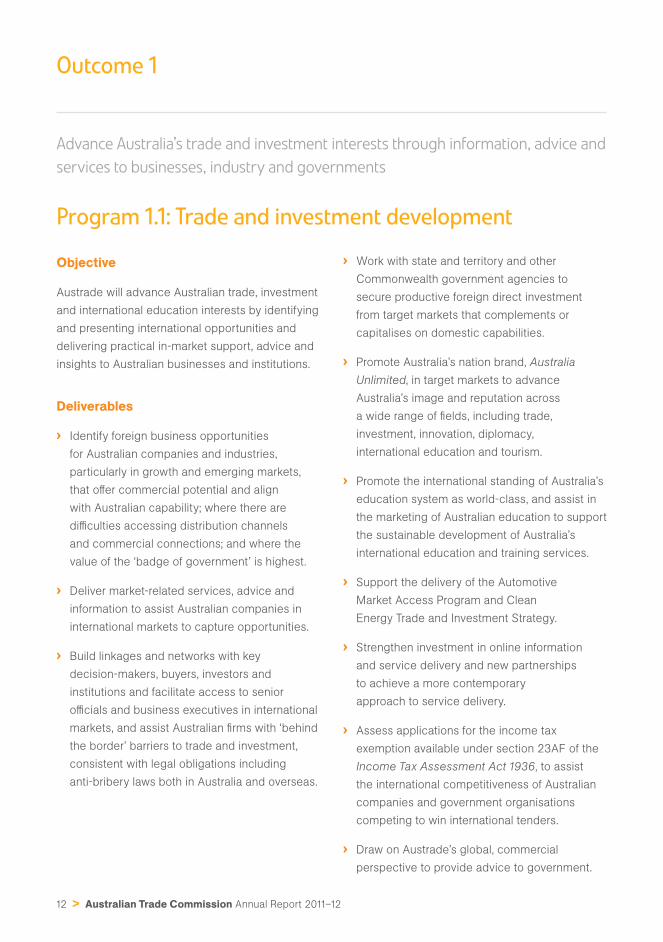
Outcome 1
Advance Australia’s trade and investment interests through information, advice and
services to businesses, industry and governments
Program 1.1: Trade and investment development
Objective
Austrade will advance Australian trade, investment
and international education interests by identifying
and presenting international opportunities and
delivering practical in-market support, advice and
insights to Australian businesses and institutions.
Deliverables
› Identify foreign business opportunities
for Australian companies and industries,
particularly in growth and emerging markets,
that off er commercial potential and align
with Australian capability; where there are
diffi culties accessing distribution channels
and commercial connections; and where the
value of the ‘badge of government’ is highest.
› Deliver market-related services, advice and
information to assist Australian companies in
international markets to capture opportunities.
› Build linkages and networks with key
decision-makers, buyers, investors and
institutions and facilitate access to senior
offi cials and business executives in international
markets, and assist Australian fi rms with ‘behind
the border’ barriers to trade and investment,
consistent with legal obligations including
anti-bribery laws both in Australia and overseas.
› Work with state and territory and other
Commonwealth government agencies to
secure productive foreign direct investment
from target markets that complements or
capitalises on domestic capabilities.
› Promote Australia’s nation brand, Australia
Unlimited, in target markets to advance
Australia’s image and reputation across
a wide range of fi elds, including trade,
investment, innovation, diplomacy,
international education and tourism.
› Promote the international standing of Australia’s
education system as world-class, and assist in
the marketing of Australian education to support
the sustainable development of Australia’s
international education and training services.
› Support the delivery of the Automotive
Market Access Program and Clean
Energy Trade and Investment Strategy.
› Strengthen investment in online information
and service delivery and new partnerships
to achieve a more contemporary
approach to service delivery.
› Assess applications for the income tax
exemption available under section 23AF of the
Income Tax Assessment Act 1936, to assist
the international competitiveness of Australian
companies and government organisations
competing to win international tenders.
› Draw on Austrade’s global, commercial
perspective to provide advice to government.
Australian Trade Commission Annual Report 2011–12 > 13
PERFO
RM
AN
CE R
EPOR
TING
O
utc
om
e 1 –
Pro
gra
m 1.1
2
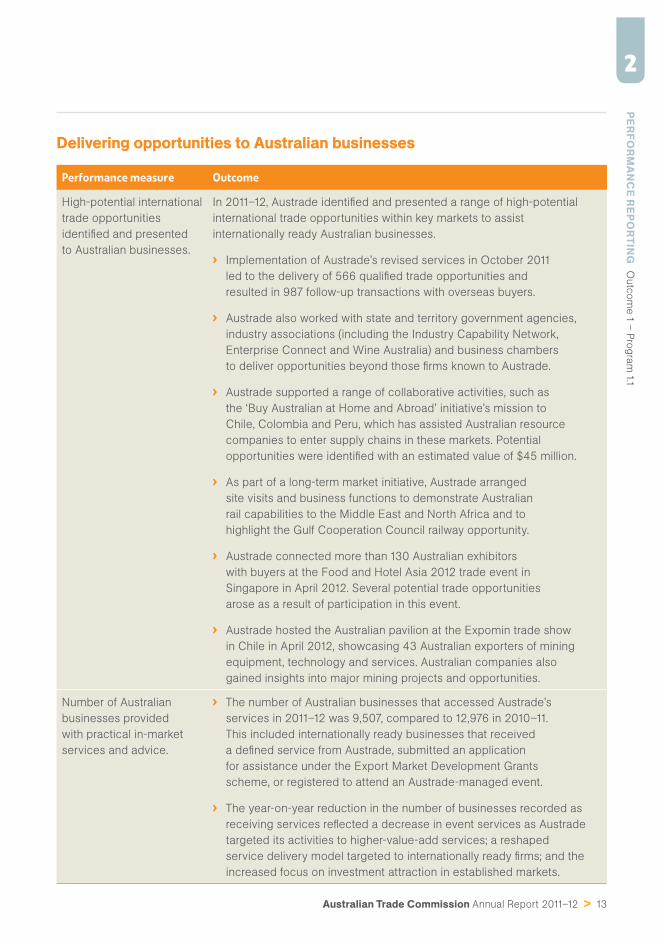
Delivering opportunities to Australian businesses
Performance measure Outcome
High-potential international
trade opportunities
identifi ed and presented
to Australian businesses.
In 2011–12, Austrade identifi ed and presented a range of high-potential
international trade opportunities within key markets to assist
internationally ready Australian businesses.
› Implementation of Austrade’s revised services in October 2011
led to the delivery of 566 qualifi ed trade opportunities and
resulted in 987 follow-up transactions with overseas buyers.
› Austrade also worked with state and territory government agencies,
industry associations (including the Industry Capability Network,
Enterprise Connect and Wine Australia) and business chambers
to deliver opportunities beyond those fi rms known to Austrade.
› Austrade supported a range of collaborative activities, such as
the ‘Buy Australian at Home and Abroad’ initiative’s mission to
Chile, Colombia and Peru, which has assisted Australian resource
companies to enter supply chains in these markets. Potential
opportunities were identifi ed with an estimated value of $45 million.
› As part of a long-term market initiative, Austrade arranged
site visits and business functions to demonstrate Australian
rail capabilities to the Middle East and North Africa and to
highlight the Gulf Cooperation Council railway opportunity.
› Austrade connected more than 130 Australian exhibitors
with buyers at the Food and Hotel Asia 2012 trade event in
Singapore in April 2012. Several potential trade opportunities
arose as a result of participation in this event.
› Austrade hosted the Australian pavilion at the Expomin trade show
in Chile in April 2012, showcasing 43 Australian exporters of mining
equipment, technology and services. Australian companies also
gained insights into major mining projects and opportunities.
Number of Australian
businesses provided
with practical in-market
services and advice.
› The number of Australian businesses that accessed Austrade’s
services in 2011–12 was 9,507, compared to 12,976 in 2010–11.
This included internationally ready businesses that received
a defi ned service from Austrade, submitted an application
for assistance under the Export Market Development Grants
scheme, or registered to attend an Austrade-managed event.
› The year-on-year reduction in the number of businesses recorded as
receiving services refl ected a decrease in event services as Austrade
targeted its activities to higher-value-add services; a reshaped
service delivery model targeted to internationally ready fi rms; and the
increased focus on investment attraction in established markets.
14 > Australian Trade Commission Annual Report 2011–12
Trade environment
Australia’s total goods and services exports rose
10.2 per cent in 2011 to $313.3 billion—the fi rst
time exports have reached over $300 billion
during any 12-month period. The record export
performance resulted in an annual trade
surplus of $18.3 billion. Mineral exports led the
way, notably iron and copper ores, increasing
by 24.6 per cent to $86.7 billion in 2011.2
Australia’s terms of trade increased 13.2 per cent
to near record levels, lifting real gross domestic
incomes. China was Australia’s largest two-way
trade partner ($121.1 billion), followed by Japan
($72.5 billion) and the United States ($54.2 billion).
Exports of resources accounted for 60.8 per
cent of total exports by value. According
to the Australian Bureau of Statistics,
there were 44,766 goods and services
exporters in Australia in 2010–11, almost
unchanged from the previous period.
2 DFAT, Composition of Trade Australia 2011.
Opportunity identifi cation and delivery
The review of Austrade has fundamentally
reshaped Austrade’s strategy, operating model
and structure. In line with the outcomes of
the review, in 2011–12, Austrade implemented
strategies that support Australian businesses
to realise tangible commercial opportunities
in priority and emerging markets, where
Austrade adds greatest value to business.
Under its new operating model, Austrade focuses
on identifying and delivering high-quality, well-
qualifi ed trade opportunities to internationally
ready Australian suppliers across a broad
range of industries. Trade opportunities are
quality international sales leads identifi ed by
Austrade’s off shore offi ces. These leads meet
a specifi c need from a qualifi ed buyer, which
Australian exporters should be able to contest
and supply. Austrade provides information on
all opportunities on a non-exclusive basis and
distributes opportunities widely to Australian
fi rms, including through industry organisations.
Australian Trade Commission Annual Report 2011–12 > 15
PERFO
RM
AN
CE R
EPOR
TING
O
utc
om
e 1 –
Pro
gra
m 1.1
2
Market initiative: major sporting events
Australia has world-leading expertise
and capability across the range of major
sporting event activities, including
bidding, planning, event staging services,
operations management, ceremonies and
venue design and construction. More than
40 Australian companies and specialists
have been engaged in projects surrounding
the 2012 Olympic Games in London.
One such success was Victorian company,
Advanced Polymer Technology, which provided
the synthetic surface of the Olympic hockey
arena. Austrade also assisted New South
Wales-based company, Intelligent Risks,
to win the supply of security planning and
operational delivery at the London Olympics.
Both of these contracts were won through
Austrade introductions to key decision-makers
from the London Olympic Delivery Authority
during the 2008 Olympic Games in Beijing.
Over the coming decade, Brazil, Qatar, the
Republic of Korea and Russia are preparing
for some of the world’s most high-profi le
sporting events, including the summer
and winter Olympics, FIFA World Cups,
Asian Games, and swimming and athletics
world championships. Austrade continues
to identify potential opportunities for
Australian companies and build networks
of high-level contacts in these markets.
In November 2011, Austrade held a major
sporting events industry webinar to highlight
business opportunities in Russia, attracting
29 business representatives in Brisbane,
Melbourne and Sydney. Austrade’s support for
Australia’s major sporting events industry will
continue in 2012–13, with Austrade holding
activities in London during the Olympic
Games, including ‘Australia Unlimited 2012’,
an event targeting key decision-makers
at a business networking reception at
the Australian High Commission.
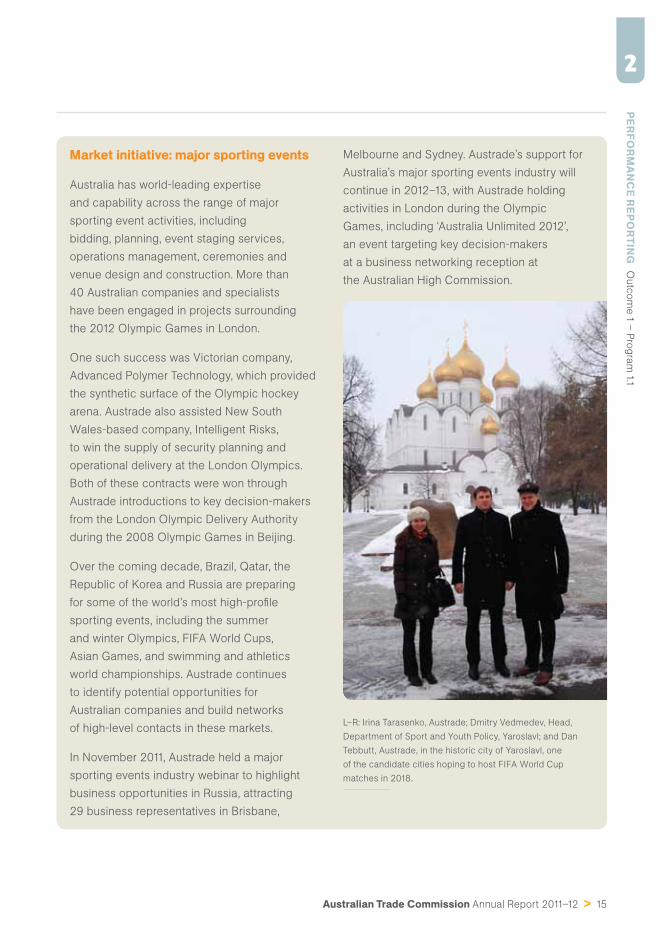
L–R: Irina Tarasenko, Austrade; Dmitry Vedmedev, Head,
Department of Sport and Youth Policy, Yaroslavl; and Dan
Tebbutt, Austrade, in the historic city of Yaroslavl, one
of the candidate cities hoping to host FIFA World Cup
matches in 2018.
16 > Australian Trade Commission Annual Report 2011–12
Performance
At 30 June 2012, Austrade had delivered
566 qualifi ed trade opportunities, and facilitated
the identifi cation and targeting of 2,937 Australian
fi rms in relation to distributed trade opportunities.
This resulted in 987 commercial introductions
of Australian suppliers to overseas buyers, and
205 export sales were either under negotiation
or concluded with overseas buyers. These results
have been achieved since the inception of the new
opportunities delivery model on 1 October 2011.
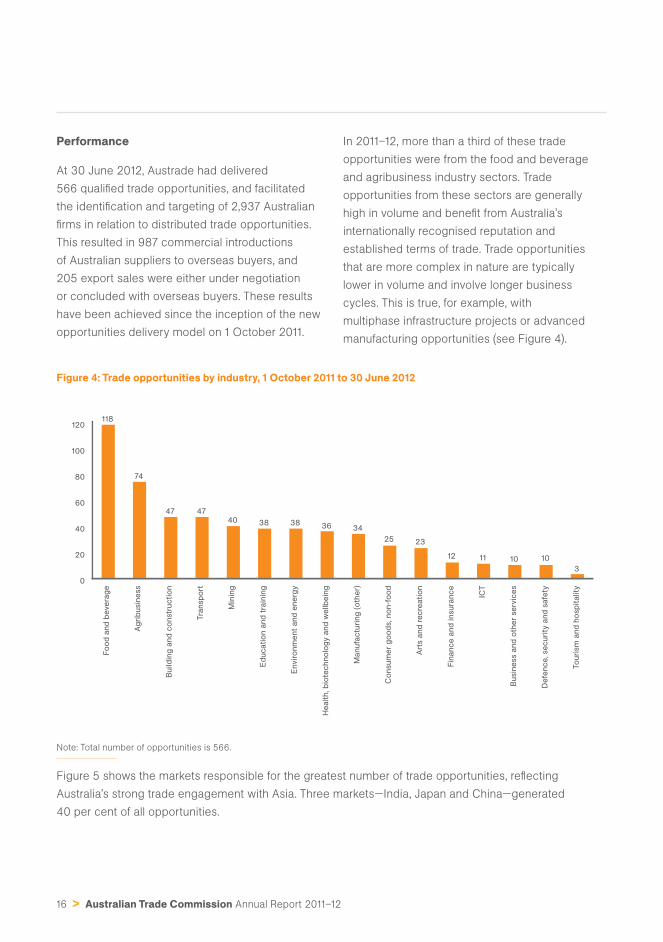
In 2011–12, more than a third of these trade
opportunities were from the food and beverage
and agribusiness industry sectors. Trade
opportunities from these sectors are generally
high in volume and benefi t from Australia’s
internationally recognised reputation and
established terms of trade. Trade opportunities
that are more complex in nature are typically
lower in volume and involve longer business
cycles. This is true, for example, with
multiphase infrastructure projects or advanced
manufacturing opportunities (see Figure 4).
Figure 4: Trade opportunities by industry, 1 October 2011 to 30 June 2012
0
20
40
60
80
100
120
Fo
od
and
be
ve
rag
e
Ag
rib
usin
ess
Build
ing
and
co
nstr
ucti
on
Tra
nsp
ort
Min
ing
Ed
ucati
on a
nd
tra
inin
g
Envir
onm
ent
and
ene
rgy
He
alt
h, b
iote
chno
log
y a
nd
we
llb
ein
g
Manufa
ctu
ring
(o
the
r)
Co
nsum
er
go
od
s, no
n-f
oo
d
Art
s a
nd
re
cre
ati
on
Fin
ance
and
insura
nce
ICT
Busin
ess a
nd
oth
er
se
rvic
es
De
fence
, se
curi
ty a
nd
safe
ty
To
uri
sm
and
ho
sp
itality
118
74
47 47
40 38 38 36 34
25 23
12 11 10 10
3
Note: Total number of opportunities is 566.
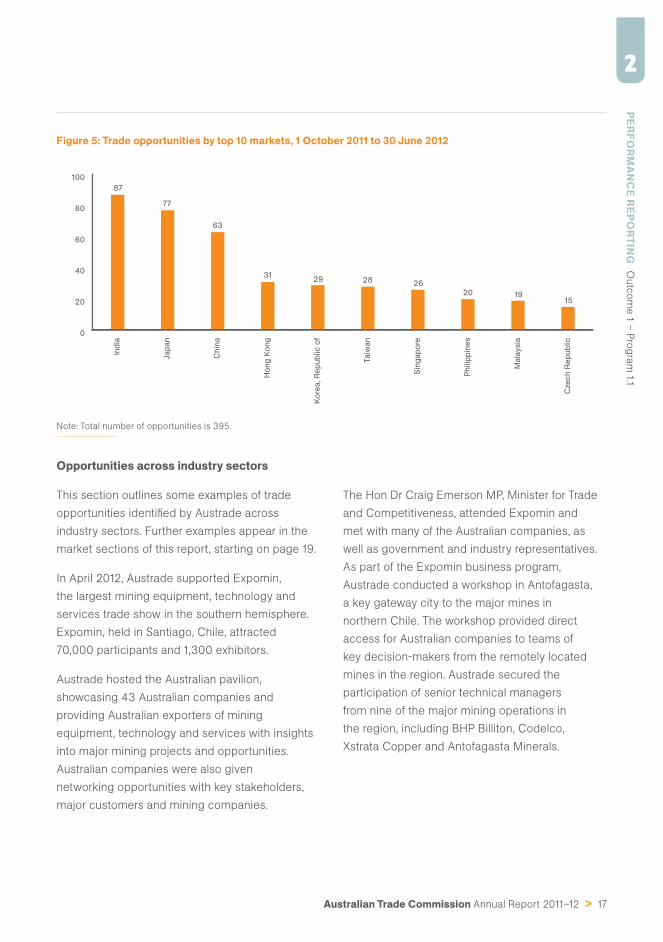
Figure 5 shows the markets responsible for the greatest number of trade opportunities, refl ecting
Australia’s strong trade engagement with Asia. Three markets—India, Japan and China—generated
40 per cent of all opportunities.
Australian Trade Commission Annual Report 2011–12 > 17
PERFO
RM
AN
CE R
EPOR
TING
O
utc
om
e 1 –
Pro
gra
m 1.1
2
Figure 5: Trade opportunities by top 10 markets, 1 October 2011 to 30 June 2012
0
20
40
60
80
100
Ind
ia
Jap
an
Chin
a
Ho
ng
Ko
ng
Ko
rea, R
ep
ub
lic o
f
Taiw
an
Sin
gap
ore
Philip
pin
es
Mala
ysia
Cze
ch R
ep
ub
lic
87
77
63
3129 28 26
20 1915
Note: Total number of opportunities is 395.
Opportunities across industry sectors
This section outlines some examples of trade
opportunities identifi ed by Austrade across
industry sectors. Further examples appear in the
market sections of this report, starting on page 19.
In April 2012, Austrade supported Expomin,
the largest mining equipment, technology and
services trade show in the southern hemisphere.
Expomin, held in Santiago, Chile, attracted
70,000 participants and 1,300 exhibitors.
Austrade hosted the Australian pavilion,
showcasing 43 Australian companies and
providing Australian exporters of mining
equipment, technology and services with insights
into major mining projects and opportunities.
Australian companies were also given
networking opportunities with key stakeholders,
major customers and mining companies.
The Hon Dr Craig Emerson MP, Minister for Trade
and Competitiveness, attended Expomin and
met with many of the Australian companies, as
well as government and industry representatives.
As part of the Expomin business program,
Austrade conducted a workshop in Antofagasta,
a key gateway city to the major mines in
northern Chile. The workshop provided direct
access for Australian companies to teams of
key decision-makers from the remotely located
mines in the region. Austrade secured the
participation of senior technical managers
from nine of the major mining operations in
the region, including BHP Billiton, Codelco,
Xstrata Copper and Antofagasta Minerals.
18 > Australian Trade Commission Annual Report 2011–12
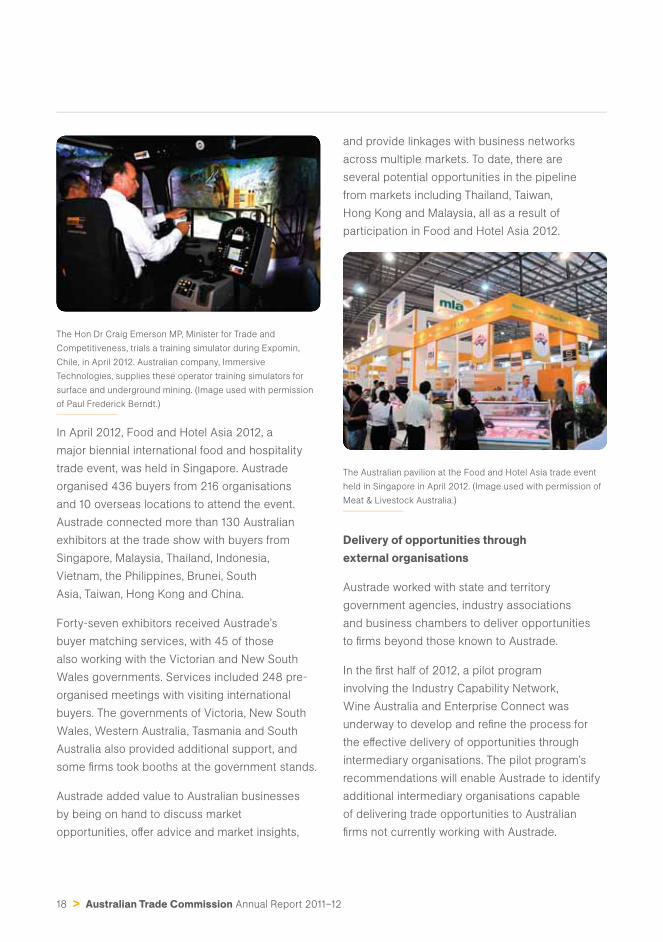
The Hon Dr Craig Emerson MP, Minister for Trade and
Competitiveness, trials a training simulator during Expomin,
Chile, in April 2012. Australian company, Immersive
Technologies, supplies these operator training simulators for
surface and underground mining. (Image used with permission
of Paul Frederick Berndt.)
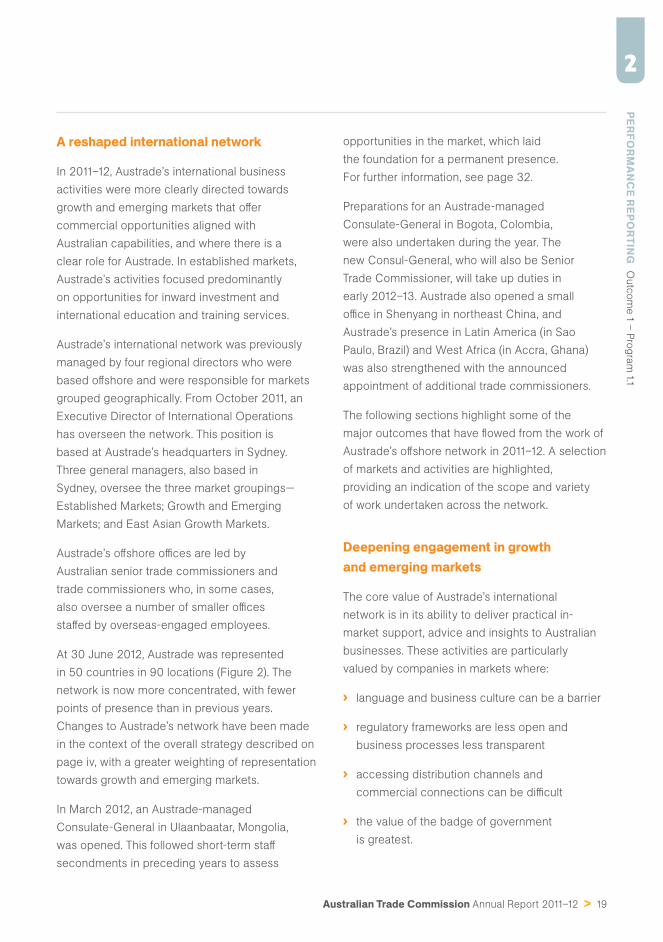
In April 2012, Food and Hotel Asia 2012, a
major biennial international food and hospitality
trade event, was held in Singapore. Austrade
organised 436 buyers from 216 organisations
and 10 overseas locations to attend the event.
Austrade connected more than 130 Australian
exhibitors at the trade show with buyers from
Singapore, Malaysia, Thailand, Indonesia,
Vietnam, the Philippines, Brunei, South
Asia, Taiwan, Hong Kong and China.
Forty-seven exhibitors received Austrade’s
buyer matching services, with 45 of those
also working with the Victorian and New South
Wales governments. Services included 248 pre-
organised meetings with visiting international
buyers. The governments of Victoria, New South
Wales, Western Australia, Tasmania and South
Australia also provided additional support, and
some fi rms took booths at the government stands.
Austrade added value to Australian businesses
by being on hand to discuss market
opportunities, off er advice and market insights,
and provide linkages with business networks
across multiple markets. To date, there are
several potential opportunities in the pipeline
from markets including Thailand, Taiwan,
Hong Kong and Malaysia, all as a result of
participation in Food and Hotel Asia 2012.
The Australian pavilion at the Food and Hotel Asia trade event
held in Singapore in April 2012. (Image used with permission of
Meat & Livestock Australia.)
Delivery of opportunities through external organisations
Austrade worked with state and territory
government agencies, industry associations
and business chambers to deliver opportunities
to fi rms beyond those known to Austrade.
In the fi rst half of 2012, a pilot program
involving the Industry Capability Network,
Wine Australia and Enterprise Connect was
underway to develop and refi ne the process for
the eff ective delivery of opportunities through
intermediary organisations. The pilot program’s
recommendations will enable Austrade to identify
additional intermediary organisations capable
of delivering trade opportunities to Australian
fi rms not currently working with Austrade.
Australian Trade Commission Annual Report 2011–12 > 19
PERFO
RM
AN
CE R
EPOR
TING
O
utc
om
e 1 –
Pro
gra
m 1.1
2
A reshaped international network
In 2011–12, Austrade’s international business
activities were more clearly directed towards
growth and emerging markets that off er
commercial opportunities aligned with
Australian capabilities, and where there is a
clear role for Austrade. In established markets,
Austrade’s activities focused predominantly
on opportunities for inward investment and
international education and training services.
Austrade’s international network was previously
managed by four regional directors who were
based off shore and were responsible for markets
grouped geographically. From October 2011, an
Executive Director of International Operations
has overseen the network. This position is
based at Austrade’s headquarters in Sydney.
Three general managers, also based in
Sydney, oversee the three market groupings—
Established Markets; Growth and Emerging
Markets; and East Asian Growth Markets.
Austrade’s off shore offi ces are led by
Australian senior trade commissioners and
trade commissioners who, in some cases,
also oversee a number of smaller offi ces
staff ed by overseas-engaged employees.
At 30 June 2012, Austrade was represented
in 50 countries in 90 locations (Figure 2). The
network is now more concentrated, with fewer
points of presence than in previous years.
Changes to Austrade’s network have been made
in the context of the overall strategy described on
page iv, with a greater weighting of representation
towards growth and emerging markets.
In March 2012, an Austrade-managed
Consulate-General in Ulaanbaatar, Mongolia,
was opened. This followed short-term staff
secondments in preceding years to assess
opportunities in the market, which laid
the foundation for a permanent presence.
For further information, see page 32.
Preparations for an Austrade-managed
Consulate-General in Bogota, Colombia,
were also undertaken during the year. The
new Consul-General, who will also be Senior
Trade Commissioner, will take up duties in
early 2012–13. Austrade also opened a small
offi ce in Shenyang in northeast China, and
Austrade’s presence in Latin America (in Sao
Paulo, Brazil) and West Africa (in Accra, Ghana)
was also strengthened with the announced
appointment of additional trade commissioners.
The following sections highlight some of the
major outcomes that have fl owed from the work of
Austrade’s off shore network in 2011–12. A selection
of markets and activities are highlighted,
providing an indication of the scope and variety
of work undertaken across the network.
Deepening engagement in growth and emerging markets
The core value of Austrade’s international
network is in its ability to deliver practical in-
market support, advice and insights to Australian
businesses. These activities are particularly
valued by companies in markets where:
› language and business culture can be a barrier
› regulatory frameworks are less open and
business processes less transparent
› accessing distribution channels and
commercial connections can be diffi cult
› the value of the badge of government
is greatest.
20 > Australian Trade Commission Annual Report 2011–12
China
China is Australia’s largest trading partner,
accounting for $71.5 billion of goods exports and
$5.7 billion of services exports in 2011.3 Australia
is a major exporter of resources, minerals, food
and fi bre to the Chinese market and was ranked
as China’s fi fth-largest overall supplier in 2011.
Although growth is moderating from the very
high levels of recent decades, China will remain
a prospective market for Australian fi rms, an
important source of international students and
a growing source of productive investment.
Continuing urbanisation, industrial upgrading,
a focus on clean energy and environmental
remediation, and the expansion of the service
sector creates a wide range of opportunities
for Australian companies. Austrade uses its
badge of government across a broad network
of offi ces in regional China to support Australian
businesses and educational institutions in
this important but challenging market.
In August 2011, Austrade organised the
Australia–China 2.0 trade mission, led by the
Hon Dr Craig Emerson MP, Minister for Trade
and Competitiveness, and the Hon Richard
Marles MP, Parliamentary Secretary for Pacifi c
Island Aff airs. The mission of 100 delegates from
92 Australian businesses and institutions focused
on the new centres of growth in China’s west.
Mission delegates comprised representatives from
a broad range of industries, including education
and training, architecture and engineering
design, clean technology, fi nancial services, legal
services and professional and business services.
The objectives of the mission were to highlight
Australia’s strong capability in the services
sector to local Chinese offi cials and business
3 DFAT, China Fact Sheet, 2012.
leaders, and for Australian delegates to learn
about rapid developments in China’s second-
tier cities. The seven-day mission travelled to
Guangzhou, Changsha, Wuhan, Chengdu and
Chongqing. In each city, Austrade organised
visits to industrial and commercial sites for
Australian delegates, seminars with local
counterparts on doing business in China, and
a reception to meet Chinese government
offi cials and business representatives.
Following participation in the Australia–
China 2.0 trade mission, several Australian
companies, including Telstra and logistics
provider Goodman, have advised of plans to
establish or expand in central and western China.
Other mission participants are following up
with a fi nancial services delegation to western
China and Shanghai in 2012. In addition, the
Victorian Government is pursuing business
opportunities in the environmental services
sector, while NSW educational institutions and
the NSW Government offi ce in Shanghai are
pursuing opportunities in the tertiary education
and vocational education and training sectors.
Australia is a preferred destination for Chinese
students choosing to study abroad and
China represents Australia’s largest market
for international education, with just under
160,000 enrolments in 2011.4 In April 2012,
Austrade held the inaugural Australia–China
Careers Fair in Shanghai in partnership with
Zhaopin Limited, one of the largest online
recruitment companies in China. The event
demonstrated the value of an Australian education
through job outcomes and career development
and was attended by Chinese students, parents,
corporate human resources representatives and
government offi cials. For more information on
the Australia–China Careers Fair, see page 53.
4 Australian Education International, 2012.
Australian Trade Commission Annual Report 2011–12 > 21
PERFO
RM
AN
CE R
EPOR
TING
O
utc
om
e 1 –
Pro
gra
m 1.1
2
India
As a major developing economy, India off ers great
opportunities for Australian businesses. Possible
constraints to growth are emerging and India
is a complex, diverse and challenging market.
However, Australia’s exports to India have grown
particularly rapidly during the past decade.
India is now Australia’s sixth-largest trading partner
and fourth-largest export destination—accounting
for $15.2 billion of goods exports and $2.1 billion of
services exports in 2011. Australia’s major exports
to India include minerals, coal, precious metals
and resources, and education services.5 There is
further potential for growth in bulk commodities,
related supply chains and across a range of niches
in technology and services. Two-way investment
fl ows are also growing strongly from a low base.
The market for clean energy in India is growing
for both domestic and international energy
generators and technology companies.
In February 2012, Austrade organised clean
technology seminars in New Delhi, Mumbai,
Hyderabad and Ahmedabad to coincide with a
Victorian Super Trade Mission, which comprised
217 companies. The aim was to capitalise on
the growth in this emerging sector. It was the
second consecutive year of collaboration with
the Victorian Government to create awareness
of Australian capability in clean energy.
To enhance delegates’ understanding of the
Indian market, Austrade coordinated a program of
group briefi ngs and site visits that were conducted
with Indian sectoral experts, including Ernst &
Young, Yes Bank, the Energy Research Institute,
5 DFAT, India Fact Sheet, 2012.
the Confederation of Indian Industries’ Green
Building Centre, Reliance Industries, and the state
governments of Andhra Pradesh and Gujarat.
The program led to successful outcomes for the
participating companies, with memorandums
of understanding and distributor agreements
signed, and trade transactions in progress.
Coinciding with the Victorian mission, Austrade
organised conferences in Pune and Chennai on
future technology trends in the automotive sector
under the auspices of the Automotive Market
Access Program. The aim of the conferences
was to promote Australia’s technical credentials
and supply capabilities to the Indian automotive
sector, and to foster collaboration in research
and development between Australia and India.
Technical experts from Australia’s automotive
industry addressed the conference, as did
the Hon Richard Dalla-Riva MLC, Victoria’s
Minister for Employment and Industrial
Relations and Minister for Manufacturing,
Exports and Trade, and John Conomos AO,
Automotive Envoy. For more information on
Austrade’s broader work in the clean technology
and automotive sectors, see page 54.
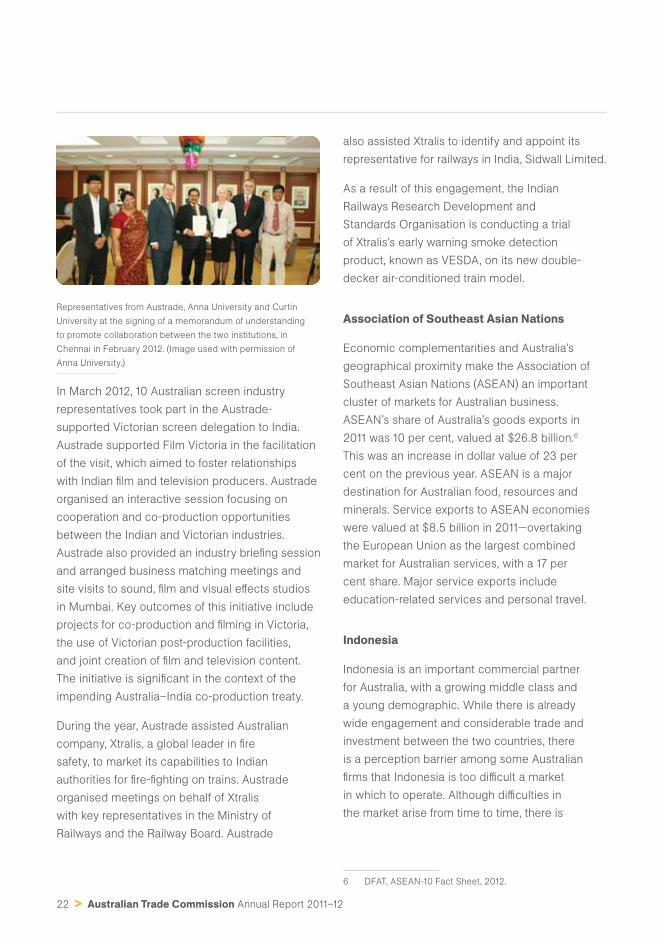
Also in February 2012, Austrade coordinated
a visit to Chennai and Bangalore for the fi ve
universities constituting the Australian Technology
Network. The 17-member delegation conducted
meetings with a number of local institutions,
focusing on developing agreements around the
commercialisation of research, joint research
development and faculty and staff exchanges.
Led by Professor Jeanette Hackett AM,
Vice-Chancellor of Curtin University, the visit
resulted in the signing of memorandums of
understanding with Anna University, Chennai
and the Indian Institute of Technology, Madras.
22 > Australian Trade Commission Annual Report 2011–12
Representatives from Austrade, Anna University and Curtin
University at the signing of a memorandum of understanding
to promote collaboration between the two institutions, in
Chennai in February 2012. (Image used with permission of
Anna University.)
In March 2012, 10 Australian screen industry
representatives took part in the Austrade-
supported Victorian screen delegation to India.
Austrade supported Film Victoria in the facilitation
of the visit, which aimed to foster relationships
with Indian fi lm and television producers. Austrade
organised an interactive session focusing on
cooperation and co-production opportunities
between the Indian and Victorian industries.
Austrade also provided an industry briefi ng session
and arranged business matching meetings and
site visits to sound, fi lm and visual eff ects studios
in Mumbai. Key outcomes of this initiative include
projects for co-production and fi lming in Victoria,
the use of Victorian post-production facilities,
and joint creation of fi lm and television content.
The initiative is signifi cant in the context of the
impending Australia–India co-production treaty.
During the year, Austrade assisted Australian
company, Xtralis, a global leader in fi re
safety, to market its capabilities to Indian
authorities for fi re-fi ghting on trains. Austrade
organised meetings on behalf of Xtralis
with key representatives in the Ministry of
Railways and the Railway Board. Austrade
also assisted Xtralis to identify and appoint its
representative for railways in India, Sidwall Limited.
As a result of this engagement, the Indian
Railways Research Development and
Standards Organisation is conducting a trial
of Xtralis’s early warning smoke detection
product, known as VESDA, on its new double-
decker air-conditioned train model.
Association of Southeast Asian Nations
Economic complementarities and Australia’s
geographical proximity make the Association of
Southeast Asian Nations (ASEAN) an important
cluster of markets for Australian business.
ASEAN’s share of Australia’s goods exports in
2011 was 10 per cent, valued at $26.8 billion.6
This was an increase in dollar value of 23 per
cent on the previous year. ASEAN is a major
destination for Australian food, resources and
minerals. Service exports to ASEAN economies
were valued at $8.5 billion in 2011—overtaking
the European Union as the largest combined
market for Australian services, with a 17 per
cent share. Major service exports include
education-related services and personal travel.
Indonesia
Indonesia is an important commercial partner
for Australia, with a growing middle class and
a young demographic. While there is already
wide engagement and considerable trade and
investment between the two countries, there
is a perception barrier among some Australian
fi rms that Indonesia is too diffi cult a market
in which to operate. Although diffi culties in
the market arise from time to time, there is
6 DFAT, ASEAN-10 Fact Sheet, 2012.
Australian Trade Commission Annual Report 2011–12 > 23
PERFO
RM
AN
CE R
EPOR
TING
O
utc
om
e 1 –
Pro
gra
m 1.1
2
undoubtedly signifi cant untapped potential and
strong support from both countries’ governments
for expanded economic and trade ties.
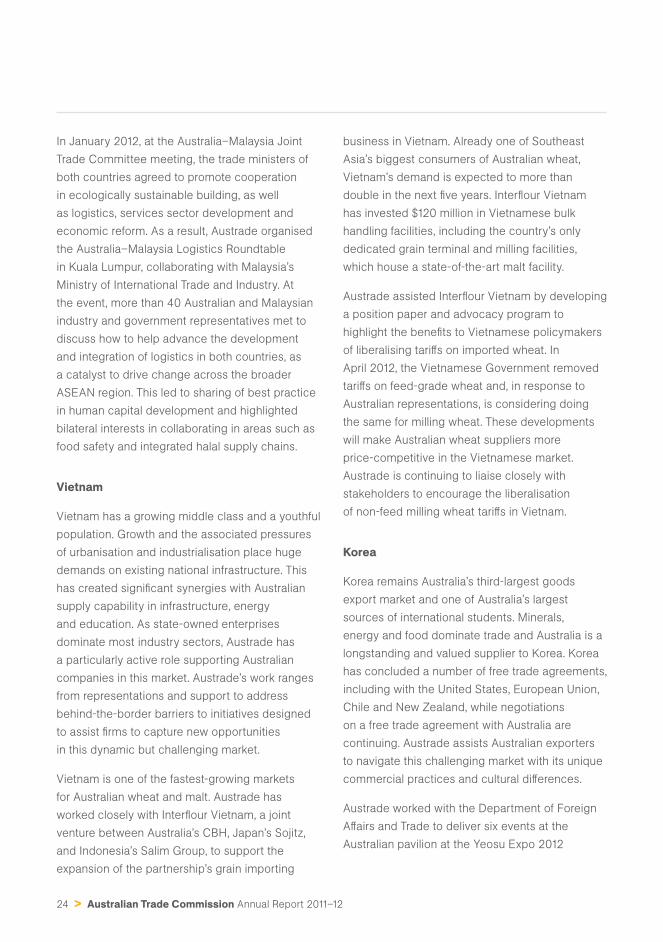
In April 2012, Austrade hosted the Australian
mining conference and exhibition, Ozmine 2012,
in Jakarta. The event brought together key
Indonesian, Australian and ASEAN industry and
government representatives who discussed
major trends, opportunities and challenges
in the mining sector across this fast-growing
region. The exhibition showcased the capabilities
of Australian mining and mining equipment,
technology and services companies to a broad
and diverse international mining audience.
Ozmine 2012 attracted more than 2,400 industry,
stakeholder and government participants from
Indonesia, Thailand, the Philippines, Vietnam,
Malaysia, India and Australia. Feedback
was positive—participants commented
favourably on strategic market insights
obtained at the conference, the high quality
of business relationships developed, and the
opportunity for business and government
leaders to engage on important developments
in the mining sector across ASEAN.
Ian Satchwell, National President of the Australia Indonesia
Business Council, addresses the opening session of
Ozmine 2012, the Australian mining conference and exhibition,
in Jakarta in April 2012. (Image used with permission of
FullFill Artplication.)
Malaysia
Australia and Malaysia have deep business and
education ties–dating back to the 1960s–that have
continued to develop strongly in recent years.
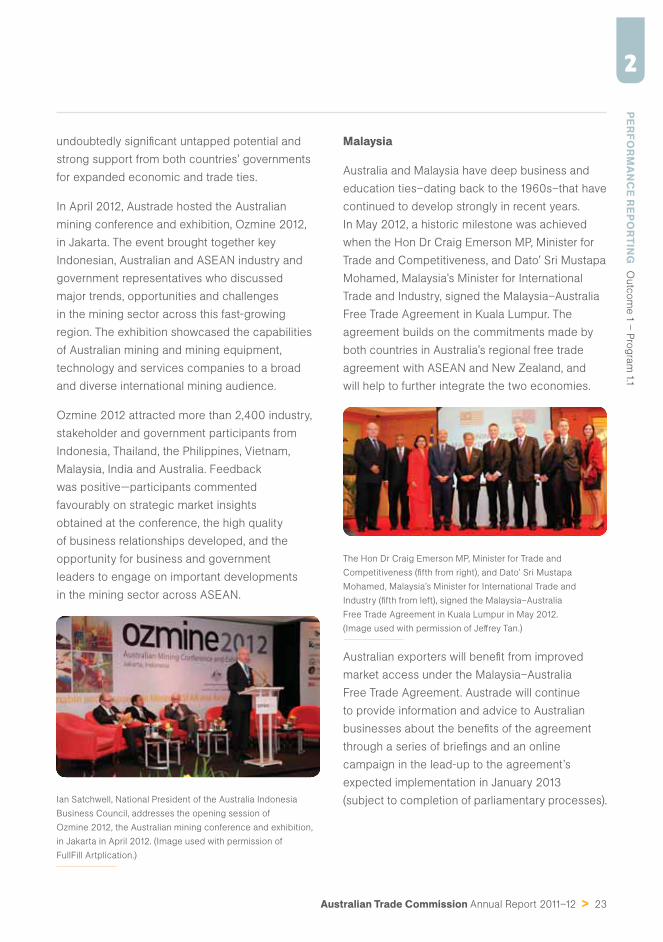
In May 2012, a historic milestone was achieved
when the Hon Dr Craig Emerson MP, Minister for
Trade and Competitiveness, and Dato’ Sri Mustapa
Mohamed, Malaysia’s Minister for International
Trade and Industry, signed the Malaysia–Australia
Free Trade Agreement in Kuala Lumpur. The
agreement builds on the commitments made by
both countries in Australia’s regional free trade
agreement with ASEAN and New Zealand, and
will help to further integrate the two economies.
The Hon Dr Craig Emerson MP, Minister for Trade and
Competitiveness (fi fth from right), and Dato’ Sri Mustapa
Mohamed, Malaysia’s Minister for International Trade and
Industry (fi fth from left), signed the Malaysia–Australia
Free Trade Agreement in Kuala Lumpur in May 2012.
(Image used with permission of Jeff rey Tan.)
Australian exporters will benefi t from improved
market access under the Malaysia–Australia
Free Trade Agreement. Austrade will continue
to provide information and advice to Australian
businesses about the benefi ts of the agreement
through a series of briefi ngs and an online
campaign in the lead-up to the agreement’s
expected implementation in January 2013
(subject to completion of parliamentary processes).
24 > Australian Trade Commission Annual Report 2011–12
In January 2012, at the Australia–Malaysia Joint
Trade Committee meeting, the trade ministers of
both countries agreed to promote cooperation
in ecologically sustainable building, as well
as logistics, services sector development and
economic reform. As a result, Austrade organised
the Australia–Malaysia Logistics Roundtable
in Kuala Lumpur, collaborating with Malaysia’s
Ministry of International Trade and Industry. At
the event, more than 40 Australian and Malaysian
industry and government representatives met to
discuss how to help advance the development
and integration of logistics in both countries, as
a catalyst to drive change across the broader
ASEAN region. This led to sharing of best practice
in human capital development and highlighted
bilateral interests in collaborating in areas such as
food safety and integrated halal supply chains.
Vietnam
Vietnam has a growing middle class and a youthful
population. Growth and the associated pressures
of urbanisation and industrialisation place huge
demands on existing national infrastructure. This
has created signifi cant synergies with Australian
supply capability in infrastructure, energy
and education. As state-owned enterprises
dominate most industry sectors, Austrade has
a particularly active role supporting Australian
companies in this market. Austrade’s work ranges
from representations and support to address
behind-the-border barriers to initiatives designed
to assist fi rms to capture new opportunities
in this dynamic but challenging market.
Vietnam is one of the fastest-growing markets
for Australian wheat and malt. Austrade has
worked closely with Interfl our Vietnam, a joint
venture between Australia’s CBH, Japan’s Sojitz,
and Indonesia’s Salim Group, to support the
expansion of the partnership’s grain importing
business in Vietnam. Already one of Southeast
Asia’s biggest consumers of Australian wheat,
Vietnam’s demand is expected to more than
double in the next fi ve years. Interfl our Vietnam
has invested $120 million in Vietnamese bulk
handling facilities, including the country’s only
dedicated grain terminal and milling facilities,
which house a state-of-the-art malt facility.
Austrade assisted Interfl our Vietnam by developing
a position paper and advocacy program to
highlight the benefi ts to Vietnamese policymakers
of liberalising tariff s on imported wheat. In
April 2012, the Vietnamese Government removed
tariff s on feed-grade wheat and, in response to
Australian representations, is considering doing
the same for milling wheat. These developments
will make Australian wheat suppliers more
price-competitive in the Vietnamese market.
Austrade is continuing to liaise closely with
stakeholders to encourage the liberalisation
of non-feed milling wheat tariff s in Vietnam.
Korea
Korea remains Australia’s third-largest goods
export market and one of Australia’s largest
sources of international students. Minerals,
energy and food dominate trade and Australia is a
longstanding and valued supplier to Korea. Korea
has concluded a number of free trade agreements,
including with the United States, European Union,
Chile and New Zealand, while negotiations
on a free trade agreement with Australia are
continuing. Austrade assists Australian exporters
to navigate this challenging market with its unique
commercial practices and cultural diff erences.
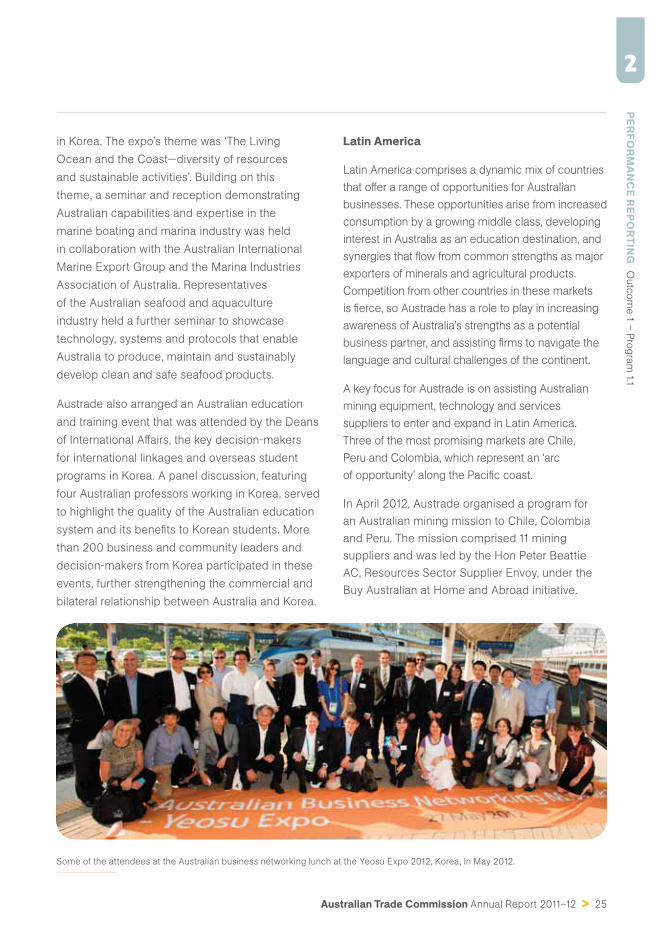
Austrade worked with the Department of Foreign
Aff airs and Trade to deliver six events at the
Australian pavilion at the Yeosu Expo 2012
Australian Trade Commission Annual Report 2011–12 > 25
PERFO
RM
AN
CE R
EPOR
TING
O
utc
om
e 1 –
Pro
gra
m 1.1
2
in Korea. The expo’s theme was ‘The Living
Ocean and the Coast—diversity of resources
and sustainable activities’. Building on this
theme, a seminar and reception demonstrating
Australian capabilities and expertise in the
marine boating and marina industry was held
in collaboration with the Australian International
Marine Export Group and the Marina Industries
Association of Australia. Representatives
of the Australian seafood and aquaculture
industry held a further seminar to showcase
technology, systems and protocols that enable
Australia to produce, maintain and sustainably
develop clean and safe seafood products.
Austrade also arranged an Australian education
and training event that was attended by the Deans
of International Aff airs, the key decision-makers
for international linkages and overseas student
programs in Korea. A panel discussion, featuring
four Australian professors working in Korea, served
to highlight the quality of the Australian education
system and its benefi ts to Korean students. More
than 200 business and community leaders and
decision-makers from Korea participated in these
events, further strengthening the commercial and
bilateral relationship between Australia and Korea.
Latin America
Latin America comprises a dynamic mix of countries
that off er a range of opportunities for Australian
businesses. These opportunities arise from increased
consumption by a growing middle class, developing
interest in Australia as an education destination, and
synergies that fl ow from common strengths as major
exporters of minerals and agricultural products.
Competition from other countries in these markets
is fi erce, so Austrade has a role to play in increasing
awareness of Australia’s strengths as a potential
business partner, and assisting fi rms to navigate the
language and cultural challenges of the continent.
A key focus for Austrade is on assisting Australian
mining equipment, technology and services
suppliers to enter and expand in Latin America.
Three of the most promising markets are Chile,
Peru and Colombia, which represent an ‘arc
of opportunity’ along the Pacifi c coast.
In April 2012, Austrade organised a program for
an Australian mining mission to Chile, Colombia
and Peru. The mission comprised 11 mining
suppliers and was led by the Hon Peter Beattie
AC, Resources Sector Supplier Envoy, under the
Buy Australian at Home and Abroad initiative.
Some of the attendees at the Australian business networking lunch at the Yeosu Expo 2012, Korea, in May 2012.
26 > Australian Trade Commission Annual Report 2011–12
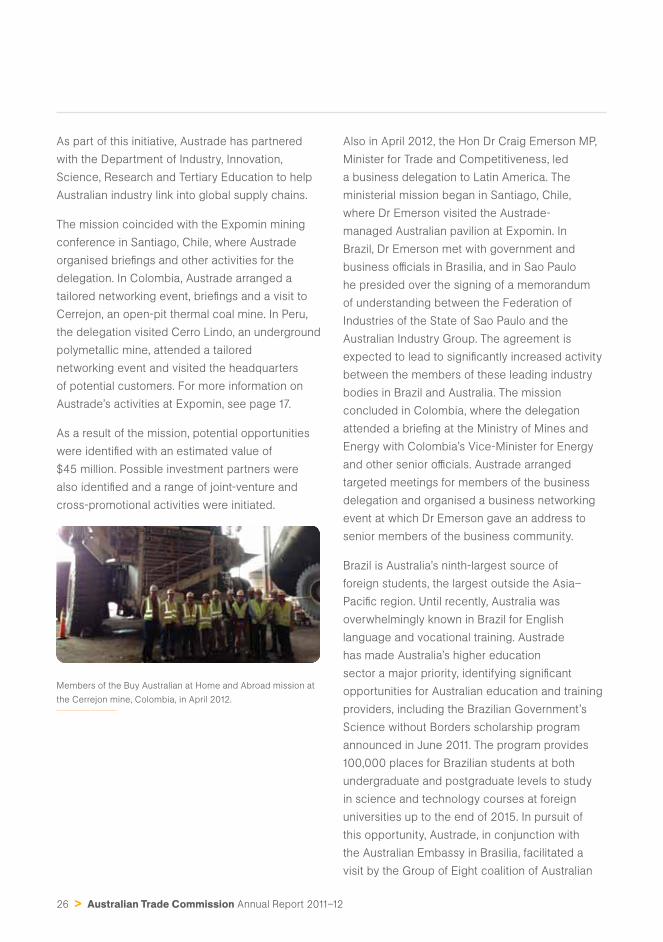
As part of this initiative, Austrade has partnered
with the Department of Industry, Innovation,
Science, Research and Tertiary Education to help
Australian industry link into global supply chains.
The mission coincided with the Expomin mining
conference in Santiago, Chile, where Austrade
organised briefi ngs and other activities for the
delegation. In Colombia, Austrade arranged a
tailored networking event, briefi ngs and a visit to
Cerrejon, an open-pit thermal coal mine. In Peru,
the delegation visited Cerro Lindo, an underground
polymetallic mine, attended a tailored
networking event and visited the headquarters
of potential customers. For more information on
Austrade’s activities at Expomin, see page 17.
As a result of the mission, potential opportunities
were identifi ed with an estimated value of
$45 million. Possible investment partners were
also identifi ed and a range of joint-venture and
cross-promotional activities were initiated.
Members of the Buy Australian at Home and Abroad mission at
the Cerrejon mine, Colombia, in April 2012.
Also in April 2012, the Hon Dr Craig Emerson MP,
Minister for Trade and Competitiveness, led
a business delegation to Latin America. The
ministerial mission began in Santiago, Chile,
where Dr Emerson visited the Austrade-
managed Australian pavilion at Expomin. In
Brazil, Dr Emerson met with government and
business offi cials in Brasilia, and in Sao Paulo
he presided over the signing of a memorandum
of understanding between the Federation of
Industries of the State of Sao Paulo and the
Australian Industry Group. The agreement is
expected to lead to signifi cantly increased activity
between the members of these leading industry
bodies in Brazil and Australia. The mission
concluded in Colombia, where the delegation
attended a briefi ng at the Ministry of Mines and
Energy with Colombia’s Vice-Minister for Energy
and other senior offi cials. Austrade arranged
targeted meetings for members of the business
delegation and organised a business networking
event at which Dr Emerson gave an address to
senior members of the business community.
Brazil is Australia’s ninth-largest source of
foreign students, the largest outside the Asia–
Pacifi c region. Until recently, Australia was
overwhelmingly known in Brazil for English
language and vocational training. Austrade
has made Australia’s higher education
sector a major priority, identifying signifi cant
opportunities for Australian education and training
providers, including the Brazilian Government’s
Science without Borders scholarship program
announced in June 2011. The program provides
100,000 places for Brazilian students at both
undergraduate and postgraduate levels to study
in science and technology courses at foreign
universities up to the end of 2015. In pursuit of
this opportunity, Austrade, in conjunction with
the Australian Embassy in Brasilia, facilitated a
visit by the Group of Eight coalition of Australian
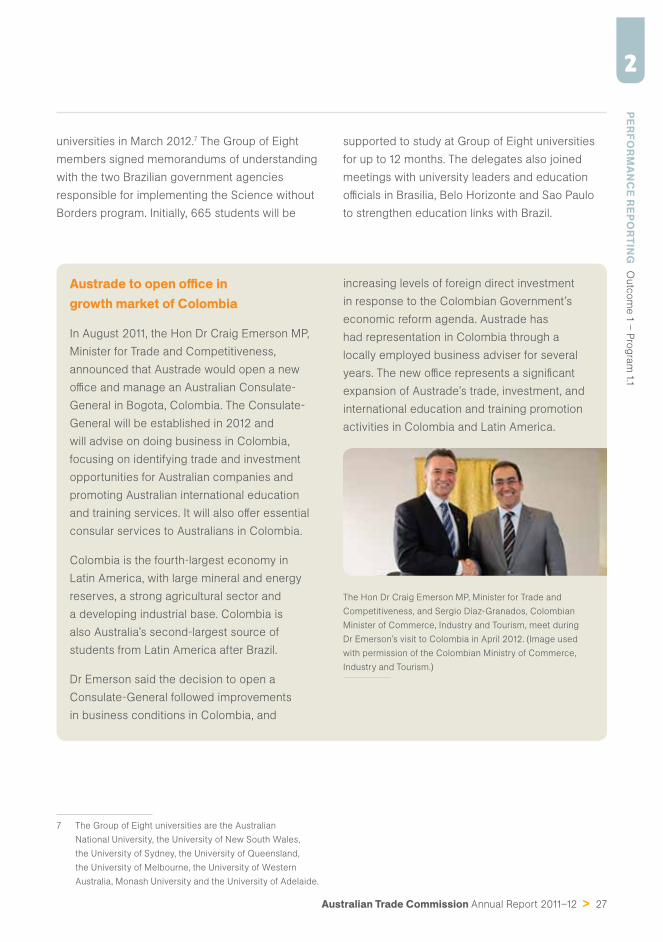
Australian Trade Commission Annual Report 2011–12 > 27
PERFO
RM
AN
CE R
EPOR
TING
O
utc
om
e 1 –
Pro
gra
m 1.1
2
universities in March 2012.7 The Group of Eight
members signed memorandums of understanding
with the two Brazilian government agencies
responsible for implementing the Science without
Borders program. Initially, 665 students will be
Austrade to open offi ce in growth market of Colombia
In August 2011, the Hon Dr Craig Emerson MP,
Minister for Trade and Competitiveness,
announced that Austrade would open a new
offi ce and manage an Australian Consulate-
General in Bogota, Colombia. The Consulate-
General will be established in 2012 and
will advise on doing business in Colombia,
focusing on identifying trade and investment
opportunities for Australian companies and
promoting Australian international education
and training services. It will also off er essential
consular services to Australians in Colombia.
Colombia is the fourth-largest economy in
Latin America, with large mineral and energy
reserves, a strong agricultural sector and
a developing industrial base. Colombia is
also Australia’s second-largest source of
students from Latin America after Brazil.
Dr Emerson said the decision to open a
Consulate-General followed improvements
in business conditions in Colombia, and
increasing levels of foreign direct investment
in response to the Colombian Government’s
economic reform agenda. Austrade has
had representation in Colombia through a
locally employed business adviser for several
years. The new offi ce represents a signifi cant
expansion of Austrade’s trade, investment, and
international education and training promotion
activities in Colombia and Latin America.
The Hon Dr Craig Emerson MP, Minister for Trade and
Competitiveness, and Sergio Díaz-Granados, Colombian
Minister of Commerce, Industry and Tourism, meet during
Dr Emerson’s visit to Colombia in April 2012. (Image used
with permission of the Colombian Ministry of Commerce,
Industry and Tourism.)
7 The Group of Eight universities are the Australian
National University, the University of New South Wales,
the University of Sydney, the University of Queensland,
the University of Melbourne, the University of Western
Australia, Monash University and the University of Adelaide.
supported to study at Group of Eight universities
for up to 12 months. The delegates also joined
meetings with university leaders and education
offi cials in Brasilia, Belo Horizonte and Sao Paulo
to strengthen education links with Brazil.
28 > Australian Trade Commission Annual Report 2011–12
Middle East
In 2011–12, markets in the Middle East continued
to face unrest. Growing aspirations across the
region created pressure for new policy responses
to drive sustainable economic development,
increase food security and better manage the
environment. Governments in the region are
also placing increased emphasis on the role of
education to cater for the needs of their young and
rapidly growing populations, and to help shape
positive social change. During the year, Austrade’s
teams in the Middle East focused on opportunities
in infrastructure, agriculture and education.
The Gulf Cooperation Council countries,
comprising the United Arab Emirates (UAE),
Saudi Arabia, Qatar, Oman, Bahrain and
Kuwait, together import more than 85 per cent
of their food requirements. These countries’
food imports are expected to double from
US$26 billion in 2010 to US$53 billion in 2020.8
For Australian exporters, opportunities in
the Gulf Cooperation Council countries exist
in most food categories, as well as in food
processing, agricultural sciences, food safety
and food security. Austrade has developed a
number of strategic market initiatives, including
participation in major industry events, to help
promote Australia as a producer of clean and
halal food. In February 2012, Austrade and
Meat & Livestock Australia coordinated over
150 Australian exhibitors, including the Victorian
Government, the Western Australian Government
and the Gold Coast City Council, as part of
Australia’s largest food trade mission to the
Gulfood 2012 trade event in Dubai. Austrade
invited customers from the Middle East, North
Africa and South Asia and secured speaking
8 Economist Intelligence Unit, The GCC in
2020: Resources for the future, 2010.
engagements at the Food Processing and
Packaging Forum and the 7th Dubai International
Food Safety Conference as part of Gulfood 2012.
Australian organic beef producer and fi rst-time
exhibitor at Gulfood, the OBE Company Pty Ltd,
won a major contract to supply Carrefour UAE.
Austrade fi rst assisted the OBE Company during
its visit to Dubai in July 2011 by organising
appointments with key distributors and retailers.
The company has since appointed distributor,
Country Hill International, to service the UAE
market and has also established networks with
major importers from Kuwait, Jordan and Qatar.
Austrade also worked closely with the Australia
Gulf Council to promote bilateral trade and
investment opportunities in the Middle East,
with a particular focus on the Gulf Cooperation
Council economies. For more information
on how Austrade has collaborated with the
Australia Gulf Council, see page 78.
In 2011–12, Austrade promoted Australian rail
capabilities in the Middle East and North Africa
as part of a major initiative in the region.
North Africa
In North Africa, Austrade continued to develop
a strategy to assist Australian agricultural
technology and services companies to access
opportunities under the Green Morocco Plan,
valued by the Moroccan Government at more than
US$15 billion. The plan is a 10-year government
initiative to develop the country’s agricultural
capacity in key areas including dry-land farming,
animal production, biosecurity and irrigation.
Other key aims include sustainable growth
of small farms and encouragement of foreign
investment to establish integrated agribusinesses.
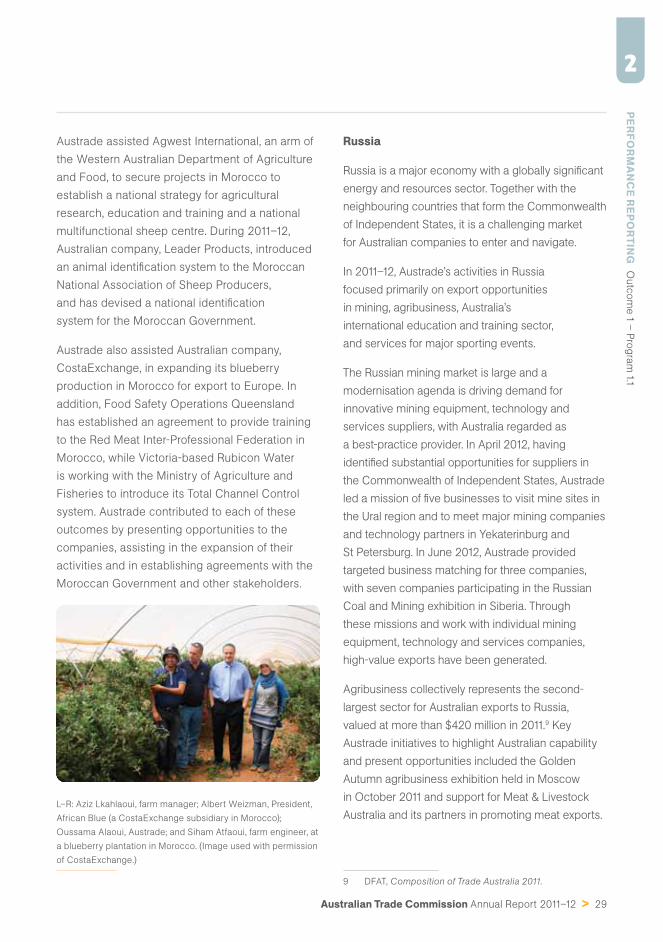
Australian Trade Commission Annual Report 2011–12 > 29
PERFO
RM
AN
CE R
EPOR
TING
O
utc
om
e 1 –
Pro
gra
m 1.1
2
Austrade assisted Agwest International, an arm of
the Western Australian Department of Agriculture
and Food, to secure projects in Morocco to
establish a national strategy for agricultural
research, education and training and a national
multifunctional sheep centre. During 2011–12,
Australian company, Leader Products, introduced
an animal identifi cation system to the Moroccan
National Association of Sheep Producers,
and has devised a national identifi cation
system for the Moroccan Government.
Austrade also assisted Australian company,
CostaExchange, in expanding its blueberry
production in Morocco for export to Europe. In
addition, Food Safety Operations Queensland
has established an agreement to provide training
to the Red Meat Inter-Professional Federation in
Morocco, while Victoria-based Rubicon Water
is working with the Ministry of Agriculture and
Fisheries to introduce its Total Channel Control
system. Austrade contributed to each of these
outcomes by presenting opportunities to the
companies, assisting in the expansion of their
activities and in establishing agreements with the
Moroccan Government and other stakeholders.
L–R: Aziz Lkahlaoui, farm manager; Albert Weizman, President,
African Blue (a CostaExchange subsidiary in Morocco);
Oussama Alaoui, Austrade; and Siham Atfaoui, farm engineer, at
a blueberry plantation in Morocco. (Image used with permission
of CostaExchange.)
Russia
Russia is a major economy with a globally signifi cant
energy and resources sector. Together with the
neighbouring countries that form the Commonwealth
of Independent States, it is a challenging market
for Australian companies to enter and navigate.
In 2011–12, Austrade’s activities in Russia
focused primarily on export opportunities
in mining, agribusiness, Australia’s
international education and training sector,
and services for major sporting events.
The Russian mining market is large and a
modernisation agenda is driving demand for
innovative mining equipment, technology and
services suppliers, with Australia regarded as
a best-practice provider. In April 2012, having
identifi ed substantial opportunities for suppliers in
the Commonwealth of Independent States, Austrade
led a mission of fi ve businesses to visit mine sites in
the Ural region and to meet major mining companies
and technology partners in Yekaterinburg and
St Petersburg. In June 2012, Austrade provided
targeted business matching for three companies,
with seven companies participating in the Russian
Coal and Mining exhibition in Siberia. Through
these missions and work with individual mining
equipment, technology and services companies,
high-value exports have been generated.
Agribusiness collectively represents the second-
largest sector for Australian exports to Russia,
valued at more than $420 million in 2011.9 Key
Austrade initiatives to highlight Australian capability
and present opportunities included the Golden
Autumn agribusiness exhibition held in Moscow
in October 2011 and support for Meat & Livestock
Australia and its partners in promoting meat exports.
9 DFAT, Composition of Trade Australia 2011.
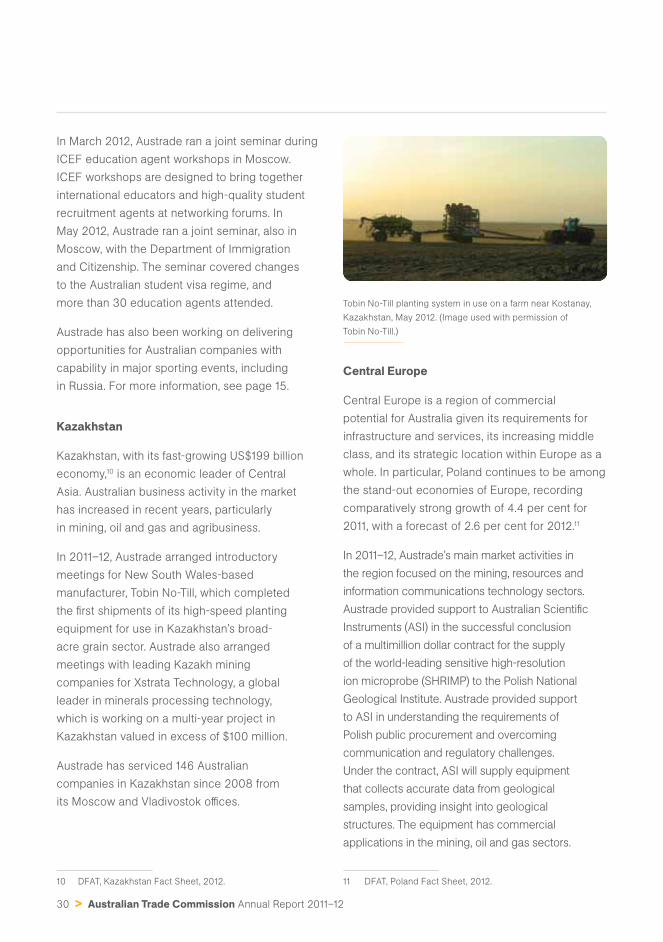
30 > Australian Trade Commission Annual Report 2011–12
In March 2012, Austrade ran a joint seminar during
ICEF education agent workshops in Moscow.
ICEF workshops are designed to bring together
international educators and high-quality student
recruitment agents at networking forums. In
May 2012, Austrade ran a joint seminar, also in
Moscow, with the Department of Immigration
and Citizenship. The seminar covered changes
to the Australian student visa regime, and
more than 30 education agents attended.
Austrade has also been working on delivering
opportunities for Australian companies with
capability in major sporting events, including
in Russia. For more information, see page 15.
Kazakhstan
Kazakhstan, with its fast-growing US$199 billion
economy,10 is an economic leader of Central
Asia. Australian business activity in the market
has increased in recent years, particularly
in mining, oil and gas and agribusiness.
In 2011–12, Austrade arranged introductory
meetings for New South Wales-based
manufacturer, Tobin No-Till, which completed
the fi rst shipments of its high-speed planting
equipment for use in Kazakhstan’s broad-
acre grain sector. Austrade also arranged
meetings with leading Kazakh mining
companies for Xstrata Technology, a global
leader in minerals processing technology,
which is working on a multi-year project in
Kazakhstan valued in excess of $100 million.
Austrade has serviced 146 Australian
companies in Kazakhstan since 2008 from
its Moscow and Vladivostok offi ces.
10 DFAT, Kazakhstan Fact Sheet, 2012.
Tobin No-Till planting system in use on a farm near Kostanay,
Kazakhstan, May 2012. (Image used with permission of
Tobin No-Till.)
Central Europe
Central Europe is a region of commercial
potential for Australia given its requirements for
infrastructure and services, its increasing middle
class, and its strategic location within Europe as a
whole. In particular, Poland continues to be among
the stand-out economies of Europe, recording
comparatively strong growth of 4.4 per cent for
2011, with a forecast of 2.6 per cent for 2012.11
In 2011–12, Austrade’s main market activities in
the region focused on the mining, resources and
information communications technology sectors.
Austrade provided support to Australian Scientifi c
Instruments (ASI) in the successful conclusion
of a multimillion dollar contract for the supply
of the world-leading sensitive high-resolution
ion microprobe (SHRIMP) to the Polish National
Geological Institute. Austrade provided support
to ASI in understanding the requirements of
Polish public procurement and overcoming
communication and regulatory challenges.
Under the contract, ASI will supply equipment
that collects accurate data from geological
samples, providing insight into geological
structures. The equipment has commercial
applications in the mining, oil and gas sectors.
11 DFAT, Poland Fact Sheet, 2012.
Australian Trade Commission Annual Report 2011–12 > 31
PERFO
RM
AN
CE R
EPOR
TING
O
utc
om
e 1 –
Pro
gra
m 1.1
2
Sub-Saharan Africa
Africa is seen by some as a frontier market
but global competition across many industry
sectors is growing at an unprecedented rate.
Austrade provides on-the-ground insights to
Australian businesses regarding projects and
supply chains where Australia has a strategic
competitive advantage. Austrade also assists in
building networks of potential business partners
and helping Australian businesses to navigate
diffi culties in the markets of the region.
Austrade’s operations in Sub-Saharan
Africa are focused primarily on identifying
mining, infrastructure, agriculture, and
international education and training
opportunities for Australian suppliers.
Vocational education opportunities aligned
to mining and infrastructure are of great
importance to Africa. The expansion of the
AusAID scholarship and sector-specifi c training
programs, along with the emergence of Australian
alumni groups, is strengthening and broadening
Australia’s reputation in this vital sector.
More than 200 Australian mining companies
have investments in nearly 600 projects across
Sub-Saharan Africa, with an estimated value
greater than $20 billion.12 Australian mining
capability in Africa is weighted towards mining
equipment, technology and services. In 2011–12,
Austrade worked with AusAID on the Australian
Government’s Mining for Development Initiative,
which aims to build resource sustainability,
governance and technical capacity across
Africa. For more information, see page 77.
12 DFAT statistics, 2011.
Australian company makes inroads into the West African mining sector
In July 2011, Australian company, Duratray
International, which manufactures
replaceable trays that reduce damage
to the original base on mining trucks,
sought Austrade’s services to help
it expand into West Africa.
Duratray International had already
received Austrade’s assistance when it
established its business in southern Africa
several years earlier. Austrade arranged
a market visit in Ghana involving site
visits to six mines, including Newmont’s
Ahafo mine, Noble Gold’s Bibiani
mine and Goldfi eld’s Tarkwa mine.
Austrade also helped Duratray International
assess potential demand for its product
in West Africa. The visit enabled
the company to identify a range of
opportunities within Ghana and follow-up
visits across West Africa are planned.
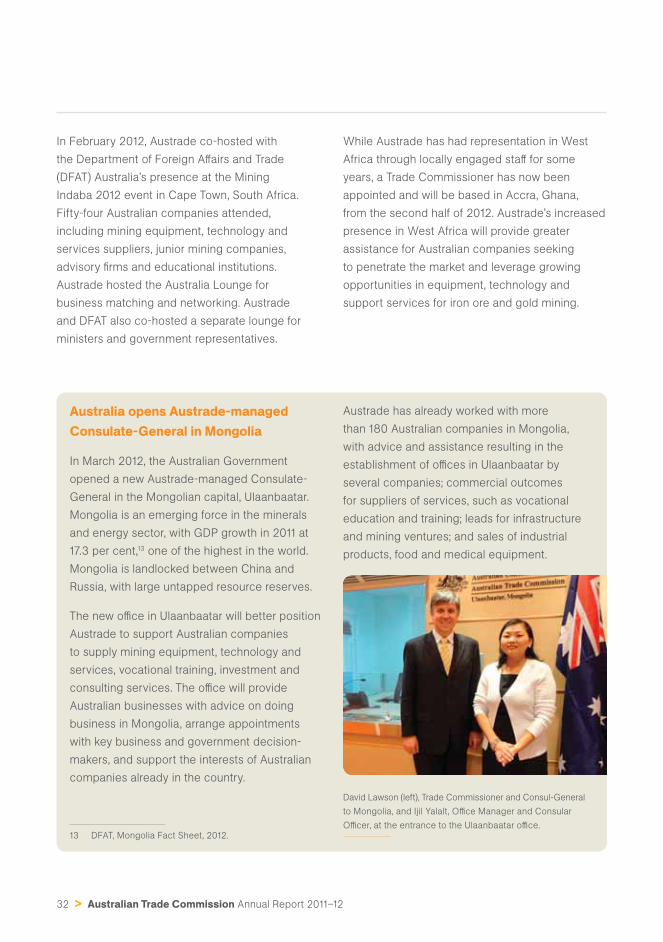
32 > Australian Trade Commission Annual Report 2011–12
In February 2012, Austrade co-hosted with
the Department of Foreign Aff airs and Trade
(DFAT) Australia’s presence at the Mining
Indaba 2012 event in Cape Town, South Africa.
Fifty-four Australian companies attended,
including mining equipment, technology and
services suppliers, junior mining companies,
advisory fi rms and educational institutions.
Austrade hosted the Australia Lounge for
business matching and networking. Austrade
and DFAT also co-hosted a separate lounge for
ministers and government representatives.
While Austrade has had representation in West
Africa through locally engaged staff for some
years, a Trade Commissioner has now been
appointed and will be based in Accra, Ghana,
from the second half of 2012. Austrade’s increased
presence in West Africa will provide greater
assistance for Australian companies seeking
to penetrate the market and leverage growing
opportunities in equipment, technology and
support services for iron ore and gold mining.
Australia opens Austrade-managed Consulate-General in Mongolia
In March 2012, the Australian Government
opened a new Austrade-managed Consulate-
General in the Mongolian capital, Ulaanbaatar.
Mongolia is an emerging force in the minerals
and energy sector, with GDP growth in 2011 at
17.3 per cent,13 one of the highest in the world.
Mongolia is landlocked between China and
Russia, with large untapped resource reserves.
The new offi ce in Ulaanbaatar will better position
Austrade to support Australian companies
to supply mining equipment, technology and
services, vocational training, investment and
consulting services. The offi ce will provide
Australian businesses with advice on doing
business in Mongolia, arrange appointments
with key business and government decision-
makers, and support the interests of Australian
companies already in the country.
13 DFAT, Mongolia Fact Sheet, 2012.
Austrade has already worked with more
than 180 Australian companies in Mongolia,
with advice and assistance resulting in the
establishment of offi ces in Ulaanbaatar by
several companies; commercial outcomes
for suppliers of services, such as vocational
education and training; leads for infrastructure
and mining ventures; and sales of industrial
products, food and medical equipment.
David Lawson (left), Trade Commissioner and Consul-General
to Mongolia, and Ijil Yalalt, Offi ce Manager and Consular
Offi cer, at the entrance to the Ulaanbaatar offi ce.
Australian Trade Commission Annual Report 2011–12 > 33
PERFO
RM
AN
CE R
EPOR
TING
O
utc
om
e 1 –
Pro
gra
m 1.1
2
A sharper focus in established markets
In established markets, such as North America
and Europe, Austrade is more sharply focused
on inward investment and international
education and training services. Austrade
makes greater use of partners, referrals and
online information and services to support
Australia’s exporters in these markets.
In 2011–12, Austrade’s inward investment activity
focused on the targeted promotion of Australia
as a destination for investment in specifi c
sectors, such as clean energy investment from
North America, and research and development
investment from Europe. Austrade also
worked in partnership with state and territory
governments to facilitate investment by other
international businesses that indicated an
interest in Australia as a potential destination.
Japan
Japan’s economic challenges also represent
long-term opportunities for renewed or expanded
engagement with Australia. These opportunities
are primarily driven by Japan’s need for minerals
and energy security, food safety and security;
responses to its ageing population and declining
productivity; Japan’s drive for technological
leadership as a competitive edge; and the
development of new markets for Japanese
exports to off set fl at domestic demand.
The high yen, slow pace of government reform
and natural disasters have added to Japan’s
challenges. Despite this, Japan remains a pivotal
trade and investment partner for Australia. In 2011,
Japan was the second-largest two-way trading
partner and second-largest export market for
Australia.14 In 2009, Australia became the third
14 DFAT, Trade at a Glance 2011.
most preferred overseas investment destination
by Japanese companies, up from eighth position
in 2008.15 Japanese foreign direct investment
has also increased substantially across Asia, with
ASEAN markets experiencing over a threefold
annual rise in Japanese investment fl ows to
$13.2 billion in 2011.16 Japanese companies are
increasingly pursuing business growth in Asia.
In 2011–12, Austrade supported Australian
participation in major Japanese infrastructure
projects in Asia by helping Australian fi rms to
fi nd Japanese partners and contribute products
and services to the projects. In September 2011,
Austrade hosted an Australia–Japan–Vietnam
trilateral business mission in Hanoi and
Ho Chi Minh City to identify opportunities for
Australian fi rms to provide services and products
to Japanese fi rms participating in infrastructure
projects in Vietnam. Austrade hosted business
forums to showcase the capabilities of Australian
fi rms in fi nancial services, engineering and
project management. Seven Australian fi rms
participated in the mission and more than
100 Japanese companies in Vietnam participated
in the forums. As a result of the mission, several
commercial leads have been identifi ed that are
currently under discussion between Australian
and Japanese companies in Vietnam.
Additionally, Japanese power companies are
boosting energy supplies with additional imports
of coal and natural gas from Australia. One of
Japan’s largest utilities companies, Kyushu Electric
15 Japan External Trade Organization statistics (2010),
foreign direct investment, by country, 1983–2009.
16 Japan External Trade Organization statistics
(2011), outward foreign direct investment fl ow.
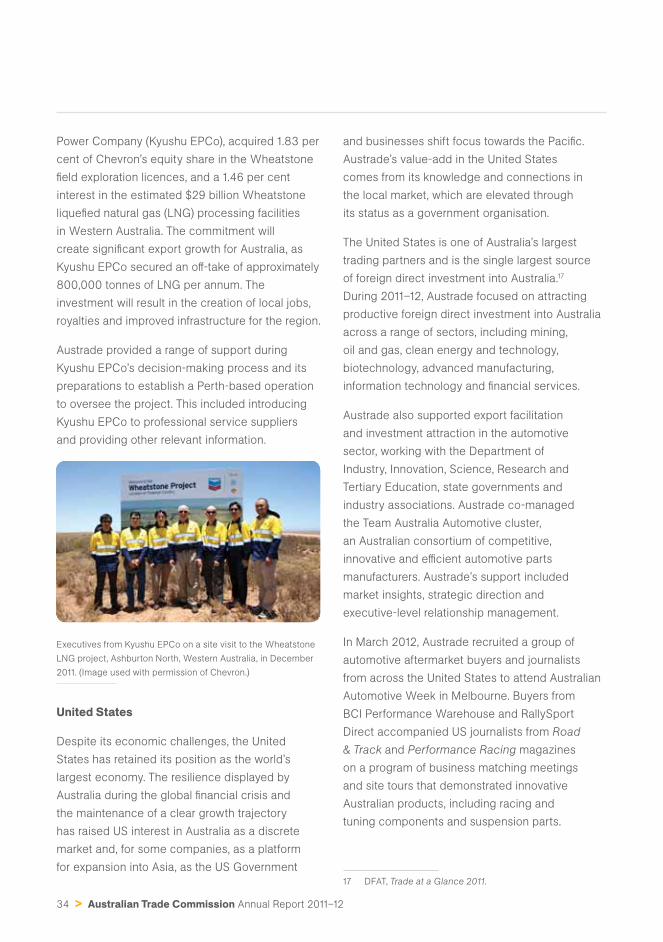
34 > Australian Trade Commission Annual Report 2011–12
Power Company (Kyushu EPCo), acquired 1.83 per
cent of Chevron’s equity share in the Wheatstone
fi eld exploration licences, and a 1.46 per cent
interest in the estimated $29 billion Wheatstone
liquefi ed natural gas (LNG) processing facilities
in Western Australia. The commitment will
create signifi cant export growth for Australia, as
Kyushu EPCo secured an off -take of approximately
800,000 tonnes of LNG per annum. The
investment will result in the creation of local jobs,
royalties and improved infrastructure for the region.
Austrade provided a range of support during
Kyushu EPCo’s decision-making process and its
preparations to establish a Perth-based operation
to oversee the project. This included introducing
Kyushu EPCo to professional service suppliers
and providing other relevant information.
Executives from Kyushu EPCo on a site visit to the Wheatstone
LNG project, Ashburton North, Western Australia, in December
2011. (Image used with permission of Chevron.)
United States
Despite its economic challenges, the United
States has retained its position as the world’s
largest economy. The resilience displayed by
Australia during the global fi nancial crisis and
the maintenance of a clear growth trajectory
has raised US interest in Australia as a discrete
market and, for some companies, as a platform
for expansion into Asia, as the US Government
and businesses shift focus towards the Pacifi c.
Austrade’s value-add in the United States
comes from its knowledge and connections in
the local market, which are elevated through
its status as a government organisation.
The United States is one of Australia’s largest
trading partners and is the single largest source
of foreign direct investment into Australia.17
During 2011–12, Austrade focused on attracting
productive foreign direct investment into Australia
across a range of sectors, including mining,
oil and gas, clean energy and technology,
biotechnology, advanced manufacturing,
information technology and fi nancial services.
Austrade also supported export facilitation
and investment attraction in the automotive
sector, working with the Department of
Industry, Innovation, Science, Research and
Tertiary Education, state governments and
industry associations. Austrade co-managed
the Team Australia Automotive cluster,
an Australian consortium of competitive,
innovative and effi cient automotive parts
manufacturers. Austrade’s support included
market insights, strategic direction and
executive-level relationship management.
In March 2012, Austrade recruited a group of
automotive aftermarket buyers and journalists
from across the United States to attend Australian
Automotive Week in Melbourne. Buyers from
BCI Performance Warehouse and RallySport
Direct accompanied US journalists from Road
& Track and Performance Racing magazines
on a program of business matching meetings
and site tours that demonstrated innovative
Australian products, including racing and
tuning components and suspension parts.
17 DFAT, Trade at a Glance 2011.
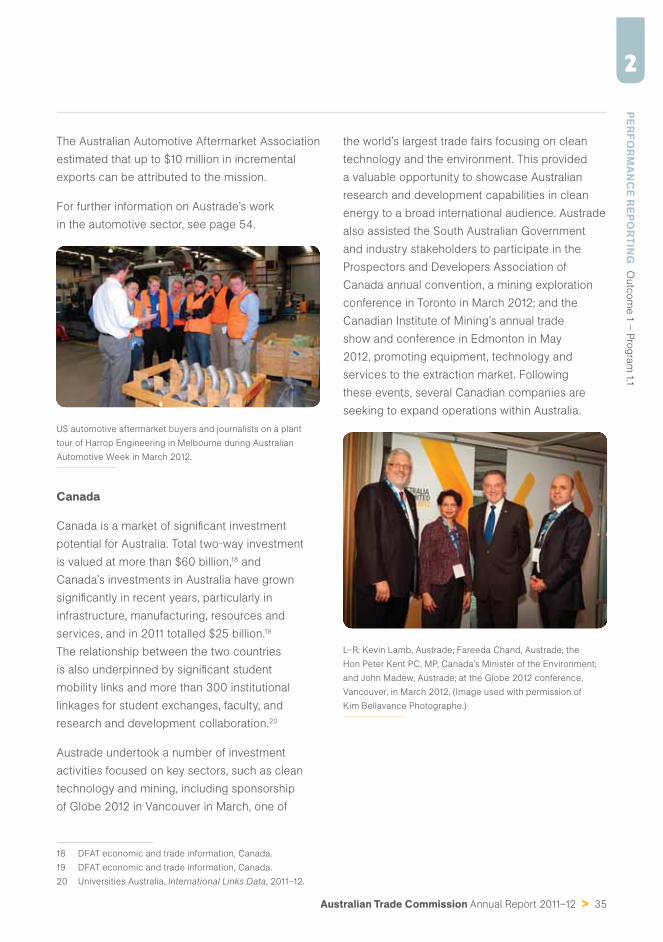
Australian Trade Commission Annual Report 2011–12 > 35
PERFO
RM
AN
CE R
EPOR
TING
O
utc
om
e 1 –
Pro
gra
m 1.1
2
The Australian Automotive Aftermarket Association
estimated that up to $10 million in incremental
exports can be attributed to the mission.
For further information on Austrade’s work
in the automotive sector, see page 54.
US automotive aftermarket buyers and journalists on a plant
tour of Harrop Engineering in Melbourne during Australian
Automotive Week in March 2012.
Canada
Canada is a market of signifi cant investment
potential for Australia. Total two-way investment
is valued at more than $60 billion,18 and
Canada’s investments in Australia have grown
signifi cantly in recent years, particularly in
infrastructure, manufacturing, resources and
services, and in 2011 totalled $25 billion.19
The relationship between the two countries
is also underpinned by signifi cant student
mobility links and more than 300 institutional
linkages for student exchanges, faculty, and
research and development collaboration.20
Austrade undertook a number of investment
activities focused on key sectors, such as clean
technology and mining, including sponsorship
of Globe 2012 in Vancouver in March, one of
18 DFAT economic and trade information, Canada.
19 DFAT economic and trade information, Canada.
20 Universities Australia, International Links Data, 2011–12.
the world’s largest trade fairs focusing on clean
technology and the environment. This provided
a valuable opportunity to showcase Australian
research and development capabilities in clean
energy to a broad international audience. Austrade
also assisted the South Australian Government
and industry stakeholders to participate in the
Prospectors and Developers Association of
Canada annual convention, a mining exploration
conference in Toronto in March 2012; and the
Canadian Institute of Mining’s annual trade
show and conference in Edmonton in May
2012, promoting equipment, technology and
services to the extraction market. Following
these events, several Canadian companies are
seeking to expand operations within Australia.
L–R: Kevin Lamb, Austrade; Fareeda Chand, Austrade; the
Hon Peter Kent PC, MP, Canada’s Minister of the Environment;
and John Madew, Austrade; at the Globe 2012 conference,
Vancouver, in March 2012. (Image used with permission of
Kim Bellavance Photographe.)
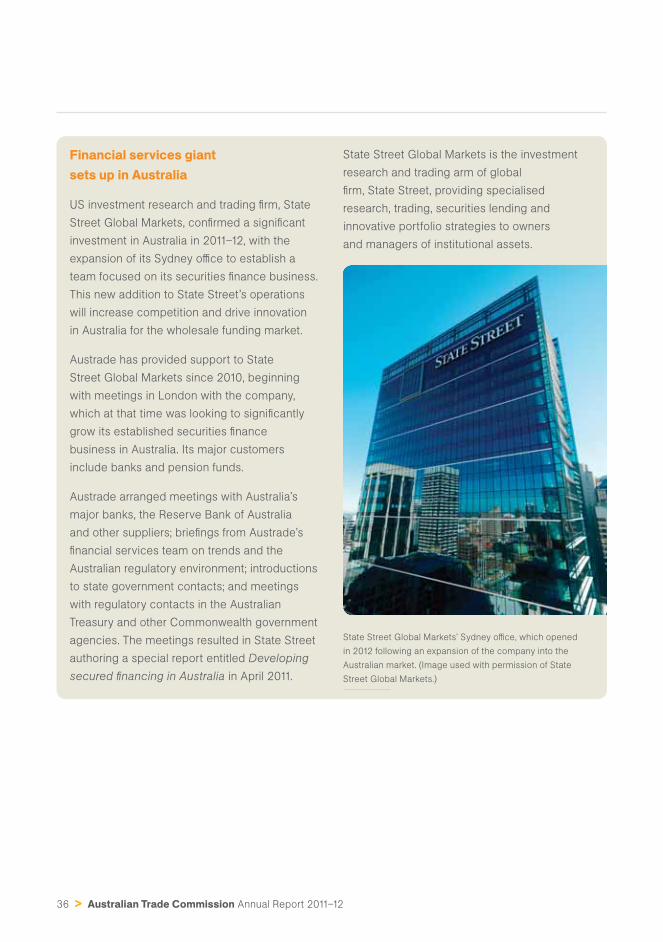
36 > Australian Trade Commission Annual Report 2011–12
Financial services giant sets up in Australia
US investment research and trading fi rm, State
Street Global Markets, confi rmed a signifi cant
investment in Australia in 2011–12, with the
expansion of its Sydney offi ce to establish a
team focused on its securities fi nance business.
This new addition to State Street’s operations
will increase competition and drive innovation
in Australia for the wholesale funding market.
Austrade has provided support to State
Street Global Markets since 2010, beginning
with meetings in London with the company,
which at that time was looking to signifi cantly
grow its established securities fi nance
business in Australia. Its major customers
include banks and pension funds.
Austrade arranged meetings with Australia’s
major banks, the Reserve Bank of Australia
and other suppliers; briefi ngs from Austrade’s
fi nancial services team on trends and the
Australian regulatory environment; introductions
to state government contacts; and meetings
with regulatory contacts in the Australian
Treasury and other Commonwealth government
agencies. The meetings resulted in State Street
authoring a special report entitled Developing
secured fi nancing in Australia in April 2011.
State Street Global Markets is the investment
research and trading arm of global
fi rm, State Street, providing specialised
research, trading, securities lending and
innovative portfolio strategies to owners
and managers of institutional assets.
State Street Global Markets’ Sydney offi ce, which opened
in 2012 following an expansion of the company into the
Australian market. (Image used with permission of State
Street Global Markets.)
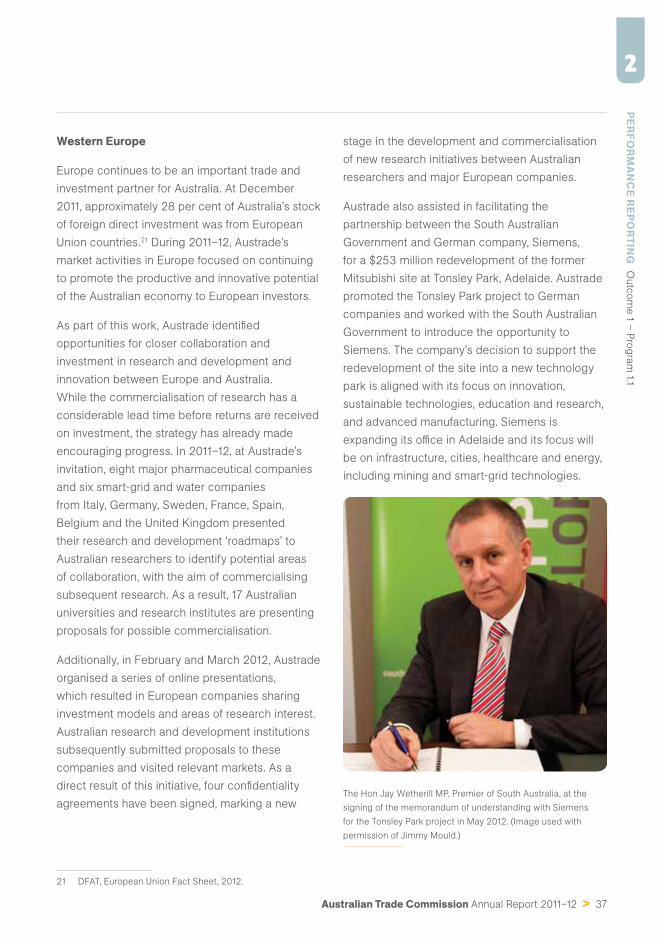
Australian Trade Commission Annual Report 2011–12 > 37
PERFO
RM
AN
CE R
EPOR
TING
O
utc
om
e 1 –
Pro
gra
m 1.1
2
Western Europe
Europe continues to be an important trade and
investment partner for Australia. At December
2011, approximately 28 per cent of Australia’s stock
of foreign direct investment was from European
Union countries.21 During 2011–12, Austrade’s
market activities in Europe focused on continuing
to promote the productive and innovative potential
of the Australian economy to European investors.
As part of this work, Austrade identifi ed
opportunities for closer collaboration and
investment in research and development and
innovation between Europe and Australia.
While the commercialisation of research has a
considerable lead time before returns are received
on investment, the strategy has already made
encouraging progress. In 2011–12, at Austrade’s
invitation, eight major pharmaceutical companies
and six smart-grid and water companies
from Italy, Germany, Sweden, France, Spain,
Belgium and the United Kingdom presented
their research and development ‘roadmaps’ to
Australian researchers to identify potential areas
of collaboration, with the aim of commercialising
subsequent research. As a result, 17 Australian
universities and research institutes are presenting
proposals for possible commercialisation.
Additionally, in February and March 2012, Austrade
organised a series of online presentations,
which resulted in European companies sharing
investment models and areas of research interest.
Australian research and development institutions
subsequently submitted proposals to these
companies and visited relevant markets. As a
direct result of this initiative, four confi dentiality
agreements have been signed, marking a new
21 DFAT, European Union Fact Sheet, 2012.
stage in the development and commercialisation
of new research initiatives between Australian
researchers and major European companies.
Austrade also assisted in facilitating the
partnership between the South Australian
Government and German company, Siemens,
for a $253 million redevelopment of the former
Mitsubishi site at Tonsley Park, Adelaide. Austrade
promoted the Tonsley Park project to German
companies and worked with the South Australian
Government to introduce the opportunity to
Siemens. The company’s decision to support the
redevelopment of the site into a new technology
park is aligned with its focus on innovation,
sustainable technologies, education and research,
and advanced manufacturing. Siemens is
expanding its offi ce in Adelaide and its focus will
be on infrastructure, cities, healthcare and energy,
including mining and smart-grid technologies.
The Hon Jay Wetherill MP, Premier of South Australia, at the
signing of the memorandum of understanding with Siemens
for the Tonsley Park project in May 2012. (Image used with
permission of Jimmy Mould.)
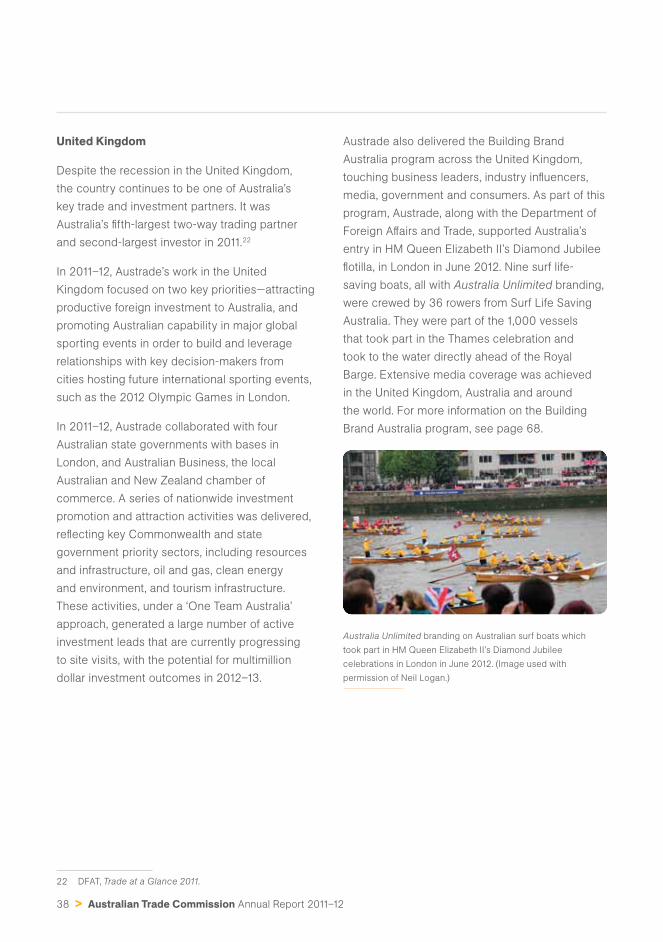
38 > Australian Trade Commission Annual Report 2011–12
United Kingdom
Despite the recession in the United Kingdom,
the country continues to be one of Australia’s
key trade and investment partners. It was
Australia’s fi fth-largest two-way trading partner
and second-largest investor in 2011.22
In 2011–12, Austrade’s work in the United
Kingdom focused on two key priorities—attracting
productive foreign investment to Australia, and
promoting Australian capability in major global
sporting events in order to build and leverage
relationships with key decision-makers from
cities hosting future international sporting events,
such as the 2012 Olympic Games in London.
In 2011–12, Austrade collaborated with four
Australian state governments with bases in
London, and Australian Business, the local
Australian and New Zealand chamber of
commerce. A series of nationwide investment
promotion and attraction activities was delivered,
refl ecting key Commonwealth and state
government priority sectors, including resources
and infrastructure, oil and gas, clean energy
and environment, and tourism infrastructure.
These activities, under a ‘One Team Australia’
approach, generated a large number of active
investment leads that are currently progressing
to site visits, with the potential for multimillion
dollar investment outcomes in 2012–13.
22 DFAT, Trade at a Glance 2011.
Austrade also delivered the Building Brand
Australia program across the United Kingdom,
touching business leaders, industry infl uencers,
media, government and consumers. As part of this
program, Austrade, along with the Department of
Foreign Aff airs and Trade, supported Australia’s
entry in HM Queen Elizabeth II’s Diamond Jubilee
fl otilla, in London in June 2012. Nine surf life-
saving boats, all with Australia Unlimited branding,
were crewed by 36 rowers from Surf Life Saving
Australia. They were part of the 1,000 vessels
that took part in the Thames celebration and
took to the water directly ahead of the Royal
Barge. Extensive media coverage was achieved
in the United Kingdom, Australia and around
the world. For more information on the Building
Brand Australia program, see page 68.
Australia Unlimited branding on Australian surf boats which
took part in HM Queen Elizabeth II’s Diamond Jubilee
celebrations in London in June 2012. (Image used with
permission of Neil Logan.)
Australian Trade Commission Annual Report 2011–12 > 39
PERFO
RM
AN
CE R
EPOR
TING
O
utc
om
e 1 –
Pro
gra
m 1.1
2
Delivering services to individual enterprises
Performance measure Outcome
Australian business
community satisfaction
with Austrade’s services.
› The Client Service Improvement Study for 2011–12 showed
85 per cent of businesses surveyed valued Austrade’s services.
› When asked to rate their dealings with Austrade in the
12 months prior to the survey, 52 per cent of respondents
rated Austrade’s service as extremely good or very good.
Eff ective collaboration
and partnerships with
stakeholders including
other Commonwealth
government agencies,
state and territory
governments, business
and industry associations
and institutions.
Note: This measure is also
reported on page 76.
› Austrade partnered with state, territory and local government and
private sector organisations through the TradeStart program to
assist Australian small and medium-sized businesses to pursue
trade, investment and education opportunities in international
markets. Austrade continued to manage the network of 31 TradeStart
advisers across metropolitan and regional Australia.
› Austrade worked closely with other Commonwealth
government agencies, and state and territory governments,
to identify and collaborate on key investment priorities.
This is discussed in more detail on page 76.
Trade services for internationally ready fi rms
Austrade’s unique value stems from the
combination of its knowledge of, and connections
in, international markets, and its status as a
government organisation. With representation in a
diverse range of international markets, Austrade’s
services are designed for those companies ready
to tackle international business opportunities.
Austrade’s services assist exporters to
expand internationally and are clustered
into the following fi ve service areas:
› information and advice on doing
business in international markets
› help with international market selection
› identifi cation of relevant international contacts
› assistance with market entry and expansion
› identifi cation and assistance with
follow-up of business opportunities.
As in previous years, the majority of businesses
receiving Austrade services were in the services
(43 per cent) and manufacturing (37 per cent)
sectors (Figure 6). Following the restructure of
the organisation, Austrade’s services are now
designed for internationally ready fi rms. For those
fi rms not ready to export, Austrade provides
information about exporting, and where to fi nd
further assistance, at www.austrade.gov.au/export.
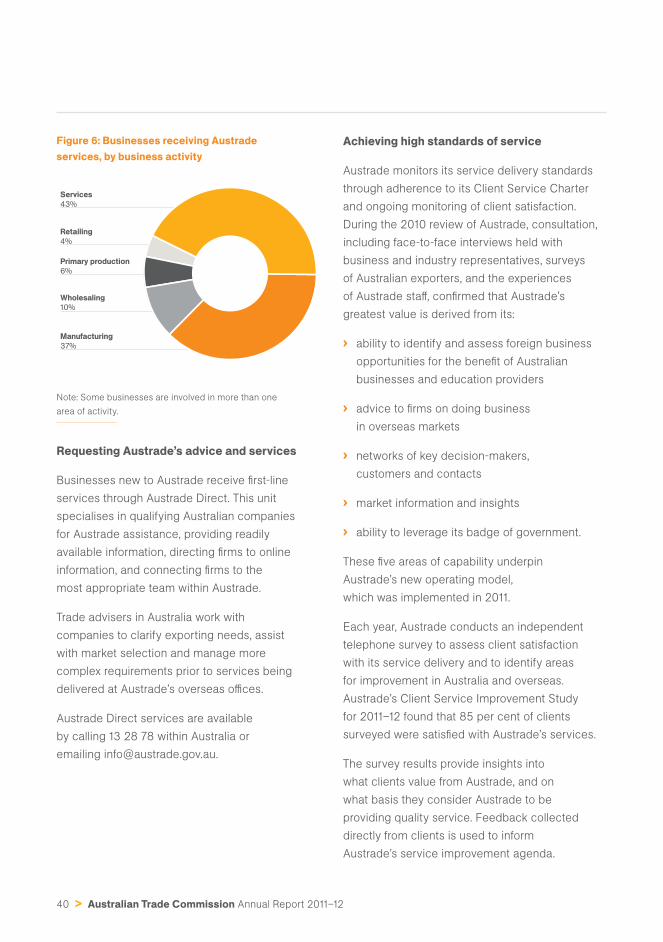
40 > Australian Trade Commission Annual Report 2011–12
Figure 6: Businesses receiving Austrade services, by business activity
Services43%
Retailing4%
Primary production6%
Wholesaling10%
Manufacturing37%
Note: Some businesses are involved in more than one
area of activity.
Requesting Austrade’s advice and services
Businesses new to Austrade receive fi rst-line
services through Austrade Direct. This unit
specialises in qualifying Australian companies
for Austrade assistance, providing readily
available information, directing fi rms to online
information, and connecting fi rms to the
most appropriate team within Austrade.
Trade advisers in Australia work with
companies to clarify exporting needs, assist
with market selection and manage more
complex requirements prior to services being
delivered at Austrade’s overseas offi ces.
Austrade Direct services are available
by calling 13 28 78 within Australia or
emailing [email protected].
Achieving high standards of service
Austrade monitors its service delivery standards
through adherence to its Client Service Charter
and ongoing monitoring of client satisfaction.
During the 2010 review of Austrade, consultation,
including face-to-face interviews held with
business and industry representatives, surveys
of Australian exporters, and the experiences
of Austrade staff , confi rmed that Austrade’s
greatest value is derived from its:
› ability to identify and assess foreign business
opportunities for the benefi t of Australian
businesses and education providers
› advice to fi rms on doing business
in overseas markets
› networks of key decision-makers,
customers and contacts
› market information and insights
› ability to leverage its badge of government.
These fi ve areas of capability underpin
Austrade’s new operating model,
which was implemented in 2011.
Each year, Austrade conducts an independent
telephone survey to assess client satisfaction
with its service delivery and to identify areas
for improvement in Australia and overseas.
Austrade’s Client Service Improvement Study
for 2011–12 found that 85 per cent of clients
surveyed were satisfi ed with Austrade’s services.
The survey results provide insights into
what clients value from Austrade, and on
what basis they consider Austrade to be
providing quality service. Feedback collected
directly from clients is used to inform
Austrade’s service improvement agenda.
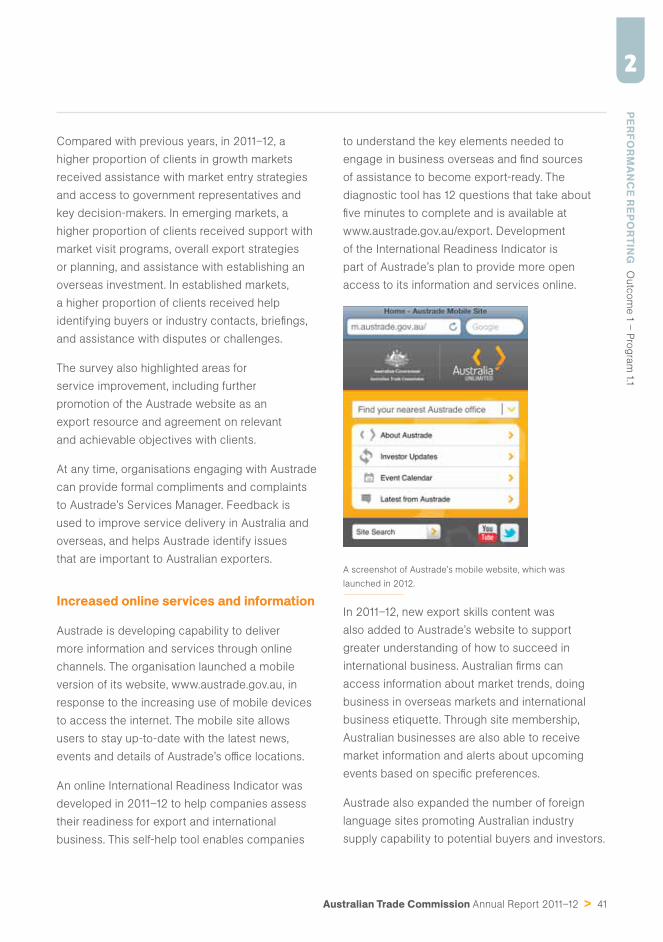
Australian Trade Commission Annual Report 2011–12 > 41
PERFO
RM
AN
CE R
EPOR
TING
O
utc
om
e 1 –
Pro
gra
m 1.1
2
Compared with previous years, in 2011–12, a
higher proportion of clients in growth markets
received assistance with market entry strategies
and access to government representatives and
key decision-makers. In emerging markets, a
higher proportion of clients received support with
market visit programs, overall export strategies
or planning, and assistance with establishing an
overseas investment. In established markets,
a higher proportion of clients received help
identifying buyers or industry contacts, briefi ngs,
and assistance with disputes or challenges.
The survey also highlighted areas for
service improvement, including further
promotion of the Austrade website as an
export resource and agreement on relevant
and achievable objectives with clients.
At any time, organisations engaging with Austrade
can provide formal compliments and complaints
to Austrade’s Services Manager. Feedback is
used to improve service delivery in Australia and
overseas, and helps Austrade identify issues
that are important to Australian exporters.
Increased online services and information
Austrade is developing capability to deliver
more information and services through online
channels. The organisation launched a mobile
version of its website, www.austrade.gov.au, in
response to the increasing use of mobile devices
to access the internet. The mobile site allows
users to stay up-to-date with the latest news,
events and details of Austrade’s offi ce locations.
An online International Readiness Indicator was
developed in 2011–12 to help companies assess
their readiness for export and international
business. This self-help tool enables companies
to understand the key elements needed to
engage in business overseas and fi nd sources
of assistance to become export-ready. The
diagnostic tool has 12 questions that take about
fi ve minutes to complete and is available at
www.austrade.gov.au/export. Development
of the International Readiness Indicator is
part of Austrade’s plan to provide more open
access to its information and services online.
A screenshot of Austrade’s mobile website, which was
launched in 2012.
In 2011–12, new export skills content was
also added to Austrade’s website to support
greater understanding of how to succeed in
international business. Australian fi rms can
access information about market trends, doing
business in overseas markets and international
business etiquette. Through site membership,
Australian businesses are also able to receive
market information and alerts about upcoming
events based on specifi c preferences.
Austrade also expanded the number of foreign
language sites promoting Australian industry
supply capability to potential buyers and investors.
42 > Australian Trade Commission Annual Report 2011–12
Local language sites were developed for China,
Germany, Hong Kong, Italy, Japan, Korea, the
Middle East, Mongolia, Russia, Singapore,
Spain, the Czech Republic and Poland.
Overseas buyers continue to access the Australian
Suppliers Database through the Austrade website,
where they can search for products and services
provided by Australian companies, as well as
reports and directories containing information
about Australian industry supply capability.
Enhancements to the Austrade website were also
made to promote Australia as a foreign investment
destination. A new interactive map with key data
and information relevant to the interests of foreign
investors was launched. An investment guide that
provides potential investors with answers to the
most common questions was also developed.
The World Bank, in its Global investment
promotion best practices 2012 report, rated
Austrade’s investment website the best in terms
of its promotional eff ectiveness among OECD
countries. The same survey also rated the site
as ‘world’s best practice’ and ranked it third out
of 187 investment promotion agency websites.
A new microsite, www.tourisminvestment.
com.au, was also developed by Austrade in
partnership with Tourism Australia and the
Department of Resources, Energy and Tourism,
to promote tourism infrastructure investment
in Australia. The new site creates a single
destination for potential foreign investors to
access information about tourism infrastructure
investment opportunities in Australia.
In 2011–12, there were 1,358,252 visits to the
Austrade website and 4,152,676 page views.
Austrade also maintains a number of corporate
social media presences, including an Austrade-
branded YouTube channel, the @Austrade Twitter
account, a LinkedIn profi le and a Flickr account.
Most social media presences are targeted to a
particular industry or market, such as the Austrade
‘Mining to Latin America’ group on LinkedIn.
Partners and referrals
In 2011–12, Austrade worked to build stronger,
more targeted and focused partnerships to
achieve a more contemporary approach to
service delivery. To help facilitate this, new
principles and business processes governing
Austrade’s establishment of partnerships,
service provider relationships and alliances
were developed. Collaborating and sharing
through Austrade’s key relationships will
provide more eff ective service delivery.
A more disciplined approach will result in the
establishment of a smaller number of partnering
arrangements. These arrangements will be
grounded in shared objectives and mutual
interest. Austrade is focused on enhanced and
practical collaboration with other government
and private sector service providers in Australia.
These organisations may be better placed
to deliver opportunities or develop export
capability to the benefi t of Australian fi rms.
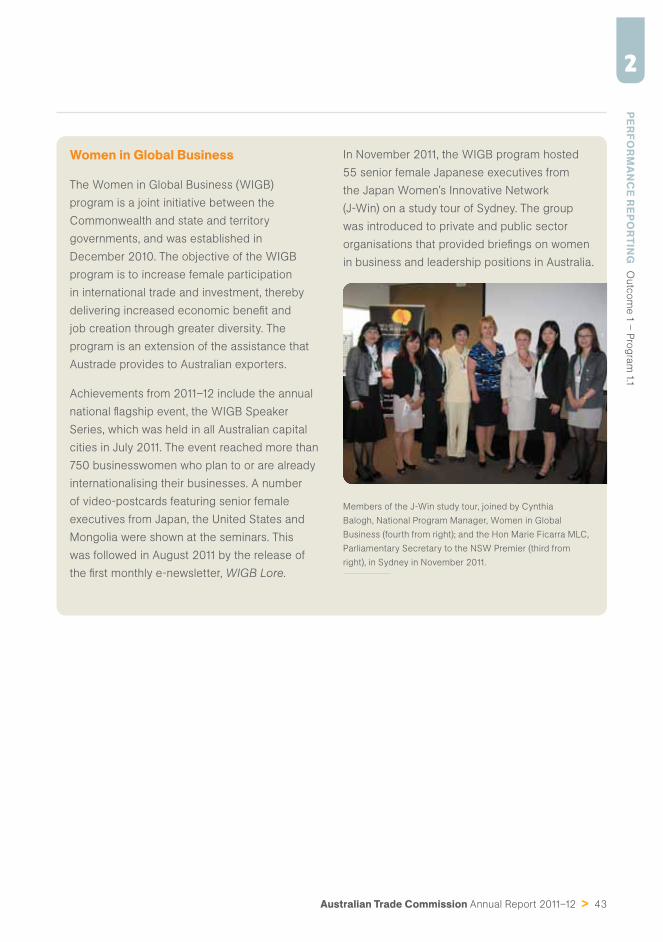
Australian Trade Commission Annual Report 2011–12 > 43
PERFO
RM
AN
CE R
EPOR
TING
O
utc
om
e 1 –
Pro
gra
m 1.1
2
Women in Global Business
The Women in Global Business (WIGB)
program is a joint initiative between the
Commonwealth and state and territory
governments, and was established in
December 2010. The objective of the WIGB
program is to increase female participation
in international trade and investment, thereby
delivering increased economic benefi t and
job creation through greater diversity. The
program is an extension of the assistance that
Austrade provides to Australian exporters.
Achievements from 2011–12 include the annual
national fl agship event, the WIGB Speaker
Series, which was held in all Australian capital
cities in July 2011. The event reached more than
750 businesswomen who plan to or are already
internationalising their businesses. A number
of video-postcards featuring senior female
executives from Japan, the United States and
Mongolia were shown at the seminars. This
was followed in August 2011 by the release of
the fi rst monthly e-newsletter, WIGB Lore.
In November 2011, the WIGB program hosted
55 senior female Japanese executives from
the Japan Women’s Innovative Network
(J-Win) on a study tour of Sydney. The group
was introduced to private and public sector
organisations that provided briefi ngs on women
in business and leadership positions in Australia.
Members of the J-Win study tour, joined by Cynthia
Balogh, National Program Manager, Women in Global
Business (fourth from right); and the Hon Marie Ficarra MLC,
Parliamentary Secretary to the NSW Premier (third from
right), in Sydney in November 2011.
44 > Australian Trade Commission Annual Report 2011–12
TradeStart
Austrade manages the TradeStart network of
export advisers across 31 locations in metropolitan
and regional Australia. TradeStart provides wider
access to Austrade’s trade, investment and
education services. It extends services provided
to Australian fi rms and institutions through
delivery of these services by state, territory
and local governments and industry bodies.
Section 23AF of the Income Tax Assessment Act 1936
Austrade works with the Australian Taxation
Offi ce to administer the income tax
exemption available under section 23AF of
the Income Tax Assessment Act 1936.
Since 1980, section 23AF of the Act has
provided an exemption from Australian
income tax for the earnings of Australian
individuals while working overseas on
‘approved projects’ for more than 91 days.
Section 23AF can assist the international
competitiveness of Australian companies
and government organisations competing to
win international tenders. This is achieved by
granting an exemption from Australian income
tax for the earnings of Australian individuals
while working overseas on approved projects.
Since 1996, the Minister for Trade and
Competitiveness has delegated to Austrade
the power to determine which projects are
eligible for the purposes of the exemption.
In 2011–12, a total of 224 applications
were submitted by 39 applicants,23 with
193 granted an approval for exemption,
compared to 218 applications, 33 applicants
and 196 approvals in the previous year.
A total of 1,063 applications have been
granted approval during the past six years,
with the majority of applications received
from education and training, engineering and
consulting businesses. Of those approved
applications, 25 per cent of applicants have
indicated that they have been successful in
securing contracts worth $5.82 billion.
23 Section 23AF applicants can submit
multiple applications for approval.
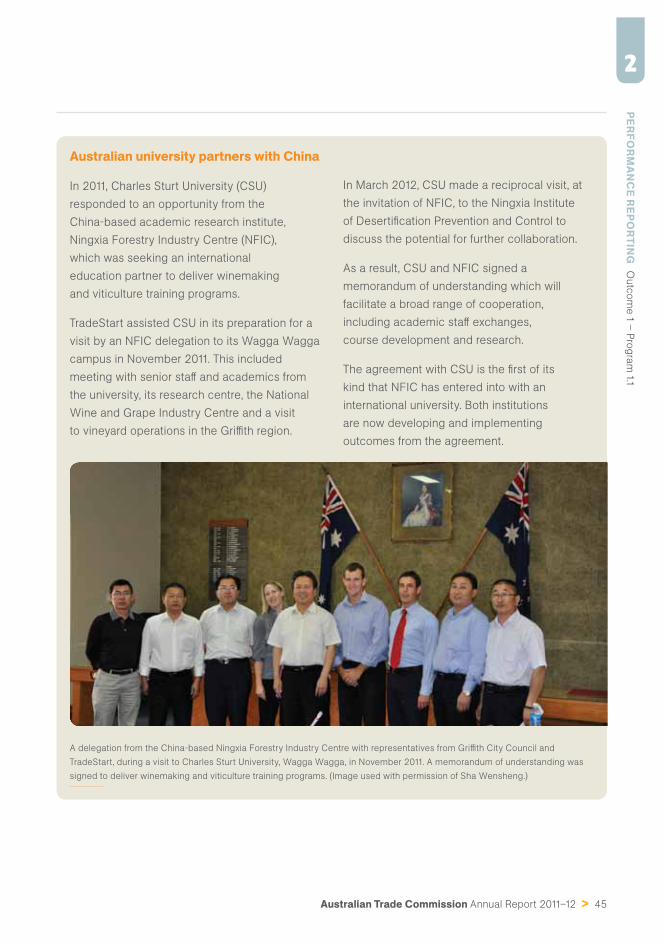
Australian Trade Commission Annual Report 2011–12 > 45
PERFO
RM
AN
CE R
EPOR
TING
O
utc
om
e 1 –
Pro
gra
m 1.1
2
Australian university partners with China
In 2011, Charles Sturt University (CSU)
responded to an opportunity from the
China-based academic research institute,
Ningxia Forestry Industry Centre (NFIC),
which was seeking an international
education partner to deliver winemaking
and viticulture training programs.
TradeStart assisted CSU in its preparation for a
visit by an NFIC delegation to its Wagga Wagga
campus in November 2011. This included
meeting with senior staff and academics from
the university, its research centre, the National
Wine and Grape Industry Centre and a visit
to vineyard operations in the Griffi th region.
In March 2012, CSU made a reciprocal visit, at
the invitation of NFIC, to the Ningxia Institute
of Desertifi cation Prevention and Control to
discuss the potential for further collaboration.
As a result, CSU and NFIC signed a
memorandum of understanding which will
facilitate a broad range of cooperation,
including academic staff exchanges,
course development and research.
The agreement with CSU is the fi rst of its
kind that NFIC has entered into with an
international university. Both institutions
are now developing and implementing
outcomes from the agreement.
A delegation from the China-based Ningxia Forestry Industry Centre with representatives from Griffi th City Council and
TradeStart, during a visit to Charles Sturt University, Wagga Wagga, in November 2011. A memorandum of understanding was
signed to deliver winemaking and viticulture training programs. (Image used with permission of Sha Wensheng.)
46 > Australian Trade Commission Annual Report 2011–12
Marketing Australian education internationally
Performance measure Outcome
Eff ective international
marketing of Australia’s
education services, in
cooperation with relevant
education institutions
and stakeholders.
During 2011–12, Austrade was involved in a wide range
of activities to eff ectively market and promote Australian
education and training internationally, including:
› provision of market intelligence through the subscription-based
Market Information Package and Austrade’s free fortnightly
e-newsletter, Global Education News, and market briefi ngs
through videoconferences, ‘webinars’ and education seminars
› promotion of the new brand for Australian international education
and training, Future Unlimited, through its use at major events
off shore; the development, launch and rollout of a Future Unlimited
video in February 2012; and promotion of the use of the new brand
by the Australian international education and training sector
› ongoing redevelopment of the Study in Australia website,
www.studyinaustralia.gov.au, involving workshops with the international
education and training sector, migration of all foreign language variants,
user needs analysis and research and competitor country analysis
› showcasing and supporting Australian alumni in key global
markets, including the celebration of 60 years of Australian alumni
in Malaysia, and the 2011 Australia–China Alumni Awards
› regular in-market engagement with education agents,
including workshops on changes to the student visa
program, surveys of education agents, newsletters and
supervision of education agent training tests
› prioritisation of transnational education with increased opportunity
identifi cation and targeted research for the sector, including research
on transnational education program approval and pricing in China
› key stakeholder engagement through representation on the
Joint Committee on International Education, a Commonwealth,
state and territory government senior offi cials committee;
the Education Visa Consultative Committee; and ongoing
work with education and training sector peak bodies
› provision of tailored services to individual education and training
providers by the Austrade network. Services have included partner
searches, business matching and the development of in-market
appointment programs for visiting institutions and stakeholders.
Australian Trade Commission Annual Report 2011–12 > 47
PERFO
RM
AN
CE R
EPOR
TING
O
utc
om
e 1 –
Pro
gra
m 1.1
2
Austrade’s international education and training framework
In 2011, there were 555,152 international
student enrolments in Australia,24 across
the higher education, vocational education
and training, English language and schools
sectors. International education was Australia’s
fourth-largest export sector and largest
services export sector, worth $15.7 billion25
to the Australian economy in 2011.
Austrade’s support to the international
education and training sector is guided by
a framework for the international marketing
and promotion of Australian education and
training. The framework (endorsed by the
Hon Dr Craig Emerson MP, Minister for Trade
and Competitiveness, in 2011) was developed
following consultation with the education and
training sector, Australian Government agencies
and state and territory governments. It aims to
help reposition Australia as a provider of high-
quality education services; contribute to the
growth of demand for Australian education;
and assist in building a sustainable Australian
international education and training sector.
Austrade has worked with the sector to achieve
these objectives by focusing on fi ve key priorities:
› working to improve perceptions of
Australia’s international education
and training sector off shore
› implementing an eff ective
communications and media strategy
› executing an eff ective engagement
strategy with off shore education agents
24 Australian Education International,
International Student Data 2011.
25 ABS, International Trade in Goods and
Services, Australia, March 2012.
› delivering high-quality and timely market
research, intelligence and services to the
international education and training sector
› undertaking eff ective stakeholder
engagement with key government and non-
government organisations, and individual
institutions, both onshore and off shore.
Improving perceptions of Australia’s international education sector off shore
As highlighted in Austrade’s 2010–11 Annual
Report, a key outcome in the previous year
was the release of a new brand for Australia’s
international education sector, Future
Unlimited. This followed extensive research
undertaken in 2009–10 through the Building
Brand Australia program (see page 68) which
showed that the quality and achievements of
Australia’s education sector were undervalued
internationally. Future Unlimited changes the
international promotion of Australian education
from a focus on the experience of studying and
living in Australia to highlighting the outcomes
and global career opportunities delivered
by an Australian education and showcases
Australia as an innovative and creative nation.
Following the launch of Future Unlimited
in June 2011 by the Hon Justine Elliot MP,
Parliamentary Secretary for Trade, Austrade
promoted the new brand across international
markets and the international education
and training sector. This included expanded
collateral and brand templates for use by
Austrade and the sector, and the launching
of a promotional video in February 2012.
48 > Australian Trade Commission Annual Report 2011–12
There was widespread media coverage of the
launch of the Future Unlimited video, which has
since been translated into 10 other languages,
with strong support from Australia-based media
and media across all major markets off shore.
In 2011–12, Austrade increased the education and
training sector’s understanding and use of the
Future Unlimited brand through the development
and promotion of new brand guidelines and
assets, and making these available to the sector
through formal brand licensing agreements. This
has included promotion in Austrade’s international
education and training e-newsletter, Global
Education News, as well as a series of brand
information sessions held in April 2012, which
were attended by more than 260 representatives
from more than 170 organisations. At 30 June
2012, Austrade had provided brand licences
to 187 organisations—142 were Australian and
45 were internationally based—and a further
19 licences were pending signature by the
applicant. Licensed Australian educational
institutions accounted for around 44 per cent
of 2011 international student enrolments.
Alumni play an important part in promoting
the Future Unlimited brand message overseas.
Austrade’s alumni events showcase the
opportunities that can be gained from an
Australian education and recognise key academic
achievements and contributions made by
Australian alumni in their respective countries.
In 2011–12, Austrade supported alumni events,
including the celebration of 60 years of
Australian alumni in Malaysia, the 2011 Australia–
China Alumni Awards, and the Australian
Alumni Excellence Awards in Sri Lanka.
Implementing an eff ective communications and media strategy
Austrade is responsible for the Study in
Australia website, www.studyinaustralia.gov.au.
This is recognised as the authoritative
source of comprehensive, up-to-date and
accurate information for prospective and
existing international students under
the Council of Australian Governments’
International Student Strategy for Australia.
Since Austrade launched the new Study in
Australia website with the Future Unlimited brand
in July 2011, there has been a steady increase in
daily site visits, from 4,500 per day in July 2011
to 6,100 by 30 June 2012. This increase refl ects
Austrade’s expanded marketing activities on
the website, off shore events and campaigns,
the release of the Future Unlimited video, and
consolidation of a number of off shore websites.
In the coming year, Austrade will redevelop
the website to better target both existing and
prospective international students. This project
will create a more contemporary, engaging
and interactive website to better position
Australian education and training internationally
and meet the expectations of users. To ensure
that these objectives are achieved, Austrade
has undertaken user needs analysis with
international students and key infl uencers, as
well as workshops with Australia’s international
education and training sector. In May and
June 2012, Austrade reviewed key competitor
websites and tested a new website structure
with international students and stakeholders.
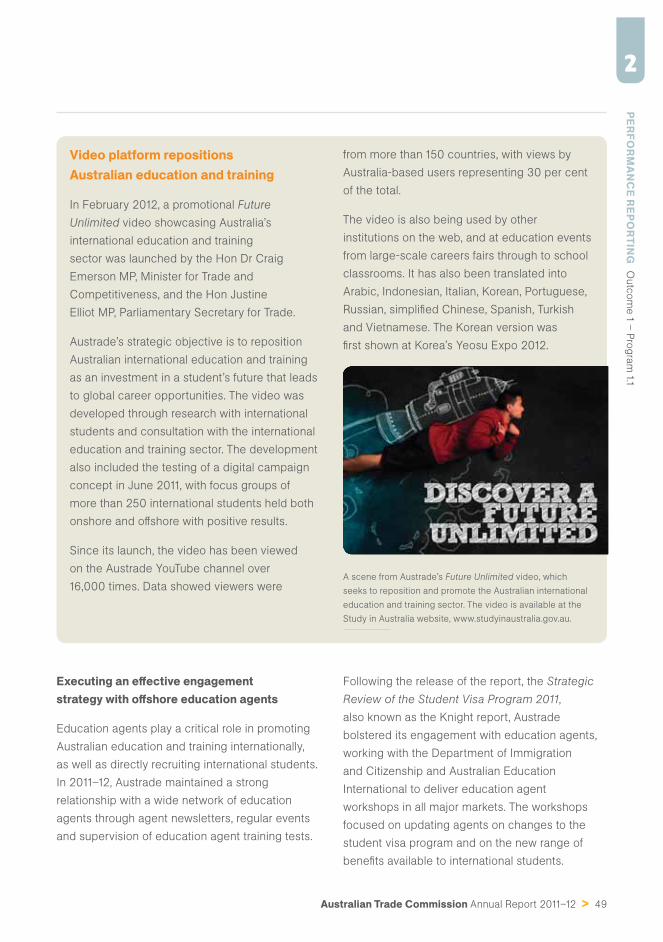
Australian Trade Commission Annual Report 2011–12 > 49
PERFO
RM
AN
CE R
EPOR
TING
O
utc
om
e 1 –
Pro
gra
m 1.1
2
Video platform repositions Australian education and training
In February 2012, a promotional Future
Unlimited video showcasing Australia’s
international education and training
sector was launched by the Hon Dr Craig
Emerson MP, Minister for Trade and
Competitiveness, and the Hon Justine
Elliot MP, Parliamentary Secretary for Trade.
Austrade’s strategic objective is to reposition
Australian international education and training
as an investment in a student’s future that leads
to global career opportunities. The video was
developed through research with international
students and consultation with the international
education and training sector. The development
also included the testing of a digital campaign
concept in June 2011, with focus groups of
more than 250 international students held both
onshore and off shore with positive results.
Since its launch, the video has been viewed
on the Austrade YouTube channel over
16,000 times. Data showed viewers were
from more than 150 countries, with views by
Australia-based users representing 30 per cent
of the total.
The video is also being used by other
institutions on the web, and at education events
from large-scale careers fairs through to school
classrooms. It has also been translated into
Arabic, Indonesian, Italian, Korean, Portuguese,
Russian, simplifi ed Chinese, Spanish, Turkish
and Vietnamese. The Korean version was
fi rst shown at Korea’s Yeosu Expo 2012.
A scene from Austrade’s Future Unlimited video, which
seeks to reposition and promote the Australian international
education and training sector. The video is available at the
Study in Australia website, www.studyinaustralia.gov.au.
Executing an eff ective engagement strategy with off shore education agents
Education agents play a critical role in promoting
Australian education and training internationally,
as well as directly recruiting international students.
In 2011–12, Austrade maintained a strong
relationship with a wide network of education
agents through agent newsletters, regular events
and supervision of education agent training tests.
Following the release of the report, the Strategic
Review of the Student Visa Program 2011,
also known as the Knight report, Austrade
bolstered its engagement with education agents,
working with the Department of Immigration
and Citizenship and Australian Education
International to deliver education agent
workshops in all major markets. The workshops
focused on updating agents on changes to the
student visa program and on the new range of
benefi ts available to international students.
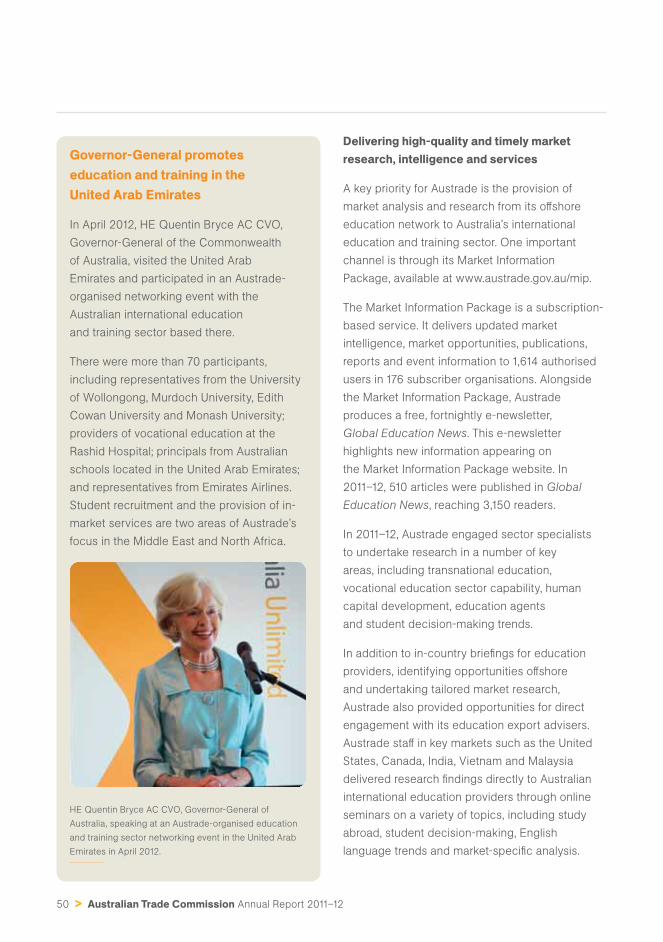
50 > Australian Trade Commission Annual Report 2011–12
Governor-General promotes education and training in the United Arab Emirates
In April 2012, HE Quentin Bryce AC CVO,
Governor-General of the Commonwealth
of Australia, visited the United Arab
Emirates and participated in an Austrade-
organised networking event with the
Australian international education
and training sector based there.
There were more than 70 participants,
including representatives from the University
of Wollongong, Murdoch University, Edith
Cowan University and Monash University;
providers of vocational education at the
Rashid Hospital; principals from Australian
schools located in the United Arab Emirates;
and representatives from Emirates Airlines.
Student recruitment and the provision of in-
market services are two areas of Austrade’s
focus in the Middle East and North Africa.
HE Quentin Bryce AC CVO, Governor-General of
Australia, speaking at an Austrade-organised education
and training sector networking event in the United Arab
Emirates in April 2012.
Delivering high-quality and timely market research, intelligence and services
A key priority for Austrade is the provision of
market analysis and research from its off shore
education network to Australia’s international
education and training sector. One important
channel is through its Market Information
Package, available at www.austrade.gov.au/mip.
The Market Information Package is a subscription-
based service. It delivers updated market
intelligence, market opportunities, publications,
reports and event information to 1,614 authorised
users in 176 subscriber organisations. Alongside
the Market Information Package, Austrade
produces a free, fortnightly e-newsletter,
Global Education News. This e-newsletter
highlights new information appearing on
the Market Information Package website. In
2011–12, 510 articles were published in Global
Education News, reaching 3,150 readers.
In 2011–12, Austrade engaged sector specialists
to undertake research in a number of key
areas, including transnational education,
vocational education sector capability, human
capital development, education agents
and student decision-making trends.
In addition to in-country briefi ngs for education
providers, identifying opportunities off shore
and undertaking tailored market research,
Austrade also provided opportunities for direct
engagement with its education export advisers.
Austrade staff in key markets such as the United
States, Canada, India, Vietnam and Malaysia
delivered research fi ndings directly to Australian
international education providers through online
seminars on a variety of topics, including study
abroad, student decision-making, English
language trends and market-specifi c analysis.
Australian Trade Commission Annual Report 2011–12 > 51
PERFO
RM
AN
CE R
EPOR
TING
O
utc
om
e 1 –
Pro
gra
m 1.1
2
Austrade staff also provided briefi ngs and sector
intelligence at a number of conferences and
seminars, including the TAFE Directors Australia
conference, the English Australia conference and
the Australian International Education conference.
Topics covered included marketing and promotion
opportunities and challenges in international
education, and English language opportunities
in Japan in the area of global human capital.
Moving on a new market trend in Japan
Japan’s prolonged period of slow economic
growth has been the driving factor behind
an unprecedented expansion by Japanese
companies into the growth markets of Asia.
Critical to each company’s success is a
globally literate workforce capable of growing
business internationally. As such, a defi cit
of so-called ‘global human capital’ presents
Japan with the challenge of how to transform
its workforce in order to perform fl exibly
and successfully in a global economy.
Austrade’s identifi cation of emerging trends
in Japan’s professional development needs
has opened up new market potential for
Australian education and training providers.
In collaboration with Tourism Australia,
Australian Education International and state
and territory governments, Austrade is using
its in-market networks and its badge of
government to access decision-makers in
human resource training and development, and
to gain recognition for Australia as the logical
destination for Japan’s overseas training needs.
Since February 2012, Fujitsu, a leading
multinational information technology equipment
and services company, has sent 12 of its
engineers to Australia to undertake fi ve-week
business-focused English language courses.
The Institute of Languages at the University of
New South Wales, the Institute of Continuing
& TESOL Education at the University of
Queensland, and OISE Sydney hosted the
Fujitsu employees as part of a pilot program.
In the coming year, Fujitsu will continue with
the program and will expand the number of
employees who undertake courses in Australia.
Austrade is also raising the profi le of Australian
international education and training providers
and reaching a wider audience by engaging
with leading domestic human resources training
companies in Japan. In March 2012, Austrade
arranged a familiarisation tour of Australia
for the Japanese company, Alue, a human
resources training provider with more than
400 clients, including blue-chip companies.
The tour visited 11 Australian education
providers and Alue is actively promoting
each of these institutions to its client base.
Austrade plays a central role in attracting
Australian international education and
training providers to this emerging market
opportunity, as well as in raising the profi le
of Australian capabilities to the Japanese
corporate sector. Austrade has also
begun exploring other markets in Asia for
global human capital development.
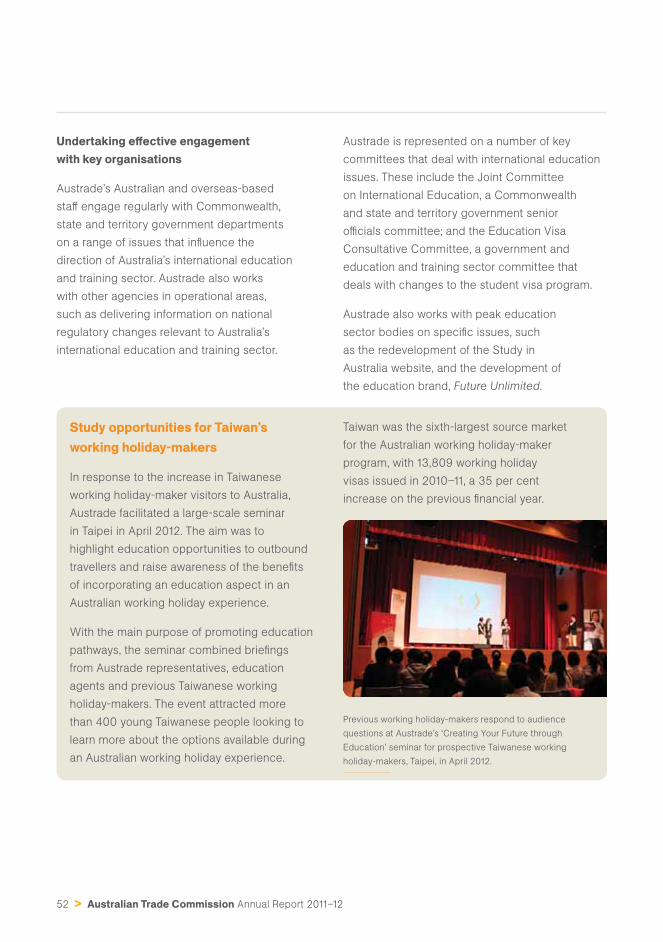
52 > Australian Trade Commission Annual Report 2011–12
Undertaking eff ective engagement with key organisations
Austrade’s Australian and overseas-based
staff engage regularly with Commonwealth,
state and territory government departments
on a range of issues that infl uence the
direction of Australia’s international education
and training sector. Austrade also works
with other agencies in operational areas,
such as delivering information on national
regulatory changes relevant to Australia’s
international education and training sector.
Austrade is represented on a number of key
committees that deal with international education
issues. These include the Joint Committee
on International Education, a Commonwealth
and state and territory government senior
offi cials committee; and the Education Visa
Consultative Committee, a government and
education and training sector committee that
deals with changes to the student visa program.
Austrade also works with peak education
sector bodies on specifi c issues, such
as the redevelopment of the Study in
Australia website, and the development of
the education brand, Future Unlimited.
Study opportunities for Taiwan’s working holiday-makers
In response to the increase in Taiwanese
working holiday-maker visitors to Australia,
Austrade facilitated a large-scale seminar
in Taipei in April 2012. The aim was to
highlight education opportunities to outbound
travellers and raise awareness of the benefi ts
of incorporating an education aspect in an
Australian working holiday experience.
With the main purpose of promoting education
pathways, the seminar combined briefi ngs
from Austrade representatives, education
agents and previous Taiwanese working
holiday-makers. The event attracted more
than 400 young Taiwanese people looking to
learn more about the options available during
an Australian working holiday experience.
Taiwan was the sixth-largest source market
for the Australian working holiday-maker
program, with 13,809 working holiday
visas issued in 2010–11, a 35 per cent
increase on the previous fi nancial year.
Previous working holiday-makers respond to audience
questions at Austrade’s ‘Creating Your Future through
Education’ seminar for prospective Taiwanese working
holiday-makers, Taipei, in April 2012.
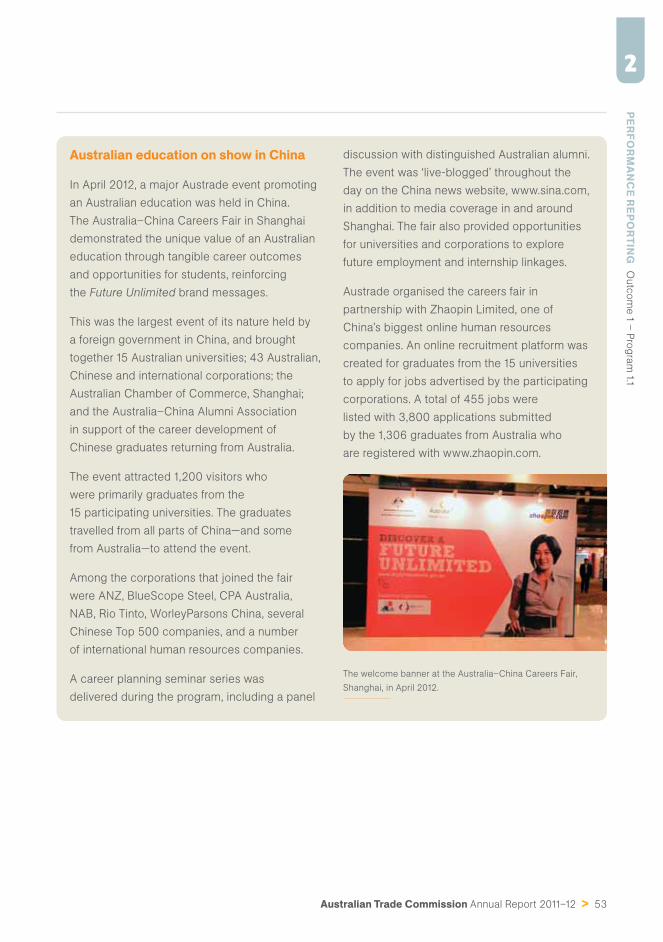
Australian Trade Commission Annual Report 2011–12 > 53
PERFO
RM
AN
CE R
EPOR
TING
O
utc
om
e 1 –
Pro
gra
m 1.1
2
Australian education on show in China
In April 2012, a major Austrade event promoting
an Australian education was held in China.
The Australia–China Careers Fair in Shanghai
demonstrated the unique value of an Australian
education through tangible career outcomes
and opportunities for students, reinforcing
the Future Unlimited brand messages.
This was the largest event of its nature held by
a foreign government in China, and brought
together 15 Australian universities; 43 Australian,
Chinese and international corporations; the
Australian Chamber of Commerce, Shanghai;
and the Australia–China Alumni Association
in support of the career development of
Chinese graduates returning from Australia.
The event attracted 1,200 visitors who
were primarily graduates from the
15 participating universities. The graduates
travelled from all parts of China—and some
from Australia—to attend the event.
Among the corporations that joined the fair
were ANZ, BlueScope Steel, CPA Australia,
NAB, Rio Tinto, WorleyParsons China, several
Chinese Top 500 companies, and a number
of international human resources companies.
A career planning seminar series was
delivered during the program, including a panel
discussion with distinguished Australian alumni.
The event was ‘live-blogged’ throughout the
day on the China news website, www.sina.com,
in addition to media coverage in and around
Shanghai. The fair also provided opportunities
for universities and corporations to explore
future employment and internship linkages.
Austrade organised the careers fair in
partnership with Zhaopin Limited, one of
China’s biggest online human resources
companies. An online recruitment platform was
created for graduates from the 15 universities
to apply for jobs advertised by the participating
corporations. A total of 455 jobs were
listed with 3,800 applications submitted
by the 1,306 graduates from Australia who
are registered with www.zhaopin.com.
The welcome banner at the Australia–China Careers Fair,
Shanghai, in April 2012.
54 > Australian Trade Commission Annual Report 2011–12
Delivering targeted trade and investment strategies
Performance measure Outcome
Eff ective delivery of trade
and investment strategies
through the Automotive
Market Access Program
and Clean Energy Trade
and Investment Strategy.
› Austrade supported the delivery of the Australian Government’s
Automotive Market Access Program, in its third and fi nal year
of funding, to assist the Australian automotive industry in
accessing supply chains in ASEAN, China, India and Korea.
› During 2011–12, 239 individual automotive clients were assisted by
Austrade to achieve export or outward investment successes.
› The Clean Energy Trade and Investment Strategy continued to promote
Australia as a destination for productive investment in clean energy
projects and technologies in its third and fi nal year of funding.
› During 2011–12, Austrade assisted in facilitating 16 investment
successes worth a total of $288.6 million as part of the
Clean Energy Trade and Investment Strategy.
› Austrade worked closely with Commonwealth and state and
territory government stakeholders and industry allies, including
Water Australia and the Water Supplier Advocate, to promote
Australia as a supplier of technology, services and expertise in water
management to emerging markets within ASEAN and Latin America.
Automotive sector
During 2011–12, Austrade supported the
delivery of the Government’s program to assist
the Australian automotive industry to access
global supply chains. Austrade supported
239 individual automotive clients in achieving
export or outward investment successes.
Automotive Market Access Program
The Automotive Market Access Program was a
three-year, $3.7 million program that concluded
on 30 June 2012. In the last year of the program,
Austrade maintained its activities with emphasis
on the automotive component industry and
new technologies, focusing on the target
markets of ASEAN, China, India and Korea.
Highlights from 2011–12 include Australian
Automotive Week, held in Melbourne in
July 2011, for which Austrade coordinated the
participation of 80 international delegates
from seven diff erent markets. Delegates took
part in targeted business matching, business
conferences, the Australian Automotive Trade
Showcase and other networking events.
Australian Trade Commission Annual Report 2011–12 > 55
PERFO
RM
AN
CE R
EPOR
TING
O
utc
om
e 1 –
Pro
gra
m 1.1
2
These events were assisted by the Australian
Government’s automotive envoys and relevant
state and territory governments and industry
associations. Australian industry feedback
suggested that participants expected to
enter new partnerships and possibly new
export programs as a result of the business
matching undertaken during the week.
To assist Australian automotive exporters,
Austrade has a joint venture with the Victorian
Government’s Department of Business and
Innovation, which funds an Austrade Business
Development Manager located in Wuhan,
China. In 2011–12, under the Automotive Market
Access Program in China, Austrade assisted
in facilitating more than $41 million in exports
and outward investment outcomes and one
inward investment project worth $2 million.
Over the three-year period of the Automotive
Market Access Program, Austrade facilitated
more than $136 million in exports and outward
investment outcomes, and $25 million in
inward investment projects. Given an average
timeframe of fi ve years is required to win
automotive contracts, Austrade expects more
outcomes in the future as a result of the business
matching and facilitation under the program.
Team Australia Automotive
In 2011–12, Austrade continued to participate
in the Team Australia Automotive initiative.
In June 2012, a Team Australia Automotive
mission, led by the Hon Steve Bracks AC,
Automotive Envoy, visited the United States with
11 Australian companies seeking to gain access
to the established US automotive supply chain.
In support of this mission, Austrade worked with
the Industry Capability Network, the Victorian
Government, contractor Terry Barr Sales and the
Federation of Automotive Products Manufacturers
to recruit Australian clients and arrange
appointments with senior decision-makers. During
the year, export and outward investment outcomes
under this initiative were in excess of $600,000.
Austrade also supported Australia’s two
automotive envoys, Mr Bracks and John
Conomos AO, in their visits to Germany, the
Czech Republic and Russia in July 2011; the
Middle East in October 2011; and to India in
January 2012. These visits were undertaken
to facilitate linkages for Australian automotive
suppliers in global supply chains.
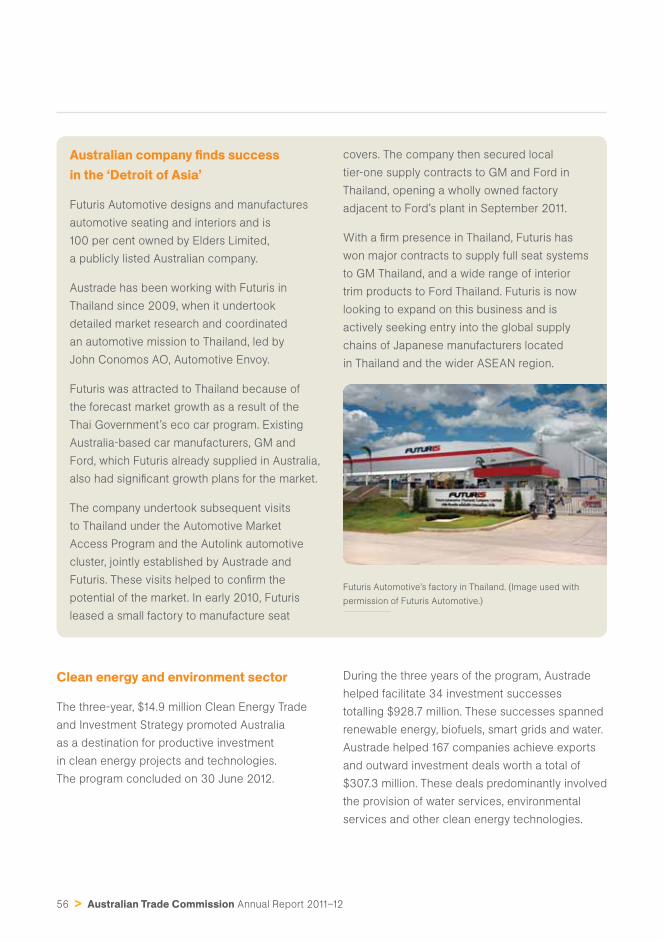
56 > Australian Trade Commission Annual Report 2011–12
Australian company fi nds success in the ‘Detroit of Asia’
Futuris Automotive designs and manufactures
automotive seating and interiors and is
100 per cent owned by Elders Limited,
a publicly listed Australian company.
Austrade has been working with Futuris in
Thailand since 2009, when it undertook
detailed market research and coordinated
an automotive mission to Thailand, led by
John Conomos AO, Automotive Envoy.
Futuris was attracted to Thailand because of
the forecast market growth as a result of the
Thai Government’s eco car program. Existing
Australia-based car manufacturers, GM and
Ford, which Futuris already supplied in Australia,
also had signifi cant growth plans for the market.
The company undertook subsequent visits
to Thailand under the Automotive Market
Access Program and the Autolink automotive
cluster, jointly established by Austrade and
Futuris. These visits helped to confi rm the
potential of the market. In early 2010, Futuris
leased a small factory to manufacture seat
covers. The company then secured local
tier-one supply contracts to GM and Ford in
Thailand, opening a wholly owned factory
adjacent to Ford’s plant in September 2011.
With a fi rm presence in Thailand, Futuris has
won major contracts to supply full seat systems
to GM Thailand, and a wide range of interior
trim products to Ford Thailand. Futuris is now
looking to expand on this business and is
actively seeking entry into the global supply
chains of Japanese manufacturers located
in Thailand and the wider ASEAN region.
Futuris Automotive’s factory in Thailand. (Image used with
permission of Futuris Automotive.)
Clean energy and environment sector
The three-year, $14.9 million Clean Energy Trade
and Investment Strategy promoted Australia
as a destination for productive investment
in clean energy projects and technologies.
The program concluded on 30 June 2012.
During the three years of the program, Austrade
helped facilitate 34 investment successes
totalling $928.7 million. These successes spanned
renewable energy, biofuels, smart grids and water.
Austrade helped 167 companies achieve exports
and outward investment deals worth a total of
$307.3 million. These deals predominantly involved
the provision of water services, environmental
services and other clean energy technologies.
Australian Trade Commission Annual Report 2011–12 > 57
PERFO
RM
AN
CE R
EPOR
TING
O
utc
om
e 1 –
Pro
gra
m 1.1
2
In 2011–12, Austrade commissioned an
independent evaluation of the Clean Energy
Trade and Investment Strategy. It concluded
that the strategy was aligned with the
Australian Government’s policy settings
and had achieved tangible outcomes.
The strategy’s 2011–12 objectives included:
› promoting the Australian Government’s Clean
Energy Future plan to potential investors
and international business stakeholders
› attracting foreign direct investment
in renewable energy generation and
biofuels projects and technologies
› promoting Australia as a global
leader in the design and delivery of
integrated water management
› introducing Australian businesses in the
clean technology and environment services
sectors to commercial opportunities in China
› positioning Australian companies to win
clean technology projects and develop
exports to Southeast Asia and India
› attracting investment and developing
trade opportunities in energy effi ciency
and environmental solutions for
commercial and residential buildings
› promoting Australia’s capabilities in the
carbon capture and storage sector.
The strategy helped Australian businesses in the
energy and environment sectors to capitalise
on the international opportunities presented
by global eff orts to mitigate climate change
and meet demand for cleaner energy, water
management and environmental solutions.
Austrade assisted international companies to
gain a greater knowledge and understanding of
the investment and commercial opportunities
in Australia. Austrade also helped Australia’s
clean energy and environment sector to better
understand global business opportunities and how
companies can work together to pursue them. A
Clean Energy and Environment Export Directory
was produced to showcase the capabilities
of more than 100 Australian companies.
During 2011–12, Austrade helped facilitate
16 investment successes through the program
totalling $288.6 million. These successes were
chiefl y spread across the solar, wind, water and
smart-grid sectors, including Swedish waste
solutions company Envac, which established
operations in Australia. For more information
on this investment success, see page 66.
Austrade assisted 24 companies to achieve
a total of 33 export deals worth $18.2 million.
These deals predominantly involved the
water and environment services sectors.
Energy sector achievements
In the last year, Austrade made further progress
in promoting Australia as a destination for the
development of advanced biofuels. In the United
States, Austrade assisted a number of companies
in making investments across the biofuels
value chain. This assistance included providing
information on biofuel investment opportunities,
organising briefi ngs with government agencies and
potential private sector partners, and coordinating
visits to Australia by company executives.
Austrade also played a role in bringing parties
together in support of the memorandum of
understanding between Australia and the United
States on sustainable aviation alternative fuels
58 > Australian Trade Commission Annual Report 2011–12
development. The agreement was signed between
the US Federal Aviation Administration and the
Department of Resources, Energy and Tourism.
In Europe, Austrade nurtured relationships
with investors, promoting Australian innovation
and research and development. Australia’s
capabilities were highlighted at the Australia–
Germany Solar Future Forum in Berlin on
World Environment Day, in June 2012. Also
in June 2012, Austrade coordinated a ‘Team
Australia’ presence at the Intersolar trade fair
in Munich, working with the South Australian
Government and the Australian Solar Institute.
In 2011–12, extensive market research and
scoping work was conducted to gauge potential
opportunities in low-emissions technology and
services in the Indonesian market, particularly for
the development and deployment of renewable,
hybrid and remote off -grid power. Austrade has
identifi ed opportunities matching Australian
capability that are focused on Indonesia’s rural and
remote electrifi cation objectives, which are being
implemented through projects such as the PT
PLN (Persero) 1000 Islands program. In addition,
Austrade worked with the Industry Capability
Network to promote Australia’s capabilities at the
Clean Power Asia conference in Bali in May 2012.
Environmental remediation
Using the Australia–China Wanwu Eco-country
initiative as a marketing platform in China,
Austrade introduced Australian companies to
Chinese local government and economic offi cials
and hosted a number of industry roundtables in
regional cities. In October 2011, Austrade and
the Ministry of Environmental Protection jointly
organised a two-day workshop in Beijing on heavy
metal remediation for the Australian Advanced
Remediation Group, a group of Australian
companies with capabilities in advanced
environmental remediation. Members of the group
presented to more than 50 Chinese executives.
Water sector focus
Australia is recognised internationally as a leader
in water management in response to climate
variability, and as a supplier of technology,
services, education and policy expertise in this
area. Austrade worked with the Australian Water
Association and Water Australia to publish an
overview of Australia’s water industry capabilities
and to plan off shore promotional activities.
Austrade focused on utilising its badge of
government to identify opportunities for
Australia’s water sector. Austrade worked closely
with Commonwealth and state and territory
government stakeholders and industry allies,
including Water Australia and the Water Supplier
Advocate, to promote Australian capability in
policy development, agriculture, urban and
regional infrastructure, research and development,
and education and training to emerging
markets within ASEAN and Latin America.
In Thailand, Austrade partnered with the
Federation of Thai Industries to deliver
business programs for Australian fi rms, and
the federation undertook a mission to the
OzWater conference in Sydney in May 2012.
In October 2011, Austrade worked in collaboration
with AusAID and the World Bank in Vietnam to
deliver the East Asia and Pacifi c Water Days
2011 conference. This was the World Bank’s
fi rst ‘community of practice’ meeting for around
40 water practitioners. It gave Australian fi rms
unprecedented access to insights from the
World Bank, and greater understanding of the
water challenges in East Asia and the Pacifi c.
Australian Trade Commission Annual Report 2011–12 > 59
PERFO
RM
AN
CE R
EPOR
TING
O
utc
om
e 1 –
Pro
gra
m 1.1
2
Clean Energy Future briefi ng series
In 2012, Austrade, in conjunction with the
Department of Resources, Energy and
Tourism, coordinated a series of overseas
forums and meetings to promote the
Australian Government’s Clean Energy Future
plan, Australia’s clean energy policies and
programs, and the investment and commercial
opportunities that are being created by
Australia’s transition to a low-carbon economy.
In cooperation with Australian Government
agencies, Austrade organised promotional
activities targeting international investors in
Western Europe, North America and Japan.
The series of seminars, roundtable meetings
and company meetings was designed to:
› explain the main elements of the Clean
Energy Future plan, including the
introduction of a carbon price and the
roles of the Australian Renewable Energy
Agency, which will commence operations
on 1 July 2012; and the Clean Energy
Finance Corporation, which will commence
investment operations on 1 July 2013
› update investors on renewable
energy developments, projects and
investment opportunities in Australia
› maintain Austrade’s pipeline of foreign
companies planning or considering
investments in Australia’s clean energy sector
› gain further insights into the views
of international investors.
In March and April 2012, Austrade hosted clean
energy seminars and meetings in Madrid, Paris,
Milan, Munich and Frankfurt. These events were
attended by more than 100 representatives
from leading clean energy investors, project
developers and government departments.
In May 2012, the Clean Energy Future plan
was promoted in Japan at an investor-focused
event in Tokyo, attended by about 100
business representatives, and through
a program of meetings with Japanese
companies and government agencies.
In North America, activities were centred on
the Globe 2012 conference and trade fair in
Vancouver, Canada, in March 2012. During
an Australia-themed day, Austrade hosted a
‘Next Generation Biofuels’ conference and
an ‘Innovation Den’ seminar, moderated by
AusIndustry. Meetings were also held with
Canadian and US-based companies.
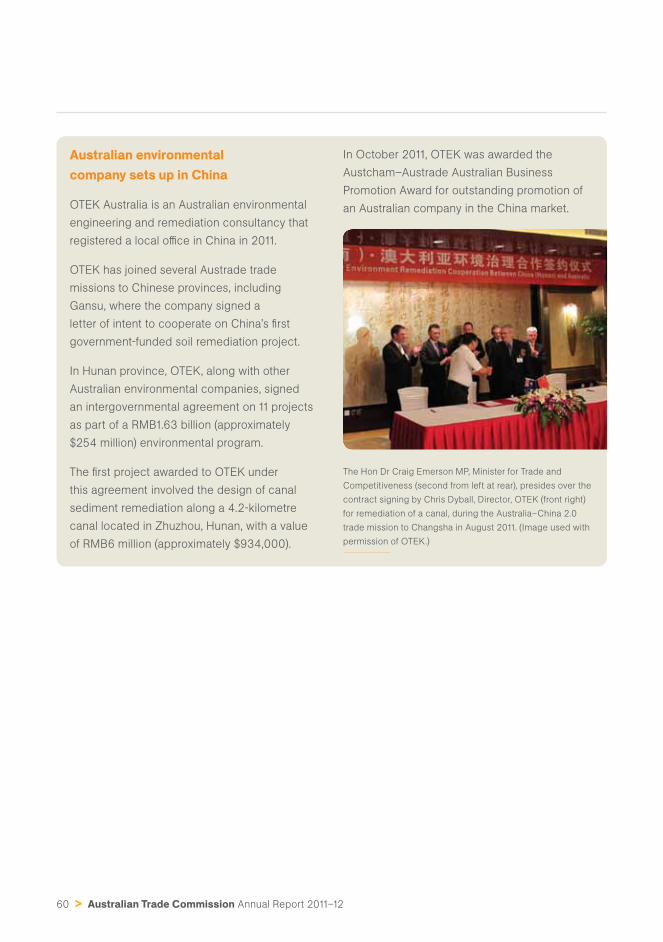
60 > Australian Trade Commission Annual Report 2011–12
Australian environmental company sets up in China
OTEK Australia is an Australian environmental
engineering and remediation consultancy that
registered a local offi ce in China in 2011.
OTEK has joined several Austrade trade
missions to Chinese provinces, including
Gansu, where the company signed a
letter of intent to cooperate on China’s fi rst
government-funded soil remediation project.
In Hunan province, OTEK, along with other
Australian environmental companies, signed
an intergovernmental agreement on 11 projects
as part of a RMB1.63 billion (approximately
$254 million) environmental program.
The fi rst project awarded to OTEK under
this agreement involved the design of canal
sediment remediation along a 4.2-kilometre
canal located in Zhuzhou, Hunan, with a value
of RMB6 million (approximately $934,000).
In October 2011, OTEK was awarded the
Austcham–Austrade Australian Business
Promotion Award for outstanding promotion of
an Australian company in the China market.
The Hon Dr Craig Emerson MP, Minister for Trade and
Competitiveness (second from left at rear), presides over the
contract signing by Chris Dyball, Director, OTEK (front right)
for remediation of a canal, during the Australia–China 2.0
trade mission to Changsha in August 2011. (Image used with
permission of OTEK.)
Australian Trade Commission Annual Report 2011–12 > 61
PERFO
RM
AN
CE R
EPOR
TING
O
utc
om
e 1 –
Pro
gra
m 1.1
2
Attracting productive foreign direct investment to Australia
Performance measure Outcome
Attraction of high value-
add inward investment
from targeted markets,
in cooperation with state
and territory governments
and partners.
› In 2011–12, Austrade worked closely with Commonwealth,
state and territory governments to develop a new
working model for investment promotion.
› Austrade assisted in the attraction of 56 inward investment projects
to Australia, with a total investment intention of $1.067 billion and
an intention to create or safeguard 954 jobs once operational.
› Austrade refocused its activities to those which deliver
unique value in priority areas for Australia.
Foreign direct investment environment
In 2011, total FDI stock in Australia grew
6.6 per cent to reach a record $507 billion.
This increase builds on the 7.5 per cent growth
in 2010, and refl ects the general upturn in
global FDI activity since 2010, as well as
Australia’s strong competitive position in the
global economy. In the fi ve years since 2006,
Australia’s inward FDI stock has grown by a
compound annual rate of 8.5 per cent.
The United States and the United Kingdom
continued to dominate FDI stock in
Australia in 2011, accounting for 24 per
cent or $122 billion, and 14 per cent or
$70 billion, respectively (Figure 7). Other
major contributors to FDI in Australia in 2011
were Japan (10 per cent or $52 billion), the
Netherlands (6.5 per cent or $33 billion) and
Switzerland (4.5 per cent or $23 billion).
Austrade’s role
Austrade is the lead Australian Government
agency for the promotion, attraction and
facilitation of foreign direct investment (FDI)
into Australia. Working in cooperation with state
and territory governments, Austrade provides
coordinated government assistance to attract
and facilitate productive FDI into Australia.
To deliver the greatest value to the Australian
economy, Austrade’s services are focused
on promoting Australia as a competitive
investment destination, and attracting
productive FDI into Australia that is of strategic
importance, builds Australian capabilities
and enhances Australia’s productivity.
Austrade’s new approach to its investment work
Austrade’s new operating model provides
a sharper focus for investment promotion
and attraction activities through a
signifi cant shift in priority setting and
operations both onshore and off shore.
62 > Australian Trade Commission Annual Report 2011–12
During the course of the review of Austrade, it
was confi rmed that Austrade’s unique value-
add in investment comes from its ability to:
› lead and deliver a national, whole-of-
government strategy for investment promotion
› identify and generate productive FDI, which
is of strategic importance to stakeholders
› gain market insights through access
to networks of key decision-makers,
multipliers, businesses and infl uencers
in Australia and international markets
› use its badge of government to
establish contacts, build networks,
target foreign fi rms and give credibility
to investment attraction activities.
In implementing its new model, Austrade has
undertaken extensive consultations with Australian
Government departments, as well as state and
territory governments, to defi ne priorities for
investment attraction, promotion and facilitation.
Austrade is now focused on:
› proactive investment attraction activity
based on priorities determined by
the Australian Government
› earlier introduction of qualifi ed investment
leads to states, territories and other service
providers for facilitation onshore
› broad investment promotion
activity in target markets only
› internationally focused marketing
and communications.
Strategy and priority setting
At the Commonwealth level, an
interdepartmental committee was formed to
identify Australian Government priorities and
agree on shared objectives. Four key areas
for engagement with overseas investors
emerged out of this process. They were:
› tourism infrastructure
› major economic and social infrastructure
› clean energy
› innovation, including advanced manufacturing.
Following consultations with states
and territories, the National Investment
Advisory Board has agreed to three further
key areas for close cooperation:
› digital economy, including information
and communications technology (ICT)
› agricultural science, and food
technology and processing
› resource technology, services and processing.
A key priority for 2012–13 will be to build
Austrade’s capability in delivering investment
outcomes in the agreed priority sectors.
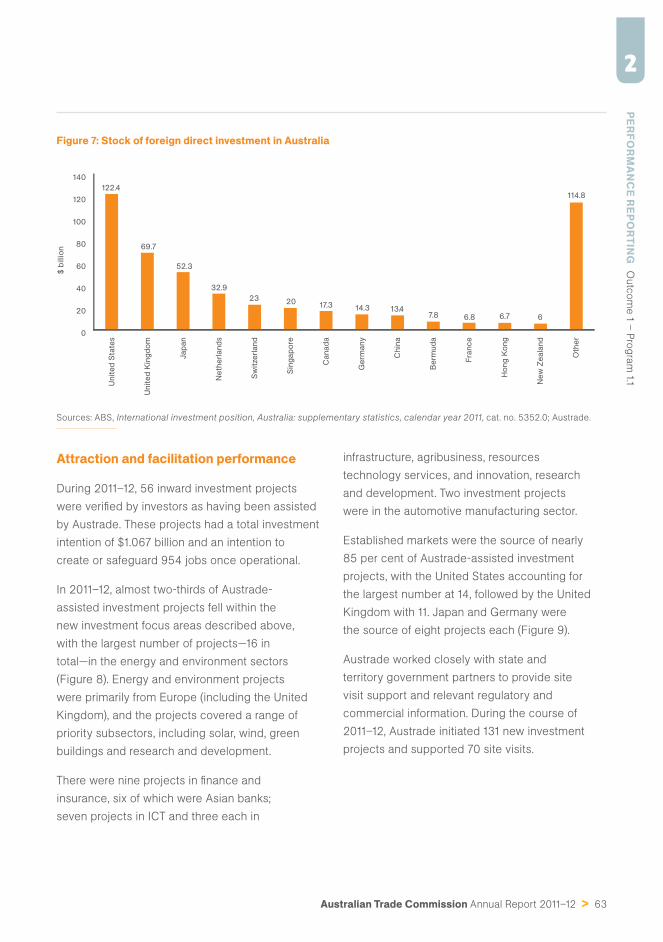
Australian Trade Commission Annual Report 2011–12 > 63
PERFO
RM
AN
CE R
EPOR
TING
O
utc
om
e 1 –
Pro
gra
m 1.1
2
Figure 7: Stock of foreign direct investment in Australia
0
20
40
60
80
100
120
140
Unit
ed
Sta
tes
Unit
ed
Kin
gd
om
Jap
an
Ne
the
rland
s
Sw
itze
rland
Sin
gap
ore
Canad
a
Ge
rmany
Chin
a
Be
rmud
a
Fra
nce
Ho
ng
Ko
ng
Ne
w Z
eala
nd
Oth
er
$ b
illio
n
122.4
69.7
52.3
32.9
23 2017.3 14.3 13.4
7.8 6.8 6.7 6
114.8
Sources: ABS, International investment position, Australia: supplementary statistics, calendar year 2011, cat. no. 5352.0; Austrade.
Attraction and facilitation performance
During 2011–12, 56 inward investment projects
were verifi ed by investors as having been assisted
by Austrade. These projects had a total investment
intention of $1.067 billion and an intention to
create or safeguard 954 jobs once operational.
In 2011–12, almost two-thirds of Austrade-
assisted investment projects fell within the
new investment focus areas described above,
with the largest number of projects—16 in
total—in the energy and environment sectors
(Figure 8). Energy and environment projects
were primarily from Europe (including the United
Kingdom), and the projects covered a range of
priority subsectors, including solar, wind, green
buildings and research and development.
There were nine projects in fi nance and
insurance, six of which were Asian banks;
seven projects in ICT and three each in
infrastructure, agribusiness, resources
technology services, and innovation, research
and development. Two investment projects
were in the automotive manufacturing sector.
Established markets were the source of nearly
85 per cent of Austrade-assisted investment
projects, with the United States accounting for
the largest number at 14, followed by the United
Kingdom with 11. Japan and Germany were
the source of eight projects each (Figure 9).
Austrade worked closely with state and
territory government partners to provide site
visit support and relevant regulatory and
commercial information. During the course of
2011–12, Austrade initiated 131 new investment
projects and supported 70 site visits.
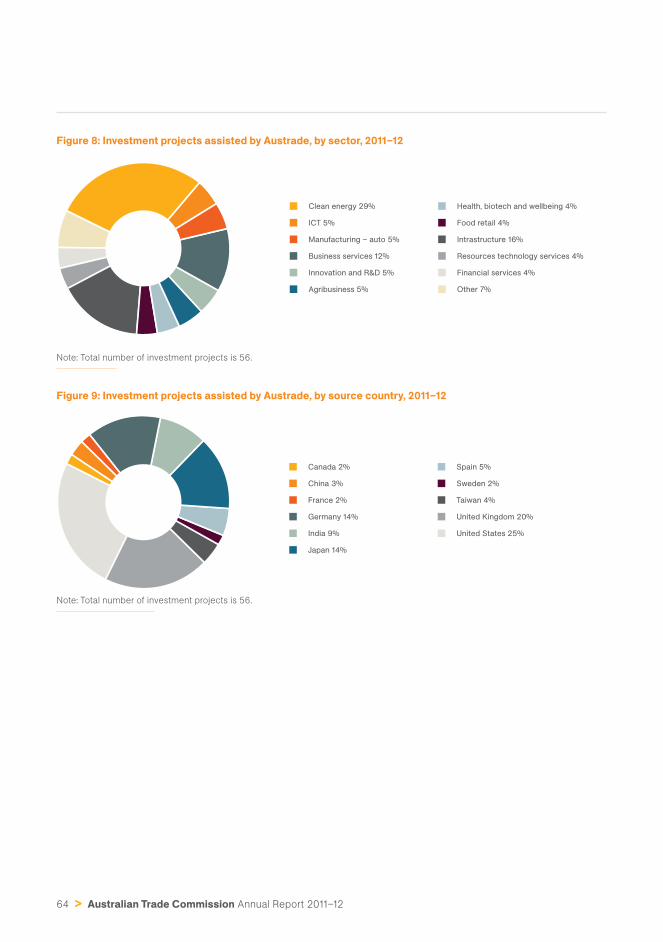
64 > Australian Trade Commission Annual Report 2011–12
Figure 8: Investment projects assisted by Austrade, by sector, 2011–12
Clean energy 29%
ICT 5%
Manufacturing – auto 5%
Business services 12%
Innovation and R&D 5%
Agribusiness 5%
Health, biotech and wellbeing 4%
Food retail 4%
Intrastructure 16%
Resources technology services 4%
Financial services 4%
Other 7%
Note: Total number of investment projects is 56.
Figure 9: Investment projects assisted by Austrade, by source country, 2011–12
Canada 2%
China 3%
France 2%
Germany 14%
India 9%
Japan 14%
Spain 5%
Sweden 2%
Taiwan 4%
United Kingdom 20%
United States 25%
Note: Total number of investment projects is 56.
Australian Trade Commission Annual Report 2011–12 > 65
PERFO
RM
AN
CE R
EPOR
TING
O
utc
om
e 1 –
Pro
gra
m 1.1
2
Building capacity
Austrade’s national leadership of a whole-of-
government approach to investment promotion,
attraction and facilitation includes capability
development. This is primarily delivered by
Austrade, with the support of the National
Investment Advisory Board, through a national
fl agship capability development program called
‘Winning Investment for Australia’. The program
was designed to support the capability needs
of investment specialists working in Austrade
and relevant state and territory departments.
In 2011–12, two programs were delivered, in
Melbourne and Adelaide, with 42 Austrade
staff and 27 state and territory staff graduating
from the two courses. The aim was to enhance
skills and knowledge to deliver high-quality
productive FDI outcomes in Australia, and
to reinforce the partnership model between
the Commonwealth and state and territory
governments on which investment promotion,
attraction and facilitation is predicated.
Additional training programs to supplement
the Winning Investment for Australia program
were also developed and delivered during the
year in order to provide more specialist applied
training for Austrade’s front-line investment
representatives, including a Europe-based
specialised program on consultative selling
and investment attraction techniques, and
a US-based coaching program to support
staff new to investment attraction to work
through ‘live’ investment projects alongside
experienced staff . Each of these programs will
be extended to other teams in Austrade’s global
investment network during the coming year.
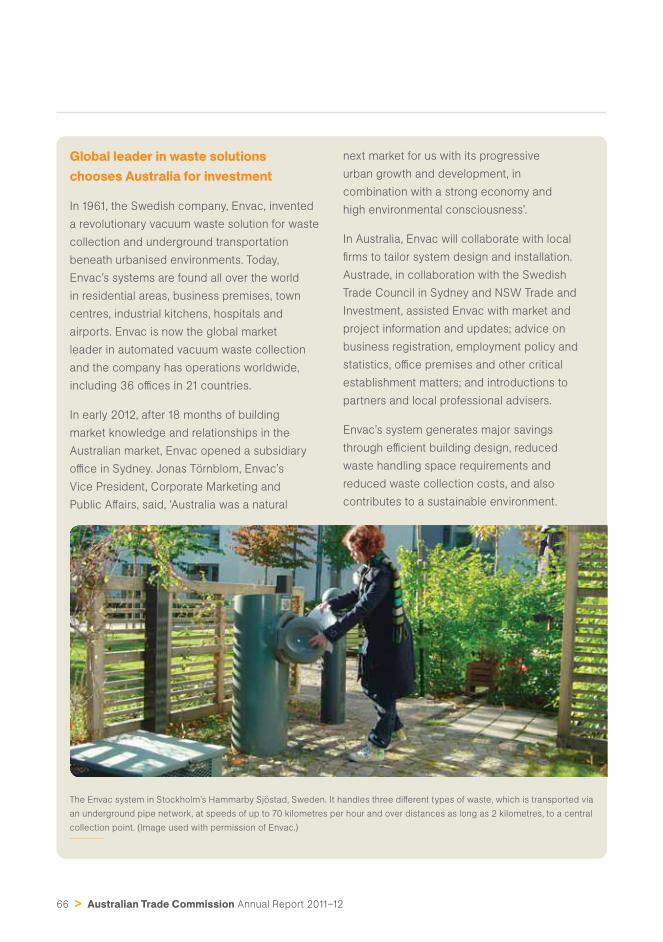
66 > Australian Trade Commission Annual Report 2011–12
Global leader in waste solutions chooses Australia for investment
In 1961, the Swedish company, Envac, invented
a revolutionary vacuum waste solution for waste
collection and underground transportation
beneath urbanised environments. Today,
Envac’s systems are found all over the world
in residential areas, business premises, town
centres, industrial kitchens, hospitals and
airports. Envac is now the global market
leader in automated vacuum waste collection
and the company has operations worldwide,
including 36 offi ces in 21 countries.
In early 2012, after 18 months of building
market knowledge and relationships in the
Australian market, Envac opened a subsidiary
offi ce in Sydney. Jonas Törnblom, Envac’s
Vice President, Corporate Marketing and
Public Aff airs, said, ‘Australia was a natural
next market for us with its progressive
urban growth and development, in
combination with a strong economy and
high environmental consciousness’.
In Australia, Envac will collaborate with local
fi rms to tailor system design and installation.
Austrade, in collaboration with the Swedish
Trade Council in Sydney and NSW Trade and
Investment, assisted Envac with market and
project information and updates; advice on
business registration, employment policy and
statistics, offi ce premises and other critical
establishment matters; and introductions to
partners and local professional advisers.
Envac’s system generates major savings
through effi cient building design, reduced
waste handling space requirements and
reduced waste collection costs, and also
contributes to a sustainable environment.
The Envac system in Stockholm’s Hammarby Sjöstad, Sweden. It handles three diff erent types of waste, which is transported via
an underground pipe network, at speeds of up to 70 kilometres per hour and over distances as long as 2 kilometres, to a central
collection point. (Image used with permission of Envac.)
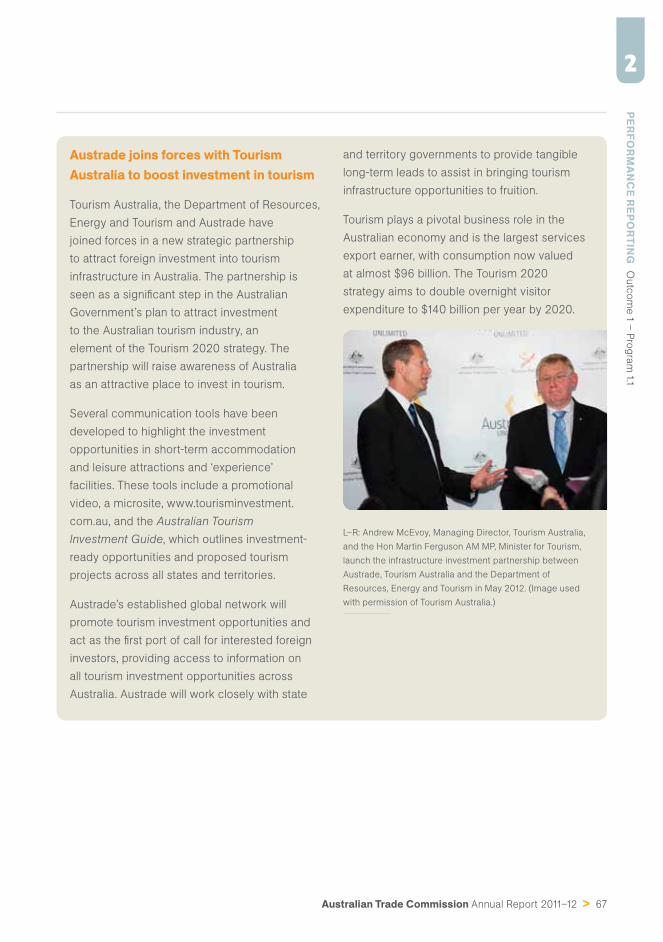
Australian Trade Commission Annual Report 2011–12 > 67
PERFO
RM
AN
CE R
EPOR
TING
O
utc
om
e 1 –
Pro
gra
m 1.1
2
Austrade joins forces with Tourism Australia to boost investment in tourism
Tourism Australia, the Department of Resources,
Energy and Tourism and Austrade have
joined forces in a new strategic partnership
to attract foreign investment into tourism
infrastructure in Australia. The partnership is
seen as a signifi cant step in the Australian
Government’s plan to attract investment
to the Australian tourism industry, an
element of the Tourism 2020 strategy. The
partnership will raise awareness of Australia
as an attractive place to invest in tourism.
Several communication tools have been
developed to highlight the investment
opportunities in short-term accommodation
and leisure attractions and ‘experience’
facilities. These tools include a promotional
video, a microsite, www.tourisminvestment.
com.au, and the Australian Tourism
Investment Guide, which outlines investment-
ready opportunities and proposed tourism
projects across all states and territories.
Austrade’s established global network will
promote tourism investment opportunities and
act as the fi rst port of call for interested foreign
investors, providing access to information on
all tourism investment opportunities across
Australia. Austrade will work closely with state
and territory governments to provide tangible
long-term leads to assist in bringing tourism
infrastructure opportunities to fruition.
Tourism plays a pivotal business role in the
Australian economy and is the largest services
export earner, with consumption now valued
at almost $96 billion. The Tourism 2020
strategy aims to double overnight visitor
expenditure to $140 billion per year by 2020.
L–R: Andrew McEvoy, Managing Director, Tourism Australia,
and the Hon Martin Ferguson AM MP, Minister for Tourism,
launch the infrastructure investment partnership between
Austrade, Tourism Australia and the Department of
Resources, Energy and Tourism in May 2012. (Image used
with permission of Tourism Australia.)
68 > Australian Trade Commission Annual Report 2011–12
Promoting Australia internationally and raising awareness of the benefi ts of trade and investment
Performance measure Outcome
Strong international
awareness of Australia
as a destination for
investment and as a
source of competitive,
high-quality goods and
services and a world-
class international
education system.
In addition to international awareness activities described elsewhere:
› Austrade leads the use and activation of the Australia Unlimited nation
brand on behalf of the Australian Government. In 2011–12, Austrade
continued to develop and promote contemporary examples of Australian
capability. The Australia Unlimited magazine for iPads was launched in
November 2011, while the supporting website, www.australiaunlimited.
com, was launched in January 2012, showcasing the world-class
ideas and the achievements of Australians at home and abroad
› internationally, Austrade used its off shore network to secure positive
media coverage of Australian capability with events including
G’Day USA and the launch of the Future Unlimited education video
in target markets
› Austrade hosted the Commonwealth Business Forum in Perth in
October 2011, highlighting global economic partnerships for trade
and investment among 1,400 business and government leaders from
54 countries, including 16 heads of government and 150 global business
leaders and expert speakers. The event contributed to Australia’s brand
as a highly rated place to invest and do business, and strengthened
Australia’s position as a trading partner and investment destination.
Brand Australia
The $20 million, four-year Building Brand
Australia program promotes intellectual,
commercial and creative credentials of
contemporary Australia through the Australia
Unlimited brand identity. The program refl ects
the economic importance of projecting a well-
balanced and accurate image of Australia
internationally, in order to attract international
buyers, investors, visitors and students.
During 2011–12, the third year of the program,
the Australia Unlimited brand has been used
extensively to demonstrate Australian capability
through innovative digital content channels,
including a monthly iPad magazine, in conjunction
with a diverse range of international activities.
Future Unlimited is the education-specifi c
brand developed through the Building Brand
Australia program. It was developed in close
consultation with the international education
sector and through extensive research with
international students. For further information
on Future Unlimited, see page 46.
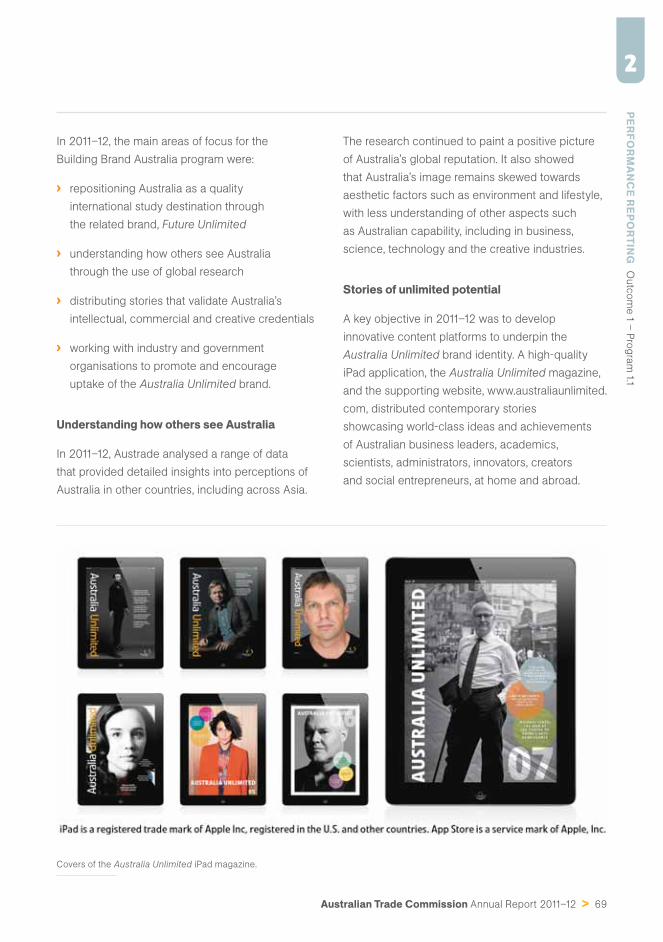
Australian Trade Commission Annual Report 2011–12 > 69
PERFO
RM
AN
CE R
EPOR
TING
O
utc
om
e 1 –
Pro
gra
m 1.1
2
In 2011–12, the main areas of focus for the
Building Brand Australia program were:
› repositioning Australia as a quality
international study destination through
the related brand, Future Unlimited
› understanding how others see Australia
through the use of global research
› distributing stories that validate Australia’s
intellectual, commercial and creative credentials
› working with industry and government
organisations to promote and encourage
uptake of the Australia Unlimited brand.
Understanding how others see Australia
In 2011–12, Austrade analysed a range of data
that provided detailed insights into perceptions of
Australia in other countries, including across Asia.
The research continued to paint a positive picture
of Australia’s global reputation. It also showed
that Australia’s image remains skewed towards
aesthetic factors such as environment and lifestyle,
with less understanding of other aspects such
as Australian capability, including in business,
science, technology and the creative industries.
Stories of unlimited potential
A key objective in 2011–12 was to develop
innovative content platforms to underpin the
Australia Unlimited brand identity. A high-quality
iPad application, the Australia Unlimited magazine,
and the supporting website, www.australiaunlimited.
com, distributed contemporary stories
showcasing world-class ideas and achievements
of Australian business leaders, academics,
scientists, administrators, innovators, creators
and social entrepreneurs, at home and abroad.
Covers of the Australia Unlimited iPad magazine.
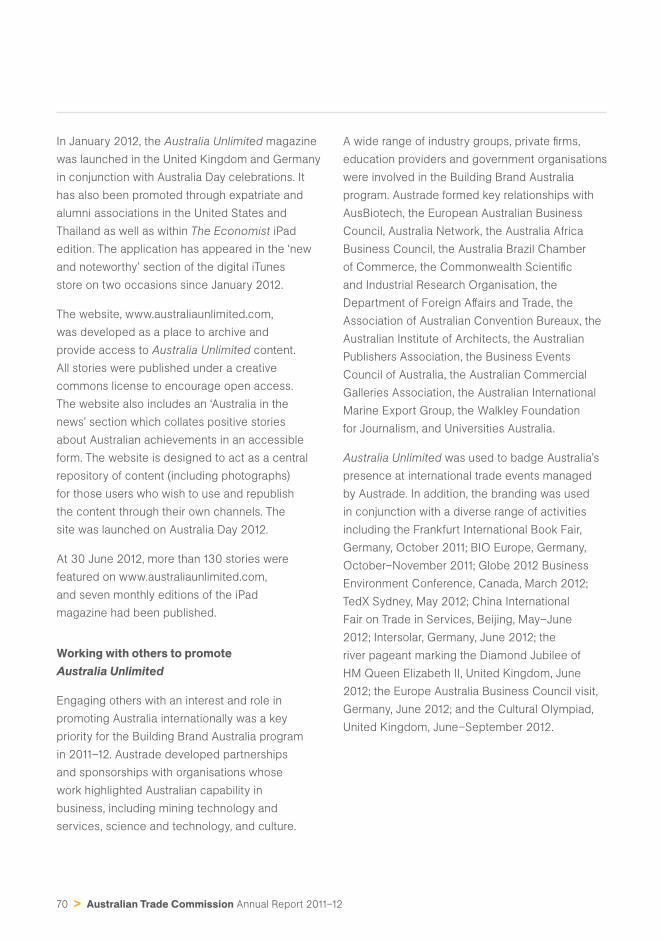
70 > Australian Trade Commission Annual Report 2011–12
In January 2012, the Australia Unlimited magazine
was launched in the United Kingdom and Germany
in conjunction with Australia Day celebrations. It
has also been promoted through expatriate and
alumni associations in the United States and
Thailand as well as within The Economist iPad
edition. The application has appeared in the ‘new
and noteworthy’ section of the digital iTunes
store on two occasions since January 2012.
The website, www.australiaunlimited.com,
was developed as a place to archive and
provide access to Australia Unlimited content.
All stories were published under a creative
commons license to encourage open access.
The website also includes an ‘Australia in the
news’ section which collates positive stories
about Australian achievements in an accessible
form. The website is designed to act as a central
repository of content (including photographs)
for those users who wish to use and republish
the content through their own channels. The
site was launched on Australia Day 2012.
At 30 June 2012, more than 130 stories were
featured on www.australiaunlimited.com,
and seven monthly editions of the iPad
magazine had been published.
Working with others to promote Australia Unlimited
Engaging others with an interest and role in
promoting Australia internationally was a key
priority for the Building Brand Australia program
in 2011–12. Austrade developed partnerships
and sponsorships with organisations whose
work highlighted Australian capability in
business, including mining technology and
services, science and technology, and culture.
A wide range of industry groups, private fi rms,
education providers and government organisations
were involved in the Building Brand Australia
program. Austrade formed key relationships with
AusBiotech, the European Australian Business
Council, Australia Network, the Australia Africa
Business Council, the Australia Brazil Chamber
of Commerce, the Commonwealth Scientifi c
and Industrial Research Organisation, the
Department of Foreign Aff airs and Trade, the
Association of Australian Convention Bureaux, the
Australian Institute of Architects, the Australian
Publishers Association, the Business Events
Council of Australia, the Australian Commercial
Galleries Association, the Australian International
Marine Export Group, the Walkley Foundation
for Journalism, and Universities Australia.
Australia Unlimited was used to badge Australia’s
presence at international trade events managed
by Austrade. In addition, the branding was used
in conjunction with a diverse range of activities
including the Frankfurt International Book Fair,
Germany, October 2011; BIO Europe, Germany,
October–November 2011; Globe 2012 Business
Environment Conference, Canada, March 2012;
TedX Sydney, May 2012; China International
Fair on Trade in Services, Beijing, May–June
2012; Intersolar, Germany, June 2012; the
river pageant marking the Diamond Jubilee of
HM Queen Elizabeth II, United Kingdom, June
2012; the Europe Australia Business Council visit,
Germany, June 2012; and the Cultural Olympiad,
United Kingdom, June–September 2012.
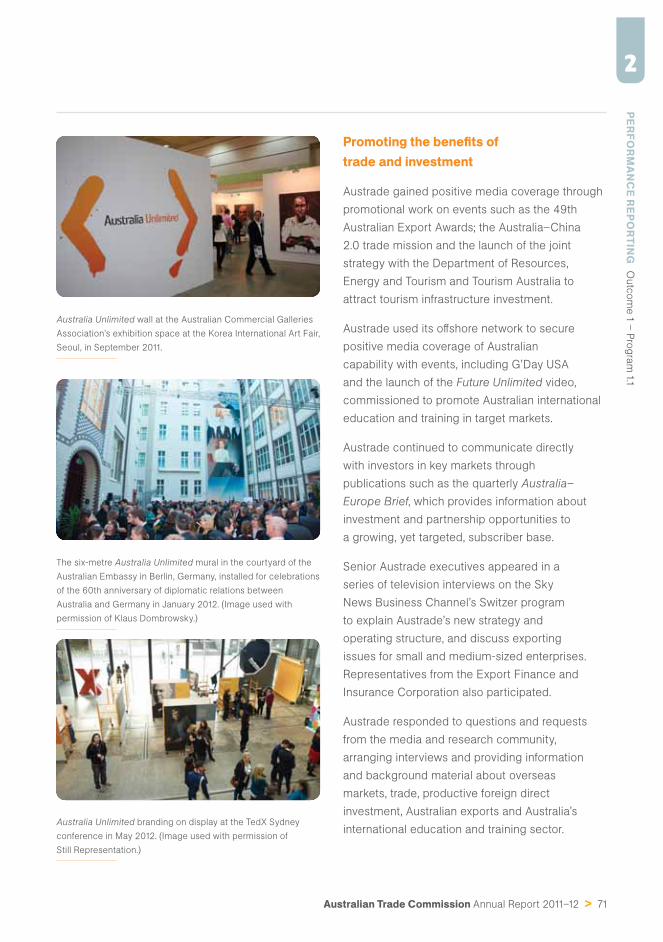
Australian Trade Commission Annual Report 2011–12 > 71
PERFO
RM
AN
CE R
EPOR
TING
O
utc
om
e 1 –
Pro
gra
m 1.1
2
Australia Unlimited wall at the Australian Commercial Galleries
Association’s exhibition space at the Korea International Art Fair,
Seoul, in September 2011.
The six-metre Australia Unlimited mural in the courtyard of the
Australian Embassy in Berlin, Germany, installed for celebrations
of the 60th anniversary of diplomatic relations between
Australia and Germany in January 2012. (Image used with
permission of Klaus Dombrowsky.)
Australia Unlimited branding on display at the TedX Sydney
conference in May 2012. (Image used with permission of
Still Representation.)
Promoting the benefi ts of trade and investment
Austrade gained positive media coverage through
promotional work on events such as the 49th
Australian Export Awards; the Australia–China
2.0 trade mission and the launch of the joint
strategy with the Department of Resources,
Energy and Tourism and Tourism Australia to
attract tourism infrastructure investment.
Austrade used its off shore network to secure
positive media coverage of Australian
capability with events, including G’Day USA
and the launch of the Future Unlimited video,
commissioned to promote Australian international
education and training in target markets.
Austrade continued to communicate directly
with investors in key markets through
publications such as the quarterly Australia–
Europe Brief, which provides information about
investment and partnership opportunities to
a growing, yet targeted, subscriber base.
Senior Austrade executives appeared in a
series of television interviews on the Sky
News Business Channel’s Switzer program
to explain Austrade’s new strategy and
operating structure, and discuss exporting
issues for small and medium-sized enterprises.
Representatives from the Export Finance and
Insurance Corporation also participated.
Austrade responded to questions and requests
from the media and research community,
arranging interviews and providing information
and background material about overseas
markets, trade, productive foreign direct
investment, Australian exports and Australia’s
international education and training sector.
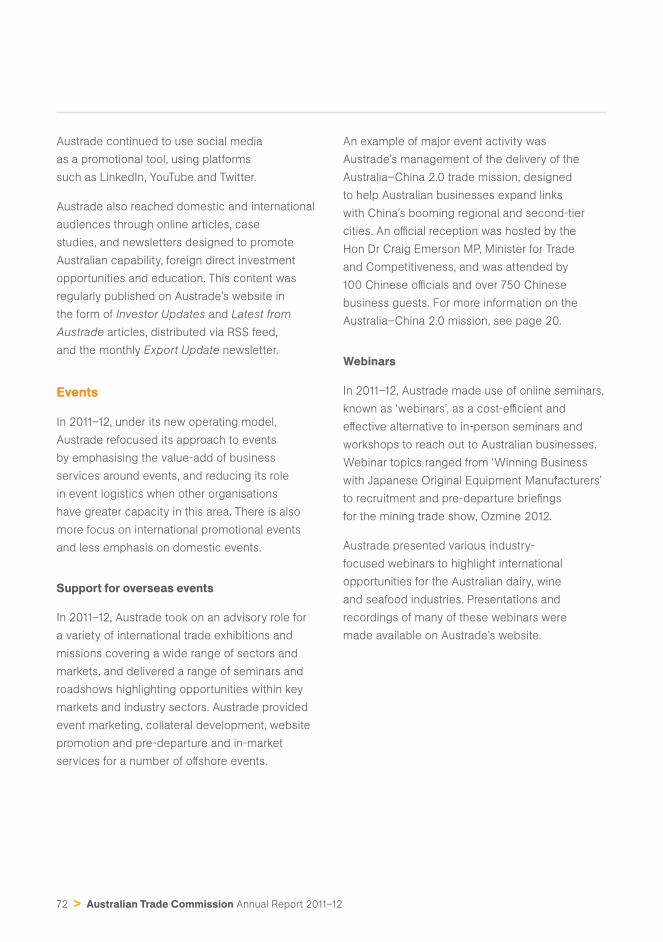
72 > Australian Trade Commission Annual Report 2011–12
Austrade continued to use social media
as a promotional tool, using platforms
such as LinkedIn, YouTube and Twitter.
Austrade also reached domestic and international
audiences through online articles, case
studies, and newsletters designed to promote
Australian capability, foreign direct investment
opportunities and education. This content was
regularly published on Austrade’s website in
the form of Investor Updates and Latest from
Austrade articles, distributed via RSS feed,
and the monthly Export Update newsletter.
Events
In 2011–12, under its new operating model,
Austrade refocused its approach to events
by emphasising the value-add of business
services around events, and reducing its role
in event logistics when other organisations
have greater capacity in this area. There is also
more focus on international promotional events
and less emphasis on domestic events.
Support for overseas events
In 2011–12, Austrade took on an advisory role for
a variety of international trade exhibitions and
missions covering a wide range of sectors and
markets, and delivered a range of seminars and
roadshows highlighting opportunities within key
markets and industry sectors. Austrade provided
event marketing, collateral development, website
promotion and pre-departure and in-market
services for a number of off shore events.
An example of major event activity was
Austrade’s management of the delivery of the
Australia–China 2.0 trade mission, designed
to help Australian businesses expand links
with China’s booming regional and second-tier
cities. An offi cial reception was hosted by the
Hon Dr Craig Emerson MP, Minister for Trade
and Competitiveness, and was attended by
100 Chinese offi cials and over 750 Chinese
business guests. For more information on the
Australia–China 2.0 mission, see page 20.
Webinars
In 2011–12, Austrade made use of online seminars,
known as ‘webinars’, as a cost-effi cient and
eff ective alternative to in-person seminars and
workshops to reach out to Australian businesses.
Webinar topics ranged from ‘Winning Business
with Japanese Original Equipment Manufacturers’
to recruitment and pre-departure briefi ngs
for the mining trade show, Ozmine 2012.
Austrade presented various industry-
focused webinars to highlight international
opportunities for the Australian dairy, wine
and seafood industries. Presentations and
recordings of many of these webinars were
made available on Austrade’s website.
Australian Trade Commission Annual Report 2011–12 > 73
PERFO
RM
AN
CE R
EPOR
TING
O
utc
om
e 1 –
Pro
gra
m 1.1
2
Australian Export Awards
Seventy-fi ve national fi nalists were recognised
at the 49th Australian Export Awards ceremony
at the Brisbane Convention and Exhibition
Centre in December 2011. The group of
fi nalists collectively achieved $5.6 billion
in export sales and employed more than
10,000 people from a diverse range of
industries in the 2010–11 fi nancial year.
The Hon Dr Craig Emerson MP, Minister for Trade
and Competitiveness, hosted the ceremony,
which was attended by more than 450 guests.
The 12 national winners were announced,
including the Prime Minister’s Australian
Exporter of the Year, Sedgman Limited, a
multidisciplinary engineering company exporting
services to the global resources industry.
The national fi nalists progressed through the
eight state and territory export award programs.
The companies were judged on criteria
including demonstrated sustainable competitive
advantage; export growth; commitment to
international business; innovation in products
and services; and marketing strategies.
Export Awards events held during the year
included an export panel breakfast, which
focused on doing business in the growth and
emerging markets of Latin America, Africa and
Mongolia. In December 2011, a ‘masterclass’
was held for all national fi nalists, concentrating
on how Australia is perceived internationally as
a business destination. The class drew on the
signifi cant research fi ndings that went into the
development of the Australia Unlimited brand to
reshape Australia’s brand image internationally,
particularly in relation to trade and investment.
The Australian Export Awards were
presented by Austrade in partnership with
the Australian Chamber of Commerce and
Industry. The awards are one of the longest
running business programs in Australia.
The 49th Australian Export Awards winners were:
Prime Minister’s Australian Exporter
of the Year Award
Sedgman Limited (QLD)
Agribusiness Award
Longwarry Food Park (VIC)
Arts and Entertainment Award
Laservision (NSW)
Education and Training Award
Institute of Continuing & TESOL Education,
the University of Queensland (QLD)
Emerging Exporter Award
Health Projects International (NSW)
Information and Communications
Technology Award
Codan Limited (SA)
Large Advanced Manufacturer Award
Finisar Australia (NSW)
Large Services Award
Aspen Medical (ACT)
Minerals and Energy Award
Sedgman Limited (QLD)
Regional Exporter Award
Almondco Australia (SA)
Small Business Award
MTECH Systems (VIC)
Small to Medium Manufacturer Award
PWR Performance Products (QLD)
Small to Medium Services Award
Prism Defence (SA)
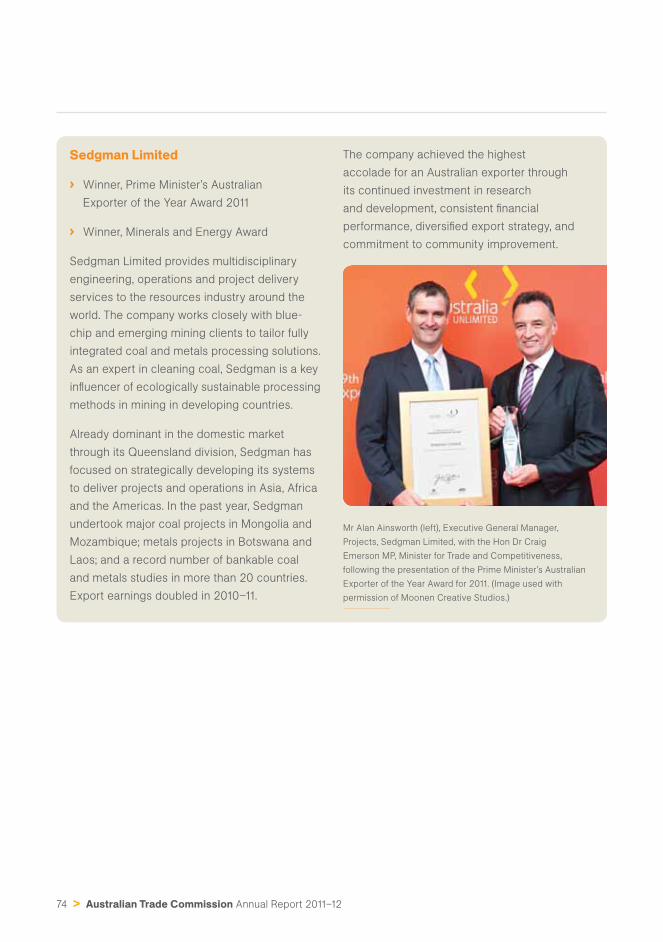
74 > Australian Trade Commission Annual Report 2011–12
Sedgman Limited
› Winner, Prime Minister’s Australian
Exporter of the Year Award 2011
› Winner, Minerals and Energy Award
Sedgman Limited provides multidisciplinary
engineering, operations and project delivery
services to the resources industry around the
world. The company works closely with blue-
chip and emerging mining clients to tailor fully
integrated coal and metals processing solutions.
As an expert in cleaning coal, Sedgman is a key
infl uencer of ecologically sustainable processing
methods in mining in developing countries.
Already dominant in the domestic market
through its Queensland division, Sedgman has
focused on strategically developing its systems
to deliver projects and operations in Asia, Africa
and the Americas. In the past year, Sedgman
undertook major coal projects in Mongolia and
Mozambique; metals projects in Botswana and
Laos; and a record number of bankable coal
and metals studies in more than 20 countries.
Export earnings doubled in 2010–11.
The company achieved the highest
accolade for an Australian exporter through
its continued investment in research
and development, consistent fi nancial
performance, diversifi ed export strategy, and
commitment to community improvement.
Mr Alan Ainsworth (left), Executive General Manager,
Projects, Sedgman Limited, with the Hon Dr Craig
Emerson MP, Minister for Trade and Competitiveness,
following the presentation of the Prime Minister’s Australian
Exporter of the Year Award for 2011. (Image used with
permission of Moonen Creative Studios.)
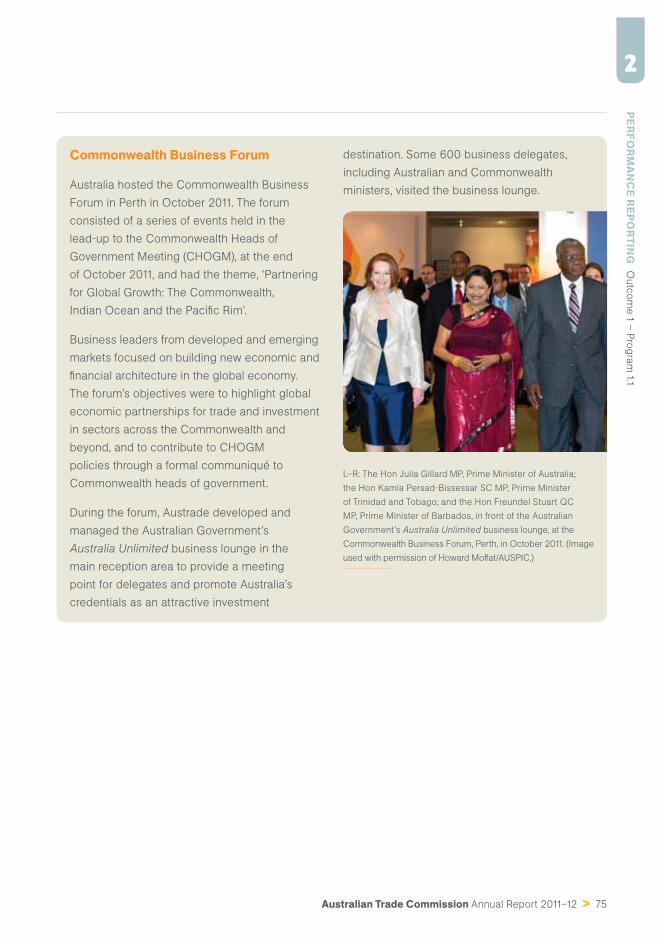
Australian Trade Commission Annual Report 2011–12 > 75
PERFO
RM
AN
CE R
EPOR
TING
O
utc
om
e 1 –
Pro
gra
m 1.1
2
Commonwealth Business Forum
Australia hosted the Commonwealth Business
Forum in Perth in October 2011. The forum
consisted of a series of events held in the
lead-up to the Commonwealth Heads of
Government Meeting (CHOGM), at the end
of October 2011, and had the theme, ‘Partnering
for Global Growth: The Commonwealth,
Indian Ocean and the Pacifi c Rim’.
Business leaders from developed and emerging
markets focused on building new economic and
fi nancial architecture in the global economy.
The forum’s objectives were to highlight global
economic partnerships for trade and investment
in sectors across the Commonwealth and
beyond, and to contribute to CHOGM
policies through a formal communiqué to
Commonwealth heads of government.
During the forum, Austrade developed and
managed the Australian Government’s
Australia Unlimited business lounge in the
main reception area to provide a meeting
point for delegates and promote Australia’s
credentials as an attractive investment
destination. Some 600 business delegates,
including Australian and Commonwealth
ministers, visited the business lounge.
L–R: The Hon Julia Gillard MP, Prime Minister of Australia;
the Hon Kamla Persad-Bissessar SC MP, Prime Minister
of Trinidad and Tobago; and the Hon Freundel Stuart QC
MP, Prime Minister of Barbados, in front of the Australian
Government’s Australia Unlimited business lounge, at the
Commonwealth Business Forum, Perth, in October 2011. (Image
used with permission of Howard Moff at/AUSPIC.)
76 > Australian Trade Commission Annual Report 2011–12
Contributing to the whole-of-government policy agenda and collaborating with key stakeholders
Performance measure Outcome
Eff ective contribution to
whole-of-government
policy development
utilising Austrade’s global,
commercial perspective
on export, investment and
international education.
In 2011–12, Austrade contributed to whole-of-government policy
development, program management and service delivery through
various processes and forums. During the year, Austrade:
› contributed, together with the Department of Foreign Aff airs
and Trade, to the Prime Minister’s Taskforce on Manufacturing
and participated in the taskforce secretariat
› coordinated trade development activities for the Australia–
China 2.0 trade mission, led by the Minister for Trade and
Competitiveness. The mission involved 100 delegates from
92 Australian businesses, who visited fi ve cities across China
during the seven-day multi-sector mission promoting engagement
in western China (for further details, see page 20)
› provided support for the white paper on Australia in the ‘Asian century’
› worked closely across Commonwealth, state and territory governments
to better target investment promotion, as discussed on page 61.
Eff ective collaboration
and partnerships with
stakeholders including
other Commonwealth
government agencies,
state and territory
governments, business
and industry associations
and institutions.
Note: This measure is also
reported on page 39.
In 2011–12, Austrade worked closely with trade, investment,
education and promotion stakeholders, businesses
and industry associations and institutions.
› In April 2012, Austrade chaired the inaugural meeting of the
Senior Offi cials Trade and Investment Group, which includes
representatives from Austrade and state and territory governments,
to develop shared trade and investment promotion initiatives.
› Austrade worked closely with a range of business and
industry chambers, including the Australia Gulf Council.
› Austrade’s partnership with Tourism Australia and the
Department of Resources, Energy and Tourism was
launched in May 2012 to promote infrastructure investment
opportunities across the Australian tourism industry.
› Austrade also worked closely with the Export Finance
and Insurance Corporation and the Australian Agency
for International Development and engaged with other
Australian Government agencies on a regular basis.
Australian Trade Commission Annual Report 2011–12 > 77
PERFO
RM
AN
CE R
EPOR
TING
O
utc
om
e 1 –
Pro
gra
m 1.1
2
Contributions to the policy agenda
Throughout 2011–12, Austrade contributed a trade,
investment and education perspective to policy
issues of importance to exporters and investors.
Austrade worked with the Department of Foreign
Aff airs and Trade on a number of signifi cant
policy processes and forums, including the
Prime Minister’s Taskforce on Manufacturing
(see page 79), the National Food Plan Green Paper
launched in July 2012, and the 2011 Australia–
China 2.0 trade mission, led by the Minister for
Trade and Competitiveness (see page 20).
Austrade and Export Finance and Insurance
Corporation (EFIC) offi cials progressed joint
activities in various markets, including Latin
America, the Middle East, Mongolia, Central
Asia, Southeast Asia, India and Africa, and
in industry sectors, including manufacturing,
engineering, consulting, pharmaceuticals, scientifi c
instruments, mining services and construction.
Collaboration objectives also extended to joint
marketing, which included the appearance
of both Austrade and EFIC executives in a
series of television interviews on the Sky News
Business Channel’s Switzer program, client
referrals, missions, hot-desk arrangements
for EFIC staff visiting Austrade offi ces, and
Australian Export Awards sponsorship.
Austrade worked with the Australian Agency for
International Development (AusAID) on a number
of initiatives both in Australia and overseas,
including the Australian Government’s Mining for
Development Initiative, which links Australian and
African educational institutions of relevance and
identifi es individual or corporate partners to support
the core program aims of improving resource
governance, building resource sustainability
and building technical capacity across Africa.
Austrade also engaged with other government
departments, including the Department of
Industry, Innovation, Science, Research and
Tertiary Education (DIISRTE), the Department of
Agriculture, Fisheries and Forestry, the Department
of Immigration and Citizenship, the Department
of the Prime Minister and Cabinet, and the
Department of Resources, Energy and Tourism.
Specifi cally, Austrade worked with DIISRTE under
the Buy Australian at Home and Abroad initiative,
to provide assistance to the Resources Sector
Supplier Envoy’s trade mission to Latin America
in April 2012. The mission visited four countries
and coincided with the visit to the region by
the Minister for Trade and Competitiveness,
reinforcing the strong message of Australian
commercial engagement with Latin America.
Austrade also worked with DIISRTE on the
Government response to the report of the
Book Industry Strategy Group, participating in
the interdepartmental committee process.
In May 2012, Austrade, the Department
of Resources, Energy and Tourism and
Tourism Australia announced a fi ve-year
strategic partnership to promote investment
opportunities across the Australian tourism
industry to foreign investors. The partnership
aims to increase the fl ow of investment into
Australia’s almost $35 billion tourism industry.
Further information is available on page 67.
Austrade contributed to an interdepartmental
committee, led by the Department of Agriculture,
Fisheries and Forestry, on the review of
the Australian Government’s Agricultural
Emergency Plan with respect to minimising
implications for international agricultural trade.
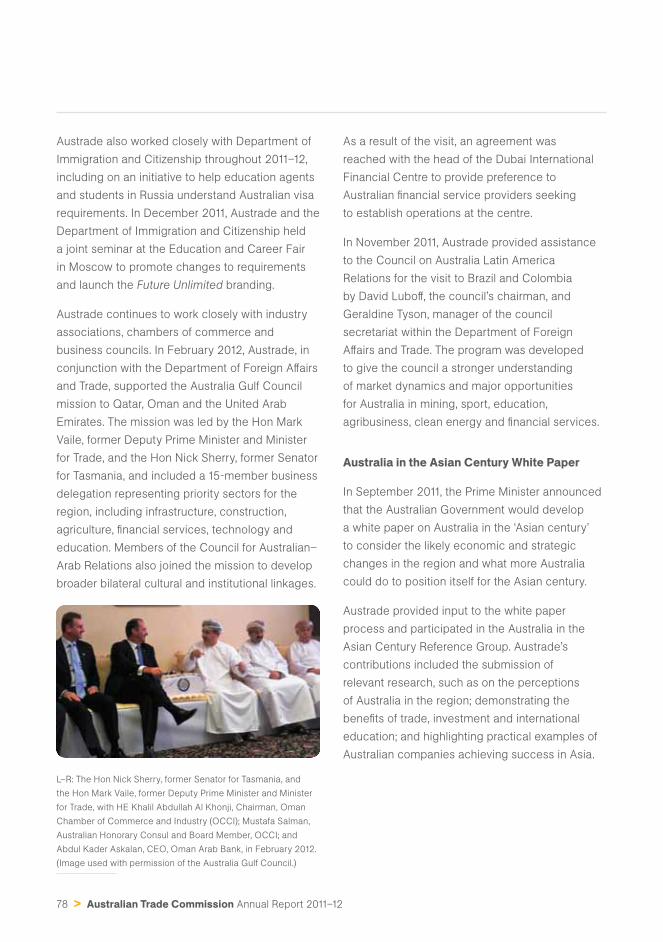
78 > Australian Trade Commission Annual Report 2011–12
Austrade also worked closely with Department of
Immigration and Citizenship throughout 2011–12,
including on an initiative to help education agents
and students in Russia understand Australian visa
requirements. In December 2011, Austrade and the
Department of Immigration and Citizenship held
a joint seminar at the Education and Career Fair
in Moscow to promote changes to requirements
and launch the Future Unlimited branding.
Austrade continues to work closely with industry
associations, chambers of commerce and
business councils. In February 2012, Austrade, in
conjunction with the Department of Foreign Aff airs
and Trade, supported the Australia Gulf Council
mission to Qatar, Oman and the United Arab
Emirates. The mission was led by the Hon Mark
Vaile, former Deputy Prime Minister and Minister
for Trade, and the Hon Nick Sherry, former Senator
for Tasmania, and included a 15-member business
delegation representing priority sectors for the
region, including infrastructure, construction,
agriculture, fi nancial services, technology and
education. Members of the Council for Australian–
Arab Relations also joined the mission to develop
broader bilateral cultural and institutional linkages.
L–R: The Hon Nick Sherry, former Senator for Tasmania, and
the Hon Mark Vaile, former Deputy Prime Minister and Minister
for Trade, with HE Khalil Abdullah Al Khonji, Chairman, Oman
Chamber of Commerce and Industry (OCCI); Mustafa Salman,
Australian Honorary Consul and Board Member, OCCI; and
Abdul Kader Askalan, CEO, Oman Arab Bank, in February 2012.
(Image used with permission of the Australia Gulf Council.)
As a result of the visit, an agreement was
reached with the head of the Dubai International
Financial Centre to provide preference to
Australian fi nancial service providers seeking
to establish operations at the centre.
In November 2011, Austrade provided assistance
to the Council on Australia Latin America
Relations for the visit to Brazil and Colombia
by David Luboff , the council’s chairman, and
Geraldine Tyson, manager of the council
secretariat within the Department of Foreign
Aff airs and Trade. The program was developed
to give the council a stronger understanding
of market dynamics and major opportunities
for Australia in mining, sport, education,
agribusiness, clean energy and fi nancial services.
Australia in the Asian Century White Paper
In September 2011, the Prime Minister announced
that the Australian Government would develop
a white paper on Australia in the ‘Asian century’
to consider the likely economic and strategic
changes in the region and what more Australia
could do to position itself for the Asian century.
Austrade provided input to the white paper
process and participated in the Australia in the
Asian Century Reference Group. Austrade’s
contributions included the submission of
relevant research, such as on the perceptions
of Australia in the region; demonstrating the
benefi ts of trade, investment and international
education; and highlighting practical examples of
Australian companies achieving success in Asia.
Australian Trade Commission Annual Report 2011–12 > 79
PERFO
RM
AN
CE R
EPOR
TING
O
utc
om
e 1 –
Pro
gra
m 1.1
2
Prime Minister’s Taskforce on Manufacturing
The Prime Minister’s Taskforce on Manufacturing
was announced in October 2011 to develop
a vision for the future of manufacturing and
identify a plan to leverage the Government’s
existing policies and programs to capture the
opportunities arising from the Asian century.
Austrade supported the taskforce through
representation on the Deputy Secretaries
Working Group and on the secretariat in
the Department of Industry, Innovation,
Science, Research and Tertiary Education.
Austrade and the Department of Foreign Aff airs
and Trade were the lead agencies for the
taskforce paper, Asian market opportunities
and barriers: audit of potential trade into
Asia and other markets. The paper explored
trends in elaborately and simply transformed
manufactures across markets. It also illustrated
opportunities for Australian manufacturing in
China, India, Indonesia, Japan, Korea, Malaysia
and Vietnam, in sectors such as medical devices
and technologies; food (including logistics); water,
environment and energy effi ciency; resources
and infrastructure; and automotive components.
Collaboration with state and territory governments
Austrade continued to work closely with state
and territory governments on initiatives both in
Australia and overseas to build on Australia’s
trade and investment interests and outcomes.
Austrade supported several state government visits
overseas throughout 2011–12, including visits to
India by the Hon Barry O’Farrell MP, Premier of New
South Wales, in November 2011 and by the Hon Ted
Baillieu MP, Premier of Victoria, in February 2012. On
both occasions, the premiers were accompanied
by business delegations and Austrade worked
closely with their respective state governments
to arrange appointments for the delegations and
support networking events. For example, Austrade
supported a Victorian Government industry event
held at the Mumbai racecourse in February 2012 to
promote Australia as a destination for tourism, sport
and business, which attracted over 300 guests.
The Victorian Government partnered with the
Victoria Racing Club to host the event, which
was attended by Mr Baillieu and the Hon Louise
Asher MP, Victorian Minister for Tourism.
Austrade supported the event by inviting relevant
contacts from Indian industry and facilitating
engagement between the Royal Western India
Turf Club and the Victoria Racing Club. The event
provided an opportunity to connect prospective
investors and trading partners with a high level of
interest in sport, and provided a platform to promote
Australia to Indian business representatives. The
2012 Emirates Melbourne Cup was on display and
Christophe Lemaire, the 2011 Emirates Melbourne
Cup winning jockey, was also in attendance.
Members of the Royal Western India Turf Club are
expected to travel to Australia for the Melbourne
Cup in 2012 and Austrade will assist the group
with trade and investment opportunities.
Senior Offi cials Trade and Investment Group
Austrade led the establishment in April 2012 of
the Senior Offi cials Trade and Investment Group.
The group was set up to enhance coordination
and collaboration between Commonwealth,
state and territory governments on ways to grow
Australia’s international trade and investment.
The aims and objectives of the Senior
Offi cials Trade and Investment Group are to
identify and agree on shared objectives and
priorities with respect to international trade
80 > Australian Trade Commission Annual Report 2011–12
and investment; formulate a joint plan of
action covering a small number of practical
and tangible areas for collaboration; and
achieve outcomes with mutual benefi t at the
Commonwealth and state and territory levels.
The Senior Offi cials Trade and Investment
Group also leads, directs and approves
the operational work of the National
Investment Advisory Board and the National
Trade Development Working Group.
At its inaugural meeting held in April 2012
in Melbourne, the Senior Offi cials Trade and
Investment Group agreed to jointly mobilise
around the four Commonwealth investment
priorities, starting with tourism. Of the three
state and territory priorities, the group agreed
to begin collaborative work on resource
technology, services and processing. The
group also agreed to work on identifying
industry capability for trade opportunities
and on the harmonisation of branding.
National Investment Advisory Board
Following the Senior Offi cials Trade and
Investment Group meeting in Melbourne,
the 20th meeting of the National Investment
Advisory Board was held in Darwin in
May 2012. Four Commonwealth Government
investment priorities were discussed with
state and territory governments, with the
board agreeing to working groups to support
the development of each priority. The board
also agreed to progress the scoping study on
resource technology, services and processing
as a state and territory investment priority.
More broadly, the National Investment Advisory
Board agreed to focus on the development
of protocols to guide more eff ective
collaboration domestically and overseas
among Commonwealth, state and territory
governments as they promote, attract and
facilitate foreign investment for Australia.
National Trade Development Working Group
The National Trade Development Working Group,
which was formed to coordinate operational
trade promotion and collaboration matters
across Commonwealth, state and territory
governments, held its third meeting in Darwin
in June 2012. Meeting outcomes included
developing collaborative brand identity guidelines
and events collaboration protocols. Two working
groups were established, one to enable state
and territory governments to provide industry
capability information to match overseas trade
opportunities identifi ed by Austrade, and the other
to coordinate marketing and communications.
Attached agency agreements
Austrade administered a number of service
agreements for property and administrative
support in overseas locations with attached
agencies, including the Department of Foreign
Aff airs and Trade; AusFilm; the Australian Federal
Police; Wine Australia; Australian Education
International; the Department of Agriculture,
Fisheries and Forestry; the Department of
Immigration and Citizenship; the South Australian
Department of Manufacturing, Innovation,
Trade, Resources and Energy; Trade and
Investment Queensland; and the Victorian
Department of Business and Innovation.
Austrade delivers services to, and works
with, these agencies and departments
overseas to ensure that government
eff orts, both Commonwealth and state and
territory, are coordinated and targeted.
Australian Trade Commission Annual Report 2011–12 > 81
PERFO
RM
AN
CE R
EPOR
TING
O
utc
om
e 1 –
Pro
gra
m 1.1
2
Parliamentary inquiries and briefi ngs
In 2011–12, Austrade provided input to
the Joint Standing Committee on Foreign
Aff airs, Defence and Trade, including:
› a formal submission to the inquiry into
Australia’s overseas representation
and appearance before the
committee in February 2012
› a formal Department of Foreign Aff airs and
Trade – Austrade joint submission to the inquiry
into Australia’s trade relationships with Japan
and the Republic of Korea and appearance
before the committee in March 2012
› a formal submission to the inquiry into
the importance of the Indian Ocean
region and Australia’s foreign, trade
and defence policy in April 2012.
Additionally, Austrade appeared before the
Parliamentary Joint Committee on the Australian
Commission for Law Enforcement Integrity
inquiry into the integrity of Commonwealth law
enforcement operations overseas in May 2012.
Austrade also provided support to parliamentary
delegations and other visit programs both in
Australia and overseas throughout 2011–12,
including participation in a Department of
Foreign Aff airs and Trade-led briefi ng in
October 2011 of a parliamentary delegation
to the United States led by Senator the
Hon John Hogg, President of the Senate.
Services to government
Austrade provided services to the Minister
for Trade and Competitiveness and the
Parliamentary Secretary for Trade, including
through the provision of a full-time departmental
liaison offi cer located in the Minister’s offi ce.
Austrade reported to the Minister for Trade
and Competitiveness on its progress towards
achieving the Government’s objectives
through regular reports and ongoing
briefi ng material. Austrade also provided
advice and assistance to the Parliamentary
Secretary for Trade, other parliamentarians
and state and territory governments.
In 2011–12, Austrade produced 80 written briefs,
52 submissions and prepared responses to
106 items of ministerial correspondence.
Austrade also met with the Minister and the
Parliamentary Secretary as well as their respective
offi ce staff to give context to written briefs
and discuss ongoing issues when required.
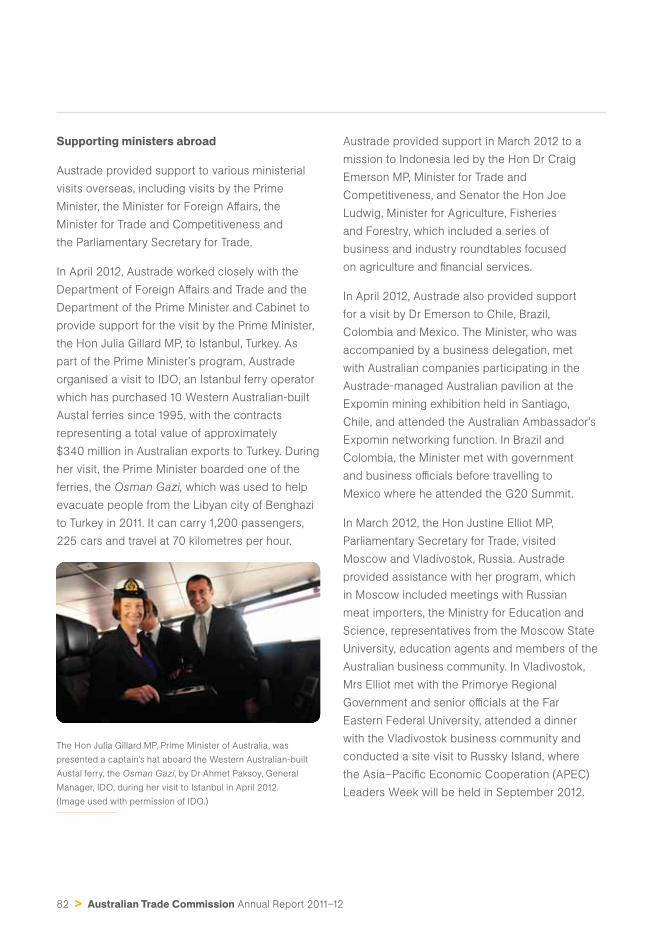
82 > Australian Trade Commission Annual Report 2011–12
Supporting ministers abroad
Austrade provided support to various ministerial
visits overseas, including visits by the Prime
Minister, the Minister for Foreign Aff airs, the
Minister for Trade and Competitiveness and
the Parliamentary Secretary for Trade.
In April 2012, Austrade worked closely with the
Department of Foreign Aff airs and Trade and the
Department of the Prime Minister and Cabinet to
provide support for the visit by the Prime Minister,
the Hon Julia Gillard MP, to Istanbul, Turkey. As
part of the Prime Minister’s program, Austrade
organised a visit to IDO, an Istanbul ferry operator
which has purchased 10 Western Australian-built
Austal ferries since 1995, with the contracts
representing a total value of approximately
$340 million in Australian exports to Turkey. During
her visit, the Prime Minister boarded one of the
ferries, the Osman Gazi, which was used to help
evacuate people from the Libyan city of Benghazi
to Turkey in 2011. It can carry 1,200 passengers,
225 cars and travel at 70 kilometres per hour.
The Hon Julia Gillard MP, Prime Minister of Australia, was
presented a captain’s hat aboard the Western Australian-built
Austal ferry, the Osman Gazi, by Dr Ahmet Paksoy, General
Manager, IDO, during her visit to Istanbul in April 2012.
(Image used with permission of IDO.)
Austrade provided support in March 2012 to a
mission to Indonesia led by the Hon Dr Craig
Emerson MP, Minister for Trade and
Competitiveness, and Senator the Hon Joe
Ludwig, Minister for Agriculture, Fisheries
and Forestry, which included a series of
business and industry roundtables focused
on agriculture and fi nancial services.
In April 2012, Austrade also provided support
for a visit by Dr Emerson to Chile, Brazil,
Colombia and Mexico. The Minister, who was
accompanied by a business delegation, met
with Australian companies participating in the
Austrade-managed Australian pavilion at the
Expomin mining exhibition held in Santiago,
Chile, and attended the Australian Ambassador’s
Expomin networking function. In Brazil and
Colombia, the Minister met with government
and business offi cials before travelling to
Mexico where he attended the G20 Summit.
In March 2012, the Hon Justine Elliot MP,
Parliamentary Secretary for Trade, visited
Moscow and Vladivostok, Russia. Austrade
provided assistance with her program, which
in Moscow included meetings with Russian
meat importers, the Ministry for Education and
Science, representatives from the Moscow State
University, education agents and members of the
Australian business community. In Vladivostok,
Mrs Elliot met with the Primorye Regional
Government and senior offi cials at the Far
Eastern Federal University, attended a dinner
with the Vladivostok business community and
conducted a site visit to Russky Island, where
the Asia–Pacifi c Economic Cooperation (APEC)
Leaders Week will be held in September 2012.
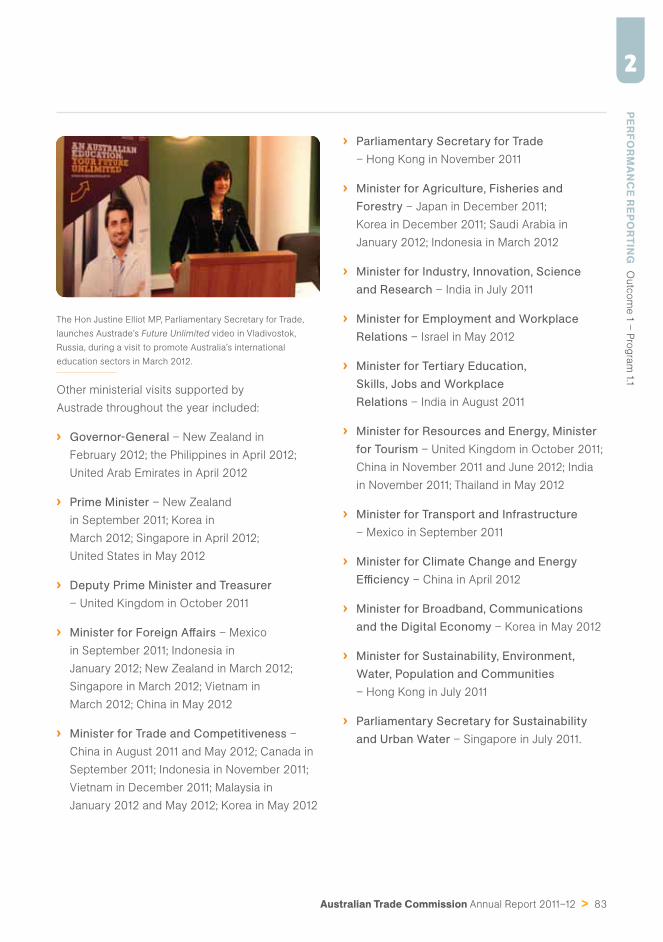
Australian Trade Commission Annual Report 2011–12 > 83
PERFO
RM
AN
CE R
EPOR
TING
O
utc
om
e 1 –
Pro
gra
m 1.1
2
The Hon Justine Elliot MP, Parliamentary Secretary for Trade,
launches Austrade’s Future Unlimited video in Vladivostok,
Russia, during a visit to promote Australia’s international
education sectors in March 2012.
Other ministerial visits supported by
Austrade throughout the year included:
› Governor-General – New Zealand in
February 2012; the Philippines in April 2012;
United Arab Emirates in April 2012
› Prime Minister – New Zealand
in September 2011; Korea in
March 2012; Singapore in April 2012;
United States in May 2012
› Deputy Prime Minister and Treasurer
– United Kingdom in October 2011
› Minister for Foreign Aff airs – Mexico
in September 2011; Indonesia in
January 2012; New Zealand in March 2012;
Singapore in March 2012; Vietnam in
March 2012; China in May 2012
› Minister for Trade and Competitiveness –
China in August 2011 and May 2012; Canada in
September 2011; Indonesia in November 2011;
Vietnam in December 2011; Malaysia in
January 2012 and May 2012; Korea in May 2012
› Parliamentary Secretary for Trade
– Hong Kong in November 2011
› Minister for Agriculture, Fisheries and
Forestry – Japan in December 2011;
Korea in December 2011; Saudi Arabia in
January 2012; Indonesia in March 2012
› Minister for Industry, Innovation, Science
and Research – India in July 2011
› Minister for Employment and Workplace
Relations – Israel in May 2012
› Minister for Tertiary Education,
Skills, Jobs and Workplace
Relations – India in August 2011
› Minister for Resources and Energy, Minister
for Tourism – United Kingdom in October 2011;
China in November 2011 and June 2012; India
in November 2011; Thailand in May 2012
› Minister for Transport and Infrastructure
– Mexico in September 2011
› Minister for Climate Change and Energy
Effi ciency – China in April 2012
› Minister for Broadband, Communications
and the Digital Economy – Korea in May 2012
› Minister for Sustainability, Environment,
Water, Population and Communities
– Hong Kong in July 2011
› Parliamentary Secretary for Sustainability
and Urban Water – Singapore in July 2011.
84 > Australian Trade Commission Annual Report 2011–12
Visits by foreign government representatives
As well as providing support to visits by
Australian ministers overseas, Austrade also
provided support for visits by foreign government
delegations throughout the year, including the
Mexican Vice Minister for Mining in August 2011
and again in November 2011; the Crown Prince
and Princess of Denmark in November 2011; the
Mexican Economy Minister in February 2012;
the Chinese Minister of Commerce in April 2012;
the Prime Minister of Thailand in May 2012; the
Thai Energy Minister in May 2012; the Saudi
Arabian Minister of Petroleum and Mineral
Resources in May 2012; and the Chinese
Guangdong Party Secretary in June 2012.
Australian Trade Commission Annual Report 2011–12 > 85
2PER
FOR
MA
NC
E REPO
RTIN
G
Outc
om
e 1 –
Pro
gra
m 1.2
Outcome 1
Advance Australia’s trade and investment interests through information, advice and
services to businesses, industry and governments
Program 1.2: Trade development schemes —
Export Market Development Grants
Objective
Provide an incentive for businesses to enter into
export and grow to become sustainable exporters.
Deliverable
Administration of the Export Market
Development Grants scheme, providing
partial reimbursement for expenditure on
eligible export promotion activities.
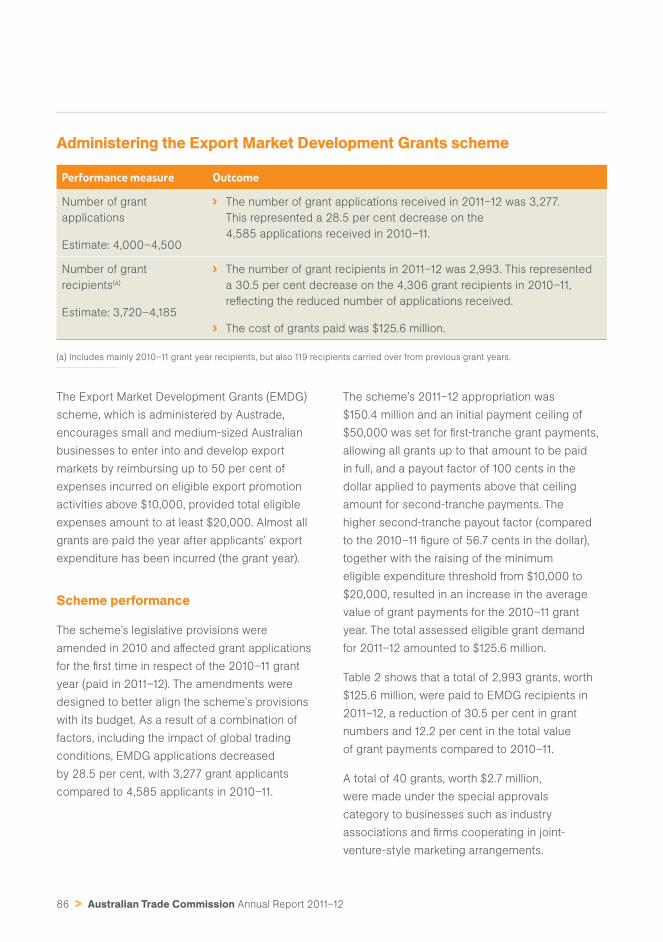
86 > Australian Trade Commission Annual Report 2011–12
Administering the Export Market Development Grants scheme
Performance measure Outcome
Number of grant
applications
Estimate: 4,000–4,500
› The number of grant applications received in 2011–12 was 3,277.
This represented a 28.5 per cent decrease on the
4,585 applications received in 2010–11.
Number of grant
recipients(a)
Estimate: 3,720–4,185
› The number of grant recipients in 2011–12 was 2,993. This represented
a 30.5 per cent decrease on the 4,306 grant recipients in 2010–11,
refl ecting the reduced number of applications received.
› The cost of grants paid was $125.6 million.
(a) Includes mainly 2010–11 grant year recipients, but also 119 recipients carried over from previous grant years.
The Export Market Development Grants (EMDG)
scheme, which is administered by Austrade,
encourages small and medium-sized Australian
businesses to enter into and develop export
markets by reimbursing up to 50 per cent of
expenses incurred on eligible export promotion
activities above $10,000, provided total eligible
expenses amount to at least $20,000. Almost all
grants are paid the year after applicants’ export
expenditure has been incurred (the grant year).
Scheme performance
The scheme’s legislative provisions were
amended in 2010 and aff ected grant applications
for the fi rst time in respect of the 2010–11 grant
year (paid in 2011–12). The amendments were
designed to better align the scheme’s provisions
with its budget. As a result of a combination of
factors, including the impact of global trading
conditions, EMDG applications decreased
by 28.5 per cent, with 3,277 grant applicants
compared to 4,585 applicants in 2010–11.
The scheme’s 2011–12 appropriation was
$150.4 million and an initial payment ceiling of
$50,000 was set for fi rst-tranche grant payments,
allowing all grants up to that amount to be paid
in full, and a payout factor of 100 cents in the
dollar applied to payments above that ceiling
amount for second-tranche payments. The
higher second-tranche payout factor (compared
to the 2010–11 fi gure of 56.7 cents in the dollar),
together with the raising of the minimum
eligible expenditure threshold from $10,000 to
$20,000, resulted in an increase in the average
value of grant payments for the 2010–11 grant
year. The total assessed eligible grant demand
for 2011–12 amounted to $125.6 million.
Table 2 shows that a total of 2,993 grants, worth
$125.6 million, were paid to EMDG recipients in
2011–12, a reduction of 30.5 per cent in grant
numbers and 12.2 per cent in the total value
of grant payments compared to 2010–11.
A total of 40 grants, worth $2.7 million,
were made under the special approvals
category to businesses such as industry
associations and fi rms cooperating in joint-
venture-style marketing arrangements.
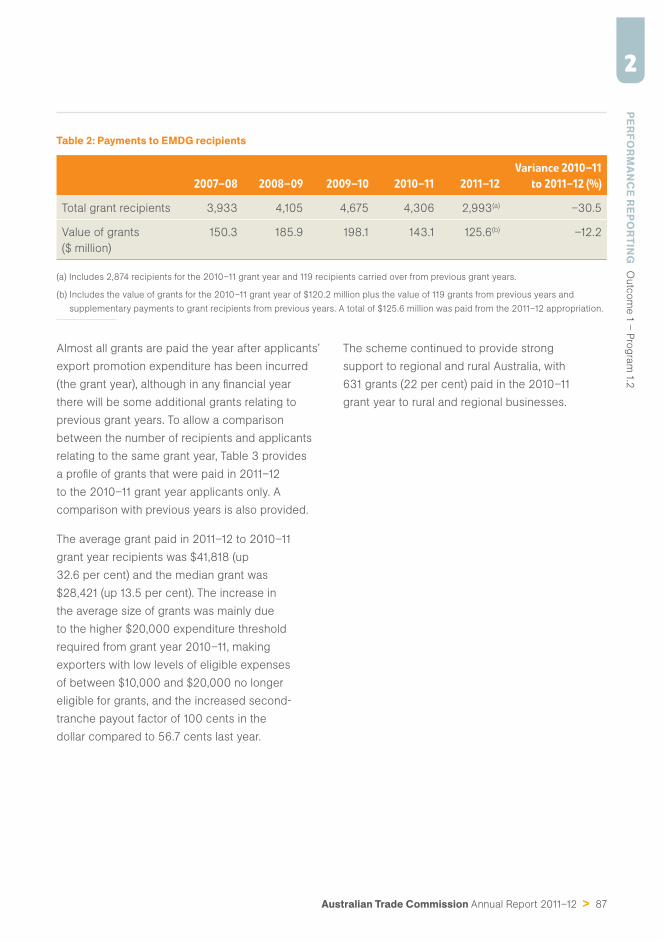
Australian Trade Commission Annual Report 2011–12 > 87
2PER
FOR
MA
NC
E REPO
RTIN
G
Outc
om
e 1 –
Pro
gra
m 1.2
Table 2: Payments to EMDG recipients
2007–08 2008–09 2009–10 2010–11 2011–12
Variance 2010–11
to 2011–12 (%)
Total grant recipients 3,933 4,105 4,675 4,306 2,993(a) –30.5
Value of grants
($ million)
150.3 185.9 198.1 143.1 125.6(b) –12.2
(a) Includes 2,874 recipients for the 2010–11 grant year and 119 recipients carried over from previous grant years.
(b) Includes the value of grants for the 2010–11 grant year of $120.2 million plus the value of 119 grants from previous years and
supplementary payments to grant recipients from previous years. A total of $125.6 million was paid from the 2011–12 appropriation.
Almost all grants are paid the year after applicants’
export promotion expenditure has been incurred
(the grant year), although in any fi nancial year
there will be some additional grants relating to
previous grant years. To allow a comparison
between the number of recipients and applicants
relating to the same grant year, Table 3 provides
a profi le of grants that were paid in 2011–12
to the 2010–11 grant year applicants only. A
comparison with previous years is also provided.
The average grant paid in 2011–12 to 2010–11
grant year recipients was $41,818 (up
32.6 per cent) and the median grant was
$28,421 (up 13.5 per cent). The increase in
the average size of grants was mainly due
to the higher $20,000 expenditure threshold
required from grant year 2010–11, making
exporters with low levels of eligible expenses
of between $10,000 and $20,000 no longer
eligible for grants, and the increased second-
tranche payout factor of 100 cents in the
dollar compared to 56.7 cents last year.
The scheme continued to provide strong
support to regional and rural Australia, with
631 grants (22 per cent) paid in the 2010–11
grant year to rural and regional businesses.
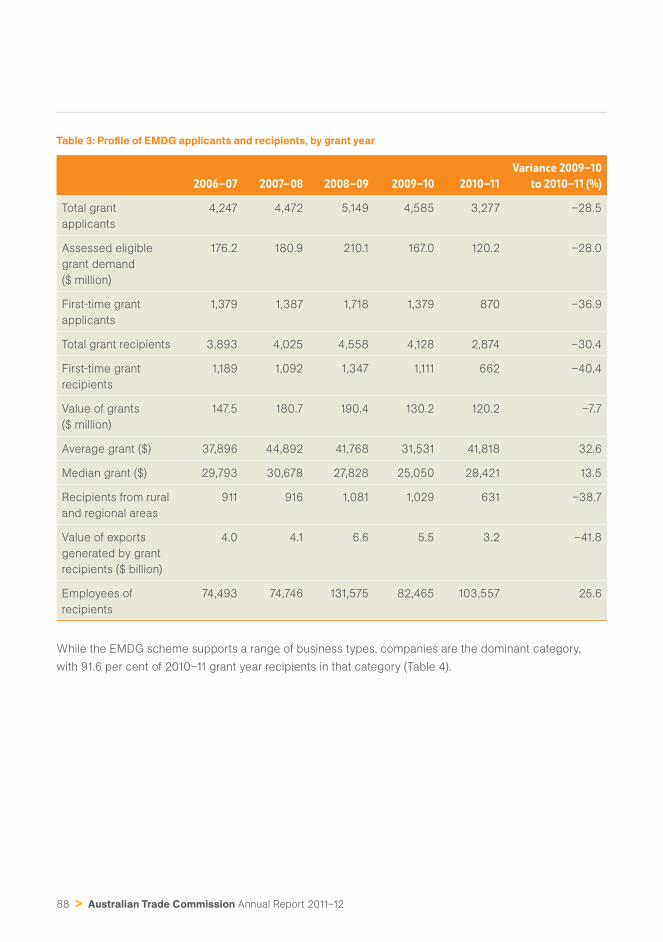
88 > Australian Trade Commission Annual Report 2011–12
Table 3: Profi le of EMDG applicants and recipients, by grant year
2006–07 2007–08 2008–09 2009–10 2010–11
Variance 2009–10
to 2010–11 (%)
Total grant
applicants
4,247 4,472 5,149 4,585 3,277 –28.5
Assessed eligible
grant demand
($ million)
176.2 180.9 210.1 167.0 120.2 –28.0
First-time grant
applicants
1,379 1,387 1,718 1,379 870 –36.9
Total grant recipients 3,893 4,025 4,558 4,128 2,874 –30.4
First-time grant
recipients
1,189 1,092 1,347 1,111 662 –40.4
Value of grants
($ million)
147.5 180.7 190.4 130.2 120.2 –7.7
Average grant ($) 37,896 44,892 41,768 31,531 41,818 32.6
Median grant ($) 29,793 30,678 27,828 25,050 28,421 13.5
Recipients from rural
and regional areas
911 916 1,081 1,029 631 –38.7
Value of exports
generated by grant
recipients ($ billion)
4.0 4.1 6.6 5.5 3.2 –41.8
Employees of
recipients
74,493 74,746 131,575 82,465 103,557 25.6
While the EMDG scheme supports a range of business types, companies are the dominant category,
with 91.6 per cent of 2010–11 grant year recipients in that category (Table 4).
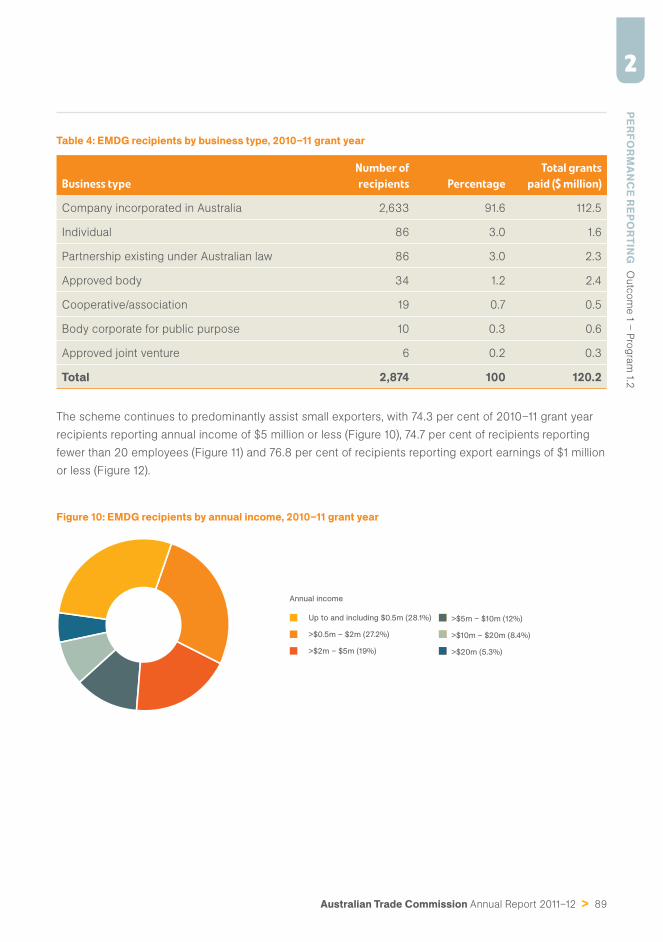
Australian Trade Commission Annual Report 2011–12 > 89
2PER
FOR
MA
NC
E REPO
RTIN
G
Outc
om
e 1 –
Pro
gra
m 1.2
Table 4: EMDG recipients by business type, 2010–11 grant year
Business type
Number of
recipients Percentage
Total grants
paid ($ million)
Company incorporated in Australia 2,633 91.6 112.5
Individual 86 3.0 1.6
Partnership existing under Australian law 86 3.0 2.3
Approved body 34 1.2 2.4
Cooperative/association 19 0.7 0.5
Body corporate for public purpose 10 0.3 0.6
Approved joint venture 6 0.2 0.3
Total 2,874 100 120.2
The scheme continues to predominantly assist small exporters, with 74.3 per cent of 2010–11 grant year
recipients reporting annual income of $5 million or less (Figure 10), 74.7 per cent of recipients reporting
fewer than 20 employees (Figure 11) and 76.8 per cent of recipients reporting export earnings of $1 million
or less (Figure 12).
Figure 10: EMDG recipients by annual income, 2010–11 grant year
Up to and including $0.5m (28.1%)
>$0.5m – $2m (27.2%)
>$2m – $5m (19%)
Annual income
>$5m – $10m (12%)
>$10m – $20m (8.4%)
>$20m (5.3%)
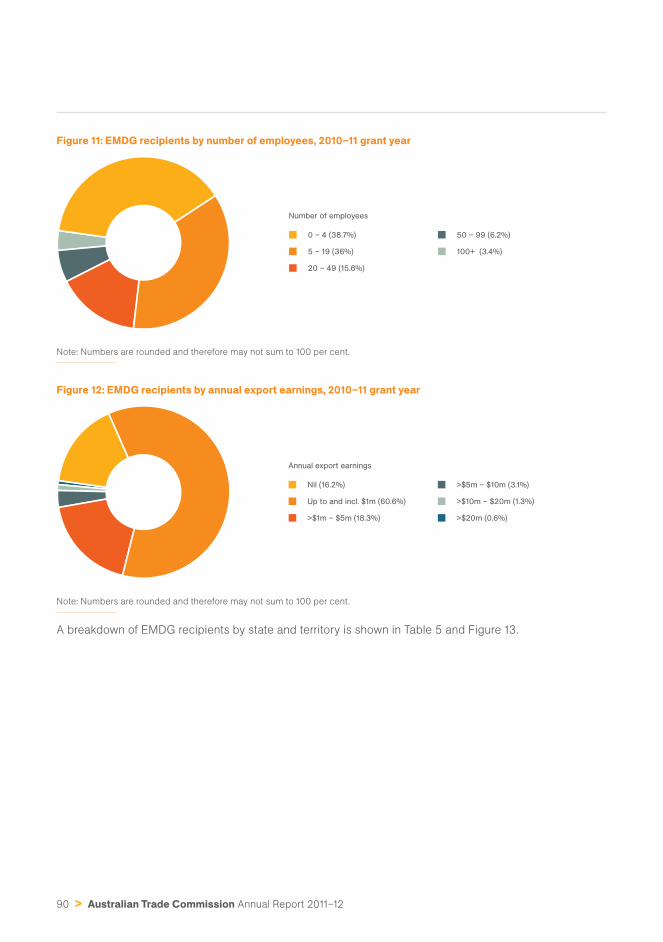
90 > Australian Trade Commission Annual Report 2011–12
Figure 11: EMDG recipients by number of employees, 2010–11 grant year
0 – 4 (38.7%)
5 – 19 (36%)
20 – 49 (15.6%)
Number of employees
50 – 99 (6.2%)
100+ (3.4%)
Note: Numbers are rounded and therefore may not sum to 100 per cent.
Figure 12: EMDG recipients by annual export earnings, 2010–11 grant year
Nil (16.2%)
Up to and incl. $1m (60.6%)
>$1m – $5m (18.3%)
Annual export earnings
>$5m – $10m (3.1%)
>$10m – $20m (1.3%)
>$20m (0.6%)
Note: Numbers are rounded and therefore may not sum to 100 per cent.
A breakdown of EMDG recipients by state and territory is shown in Table 5 and Figure 13.
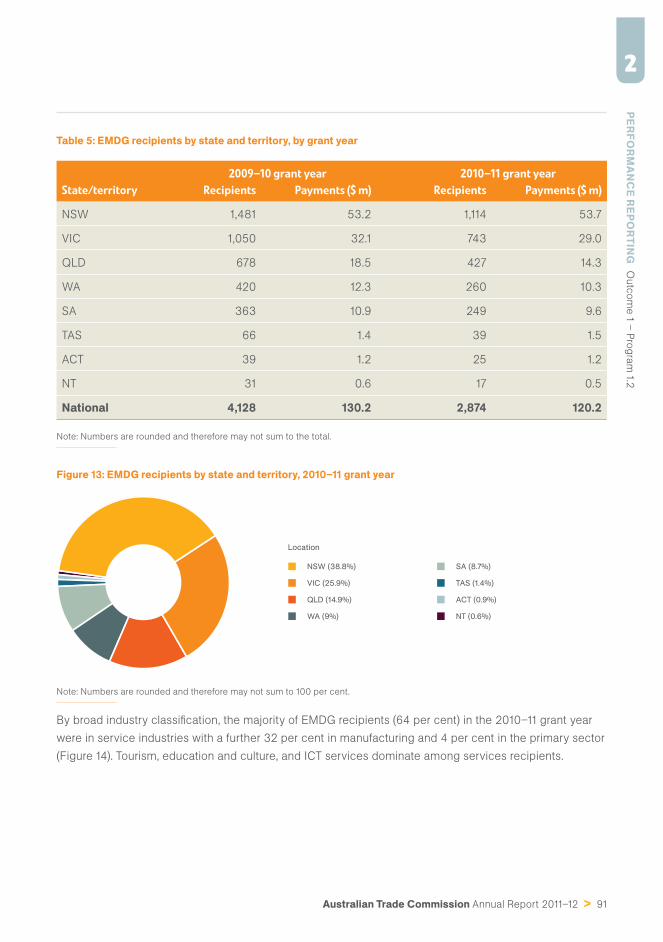
Australian Trade Commission Annual Report 2011–12 > 91
2PER
FOR
MA
NC
E REPO
RTIN
G
Outc
om
e 1 –
Pro
gra
m 1.2
Table 5: EMDG recipients by state and territory, by grant year
2009–10 grant year 2010–11 grant year
State/territory Recipients Payments ($ m) Recipients Payments ($ m)
NSW 1,481 53.2 1,114 53.7
VIC 1,050 32.1 743 29.0
QLD 678 18.5 427 14.3
WA 420 12.3 260 10.3
SA 363 10.9 249 9.6
TAS 66 1.4 39 1.5
ACT 39 1.2 25 1.2
NT 31 0.6 17 0.5
National 4,128 130.2 2,874 120.2
Note: Numbers are rounded and therefore may not sum to the total.
Figure 13: EMDG recipients by state and territory, 2010–11 grant year
NSW (38.8%)
VIC (25.9%)
QLD (14.9%)
WA (9%)
Location
SA (8.7%)
TAS (1.4%)
ACT (0.9%)
NT (0.6%)
Note: Numbers are rounded and therefore may not sum to 100 per cent.
By broad industry classifi cation, the majority of EMDG recipients (64 per cent) in the 2010–11 grant year
were in service industries with a further 32 per cent in manufacturing and 4 per cent in the primary sector
(Figure 14). Tourism, education and culture, and ICT services dominate among services recipients.
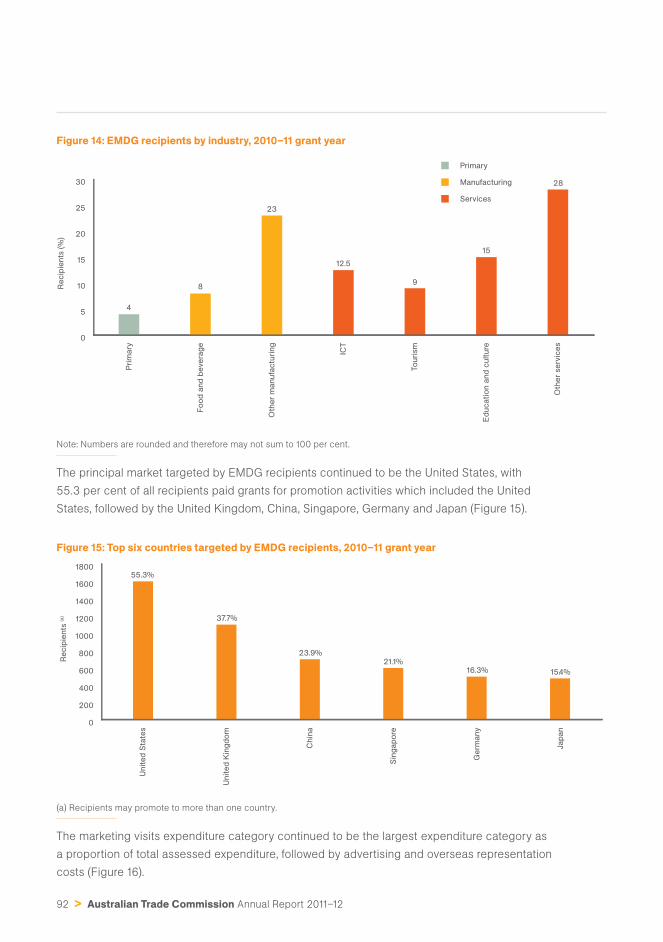
92 > Australian Trade Commission Annual Report 2011–12
Figure 14: EMDG recipients by industry, 2010–11 grant year
0
5
10
15
20
25
30
Pri
mary
Fo
od
and
be
ve
rag
e
Oth
er
manufa
ctu
ring
ICT
To
uri
sm
Ed
ucati
on a
nd
cult
ure
Oth
er
se
rvic
es
Re
cip
ients
(%
)
4
8
23
12.5
9
15
28
Primary
Manufacturing
Services
Note: Numbers are rounded and therefore may not sum to 100 per cent.
The principal market targeted by EMDG recipients continued to be the United States, with
55.3 per cent of all recipients paid grants for promotion activities which included the United
States, followed by the United Kingdom, China, Singapore, Germany and Japan (Figure 15).
Figure 15: Top six countries targeted by EMDG recipients, 2010–11 grant year
0
200
400
600
800
1000
1200
1400
1600
1800
Unit
ed
Sta
tes
Unit
ed
Kin
gd
om
Chin
a
Sin
gap
ore
Ge
rmany
Jap
an
Re
cip
ients
(a)
55.3%
37.7%
23.9%
21.1%
16.3% 15.4%
(a) Recipients may promote to more than one country.
The marketing visits expenditure category continued to be the largest expenditure category as
a proportion of total assessed expenditure, followed by advertising and overseas representation
costs (Figure 16).
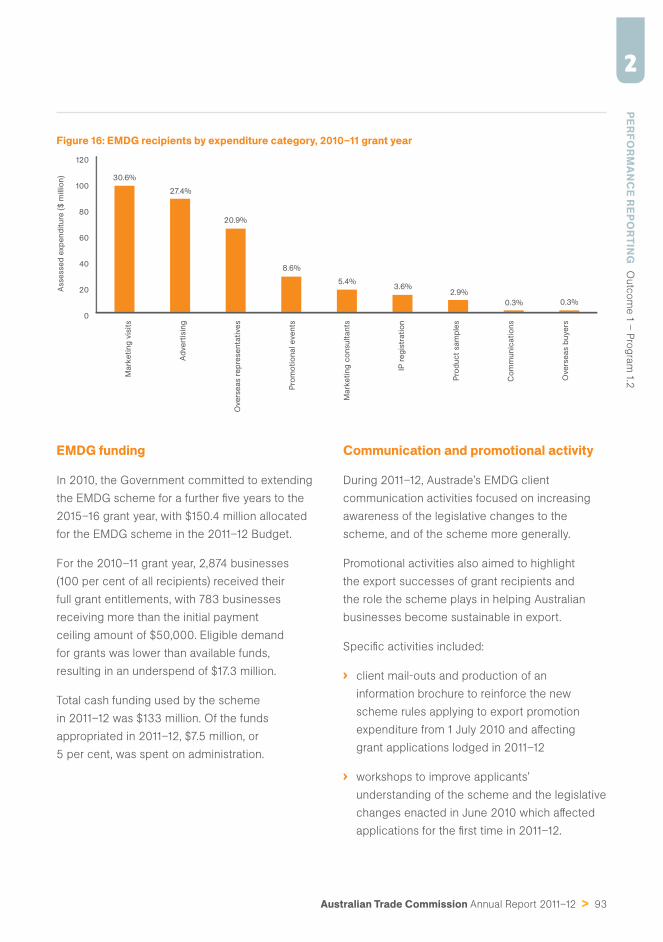
Australian Trade Commission Annual Report 2011–12 > 93
2PER
FOR
MA
NC
E REPO
RTIN
G
Outc
om
e 1 –
Pro
gra
m 1.2
Figure 16: EMDG recipients by expenditure category, 2010–11 grant year
0
20
40
60
80
100
120
Mark
eti
ng
vis
its
Ad
ve
rtis
ing
Ove
rse
as r
ep
rese
nta
tive
s
Pro
mo
tio
nal e
ve
nts
Mark
eti
ng
co
nsult
ants
IP r
eg
istr
ati
on
Pro
duct
sam
ple
s
Co
mm
unic
ati
ons
Ove
rse
as b
uye
rs
Asse
sse
d e
xp
end
iture
($
millio
n) 30.6%
27.4%
20.9%
8.6%
5.4%3.6%
2.9%
0.3% 0.3%
EMDG funding
In 2010, the Government committed to extending
the EMDG scheme for a further fi ve years to the
2015–16 grant year, with $150.4 million allocated
for the EMDG scheme in the 2011–12 Budget.
For the 2010–11 grant year, 2,874 businesses
(100 per cent of all recipients) received their
full grant entitlements, with 783 businesses
receiving more than the initial payment
ceiling amount of $50,000. Eligible demand
for grants was lower than available funds,
resulting in an underspend of $17.3 million.
Total cash funding used by the scheme
in 2011–12 was $133 million. Of the funds
appropriated in 2011–12, $7.5 million, or
5 per cent, was spent on administration.
Communication and promotional activity
During 2011–12, Austrade’s EMDG client
communication activities focused on increasing
awareness of the legislative changes to the
scheme, and of the scheme more generally.
Promotional activities also aimed to highlight
the export successes of grant recipients and
the role the scheme plays in helping Australian
businesses become sustainable in export.
Specifi c activities included:
› client mail-outs and production of an
information brochure to reinforce the new
scheme rules applying to export promotion
expenditure from 1 July 2010 and aff ecting
grant applications lodged in 2011–12
› workshops to improve applicants’
understanding of the scheme and the legislative
changes enacted in June 2010 which aff ected
applications for the fi rst time in 2011–12.
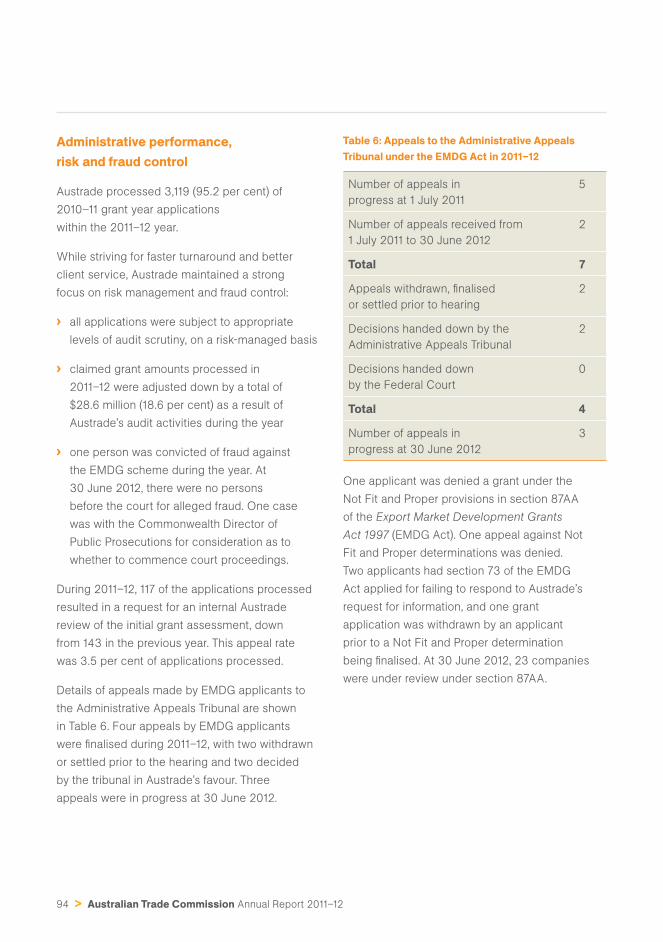
94 > Australian Trade Commission Annual Report 2011–12
Administrative performance, risk and fraud control
Austrade processed 3,119 (95.2 per cent) of
2010–11 grant year applications
within the 2011–12 year.
While striving for faster turnaround and better
client service, Austrade maintained a strong
focus on risk management and fraud control:
› all applications were subject to appropriate
levels of audit scrutiny, on a risk-managed basis
› claimed grant amounts processed in
2011–12 were adjusted down by a total of
$28.6 million (18.6 per cent) as a result of
Austrade’s audit activities during the year
› one person was convicted of fraud against
the EMDG scheme during the year. At
30 June 2012, there were no persons
before the court for alleged fraud. One case
was with the Commonwealth Director of
Public Prosecutions for consideration as to
whether to commence court proceedings.
During 2011–12, 117 of the applications processed
resulted in a request for an internal Austrade
review of the initial grant assessment, down
from 143 in the previous year. This appeal rate
was 3.5 per cent of applications processed.
Details of appeals made by EMDG applicants to
the Administrative Appeals Tribunal are shown
in Table 6. Four appeals by EMDG applicants
were fi nalised during 2011–12, with two withdrawn
or settled prior to the hearing and two decided
by the tribunal in Austrade’s favour. Three
appeals were in progress at 30 June 2012.
Table 6: Appeals to the Administrative Appeals Tribunal under the EMDG Act in 2011–12
Number of appeals in
progress at 1 July 2011
5
Number of appeals received from
1 July 2011 to 30 June 2012
2
Total 7
Appeals withdrawn, fi nalised
or settled prior to hearing
2
Decisions handed down by the
Administrative Appeals Tribunal
2
Decisions handed down
by the Federal Court
0
Total 4
Number of appeals in
progress at 30 June 2012
3
One applicant was denied a grant under the
Not Fit and Proper provisions in section 87AA
of the Export Market Development Grants
Act 1997 (EMDG Act). One appeal against Not
Fit and Proper determinations was denied.
Two applicants had section 73 of the EMDG
Act applied for failing to respond to Austrade’s
request for information, and one grant
application was withdrawn by an applicant
prior to a Not Fit and Proper determination
being fi nalised. At 30 June 2012, 23 companies
were under review under section 87AA.
Australian Trade Commission Annual Report 2011–12 > 95
2PER
FOR
MA
NC
E REPO
RTIN
G
Outc
om
e 1 –
Pro
gra
m 1.2
EMDG assists Comscentre in Asia
Comscentre is an Australian-owned company
that provides managed communications
across Australia and Asia, including corporate-
grade internet protocol telephony, data,
video, and local and wide area networks.
Since commencing operations in 2002, the
company now employs 86 full-time staff in
its Brisbane head offi ce and in its Sydney,
Melbourne and Perth operations, as well as in its
recently established support offi ce in Manila, the
Philippines. In 2009, Comscentre was ranked
as Australia’s tenth-fastest-growing company.
Comscentre’s customers benefi t from advanced
communications systems delivered by the
one organisation providing small to medium-
sized businesses with a level of sophistication
and service that was previously only available
to large enterprises. This delivers signifi cant
cost savings by outsourcing business
communications for a fi xed monthly fee.
Internationally, Comscentre has been
successful in securing a contract with
Malaysia-based airline AirAsia. Earnings from
this customer are now well into six fi gures
and exports account for 6 per cent of sales.
Comscentre’s new operation in Manila is a key
part of its growth strategy in the Asian region.
‘The EMDG was key to the establishment
of our Asian operation and from there the
ability to successfully pitch for AirAsia’,
said managing director, Ben Shipley. ‘The
grant allowed us to secure a consultant to
negotiate the Philippines’ commercial and
legal environment to establish the offi ce and
provide leads for business in the region’.
‘Numerous visits to Manila were required to
set up that operation and the EMDG was
of invaluable assistance and has helped
create Australian jobs’, said Mr Shipley.
The grant assisted the company by reimbursing
a substantial share of the cost of marketing
visits and assisting with the cost of maintaining
the external consultant. The consultant has
been employed to research new opportunities
in markets such as India, the Philippines,
Indonesia, France and the United Kingdom.
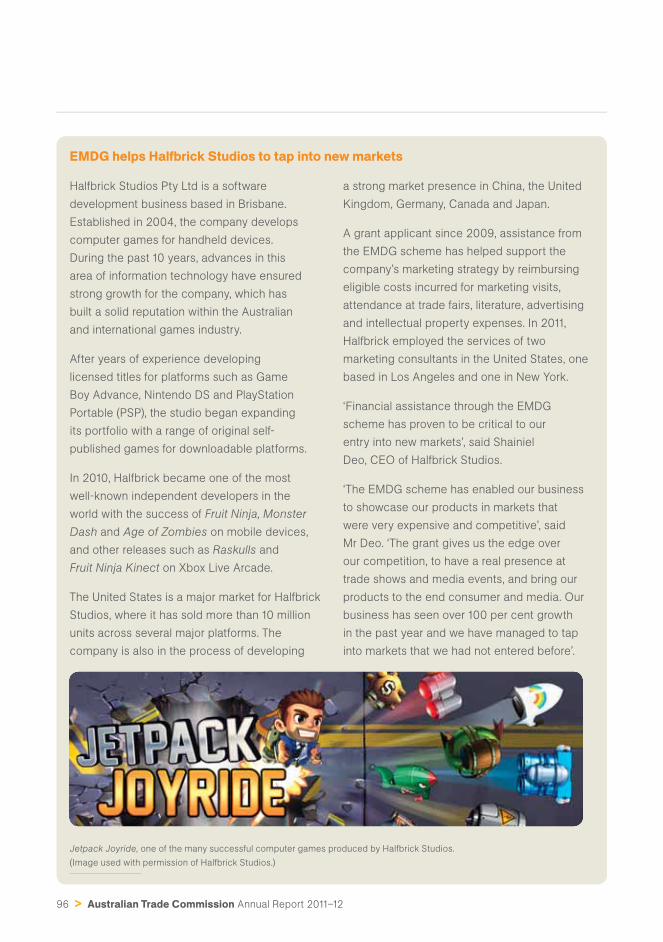
96 > Australian Trade Commission Annual Report 2011–12
EMDG helps Halfbrick Studios to tap into new markets
Halfbrick Studios Pty Ltd is a software
development business based in Brisbane.
Established in 2004, the company develops
computer games for handheld devices.
During the past 10 years, advances in this
area of information technology have ensured
strong growth for the company, which has
built a solid reputation within the Australian
and international games industry.
After years of experience developing
licensed titles for platforms such as Game
Boy Advance, Nintendo DS and PlayStation
Portable (PSP), the studio began expanding
its portfolio with a range of original self-
published games for downloadable platforms.
In 2010, Halfbrick became one of the most
well-known independent developers in the
world with the success of Fruit Ninja, Monster
Dash and Age of Zombies on mobile devices,
and other releases such as Raskulls and
Fruit Ninja Kinect on Xbox Live Arcade.
The United States is a major market for Halfbrick
Studios, where it has sold more than 10 million
units across several major platforms. The
company is also in the process of developing
a strong market presence in China, the United
Kingdom, Germany, Canada and Japan.
A grant applicant since 2009, assistance from
the EMDG scheme has helped support the
company’s marketing strategy by reimbursing
eligible costs incurred for marketing visits,
attendance at trade fairs, literature, advertising
and intellectual property expenses. In 2011,
Halfbrick employed the services of two
marketing consultants in the United States, one
based in Los Angeles and one in New York.
‘Financial assistance through the EMDG
scheme has proven to be critical to our
entry into new markets’, said Shainiel
Deo, CEO of Halfbrick Studios.
‘The EMDG scheme has enabled our business
to showcase our products in markets that
were very expensive and competitive’, said
Mr Deo. ‘The grant gives us the edge over
our competition, to have a real presence at
trade shows and media events, and bring our
products to the end consumer and media. Our
business has seen over 100 per cent growth
in the past year and we have managed to tap
into markets that we had not entered before’.
Jetpack Joyride, one of the many successful computer games produced by Halfbrick Studios.
(Image used with permission of Halfbrick Studios.)
Australian Trade Commission Annual Report 2011–12 > 97
2Outcome 2
PERFO
RM
AN
CE R
EPOR
TING
O
utc
om
e 2
– P
rog
ram
2.1
The protection and welfare of Australians abroad through timely and responsive
consular and passport services in specifi c locations overseas
Program 2.1: Consular and passport services
Objective
Support Australians in specifi c locations
overseas through eff ective consular service,
accurate and timely travel advice, practical
contingency planning and rapid crisis response.
Deliverables
In specifi c locations overseas:
› Deliver comprehensive, responsive, high quality
consular services to an increasing number of
Australian travellers and citizens living overseas,
including notarial services and assistance with
welfare issues, whereabouts enquiries, arrest or
detention matters and medical emergencies.
› Provide high-quality passport services
to Australians, including processing new
passport applications, registering lost
or stolen passports, issuing emergency
passports, and detecting passport fraud.
› Undertake eff ective consular contingency
planning for major events or high-risk
scenarios, including through regular reviews of
procedures and available resources, training of
staff and coordination with other government
agencies and foreign governments.
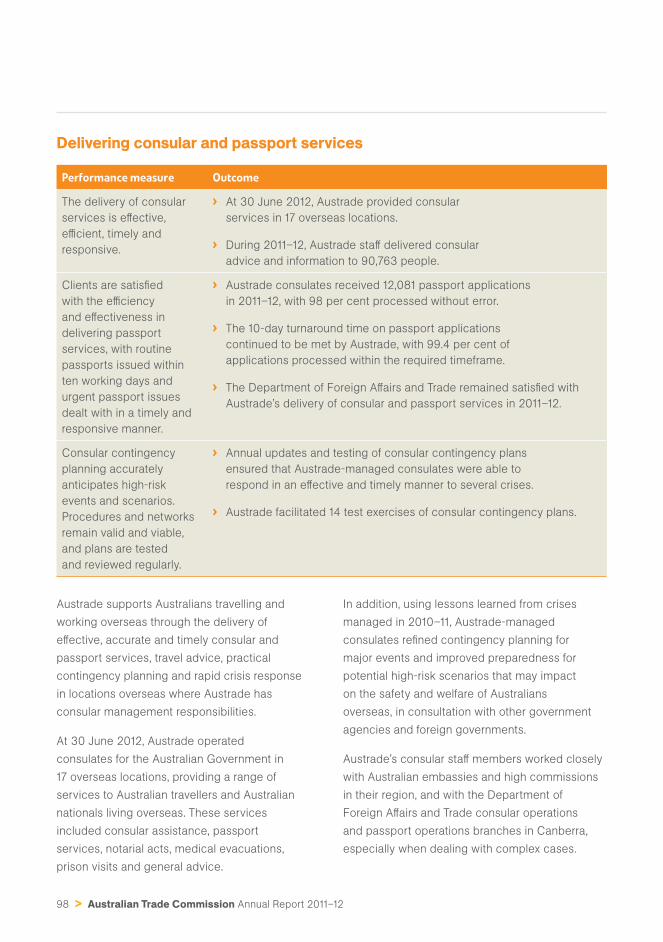
98 > Australian Trade Commission Annual Report 2011–12
Delivering consular and passport services
Performance measure Outcome
The delivery of consular
services is eff ective,
effi cient, timely and
responsive.
› At 30 June 2012, Austrade provided consular
services in 17 overseas locations.
› During 2011–12, Austrade staff delivered consular
advice and information to 90,763 people.
Clients are satisfi ed
with the effi ciency
and eff ectiveness in
delivering passport
services, with routine
passports issued within
ten working days and
urgent passport issues
dealt with in a timely and
responsive manner.
› Austrade consulates received 12,081 passport applications
in 2011–12, with 98 per cent processed without error.
› The 10-day turnaround time on passport applications
continued to be met by Austrade, with 99.4 per cent of
applications processed within the required timeframe.
› The Department of Foreign Aff airs and Trade remained satisfi ed with
Austrade’s delivery of consular and passport services in 2011–12.
Consular contingency
planning accurately
anticipates high-risk
events and scenarios.
Procedures and networks
remain valid and viable,
and plans are tested
and reviewed regularly.
› Annual updates and testing of consular contingency plans
ensured that Austrade-managed consulates were able to
respond in an eff ective and timely manner to several crises.
› Austrade facilitated 14 test exercises of consular contingency plans.
Austrade supports Australians travelling and
working overseas through the delivery of
eff ective, accurate and timely consular and
passport services, travel advice, practical
contingency planning and rapid crisis response
in locations overseas where Austrade has
consular management responsibilities.
At 30 June 2012, Austrade operated
consulates for the Australian Government in
17 overseas locations, providing a range of
services to Australian travellers and Australian
nationals living overseas. These services
included consular assistance, passport
services, notarial acts, medical evacuations,
prison visits and general advice.
In addition, using lessons learned from crises
managed in 2010–11, Austrade-managed
consulates refi ned contingency planning for
major events and improved preparedness for
potential high-risk scenarios that may impact
on the safety and welfare of Australians
overseas, in consultation with other government
agencies and foreign governments.
Austrade’s consular staff members worked closely
with Australian embassies and high commissions
in their region, and with the Department of
Foreign Aff airs and Trade consular operations
and passport operations branches in Canberra,
especially when dealing with complex cases.
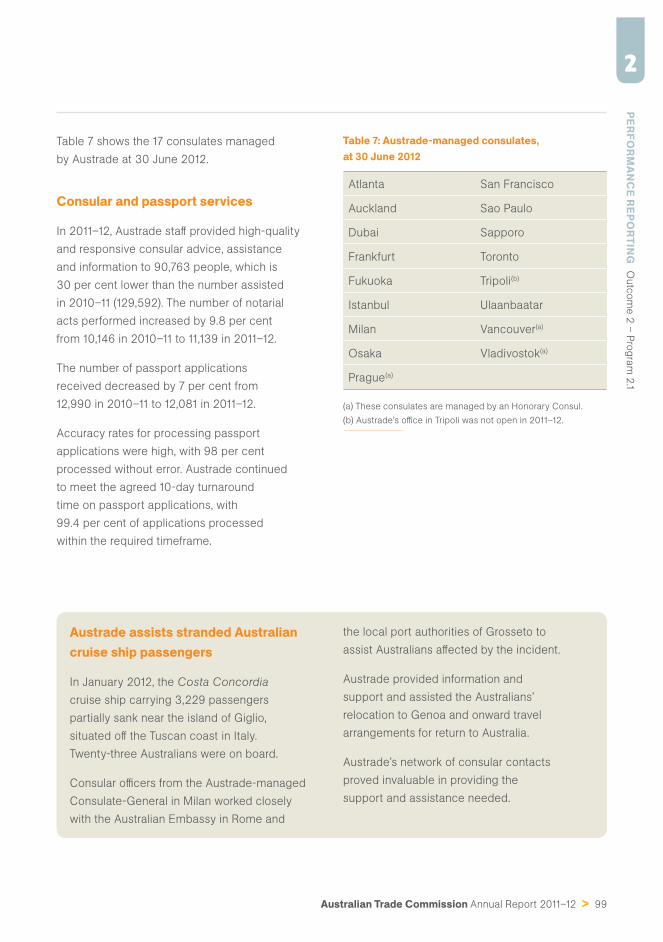
Australian Trade Commission Annual Report 2011–12 > 99
2PER
FOR
MA
NC
E REPO
RTIN
G
Outc
om
e 2
– P
rog
ram
2.1
Table 7 shows the 17 consulates managed
by Austrade at 30 June 2012.
Consular and passport services
In 2011–12, Austrade staff provided high-quality
and responsive consular advice, assistance
and information to 90,763 people, which is
30 per cent lower than the number assisted
in 2010–11 (129,592). The number of notarial
acts performed increased by 9.8 per cent
from 10,146 in 2010–11 to 11,139 in 2011–12.
The number of passport applications
received decreased by 7 per cent from
12,990 in 2010–11 to 12,081 in 2011–12.
Accuracy rates for processing passport
applications were high, with 98 per cent
processed without error. Austrade continued
to meet the agreed 10-day turnaround
time on passport applications, with
99.4 per cent of applications processed
within the required timeframe.
Table 7: Austrade-managed consulates, at 30 June 2012
Atlanta San Francisco
Auckland Sao Paulo
Dubai Sapporo
Frankfurt Toronto
Fukuoka Tripoli(b)
Istanbul Ulaanbaatar
Milan Vancouver(a)
Osaka Vladivostok(a)
Prague(a)
(a) These consulates are managed by an Honorary Consul.
(b) Austrade’s offi ce in Tripoli was not open in 2011–12.
Austrade assists stranded Australian cruise ship passengers
In January 2012, the Costa Concordia
cruise ship carrying 3,229 passengers
partially sank near the island of Giglio,
situated off the Tuscan coast in Italy.
Twenty-three Australians were on board.
Consular offi cers from the Austrade-managed
Consulate-General in Milan worked closely
with the Australian Embassy in Rome and
the local port authorities of Grosseto to
assist Australians aff ected by the incident.
Austrade provided information and
support and assisted the Australians’
relocation to Genoa and onward travel
arrangements for return to Australia.
Austrade’s network of consular contacts
proved invaluable in providing the
support and assistance needed.
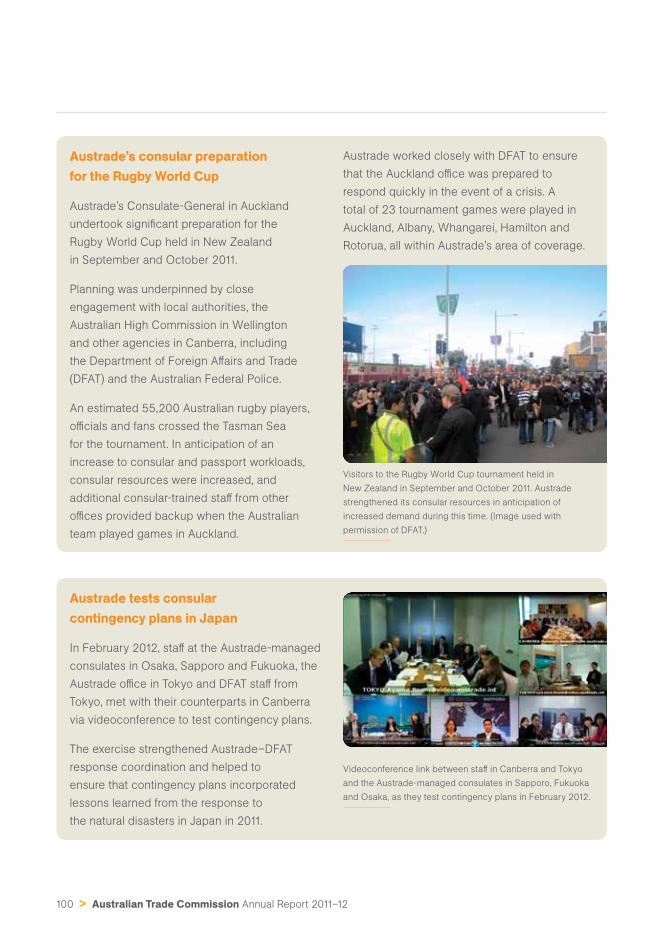
100 > Australian Trade Commission Annual Report 2011–12
Austrade’s consular preparation for the Rugby World Cup
Austrade’s Consulate-General in Auckland
undertook signifi cant preparation for the
Rugby World Cup held in New Zealand
in September and October 2011.
Planning was underpinned by close
engagement with local authorities, the
Australian High Commission in Wellington
and other agencies in Canberra, including
the Department of Foreign Aff airs and Trade
(DFAT) and the Australian Federal Police.
An estimated 55,200 Australian rugby players,
offi cials and fans crossed the Tasman Sea
for the tournament. In anticipation of an
increase to consular and passport workloads,
consular resources were increased, and
additional consular-trained staff from other
offi ces provided backup when the Australian
team played games in Auckland.
Austrade worked closely with DFAT to ensure
that the Auckland offi ce was prepared to
respond quickly in the event of a crisis. A
total of 23 tournament games were played in
Auckland, Albany, Whangarei, Hamilton and
Rotorua, all within Austrade’s area of coverage.
Visitors to the Rugby World Cup tournament held in
New Zealand in September and October 2011. Austrade
strengthened its consular resources in anticipation of
increased demand during this time. (Image used with
permission of DFAT.)
Austrade tests consular contingency plans in Japan
In February 2012, staff at the Austrade-managed
consulates in Osaka, Sapporo and Fukuoka, the
Austrade offi ce in Tokyo and DFAT staff from
Tokyo, met with their counterparts in Canberra
via videoconference to test contingency plans.
The exercise strengthened Austrade–DFAT
response coordination and helped to
ensure that contingency plans incorporated
lessons learned from the response to
the natural disasters in Japan in 2011.
Videoconference link between staff in Canberra and Tokyo
and the Austrade-managed consulates in Sapporo, Fukuoka
and Osaka, as they test contingency plans in February 2012.
PART THREEManagement and accountability
› Accountability and management of resources 102
Corporate governance 102
Risk management 109
Legislative framework and
external scrutiny 110
Management of human resources 111
Financial management and
business assurance 118
Managing knowledge and information 122
102 > Australian Trade Commission Annual Report 2011–12
Accountability and management of resources
Austrade, a Statutory Agency within the Foreign Aff airs and Trade portfolio, is a
Prescribed Agency subject to the Financial Management and Accountability
Act 1997 and the Public Service Act 1999. Austrade has an executive
management governance structure headed by its Chief Executive Offi cer (CEO).
Corporate governance
Austrade’s Corporate Governance Framework
provides support to the operations of Austrade
to achieve its stated objectives in an ethical,
effi cient and eff ective manner. The framework
provides a structured approach to decision-
making through a mature system for managing
risk, internal controls, human and fi nancial
resources, planning and assurance processes.
The CEO is responsible to the Minister for
Trade and Competitiveness, the Hon Dr Craig
Emerson MP, for the performance of Austrade.
The CEO is assisted in his role by a Senior
Executive Group (Table 8), an Audit and Risk
Committee, an Ethics Committee and a number
of internal management committees. Both
the Audit and Risk Committee and the Ethics
Committee have independent chairpersons,
and the Audit and Risk Committee also has
a further additional independent member.
During the past year, Austrade has undertaken
a range of enhancements to its governance
framework. Examples of specifi c governance
changes implemented at Austrade to date include:
› a smaller and strengthened Senior Executive
Group headed by the CEO which meets weekly
› a global rather than regional management
structure with strategic management and
oversight of the international network based
in Austrade’s Sydney headquarters
› a simplifi ed organisational structure
(see page 5) providing clearer lines of
responsibility for Austrade’s core functions—
trade, investment and education—and for the
Export Market Development Grants scheme,
as well as for corporate service functions.
Governance review
In August 2011, Austrade commissioned
the Australia and New Zealand School of
Government’s Institute for Governance at the
University of Canberra to provide an independent
review of its overall governance framework.
The institute’s report concluded that
Austrade’s corporate governance structures
were of a high quality, particularly in the
area of anti-corruption training, which
represented international best practice.
The report also noted that Austrade had
implemented a considered reform program of
its business and internal structures and had
created eff ective frameworks for governance.
Austrade will continue to monitor the quality
and eff ectiveness of its Corporate Governance
Framework.
Australian Trade Commission Annual Report 2011–12 > 103
MA
NAG
EMEN
T AN
D ACC
OU
NTA
BILITY
A
cco
unta
bility
and m
anag
em
ent o
f reso
urc
es
3
Anti-bribery
The Australian Government has a zero tolerance
approach to bribery and corruption.
Since 2010, Austrade has undertaken a series
of initiatives to ensure its practices comply
with the anti-bribery provisions contained
in section 70 of the Criminal Code 1995.
Among these initiatives was a mandatory
training program for all staff outlining their
responsibilities with respect to the anti-bribery
provisions. Transparency International Australia
and the Australian Federal Police both reviewed
Austrade’s training program, which was completed
with 100 per cent participation by staff .
Austrade also updated its policies and
client documentation, including its Service
Policy Handbook, to ensure that anti-bribery
provisions—for example, that Austrade
cannot assist fi rms that pay bribes—are
made clear in its service proposals.
In addition, Australian businesses operating
in international markets are advised of their
ethical and legal obligations under Australian
law. Australian businesses also need to
be aware of how anti-bribery laws of other
countries may apply to them, including
diff erent laws around facilitation payments.
Austrade’s policy is that Austrade offi cers should
not make or arrange facilitation payments. Any
Austrade offi cial who suspects an individual
or a company of being involved in corruption
must report the concern to authorities.
Corporate Governance Forum
The Corporate Governance Forum is an
Austrade initiative developed in 2009 to assist
Australian Government agencies to achieve
best practice in governance through the
exchange of ideas. The forum brings together
government agencies throughout the year
to share information on current approaches,
transfer knowledge and identify best practice
on public sector governance topics.
In 2011–12, four forum meetings were held,
hosted by agencies on the organising
committee and covering topics such as:
› integrity and ethics
› work health and safety
› the Commonwealth Financial
Management Framework
› the Public Service Act 1999.
Austrade has benefi ted from leading and
participating in the forum to further enhance
its own approach towards its risk culture,
audit practices and the development of an
improved corporate policy framework.
The forum’s organising committee includes
representatives from Austrade, AusAID, the
Australian Taxation Offi ce, Centrelink, the
Department of Finance and Deregulation, the
Department of Foreign Aff airs and Trade, and
the Department of Immigration and Citizenship.
The Australian Taxation Offi ce took over as
chair of the forum at the end of 2011.
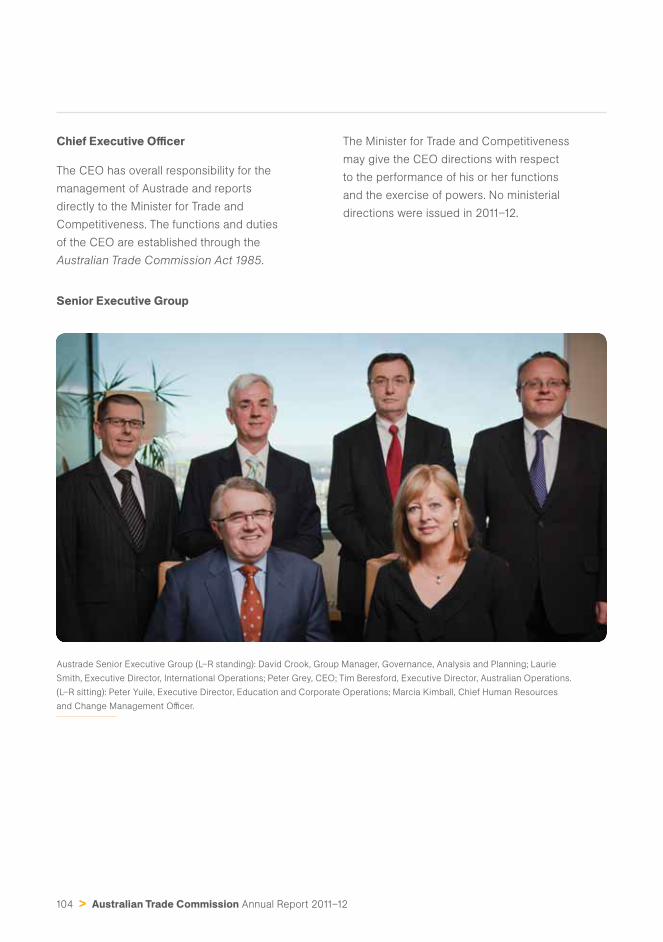
104 > Australian Trade Commission Annual Report 2011–12
Chief Executive Offi cer
The CEO has overall responsibility for the
management of Austrade and reports
directly to the Minister for Trade and
Competitiveness. The functions and duties
of the CEO are established through the
Australian Trade Commission Act 1985.
The Minister for Trade and Competitiveness
may give the CEO directions with respect
to the performance of his or her functions
and the exercise of powers. No ministerial
directions were issued in 2011–12.
Senior Executive Group
Austrade Senior Executive Group (L–R standing): David Crook, Group Manager, Governance, Analysis and Planning; Laurie
Smith, Executive Director, International Operations; Peter Grey, CEO; Tim Beresford, Executive Director, Australian Operations.
(L–R sitting): Peter Yuile, Executive Director, Education and Corporate Operations; Marcia Kimball, Chief Human Resources
and Change Management Offi cer.
Australian Trade Commission Annual Report 2011–12 > 105
MA
NAG
EMEN
T AN
D ACC
OU
NTA
BILITY
A
cco
unta
bility
and m
anag
em
ent o
f reso
urc
es
3
Table 8: Senior Executive Group
Position Name Responsibilities
Chief Executive Offi cer Peter Grey Overall responsibility for the management
of Austrade; reports directly to the Minister
for Trade and Competitiveness
Executive Director,
International Operations
Laurie Smith Responsible for Austrade’s off shore network
Executive Director,
Australian Operations
Tim Beresford Responsible for fi ve key business areas in Austrade:
Trade; Investment; Partners and Referrals; Sectoral
Initiatives; and Marketing, Online and Business Practice
Executive Director,
Education and
Corporate Operations
Peter Yuile Responsible for six key business and enabling areas in
Austrade: International Education and Training; Programs,
Consular and Business Services; Finance; Information
Technology Services; Legal, Security and Procurement;
and Ministerial, Parliamentary and Portfolio Coordination
Chief Human
Resources and Change
Management Offi cer
Marcia Kimball Responsible for Austrade’s national and international
human resources management, strategy,
systems, services, capability and talent
Group Manager,
Governance, Analysis
and Planning
David Crook Responsible for Austrade’s corporate governance,
including internal audit, analysis and corporate planning
Audit and Risk Committee
The role of the Audit and Risk Committee is to
provide independent assurance and assistance to
the CEO on Austrade’s risk, control, compliance
and external accountability responsibilities.
The committee consists of four members: two
independent members, David Morgan (chair)
and David Lawler, and two internal members,
the Executive Director, Australian Operations,
and the General Manager, Established Markets.
The committee met six times during 2011–12.
Ethics Committee
The role of the Ethics Committee is to
promote high standards of ethical behaviour
throughout Austrade, provide clear and
consistent guidance on standards of conduct
and evaluate the eff ectiveness of Austrade
policies and practices in relation to ethical
behaviour. The committee provides independent
assurance and assistance to the CEO on
Austrade’s ethical governance framework.
106 > Australian Trade Commission Annual Report 2011–12
The committee consists of an independent
member, Jeff Lamond (chair); Austrade’s Chief
Human Resources and Change Management
Offi cer; and a cross-section of Austrade’s senior
management from onshore and off shore. The
Group Manager, Legal, Security and Procurement,
is designated as Chief Ethics Offi cer and an
ex-offi cio member of the Ethics Committee.
Corporate planning
Austrade’s corporate planning framework
includes the preparation of a Corporate Plan
which sets out the key strategies that Austrade
will pursue to achieve the outcomes and
priorities set by the Australian Government.
The Senior Executive Group determines
organisation-wide initiatives to support the
agreed strategies. In 2011–12, these initiatives
focused on the implementation of the outcomes
of the Austrade review, including a new strategy,
operating model and organisational structure.
Austrade’s new strategic direction is set out
in the May 2011 statement Reform of the
Australian Trade Commission: maximising our
value, available at www.austrade.gov.au.
More generally, the initiatives refl ect Austrade’s
demand-driven model which centres on the
need to focus where Austrade can add the
greatest value in addressing market challenges.
Austrade’s corporate planning is informed by
factors including:
› the Government’s expectations and policies,
refl ected in the programs and functions
for which Austrade is responsible
› trade, investment and education environments,
and the opportunities these present for
Australian businesses and educational
institutions, as well as anticipated changes
in the global trade and economic outlook
› current budgetary and fi scal requirements.
Austrade’s plans for 2011–12 were also informed
by research undertaken as part of the review
of Austrade, including information from the
annual Client Service Improvement Study,
Austrade client, investor and customer data,
and previous research, analysis and empirical
studies conducted by international institutions.
The Senior Executive Group reviews progress
against the plan through reports at its
weekly meetings. In 2011–12, the Review
Implementation Taskforce also met regularly
to monitor implementation of Austrade’s
revised strategy, structure and processes as
articulated in the Reform of the Australian Trade
Commission: maximising our value statement.
Management committees
Members of the Senior Executive Group
chair subcommittees on workplace relations,
security, and business improvement
priorities and initiatives (see Table 9). These
committees support governance, inform
operations and provide mechanisms for
consultation and communication with staff .
Austrade’s executive management structure and
reporting relationships are shown in Figure 17.
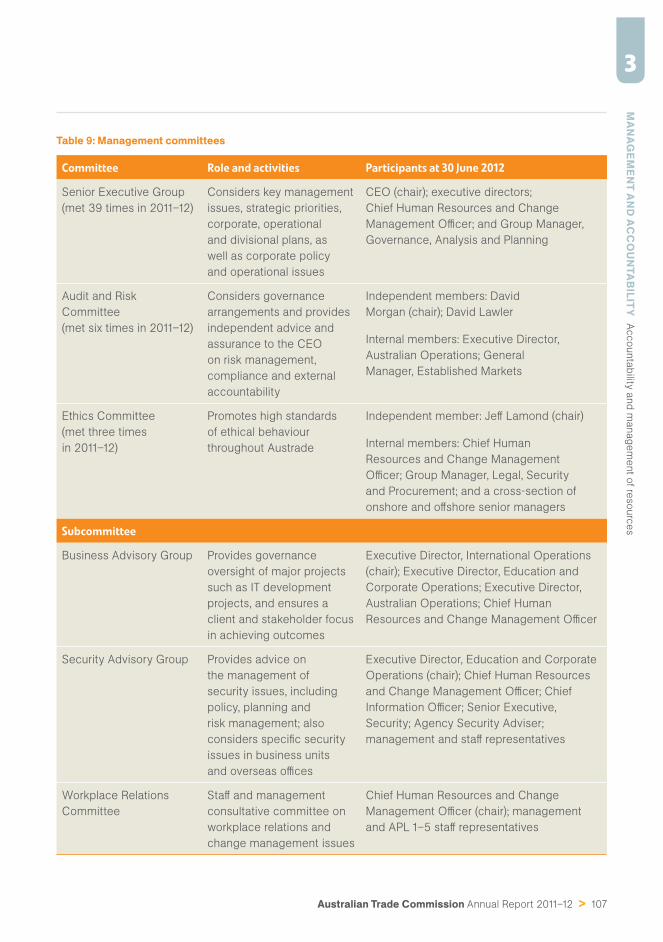
Australian Trade Commission Annual Report 2011–12 > 107
MA
NAG
EMEN
T AN
D ACC
OU
NTA
BILITY
A
cco
unta
bility
and m
anag
em
ent o
f reso
urc
es
3
Table 9: Management committees
Committee Role and activities Participants at 30 June 2012
Senior Executive Group
(met 39 times in 2011–12)
Considers key management
issues, strategic priorities,
corporate, operational
and divisional plans, as
well as corporate policy
and operational issues
CEO (chair); executive directors;
Chief Human Resources and Change
Management Offi cer; and Group Manager,
Governance, Analysis and Planning
Audit and Risk
Committee
(met six times in 2011–12)
Considers governance
arrangements and provides
independent advice and
assurance to the CEO
on risk management,
compliance and external
accountability
Independent members: David
Morgan (chair); David Lawler
Internal members: Executive Director,
Australian Operations; General
Manager, Established Markets
Ethics Committee
(met three times
in 2011–12)
Promotes high standards
of ethical behaviour
throughout Austrade
Independent member: Jeff Lamond (chair)
Internal members: Chief Human
Resources and Change Management
Offi cer; Group Manager, Legal, Security
and Procurement; and a cross-section of
onshore and off shore senior managers
Subcommittee
Business Advisory Group Provides governance
oversight of major projects
such as IT development
projects, and ensures a
client and stakeholder focus
in achieving outcomes
Executive Director, International Operations
(chair); Executive Director, Education and
Corporate Operations; Executive Director,
Australian Operations; Chief Human
Resources and Change Management Offi cer
Security Advisory Group Provides advice on
the management of
security issues, including
policy, planning and
risk management; also
considers specifi c security
issues in business units
and overseas offi ces
Executive Director, Education and Corporate
Operations (chair); Chief Human Resources
and Change Management Offi cer; Chief
Information Offi cer; Senior Executive,
Security; Agency Security Adviser;
management and staff representatives
Workplace Relations
Committee
Staff and management
consultative committee on
workplace relations and
change management issues
Chief Human Resources and Change
Management Offi cer (chair); management
and APL 1–5 staff representatives
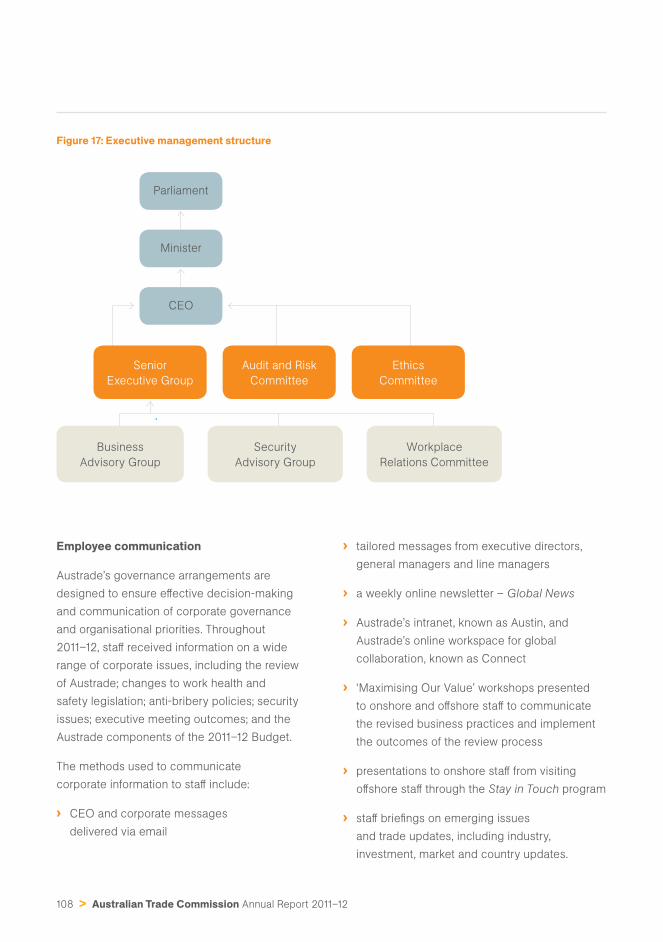
108 > Australian Trade Commission Annual Report 2011–12
Figure 17: Executive management structure
Parliament
Minister
CEO
Security
Advisory Group
Workplace
Relations Committee
Business
Advisory Group
Ethics
Committee
Audit and Risk
Committee
Senior
Executive Group
Employee communication
Austrade’s governance arrangements are
designed to ensure eff ective decision-making
and communication of corporate governance
and organisational priorities. Throughout
2011–12, staff received information on a wide
range of corporate issues, including the review
of Austrade; changes to work health and
safety legislation; anti-bribery policies; security
issues; executive meeting outcomes; and the
Austrade components of the 2011–12 Budget.
The methods used to communicate
corporate information to staff include:
› CEO and corporate messages
delivered via email
› tailored messages from executive directors,
general managers and line managers
› a weekly online newsletter – Global News
› Austrade’s intranet, known as Austin, and
Austrade’s online workspace for global
collaboration, known as Connect
› ‘Maximising Our Value’ workshops presented
to onshore and off shore staff to communicate
the revised business practices and implement
the outcomes of the review process
› presentations to onshore staff from visiting
off shore staff through the Stay in Touch program
› staff briefi ngs on emerging issues
and trade updates, including industry,
investment, market and country updates.
Australian Trade Commission Annual Report 2011–12 > 109
MA
NAG
EMEN
T AN
D ACC
OU
NTA
BILITY
A
cco
unta
bility
and m
anag
em
ent o
f reso
urc
es
3
Corporate training programs, including pre-
posting and induction training and online
modules, were used throughout 2011–12 to
keep staff informed and aware of current
corporate policies and procedures.
Each year, all Austrade staff are required
to complete an annual Austrade corporate
policy refresher module. Key policy focus
areas covered by the module included:
› ethical business, code of conduct and
Australian Public Service values, especially
relating to bribery and corruption
› work health and safety
› corporate governance and policy
framework, including risk management
› engagement with clients and investors
› procurement practices.
In 2011–12, all Austrade staff also completed an
online training module on work health and safety.
Risk management
Throughout 2011–12, Austrade continued to
manage its exposure to risk and mitigate
adverse consequences through implementation
of risk management principles and
practices, as outlined in the Chief Executive
Instruction on Risk Management and the
Corporate Governance Framework.
The Agency Risk Management Plan 2011–12 was
prepared in accordance with the risk management
standard, ISO 31000:2009. The plan identifi es key
risks with the potential to impact on Austrade’s
ability to achieve the objectives and priorities set
out in the Corporate Plan. Risks identifi ed in the
plan covered strategic risks, including evolution
and development of services, models and
channels to meet contemporary needs; transitional
processes, such as implementation of the change
process fl owing from the Austrade review; and
operational and corporate risks, including a range
of security risks, and issues such as eff ective
business continuity and emergency management.
Austrade managers develop mitigation strategies
and actions for identifi ed agency risks, and report
progress against these mitigation strategies
to the Audit and Risk Committee quarterly to
assist in the assurance process to the CEO that
Austrade risks are being managed and monitored.
Internal controls
The Audit and Risk Committee and the internal
auditor have noted the mature nature of Austrade’s
internal control framework. The main features
of the internal control framework include:
› policies and procedures (including chief
executive instructions) that support compliance
with legislative and administrative requirements
› a positive compliance and management
environment supported by an
eff ective schedule of delegations
› an eff ective internal audit function
that seeks to appropriately balance
performance and compliance audits
› an eff ective risk management framework,
including fraud control, risk management
plans, security and business continuity
management and disaster recovery
› compliance with the Australian Public Service
and Austrade values and codes of conduct
110 > Australian Trade Commission Annual Report 2011–12
› monitoring controls through eff ective
planning at the corporate, operational and
business unit level, reviews of business
units and ongoing budget management
› accountability mechanisms, including
reports, reviews and individual performance
management arrangements.
Fraud control
Austrade maintains fraud prevention, detection,
investigation and reporting procedures
and processes that are compliant with the
Commonwealth Fraud Control Guidelines.
A revised Fraud Control Plan, eff ective from
2011 to 2013, has been endorsed by the Audit
and Risk Committee and is consistent with
the Australian standards applying at the time
(AS/NZS ISO 31000:2009 Risk Management
and AS 8001:2003 Fraud Corruption and
Control). A principles-based ethics and
integrity approach underpins the strategies of
awareness, prevention, identifi cation, reporting,
prosecution and continuous improvement.
This approach includes an anti-bribery and
corruption awareness program for all staff .
Internal audit
Austrade’s internal auditor in 2011–12, KPMG
Australia, took a systematic and objective
approach to evaluating and improving risk
management, control and governance processes.
The internal auditor’s activities are defi ned
by a three-year rolling plan and an annual
internal audit plan approved by the Audit and
Risk Committee and the CEO. All signifi cant
Austrade activities are considered to be within
the ambit of the function and the annual plan
seeks to coordinate internal audit activity with
other assurance activities and mechanisms,
including external audit and better practice
guides of the Australian National Audit Offi ce.
During the year, 31 compliance and performance-
based audits and reviews were undertaken.
Austrade’s contract with KPMG for internal
audit services concluded on 30 June 2012.
After a competitive public tender process,
PricewaterhouseCoopers has been appointed to
provide future internal audit services for Austrade.
Legislative framework and external scrutiny
This section outlines the legislative framework
and external scrutiny mechanisms under which
Austrade operates.
Legislation
Legislation under which Austrade
operates includes the:
› Australian Trade Commission Act 1985 –
defi nes the functions, duties and powers of the
Chief Executive Offi cer and the Commission
› Export Market Development Grants
Act 1997 – provides for the Export Market
Development Grants scheme, the Government’s
principal export fi nance assistance program,
which is administered by Austrade
› Financial Management and Accountability
Act 1997 – provides the framework
for the proper management of public
money and public property
› Public Service Act 1999 – governs the
establishment and operation of, and
employment in, the Australian Public Service.
Australian Trade Commission Annual Report 2011–12 > 111
MA
NAG
EMEN
T AN
D ACC
OU
NTA
BILITY
A
cco
unta
bility
and m
anag
em
ent o
f reso
urc
es
3
Independent audits
Austrade was not the subject of any
reports tabled by the Auditor-General
in Parliament during 2011–12.
During the reporting period, Austrade
management considered two Australian National
Audit Offi ce reports tabled by the Auditor-General
to assess relevance to Austrade operations.
Austrade management also reviewed six better
practice guides and made recommendations to
the Audit and Risk Committee on ways to improve
Austrade’s management controls and framework.
Judicial decisions and reviews by outside bodies
During 2011–12 there were no parliamentary
inquiries into matters directly aff ecting Austrade,
nor any judicial decisions that had a signifi cant
impact on the operations of Austrade.
Details of appeals to the Administrative Appeals
Tribunal under the Export Market Development
Grants Act 1997 are shown on page 94.
Privacy
During 2011–12, Austrade received no
complaints under the Privacy Act 1988.
Training on the Information Privacy Principles
and Austrade’s own privacy policies is provided
as part of regular corporate training, including
training for staff being deployed overseas.
Freedom of information
Agencies subject to the Freedom of Information
Act 1982 (FOI Act) are required to publish
information to the public as part of the Information
Publication Scheme. This requirement is in
Part II of the FOI Act and has replaced the
former requirement to publish a section 8
statement in an annual report. Austrade
displays on its website a plan showing what
information it publishes in accordance with the
requirements of the Information Publication
Scheme. Austrade has met this requirement.
Management of human resources
Throughout 2011–12, the management of
Austrade’s human resources was guided by its
three-year global human resources strategic
plan. In its third year of operation, the plan
identifi es priorities in the six key result areas of:
› organisational design and workforce planning
› organisational capability
› employment frameworks
› managing and recognising performance
› work environment
› culture and values.
A summary of achievements against planned
priorities under each of the key result areas is
provided on the following pages.
112 > Australian Trade Commission Annual Report 2011–12
Organisational design and workforce planning
Following on from 2010–11, a major focus for
Austrade with respect to human resources was
the provision of strategic and operational support
for the implementation of the new Austrade
business model. Organisational design and
change facilitation were particular areas of priority
in the transition to the new arrangements.
Austrade continued to build on its workforce
reporting throughout the year with the
implementation of global vacancy management
reporting and combined monthly human
resources and fi nancial reporting.
Staffi ng overview
At 30 June 2012, Austrade employed 985 staff ,
76 per cent of whom were employed in
client-focused operations in Australia and
overseas locations.
Staff turnover increased to a 13.5 per cent
separation rate, compared with 11.2 per cent in
2010–11. The gender balance remained the same
at 45 per cent male and 55 per cent female.
Organisational capability
Austrade continued to provide a wide range of
workforce capability development programs
and opportunities to support the achievement
of corporate objectives. These were delivered
through a variety of methods, including
face-to-face and online learning programs,
coaching, mentoring, short-term developmental
assignments and on-the-job learning.
During 2011–12, Austrade implemented a new
online system to improve the management
of individual performance planning, the
development of talent and the delivery of
learning programs. The new system has also
strengthened Austrade’s ability to monitor and
report on capability development activity.
Throughout the year, Austrade employees
completed 4,600 internally provided
learning and development programs, of
which 55 per cent were delivered online.
Capability development highlights
for the year included:
› 88 staff attended induction programs
held in Australia and off shore
› 14 trade commissioners participated
in pre-posting training programs
› ‘Maximising Our Value’ one-day business
practice workshops were delivered to all staff
› 42 staff participated in investment training
› Work health and safety and corporate
policy refresher online courses
were delivered to all staff
› 25 staff attended anti-bribery workshops as part
of the rollout to all staff which began in 2010–11
› 130 staff used the Harvard ManageMentor
online learning modules which cover
42 leadership and management topics
› 3 staff participated in the Asialink Leaders
Program that builds knowledge and
networks for the ‘Asian century’.
Capability Framework
Austrade revised its Capability Framework
in 2011–12 to align more closely with its new
organisational direction and priorities. The
new framework identifi es core capabilities
required by all Austrade employees, as well
as a detailed set of trade, investment and
Australian Trade Commission Annual Report 2011–12 > 113
MA
NAG
EMEN
T AN
D ACC
OU
NTA
BILITY
A
cco
unta
bility
and m
anag
em
ent o
f reso
urc
es
3
education technical capabilities. The framework
has a range of uses, including as a tool for
identifying learning and development priorities,
to inform selection criteria for recruitment, and
to assist employees with career progression.
Review of Austrade
A key focus for Austrade throughout the year
was on the delivery of capability development
strategies to enable staff to work in teams
to implement the changes to Austrade’s
strategic direction, business practices and
systems resulting from the review of Austrade.
The centrepiece was a one-day ‘Maximising
Our Value’ workshop that was delivered to
all staff . Additional targeted learning and
coaching was also delivered to off shore and
onshore teams to embed the changes.
Induction
Austrade’s induction program for new staff involves
completing a number of online courses and,
where possible, attending a fi ve-day workshop in
Sydney. Throughout the year, Austrade’s induction
program was attended by a total of 88 new
staff (40 onshore and 48 off shore). A series of
checklists for new staff and managers was also
developed to support the induction process.
Building leadership capability
Targeted and strategic leadership development
opportunities were provided throughout
2011–12 to help build capability. Executive
coaching and leadership development
programs, including the Australian Public
Service Commission’s Career Development
Assessment Centre, were made available to
a number of staff in key leadership roles.
Short-term overseas assignments
Short-term overseas assignments provide
opportunities for staff to develop their
capability through challenging and diverse
work experiences. In 2011–12, a total of 37 staff
undertook short-term overseas assignments,
with 22 of those staff from Australia completing
an assignment at an overseas offi ce, 13 staff
from overseas completing an assignment in
Australia, and two staff from Australia completing
an assignment in another Australian offi ce.
Mentoring
Mentoring programs were delivered to
31 female staff in Austrade throughout the
year as part of a women’s mentoring program.
Outcomes included improved infl uencing and
communication skills and career planning.
Austrade also coordinated and supported a
traditional one-on-one mentoring program where
mentees were matched with an appropriate
mentor for a 12-month period. A new Cultural
Mentor Program was also launched in 2012,
matching 10 staff in Australia and 10 staff from
overseas in a structured program to share
information on a number of topics during the year.
Language policy
Twenty-one employees undertook 25 language
profi ciency tests in one or more languages during
the year, as part of Austrade’s revised language
policy, which recognises the importance of
maintaining language skills. Five staff members
are undertaking language training as part of
the Austrade Studies Assistance scheme.
114 > Australian Trade Commission Annual Report 2011–12
Employment frameworks
Austrade’s employment frameworks aim to
refl ect good practice, government policy and
legal compliance to ensure a positive work
environment for staff and minimise employment
risk in the countries in which Austrade operates.
Senior Executive Service (SES) employees are
engaged on individual employment contracts.
Non-SES, Australia-based employees are covered
by the Austrade Employee Collective Agreement.
The Workplace Relations Committee, established
under the Austrade Employee Collective
Agreement, met during the year to consult on
workplace matters aff ecting non-SES, Australia-
based employees. The Enterprise Bargaining
Committee, comprising Austrade management
and the Community and Public Sector Union
(union offi cials and workplace delegates) also
met several times throughout the year as part
of the bargaining process for the incoming
Austrade Enterprise Agreement 2012–2014.
Overseas-engaged employees are engaged
under terms and conditions of employment
consistent with local labour law and good
employment practices in the relevant overseas
locations in which Austrade operates. To ensure
that Austrade continues to meet local labour
law standards and provide a positive work
environment, terms and conditions of service for
overseas-engaged employees were reviewed
during 2011–12 in a number of these locations.
Managing and recognising performance
In 2011–12, the guiding principle for individual
performance plans was to focus on recognising
and rewarding behaviours that contribute to
Austrade’s organisational priorities and value-
add, and that are consistent with Australian
Public Service values and ethical standards. As
in previous years, the activities and measures in
performance plans also refl ected the principles
of ‘know, share, succeed’. As 2011–12 was a
signifi cant year for embedding organisational
change, performance plans for managers focused
on leadership of organisational change and the
desired behaviours necessary to achieve this.
A new performance plan template was developed
to ensure consistency across the organisation
and to incorporate specifi c ‘leadership of change’
and governance measures for managers.
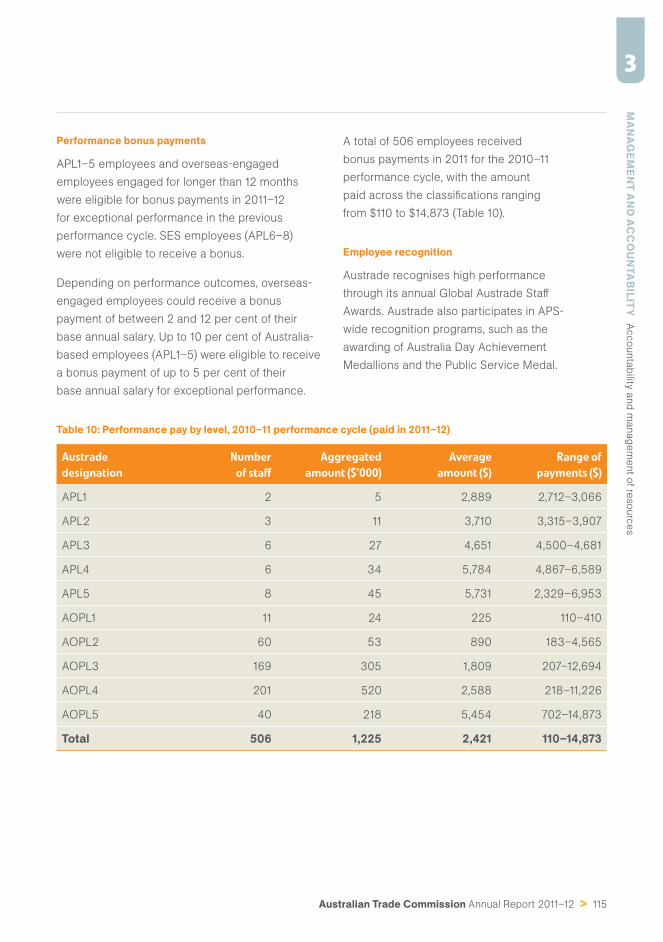
Australian Trade Commission Annual Report 2011–12 > 115
MA
NAG
EMEN
T AN
D ACC
OU
NTA
BILITY
A
cco
unta
bility
and m
anag
em
ent o
f reso
urc
es
3
Performance bonus payments
APL1–5 employees and overseas-engaged
employees engaged for longer than 12 months
were eligible for bonus payments in 2011–12
for exceptional performance in the previous
performance cycle. SES employees (APL6–8)
were not eligible to receive a bonus.
Depending on performance outcomes, overseas-
engaged employees could receive a bonus
payment of between 2 and 12 per cent of their
base annual salary. Up to 10 per cent of Australia-
based employees (APL1–5) were eligible to receive
a bonus payment of up to 5 per cent of their
base annual salary for exceptional performance.
A total of 506 employees received
bonus payments in 2011 for the 2010–11
performance cycle, with the amount
paid across the classifi cations ranging
from $110 to $14,873 (Table 10).
Employee recognition
Austrade recognises high performance
through its annual Global Austrade Staff
Awards. Austrade also participates in APS-
wide recognition programs, such as the
awarding of Australia Day Achievement
Medallions and the Public Service Medal.
Table 10: Performance pay by level, 2010–11 performance cycle (paid in 2011–12)
Austrade
designation
Number
of staff
Aggregated
amount ($’000)
Average
amount ($)
Range of
payments ($)
APL1 2 5 2,889 2,712–3,066
APL2 3 11 3,710 3,315–3,907
APL3 6 27 4,651 4,500–4,681
APL4 6 34 5,784 4,867–6,589
APL5 8 45 5,731 2,329–6,953
AOPL1 11 24 225 110–410
AOPL2 60 53 890 183–4,565
AOPL3 169 305 1,809 207–12,694
AOPL4 201 520 2,588 218–11,226
AOPL5 40 218 5,454 702–14,873
Total 506 1,225 2,421 110–14,873
116 > Australian Trade Commission Annual Report 2011–12
Global Austrade Staff Awards
Global Austrade Staff Awards recognise
outstanding performance by individuals and teams
in their eff orts to assist Australian businesses to
grow in international markets, show excellence
in consular assistance, facilitate investment
into Australia, and assist Australian education
providers to promote their services internationally.
In 2011–12, Global Austrade Staff Awards
recognised the contributions of fi ve individuals
and seven teams. The award recipients were:
› Anna Plawinska – for coordination of the
Australia Unlimited branding rollout in Europe,
and for consistently displaying high levels of
initiative and commitment to Austrade’s values
› Debbie Kerrins – for exemplary leadership
in managing career and talent
› David Tonkin – for exemplary leadership
in the development and, in conjunction
with Human Resources, the delivery of
the anti-bribery training program
› Tracy Harris – for outstanding leadership of
the Australian Education Seminar Series
› Tibet Kara – for exceptional initiative and
innovation in relation to her work for the mining
and energy sector, in particular for the staging
of the fi rst Istanbul inwards mining mission
› Cairo evacuation consular team –
for outstanding work in the national
interest, particularly in relation to the
evacuation of Australians from Cairo
› China International SME Fair 2010 team –
for work undertaken to ensure that the trade
fair was a successful event and for raising
awareness of Australian SME capability in China
› Investing in Research mission team –
for the successful pilot mission to discuss
specifi c research and commercialisation
projects regarding technology
› Japan earthquake and tsunami response
team – for displaying exceptional initiative
and innovation in assisting Australians to leave
Tokyo after the 2011 earthquake and tsunami
› Global Practice team – for outstanding
contribution to their teams as champions of
excellence in Austrade’s business practices
› Mining Indaba Africa project team – for
excellence in the promotion of Australia’s mining
industry at the Mining Indaba investment event
› Vietnam team – for outstanding
contributions to the Prime Minister’s
program and visit to Hanoi for the 17th
ASEAN Summit and the accompanying
Business and Investment Summit.
Australia Day Achievement Medallions
Austrade participated in the Australia Day
Achievement Medallions program in 2011–12.
The program acknowledges the achievements
of public servants, either on special projects
that have made a signifi cant contribution
to the nation, or through outstanding
performance in their core duties.
This year, an Australia Day Achievement
Medallion was awarded to Marcia Kimball for
her work in ensuring that Austrade’s Human
Resources Division anticipates, understands
and meets the needs of the organisation in
a changing and complex environment.
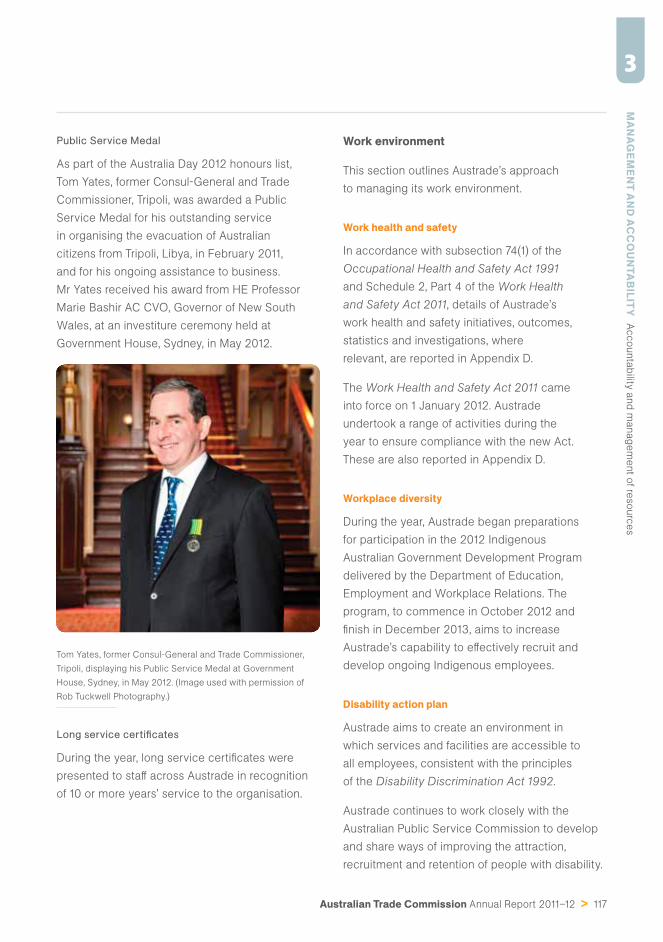
Australian Trade Commission Annual Report 2011–12 > 117
MA
NAG
EMEN
T AN
D ACC
OU
NTA
BILITY
A
cco
unta
bility
and m
anag
em
ent o
f reso
urc
es
3
Public Service Medal
As part of the Australia Day 2012 honours list,
Tom Yates, former Consul-General and Trade
Commissioner, Tripoli, was awarded a Public
Service Medal for his outstanding service
in organising the evacuation of Australian
citizens from Tripoli, Libya, in February 2011,
and for his ongoing assistance to business.
Mr Yates received his award from HE Professor
Marie Bashir AC CVO, Governor of New South
Wales, at an investiture ceremony held at
Government House, Sydney, in May 2012.
Tom Yates, former Consul-General and Trade Commissioner,
Tripoli, displaying his Public Service Medal at Government
House, Sydney, in May 2012. (Image used with permission of
Rob Tuckwell Photography.)
Long service certifi cates
During the year, long service certifi cates were
presented to staff across Austrade in recognition
of 10 or more years’ service to the organisation.
Work environment
This section outlines Austrade’s approach
to managing its work environment.
Work health and safety
In accordance with subsection 74(1) of the
Occupational Health and Safety Act 1991
and Schedule 2, Part 4 of the Work Health
and Safety Act 2011, details of Austrade’s
work health and safety initiatives, outcomes,
statistics and investigations, where
relevant, are reported in Appendix D.
The Work Health and Safety Act 2011 came
into force on 1 January 2012. Austrade
undertook a range of activities during the
year to ensure compliance with the new Act.
These are also reported in Appendix D.
Workplace diversity
During the year, Austrade began preparations
for participation in the 2012 Indigenous
Australian Government Development Program
delivered by the Department of Education,
Employment and Workplace Relations. The
program, to commence in October 2012 and
fi nish in December 2013, aims to increase
Austrade’s capability to eff ectively recruit and
develop ongoing Indigenous employees.
Disability action plan
Austrade aims to create an environment in
which services and facilities are accessible to
all employees, consistent with the principles
of the Disability Discrimination Act 1992.
Austrade continues to work closely with the
Australian Public Service Commission to develop
and share ways of improving the attraction,
recruitment and retention of people with disability.
118 > Australian Trade Commission Annual Report 2011–12
Changes to disability reporting in annual reports
Since 1994, Commonwealth departments and
agencies have reported on their performance
as policy adviser, purchaser, employer, regulator
and provider under the Commonwealth Disability
Strategy. In 2007–08, reporting on the employer
role was transferred to the Australian Public
Service Commission’s State of the Service
Report and the APS Statistical Bulletin. These
reports are available at www.apsc.gov.au. From
2010–11, departments and agencies were no
longer required to report on these functions.
The Commonwealth Disability Strategy has been
overtaken by a new National Disability Strategy
which sets out a 10-year national policy framework
for improving life for Australians with a disability,
their families and carers. A high-level report to
track progress for people with a disability at a
national level will be produced by the Standing
Council on Community, Housing and Disability
Services to the Council of Australian Governments
and will be available at www.fahcsia.gov.au.
The Social Inclusion Measurement and
Reporting Strategy agreed by the Government
in December 2009 will also include some
reporting on disability matters in its regular How
Australia is Faring report and, if appropriate, in
strategic change indicators in agency annual
reports. More detail on social inclusion matters
can be found at www.socialinclusion.gov.au.
Culture and values
During the year, Austrade established an Ethics
Committee. The committee, which reports
directly to the Chief Executive Offi cer, is chaired
by Jeff Lamond, external consultant and former
Australian Public Service Merit Protection
Commissioner. Other committee members include
senior managers from Austrade’s International
Operations, Australian Operations, Education and
Corporate Operations and Human Resources, as
well as the Chief Ethics Offi cer, who is also the
Group Manager, Legal, Security and Procurement.
The committee met three times during the
year to review Austrade’s ethical governance
framework and examine the appropriateness
of individual policies, such as those applying to
confl ict of interest declarations and social media.
Financial management and business assurance
Austrade managed its assets and fi nancial
resources to support its operations by delivering:
› an eff ective system of management
and internal controls
› accounting, treasury and taxation services
› procurement systems and processes
that achieve value for money
› business systems and processes to provide
fi nancial and performance information to
enhance decision-making and the ethical,
effi cient and eff ective use of resources
› information technology that is stable,
secure and increases connectivity
for staff , clients and allies
› systems to monitor, safeguard and
enhance property and other assets.
Information on Austrade’s fi nancial
performance is available on page 125.
Australian Trade Commission Annual Report 2011–12 > 119
MA
NAG
EMEN
T AN
D ACC
OU
NTA
BILITY
A
cco
unta
bility
and m
anag
em
ent o
f reso
urc
es
3
Property management
Austrade manages an overseas and domestic
property portfolio of 162 leased commercial and
residential properties. The portfolio comprises
properties leased from the Overseas Property
Offi ce within the Department of Foreign Aff airs
and Trade and from private sector landlords.
In 2011–12, security upgrade and other property
fi t-out projects improved the safety and security
of Austrade staff , customers and assets, and
15 security and property fi t-outs were completed.
Austrade negotiated 21 new leases and
renewed 53 leases as part of the ongoing
management of its property portfolio.
Austrade managed its property portfolio in
accordance with government policies and
guidelines, and identifi ed opportunities for
maximising effi ciencies and cost eff ectiveness.
This was achieved by a combination of
the appropriate rationalisation of surplus
space and cost reduction while complying
with work health and safety legislation, and
relevant building codes and standards.
Business continuity planning
Austrade continued to strengthen its integrated
business continuity management framework
throughout 2011–12.
Austrade’s business continuity plans were
reviewed and tested under a scenario-based
program. This quality assurance initiative
enhanced staff awareness of potential
risks to Austrade’s business, and enabled
best practice and lessons learned to
be embedded across the agency.
Austrade continued to work closely with the
Department of Foreign Aff airs and Trade to
ensure consistency in business continuity
plan templates and testing mechanisms.
The business continuity framework supported
eff ective decision-making and enabled actions
to be taken quickly to ensure the safety of
staff , the welfare of Australians abroad and the
effi cient recovery of Austrade’s business.
In 2011–12, several events required the activation
of business continuity plans, including in
preparations in March 2012 for a public protest
outside the Austrade-managed Consulate-
General in Sao Paulo, Brazil; and in response to
widespread fl ooding in Fiji in March and April 2012.
Precautions taken by Austrade offi ces ensured
the safety of staff and the organisation’s resilience
when responding to signifi cant incidents.
Protective security
Austrade undertook two key security activities in
2011–12 as part of its ongoing commitment to a
safe and secure working environment for all staff
and customers.
The fi rst project involved the implementation
of the Australian Government’s Protective
Security Policy Framework. At 30 June 2012,
this project was well underway.
The second initiative was the commissioning of an
independent review of Austrade’s security policy,
processes and procedures. This comprehensive
review was completed in March 2012 and
the fi ndings of the review were fully endorsed
by Austrade’s Senior Executive Group.
120 > Australian Trade Commission Annual Report 2011–12
Austrade’s Protective Security Team has continued
to work with stakeholders across the organisation
and with other relevant agencies such as the
Department of Foreign Aff airs and Trade, the
Department of Defence and the Attorney-
General’s Department. The team provided
enhanced security awareness and training to
staff , improved cybersecurity measures and
developed the protective security measures
required for the establishment of the Austrade-
managed offi ces in Mongolia and Colombia.
The team’s work also included security
management of Austrade-sponsored trade events
and exhibitions, such as the Ozmine 2012 event in
Indonesia, and international education and training
events in Indonesia, Pakistan and the Philippines.
Legal services
In 2011–12, legal services to Austrade were
provided through Austrade’s internal legal services
team, with the assistance of external law fi rms.
The nature of the services provided to Austrade
covered a range of legal issues in many diff erent
locations and jurisdictions. These issues included:
› complex contractual negotiations and
drafting, including cooperative agreements
with allies, memorandums of understanding
and departmental agreements
› specifi c legal issues applying to facilitating
trade in fi nancial services, investment and
international education and training
› training on compliance with extraterritorial
laws on bribery conventions, international
laws and other issues at overseas offi ces
› commercial litigation and appeals under the
Administrative Appeals Tribunal Act 1975
mainly involving appeals under the Export
Market Development Grants scheme
› advice, drafting and legal actions
involving employment law, commercial
contracts, intellectual property, real
property and tax, and section 23AF of
the Income Tax Assessment Act 1936
› advice on insurance, legislation, letters of
introduction and Austrade-run programs
› compliance with the Legal Services
Directions and associated reporting and
management of all external legal work
› advice on whole-of-government
approaches to operations and policy
› response to complaints, disputes and
claims arising from Austrade’s day-to-day
operations and the delivery of its services.
Purchasing
Austrade’s procurement policies and
practices refl ect the principles set out in
the Commonwealth Procurement Rules.
Austrade’s procurement practices focus on:
› value for money
› encouraging competition
› effi cient, eff ective and ethical use
of government resources
› accountability and transparency
› compliance with other Australian
Government policies.
Australian Trade Commission Annual Report 2011–12 > 121
MA
NAG
EMEN
T AN
D AC
CO
UN
TAB
ILITY Accountability and m
anagement of resources
3
Austrade’s chief executive instructions on procurement reflect these principles and the need for compliance with government policy by all staff when choosing procurement methods, sourcing potential supplies or entering into contracts. As part of these arrangements, in 2011–12, Austrade published details of the following on the AusTender website, www.tenders.gov.au, or the Austrade website www.austrade.gov.au:
ћ publicly available business opportunities with a value of $80,000 or more on the AusTender website
ћ actual contracts awarded with a value of $10,000 or more on the AusTender website
ћ actual contracts with a value of $100,000 or more on the Austrade website, as required by Senate Order 192.
All major contracts let included a requirement for contractors to allow access to their premises by the Australian National Audit Office. Information on expected procurement in 2012–13 is published in Austrade’s Annual Procurement Plan, which is available on the AusTender website. It outlines Austrade’s planned procurement for the coming year, giving prospective suppliers the opportunity to plan for potential work with the agency.
There were no contracts in 2011–12 that were exempt from being reported on the AusTender website.
Consultants
Consultants are engaged to provide professional, independent and expert advice or services where Austrade needs specific expertise or where independent assessments or input are considered desirable. Austrade selects consultants in the same way that it procures other goods and services. The value and number of consultancies fluctuates from year to year, reflecting changes in government and Austrade priorities. For further information, see Table 11.
During 2011–12, Austrade entered into 94 new consultancy contracts with a total actual expenditure of $1,910,560. In addition, seven ongoing consultancy contracts were active during 2011–12, involving a total actual expenditure of $164,960. Detailed information on Austrade’s consultancies for 2011–12 is available on the AusTender website, www.tenders.gov.au.
Annual reports contain information about actual expenditure on contracts for consultancies. Information on the value of contracts and consultancies is available on the AusTender website.
Table 11: Trends in consultancies
2009–10 2010–11 2011–12
No. of existing consultancies 9 11 7
No. of new consultancies 69 74 94
Total consultancies 78 85 101
Total expenditure ($) 4,058,074 4,363,070 2,075,520
Note: This table has been prepared following confirmation that all consultancies should be recorded irrespective of value and on actual expenditure. It includes adjustments made as a result of a broader review of Austrade processes and reconciliation with financial payments. The consultancy data has been independently audited.
122 > Australian Trade Commission Annual Report 2011–12
Managing knowledge and information
Austrade’s knowledge and information systems
underpin its capacity to create, collect,
analyse and deliver advice and opportunities
to Australian businesses and institutions and
to the Government. Austrade’s information
technology connects staff across a distributed
network in 50 countries, and enables it to
connect Australian and foreign businesses and
institutions to pursue trade, investment and
international education and training interests.
Business systems
Austrade’s relationship management system
is the core business system for managing and
sharing information about its relationships
and interactions with other organisations.
In 2011–12, Austrade commenced a restructure
of its relationship management system to
ensure that the strategic objectives of the
review of Austrade could be implemented.
This work, due for completion by June 2013,
addresses system complexity and useability
issues to support necessary changes to
Austrade’s core business practices.
Austrade also initiated a project to integrate two
major information systems—its intranet, known
as Austin, and information collaboration system,
known as Connect. This project will result in a
single point of entry to an environment where
Austrade will store, access, search, and retrieve
its core knowledge and information assets.
Staff will also be able to selectively subscribe
to areas of interest and receive notifi cations
as new information is added to the system.
The project will address the structural and
content aspects of how corporate information,
particularly governance information such as
policies, procedures, risk management and fraud
control, is provided to staff . The new intranet
is expected to be live in the fi rst half 2013.
Information security
Information security continues to be a strong
focus for Austrade. Continual changes to the
cybersecurity landscape and an increase in the
volume and sophistication of attempts to gain
unauthorised access to Austrade’s information
and systems mean that constant vigilance and
attention is required to avoid compromise.
In 2011–12, Austrade upgraded information
security measures in accordance with advice
provided by the Defence Signals Directorate.
Security-related Austrade access points have
been enhanced and early detection of security-
related events has also been a priority.
In 2011–12, Austrade continued system trials
of a new capability to manage Protected-level
information which, when fully implemented,
will deliver valuable additional information
security. The new system has been subject
to independent assessment and is expected
to receive formal certifi cation, accreditation
and implementation before the end of 2012.
Australian Trade Commission Annual Report 2011–12 > 123
MA
NAG
EMEN
T AN
D ACC
OU
NTA
BILITY
A
cco
unta
bility
and m
anag
em
ent o
f reso
urc
es
3
Data centres
In the fi rst half of 2012, Austrade’s Senior
Executive Group approved a strategy to house
its computing environment within a government-
approved commercial data centre. Planning for
the data centre relocation has commenced and
will involve reviewing the relationship between
Austrade’s data centres in Sydney and Canberra.
Austrade’s data centre strategy is expected to
deliver cost savings through reduced fl oor space
requirements, more effi cient use of equipment
and facilities and reduced power consumption.
The strategy is consistent with the Australian
Government’s data centre requirements and
is expected to be completed in 2013.
In April 2012, Austrade updated its data centre
optimisation targets plan, or energy management
plan, which identifi es energy usage by ICT
equipment and data centres. The plan reviews
current power consumption and projects usage
to 2014–15 based on a number of initiatives that
are being implemented within Austrade. The
plan shows a projected ICT energy consumption
reduction of 32 per cent by 2015, compared with
2009–10. Austrade is on track to meet this goal,
and in 2011–12 achieved a 3.4 per cent power
saving for its ICT systems, compared to 2010–11.
Global ICT equipment upgrade
In 2011–12, Austrade initiated a project for the
planned replacement of its global ICT equipment
at all offi ce locations. New technologies and
contemporary hardware will form a core
component of the design, as will performance and
capacity increases to better support and enhance
productivity. Improved security and resilience
will also be delivered, complementing other
security initiatives that Austrade is undertaking.
Telephony and videoconferencing
Austrade continued to leverage its investment
in global videoconferencing, which is used
for approximately 35,000 conferences per
year across around 400 access points.
Usage continues to rise. Videoconferencing
helps Austrade avoid travel costs, save
time, and reduce the organisation’s carbon
footprint. In October 2011, to support this use
and ensure availability, Austrade upgraded
ageing and underperforming room-based
videoconference end points and desktop-
based systems and implemented disaster
recovery capability for videoconferencing.
During the year, Austrade provided new telephony
operator consoles in major domestic and
overseas offi ces to replace incompatible and
expensive legacy equipment. Console operators
are now integrated into the central call systems,
accessing additional functionality. The project
also delivers ongoing maintenance savings.
A related voice project was initiated in 2011–12
to bring Austrade’s two ICT call centres, one
each in Sydney and Canberra, onto a single
platform. This project enables integration with
the relationship management system and
improved call centre productivity, and off ers
opportunities for further cost reductions.
124 > Australian Trade Commission Annual Report 2011–12
Corporate data infrastructure
In 2011–12, Austrade initiated a range of projects
to strengthen its management and retention of
corporate data. This included the upgrade to
Austrade’s core email platform, and the purchase
and implementation of a new corporate backup
system and email archiving capability. These
projects, to be completed by the end of 2012,
will provide a more secure and transparent
environment for Austrade’s corporate information.
Mobility
Support for Austrade’s highly mobile
workforce remains a core component of its
ICT strategy. The Austrade workstation fl eet
is made up of a majority of laptops rather
than desktops and, in 2011–12, Blackberry
devices were deployed to 150 Austrade staff .
Austrade also commenced work on upgrading
its remote access system, known as Austrade
Anywhere, which allows remote access to
Austrade ICT systems. This new access
capability is currently being tested and is
expected to be live by the end of 2012. The
upgraded system will reduce operational
costs, provide enhanced security features
and enable access from a broader range of
devices such as mobile phones and tablets.
Accessibility to Austrade systems
Austrade is committed to ensuring that its
ICT systems meet the requirements for web
accessibility, so that content is accessible to
people with a diverse range of hearing, movement,
sight and cognitive ability, as described by the
Australian Government Information Management
Offi ce and the mandated Web Content
Accessibility Guidelines (WCAG). Austrade
has completed the fi rst phase of assessment
activities and is now in the process of remediation
planning and ensuring that all external-facing
websites move towards WCAG 2.0 compliance.
Portfolio, program and project management maturity model
The portfolio, program and project management
maturity model, known as P3M3, provides
a framework within which Austrade can
assess its performance, or maturity, and
put in place improvement plans. In 2011–12,
Austrade completed an organisational maturity
assessment of its IT Services areas and identifi ed
areas for improvement, such as benefi ts
realisation and fi nancial risk, and resource
management. A program aimed at achieving
the next level of maturity has commenced
and is expected to be completed by 2014.
› Financial performance 126
› Independent auditor’s report 127
› Certifi cation of fi nancial statements 131
› Financial statements 132
› Notes to and forming part of the fi nancial statements 143
PART FOURFinancial statements
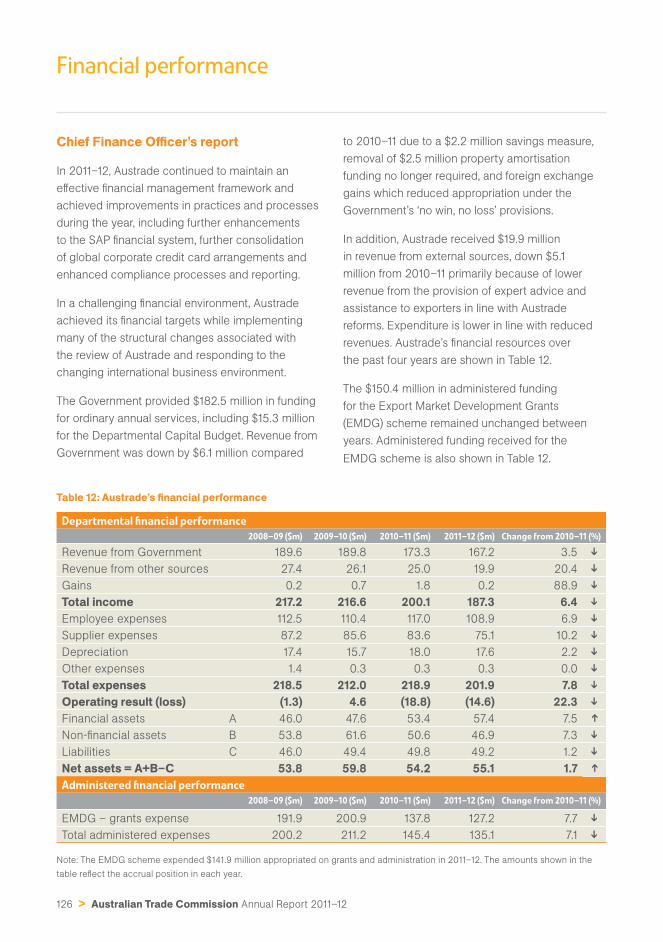
126 > Australian Trade Commission Annual Report 2011–12
Financial performance
Chief Finance Offi cer’s report
In 2011–12, Austrade continued to maintain an
eff ective fi nancial management framework and
achieved improvements in practices and processes
during the year, including further enhancements
to the SAP fi nancial system, further consolidation
of global corporate credit card arrangements and
enhanced compliance processes and reporting.
In a challenging fi nancial environment, Austrade
achieved its fi nancial targets while implementing
many of the structural changes associated with
the review of Austrade and responding to the
changing international business environment.
The Government provided $182.5 million in funding
for ordinary annual services, including $15.3 million
for the Departmental Capital Budget. Revenue from
Government was down by $6.1 million compared
to 2010–11 due to a $2.2 million savings measure,
removal of $2.5 million property amortisation
funding no longer required, and foreign exchange
gains which reduced appropriation under the
Government’s ‘no win, no loss’ provisions.
In addition, Austrade received $19.9 million
in revenue from external sources, down $5.1
million from 2010–11 primarily because of lower
revenue from the provision of expert advice and
assistance to exporters in line with Austrade
reforms. Expenditure is lower in line with reduced
revenues. Austrade’s fi nancial resources over
the past four years are shown in Table 12.
The $150.4 million in administered funding
for the Export Market Development Grants
(EMDG) scheme remained unchanged between
years. Administered funding received for the
EMDG scheme is also shown in Table 12.
Table 12: Austrade’s fi nancial performance
Departmental fi nancial performance
2008–09 ($m) 2009–10 ($m) 2010–11 ($m) 2011–12 ($m) Change from 2010–11 (%)
Revenue from Government 189.6 189.8 173.3 167.2 3.5
➔
Revenue from other sources 27.4 26.1 25.0 19.9 20.4
➔
Gains 0.2 0.7 1.8 0.2 88.9
➔
Total income 217.2 216.6 200.1 187.3 6.4
➔
Employee expenses 112.5 110.4 117.0 108.9 6.9
➔
Supplier expenses 87.2 85.6 83.6 75.1 10.2
➔
Depreciation 17.4 15.7 18.0 17.6 2.2
➔
Other expenses 1.4 0.3 0.3 0.3 0.0
➔
Total expenses 218.5 212.0 218.9 201.9 7.8
➔
Operating result (loss) (1.3) 4.6 (18.8) (14.6) 22.3
➔
Financial assets A 46.0 47.6 53.4 57.4 7.5 ➔
Non-fi nancial assets B 53.8 61.6 50.6 46.9 7.3
➔
Liabilities C 46.0 49.4 49.8 49.2 1.2
➔
Net assets = A+B–C 53.8 59.8 54.2 55.1 1.7 ➔
Administered fi nancial performance
2008–09 ($m) 2009–10 ($m) 2010–11 ($m) 2011–12 ($m) Change from 2010–11 (%)
EMDG – grants expense 191.9 200.9 137.8 127.2 7.7
➔
Total administered expenses 200.2 211.2 145.4 135.1 7.1
➔
Note: The EMDG scheme expended $141.9 million appropriated on grants and administration in 2011–12. The amounts shown in the
table refl ect the accrual position in each year.
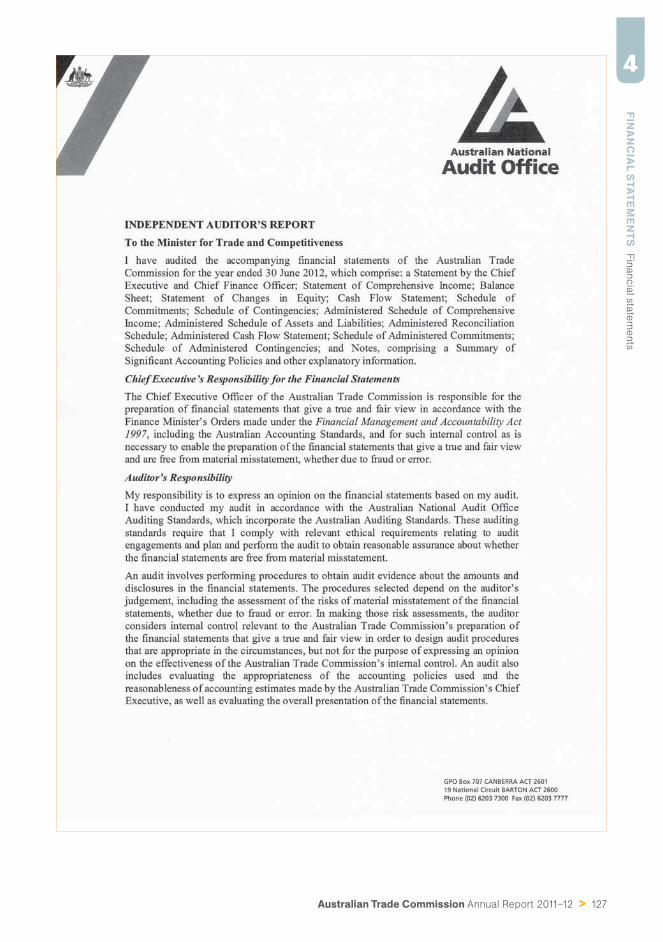
Australian Trade Commission Annual Report 2011–12 > 127
FINA
NC
IAL S
TATEMEN
TS
Fin
ancia
l sta
tem
ents
4Independent
auditor’s report
128 > Australian Trade Commission Annual Report 2011–12
Australian Trade Commission Annual Report 2011–12 > 129
FINA
NC
IAL S
TATEMEN
TS
Fin
ancia
l sta
tem
ents
4
Australian Trade Commission
Financial Statementsfor the Period Ended 30 June 2012
130 > Australian Trade Commission Annual Report 2011–12
TABLE OF CONTENTS
Independent Audit Report 127
Statement by Offi cers 131
Statement of Comprehensive Income 132
Balance Sheet 133
Statement of Changes in Equity 134
Cash Flow Statement 135
Schedule of Commitments 136
Schedule of Contingencies 137
Administered Schedule of Comprehensive Income 138
Administered Schedule of Assets and Liabilities 139
Administered Reconciliation Schedule 139
Administered Cash Flow Statement 140
Schedule of Administered Commitments 141
Schedule of Administered Contingencies 142
Table of Contents – Notes 143
Note 1: Summary of Signifi cant Accounting Policies 144
Note 2: Events After the Reporting Period 152
Note 3: Expenses 153
Note 4: Income 154
Note 5: Financial Assets 155
Note 6: Non-Financial Assets 157
Note 7: Payables 162
Note 8: Provisions 163
Note 9: Restructuring 164
Note 10: Cash Flow Reconciliation 164
Note 11: Contingent Assets and Liabilities 165
Note 12: Senior Executive Remuneration 166
Note 13: Remuneration of Auditors 175
Note 14: Financial Instruments 175
Note 15: Financial Assets Reconciliation 179
Note 16: Administered – Expenses 180
Note 17: Administered – Income 180
Note 18: Administered – Financial Assets 181
Note 19: Administered – Payables 183
Note 20: Administered – Provisions 183
Note 21: Administered – Cash Flow Reconciliation 184
Note 22: Administered – Contingent Assets and Liabilities 185
Note 23: Administered – Financial Instruments 185
Note 24: Administered – Financial Assets Reconciliation 186
Note 25: Appropriations 187
Note 26: Special Accounts 193
Note 27: Compensation and Debt Relief 194
Note 28: Assets Held in Trust 194
Note 29: Reporting of Outcomes 195
Note 30: Net Cash Appropriation Arrangements 198
Australian Trade Commission Annual Report 2011–12 > 131
FINA
NC
IAL S
TATEMEN
TS
Fin
ancia
l sta
tem
ents
4Certifi cation of fi nancial
statements
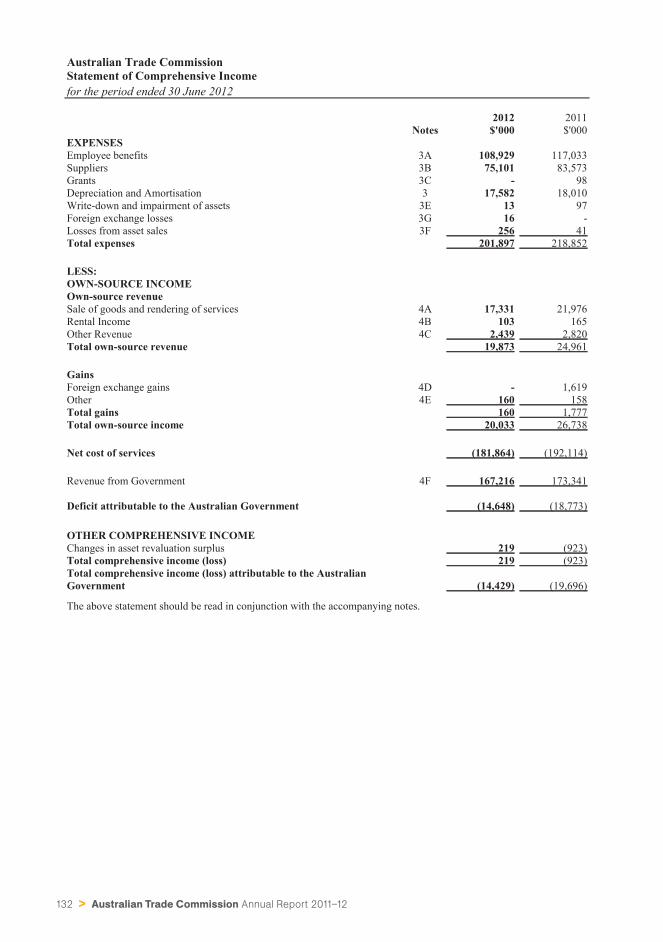
132 > Australian Trade Commission Annual Report 2011–12
Financial statementsAustralian Trade CommissionStatement of Comprehensive Incomefor the period ended 30 June 2012
2012 2011Notes $'000 $'000
EXPENSESEmployee benefits 3A 108,929 117,033Suppliers 3B 75,101 83,573Grants 3C - 98Depreciation and Amortisation 3 17,582 18,010Write-down and impairment of assets 3E 13 97Foreign exchange losses 3G 16 -Losses from asset sales 3F 256 41Total expenses 201,897 218,852
LESS:OWN-SOURCE INCOMEOwn-source revenueSale of goods and rendering of services 4A 17,331 21,976Rental Income 4B 103 165Other Revenue 4C 2,439 2,820Total own-source revenue 19,873 24,961
GainsForeign exchange gains 4D - 1,619Other 4E 160 158Total gains 160 1,777Total own-source income 20,033 26,738
Net cost of services (181,864) (192,114)
Revenue from Government 4F 167,216 173,341
Deficit attributable to the Australian Government (14,648) (18,773)
OTHER COMPREHENSIVE INCOMEChanges in asset revaluation surplus 219 (923)Total comprehensive income (loss) 219 (923)Total comprehensive income (loss) attributable to the AustralianGovernment (14,429) (19,696)
The above statement should be read in conjunction with the accompanying notes.
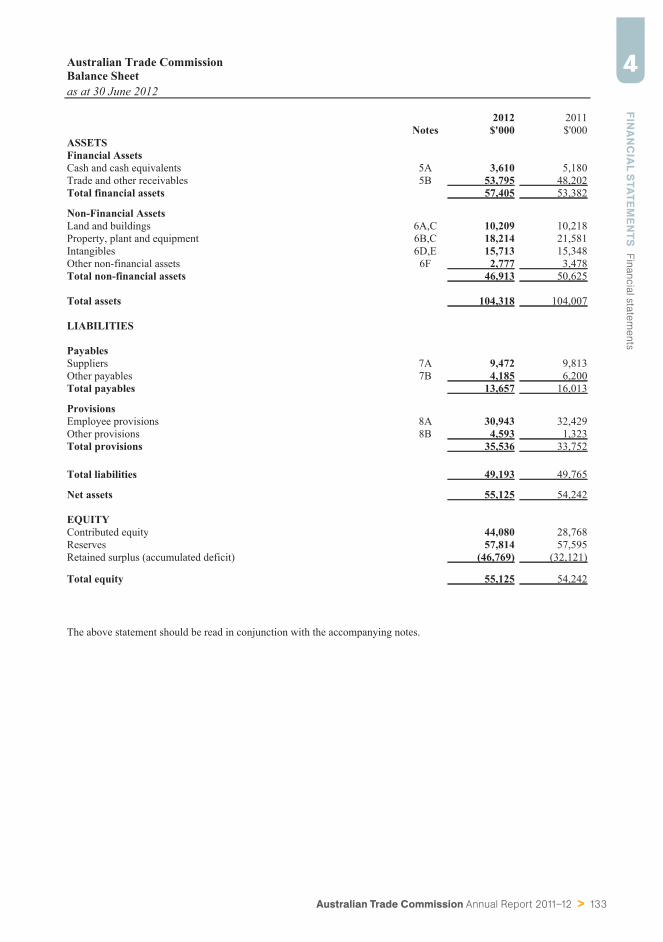
Australian Trade Commission Annual Report 2011–12 > 133
FINA
NC
IAL S
TATEMEN
TS
Fin
ancia
l sta
tem
ents
4Australian Trade CommissionBalance Sheetas at 30 June 2012
2012 2011Notes $'000 $'000
ASSETSFinancial AssetsCash and cash equivalents 5A 3,610 5,180Trade and other receivables 5B 53,795 48,202Total financial assets 57,405 53,382
Non-Financial AssetsLand and buildings 6A,C 10,209 10,218Property, plant and equipment 6B,C 18,214 21,581Intangibles 6D,E 15,713 15,348Other non-financial assets 6F 2,777 3,478Total non-financial assets 46,913 50,625
Total assets 104,318 104,007
LIABILITIES
PayablesSuppliers 7A 9,472 9,813Other payables 7B 4,185 6,200Total payables 13,657 16,013
ProvisionsEmployee provisions 8A 30,943 32,429Other provisions 8B 4,593 1,323Total provisions 35,536 33,752
Total liabilities 49,193 49,765
Net assets 55,125 54,242
EQUITYContributed equity 44,080 28,768Reserves 57,814 57,595Retained surplus (accumulated deficit) (46,769) (32,121)
Total equity 55,125 54,242
The above statement should be read in conjunction with the accompanying notes.
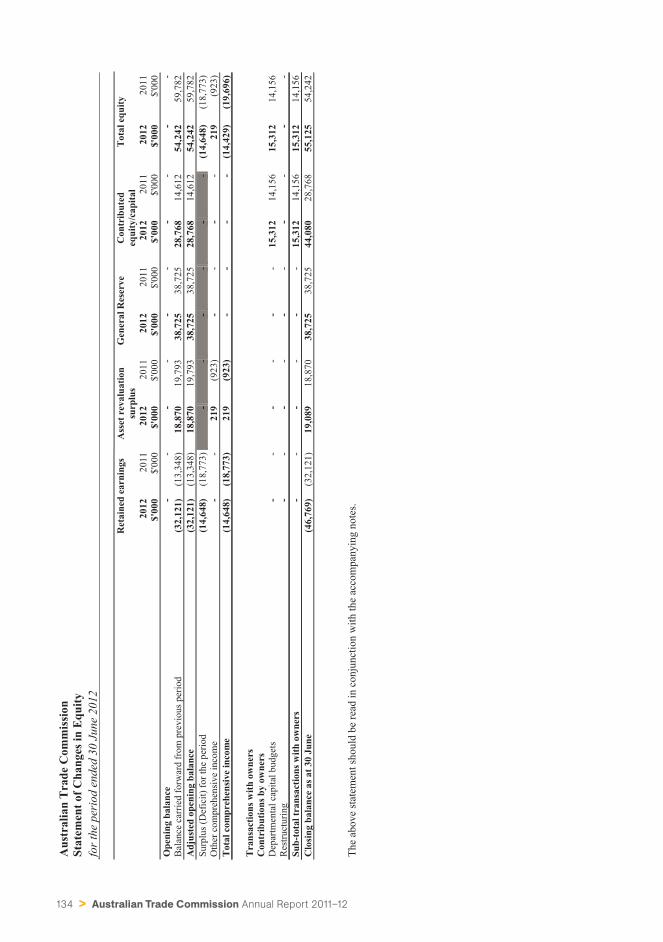
134 > Australian Trade Commission Annual Report 2011–12
Aus
tral
ian
Tra
de C
omm
issi
onSt
atem
ent o
f Cha
nges
in E
quity
for t
he p
erio
d en
ded
30 J
une
2012
Ret
aine
d ea
rnin
gsA
sset
rev
alua
tion
surp
lus
Gen
eral
Res
erve
Con
trib
uted
equi
ty/c
apita
lTo
tal e
quity
2012
$'00
020
11$'
000
2012
$'00
020
11$'
000
2012
$'00
020
11$'
000
2012
$'00
020
11$'
000
2012
$'00
020
11$'
000
Ope
ning
bal
ance
--
--
--
--
--
Bal
ance
car
ried
forw
ard
from
pre
viou
s per
iod
(32,
121)
(13,
348)
18,8
7019
,793
38,7
2538
,725
28,7
6814
,612
54,2
4259
,782
Adj
uste
d op
enin
g ba
lanc
e(3
2,12
1)(1
3,34
8)18
,870
19,7
9338
,725
38,7
2528
,768
14,6
1254
,242
59,7
82Su
rplu
s (D
efic
it) fo
r the
per
iod
(14,
648)
(18,
773)
--
--
--
(14,
648)
(18,
773)
Oth
er c
ompr
ehen
sive
inco
me
--
219
(923
)-
--
-21
9(9
23)
Tota
l com
preh
ensiv
e in
com
e(1
4,64
8)(1
8,77
3)21
9(9
23)
--
--
(14,
429)
(19,
696)
Tran
sact
ions
with
ow
ners
Con
trib
utio
ns b
y ow
ners
Dep
artm
enta
l cap
ital b
udge
ts
--
--
--
15,3
1214
,156
15,3
1214
,156
Res
truct
urin
g-
--
--
--
--
-Su
b-to
tal t
rans
actio
ns w
ith o
wne
rs-
--
--
-15
,312
14,1
5615
,312
14,1
56C
losin
g ba
lanc
e as
at 3
0 Ju
ne(4
6,76
9)(3
2,12
1)19
,089
18,8
7038
,725
38,7
2544
,080
28,7
6855
,125
54,2
42
The
abov
e st
atem
ent s
houl
d be
read
in c
onju
nctio
n w
ith th
e ac
com
pany
ing
note
s.
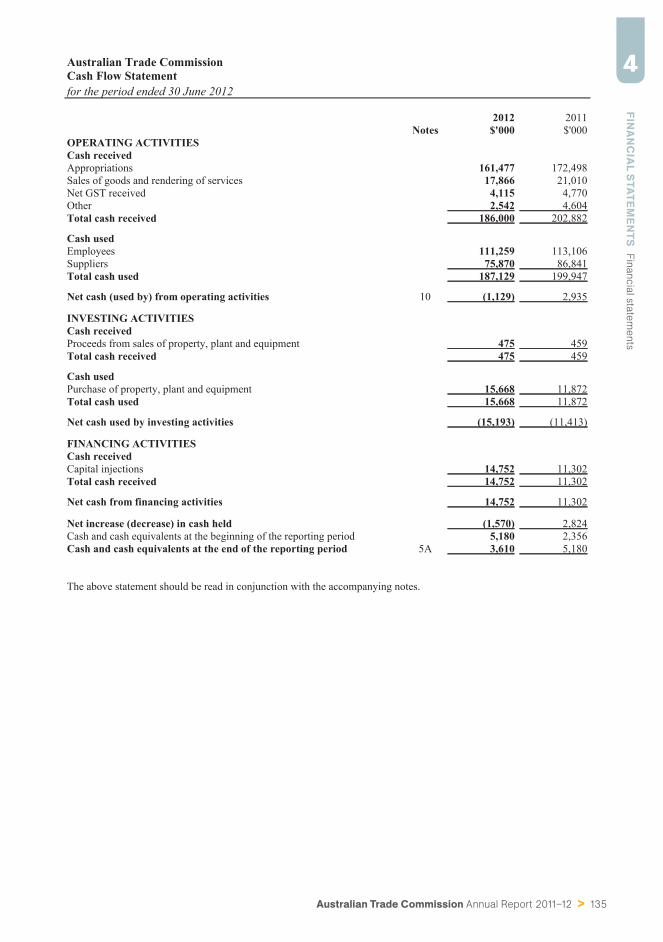
Australian Trade Commission Annual Report 2011–12 > 135
FINA
NC
IAL S
TATEMEN
TS
Fin
ancia
l sta
tem
ents
4Australian Trade CommissionCash Flow Statementfor the period ended 30 June 2012
2012 2011Notes $'000 $'000
OPERATING ACTIVITIESCash receivedAppropriations 161,477 172,498Sales of goods and rendering of services 17,866 21,010Net GST received 4,115 4,770Other 2,542 4,604Total cash received 186,000 202,882
Cash usedEmployees 111,259 113,106Suppliers 75,870 86,841Total cash used 187,129 199,947
Net cash (used by) from operating activities 10 (1,129) 2,935
INVESTING ACTIVITIESCash receivedProceeds from sales of property, plant and equipment 475 459Total cash received 475 459
Cash usedPurchase of property, plant and equipment 15,668 11,872Total cash used 15,668 11,872
Net cash used by investing activities (15,193) (11,413)
FINANCING ACTIVITIESCash receivedCapital injections 14,752 11,302Total cash received 14,752 11,302
Net cash from financing activities 14,752 11,302
Net increase (decrease) in cash held (1,570) 2,824Cash and cash equivalents at the beginning of the reporting period 5,180 2,356Cash and cash equivalents at the end of the reporting period 5A 3,610 5,180
The above statement should be read in conjunction with the accompanying notes.
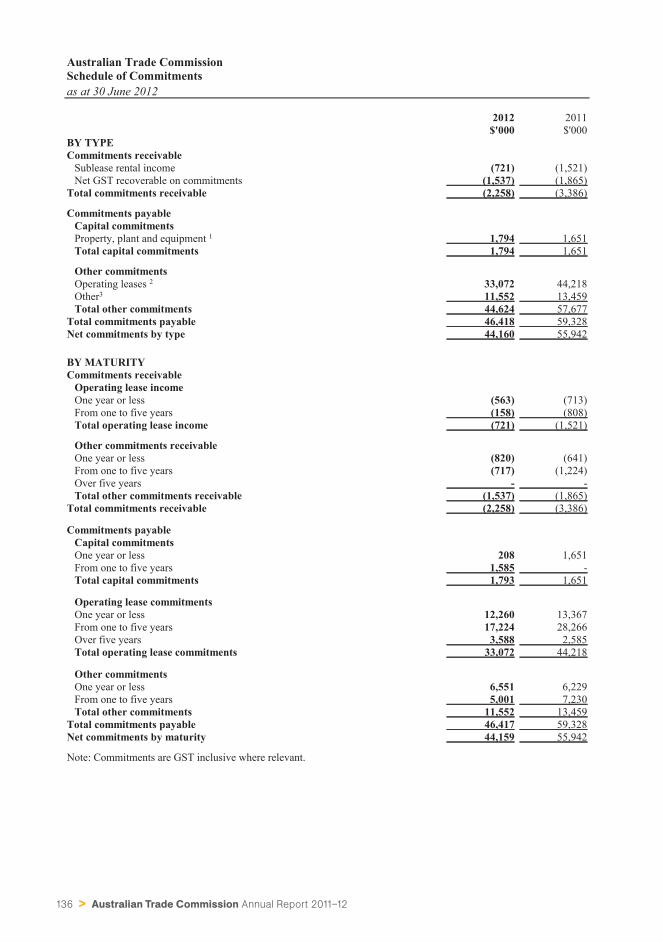
136 > Australian Trade Commission Annual Report 2011–12
Australian Trade CommissionSchedule of Commitmentsas at 30 June 2012
2012 2011$'000 $'000
BY TYPECommitments receivable
Sublease rental income (721) (1,521)Net GST recoverable on commitments (1,537) (1,865)
Total commitments receivable (2,258) (3,386)
Commitments payableCapital commitmentsProperty, plant and equipment 1 1,794 1,651Total capital commitments 1,794 1,651
Other commitmentsOperating leases 2 33,072 44,218Other3 11,552 13,459Total other commitments 44,624 57,677
Total commitments payable 46,418 59,328Net commitments by type 44,160 55,942
BY MATURITYCommitments receivable
Operating lease incomeOne year or less (563) (713)From one to five years (158) (808)Total operating lease income (721) (1,521)
Other commitments receivableOne year or less (820) (641)From one to five years (717) (1,224)Over five years - -Total other commitments receivable (1,537) (1,865)
Total commitments receivable (2,258) (3,386)
Commitments payableCapital commitmentsOne year or less 208 1,651From one to five years 1,585 -Total capital commitments 1,793 1,651
Operating lease commitmentsOne year or less 12,260 13,367From one to five years 17,224 28,266Over five years 3,588 2,585Total operating lease commitments 33,072 44,218
Other commitmentsOne year or less 6,551 6,229From one to five years 5,001 7,230Total other commitments 11,552 13,459
Total commitments payable 46,417 59,328Net commitments by maturity 44,159 55,942
Note: Commitments are GST inclusive where relevant.
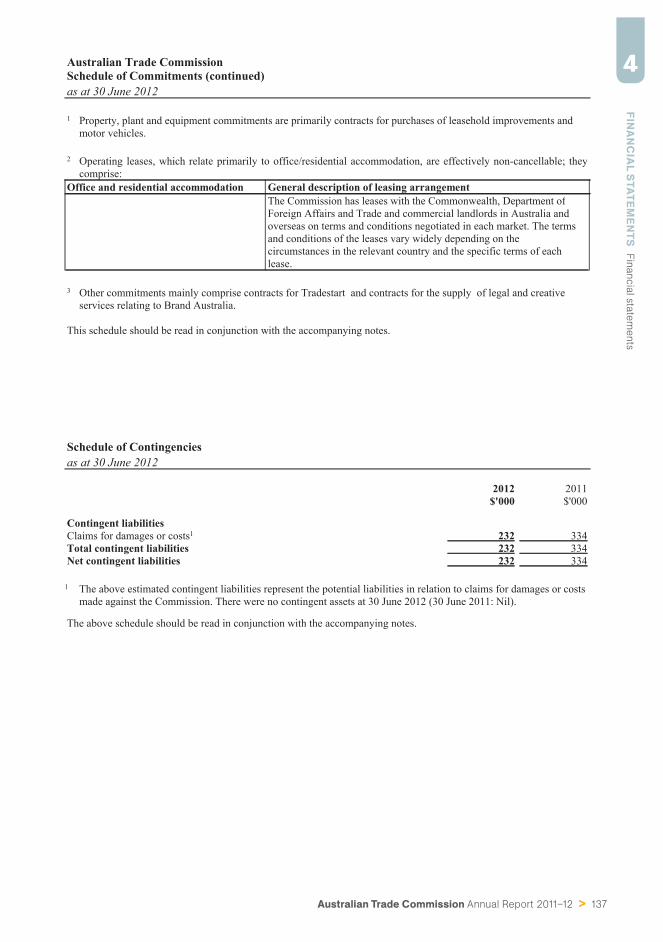
Australian Trade Commission Annual Report 2011–12 > 137
FINA
NC
IAL S
TATEMEN
TS
Fin
ancia
l sta
tem
ents
4Australian Trade CommissionSchedule of Commitments (continued)as at 30 June 2012
1 Property, plant and equipment commitments are primarily contracts for purchases of leasehold improvements andmotor vehicles.
2 Operating leases, which relate primarily to office/residential accommodation, are effectively non-cancellable; theycomprise:
Office and residential accommodation General description of leasing arrangementThe Commission has leases with the Commonwealth, Department ofForeign Affairs and Trade and commercial landlords in Australia andoverseas on terms and conditions negotiated in each market. The termsand conditions of the leases vary widely depending on thecircumstances in the relevant country and the specific terms of eachlease.
3 Other commitments mainly comprise contracts for Tradestart and contracts for the supply of legal and creativeservices relating to Brand Australia.
This schedule should be read in conjunction with the accompanying notes.
Schedule of Contingenciesas at 30 June 2012
2012 2011$'000 $'000
Contingent liabilitiesClaims for damages or costs1 232 334Total contingent liabilities 232 334Net contingent liabilities 232 334
1 The above estimated contingent liabilities represent the potential liabilities in relation to claims for damages or costsmade against the Commission. There were no contingent assets at 30 June 2012 (30 June 2011: Nil).
The above schedule should be read in conjunction with the accompanying notes.
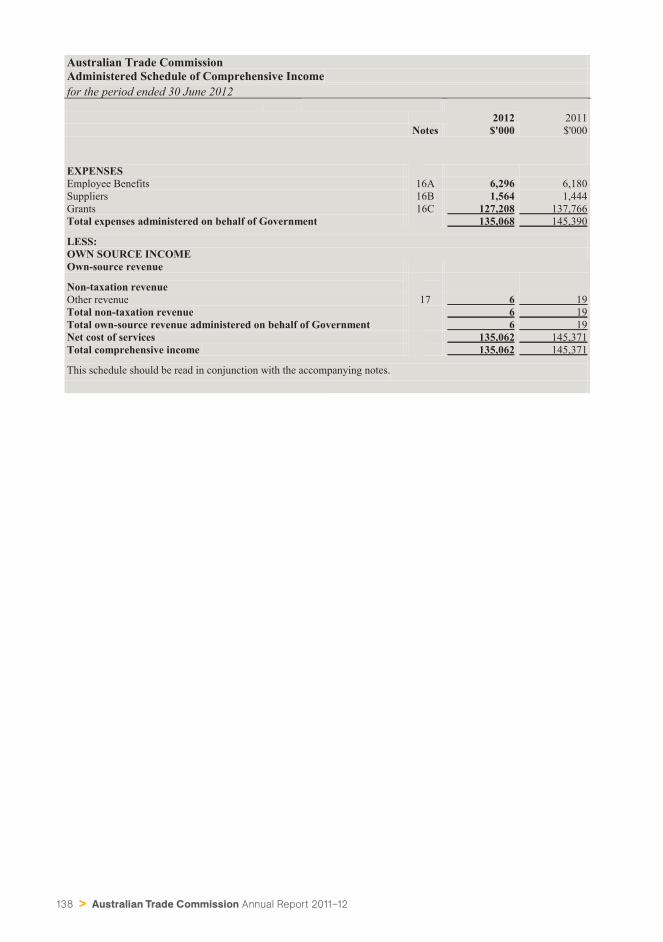
138 > Australian Trade Commission Annual Report 2011–12
Australian Trade CommissionAdministered Schedule of Comprehensive Incomefor the period ended 30 June 2012
2012 2011Notes $'000 $'000
EXPENSESEmployee Benefits 16A 6,296 6,180Suppliers 16B 1,564 1,444Grants 16C 127,208 137,766Total expenses administered on behalf of Government 135,068 145,390
LESS:OWN SOURCE INCOMEOwn-source revenue
Non-taxation revenueOther revenue 17 6 19Total non-taxation revenue 6 19Total own-source revenue administered on behalf of Government 6 19Net cost of services 135,062 145,371Total comprehensive income 135,062 145,371
This schedule should be read in conjunction with the accompanying notes.
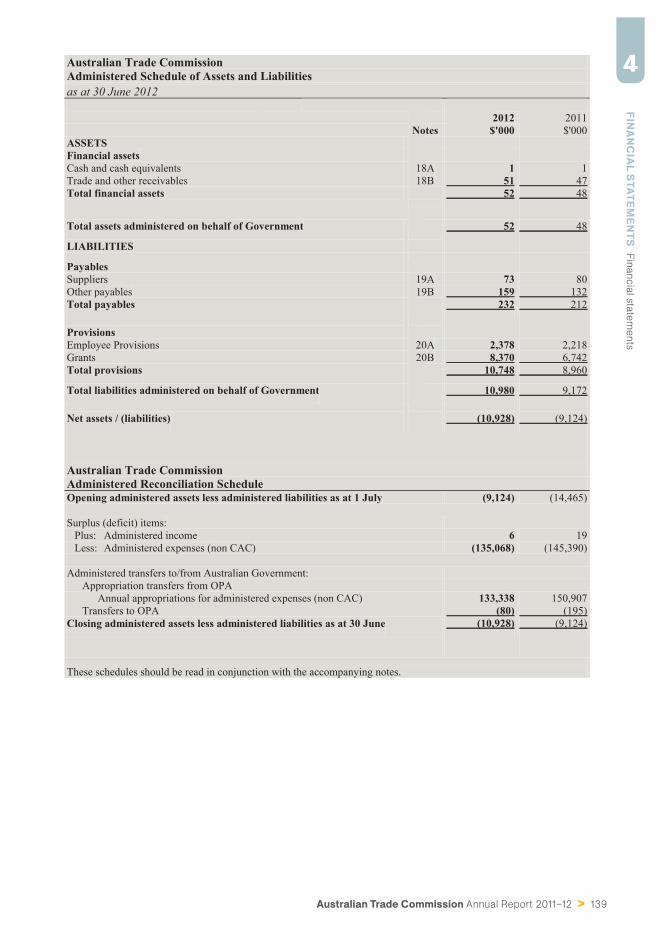
Australian Trade Commission Annual Report 2011–12 > 139
FINA
NC
IAL S
TATEMEN
TS
Fin
ancia
l sta
tem
ents
4Australian Trade CommissionAdministered Schedule of Assets and Liabilitiesas at 30 June 2012
2012 2011Notes $'000 $'000
ASSETSFinancial assetsCash and cash equivalents 18A 1 1Trade and other receivables 18B 51 47Total financial assets 52 48
Total assets administered on behalf of Government 52 48
LIABILITIES
PayablesSuppliers 19A 73 80Other payables 19B 159 132Total payables 232 212
ProvisionsEmployee Provisions 20A 2,378 2,218Grants 20B 8,370 6,742Total provisions 10,748 8,960
Total liabilities administered on behalf of Government 10,980 9,172
Net assets / (liabilities) (10,928) (9,124)
Australian Trade CommissionAdministered Reconciliation ScheduleOpening administered assets less administered liabilities as at 1 July (9,124) (14,465)
Surplus (deficit) items:Plus: Administered income 6 19Less: Administered expenses (non CAC) (135,068) (145,390)
Administered transfers to/from Australian Government:Appropriation transfers from OPA
Annual appropriations for administered expenses (non CAC) 133,338 150,907Transfers to OPA (80) (195)
Closing administered assets less administered liabilities as at 30 June (10,928) (9,124)
These schedules should be read in conjunction with the accompanying notes.
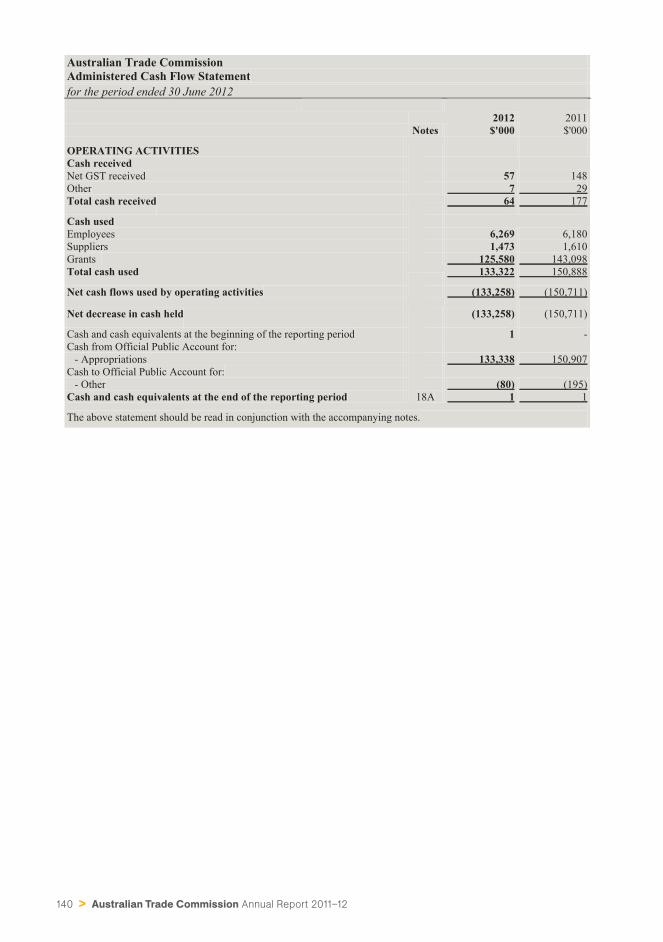
140 > Australian Trade Commission Annual Report 2011–12
Australian Trade CommissionAdministered Cash Flow Statementfor the period ended 30 June 2012
2012 2011Notes $'000 $'000
OPERATING ACTIVITIESCash receivedNet GST received 57 148Other 7 29Total cash received 64 177
Cash usedEmployees 6,269 6,180Suppliers 1,473 1,610Grants 125,580 143,098Total cash used 133,322 150,888
Net cash flows used by operating activities (133,258) (150,711)
Net decrease in cash held (133,258) (150,711)
Cash and cash equivalents at the beginning of the reporting period 1 -Cash from Official Public Account for:
- Appropriations 133,338 150,907Cash to Official Public Account for:
- Other (80) (195)Cash and cash equivalents at the end of the reporting period 18A 1 1
The above statement should be read in conjunction with the accompanying notes.
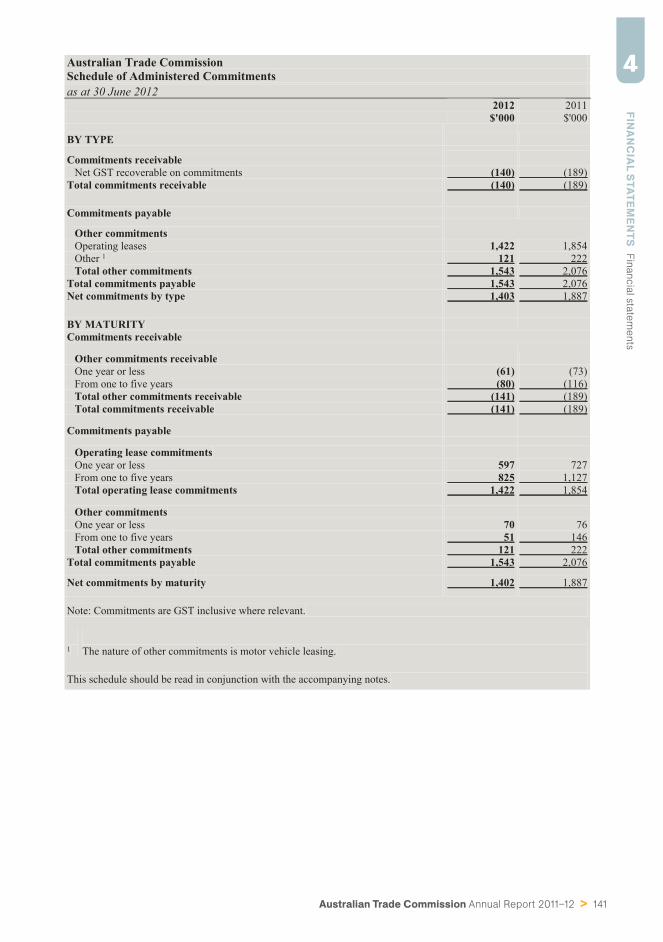
Australian Trade Commission Annual Report 2011–12 > 141
FINA
NC
IAL S
TATEMEN
TS
Fin
ancia
l sta
tem
ents
4Australian Trade CommissionSchedule of Administered Commitmentsas at 30 June 2012
2012 2011$'000 $'000
BY TYPE
Commitments receivableNet GST recoverable on commitments (140) (189)
Total commitments receivable (140) (189)
Commitments payable
Other commitmentsOperating leases 1,422 1,854Other 1 121 222Total other commitments 1,543 2,076
Total commitments payable 1,543 2,076Net commitments by type 1,403 1,887
BY MATURITYCommitments receivable
Other commitments receivableOne year or less (61) (73)From one to five years (80) (116)Total other commitments receivable (141) (189)Total commitments receivable (141) (189)
Commitments payable
Operating lease commitmentsOne year or less 597 727From one to five years 825 1,127Total operating lease commitments 1,422 1,854
Other commitmentsOne year or less 70 76From one to five years 51 146Total other commitments 121 222
Total commitments payable 1,543 2,076
Net commitments by maturity 1,402 1,887
Note: Commitments are GST inclusive where relevant.
1 The nature of other commitments is motor vehicle leasing.
This schedule should be read in conjunction with the accompanying notes.
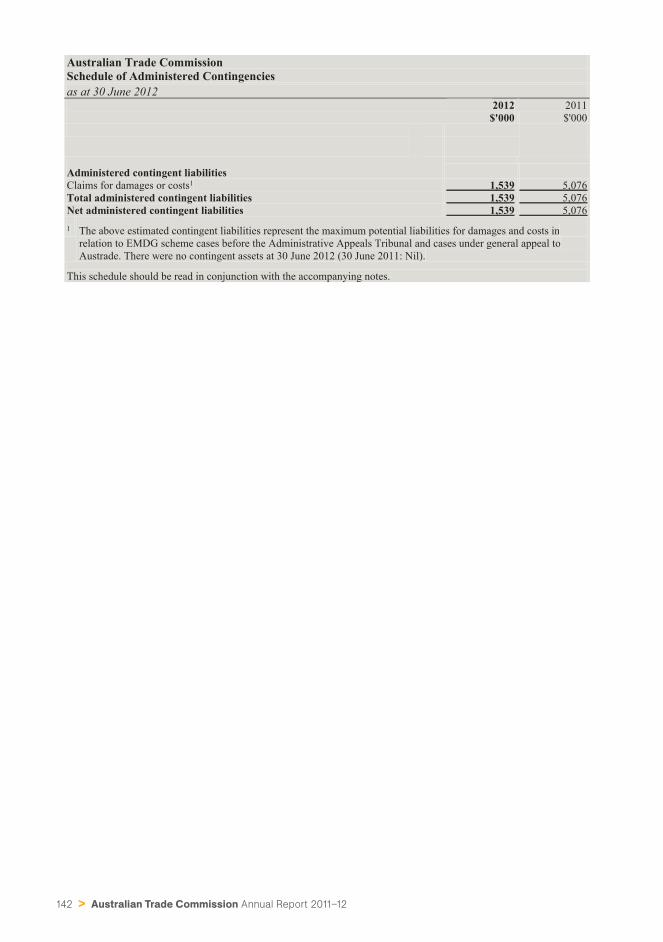
142 > Australian Trade Commission Annual Report 2011–12
Australian Trade CommissionSchedule of Administered Contingenciesas at 30 June 2012
2012 2011$'000 $'000
Administered contingent liabilitiesClaims for damages or costs1 1,539 5,076Total administered contingent liabilities 1,539 5,076Net administered contingent liabilities 1,539 5,0761 The above estimated contingent liabilities represent the maximum potential liabilities for damages and costs in
relation to EMDG scheme cases before the Administrative Appeals Tribunal and cases under general appeal toAustrade. There were no contingent assets at 30 June 2012 (30 June 2011: Nil).
This schedule should be read in conjunction with the accompanying notes.
Australian Trade Commission Annual Report 2011–12 > 143
FINA
NC
IAL S
TATEMEN
TS
Fin
ancia
l sta
tem
ents
4TABLE OF CONTENTS – NOTES
Note 1: Summary of Signifi cant Accounting Policies 144
Note 2: Events After the Reporting Period 152
Note 3: Expenses 153
Note 4: Income 154
Note 5: Financial Assets 155
Note 6: Non-Financial Assets 157
Note 7: Payables 162
Note 8: Provisions 163
Note 9: Restructuring 164
Note 10: Cash Flow Reconciliation 164
Note 11: Contingent Assets and Liabilities 165
Note 12: Senior Executive Remuneration 166
Note 13: Remuneration of Auditors 175
Note 14: Financial Instruments 175
Note 15: Financial Assets Reconciliation 179
Note 16: Administered – Expenses 180
Note 17: Administered – Income 180
Note 18: Administered – Financial Assets 181
Note 19: Administered – Payables 183
Note 20: Administered – Provisions 183
Note 21: Administered – Cash Flow Reconciliation 184
Note 22: Administered – Contingent Assets and Liabilities 185
Note 23: Administered – Financial Instruments 185
Note 24: Administered – Financial Assets Reconciliation 186
Note 25: Appropriations 187
Note 26: Special Accounts 193
Note 27: Compensation and Debt Relief 194
Note 28: Assets Held in Trust 194
Note 29: Reporting of Outcomes 195
Note 30: Net Cash Appropriation Arrangements 198
144 > Australian Trade Commission Annual Report 2011–12
Notes to and forming part of the Financial Statements
Note 1: Summary of Significant Accounting Policies
1.1 Objectives of the Australian Trade Commission
The Australian Trade Commission (the Commission) is an Australian Government controlled entity. It is a not-for-profit entity.
The Commission is the Australian Government's export and international business development agency. Theobjectives of the Commission are to:
! Enhance Australia's national properity by assisting Australian enterprises to capture international businessopportunities to sustain growth, employment and investment;
! Increase the capability and capacity of Australian industry to compete in international markets throughattracting productive foreign direct investment and supporting the sustainable development of Australia'sinternational education and training services;
! Provide a commercial, international perspective that can inform policy development, including by identifyingbarriers to trade and investment; and
! Promote Australia's education and training sector internationally.
The Commission is structured to meet the following outcomes :
Outcome 1: Advance Australia's trade, investment and education promotion interests through information, adviceand services to business, the education sector and governments.
Outcome 2: The protection and welfare of Australians abroad through timely and responsive consular and passportservices in specific locations overseas.
The continued existence of the Commission in its present form and with its present programs is dependent onGovernment policy and on continuing funding by Parliament for the Commission's administration and programs.
The Commission's activities contributing toward these outcomes are classified as either departmental or administered.Departmental activities involve the use of assets, liabilities, income and expenses controlled or incurred by theCommission in its own right. Administered activities involve the management or oversight by the Commission, onbehalf of the government, of items controlled or incurred by the government.
The Commission conducts the following administered activities on behalf of the Government:
! Export Market Development Grants Scheme
Australian Trade Commission Annual Report 2011–12 > 145
FINA
NC
IAL S
TATEMEN
TS
Fin
ancia
l sta
tem
ents
4Notes to and forming part of the Financial Statements
1.2 Basis of Preparation of the Financial Statements
The financial statements are general purpose financial statements and are required by section 49 of the FinancialManagement and Accountability Act 1997 (FMA Act).
The financial statements and notes have been prepared in accordance with:
! Finance Minister's Orders (or FMOs) for the reporting periods ending on or after 1 July 2011; and ! Australian Accounting Standards and Interpretations issued by the Australian Accounting Standards Board
(AASB) that apply for the reporting period.
The financial statements have been prepared on an accrual basis and in accordance with the historical cost convention,except for certain assets and liabilities at fair value. Except where stated, no allowance is made for the effect ofchanging prices on the results or the financial position.
The financial statements are presented in Australian dollars and values are rounded to the nearest thousand dollarsunless otherwise specified.
Unless an alternative treatment is specifically required by an accounting standard or the FMOs, assets and liabilitiesare recognised in the balance sheet when and only when it is probable that future economic benefits will flow to theCommission or a future sacrifice of economic benefits will be required and the amounts of the assets or liabilities canbe reliably measured. However, assets and liabilities arising under executor contracts are not recognised unlessrequired by an accounting standard. Liabilities and assets which are unrecognised are reported in the schedule ofcommitments or the schedule of contingencies.
Unless an alternative treatment is specifically required by an accounting standard, income and expenses arerecognised in the Statement of Comprehensive Income when and only when the flow, consumption or loss ofeconomic benefits has occurred and can be reliably measured.
1.3 Significant Accounting Judgements and Estimates
In the process of applying the accounting policies listed in this note, the Commission has made the followingjudgements that have the most significant impact on the amounts recorded in the financial statements:
! The fair value of leasehold improvements has been taken to be the depreciated replacement cost as determinedby an independent valuer by reference to the gross replacement cost;
! The fair value of plant and equipment has been determined by reference to the market value of similar assets;
! The liability for long service leave has been estimated using present value techniques, which take account ofattrition rates and pay increases through promotion and inflation;
! The liability for grants lodged and payable under the EMDG Scheme but not yet determined has beenestimated by reference to payment histories in previous years;
! The liability for grant appeals lodged under the EMDG Scheme but not yet finalised has been estimated byreference to successful appeals histories in previous years; and
! The provision for impairment of departmental financial assets has been determined by reference to collection
histories in previous years and the current debt profile.
No accounting assumptions or estimates have been identified that have a significant risk of causing a materialadjustment to carrying amounts of assets and liabilities within the next reporting period.
146 > Australian Trade Commission Annual Report 2011–12
Notes to and forming part of the Financial Statements
1.4 New Australian Accounting Standards
Adoption of New Australian Accounting Standard Requirements
No accounting standard has been adopted earlier than the application date as stated in the standard.
No new or revised Standards, amending Standards or Interpretations that were issued prior to signing of the statementby the Chief Executive and Chief Finance Officer which are applicable to the current reporting period have a financialimpact, or are expected to have a future financial impact on the Commission.
Future Australian Accounting Standard Requirements
No new or revised Standards, amending Standards or Interpretations that were issued prior to signing of the statementby the Chief Executive and Chief Finance Officer which are applicable to the future reporting periods are expected tohave a future financial impact on the Commission.
1.5 Revenue
Revenue from Government Amounts appropriated for departmental appropriations for the year (adjusted for any formal additions and reductions)are recognised as Revenue from Government when the Commission gains control of the appropriation, except forcertain amounts that relate to activities that are reciprocal in nature, in which case revenue is recognised only when ithas been earned. Appropriations receivable are recognised at their nominal amounts.
Revenue from the sale of goods is recognised when:
a) the risks and rewards of ownership have been transferred to the buyer;
b) the Commission retains no managerial involvement or effective control over the goods;
c) the revenue and transaction costs incurred can be reliably measured; and
d) it is probable that the economic benefits associated with the transaction will flow to the Commission.
Revenue from the rendering of services is recognised by reference to the stage of completion of contracts at thereporting date. The revenue is recognised when:
a) the amount of revenue, stage of completion and transaction costs incurred can be reliably measured; and b) the probable economic benefits associated with the transaction will flow to the Commission.
The stage of completion of contracts at the reporting date is determined by reference to the proportion that costsincurred to date bear to the total estimated costs of the transaction.
Receivables for goods and services, which have 30 day terms, are recognised at the nominal amounts due less anyimpairment allowance account. Collectability of debts is reviewed at the end of the reporting period. Allowances aremade when collectability of the debt is no longer probable.
1.6 Gains
Resources Received Free of Charge
Resources received free of charge are recognised as gains when, and only when, a fair value can be reliablydetermined and the services would have been purchased if they had not been donated. Use of those resources isrecognised as an expense.
Resources received free of charge are recorded as either revenue or gains depending on their nature.
Sale of Assets
Gains from disposal of assets are recognised when control of the asset has passed to the buyer.
Australian Trade Commission Annual Report 2011–12 > 147
FINA
NC
IAL S
TATEMEN
TS
Fin
ancia
l sta
tem
ents
4Notes to and forming part of the Financial Statements
1.7 Transactions with the Government as Owner
Equity Injections
Amounts appropriated which are designated as 'equity injections' for a year (less any formal reductions) andDepartmental Capital Budgets (DCBs) are recognised directly in contributed equity in that year.
Restructuring of Administrative Arrangements
Net assets received from or relinquished to another Government entity under a restructuring of administrativearrangements are adjusted at their book value directly against contributed equity.
1.8 Employee Benefits
Liabilities for ‘short-term employee benefits’ (as defined in AASB 119 Employee Benefits) and termination benefitsdue within twelve months of the end of the reporting period are measured at their nominal amounts.
The nominal amount is calculated with regard to the rates expected to be paid on settlement of the liability.
Other long term employee benefit liabilities are measured as the net total of the present value of the defined benefitobligation at the end of the reporting period minus the fair value at the end of the reporting period of plan assets (ifany) out of which the obligations are to be settled directly.
Leave
The liability for employee benefits includes provisions for annual leave and long service leave. No provision has beenmade for sick leave as all sick leave is non-vesting and the average sick leave taken in future years by employees ofthe Commission is estimated to be less than the annual entitlement for sick leave.
The leave liabilities are calculated on the basis of employees' remuneration at the estimated salary rates that will beapplied at the time the leave is taken, including the Commission's employer superannuation contribution rates to theextent that the leave is likely to be taken during service rather than paid out on termination.
The liability for long service leave is estimated using present value techniques, which take account of attrition ratesand pay increases through promotion and inflation.
For employees engaged overseas, liabilities for separation entitlements are calculated in accordance with local labourconditions.
Separation and Redundancy
Provision is made for separation and redundancy benefit payments. The Commission recognises a provision fortermination when it has developed a detailed formal plan for the terminations and there is no realistic possibility ofwithdrawal.
Superannuation
Australian based staff of the Commission are members of the Commonwealth Superannuation Scheme (CSS), thePublic Sector Superannuation Scheme (PSS), the Public Sector Superannuation accumulation plan (PSSap), and asmall number of other complying funds nominated by employees.
The CSS and PSS are defined benefit schemes for the Australian Government. The PSSap is a defined contributionscheme.
The liability for defined benefits is recognised in the financial statements of the Australian Government and is settledby the Australian Government in due course. This liability is reported in the Department of Finance andDeregulation's administered schedules and notes.
148 > Australian Trade Commission Annual Report 2011–12
Notes to and forming part of the Financial StatementsThe Commission makes employer contributions to the employees' superannaution schemes at rates determined by anactuary to be sufficient to meet the current cost to the Government. The Commission accounts for the contributions asif they were contributions to defined contribution plans.
For employees engaged overseas, the Commission pays employer contributions to meet its superannuation obligations,which vary according to local employment conditions.
The liability for superannuation recognised as at 30 June represents outstanding contributions for the final pay periodof the year and other amounts payable in relation to 2011-12.
1.9 Leases
A distinction is made between finance leases and operating leases. Finance leases effectively transfer from the lessorto the lessee substantially all the risks and benefits incidental to ownership of leased assets. An operating lease is alease that is not a finance lease. In operating leases, the lessor effectively retains substantially all such risks andbenefits.
Where an asset is acquired by means of a finance lease, the asset is capitalised at either the fair value of the leaseproperty or, if lower, the present value of minimum lease payments at the inception of the contract and a liability isrecognised at the same time and for the same amount.
The discount rate used is the interest rate implicit in the lease. Leased assets are amortised over the period of thelease. Lease payments are allocated between the principal component and the interest expense.
Operating lease payments are expensed on a straight-line basis which is representative of the pattern of benefitsderived from the leased assets.
The net present value of future net outlays in respect of surplus space under non-cancellable lease agreements isexpensed in the period in which the space becomes surplus.
Security deposits in relation to overseas property leases are payable to the Commission on the termination ofindividual leases. These deposits are classified as current or non-current receivables as appropriate.
Lease incentives taking the form of payments from landlords, subsidised fitout, or rental holidays, are recognised asliabilities. These liabilities are reduced by allocating future lease payments between rental expense and reduction ofthe liability.
1.10 Cash
Cash and cash equivalents includes cash on hand, cash at banks and deposits held at call with banks and includes cashin special accounts. Cash is recognised at its nominal amount.
Australian Trade Commission Annual Report 2011–12 > 149
FINA
NC
IAL S
TATEMEN
TS
Fin
ancia
l sta
tem
ents
4Notes to and forming part of the Financial Statements
1.11 Financial Assets and Liabilities
Recognised financial assets and liabilities
Financial assets and liabilities are measured at fair value. In practice this means that receivables are measured at theirnominal amounts, less any allowance for impairment losses. Provisions are made when collection of the debt is judgedto be less rather than more likely.
Trade creditors and accruals are recognised to the extent that the goods or services have been received (andirrespective of having been invoiced) and measured at their nominal amounts, being the amounts at which they will besettled.
1.12 Contingent Liabilities and Contingent Assets
Contingent liabilities and contingent assets are not recognised in the balance sheet but are reported in the relevantschedules and notes. They may arise from uncertainty as to the existence of a liability or asset or represent an asset orliability in respect of which the amount cannot be reliably measured. Contingent assets are disclosed when settlementis probable but not virtually certain and contingent liabilities are disclosed when settlement is greater than remote.
1.13 Acquisition of assets
Assets are recorded at cost on acquisition except as stated below. The cost of acquisition includes the fair value ofassets transferred in exchange and liabilities undertaken. Financial assets are initially measured at their fair value plustransaction costs where appropriate.
Assets acquired at no cost, or for nominal consideration, are initially recognised as assets and income at their fairvalue at the date of acquisition, unless acquired as a consequence of restructuring of administrative arrangements. Inthe latter case, assets are initially recognised as contributions by owners at the amounts at which they were recognisedin the transferor agency’s accounts immediately prior to the restructuring.
1.14 Property, plant and equipment
Asset recognition threshold
Purchases of property plant and equipment are recognised initially cost in the balance sheet, except forpurchases costing less than $5,000 ($3,500 for computer equipment), which are expensed in the year of acquisition(other than where they form part of a group of similar items which are significant in total).
The initial cost of an asset includes an estimate of the cost of dismantling and removing the item and restoring the siteon which it is located where there is a reasonable prospect that this will be required.
Revaluations
Fair values for each class of asset are determined as shown below:
Asset class Fair value measured at:Land and Buildings
-Leasehold improvements Depreciated replacement costInfrastructure, plant and equipment -Plant and equipment Market selling price
Following initial recognition at cost, property, plant and equipment are carried at fair value less subsequentaccumulated depreciation and accumulated impairment losses. Valuations are conducted with sufficient frequency toensure that the carrying amounts of assets do not differ materially from the assets’ fair values as at the reporting date. The regularity of independent valuations depends upon the volatility of movements in market values for the relevantassets.
150 > Australian Trade Commission Annual Report 2011–12
Notes to and forming part of the Financial StatementsRevaluation adjustments are made on a class basis. Any revaluation increment is credited to equity under the headingof asset revaluation reserve except to the extent that it reversed a previous revaluation decrement of the same assetclass that was previously recognised in the surplus/deficit. Revaluation decrements for a class of assets are recogniseddirectly in the surplus/deficit except to the extent that they reversed a previous revaluation increment for that class.
Any accumulated depreciation as at the revaluation date is eliminated against the gross carrying amount of the assetand the asset restated to the revalued amount.
Depreciation
Depreciable property, plant and equipment assets are written-off to their estimated residual values over their estimateduseful lives to the Commission using, in all cases, the straight-line method of depreciation.
Depreciation rates (useful lives), residual values and methods are reviewed at each reporting date and necessaryadjustments are recognised in the current, or current and future, reporting periods, as appropriate.
Depreciation rates applying to each class of depreciable asset are based on the following useful lives:
2012 2011Leasehold improvements Lease term or assessed life Lease term or assessed lifeProperty, plant and equipment 3 to 10 years 3 to 10 years
Impairment
All assets were assessed for impairment at 30 June 2012. Where indications of impairment exist, the asset’srecoverable amount is estimated and an impairment adjustment made if the asset’s recoverable amount is less than itscarrying amount.
The recoverable amount of an asset is the higher of its fair value less costs to sell and its value in use. Value in use isthe present value of the future cash flows expected to be derived from the asset. Where the future economic benefit ofan asset is not primarily dependent on the asset’s ability to generate future cash flows, and the asset would be replacedif the Commission were deprived of the asset, its value in use is taken to be its depreciated replacement cost.
Derecognition
An item of property, plant and equipment is derecognised upon disposal or when no further future economic benefitsare expected from its use or disposal.
Restoration Provisions
Provisions for restoration represent restoration obligations in repect of ICT equipment. The provisions are the bestestimate of the present value of the expenditure required to settle the restoration obligations at reporting date, basedon current security and legal requirements and technology. The amount of the provision for future restoration costs iscapitalised as an Infrastructure Plant and Equipment asset and amortised over the asset life.
1.15 Intangibles
The Commission's intangibles comprise internally developed and purchased software for internal use and otherintellectual property. Other intellectual property comprises still and moving images and web site resources. Theseassets are carried at cost less accumulated amortisation and accumulated impairment losses.
Intangible asset development projects in progress, where future economic benefits are assessed as probable, arerecognised progressively as assets and measured at cost. Amortisation begins when the asset is first put into use orheld ready for use.
Intangible assets are amortised on a straight-line basis over their anticipated useful life. The useful lives of theCommission's software are 3 to 8 years (2010-11: 3 to 8 years).
Australian Trade Commission Annual Report 2011–12 > 151
FINA
NC
IAL S
TATEMEN
TS
Fin
ancia
l sta
tem
ents
4Notes to and forming part of the Financial StatementsAll intangible assets were assessed for impairment at 30 June 2012. Where indications of impairment exist, the asset’srecoverable amount is estimated and an impairment adjustment made if the asset’s recoverable amount is less than itscarrying amount.
1.16 Taxation / Competitive NeutralityThe Commission is exempt from all forms of taxation except Fringe Benefits Tax (FBT) and the Goods and ServicesTax (GST).
The Commission also pays various in-country taxes applicable to its overseas operations.
Revenues, expenses and assets are recognised net of GST or equivalent except where the amount of GST orequivalent incurred is not recoverable from the Australian Taxation Office and except for receivables and payables.
Competitive neutralityThe Commission has not been required to make any competitive neutrality payments.
1.17 Foreign currency
Transactions denominated in a foreign currency are translated to Australian currency using the exchange rate at thedate of the transaction. At reporting date, foreign currency receivables and payables or assets and liabilities aretranslated at the exchange rates current as at that date. All exchange gains and losses are recognised as revenues orexpenses, as appropriate.
The Commission's operating budget funding for overseas activities is adjusted for any differences in realised foreignexchange transactions during the year against rates set at budget time by the Department of Finance and Deregulation. Adjustments are generally made to the Appropriation Bills in the current or following year. Any amounts soreceivable or payable at the end of the reporting period are recognised as assets or liabilities as appropriate.
1.18 Reporting of Administered Activities
Administered revenues, expenses, assets, liabilities and cash flows are disclosed in the administered schedules andrelated notes.
Except where otherwise stated below, administered items are accounted for on the same basis and using the samepolicies as for departmental items, including the application of Australian Accounting Standards.
Administered Cash Transfers to and from the Official Public Account
Revenue collected by the Commission for use by the government rather than the Commission is administered revenue.Collections are transferred to the Official Public Account (OPA) maintained by the Department of Finance andDeregulation. Conversely, cash is drawn from the OPA to make payments under Parliamentary appropriation onbehalf of Government. These transfers to and from the OPA are adjustments to the administered cash held by theCommission on behalf of the Government and reported as such in the schedule of administered cash flows and in theadministered reconciliation schedule.
GrantsThe Commission, on behalf of the Government, administers grants relating to the Export Market Development GrantsScheme (EMDG).
Export Market Development Grants are brought to account when deemed payable in accordance with the provisionsof the Export Market Development Grants Act 1997. However, a provision is also recognised at the end of thefinancial year for the likely payments arising from grants claims and appeals lodged but not yet finalised based onprior years' payment history.
152 > Australian Trade Commission Annual Report 2011–12
Australian Trade CommissionNotes to and forming part of the Financial Statementsfor the year ended 30 June 2012
Note 2: Events After the Reporting Period
There was no subsequent event that had the potential to significantly affect the ongoing structure and financialactivities of the Commission.
Australian Trade Commission Annual Report 2011–12 > 153
FINA
NC
IAL S
TATEMEN
TS
Fin
ancia
l sta
tem
ents
4Notes to and forming part of the Financial Statements
2012 2011$'000 $'000
Note 3: Expenses
Note 3A: Employee BenefitsWages and salaries 81,277 86,173Superannuation:
Defined contribution plans 2,531 2,228Defined benefit plans 4,376 5,195
Leave and other entitlements 15,784 15,711Separation and redundancies 3,459 6,225Fringe Benefits Tax 1,502 1,501Total employee benefits 108,929 117,033
Note 3B: SuppliersGoods and servicesContractors, consultants and service providers 9,794 9,810Non-lease property related costs 4,977 4,530Publicity and promotions 13,605 14,686Communications and information technology 5,638 5,808Travel and related expenses 7,828 9,454Tradestart payments 3,299 3,281Other operating costs 8,253 9,677Total goods and services 53,394 57,246
Goods and services are made up of:Rendering of services - related entities 411 511Rendering of services - external parties 52,983 56,735Total goods and services 53,394 57,246
Other supplier expensesOperating lease rentals - related entities:
Minimum lease payments 3,973 9,645Operating lease rentals - external parties:
Minimum lease payments 17,488 16,335Workers compensation expenses 246 347Total other supplier expenses 21,707 26,327Total supplier expenses 75,101 83,573
Note 3C: GrantsPrivate sector:Other - 98Total grants - 98
Note 3D: Depreciation and AmortisationDepreciation:
Infrastructure, plant and equipment 7,755 7,536Buildings 4,074 4,899
Total depreciation 11,829 12,435
Amortisation:Intangibles 5,753 5,575
Total Amortisation 5,753 5,575Total depreciation and amortisation 17,582 18,010
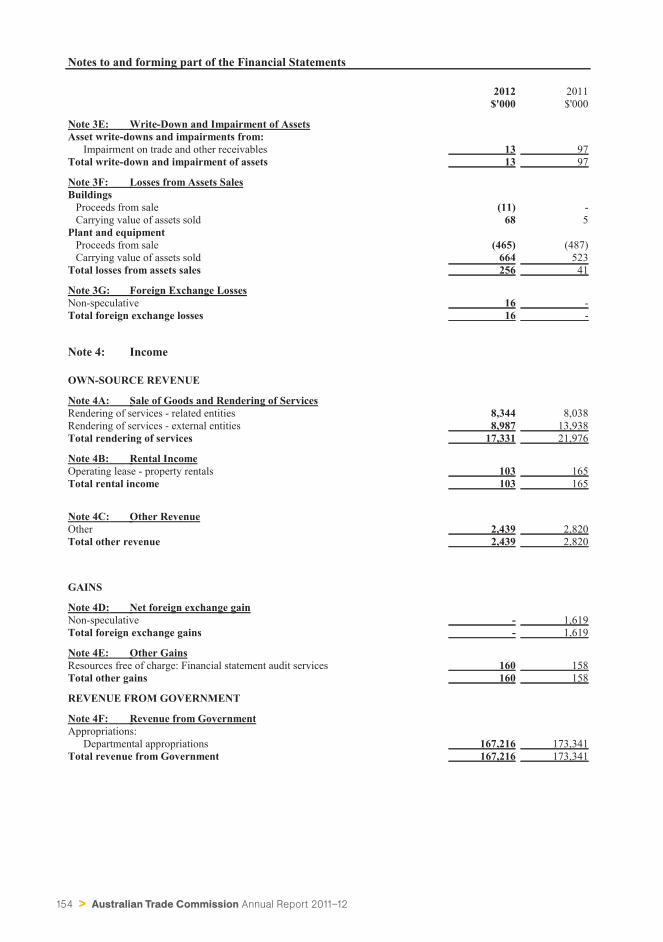
154 > Australian Trade Commission Annual Report 2011–12
Notes to and forming part of the Financial Statements
2012 2011$'000 $'000
Note 3E: Write-Down and Impairment of AssetsAsset write-downs and impairments from:
Impairment on trade and other receivables 13 97Total write-down and impairment of assets 13 97
Note 3F: Losses from Assets SalesBuildings
Proceeds from sale (11) -Carrying value of assets sold 68 5
Plant and equipmentProceeds from sale (465) (487)Carrying value of assets sold 664 523
Total losses from assets sales 256 41
Note 3G: Foreign Exchange LossesNon-speculative 16 -Total foreign exchange losses 16 -
Note 4: Income
OWN-SOURCE REVENUE
Note 4A: Sale of Goods and Rendering of ServicesRendering of services - related entities 8,344 8,038Rendering of services - external entities 8,987 13,938Total rendering of services 17,331 21,976
Note 4B: Rental IncomeOperating lease - property rentals 103 165Total rental income 103 165
Note 4C: Other RevenueOther 2,439 2,820Total other revenue 2,439 2,820
GAINS
Note 4D: Net foreign exchange gainNon-speculative - 1,619Total foreign exchange gains - 1,619
Note 4E: Other GainsResources free of charge: Financial statement audit services 160 158Total other gains 160 158
REVENUE FROM GOVERNMENT
Note 4F: Revenue from GovernmentAppropriations:
Departmental appropriations 167,216 173,341Total revenue from Government 167,216 173,341
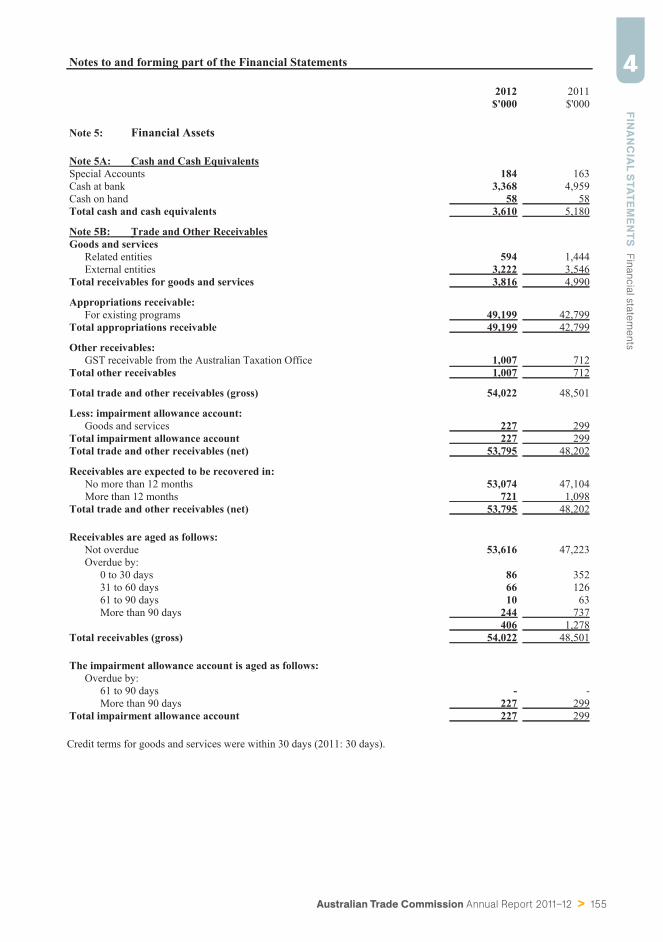
Australian Trade Commission Annual Report 2011–12 > 155
FINA
NC
IAL S
TATEMEN
TS
Fin
ancia
l sta
tem
ents
4Notes to and forming part of the Financial Statements
2012 2011$'000 $'000
Note 5: Financial Assets
Note 5A: Cash and Cash EquivalentsSpecial Accounts 184 163Cash at bank 3,368 4,959Cash on hand 58 58Total cash and cash equivalents 3,610 5,180
Note 5B: Trade and Other ReceivablesGoods and services
Related entities 594 1,444External entities 3,222 3,546
Total receivables for goods and services 3,816 4,990
Appropriations receivable:For existing programs 49,199 42,799
Total appropriations receivable 49,199 42,799
Other receivables:GST receivable from the Australian Taxation Office 1,007 712
Total other receivables 1,007 712
Total trade and other receivables (gross) 54,022 48,501
Less: impairment allowance account:Goods and services 227 299
Total impairment allowance account 227 299Total trade and other receivables (net) 53,795 48,202
Receivables are expected to be recovered in:No more than 12 months 53,074 47,104More than 12 months 721 1,098
Total trade and other receivables (net) 53,795 48,202
Receivables are aged as follows:Not overdue 53,616 47,223Overdue by:
0 to 30 days 86 35231 to 60 days 66 12661 to 90 days 10 63More than 90 days 244 737
406 1,278Total receivables (gross) 54,022 48,501
The impairment allowance account is aged as follows:Overdue by:
61 to 90 days - -More than 90 days 227 299
Total impairment allowance account 227 299
Credit terms for goods and services were within 30 days (2011: 30 days).
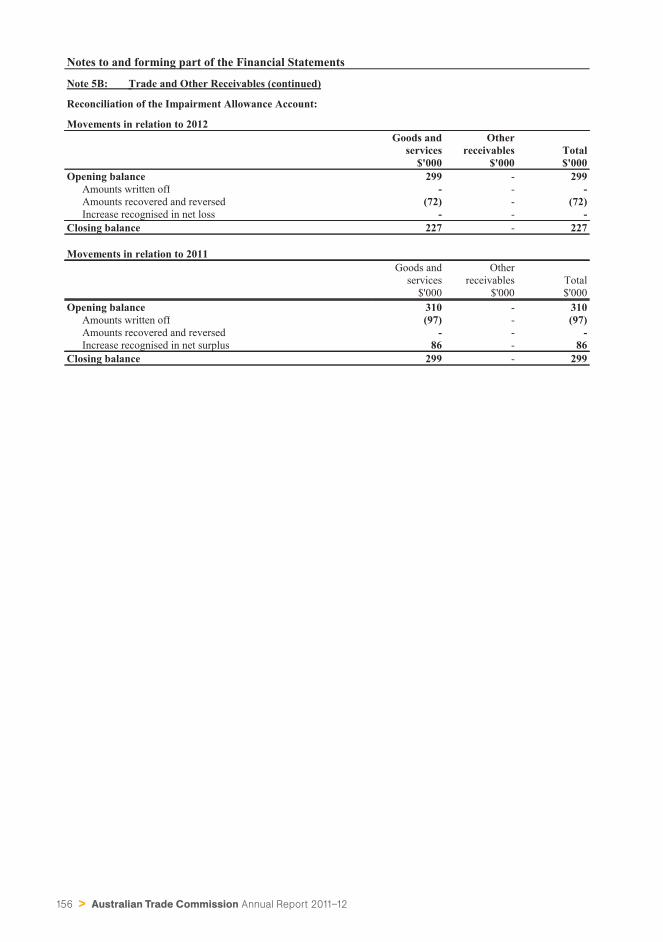
156 > Australian Trade Commission Annual Report 2011–12
Notes to and forming part of the Financial Statements
Note 5B: Trade and Other Receivables (continued)
Reconciliation of the Impairment Allowance Account:
Movements in relation to 2012Goods and
servicesOther
receivables Total$'000 $'000 $'000
Opening balance 299 - 299Amounts written off - - -Amounts recovered and reversed (72) - (72)Increase recognised in net loss - - -
Closing balance 227 - 227
Movements in relation to 2011Goods and
servicesOther
receivables Total$'000 $'000 $'000
Opening balance 310 - 310Amounts written off (97) - (97)Amounts recovered and reversed - - -Increase recognised in net surplus 86 - 86
Closing balance 299 - 299
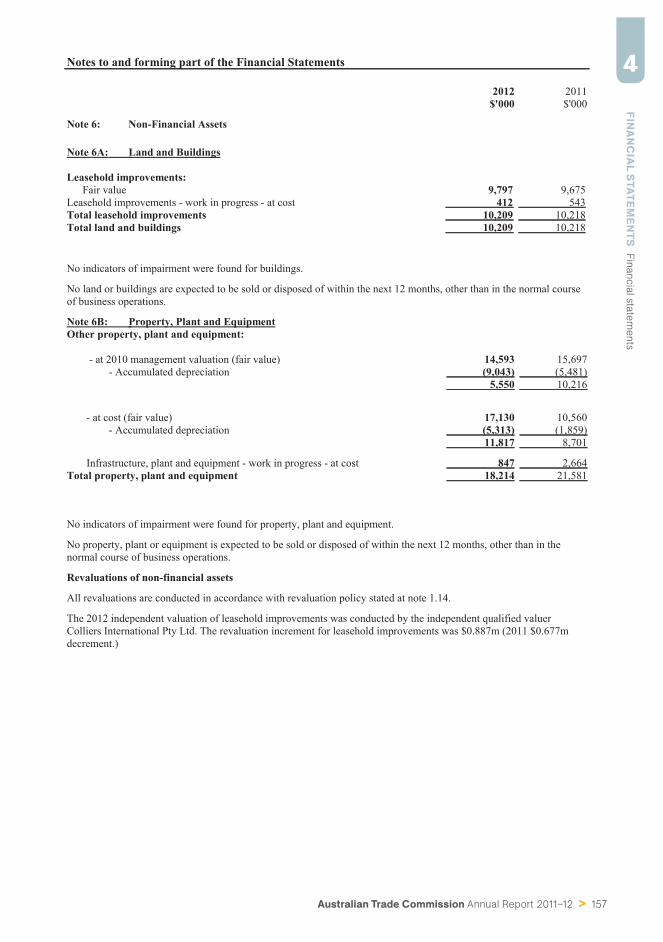
Australian Trade Commission Annual Report 2011–12 > 157
FINA
NC
IAL S
TATEMEN
TS
Fin
ancia
l sta
tem
ents
4Notes to and forming part of the Financial Statements
2012 2011$'000 $'000
Note 6: Non-Financial Assets
Note 6A: Land and Buildings
Leasehold improvements:Fair value 9,797 9,675
Leasehold improvements - work in progress - at cost 412 543Total leasehold improvements 10,209 10,218Total land and buildings 10,209 10,218
No indicators of impairment were found for buildings.
No land or buildings are expected to be sold or disposed of within the next 12 months, other than in the normal courseof business operations.
Note 6B: Property, Plant and EquipmentOther property, plant and equipment:
- at 2010 management valuation (fair value) 14,593 15,697 - Accumulated depreciation (9,043) (5,481)
5,550 10,216
- at cost (fair value) 17,130 10,560 - Accumulated depreciation (5,313) (1,859)
11,817 8,701
Infrastructure, plant and equipment - work in progress - at cost 847 2,664Total property, plant and equipment 18,214 21,581
No indicators of impairment were found for property, plant and equipment.
No property, plant or equipment is expected to be sold or disposed of within the next 12 months, other than in thenormal course of business operations.
Revaluations of non-financial assets
All revaluations are conducted in accordance with revaluation policy stated at note 1.14.
The 2012 independent valuation of leasehold improvements was conducted by the independent qualified valuerColliers International Pty Ltd. The revaluation increment for leasehold improvements was $0.887m (2011 $0.677mdecrement.)
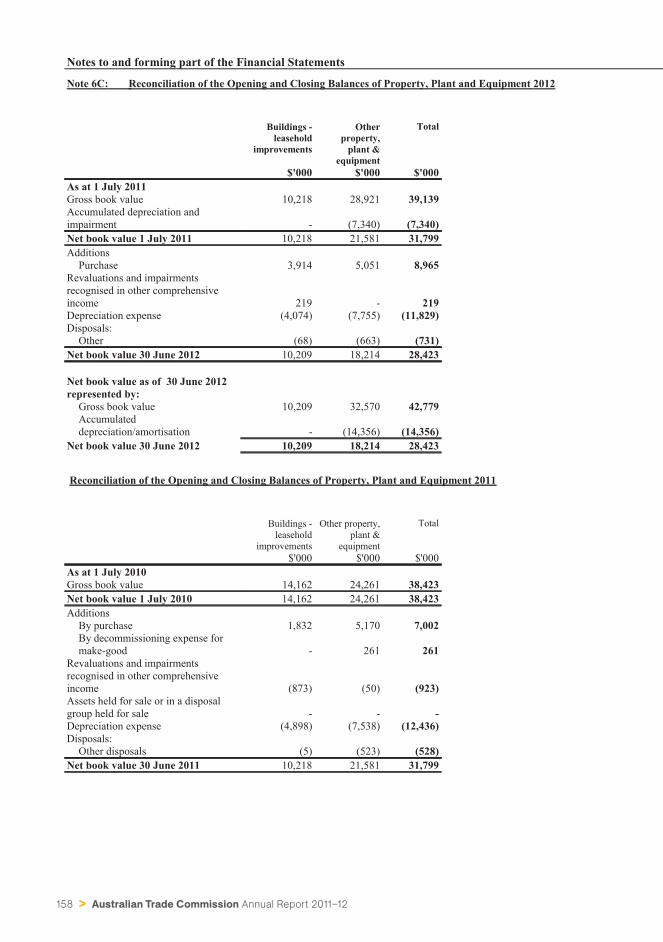
158 > Australian Trade Commission Annual Report 2011–12
Notes to and forming part of the Financial Statements
Note 6C: Reconciliation of the Opening and Closing Balances of Property, Plant and Equipment 2012
Buildings -leasehold
improvements
Otherproperty,
plant &equipment
Total
$'000 $'000 $'000As at 1 July 2011Gross book value 10,218 28,921 39,139Accumulated depreciation andimpairment - (7,340) (7,340)Net book value 1 July 2011 10,218 21,581 31,799Additions
Purchase 3,914 5,051 8,965Revaluations and impairmentsrecognised in other comprehensiveincome 219 - 219Depreciation expense (4,074) (7,755) (11,829)Disposals:
Other (68) (663) (731)Net book value 30 June 2012 10,209 18,214 28,423
Net book value as of 30 June 2012represented by:
Gross book value 10,209 32,570 42,779Accumulateddepreciation/amortisation - (14,356) (14,356)
Net book value 30 June 2012 10,209 18,214 28,423
Reconciliation of the Opening and Closing Balances of Property, Plant and Equipment 2011
Buildings -leasehold
improvements
Other property,plant &
equipment
Total
$'000 $'000 $'000As at 1 July 2010Gross book value 14,162 24,261 38,423Net book value 1 July 2010 14,162 24,261 38,423Additions
By purchase 1,832 5,170 7,002By decommissioning expense formake-good - 261 261
Revaluations and impairmentsrecognised in other comprehensiveincome (873) (50) (923)Assets held for sale or in a disposalgroup held for sale - - -Depreciation expense (4,898) (7,538) (12,436)Disposals:
Other disposals (5) (523) (528)Net book value 30 June 2011 10,218 21,581 31,799
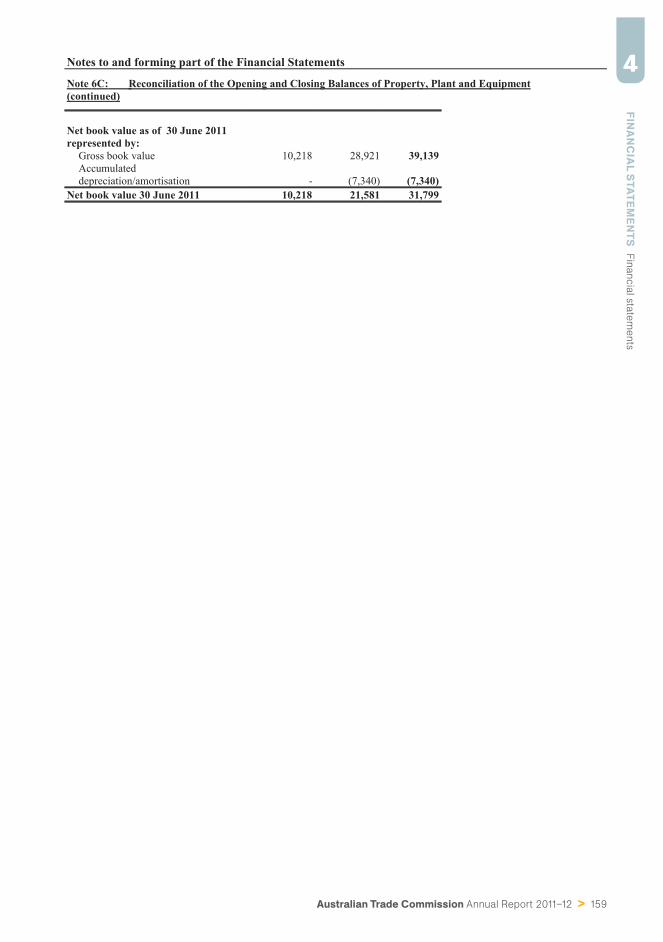
Australian Trade Commission Annual Report 2011–12 > 159
FINA
NC
IAL S
TATEMEN
TS
Fin
ancia
l sta
tem
ents
4Notes to and forming part of the Financial Statements
Note 6C: Reconciliation of the Opening and Closing Balances of Property, Plant and Equipment(continued)
Net book value as of 30 June 2011represented by:
Gross book value 10,218 28,921 39,139Accumulateddepreciation/amortisation - (7,340) (7,340)
Net book value 30 June 2011 10,218 21,581 31,799
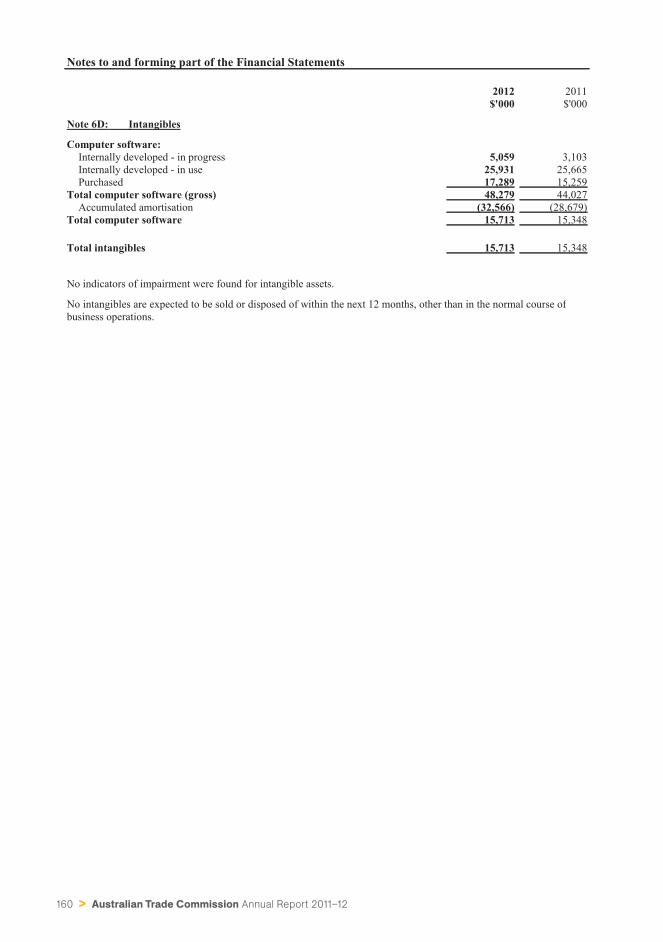
160 > Australian Trade Commission Annual Report 2011–12
Notes to and forming part of the Financial Statements
2012 2011$'000 $'000
Note 6D: Intangibles
Computer software:Internally developed - in progress 5,059 3,103Internally developed - in use 25,931 25,665Purchased 17,289 15,259
Total computer software (gross) 48,279 44,027Accumulated amortisation (32,566) (28,679)
Total computer software 15,713 15,348
Total intangibles 15,713 15,348
No indicators of impairment were found for intangible assets.
No intangibles are expected to be sold or disposed of within the next 12 months, other than in the normal course ofbusiness operations.
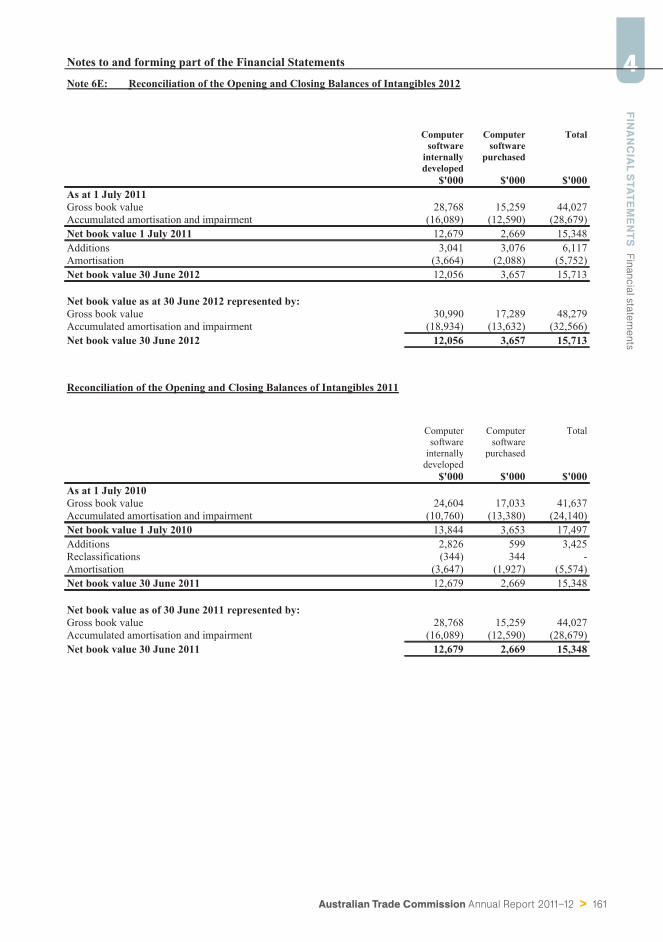
Australian Trade Commission Annual Report 2011–12 > 161
FINA
NC
IAL S
TATEMEN
TS
Fin
ancia
l sta
tem
ents
4Notes to and forming part of the Financial Statements
Note 6E: Reconciliation of the Opening and Closing Balances of Intangibles 2012
Computersoftware
internallydeveloped
Computersoftware
purchased
Total
$'000 $'000 $'000As at 1 July 2011Gross book value 28,768 15,259 44,027Accumulated amortisation and impairment (16,089) (12,590) (28,679)Net book value 1 July 2011 12,679 2,669 15,348Additions 3,041 3,076 6,117Amortisation (3,664) (2,088) (5,752)Net book value 30 June 2012 12,056 3,657 15,713
Net book value as at 30 June 2012 represented by:Gross book value 30,990 17,289 48,279Accumulated amortisation and impairment (18,934) (13,632) (32,566)Net book value 30 June 2012 12,056 3,657 15,713
Reconciliation of the Opening and Closing Balances of Intangibles 2011
Computersoftware
internallydeveloped
Computersoftware
purchased
Total
$'000 $'000 $'000As at 1 July 2010Gross book value 24,604 17,033 41,637Accumulated amortisation and impairment (10,760) (13,380) (24,140)Net book value 1 July 2010 13,844 3,653 17,497Additions 2,826 599 3,425Reclassifications (344) 344 -Amortisation (3,647) (1,927) (5,574)Net book value 30 June 2011 12,679 2,669 15,348
Net book value as of 30 June 2011 represented by:Gross book value 28,768 15,259 44,027Accumulated amortisation and impairment (16,089) (12,590) (28,679)Net book value 30 June 2011 12,679 2,669 15,348
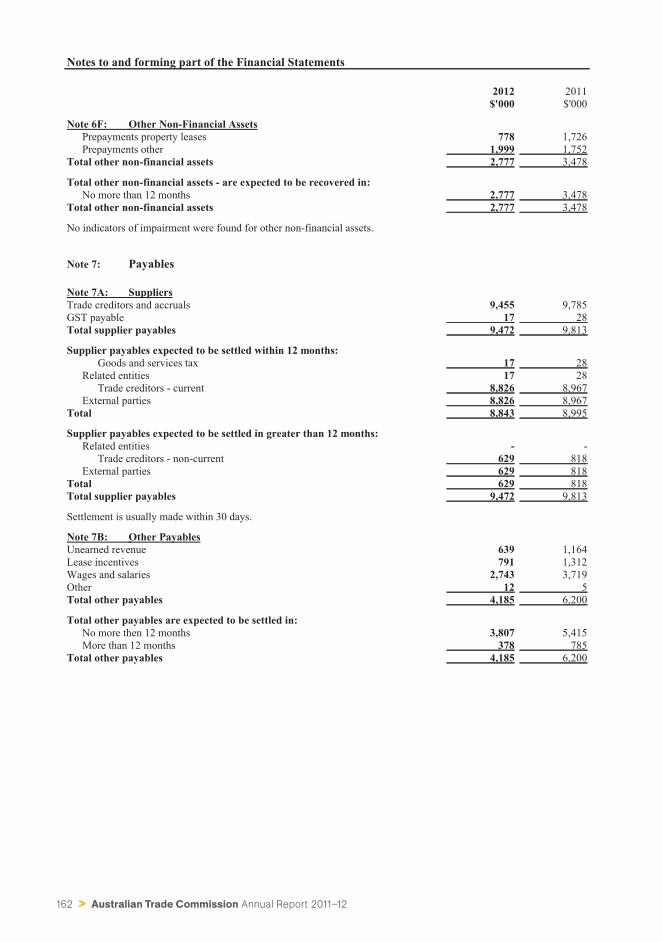
162 > Australian Trade Commission Annual Report 2011–12
Notes to and forming part of the Financial Statements
2012 2011$'000 $'000
Note 6F: Other Non-Financial AssetsPrepayments property leases 778 1,726Prepayments other 1,999 1,752
Total other non-financial assets 2,777 3,478
Total other non-financial assets - are expected to be recovered in:No more than 12 months 2,777 3,478
Total other non-financial assets 2,777 3,478
No indicators of impairment were found for other non-financial assets.
Note 7: Payables
Note 7A: SuppliersTrade creditors and accruals 9,455 9,785GST payable 17 28Total supplier payables 9,472 9,813
Supplier payables expected to be settled within 12 months:Goods and services tax 17 28
Related entities 17 28Trade creditors - current 8,826 8,967
External parties 8,826 8,967Total 8,843 8,995
Supplier payables expected to be settled in greater than 12 months:Related entities - -
Trade creditors - non-current 629 818External parties 629 818
Total 629 818Total supplier payables 9,472 9,813
Settlement is usually made within 30 days.
Note 7B: Other PayablesUnearned revenue 639 1,164Lease incentives 791 1,312Wages and salaries 2,743 3,719Other 12 5Total other payables 4,185 6,200
Total other payables are expected to be settled in:No more then 12 months 3,807 5,415More than 12 months 378 785
Total other payables 4,185 6,200
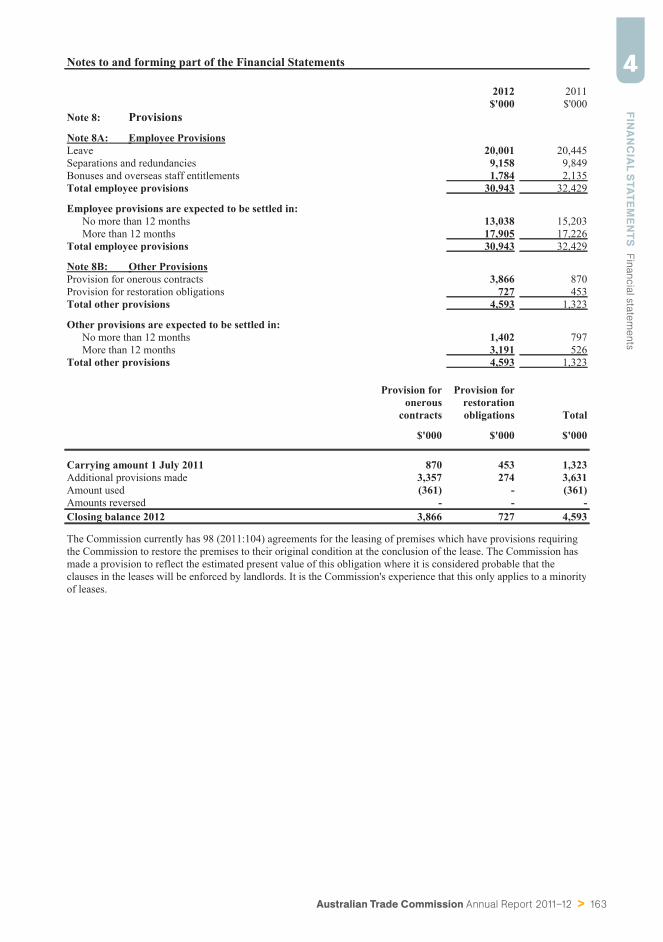
Australian Trade Commission Annual Report 2011–12 > 163
FINA
NC
IAL S
TATEMEN
TS
Fin
ancia
l sta
tem
ents
4Notes to and forming part of the Financial Statements
2012 2011$'000 $'000
Note 8: Provisions
Note 8A: Employee ProvisionsLeave 20,001 20,445Separations and redundancies 9,158 9,849Bonuses and overseas staff entitlements 1,784 2,135Total employee provisions 30,943 32,429
Employee provisions are expected to be settled in:No more than 12 months 13,038 15,203More than 12 months 17,905 17,226
Total employee provisions 30,943 32,429
Note 8B: Other ProvisionsProvision for onerous contracts 3,866 870Provision for restoration obligations 727 453Total other provisions 4,593 1,323
Other provisions are expected to be settled in:No more than 12 months 1,402 797More than 12 months 3,191 526
Total other provisions 4,593 1,323
Provision foronerous
contracts
Provision forrestorationobligations Total
$'000 $'000 $'000
Carrying amount 1 July 2011 870 453 1,323Additional provisions made 3,357 274 3,631Amount used (361) - (361)Amounts reversed - - -Closing balance 2012 3,866 727 4,593
The Commission currently has 98 (2011:104) agreements for the leasing of premises which have provisions requiringthe Commission to restore the premises to their original condition at the conclusion of the lease. The Commission hasmade a provision to reflect the estimated present value of this obligation where it is considered probable that theclauses in the leases will be enforced by landlords. It is the Commission's experience that this only applies to a minorityof leases.
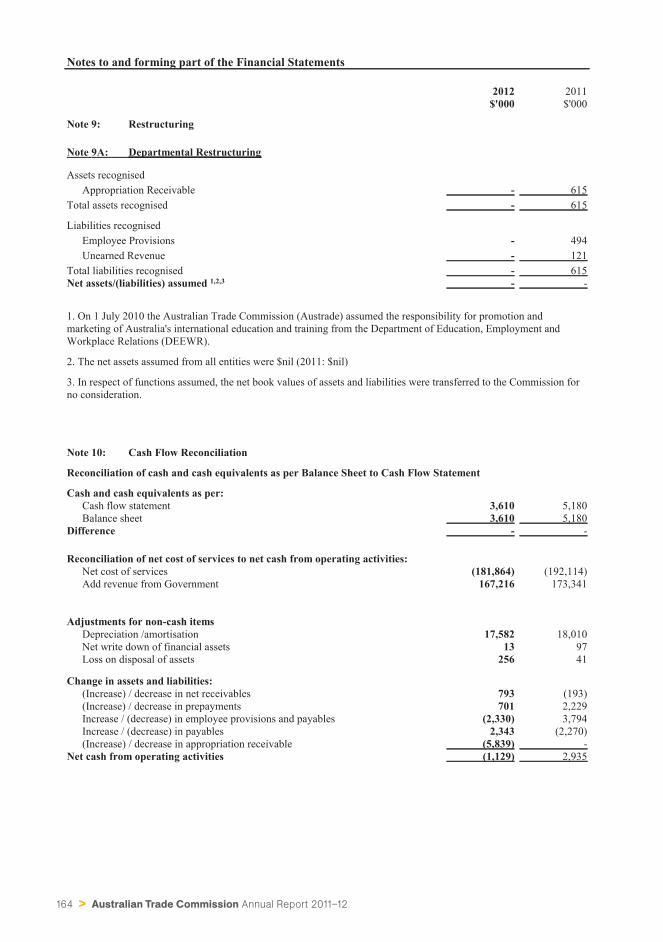
164 > Australian Trade Commission Annual Report 2011–12
Notes to and forming part of the Financial Statements
2012 2011$'000 $'000
Note 9: Restructuring
Note 9A: Departmental Restructuring
Assets recognisedAppropriation Receivable - 615
Total assets recognised - 615
Liabilities recognisedEmployee Provisions - 494Unearned Revenue - 121
Total liabilities recognised - 615Net assets/(liabilities) assumed 1,2,3 - -
1. On 1 July 2010 the Australian Trade Commission (Austrade) assumed the responsibility for promotion andmarketing of Australia's international education and training from the Department of Education, Employment andWorkplace Relations (DEEWR).
2. The net assets assumed from all entities were $nil (2011: $nil)
3. In respect of functions assumed, the net book values of assets and liabilities were transferred to the Commission forno consideration.
Note 10: Cash Flow Reconciliation
Reconciliation of cash and cash equivalents as per Balance Sheet to Cash Flow Statement
Cash and cash equivalents as per:Cash flow statement 3,610 5,180Balance sheet 3,610 5,180
Difference - -
Reconciliation of net cost of services to net cash from operating activities:Net cost of services (181,864) (192,114)Add revenue from Government 167,216 173,341
Adjustments for non-cash itemsDepreciation /amortisation 17,582 18,010Net write down of financial assets 13 97Loss on disposal of assets 256 41
Change in assets and liabilities:(Increase) / decrease in net receivables 793 (193)(Increase) / decrease in prepayments 701 2,229Increase / (decrease) in employee provisions and payables (2,330) 3,794Increase / (decrease) in payables 2,343 (2,270)(Increase) / decrease in appropriation receivable (5,839) -
Net cash from operating activities (1,129) 2,935
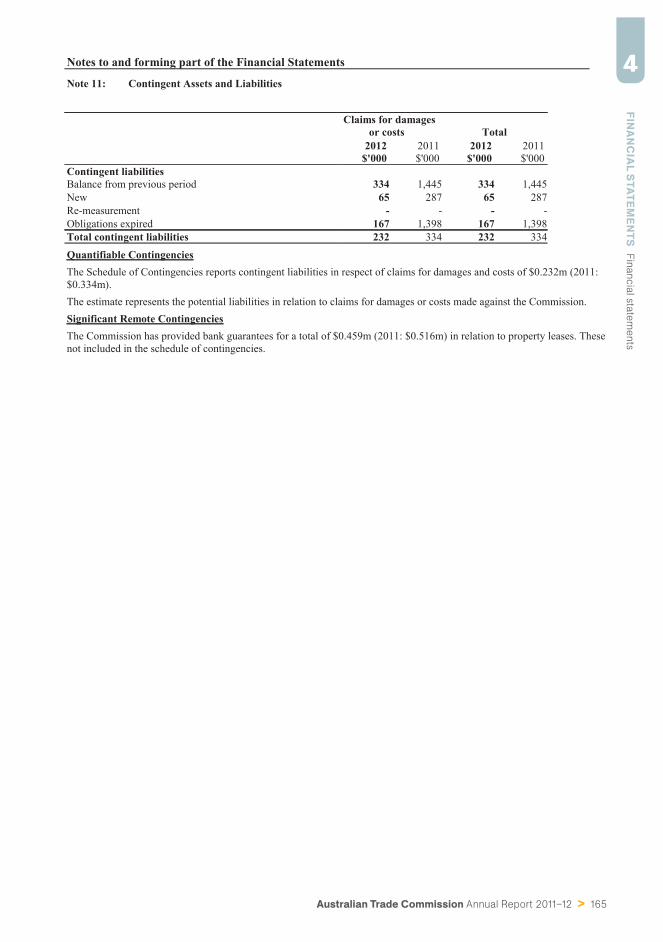
Australian Trade Commission Annual Report 2011–12 > 165
FINA
NC
IAL S
TATEMEN
TS
Fin
ancia
l sta
tem
ents
4Notes to and forming part of the Financial Statements
Note 11: Contingent Assets and Liabilities
Claims for damagesor costs Total
2012 2011 2012 2011$'000 $'000 $'000 $'000
Contingent liabilitiesBalance from previous period 334 1,445 334 1,445New 65 287 65 287Re-measurement - - - -Obligations expired 167 1,398 167 1,398Total contingent liabilities 232 334 232 334Quantifiable ContingenciesThe Schedule of Contingencies reports contingent liabilities in respect of claims for damages and costs of $0.232m (2011:$0.334m). The estimate represents the potential liabilities in relation to claims for damages or costs made against the Commission.Significant Remote ContingenciesThe Commission has provided bank guarantees for a total of $0.459m (2011: $0.516m) in relation to property leases. These not included in the schedule of contingencies.
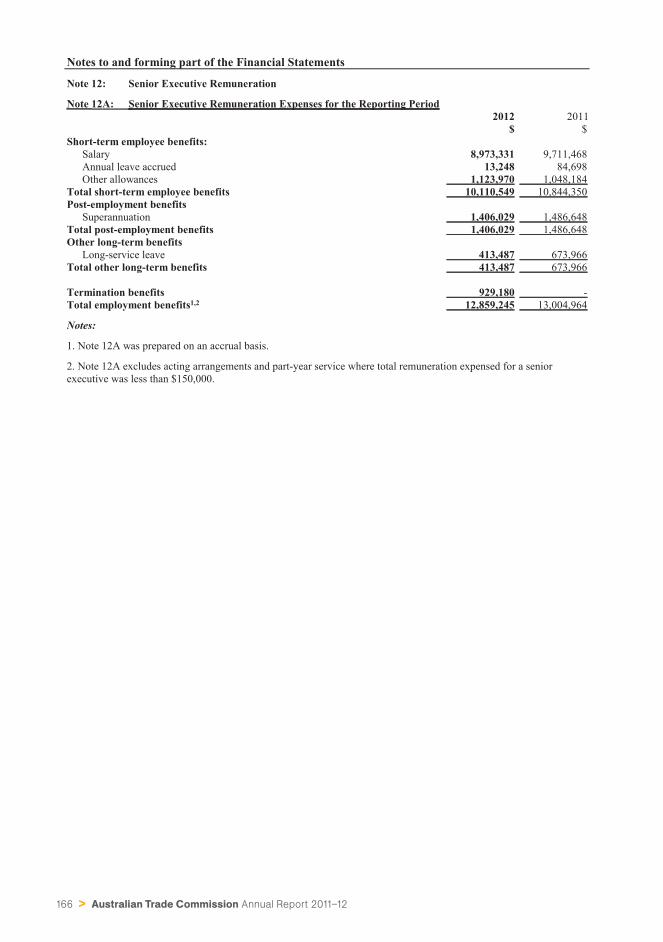
166 > Australian Trade Commission Annual Report 2011–12
Notes to and forming part of the Financial Statements
Note 12: Senior Executive Remuneration
Note 12A: Senior Executive Remuneration Expenses for the Reporting Period2012 2011
$ $Short-term employee benefits:
Salary 8,973,331 9,711,468Annual leave accrued 13,248 84,698Other allowances 1,123,970 1,048,184
Total short-term employee benefits 10,110,549 10,844,350Post-employment benefits
Superannuation 1,406,029 1,486,648Total post-employment benefits 1,406,029 1,486,648Other long-term benefits
Long-service leave 413,487 673,966Total other long-term benefits 413,487 673,966
Termination benefits 929,180 -Total employment benefits1,2 12,859,245 13,004,964
Notes:
1. Note 12A was prepared on an accrual basis.
2. Note 12A excludes acting arrangements and part-year service where total remuneration expensed for a seniorexecutive was less than $150,000.

Australian Trade Commission Annual Report 2011–12 > 167
FINA
NC
IAL S
TATEMEN
TS
Fin
ancia
l sta
tem
ents
4N
otes
to a
nd fo
rmin
g pa
rt o
f the
Fin
anci
al S
tate
men
ts
Not
e 12
:Se
nior
Exe
cutiv
e R
emun
erat
ion
(con
tinue
d)
Not
e 12
B:A
vera
ge A
nnua
l Rem
uner
atio
n Pa
id to
Sub
stan
tive
Seni
or E
xecu
tives
dur
ing
the
Rep
ortin
g Pe
riod
2012
Seni
orE
xecu
tives No.
Rep
orta
ble
sala
ry2,
5C
ontr
ibut
edsu
pera
nnua
tion3.
Rep
orta
ble
allo
wan
ces4.
Bon
us p
aid5.
Tot
alA
vera
ge a
nnua
l rep
orta
ble
rem
uner
atio
n 1.
$'$'
$'$'
$'T
otal
rem
uner
atio
n (in
clud
ing
part
-tim
e ar
rang
emen
ts)
less
than
$15
0,00
017
63,9
9914
,862
178
-79
,039
$150
000
- $1
79,9
992
148,
735
18,8
1444
3-
167,
992
$180
000
- $2
09,9
9914
163,
841
34,6
7448
2-
198,
997
$210
000
- $2
39,9
999
197,
407
28,4
1385
-22
5,90
5$2
40 0
00 -
$269
,999
820
6,25
948
,514
567
-25
5,34
0$2
70 0
00 -
$299
,999
825
6,32
828
,854
--
285,
182
$300
000
- $3
29,9
994
245,
140
67,9
8937
4-
313,
503
$330
000
- $3
59,9
991
277,
976
57,9
51-
-33
5,92
7$3
60,0
00 -
$389
,999
331
1,02
169
,093
--
380,
114
$450
000
- $4
79,9
991
361,
666
104,
023
--
465,
689
Tot
al67
Not
es:
1.Th
is ta
ble
repo
rts su
bsta
ntiv
e se
nior
exe
cutiv
es w
ho re
ceiv
ed re
mun
erat
ion
durin
g th
e re
porti
ng p
erio
d. E
ach
row
isan
ave
rage
d fig
ure
base
d on
hea
dcou
nt fo
r ind
ivid
uals
in th
e ba
nd.
2.'R
epor
tabl
e Sa
lary
' inc
lude
s the
follo
win
g:(a
) gro
ss p
aym
ents
(b) r
epor
tabl
e fr
inge
ben
efits
3.Th
e 'co
ntrib
uted
supe
rann
uatio
n' a
mou
nt is
the
aver
age
actu
al su
pera
nnua
tion
cont
ribut
ions
pai
d to
seni
or e
xecu
tives
in th
at re
porta
ble
rem
uner
atio
n ba
nd d
urin
g th
e re
porti
ng p
erio
d, in
clud
ing
any
sala
ry sa
crifi
ced
amou
nts,
as p
er th
ein
divi
dual
s' pa
yslip
s.
4.'R
epor
tabl
e al
low
ance
s' ar
e th
e av
erag
e ac
tual
allo
wan
ces p
aid
as p
er th
e 'to
tal a
llow
ance
s' lin
e on
indi
vidu
als'
paym
ent s
umm
arie
s.
5.Fr
om th
e 20
10-1
1 fin
anci
al y
ear t
he C
omm
issi
on n
o lo
nger
pai
d se
nior
exe
cutiv
e pe
rfor
man
ce b
onus
es.
168 > Australian Trade Commission Annual Report 2011–12
Notes to and forming part of the Financial Statements
Note 12: Senior Executive Remuneration (continued)
6. Various salary sacrifice arrangements were available to senior executives including superannuation, motor vehicleand expense payment fringe benefits. Salary sacrifice benefits are reported in the 'reportable salary' column, excludingsalary sacrificed superannuation, which is reported in the 'contributed superannuation' column.
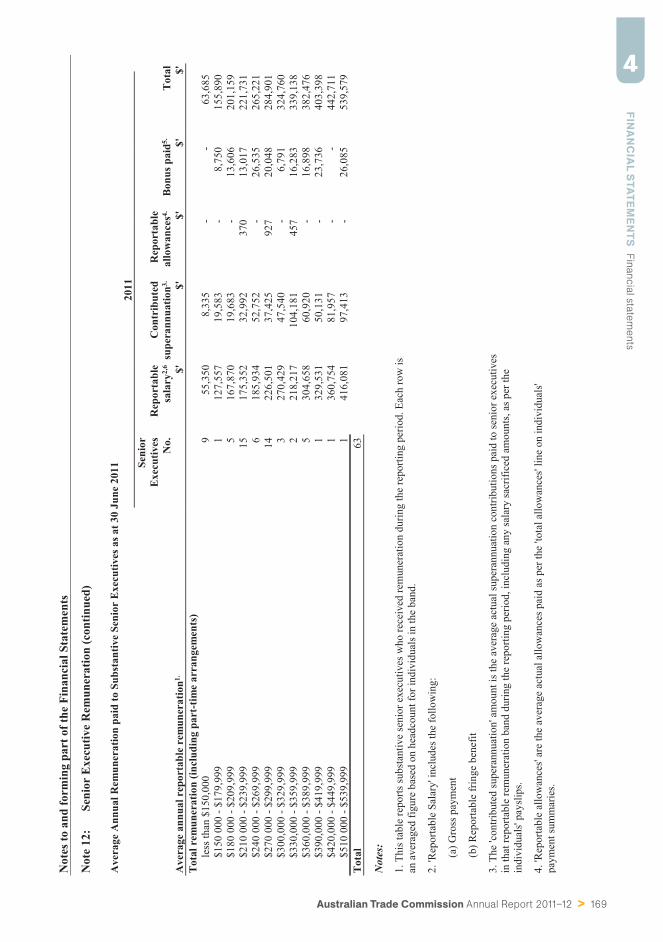
Australian Trade Commission Annual Report 2011–12 > 169
FINA
NC
IAL S
TATEMEN
TS
Fin
ancia
l sta
tem
ents
4N
otes
to a
nd fo
rmin
g pa
rt o
f the
Fin
anci
al S
tate
men
ts
Not
e 12
:Se
nior
Exe
cutiv
e R
emun
erat
ion
(con
tinue
d)
Ave
rage
Ann
ual R
emun
erat
ion
paid
to S
ubst
antiv
e Se
nior
Exe
cutiv
es a
s at 3
0 Ju
ne 2
011
2011
Seni
orE
xecu
tives No.
Rep
orta
ble
sala
ry2,
6C
ontr
ibut
edsu
pera
nnua
tion3.
Rep
orta
ble
allo
wan
ces4.
Bon
us p
aid5.
Tot
alA
vera
ge a
nnua
l rep
orta
ble
rem
uner
atio
n1.$'
$'$'
$'$'
Tot
al r
emun
erat
ion
(incl
udin
g pa
rt-t
ime
arra
ngem
ents
)le
ss th
an $
150,
000
955
,350
8,33
5-
-63
,685
$150
000
- $1
79,9
991
127,
557
19,5
83-
8,75
015
5,89
0$1
80 0
00 -
$209
,999
516
7,87
019
,683
-13
,606
201,
159
$210
000
- $2
39,9
9915
175,
352
32,9
9237
013
,017
221,
731
$240
000
- $2
69,9
996
185,
934
52,7
52-
26,5
3526
5,22
1$2
70 0
00 -
$299
,999
1422
6,50
137
,425
927
20,0
4828
4,90
1$3
00,0
00 -
$329
,999
327
0,42
947
,540
-6,
791
324,
760
$330
,000
- $3
59,9
992
218,
217
104,
181
457
16,2
8333
9,13
8$3
60,0
00 -
$389
,999
530
4,65
860
,920
-16
,898
382,
476
$390
,000
- $4
19,9
991
329,
531
50,1
31-
23,7
3640
3,39
8$4
20,0
00 -
$449
,999
136
0,75
481
,957
--
442,
711
$510
000
- $5
39,9
991
416,
081
97,4
13-
26,0
8553
9,57
9T
otal
63
Not
es:
1.Th
is ta
ble
repo
rts su
bsta
ntiv
e se
nior
exe
cutiv
es w
ho re
ceiv
ed re
mun
erat
ion
durin
g th
e re
porti
ng p
erio
d. E
ach
row
isan
ave
rage
d fig
ure
base
d on
hea
dcou
nt fo
r ind
ivid
uals
in th
e ba
nd.
2.'R
epor
tabl
e Sa
lary
' inc
lude
s the
follo
win
g:
(a) G
ross
pay
men
t
(b) R
epor
tabl
e fr
inge
ben
efit
3.Th
e 'co
ntrib
uted
supe
rann
uatio
n' a
mou
nt is
the
aver
age
actu
al su
pera
nnua
tion
cont
ribut
ions
pai
d to
seni
or e
xecu
tives
in th
at re
porta
ble
rem
uner
atio
n ba
nd d
urin
g th
e re
porti
ng p
erio
d, in
clud
ing
any
sala
ry sa
crifi
ced
amou
nts,
as p
er th
ein
divi
dual
s' pa
yslip
s.
4.'R
epor
tabl
e al
low
ance
s' ar
e th
e av
erag
e ac
tual
allo
wan
ces p
aid
as p
er th
e 'to
tal a
llow
ance
s' lin
e on
indi
vidu
als'
paym
ent s
umm
arie
s.
170 > Australian Trade Commission Annual Report 2011–12
Notes to and forming part of the Financial Statements
Note 12: Senior Executive Remuneration (continued)
5. 'Bonus paid' represents average actual bonuses paid during the reporting period in that reportable remuneration band.The 'bonus paid' within a particular band may vary between financial years due to various factors such as individualscommencing with or leaving the entity during the financial year.
6. Various salary sacrifice arrangements were available to senior executives including superannuation, motor vehicleand expense payment fringe benefits. Salary sacrifice benefits are reported in the 'reportable salary' column, excludingsalary sacrificed superannuation, which is reported in the 'contributed superannuation' column.
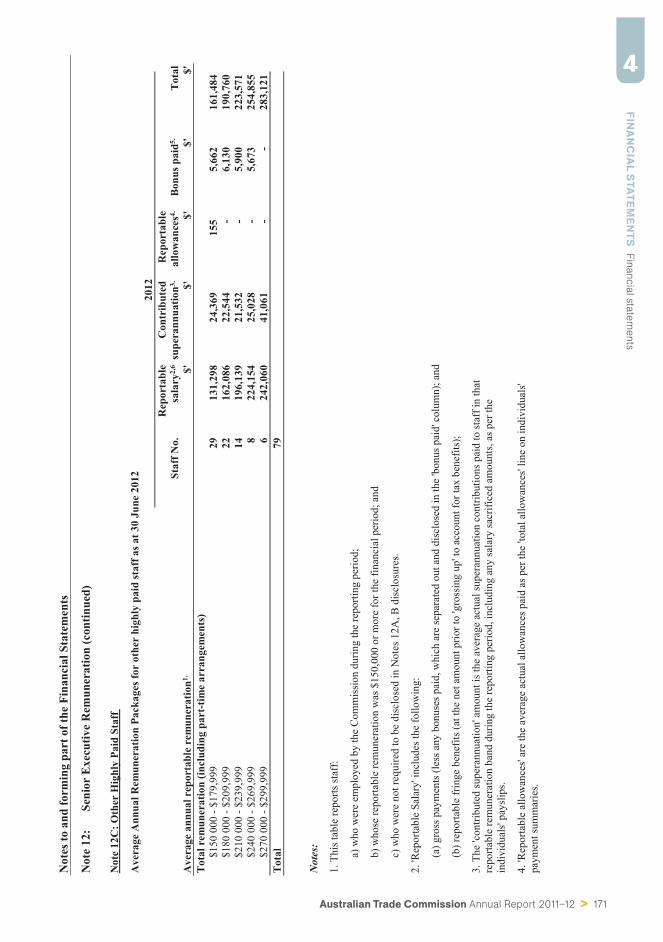
Australian Trade Commission Annual Report 2011–12 > 171
FINA
NC
IAL S
TATEMEN
TS
Fin
ancia
l sta
tem
ents
4N
otes
to a
nd fo
rmin
g pa
rt o
f the
Fin
anci
al S
tate
men
ts
Not
e 12
:Se
nior
Exe
cutiv
e R
emun
erat
ion
(con
tinue
d)
Not
e 12
C: O
ther
Hig
hly
Paid
Sta
ff
Ave
rage
Ann
ual R
emun
erat
ion
Pack
ages
for
othe
r hi
ghly
pai
d st
aff a
s at 3
0 Ju
ne 2
012
2012
Staf
f No.
Rep
orta
ble
sala
ry2,
6C
ontr
ibut
edsu
pera
nnua
tion3.
Rep
orta
ble
allo
wan
ces4.
Bon
us p
aid5.
Tot
alA
vera
ge a
nnua
l rep
orta
ble
rem
uner
atio
n1.$'
$'$'
$'$'
Tot
al r
emun
erat
ion
(incl
udin
g pa
rt-t
ime
arra
ngem
ents
)$1
50 0
00 -
$179
,999
2913
1,29
824
,369
155
5,66
216
1,48
4$1
80 0
00 -
$209
,999
2216
2,08
622
,544
-6,
130
190,
760
$210
000
- $2
39,9
9914
196,
139
21,5
32-
5,90
022
3,57
1$2
40 0
00 -
$269
,999
822
4,15
425
,028
-5,
673
254,
855
$270
000
- $2
99,9
996
242,
060
41,0
61-
-28
3,12
1T
otal
79
Not
es:
1.Th
is ta
ble
repo
rts st
aff:
a) w
ho w
ere
empl
oyed
by
the
Com
mis
sion
dur
ing
the
repo
rting
per
iod;
b) w
hose
repo
rtabl
e re
mun
erat
ion
was
$15
0,00
0 or
mor
e fo
r the
fina
ncia
l per
iod;
and
c) w
ho w
ere
not r
equi
red
to b
e di
sclo
sed
in N
otes
12A
, B d
iscl
osur
es.
2.'R
epor
tabl
e Sa
lary
' inc
lude
s the
follo
win
g:
(a) g
ross
pay
men
ts (l
ess a
ny b
onus
es p
aid,
whi
ch a
re se
para
ted
out a
nd d
iscl
osed
in th
e 'b
onus
pai
d' c
olum
n); a
nd
(b) r
epor
tabl
e fr
inge
ben
efits
(at t
he n
et a
mou
nt p
rior t
o 'g
ross
ing
up' t
o ac
coun
t for
tax
bene
fits)
;
3.Th
e 'co
ntrib
uted
supe
rann
uatio
n' a
mou
nt is
the
aver
age
actu
al su
pera
nnua
tion
cont
ribut
ions
pai
d to
staf
f in
that
repo
rtabl
e re
mun
erat
ion
band
dur
ing
the
repo
rting
per
iod,
incl
udin
g an
y sa
lary
sacr
ifice
d am
ount
s, as
per
the
indi
vidu
als'
pays
lips.
4.'R
epor
tabl
e al
low
ance
s' ar
e th
e av
erag
e ac
tual
allo
wan
ces p
aid
as p
er th
e 'to
tal a
llow
ance
s' lin
e on
indi
vidu
als'
paym
ent s
umm
arie
s.
172 > Australian Trade Commission Annual Report 2011–12
Notes to and forming part of the Financial Statements
Note 12: Senior Executive Remuneration (continued)
5. 'Bonus paid' represents average actual bonuses paid during the reporting period in that reportable remuneration band.The 'bonus paid' within a particular band may vary between financial years due to various factors such as individualscommencing with or leaving the entity during the financial year.
6. Various salary sacrifice arrangements were available to other highly paid staff including superannuation, motorvehicle and expense payment fringe benefits. Salary sacrifice benefits are reported in the 'reportable salary' column,excluding salary sacrificed superannuation, which is reported in the 'contributed superannuation' column.
The Commission has 60 to 70 Australian staff serving at overseas posts. Many of these staff, who are not seniorexecutives, receive accommodation and other allowances which contribute to their remuneration resulting in themreceiving more than $150,000 in total remuneration for the purposes of this note.
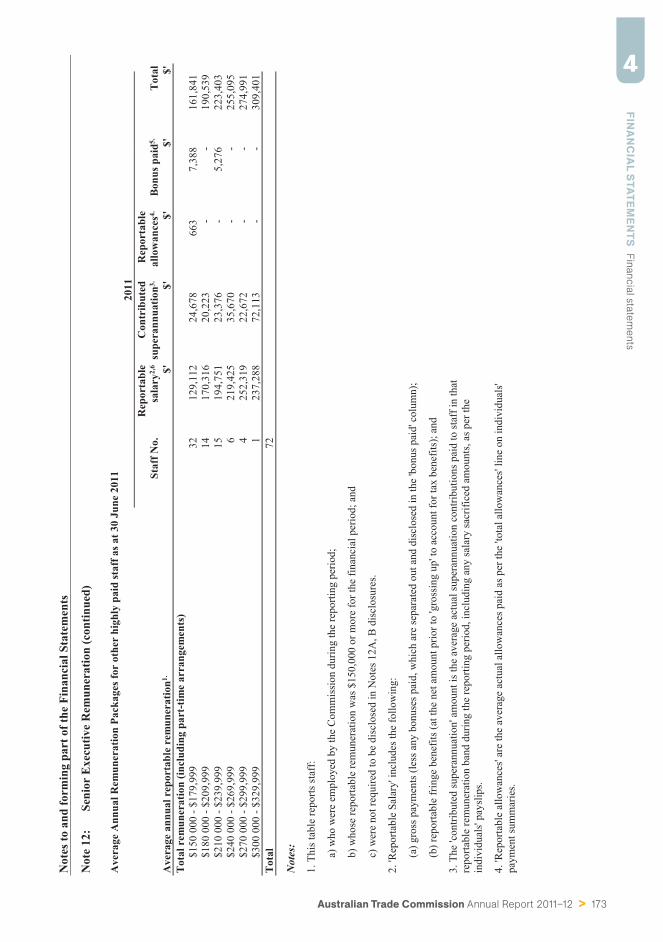
Australian Trade Commission Annual Report 2011–12 > 173
FINA
NC
IAL S
TATEMEN
TS
Fin
ancia
l sta
tem
ents
4N
otes
to a
nd fo
rmin
g pa
rt o
f the
Fin
anci
al S
tate
men
ts
Not
e 12
:Se
nior
Exe
cutiv
e R
emun
erat
ion
(con
tinue
d)
Ave
rage
Ann
ual R
emun
erat
ion
Pack
ages
for
othe
r hi
ghly
pai
d st
aff a
s at 3
0 Ju
ne 2
011
2011
Staf
f No.
Rep
orta
ble
sala
ry2,
6C
ontr
ibut
edsu
pera
nnua
tion3.
Rep
orta
ble
allo
wan
ces4.
Bon
us p
aid5.
Tot
alA
vera
ge a
nnua
l rep
orta
ble
rem
uner
atio
n1.$'
$'$'
$'$'
Tot
al r
emun
erat
ion
(incl
udin
g pa
rt-t
ime
arra
ngem
ents
)$1
50 0
00 -
$179
,999
3212
9,11
224
,678
663
7,38
816
1,84
1$1
80 0
00 -
$209
,999
1417
0,31
620
,223
--
190,
539
$210
000
- $2
39,9
9915
194,
751
23,3
76-
5,27
622
3,40
3$2
40 0
00 -
$269
,999
621
9,42
535
,670
--
255,
095
$270
000
- $2
99,9
994
252,
319
22,6
72-
-27
4,99
1$3
00 0
00 -
$329
,999
123
7,28
872
,113
--
309,
401
Tot
al72
Not
es:
1.Th
is ta
ble
repo
rts st
aff:
a) w
ho w
ere
empl
oyed
by
the
Com
mis
sion
dur
ing
the
repo
rting
per
iod;
b) w
hose
repo
rtabl
e re
mun
erat
ion
was
$15
0,00
0 or
mor
e fo
r the
fina
ncia
l per
iod;
and
c) w
ere
not r
equi
red
to b
e di
sclo
sed
in N
otes
12A
, B d
iscl
osur
es.
2.'R
epor
tabl
e Sa
lary
' inc
lude
s the
follo
win
g:
(a) g
ross
pay
men
ts (l
ess a
ny b
onus
es p
aid,
whi
ch a
re se
para
ted
out a
nd d
iscl
osed
in th
e 'b
onus
pai
d' c
olum
n);
(b) r
epor
tabl
e fr
inge
ben
efits
(at t
he n
et a
mou
nt p
rior t
o 'g
ross
ing
up' t
o ac
coun
t for
tax
bene
fits)
; and
3.Th
e 'co
ntrib
uted
supe
rann
uatio
n' a
mou
nt is
the
aver
age
actu
al su
pera
nnua
tion
cont
ribut
ions
pai
d to
staf
f in
that
repo
rtabl
e re
mun
erat
ion
band
dur
ing
the
repo
rting
per
iod,
incl
udin
g an
y sa
lary
sacr
ifice
d am
ount
s, as
per
the
indi
vidu
als'
pays
lips.
4.'R
epor
tabl
e al
low
ance
s' ar
e th
e av
erag
e ac
tual
allo
wan
ces p
aid
as p
er th
e 'to
tal a
llow
ance
s' lin
e on
indi
vidu
als'
paym
ent s
umm
arie
s.

174 > Australian Trade Commission Annual Report 2011–12
Notes to and forming part of the Financial Statements
Note 12: Senior Executive Remuneration (continued)
5. 'Bonus paid' represents average actual bonuses paid during the reporting period in that reportable remuneration band.The 'bonus paid' within a particular band may vary between financial years due to various factors such as individualscommencing with or leaving the entity during the financial year.
6. Various salary sacrifice arrangements were available to other highly paid staff including superannuation, motorvehicle and expense payment fringe benefits. Salary sacrifice benefits are reported in the 'reportable salary' column,excluding salary sacrificed superannuation, which is reported in the 'contributed superannuation' column.
The Commission has 60 to 70 Australian staff serving at overseas posts. Many of these staff, who are not seniorexecutives, receive accommodation and other allowances which contribute to their remuneration resulting in themreceiving more than $150,000 in total remuneration for the purposes of this note.
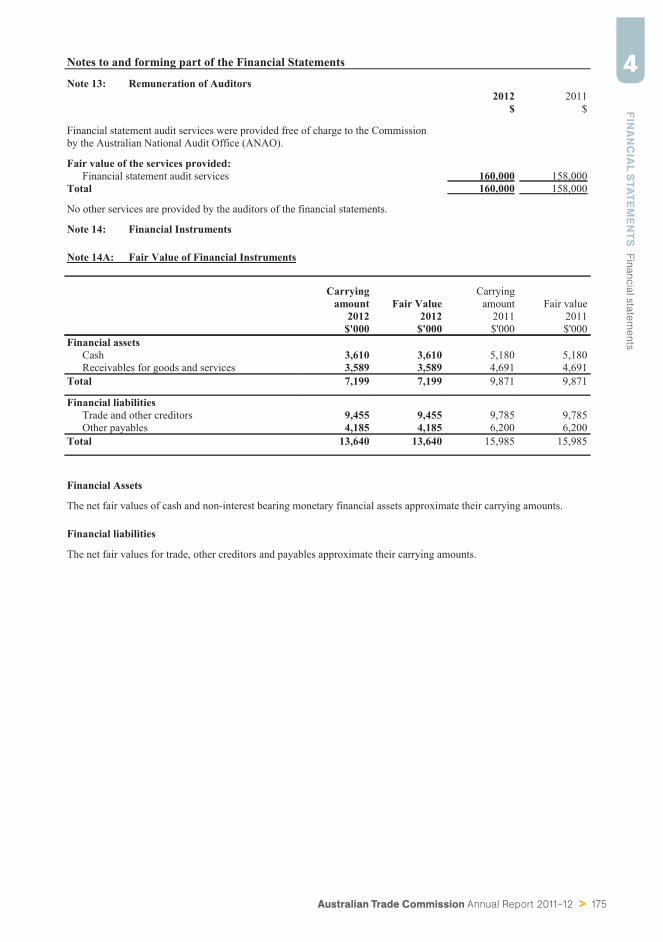
Australian Trade Commission Annual Report 2011–12 > 175
FINA
NC
IAL S
TATEMEN
TS
Fin
ancia
l sta
tem
ents
4Notes to and forming part of the Financial Statements
Note 13: Remuneration of Auditors2012 2011
$ $
Financial statement audit services were provided free of charge to the Commissionby the Australian National Audit Office (ANAO).
Fair value of the services provided:Financial statement audit services 160,000 158,000
Total 160,000 158,000
No other services are provided by the auditors of the financial statements.
Note 14: Financial Instruments
Note 14A: Fair Value of Financial Instruments
Carryingamount Fair Value
Carryingamount Fair value
2012 2012 2011 2011$'000 $'000 $'000 $'000
Financial assetsCash 3,610 3,610 5,180 5,180Receivables for goods and services 3,589 3,589 4,691 4,691
Total 7,199 7,199 9,871 9,871
Financial liabilitiesTrade and other creditors 9,455 9,455 9,785 9,785Other payables 4,185 4,185 6,200 6,200
Total 13,640 13,640 15,985 15,985
Financial Assets
The net fair values of cash and non-interest bearing monetary financial assets approximate their carrying amounts.
Financial liabilities
The net fair values for trade, other creditors and payables approximate their carrying amounts.
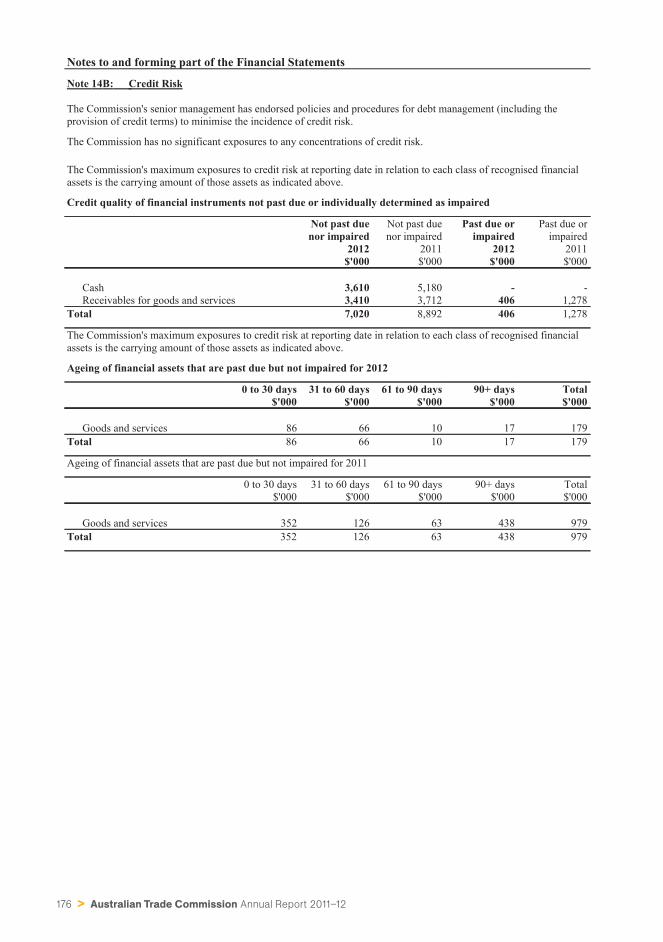
176 > Australian Trade Commission Annual Report 2011–12
Notes to and forming part of the Financial Statements
Note 14B: Credit Risk
The Commission's senior management has endorsed policies and procedures for debt management (including theprovision of credit terms) to minimise the incidence of credit risk.
The Commission has no significant exposures to any concentrations of credit risk.
The Commission's maximum exposures to credit risk at reporting date in relation to each class of recognised financialassets is the carrying amount of those assets as indicated above.
Credit quality of financial instruments not past due or individually determined as impaired
Not past duenor impaired
Not past duenor impaired
Past due orimpaired
Past due orimpaired
2012 2011 2012 2011$'000 $'000 $'000 $'000
Cash 3,610 5,180 - -Receivables for goods and services 3,410 3,712 406 1,278
Total 7,020 8,892 406 1,278
The Commission's maximum exposures to credit risk at reporting date in relation to each class of recognised financialassets is the carrying amount of those assets as indicated above.
Ageing of financial assets that are past due but not impaired for 2012
0 to 30 days 31 to 60 days 61 to 90 days 90+ days Total$'000 $'000 $'000 $'000 $'000
Goods and services 86 66 10 17 179Total 86 66 10 17 179
Ageing of financial assets that are past due but not impaired for 2011
0 to 30 days 31 to 60 days 61 to 90 days 90+ days Total$'000 $'000 $'000 $'000 $'000
Goods and services 352 126 63 438 979Total 352 126 63 438 979
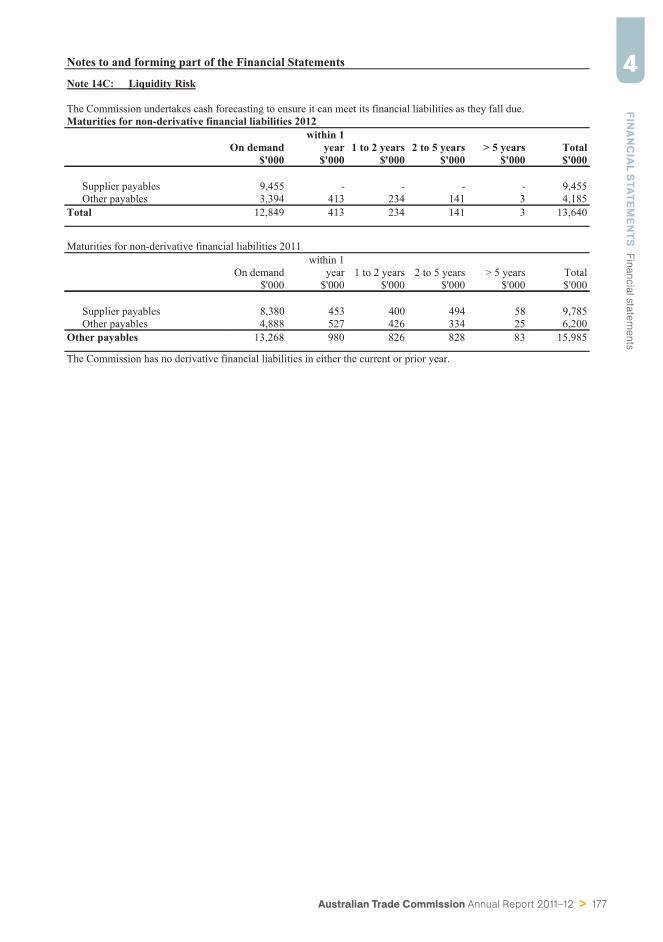
Australian Trade Commission Annual Report 2011–12 > 177
FINA
NC
IAL S
TATEMEN
TS
Fin
ancia
l sta
tem
ents
4Notes to and forming part of the Financial Statements
Note 14C: Liquidity Risk
The Commission undertakes cash forecasting to ensure it can meet its financial liabilities as they fall due.Maturities for non-derivative financial liabilities 2012
On demandwithin 1
year 1 to 2 years 2 to 5 years > 5 years Total$'000 $'000 $'000 $'000 $'000 $'000
Supplier payables 9,455 - - - - 9,455Other payables 3,394 413 234 141 3 4,185
Total 12,849 413 234 141 3 13,640
Maturities for non-derivative financial liabilities 2011
On demandwithin 1
year 1 to 2 years 2 to 5 years > 5 years Total$'000 $'000 $'000 $'000 $'000 $'000
Supplier payables 8,380 453 400 494 58 9,785Other payables 4,888 527 426 334 25 6,200
Other payables 13,268 980 826 828 83 15,985
The Commission has no derivative financial liabilities in either the current or prior year.
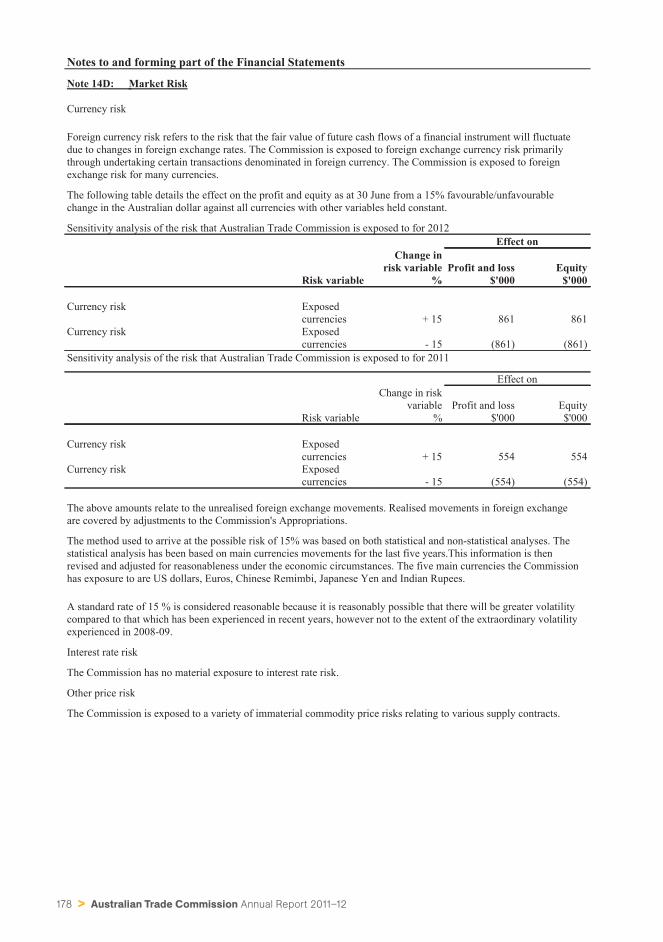
178 > Australian Trade Commission Annual Report 2011–12
Notes to and forming part of the Financial Statements
Note 14D: Market Risk
Currency risk
Foreign currency risk refers to the risk that the fair value of future cash flows of a financial instrument will fluctuatedue to changes in foreign exchange rates. The Commission is exposed to foreign exchange currency risk primarilythrough undertaking certain transactions denominated in foreign currency. The Commission is exposed to foreignexchange risk for many currencies.
The following table details the effect on the profit and equity as at 30 June from a 15% favourable/unfavourablechange in the Australian dollar against all currencies with other variables held constant.
Sensitivity analysis of the risk that Australian Trade Commission is exposed to for 2012Effect on
Change inrisk variable Profit and loss Equity
Risk variable % $'000 $'000
Currency risk Exposedcurrencies + 15 861 861
Currency risk Exposedcurrencies - 15 (861) (861)
Sensitivity analysis of the risk that Australian Trade Commission is exposed to for 2011
Effect onChange in risk
variable Profit and loss EquityRisk variable % $'000 $'000
Currency risk Exposedcurrencies + 15 554 554
Currency risk Exposedcurrencies - 15 (554) (554)
The above amounts relate to the unrealised foreign exchange movements. Realised movements in foreign exchangeare covered by adjustments to the Commission's Appropriations.
The method used to arrive at the possible risk of 15% was based on both statistical and non-statistical analyses. Thestatistical analysis has been based on main currencies movements for the last five years.This information is thenrevised and adjusted for reasonableness under the economic circumstances. The five main currencies the Commissionhas exposure to are US dollars, Euros, Chinese Remimbi, Japanese Yen and Indian Rupees.
A standard rate of 15 % is considered reasonable because it is reasonably possible that there will be greater volatilitycompared to that which has been experienced in recent years, however not to the extent of the extraordinary volatilityexperienced in 2008-09.
Interest rate risk
The Commission has no material exposure to interest rate risk.
Other price risk
The Commission is exposed to a variety of immaterial commodity price risks relating to various supply contracts.
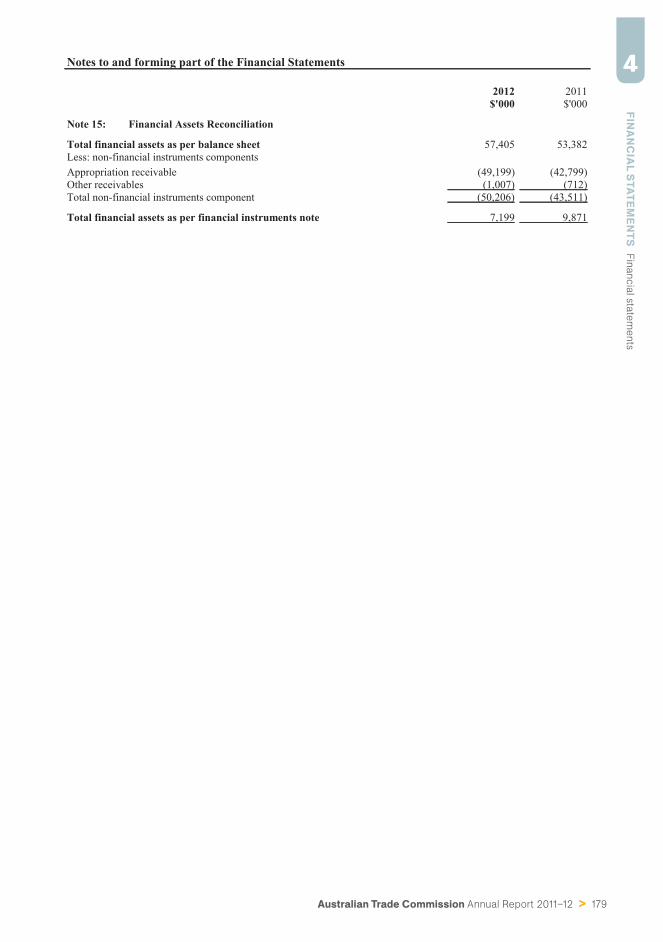
Australian Trade Commission Annual Report 2011–12 > 179
FINA
NC
IAL S
TATEMEN
TS
Fin
ancia
l sta
tem
ents
4Notes to and forming part of the Financial Statements
2012 2011$'000 $'000
Note 15: Financial Assets Reconciliation
Total financial assets as per balance sheet 57,405 53,382Less: non-financial instruments componentsAppropriation receivable (49,199) (42,799)Other receivables (1,007) (712)Total non-financial instruments component (50,206) (43,511)
Total financial assets as per financial instruments note 7,199 9,871
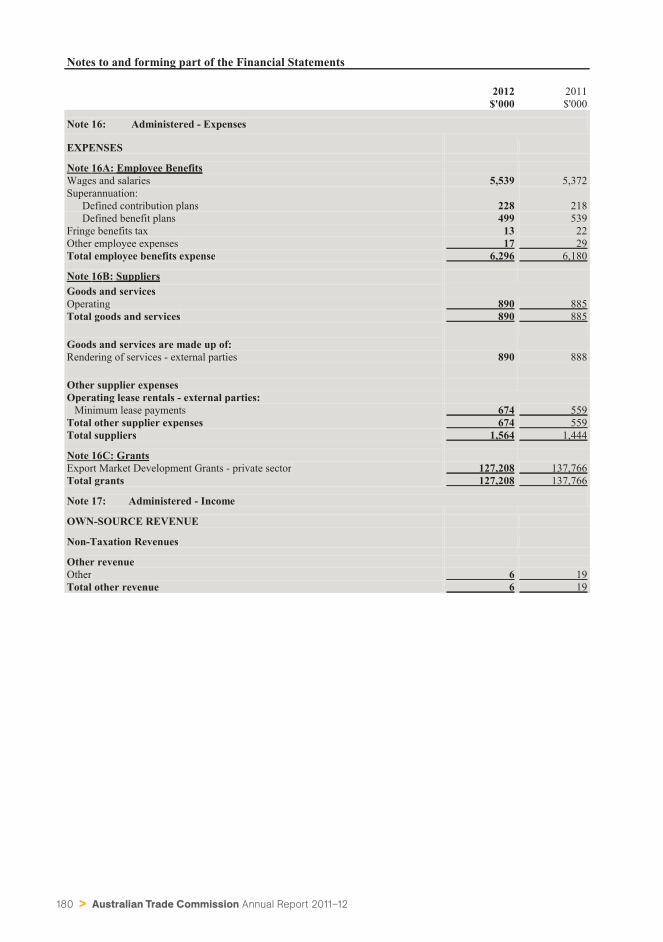
180 > Australian Trade Commission Annual Report 2011–12
Notes to and forming part of the Financial Statements
2012 2011$'000 $'000
Note 16: Administered - Expenses
EXPENSES
Note 16A: Employee BenefitsWages and salaries 5,539 5,372Superannuation:
Defined contribution plans 228 218Defined benefit plans 499 539
Fringe benefits tax 13 22Other employee expenses 17 29Total employee benefits expense 6,296 6,180
Note 16B: SuppliersGoods and servicesOperating 890 885Total goods and services 890 885
Goods and services are made up of:Rendering of services - external parties 890 888
Other supplier expensesOperating lease rentals - external parties:
Minimum lease payments 674 559Total other supplier expenses 674 559Total suppliers 1,564 1,444
Note 16C: GrantsExport Market Development Grants - private sector 127,208 137,766Total grants 127,208 137,766
Note 17: Administered - Income
OWN-SOURCE REVENUE
Non-Taxation Revenues
Other revenueOther 6 19Total other revenue 6 19
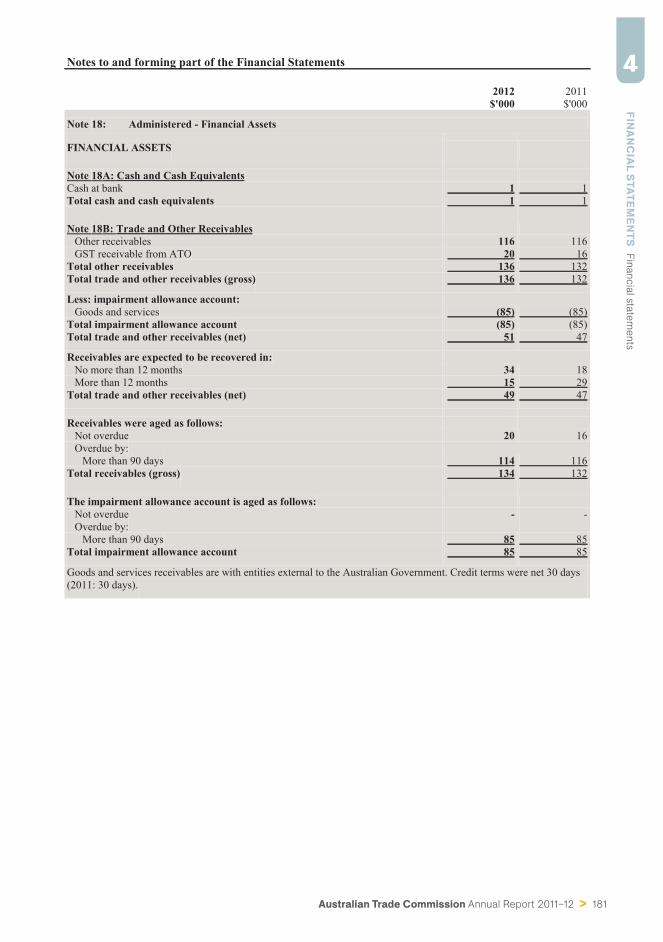
Australian Trade Commission Annual Report 2011–12 > 181
FINA
NC
IAL S
TATEMEN
TS
Fin
ancia
l sta
tem
ents
4Notes to and forming part of the Financial Statements
2012 2011$'000 $'000
Note 18: Administered - Financial Assets
FINANCIAL ASSETS
Note 18A: Cash and Cash EquivalentsCash at bank 1 1Total cash and cash equivalents 1 1
Note 18B: Trade and Other ReceivablesOther receivables 116 116GST receivable from ATO 20 16
Total other receivables 136 132Total trade and other receivables (gross) 136 132
Less: impairment allowance account:Goods and services (85) (85)
Total impairment allowance account (85) (85)Total trade and other receivables (net) 51 47
Receivables are expected to be recovered in:No more than 12 months 34 18More than 12 months 15 29
Total trade and other receivables (net) 49 47
Receivables were aged as follows:Not overdue 20 16Overdue by:
More than 90 days 114 116Total receivables (gross) 134 132
The impairment allowance account is aged as follows:Not overdue - -Overdue by:
More than 90 days 85 85Total impairment allowance account 85 85
Goods and services receivables are with entities external to the Australian Government. Credit terms were net 30 days(2011: 30 days).
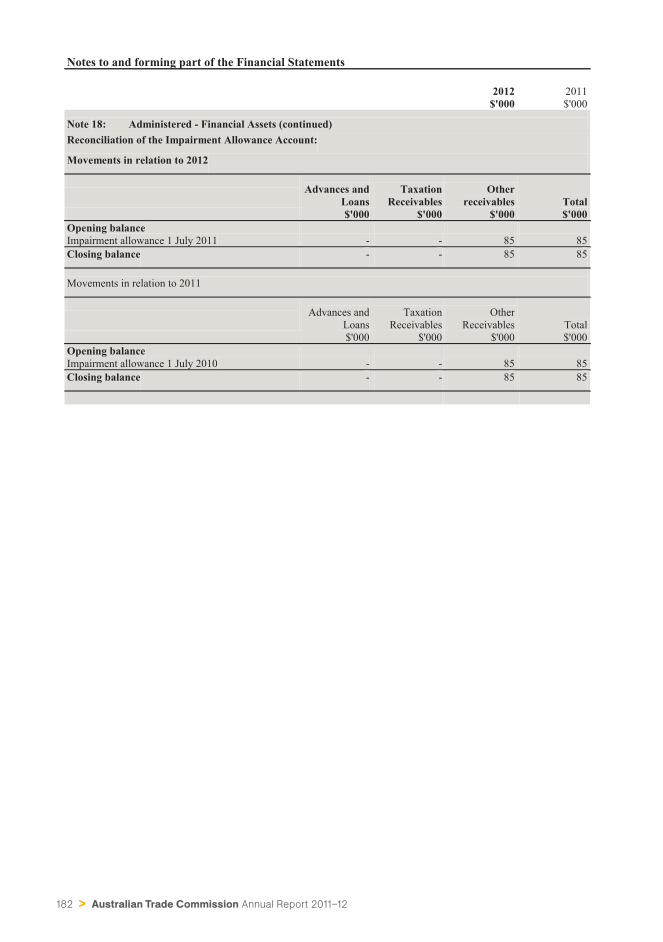
182 > Australian Trade Commission Annual Report 2011–12
Notes to and forming part of the Financial Statements
2012 2011$'000 $'000
Note 18: Administered - Financial Assets (continued)Reconciliation of the Impairment Allowance Account:
Movements in relation to 2012
Advances andLoans
TaxationReceivables
Otherreceivables Total
$'000 $'000 $'000 $'000Opening balanceImpairment allowance 1 July 2011 - - 85 85Closing balance - - 85 85
Movements in relation to 2011
Advances andLoans
TaxationReceivables
OtherReceivables Total
$'000 $'000 $'000 $'000Opening balanceImpairment allowance 1 July 2010 - - 85 85Closing balance - - 85 85
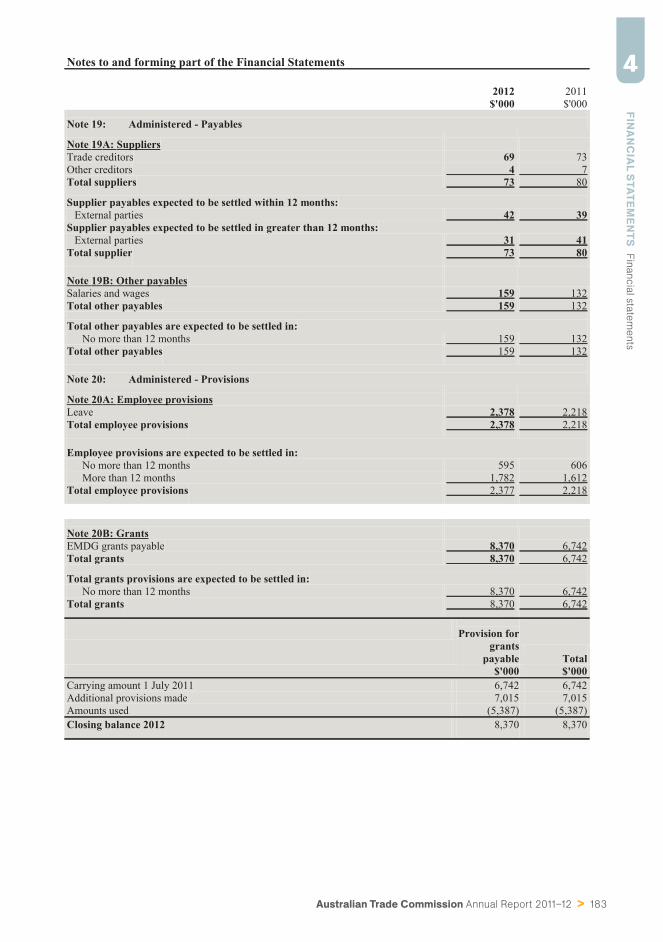
Australian Trade Commission Annual Report 2011–12 > 183
FINA
NC
IAL S
TATEMEN
TS
Fin
ancia
l sta
tem
ents
4Notes to and forming part of the Financial Statements
2012 2011$'000 $'000
Note 19: Administered - Payables
Note 19A: SuppliersTrade creditors 69 73Other creditors 4 7Total suppliers 73 80
Supplier payables expected to be settled within 12 months:External parties 42 39
Supplier payables expected to be settled in greater than 12 months:External parties 31 41
Total supplier 73 80
Note 19B: Other payablesSalaries and wages 159 132Total other payables 159 132
Total other payables are expected to be settled in:No more than 12 months 159 132
Total other payables 159 132
Note 20: Administered - Provisions
Note 20A: Employee provisionsLeave 2,378 2,218Total employee provisions 2,378 2,218
Employee provisions are expected to be settled in:No more than 12 months 595 606More than 12 months 1,782 1,612
Total employee provisions 2,377 2,218
Note 20B: GrantsEMDG grants payable 8,370 6,742Total grants 8,370 6,742
Total grants provisions are expected to be settled in:No more than 12 months 8,370 6,742
Total grants 8,370 6,742
Provision forgrants
payable Total$'000 $'000
Carrying amount 1 July 2011 6,742 6,742Additional provisions made 7,015 7,015Amounts used (5,387) (5,387)Closing balance 2012 8,370 8,370
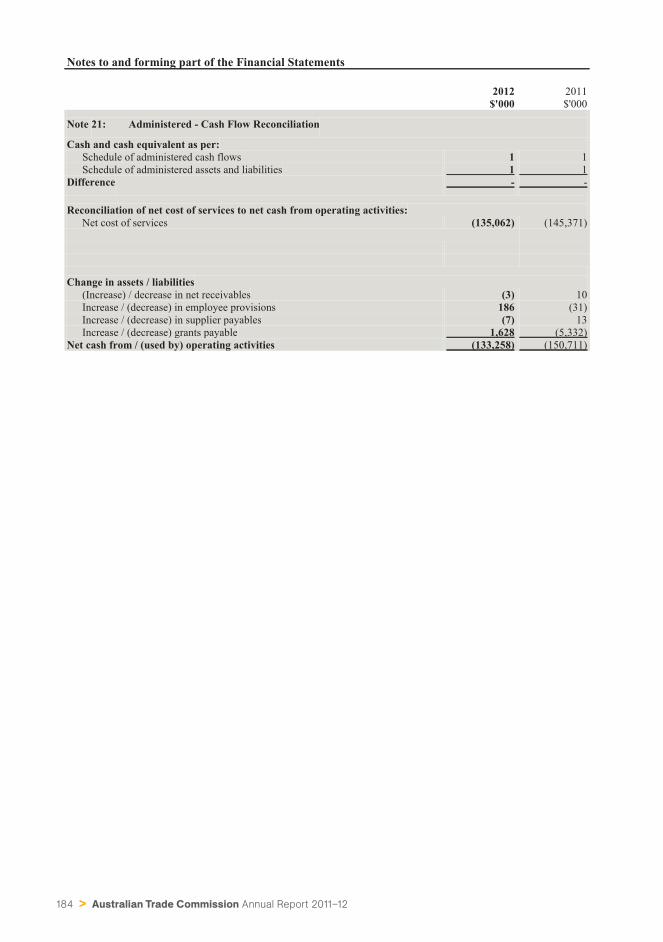
184 > Australian Trade Commission Annual Report 2011–12
Notes to and forming part of the Financial Statements
2012 2011$'000 $'000
Note 21: Administered - Cash Flow Reconciliation
Cash and cash equivalent as per:Schedule of administered cash flows 1 1Schedule of administered assets and liabilities 1 1
Difference - -
Reconciliation of net cost of services to net cash from operating activities:Net cost of services (135,062) (145,371)
Change in assets / liabilities(Increase) / decrease in net receivables (3) 10Increase / (decrease) in employee provisions 186 (31)Increase / (decrease) in supplier payables (7) 13Increase / (decrease) grants payable 1,628 (5,332)
Net cash from / (used by) operating activities (133,258) (150,711)
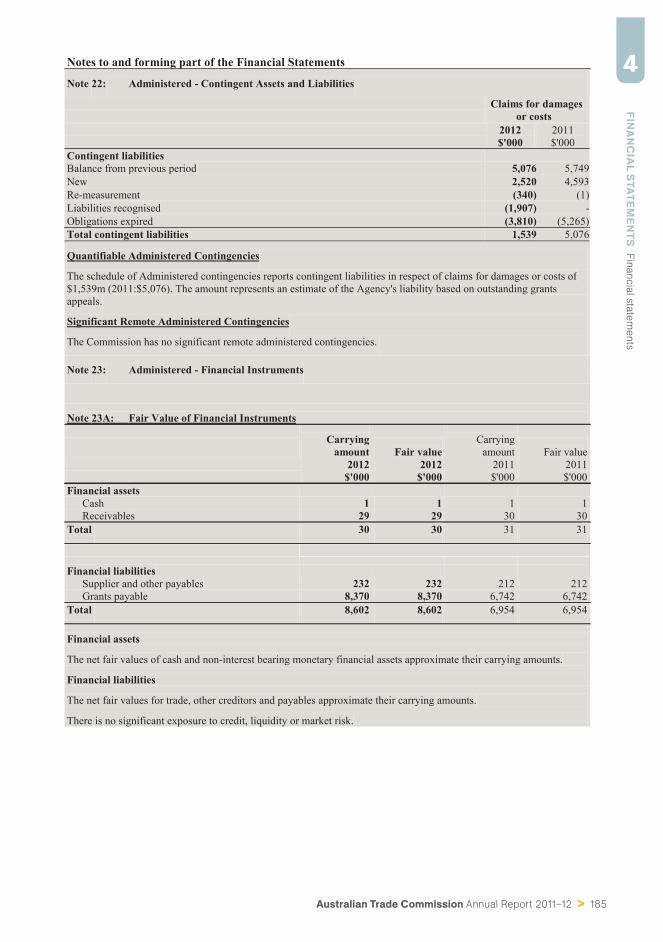
Australian Trade Commission Annual Report 2011–12 > 185
FINA
NC
IAL S
TATEMEN
TS
Fin
ancia
l sta
tem
ents
4Notes to and forming part of the Financial Statements
Note 22: Administered - Contingent Assets and Liabilities
Claims for damagesor costs
2012 2011$'000 $'000
Contingent liabilitiesBalance from previous period 5,076 5,749New 2,520 4,593Re-measurement (340) (1)Liabilities recognised (1,907) -Obligations expired (3,810) (5,265)Total contingent liabilities 1,539 5,076
Quantifiable Administered Contingencies
The schedule of Administered contingencies reports contingent liabilities in respect of claims for damages or costs of$1,539m (2011:$5,076). The amount represents an estimate of the Agency's liability based on outstanding grantsappeals.
Significant Remote Administered Contingencies
The Commission has no significant remote administered contingencies.
Note 23: Administered - Financial Instruments
Note 23A: Fair Value of Financial Instruments
Carryingamount Fair value
Carryingamount Fair value
2012 2012 2011 2011$'000 $'000 $'000 $'000
Financial assetsCash 1 1 1 1Receivables 29 29 30 30
Total 30 30 31 31
Financial liabilitiesSupplier and other payables 232 232 212 212Grants payable 8,370 8,370 6,742 6,742
Total 8,602 8,602 6,954 6,954
Financial assets
The net fair values of cash and non-interest bearing monetary financial assets approximate their carrying amounts.
Financial liabilities
The net fair values for trade, other creditors and payables approximate their carrying amounts.
There is no significant exposure to credit, liquidity or market risk.
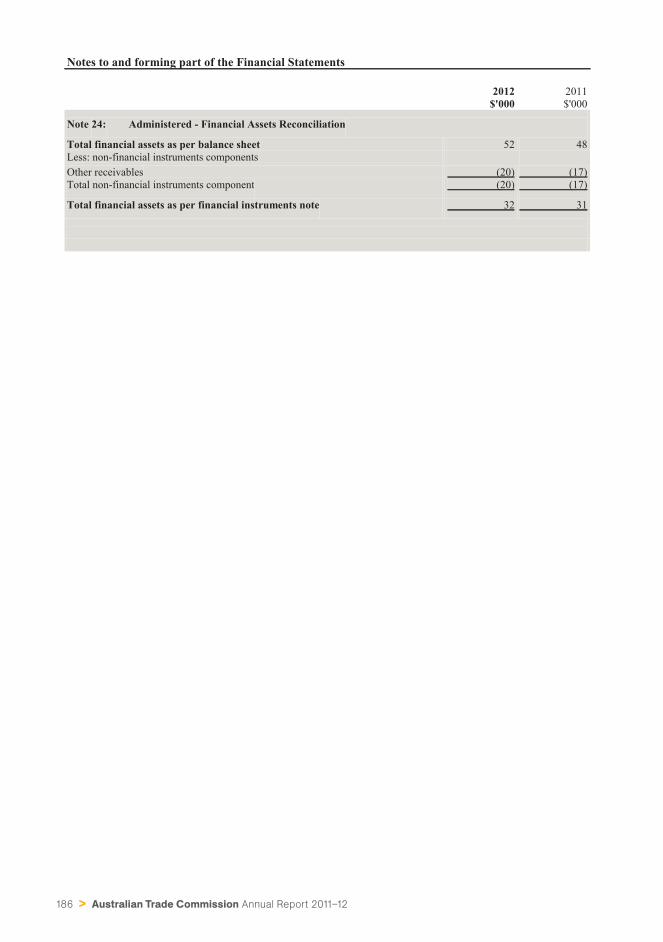
186 > Australian Trade Commission Annual Report 2011–12
Notes to and forming part of the Financial Statements
2012 2011$'000 $'000
Note 24: Administered - Financial Assets Reconciliation
Total financial assets as per balance sheet 52 48Less: non-financial instruments componentsOther receivables (20) (17)Total non-financial instruments component (20) (17)
Total financial assets as per financial instruments note 32 31
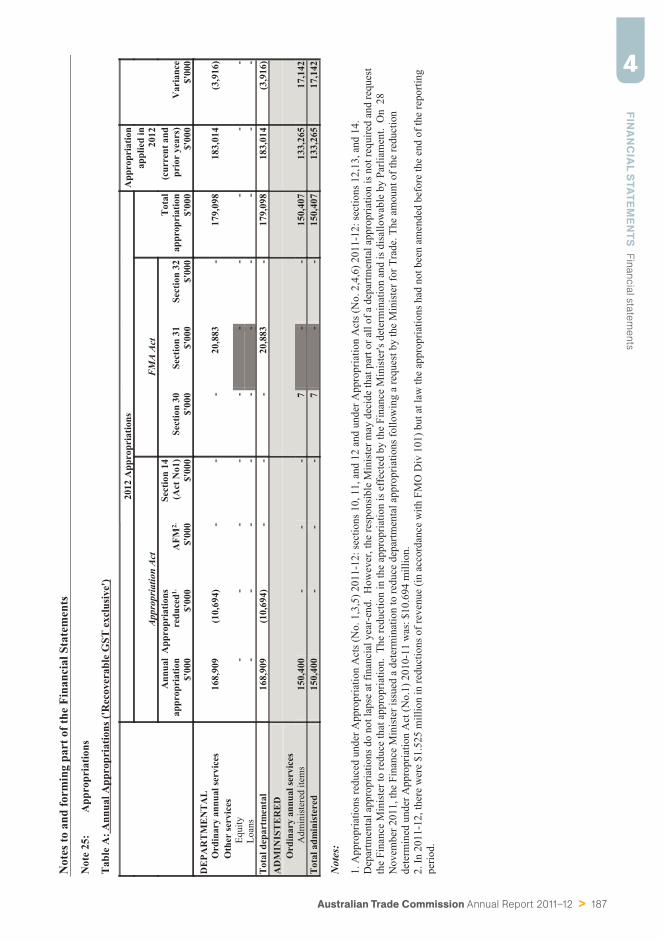
Australian Trade Commission Annual Report 2011–12 > 187
FINA
NC
IAL S
TATEMEN
TS
Fin
ancia
l sta
tem
ents
4N
otes
to a
nd fo
rmin
g pa
rt o
f the
Fin
anci
al S
tate
men
ts
Not
e 25
:A
ppro
pria
tions
Tab
le A
: Ann
ual A
ppro
pria
tions
('R
ecov
erab
le G
ST e
xclu
sive
')
2012
App
ropr
iatio
nsA
ppro
pria
tion
App
ropr
iatio
n A
ctFM
A Ac
tap
plie
d in
2012
Ann
ual
appr
opri
atio
nA
ppro
pria
tions
redu
ced1.
AFM
2.Se
ctio
n 14
(Act
No1
)Se
ctio
n 30
Sect
ion
31Se
ctio
n 32
Tota
lap
prop
riat
ion
(cur
rent
and
prio
r ye
ars)
Var
ianc
e$'
000
$'00
0$'
000
$'00
0$'
000
$'00
0$'
000
$'00
0$'
000
$'00
0
DE
PAR
TM
EN
TA
LO
rdin
ary
annu
al se
rvic
es16
8,90
9(1
0,69
4)-
--
20,8
83-
179,
098
183,
014
(3,9
16)
Oth
er se
rvic
esEq
uity
--
--
--
--
--
Loan
s-
--
--
--
--
-To
tal d
epar
tmen
tal
168,
909
(10,
694)
--
-20
,883
-17
9,09
818
3,01
4(3
,916
)A
DM
INIS
TE
RE
DO
rdin
ary
annu
al se
rvic
esA
dmin
iste
red
item
s15
0,40
0-
--
7-
-15
0,40
713
3,26
517
,142
Tota
l adm
inist
ered
150,
400
--
-7
--
150,
407
133,
265
17,1
42
Not
es:
1. A
ppro
pria
tions
redu
ced
unde
r App
ropr
iatio
n A
cts (
No.
1,3
,5) 2
011-
12: s
ectio
ns 1
0, 1
1, a
nd 1
2 an
d un
der A
ppro
pria
tion
Act
s (N
o. 2
,4,6
) 201
1-12
: sec
tions
12,
13, a
nd 1
4.D
epar
tmen
tal a
ppro
pria
tions
do
not l
apse
at f
inan
cial
yea
r-en
d. H
owev
er, t
he re
spon
sibl
e M
inis
ter m
ay d
ecid
e th
at p
art o
r all
of a
dep
artm
enta
l app
ropr
iatio
n is
not
requ
ired
and
requ
est
the
Fina
nce
Min
iste
r to
redu
ce th
at a
ppro
pria
tion.
The
redu
ctio
n in
the
appr
opria
tion
is e
ffec
ted
by th
e Fi
nanc
e M
inis
ter's
det
erm
inat
ion
and
is d
isal
low
able
by
Parli
amen
t. O
n 2
8N
ovem
ber 2
011,
the
Fina
nce
Min
iste
r iss
ued
a de
term
inat
ion
to re
duce
dep
artm
enta
l app
ropr
iatio
ns fo
llow
ing
a re
ques
t by
the
Min
iste
r for
Tra
de. T
he a
mou
nt o
f the
redu
ctio
nde
term
ined
und
er A
ppro
pria
tion
Act
(No.
1) 2
010-
11 w
as: $
10.6
94 m
illio
n.
2. In
201
1-12
, the
re w
ere
$1.5
25 m
illio
n in
redu
ctio
ns o
f rev
enue
(in
acco
rdan
ce w
ith F
MO
Div
101
) but
at l
aw th
e ap
prop
riatio
ns h
ad n
ot b
een
amen
ded
befo
re th
e en
d of
the
repo
rting
perio
d.
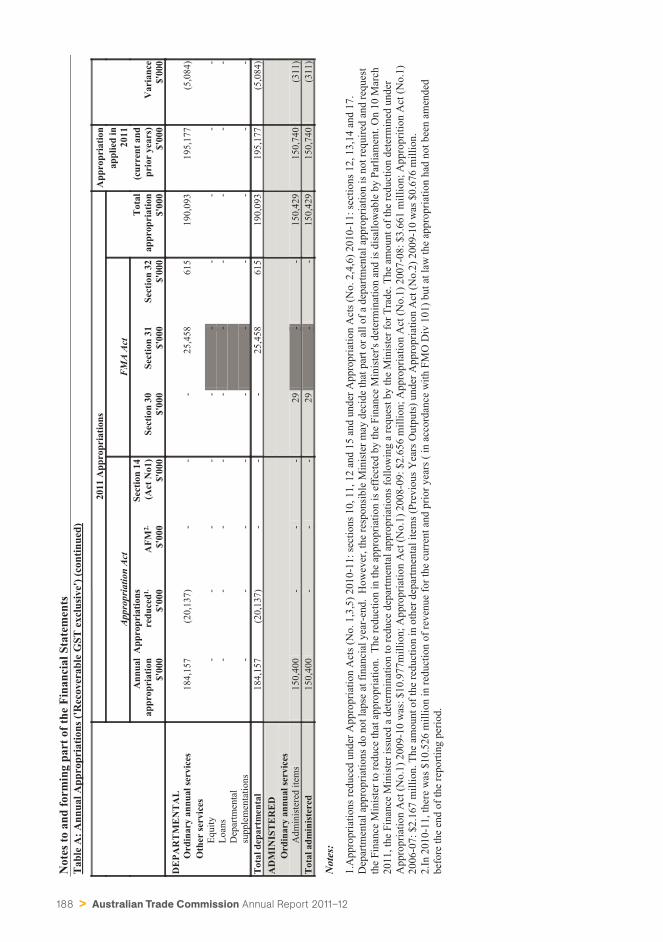
188 > Australian Trade Commission Annual Report 2011–12
Not
es to
and
form
ing
part
of t
he F
inan
cial
Sta
tem
ents
Tab
le A
: Ann
ual A
ppro
pria
tions
('R
ecov
erab
le G
ST e
xclu
sive
') (c
ontin
ued)
2011
App
ropr
iatio
nsA
ppro
pria
tion
App
ropr
iatio
n A
ctFM
A Ac
tap
plie
d in
2011
Ann
ual
appr
opri
atio
nA
ppro
pria
tions
redu
ced1.
AFM
2.Se
ctio
n 14
(Act
No1
)Se
ctio
n 30
Sect
ion
31Se
ctio
n 32
Tota
lap
prop
riat
ion
(cur
rent
and
prio
r ye
ars)
Var
ianc
e$'
000
$'00
0$'
000
$'00
0$'
000
$'00
0$'
000
$'00
0$'
000
$'00
0
DE
PAR
TM
EN
TA
LO
rdin
ary
annu
al se
rvic
es18
4,15
7(2
0,13
7)-
--
25,4
5861
519
0,09
319
5,17
7(5
,084
)O
ther
serv
ices
Equi
ty-
--
--
--
--
-Lo
ans
--
--
--
--
--
Dep
artm
enta
lsu
pple
men
tatio
ns-
--
--
--
--
-To
tal d
epar
tmen
tal
184,
157
(20,
137)
--
-25
,458
615
190,
093
195,
177
(5,0
84)
AD
MIN
IST
ER
ED
Ord
inar
y an
nual
serv
ices
Adm
inis
tere
d ite
ms
150,
400
--
-29
--
150,
429
150,
740
(311
)To
tal a
dmin
ister
ed15
0,40
0-
--
29-
-15
0,42
915
0,74
0(3
11)
Not
es:
1.A
ppro
pria
tions
redu
ced
unde
r App
ropr
iatio
n A
cts (
No.
1,3
,5) 2
010-
11: s
ectio
ns 1
0, 1
1, 1
2 an
d 15
and
und
er A
ppro
pria
tion
Act
s (N
o. 2
,4,6
) 201
0-11
: sec
tions
12,
13,
14 a
nd 1
7.D
epar
tmen
tal a
ppro
pria
tions
do
not l
apse
at f
inan
cial
yea
r-en
d. H
owev
er, t
he re
spon
sibl
e M
inis
ter m
ay d
ecid
e th
at p
art o
r all
of a
dep
artm
enta
l app
ropr
iatio
n is
not
requ
ired
and
requ
est
the
Fina
nce
Min
iste
r to
redu
ce th
at a
ppro
pria
tion.
The
redu
ctio
n in
the
appr
opria
tion
is e
ffec
ted
by th
e Fi
nanc
e M
inis
ter's
det
erm
inat
ion
and
is d
isal
low
able
by
Parli
amen
t. O
n 10
Mar
ch20
11, t
he F
inan
ce M
inis
ter i
ssue
d a
dete
rmin
atio
n to
redu
ce d
epar
tmen
tal a
ppro
pria
tions
follo
win
g a
requ
est b
y th
e M
inis
ter f
or T
rade
. The
am
ount
of t
he re
duct
ion
dete
rmin
ed u
nder
App
ropr
iatio
n A
ct (N
o.1)
200
9-10
was
: $10
.977
mill
ion;
App
ropr
iatio
n A
ct (N
o.1)
200
8-09
: $2.
656
mill
ion;
App
ropr
iatio
n A
ct (N
o.1)
200
7-08
: $3.
661
mill
ion;
App
ropr
ition
Act
(No.
1)20
06-0
7: $
2.16
7 m
illio
n. T
he a
mou
nt o
f the
redu
ctio
n in
oth
er d
epar
tmen
tal i
tem
s (Pr
evio
us Y
ears
Out
puts
) und
er A
ppro
pria
tion
Act
(No.
2) 2
009-
10 w
as $
0.67
6 m
illio
n.
2.In
201
0-11
, the
re w
as $
10.5
26 m
illio
n in
redu
ctio
n of
reve
nue
for t
he c
urre
nt a
nd p
rior y
ears
( in
acc
orda
nce
with
FM
O D
iv 1
01) b
ut a
t law
the
appr
opria
tion
had
not b
een
amen
ded
befo
re th
e en
d of
the
repo
rting
per
iod.
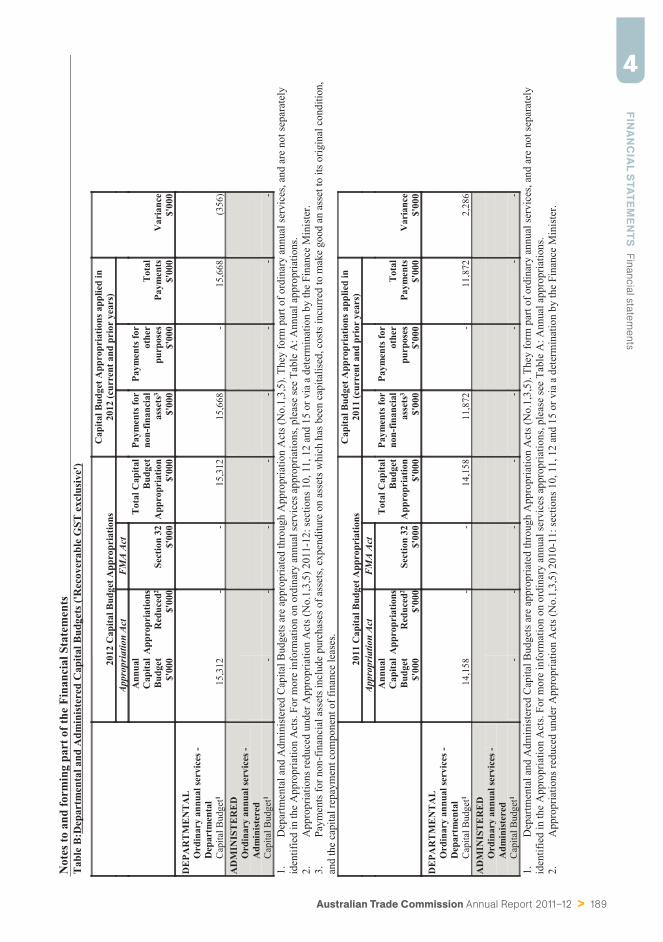
Australian Trade Commission Annual Report 2011–12 > 189
FINA
NC
IAL S
TATEMEN
TS
Fin
ancia
l sta
tem
ents
4N
otes
to a
nd fo
rmin
g pa
rt o
f the
Fin
anci
al S
tate
men
tsT
able
B:D
epar
tmen
tal a
nd A
dmin
iste
red
Cap
ital B
udge
ts ('
Rec
over
able
GST
exc
lusi
ve')
2012
Cap
ital B
udge
t App
ropr
iatio
nsC
apita
l Bud
get A
ppro
pria
tions
app
lied
in20
12 (c
urre
nt a
nd p
rior
yea
rs)
App
ropr
iatio
n A
ctFM
A Ac
tA
nnua
lC
apita
lBu
dget
App
ropr
iatio
nsR
educ
ed2
Sect
ion
32
Tota
l Cap
ital
Budg
etA
ppro
pria
tion
Paym
ents
for
non-
finan
cial
asse
ts3
Paym
ents
for
othe
rpu
rpos
esTo
tal
Paym
ents
Var
ianc
e$'
000
$'00
0$'
000
$'00
0$'
000
$'00
0$'
000
$'00
0
DE
PAR
TM
EN
TA
LO
rdin
ary
annu
al se
rvic
es -
Dep
artm
enta
lC
apita
l Bud
get1
15,3
12-
-15
,312
15,6
68-
15,6
68(3
56)
AD
MIN
IST
ER
ED
Ord
inar
y an
nual
serv
ices
-A
dmin
ister
edC
apita
l Bud
get1
--
--
--
--
1.D
epar
tmen
tal a
nd A
dmin
iste
red
Cap
ital B
udge
ts a
re a
ppro
pria
ted
thro
ugh
App
ropr
iatio
n A
cts (
No.
1,3,
5). T
hey
form
par
t of o
rdin
ary
annu
al se
rvic
es, a
nd a
re n
ot se
para
tely
iden
tifie
d in
the
App
ropr
iatio
n A
cts.
For m
ore
info
rmat
ion
on o
rdin
ary
annu
al se
rvic
es a
ppro
pria
tions
, ple
ase
see
Tabl
e A
: Ann
ual a
ppro
pria
tions
.2.
App
ropr
iatio
ns re
duce
d un
der A
ppro
pria
tion
Act
s (N
o.1,
3,5)
201
1-12
: sec
tions
10,
11,
12
and
15 o
r via
a d
eter
min
atio
n by
the
Fina
nce
Min
iste
r.3.
Paym
ents
for n
on-f
inan
cial
ass
ets i
nclu
de p
urch
ases
of a
sset
s, ex
pend
iture
on
asse
ts w
hich
has
bee
n ca
pita
lised
, cos
ts in
curr
ed to
mak
e go
od a
n as
set t
o its
orig
inal
con
ditio
n,an
d th
e ca
pita
l rep
aym
ent c
ompo
nent
of f
inan
ce le
ases
.
2011
Cap
ital B
udge
t App
ropr
iatio
nsC
apita
l Bud
get A
ppro
pria
tions
app
lied
in20
11 (c
urre
nt a
nd p
rior
yea
rs)
App
ropr
iatio
n A
ctFM
A Ac
tA
nnua
lC
apita
lBu
dget
App
ropr
iatio
nsR
educ
ed2
Sect
ion
32
Tota
l Cap
ital
Budg
etA
ppro
pria
tion
Paym
ents
for
non-
finan
cial
asse
ts3
Paym
ents
for
othe
rpu
rpos
esTo
tal
Paym
ents
Var
ianc
e$'
000
$'00
0$'
000
$'00
0$'
000
$'00
0$'
000
$'00
0
DE
PAR
TM
EN
TA
LO
rdin
ary
annu
al se
rvic
es -
Dep
artm
enta
lC
apita
l Bud
get1
14,1
58-
-14
,158
11,8
72-
11,8
722,
286
AD
MIN
IST
ER
ED
Ord
inar
y an
nual
serv
ices
-A
dmin
ister
edC
apita
l Bud
get1
--
--
--
--
1.D
epar
tmen
tal a
nd A
dmin
iste
red
Cap
ital B
udge
ts a
re a
ppro
pria
ted
thro
ugh
App
ropr
iatio
n A
cts (
No.
1,3,
5). T
hey
form
par
t of o
rdin
ary
annu
al se
rvic
es, a
nd a
re n
ot se
para
tely
iden
tifie
d in
the
App
ropr
iatio
n A
cts.
For m
ore
info
rmat
ion
on o
rdin
ary
annu
al se
rvic
es a
ppro
pria
tions
, ple
ase
see
Tabl
e A
: Ann
ual a
ppro
pria
tions
.2.
App
ropr
iatio
ns re
duce
d un
der A
ppro
pria
tion
Act
s (N
o.1,
3,5)
201
0-11
: sec
tions
10,
11,
12
and
15 o
r via
a d
eter
min
atio
n by
the
Fina
nce
Min
iste
r.
190 > Australian Trade Commission Annual Report 2011–12
Not
es to
and
form
ing
part
of t
he F
inan
cial
Sta
tem
ents
3.Pa
ymen
ts fo
r non
-fin
anci
al a
sset
s inc
lude
pur
chas
es o
f ass
ets,
expe
nditu
re o
n as
sets
whi
ch h
as b
een
capi
talis
ed, c
osts
incu
rred
to m
ake
good
an
asse
t to
its o
rigin
al c
ondi
tion,
and
the
capi
tal r
epay
men
t com
pone
nt o
f fin
ance
leas
es.
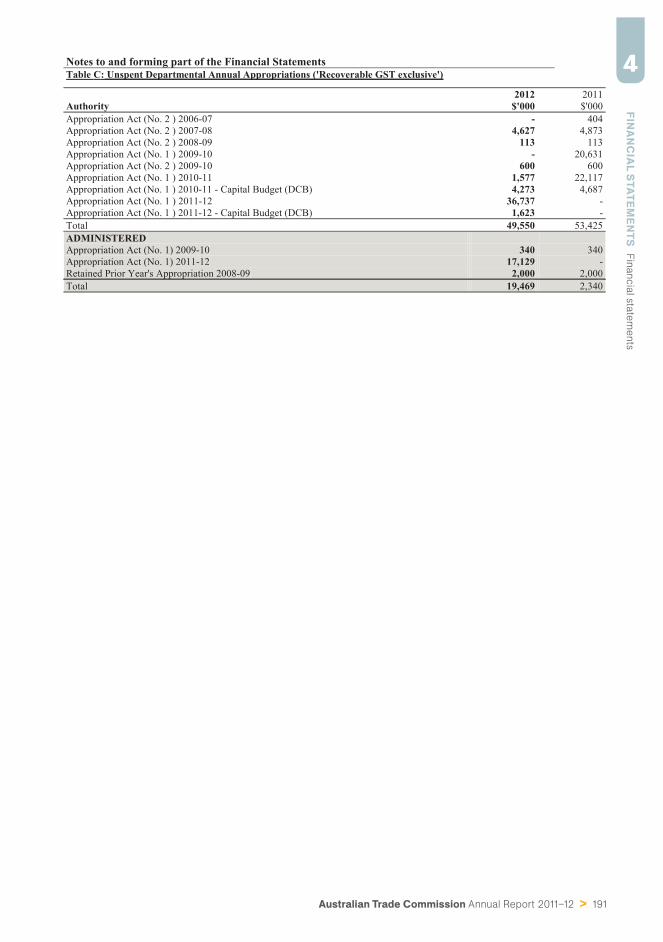
Australian Trade Commission Annual Report 2011–12 > 191
FINA
NC
IAL S
TATEMEN
TS
Fin
ancia
l sta
tem
ents
4Notes to and forming part of the Financial StatementsTable C: Unspent Departmental Annual Appropriations ('Recoverable GST exclusive')
2012 2011Authority $'000 $'000Appropriation Act (No. 2 ) 2006-07 - 404Appropriation Act (No. 2 ) 2007-08 4,627 4,873Appropriation Act (No. 2 ) 2008-09 113 113Appropriation Act (No. 1 ) 2009-10 - 20,631Appropriation Act (No. 2 ) 2009-10 600 600Appropriation Act (No. 1 ) 2010-11 1,577 22,117Appropriation Act (No. 1 ) 2010-11 - Capital Budget (DCB) 4,273 4,687Appropriation Act (No. 1 ) 2011-12 36,737 -Appropriation Act (No. 1 ) 2011-12 - Capital Budget (DCB) 1,623 -Total 49,550 53,425ADMINISTEREDAppropriation Act (No. 1) 2009-10 340 340Appropriation Act (No. 1) 2011-12 17,129 -Retained Prior Year's Appropriation 2008-09 2,000 2,000Total 19,469 2,340
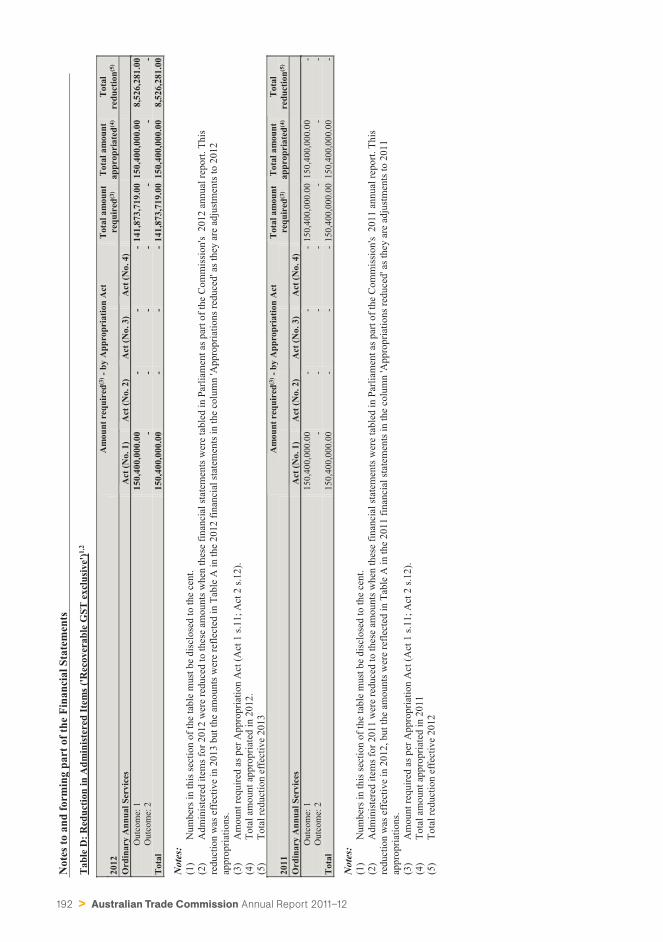
192 > Australian Trade Commission Annual Report 2011–12
Not
es to
and
form
ing
part
of t
he F
inan
cial
Sta
tem
ents
Tab
le D
: Red
uctio
n in
Adm
inis
tere
d It
ems (
'Rec
over
able
GST
exc
lusi
ve')1,
2
Am
ount
req
uire
d(3) -
by
App
ropr
iatio
n A
ctTo
tal a
mou
ntTo
tal a
mou
ntTo
tal
2012
requ
ired
(3)
appr
opri
ated
(4)
redu
ctio
n(5)
Ord
inar
y A
nnua
l Ser
vice
sA
ct (N
o. 1
)A
ct (N
o. 2
)A
ct (N
o. 3
)A
ct (N
o. 4
)O
utco
me:
115
0,40
0,00
0.00
--
-14
1,87
3,71
9.00
150,
400,
000.
008,
526,
281.
00O
utco
me:
2-
--
--
--
Tota
l15
0,40
0,00
0.00
--
-14
1,87
3,71
9.00
150,
400,
000.
008,
526,
281.
00
Not
es:
(1)
Num
bers
in th
is se
ctio
n of
the
tabl
e m
ust b
e di
sclo
sed
to th
e ce
nt.
(2)
Adm
inis
tere
d ite
ms f
or 2
012
wer
e re
duce
d to
thes
e am
ount
s whe
n th
ese
finan
cial
stat
emen
ts w
ere
tabl
ed in
Par
liam
ent a
s par
t of t
he C
omm
issi
on's
201
2 an
nual
repo
rt. T
his
redu
ctio
n w
as e
ffec
tive
in 2
013
but t
he a
mou
nts w
ere
refle
cted
in T
able
A in
the
2012
fina
ncia
l sta
tem
ents
in th
e co
lum
n 'A
ppro
pria
tions
redu
ced'
as t
hey
are
adju
stm
ents
to 2
012
appr
opria
tions
.(3
)A
mou
nt re
quire
d as
per
App
ropr
iatio
n A
ct (A
ct 1
s.11
; Act
2 s.
12).
(4)
Tota
l am
ount
app
ropr
iate
d in
201
2.(5
)To
tal r
educ
tion
effe
ctiv
e 20
13A
mou
nt r
equi
red(3
) - b
y A
ppro
pria
tion
Act
Tota
l am
ount
Tota
l am
ount
Tota
l20
11re
quir
ed(3
)ap
prop
riat
ed(4
)re
duct
ion(5
)
Ord
inar
y A
nnua
l Ser
vice
s A
ct (N
o. 1
)A
ct (N
o. 2
)A
ct (N
o. 3
)A
ct (N
o. 4
)O
utco
me:
115
0,40
0,00
0.00
--
-15
0,40
0,00
0.00
150,
400,
000.
00-
Out
com
e: 2
--
--
--
-To
tal
150,
400,
000.
00-
--
150,
400,
000.
0015
0,40
0,00
0.00
-
Not
es:
(1)
Num
bers
in th
is se
ctio
n of
the
tabl
e m
ust b
e di
sclo
sed
to th
e ce
nt.
(2)
Adm
inis
tere
d ite
ms f
or 2
011
wer
e re
duce
d to
thes
e am
ount
s whe
n th
ese
finan
cial
stat
emen
ts w
ere
tabl
ed in
Par
liam
ent a
s par
t of t
he C
omm
issi
on's
201
1 an
nual
repo
rt. T
his
redu
ctio
n w
as e
ffec
tive
in 2
012,
but
the
amou
nts w
ere
refle
cted
in T
able
A in
the
2011
fina
ncia
l sta
tem
ents
in th
e co
lum
n 'A
ppro
pria
tions
redu
ced'
as t
hey
are
adju
stm
ents
to 2
011
appr
opria
tions
.(3
)A
mou
nt re
quire
d as
per
App
ropr
iatio
n A
ct (A
ct 1
s.11
; Act
2 s.
12).
(4)
Tota
l am
ount
app
ropr
iate
d in
201
1(5
)To
tal r
educ
tion
effe
ctiv
e 20
12
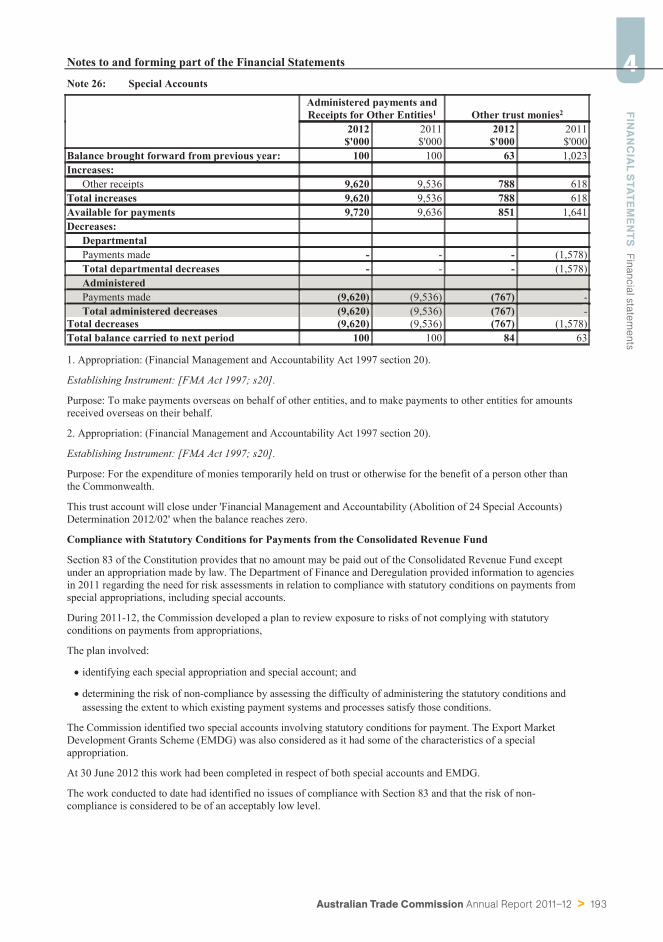
Australian Trade Commission Annual Report 2011–12 > 193
FINA
NC
IAL S
TATEMEN
TS
Fin
ancia
l sta
tem
ents
4Notes to and forming part of the Financial Statements
Note 26: Special Accounts
Administered payments andReceipts for Other Entities1 Other trust monies2
2012 2011 2012 2011$'000 $'000 $'000 $'000
Balance brought forward from previous year: 100 100 63 1,023Increases:
Other receipts 9,620 9,536 788 618Total increases 9,620 9,536 788 618Available for payments 9,720 9,636 851 1,641Decreases:
DepartmentalPayments made - - - (1,578)Total departmental decreases - - - (1,578)AdministeredPayments made (9,620) (9,536) (767) -Total administered decreases (9,620) (9,536) (767) -
Total decreases (9,620) (9,536) (767) (1,578)Total balance carried to next period 100 100 84 63
1. Appropriation: (Financial Management and Accountability Act 1997 section 20).
Establishing Instrument: [FMA Act 1997; s20].
Purpose: To make payments overseas on behalf of other entities, and to make payments to other entities for amountsreceived overseas on their behalf.
2. Appropriation: (Financial Management and Accountability Act 1997 section 20).
Establishing Instrument: [FMA Act 1997; s20].
Purpose: For the expenditure of monies temporarily held on trust or otherwise for the benefit of a person other thanthe Commonwealth.
This trust account will close under 'Financial Management and Accountability (Abolition of 24 Special Accounts)Determination 2012/02' when the balance reaches zero.
Compliance with Statutory Conditions for Payments from the Consolidated Revenue Fund
Section 83 of the Constitution provides that no amount may be paid out of the Consolidated Revenue Fund exceptunder an appropriation made by law. The Department of Finance and Deregulation provided information to agenciesin 2011 regarding the need for risk assessments in relation to compliance with statutory conditions on payments fromspecial appropriations, including special accounts.
During 2011-12, the Commission developed a plan to review exposure to risks of not complying with statutoryconditions on payments from appropriations,
The plan involved:
! identifying each special appropriation and special account; and
! determining the risk of non-compliance by assessing the difficulty of administering the statutory conditions andassessing the extent to which existing payment systems and processes satisfy those conditions.
The Commission identified two special accounts involving statutory conditions for payment. The Export MarketDevelopment Grants Scheme (EMDG) was also considered as it had some of the characteristics of a specialappropriation.
At 30 June 2012 this work had been completed in respect of both special accounts and EMDG.
The work conducted to date had identified no issues of compliance with Section 83 and that the risk of non-compliance is considered to be of an acceptably low level.
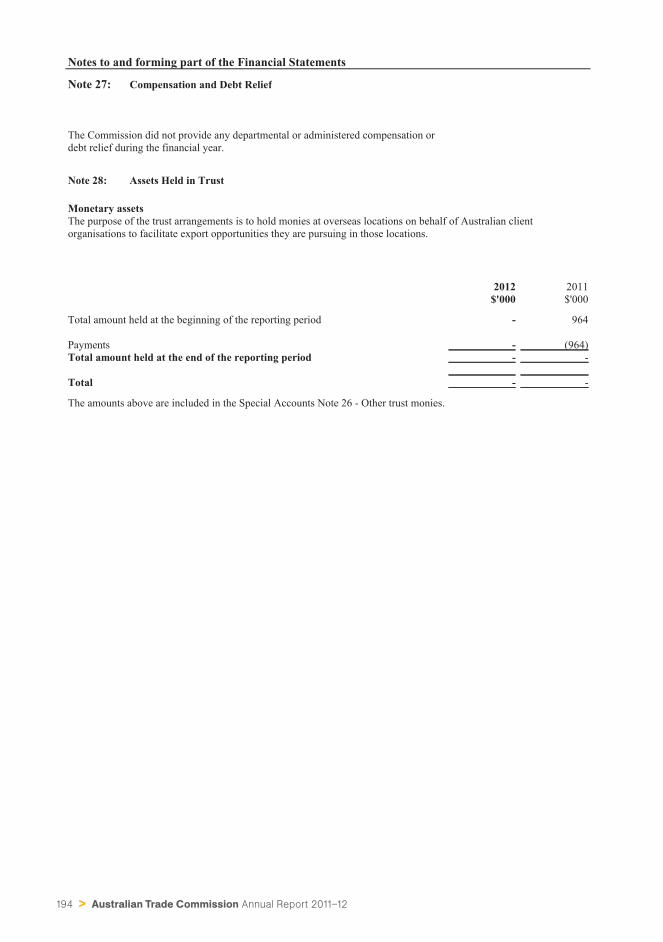
194 > Australian Trade Commission Annual Report 2011–12
Notes to and forming part of the Financial Statements
Note 27: Compensation and Debt Relief
The Commission did not provide any departmental or administered compensation ordebt relief during the financial year.
Note 28: Assets Held in Trust
Monetary assetsThe purpose of the trust arrangements is to hold monies at overseas locations on behalf of Australian clientorganisations to facilitate export opportunities they are pursuing in those locations.
2012$'000
2011$'000
Total amount held at the beginning of the reporting period - 964
Payments - (964)Total amount held at the end of the reporting period - -
Total - -
The amounts above are included in the Special Accounts Note 26 - Other trust monies.
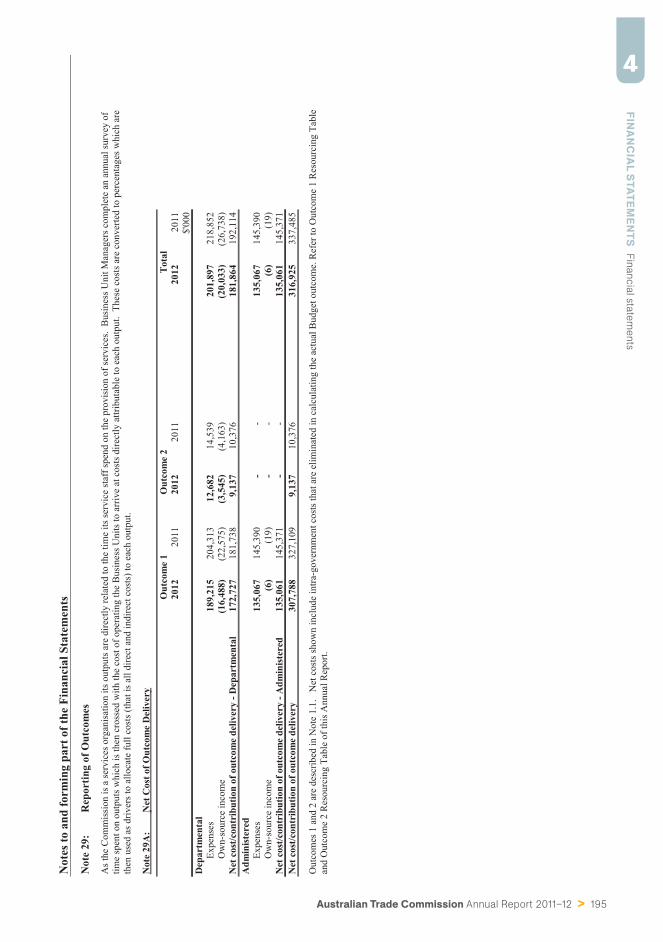
Australian Trade Commission Annual Report 2011–12 > 195
FINA
NC
IAL S
TATEMEN
TS
Fin
ancia
l sta
tem
ents
4N
otes
to a
nd fo
rmin
g pa
rt o
f the
Fin
anci
al S
tate
men
ts
Not
e 29
:R
epor
ting
of O
utco
mes
As t
he C
omm
issi
on is
a se
rvic
es o
rgan
isat
ion
its o
utpu
ts a
re d
irect
ly re
late
d to
the
time
its se
rvic
e st
aff s
pend
on
the
prov
isio
n of
serv
ices
. B
usin
ess U
nit M
anag
ers c
ompl
ete
an a
nnua
l sur
vey
oftim
e sp
ent o
n ou
tput
s whi
ch is
then
cro
ssed
with
the
cost
of o
pera
ting
the
Bus
ines
s Uni
ts to
arr
ive
at c
osts
dire
ctly
attr
ibut
able
to e
ach
outp
ut.
Thes
e co
sts a
re c
onve
rted
to p
erce
ntag
es w
hich
are
then
use
d as
driv
ers t
o al
loca
te fu
ll co
sts (
that
is a
ll di
rect
and
indi
rect
cos
ts) t
o ea
ch o
utpu
t.
Not
e 29
A:
Net
Cos
t of O
utco
me
Del
iver
y
Out
com
e 1
Out
com
e 2
Tota
l20
1220
1120
1220
1120
1220
11$'
000
Dep
artm
enta
lEx
pens
es18
9,21
520
4,31
312
,682
14,5
3920
1,89
721
8,85
2O
wn-
sour
ce in
com
e(1
6,48
8)(2
2,57
5)(3
,545
)(4
,163
)(2
0,03
3)(2
6,73
8)N
et c
ost/c
ontr
ibut
ion
of o
utco
me
deliv
ery
- Dep
artm
enta
l17
2,72
718
1,73
89,
137
10,3
7618
1,86
419
2,11
4A
dmin
ister
edEx
pens
es13
5,06
714
5,39
0-
-13
5,06
714
5,39
0O
wn-
sour
ce in
com
e(6
)(1
9)-
-(6
)(1
9)N
et c
ost/c
ontr
ibut
ion
of o
utco
me
deliv
ery
- Adm
inist
ered
135,
061
145,
371
--
135,
061
145,
371
Net
cos
t/con
trib
utio
n of
out
com
e de
liver
y30
7,78
832
7,10
99,
137
10,3
7631
6,92
533
7,48
5
Out
com
es 1
and
2 a
re d
escr
ibed
in N
ote
1.1.
N
et c
osts
show
n in
clud
e in
tra-g
over
nmen
t cos
ts th
at a
re e
limin
ated
in c
alcu
latin
g th
e ac
tual
Bud
get o
utco
me.
Ref
er to
Out
com
e 1
Res
ourc
ing
Tabl
ean
d O
utco
me
2 R
esou
rcin
g Ta
ble
of th
is A
nnua
l Rep
ort.
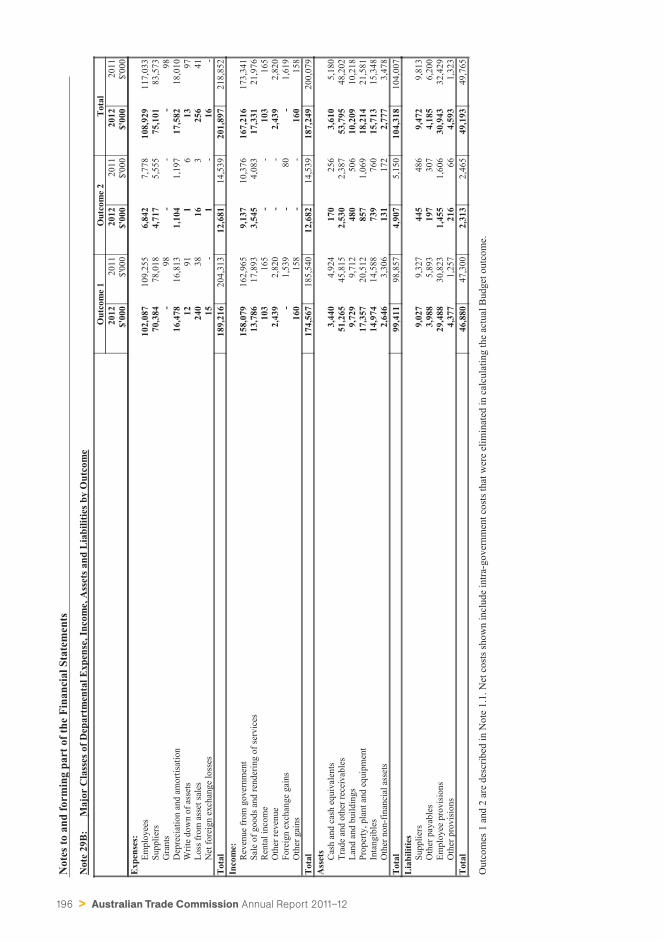
196 > Australian Trade Commission Annual Report 2011–12
Not
es to
and
form
ing
part
of t
he F
inan
cial
Sta
tem
ents
Not
e 29
B:
M
ajor
Cla
sses
of D
epar
tmen
tal E
xpen
se, I
ncom
e, A
sset
s and
Lia
bilit
ies b
y O
utco
me
Out
com
e 1
Out
com
e 2
Tota
l20
1220
1120
1220
1120
1220
11$'
000
$'00
0$'
000
$'00
0$'
000
$'00
0Ex
pens
es:
Empl
oyee
s10
2,08
710
9,25
56,
842
7,77
810
8,92
911
7,03
3Su
pplie
rs70
,384
78,0
184,
717
5,55
575
,101
83,5
73G
rant
s-
98-
--
98D
epre
ciat
ion
and
amor
tisat
ion
16,4
7816
,813
1,10
41,
197
17,5
8218
,010
Writ
e do
wn
of a
sset
s12
911
613
97Lo
ss fr
om a
sset
sale
s24
038
163
256
41N
et fo
reig
n ex
chan
ge lo
sses
15-
1-
16-
Tota
l 18
9,21
620
4,31
312
,681
14,5
3920
1,89
721
8,85
2In
com
e:R
even
ue fr
om g
over
nmen
t15
8,07
916
2,96
59,
137
10,3
7616
7,21
617
3,34
1Sa
le o
f goo
ds a
nd re
nder
ing
of se
rvic
es13
,786
17,8
933,
545
4,08
317
,331
21,9
76R
enta
l inc
ome
103
165
--
103
165
Oth
er re
venu
e2,
439
2,82
0-
-2,
439
2,82
0Fo
reig
n ex
chan
ge g
ains
-1,
539
-80
-1,
619
Oth
er g
ains
160
158
--
160
158
Tota
l 17
4,56
718
5,54
012
,682
14,5
3918
7,24
920
0,07
9A
sset
sC
ash
and
cash
equ
ival
ents
3,44
04,
924
170
256
3,61
05,
180
Trad
e an
d ot
her r
ecei
vabl
es51
,265
45,8
152,
530
2,38
753
,795
48,2
02La
nd a
nd b
uild
ings
9,72
99,
712
480
506
10,2
0910
,218
Prop
erty
, pla
nt a
nd e
quip
men
t17
,357
20,5
1285
71,
069
18,2
1421
,581
Inta
ngib
les
14,9
7414
,588
739
760
15,7
1315
,348
Oth
er n
on-f
inan
cial
ass
ets
2,64
63,
306
131
172
2,77
73,
478
Tota
l 99
,411
98,8
574,
907
5,15
010
4,31
810
4,00
7Li
abili
ties
Supp
liers
9,02
79,
327
445
486
9,47
29,
813
Oth
er p
ayab
les
3,98
85,
893
197
307
4,18
56,
200
Empl
oyee
pro
visi
ons
29,4
8830
,823
1,45
51,
606
30,9
4332
,429
Oth
er p
rovi
sion
s4,
377
1,25
721
666
4,59
31,
323
Tota
l 46
,880
47,3
002,
313
2,46
549
,193
49,7
65
Out
com
es 1
and
2 a
re d
escr
ibed
in N
ote
1.1.
Net
cos
ts sh
own
incl
ude
intra
-gov
ernm
ent c
osts
that
wer
e el
imin
ated
in c
alcu
latin
g th
e ac
tual
Bud
get o
utco
me.
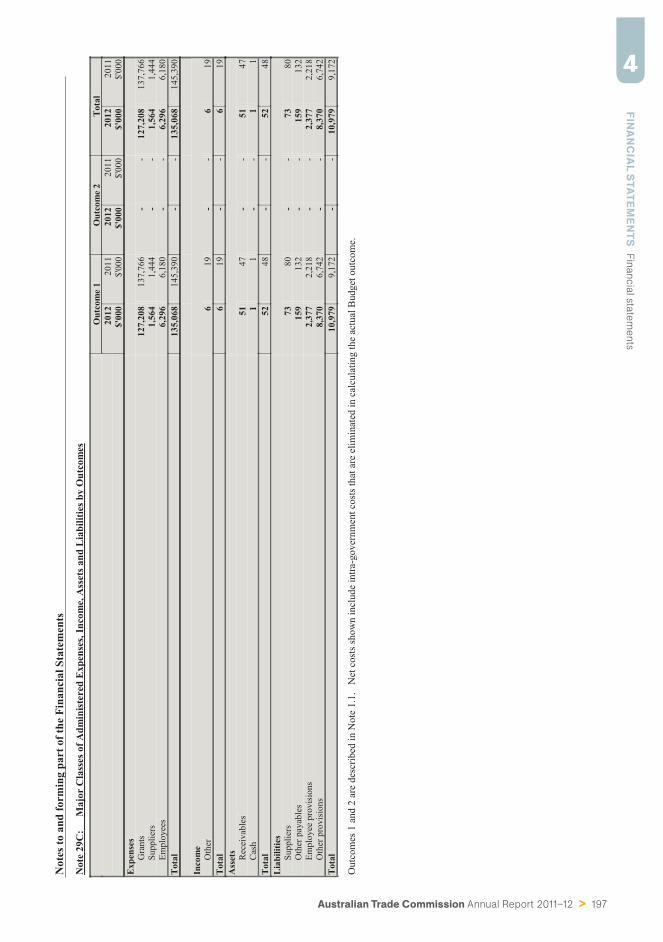
Australian Trade Commission Annual Report 2011–12 > 197
FINA
NC
IAL S
TATEMEN
TS
Fin
ancia
l sta
tem
ents
4N
otes
to a
nd fo
rmin
g pa
rt o
f the
Fin
anci
al S
tate
men
ts
Not
e 29
C:
M
ajor
Cla
sses
of A
dmin
iste
red
Exp
ense
s, In
com
e, A
sset
s and
Lia
bilit
ies b
y O
utco
mes
Out
com
e 1
Out
com
e 2
Tota
l20
1220
1120
1220
1120
1220
11$'
000
$'00
0$'
000
$'00
0$'
000
$'00
0Ex
pens
esG
rant
s12
7,20
813
7,76
6-
-12
7,20
813
7,76
6Su
pplie
rs1,
564
1,44
4-
-1,
564
1,44
4Em
ploy
ees
6,29
66,
180
--
6,29
66,
180
Tota
l13
5,06
814
5,39
0-
-13
5,06
814
5,39
0
Inco
me
Oth
er6
19-
-6
19To
tal
619
--
619
Ass
ets
Rec
eiva
bles
5147
--
5147
Cas
h1
1-
-1
1To
tal
5248
--
5248
Liab
ilitie
sSu
pplie
rs73
80-
-73
80O
ther
pay
able
s15
913
2-
-15
913
2Em
ploy
ee p
rovi
sion
s2,
377
2,21
8-
-2,
377
2,21
8O
ther
pro
visi
ons
8,37
06,
742
--
8,37
06,
742
Tota
l 10
,979
9,17
2-
-10
,979
9,17
2
Out
com
es 1
and
2 a
re d
escr
ibed
in N
ote
1.1.
N
et c
osts
show
n in
clud
e in
tra-g
over
nmen
t cos
ts th
at a
re e
limin
ated
in c
alcu
latin
g th
e ac
tual
Bud
get o
utco
me.
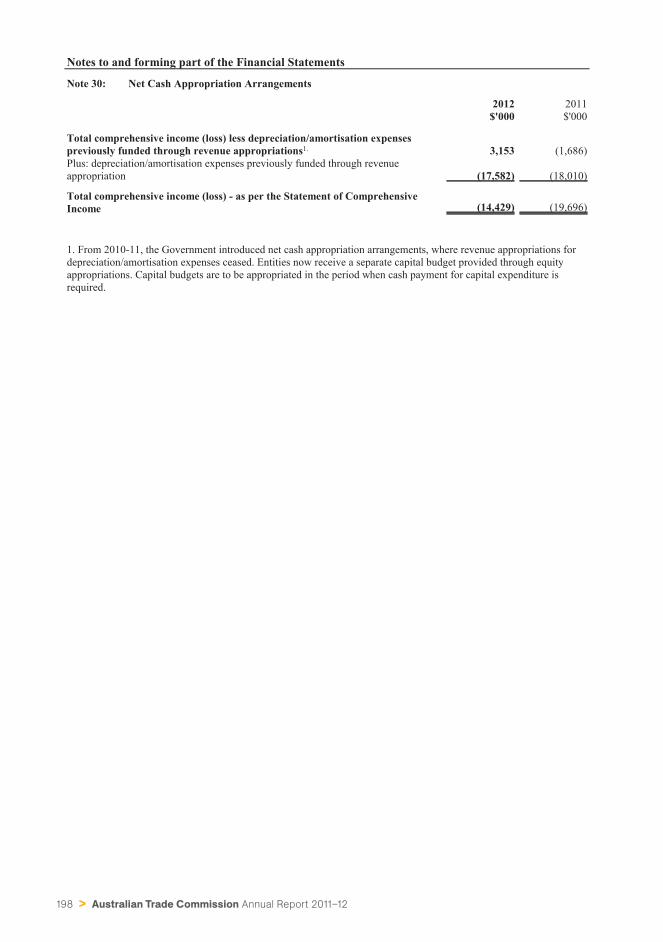
198 > Australian Trade Commission Annual Report 2011–12
Notes to and forming part of the Financial Statements
Note 30: Net Cash Appropriation Arrangements
2012 2011$'000 $'000
Total comprehensive income (loss) less depreciation/amortisation expensespreviously funded through revenue appropriations1. 3,153 (1,686)Plus: depreciation/amortisation expenses previously funded through revenueappropriation (17,582) (18,010)
Total comprehensive income (loss) - as per the Statement of ComprehensiveIncome (14,429) (19,696)
1. From 2010-11, the Government introduced net cash appropriation arrangements, where revenue appropriations fordepreciation/amortisation expenses ceased. Entities now receive a separate capital budget provided through equityappropriations. Capital budgets are to be appropriated in the period when cash payment for capital expenditure isrequired.
PART FIVEAppendixes
› A: Staffi ng overview 200
› B: Austrade locations in Australia (including TradeStart) 206
› C: Client Service Charter 209
› D: Work health and safety 211
› E: Consultancies 214
› F: Financial and staffi ng resources 215
› G: Ecologically sustainable development and environmental performance 217
› H: Advertising and market research 220
› I: List of requirements 223
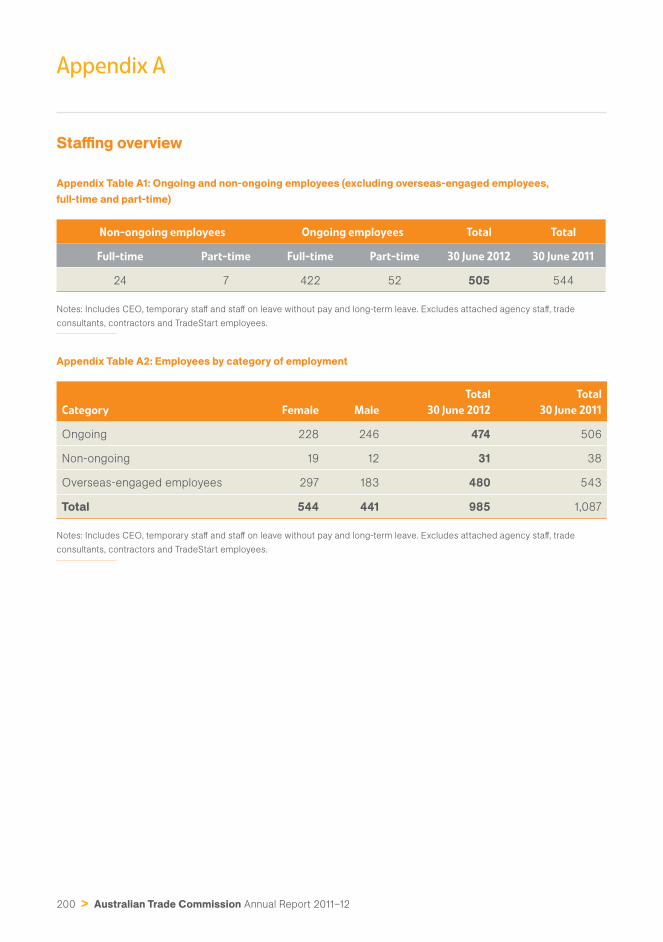
200 > Australian Trade Commission Annual Report 2011–12
Appendix A
Staffi ng overview
Appendix Table A1: Ongoing and non-ongoing employees (excluding overseas-engaged employees, full-time and part-time)
Non-ongoing employees Ongoing employees Total Total
Full-time Part-time Full-time Part-time 30 June 2012 30 June 2011
24 7 422 52 505 544
Notes: Includes CEO, temporary staff and staff on leave without pay and long-term leave. Excludes attached agency staff , trade
consultants, contractors and TradeStart employees.
Appendix Table A2: Employees by category of employment
Category Female Male
Total
30 June 2012
Total
30 June 2011
Ongoing 228 246 474 506
Non-ongoing 19 12 31 38
Overseas-engaged employees 297 183 480 543
Total 544 441 985 1,087
Notes: Includes CEO, temporary staff and staff on leave without pay and long-term leave. Excludes attached agency staff , trade
consultants, contractors and TradeStart employees.
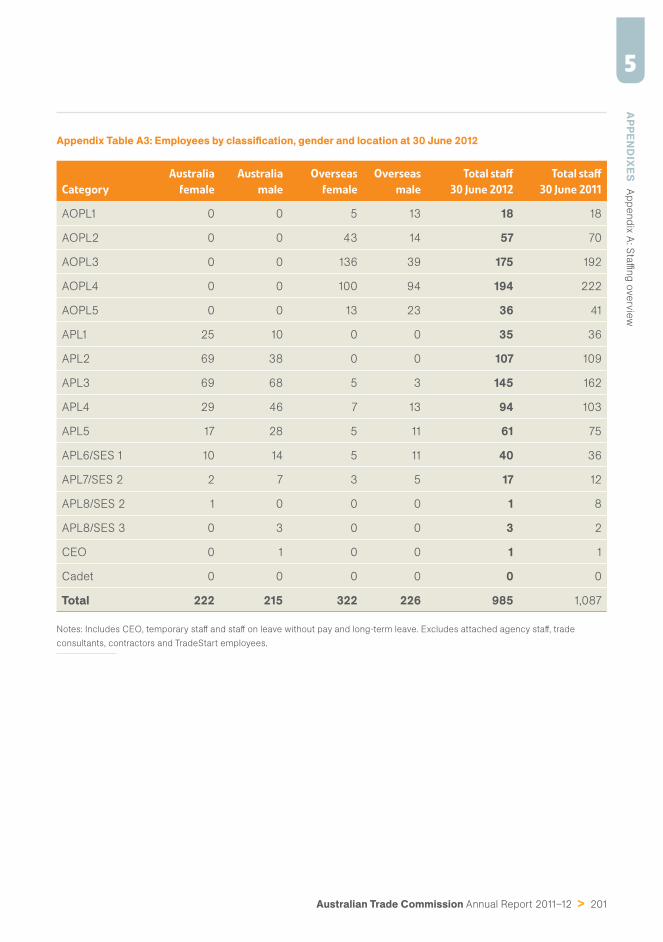
Australian Trade Commission Annual Report 2011–12 > 201
5A
PPEND
IXES
Ap
pend
ix A
: Sta
ffi ng o
verv
iew
Appendix Table A3: Employees by classifi cation, gender and location at 30 June 2012
Category
Australia
female
Australia
male
Overseas
female
Overseas
male
Total staff
30 June 2012
Total staff
30 June 2011
AOPL1 0 0 5 13 18 18
AOPL2 0 0 43 14 57 70
AOPL3 0 0 136 39 175 192
AOPL4 0 0 100 94 194 222
AOPL5 0 0 13 23 36 41
APL1 25 10 0 0 35 36
APL2 69 38 0 0 107 109
APL3 69 68 5 3 145 162
APL4 29 46 7 13 94 103
APL5 17 28 5 11 61 75
APL6/SES 1 10 14 5 11 40 36
APL7/SES 2 2 7 3 5 17 12
APL8/SES 2 1 0 0 0 1 8
APL8/SES 3 0 3 0 0 3 2
CEO 0 1 0 0 1 1
Cadet 0 0 0 0 0 0
Total 222 215 322 226 985 1,087
Notes: Includes CEO, temporary staff and staff on leave without pay and long-term leave. Excludes attached agency staff , trade
consultants, contractors and TradeStart employees.
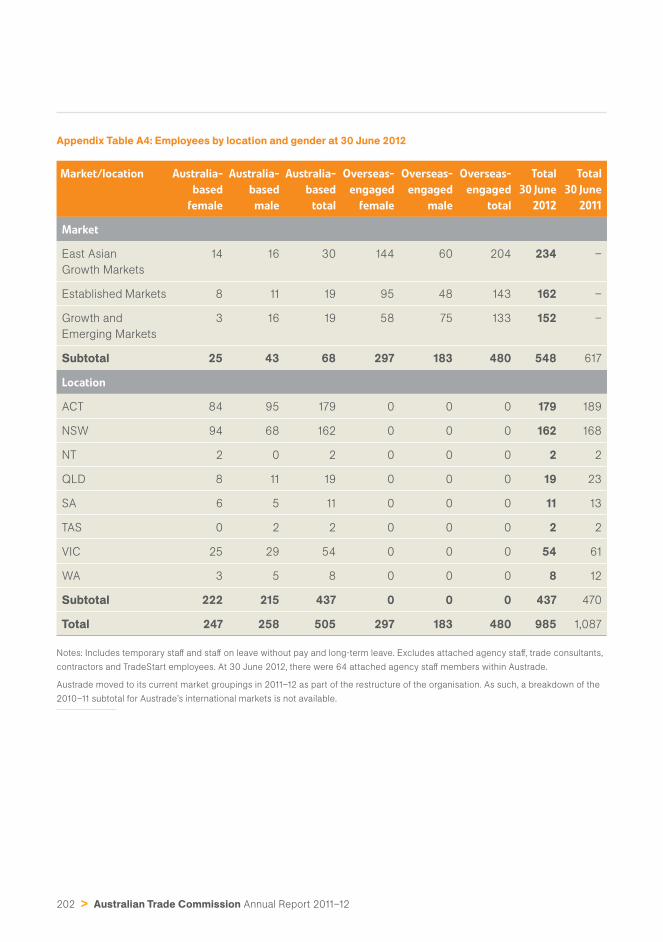
202 > Australian Trade Commission Annual Report 2011–12
Appendix Table A4: Employees by location and gender at 30 June 2012
Market/location Australia-
based
female
Australia-
based
male
Australia-
based
total
Overseas-
engaged
female
Overseas-
engaged
male
Overseas-
engaged
total
Total
30 June
2012
Total
30 June
2011
Market
East Asian
Growth Markets
14 16 30 144 60 204 234 –
Established Markets 8 11 19 95 48 143 162 –
Growth and
Emerging Markets
3 16 19 58 75 133 152 –
Subtotal 25 43 68 297 183 480 548 617
Location
ACT 84 95 179 0 0 0 179 189
NSW 94 68 162 0 0 0 162 168
NT 2 0 2 0 0 0 2 2
QLD 8 11 19 0 0 0 19 23
SA 6 5 11 0 0 0 11 13
TAS 0 2 2 0 0 0 2 2
VIC 25 29 54 0 0 0 54 61
WA 3 5 8 0 0 0 8 12
Subtotal 222 215 437 0 0 0 437 470
Total 247 258 505 297 183 480 985 1,087
Notes: Includes temporary staff and staff on leave without pay and long-term leave. Excludes attached agency staff , trade consultants,
contractors and TradeStart employees. At 30 June 2012, there were 64 attached agency staff members within Austrade.
Austrade moved to its current market groupings in 2011–12 as part of the restructure of the organisation. As such, a breakdown of the
2010–11 subtotal for Austrade’s international markets is not available.
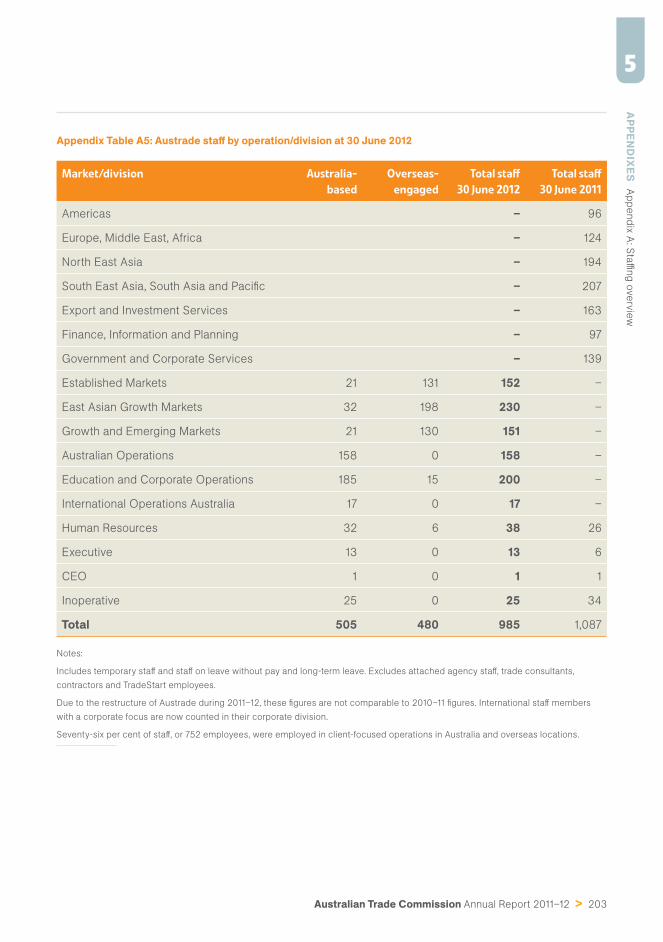
Australian Trade Commission Annual Report 2011–12 > 203
5A
PPEND
IXES
Ap
pend
ix A
: Sta
ffi ng o
verv
iew
Appendix Table A5: Austrade staff by operation/division at 30 June 2012
Market/division Australia-
based
Overseas-
engaged
Total staff
30 June 2012
Total staff
30 June 2011
Americas – 96
Europe, Middle East, Africa – 124
North East Asia – 194
South East Asia, South Asia and Pacifi c – 207
Export and Investment Services – 163
Finance, Information and Planning – 97
Government and Corporate Services – 139
Established Markets 21 131 152 –
East Asian Growth Markets 32 198 230 –
Growth and Emerging Markets 21 130 151 –
Australian Operations 158 0 158 –
Education and Corporate Operations 185 15 200 –
International Operations Australia 17 0 17 –
Human Resources 32 6 38 26
Executive 13 0 13 6
CEO 1 0 1 1
Inoperative 25 0 25 34
Total 505 480 985 1,087
Notes:
Includes temporary staff and staff on leave without pay and long-term leave. Excludes attached agency staff , trade consultants,
contractors and TradeStart employees.
Due to the restructure of Austrade during 2011–12, these fi gures are not comparable to 2010–11 fi gures. International staff members
with a corporate focus are now counted in their corporate division.
Seventy-six per cent of staff , or 752 employees, were employed in client-focused operations in Australia and overseas locations.
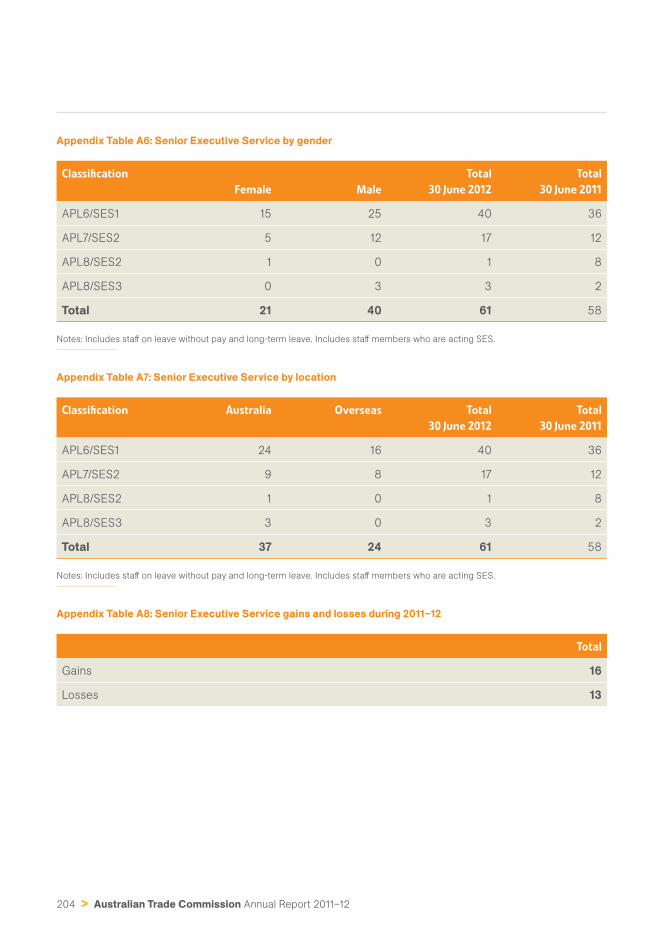
204 > Australian Trade Commission Annual Report 2011–12
Appendix Table A6: Senior Executive Service by gender
Classifi cation
Female Male
Total
30 June 2012
Total
30 June 2011
APL6/SES1 15 25 40 36
APL7/SES2 5 12 17 12
APL8/SES2 1 0 1 8
APL8/SES3 0 3 3 2
Total 21 40 61 58
Notes: Includes staff on leave without pay and long-term leave. Includes staff members who are acting SES.
Appendix Table A7: Senior Executive Service by location
Classifi cation Australia Overseas Total
30 June 2012
Total
30 June 2011
APL6/SES1 24 16 40 36
APL7/SES2 9 8 17 12
APL8/SES2 1 0 1 8
APL8/SES3 3 0 3 2
Total 37 24 61 58
Notes: Includes staff on leave without pay and long-term leave. Includes staff members who are acting SES.
Appendix Table A8: Senior Executive Service gains and losses during 2011–12
Total
Gains 16
Losses 13
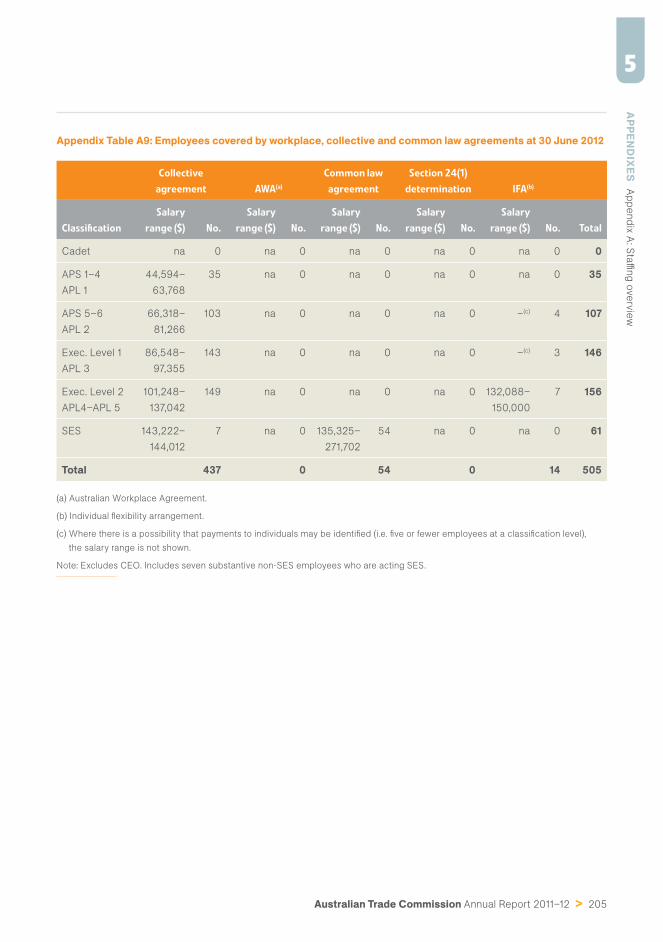
Australian Trade Commission Annual Report 2011–12 > 205
5A
PPEND
IXES
Ap
pend
ix A
: Sta
ffi ng o
verv
iew
Appendix Table A9: Employees covered by workplace, collective and common law agreements at 30 June 2012
Collective
agreement AWA(a)
Common law
agreement
Section 24(1)
determination IFA(b)
Classifi cation
Salary
range ($) No.
Salary
range ($) No.
Salary
range ($) No.
Salary
range ($) No.
Salary
range ($) No. Total
Cadet na 0 na 0 na 0 na 0 na 0 0
APS 1–4
APL 1
44,594–
63,768
35 na 0 na 0 na 0 na 0 35
APS 5–6
APL 2
66,318–
81,266
103 na 0 na 0 na 0 –(c) 4 107
Exec. Level 1
APL 3
86,548–
97,355
143 na 0 na 0 na 0 –(c) 3 146
Exec. Level 2
APL4–APL 5
101,248–
137,042
149 na 0 na 0 na 0 132,088–
150,000
7 156
SES 143,222–
144,012
7 na 0 135,325–
271,702
54 na 0 na 0 61
Total 437 0 54 0 14 505
(a) Australian Workplace Agreement.
(b) Individual fl exibility arrangement.
(c) Where there is a possibility that payments to individuals may be identifi ed (i.e. fi ve or fewer employees at a classifi cation level),
the salary range is not shown.
Note: Excludes CEO. Includes seven substantive non-SES employees who are acting SES.
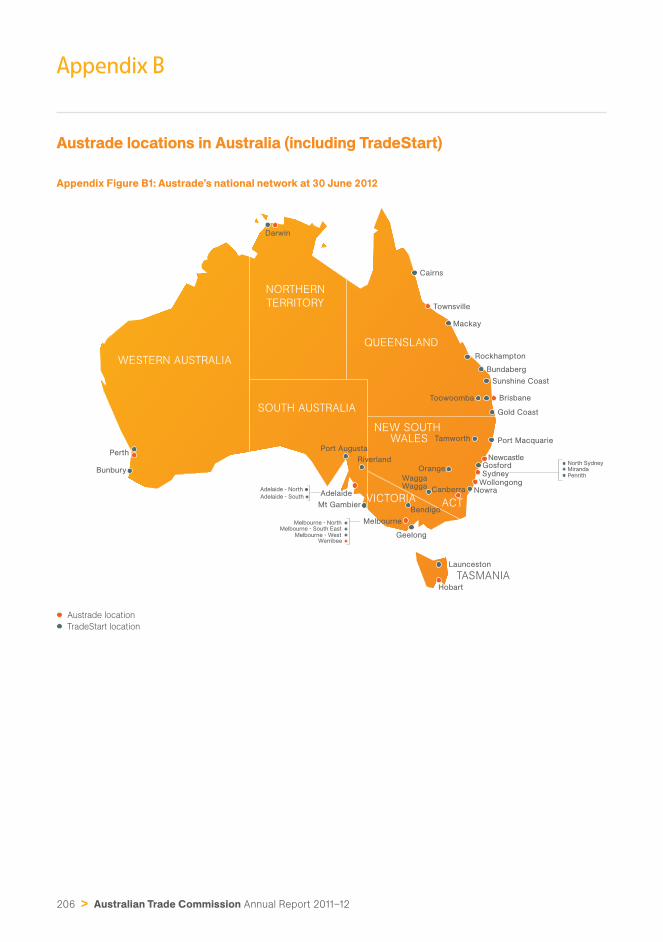
206 > Australian Trade Commission Annual Report 2011–12
Appendix B
Austrade locations in Australia (including TradeStart)
Appendix Figure B1: Austrade’s national network at 30 June 2012
ACTVICTORIA
WESTERN AUSTRALIA
NORTHERN
TERRITORY
QUEENSLAND
SOUTH AUSTRALIA
TASMANIA
NEW SOUTH WALES
Perth
Darwin
Townsville
Newcastle
Sydney
Wollongong
Adelaide
Melbourne
Canberra
Bunbury
Rockhampton
Cairns
Bundaberg
Nowra
GosfordOrange
WaggaWagga
Mt Gambier
Tamworth
Brisbane
Port Augusta
Sunshine Coast
Gold Coast
TradeStart location
Austrade location
Mackay
Riverland
Toowoomba
Port Macquarie
Adelaide - North
Adelaide - South
Launceston
MirandaNorth Sydney
Penrith
Melbourne - West
Melbourne - South East
Geelong
Bendigo
Werribee
Melbourne - North
Hobart
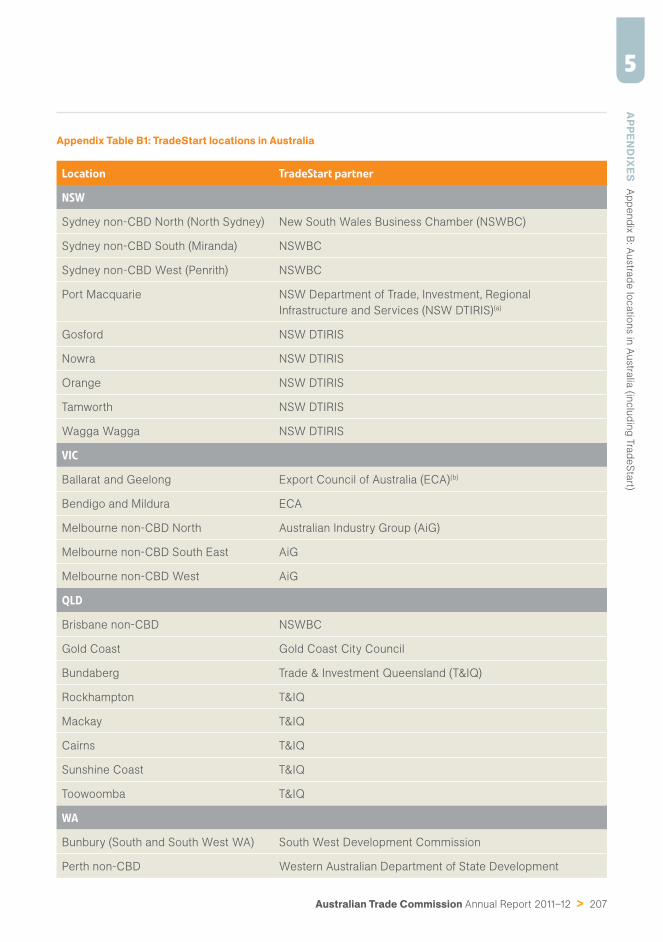
Australian Trade Commission Annual Report 2011–12 > 207
5A
PPEND
IXES
Ap
pend
ix B
: Austra
de lo
catio
ns in
Austra
lia (in
clu
din
g T
rad
eS
tart)
Appendix Table B1: TradeStart locations in Australia
Location TradeStart partner
NSW
Sydney non-CBD North (North Sydney) New South Wales Business Chamber (NSWBC)
Sydney non-CBD South (Miranda) NSWBC
Sydney non-CBD West (Penrith) NSWBC
Port Macquarie NSW Department of Trade, Investment, Regional
Infrastructure and Services (NSW DTIRIS)(a)
Gosford NSW DTIRIS
Nowra NSW DTIRIS
Orange NSW DTIRIS
Tamworth NSW DTIRIS
Wagga Wagga NSW DTIRIS
VIC
Ballarat and Geelong Export Council of Australia (ECA)(b)
Bendigo and Mildura ECA
Melbourne non-CBD North Australian Industry Group (AiG)
Melbourne non-CBD South East AiG
Melbourne non-CBD West AiG
QLD
Brisbane non-CBD NSWBC
Gold Coast Gold Coast City Council
Bundaberg Trade & Investment Queensland (T&IQ)
Rockhampton T&IQ
Mackay T&IQ
Cairns T&IQ
Sunshine Coast T&IQ
Toowoomba T&IQ
WA
Bunbury (South and South West WA) South West Development Commission
Perth non-CBD Western Australian Department of State Development
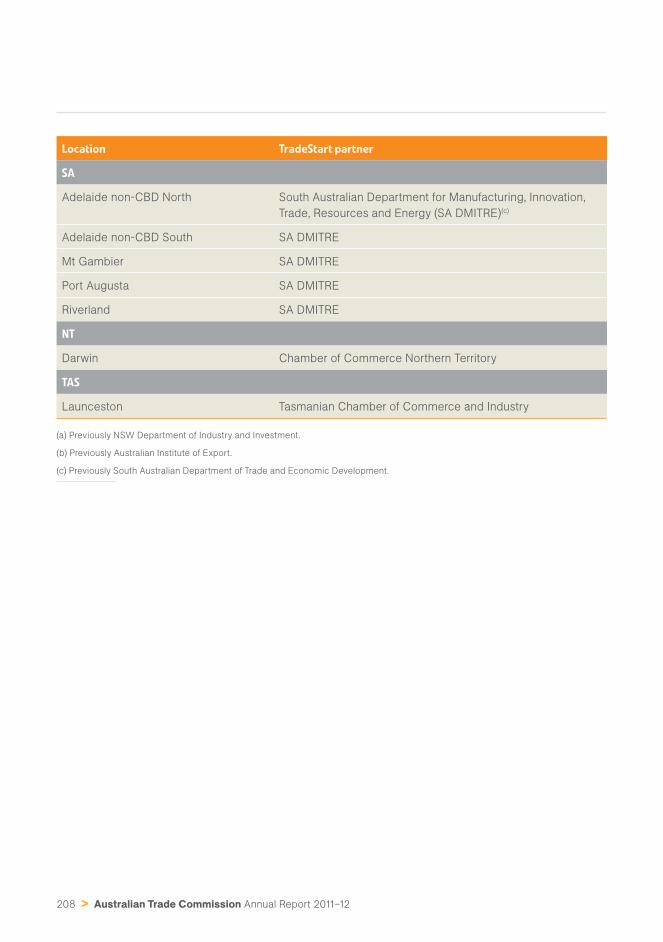
208 > Australian Trade Commission Annual Report 2011–12
Location TradeStart partner
SA
Adelaide non-CBD North South Australian Department for Manufacturing, Innovation,
Trade, Resources and Energy (SA DMITRE)(c)
Adelaide non-CBD South SA DMITRE
Mt Gambier SA DMITRE
Port Augusta SA DMITRE
Riverland SA DMITRE
NT
Darwin Chamber of Commerce Northern Territory
TAS
Launceston Tasmanian Chamber of Commerce and Industry
(a) Previously NSW Department of Industry and Investment.
(b) Previously Australian Institute of Export.
(c) Previously South Australian Department of Trade and Economic Development.
Australian Trade Commission Annual Report 2011–12 > 209
5Appendix C
APPEN
DIXES
A
pp
end
ix C
: Clie
nt S
erv
ice C
harte
r
Client Service Charter
Austrade’s Client Service Charter was
developed after consultations with our clients
and represents our commitment to improve
our service performance. The charter sets out
the service standards clients can expect from
Austrade and outlines how they can provide
feedback. Our clients rate our performance
against each service standard (stated below) in
our annual Client Service Improvement Study.
Our service values
› understand your business and
work with you in partnership
› provide advice and information based on
experience and networks we have established
across Australia and around the world
› be commercially focused and deliver
services that are tailored to your needs
› be professional and highly motivated
to help your business
› be fl exible and responsive in
meeting your particular needs.
Our service standards
› We value the information you give us
and will maintain confi dentiality.
› We will clearly explain our service off erings and
how they can add value to your export eff orts.
› Austrade will explain any fees and
provide you with a written quote before
commencing work on your behalf.
› If you contact us, we will respond within
two working days of receipt of your
enquiry. If your business enquiry is
more complex, we will inform you of our
progress. Austrade will agree with you on
timeframes, deliverables and follow-up.
› We will keep you informed of major
developments that aff ect your project.
› Austrade will endeavour to deliver opportunities
that best match your line of business.
› We will provide appropriate referrals
if Austrade cannot help you.
› Austrade will provide you with clear
information on eligibility and application and
assessment processes for our Export Market
Development Grants (EMDG) and will process
your application promptly and effi ciently in
accordance with the EMDG legislation.
210 > Australian Trade Commission Annual Report 2011–12
Help us to help you
› Brief us clearly about your products or
services and business objectives.
› Allow realistic lead times and keep us informed
of your timeframes for taking action.
› Let us know how we might improve our services
and/or when we have done a good job.
Measuring our performance
Austrade will review the charter and provide
opportunities for you to comment on your
satisfaction with our services through our
annual client satisfaction survey and other
research. This will allow us to measure the
outcome of our assistance and identify issues
and service aspects that are important to you.
Consultation and feedback
We welcome your feedback. Simply call us,
write to us or send us an email. If you have
a problem you need resolved, please raise it
with the staff member concerned or write to:
Client Service ManagerAustradeGPO Box 5301Sydney NSW 2001Email: [email protected]
If, at any stage, you are dissatisfi ed with our
handling of your complaint, you may contact
an offi ce of the Commonwealth Ombudsman
and/or the Privacy Commissioner.
Australian Trade Commission Annual Report 2011–12 > 211
5Appendix D
APPEN
DIXES
A
pp
end
ix D
: Wo
rk h
ealth
and s
afe
ty
Work health and safety
In accordance with subsection 74(1) of the
Occupational Health and Safety Act 1991
(OHS Act) and Schedule 2, Part 4 of the Work
Health and Safety Act 2011 (WHS Act), the annual
report is to include details of the following matters:
› initiatives taken during the year to ensure
the health, safety and welfare of workers
who carry out work for the entity
› health and safety outcomes (including
the impact on injury rates of workers)
achieved as a result of initiatives taken
during the year or previous initiatives
› statistics of any notifi able incidents of
which the entity becomes aware during
the year that arose out of the conduct of
businesses or undertakings by the entity
› any investigations conducted during the year
that relate to businesses or undertakings
conducted by the entity, including details
of all notices given to the entity during
the year under Part 10 of the WHS Act
› such other matters as are required by guidelines
approved on behalf of the Parliament by the
Joint Committee of Public Accounts and Audit.
Health and safety management arrangements
Austrade seeks at all times to provide a safe
and healthy working environment for employees
and others in Austrade workplaces. Austrade
employees have access to work health
and safety information from the Workplace
Support Adviser, human resources managers
and through the Austrade intranet.
Austrade also has a National Work Health
and Safety Committee which meets
quarterly and represents the work health
and safety interests of employees.
Health and safety initiatives and outcomes achieved
During the year, a number of management
initiatives were undertaken to reinforce
the work health and safety management
arrangements and improve the safety culture
across the organisation. These included:
› review of all fi rst aid offi cers to ensure that
certifi cation and training was up to date
› review of training requirements and
responsibilities for all health and safety
representatives nationally. Training on the
harmonisation of work health and safety
legislation was provided by Comcare
to health and safety representatives at
Austrade’s annual National Work Health
and Safety Committee meeting
212 > Australian Trade Commission Annual Report 2011–12
› briefi ng session delivered by Comcare to staff
in the Canberra offi ce to raise awareness of
legislative changes under the WHS Act
› workshop for the Senior Executive Group,
facilitated by a legal practitioner in work
health and safety, to explain the legal and
practical implications of the WHS Act, with
particular emphasis on the due diligence
framework requirements for offi cers under
the Act and the creation of an appropriate
work health and safety culture
› external audit and gap analysis of the Austrade
occupational health and safety management
system in preparation for the implementation
of work health and safety legislation that
came into eff ect on 1 January 2012
› review of work health and safety policies,
offi cer regime, reporting and consultation
arrangements to ensure full and proper
implementation of the WHS Act
› staff workshops at onshore and off shore
locations to enhance awareness of the
requirements of the WHS Act, particularly
in relation to the responsibilities of
offi cers and other workers, work health
and safety risk management and the
assessment of offi ce locations
› provision of work health and safety training
modules (for employees and managers)
in the Austrade online induction package,
with completion mandatory for all staff
› implementation of location work health and
safety assessments at offi ces worldwide to
raise awareness of the importance of work
health and safety, address hazards and risks,
and ensure full legislative compliance
› creation of online information resources
for offi cers and other workers to assist
them in understanding their legal
responsibilities under the WHS Act
› creation of online incident notifi cation and
reporting processes to meet legislative
requirements under the WHS Act
› four meetings of the National Work Health
and Safety Committee, held in line with health
and safety management arrangements
› provision of voluntary free health checks and
infl uenza vaccinations for Australia-based staff
› provision of ergonomic workstation
assessments for staff
› engagement of an external expert, as part
of Austrade’s enforceable undertaking,
to audit the existing work health and
safety management system and create
an enhanced, comprehensive and
integrated system for Austrade.
During the year, 24 work health and safety
incidents were reported to the Workplace
Support Unit in accordance with Austrade’s
incident notifi cation and reporting procedures.
Action was undertaken to assess all incidents
reported. The elimination or control of the
risks identifi ed was actioned to minimise
the risk of such incidents reoccurring.
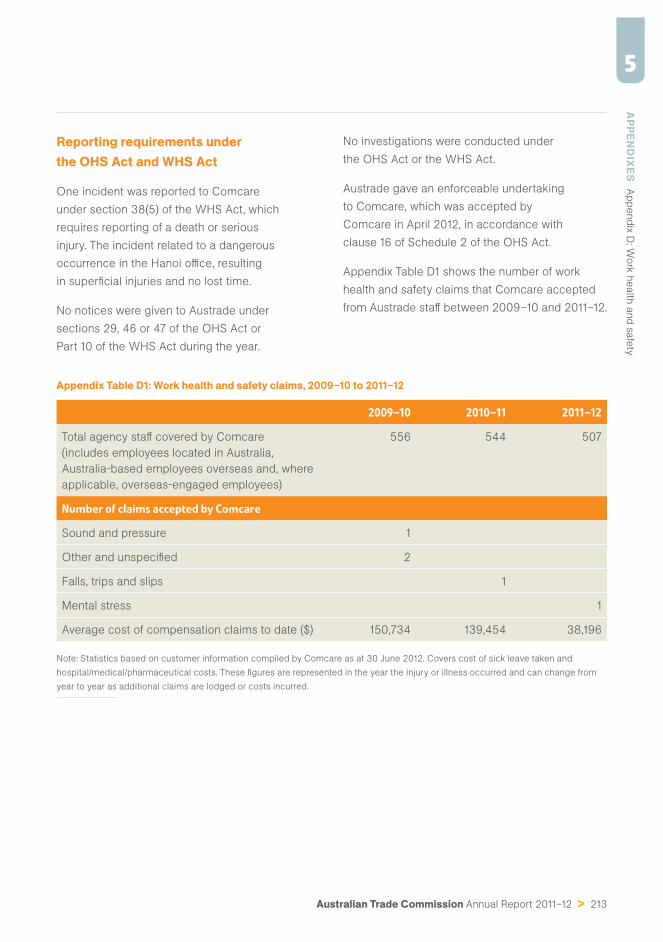
Australian Trade Commission Annual Report 2011–12 > 213
5A
PPEND
IXES
Ap
pend
ix D
: Wo
rk h
ealth
and s
afe
ty
Reporting requirements under the OHS Act and WHS Act
One incident was reported to Comcare
under section 38(5) of the WHS Act, which
requires reporting of a death or serious
injury. The incident related to a dangerous
occurrence in the Hanoi offi ce, resulting
in superfi cial injuries and no lost time.
No notices were given to Austrade under
sections 29, 46 or 47 of the OHS Act or
Part 10 of the WHS Act during the year.
No investigations were conducted under
the OHS Act or the WHS Act.
Austrade gave an enforceable undertaking
to Comcare, which was accepted by
Comcare in April 2012, in accordance with
clause 16 of Schedule 2 of the OHS Act.
Appendix Table D1 shows the number of work
health and safety claims that Comcare accepted
from Austrade staff between 2009–10 and 2011–12.
Appendix Table D1: Work health and safety claims, 2009–10 to 2011–12
2009–10 2010–11 2011–12
Total agency staff covered by Comcare
(includes employees located in Australia,
Australia-based employees overseas and, where
applicable, overseas-engaged employees)
556 544 507
Number of claims accepted by Comcare
Sound and pressure 1
Other and unspecifi ed 2
Falls, trips and slips 1
Mental stress 1
Average cost of compensation claims to date ($) 150,734 139,454 38,196
Note: Statistics based on customer information compiled by Comcare as at 30 June 2012. Covers cost of sick leave taken and
hospital/medical/pharmaceutical costs. These fi gures are represented in the year the injury or illness occurred and can change from
year to year as additional claims are lodged or costs incurred.
214 > Australian Trade Commission Annual Report 2011–12
Appendix E
Consultancies
Consultancies—selection and engagement
The methods of selection used for
consultancies are categorised as follows:
› open tender—a procurement procedure
in which a request for tender is published
inviting all businesses that satisfy the
conditions for participation to submit
tenders. Public tenders are generally
sought through the Australian Government
AusTender website, www.tenders.gov.au
› select tender—a procurement procedure in
which the procuring agency selects which
potential suppliers are invited to submit tenders
(this includes tenders submitted through multi-
use lists). This procurement process may only
be used under certain defi ned circumstances
› direct sourcing—a form of restricted tendering,
available only under certain defi ned
circumstances, with a single potential supplier
or suppliers being invited to bid because of
their unique expertise and/or their special ability
to supply the property and/or services sought
› panel—an arrangement under which a number
of suppliers, initially selected through an open
tender process, may each supply property and/
or services to an agency as specifi ed in the
panel arrangements. Quotes are sought from
suppliers that have prequalifi ed on the agency
panels to supply to the Government. This
category includes standing off ers and supplier
panels where the supply of property and/or
services may be provided for a predetermined
length of time, usually at a prearranged price.
Reasons for the use of external resources
The reasons for decisions to employ external
consultancy services vary and it is possible
that a consultancy might belong in more
than one category. Principal justifi cation is
based on the following classifi cations:
› A—skills currently unavailable within agency
› B—need for specialised or professional skills
› C—need for independent research or
assessment.
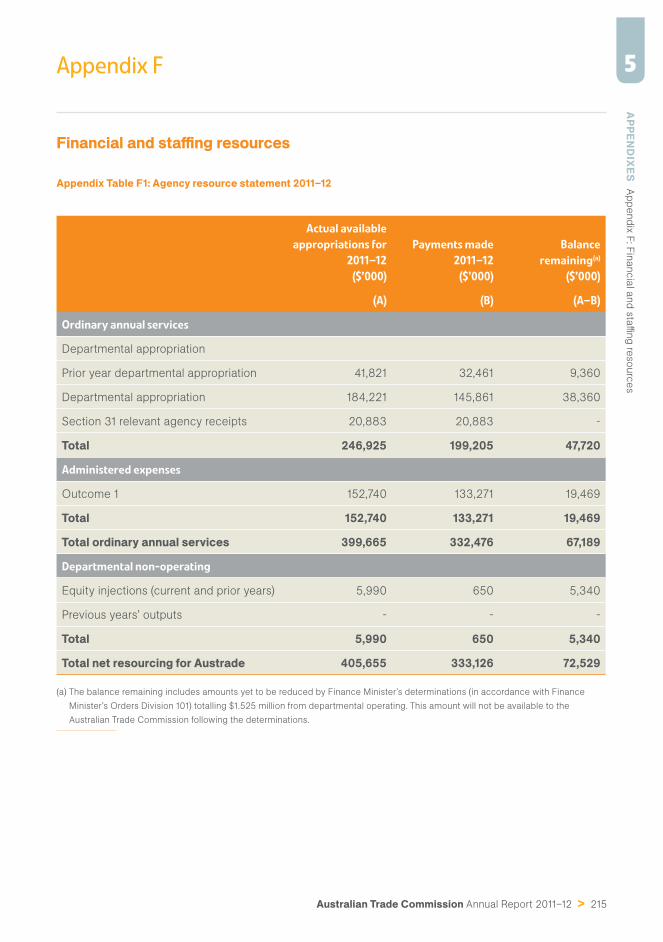
Australian Trade Commission Annual Report 2011–12 > 215
5Appendix F
APPEN
DIXES
A
pp
end
ix F
: Fin
ancia
l and s
taffi n
g re
so
urc
es
Financial and staffi ng resources
Appendix Table F1: Agency resource statement 2011–12
Actual available
appropriations for
2011–12
($’000)
Payments made
2011–12
($’000)
Balance
remaining(a)
($’000)
(A) (B) (A–B)
Ordinary annual services
Departmental appropriation
Prior year departmental appropriation 41,821 32,461 9,360
Departmental appropriation 184,221 145,861 38,360
Section 31 relevant agency receipts 20,883 20,883 -
Total 246,925 199,205 47,720
Administered expenses
Outcome 1 152,740 133,271 19,469
Total 152,740 133,271 19,469
Total ordinary annual services 399,665 332,476 67,189
Departmental non-operating
Equity injections (current and prior years) 5,990 650 5,340
Previous years’ outputs - - -
Total 5,990 650 5,340
Total net resourcing for Austrade 405,655 333,126 72,529
(a) The balance remaining includes amounts yet to be reduced by Finance Minister’s determinations (in accordance with Finance
Minister’s Orders Division 101) totalling $1.525 million from departmental operating. This amount will not be available to the
Australian Trade Commission following the determinations.
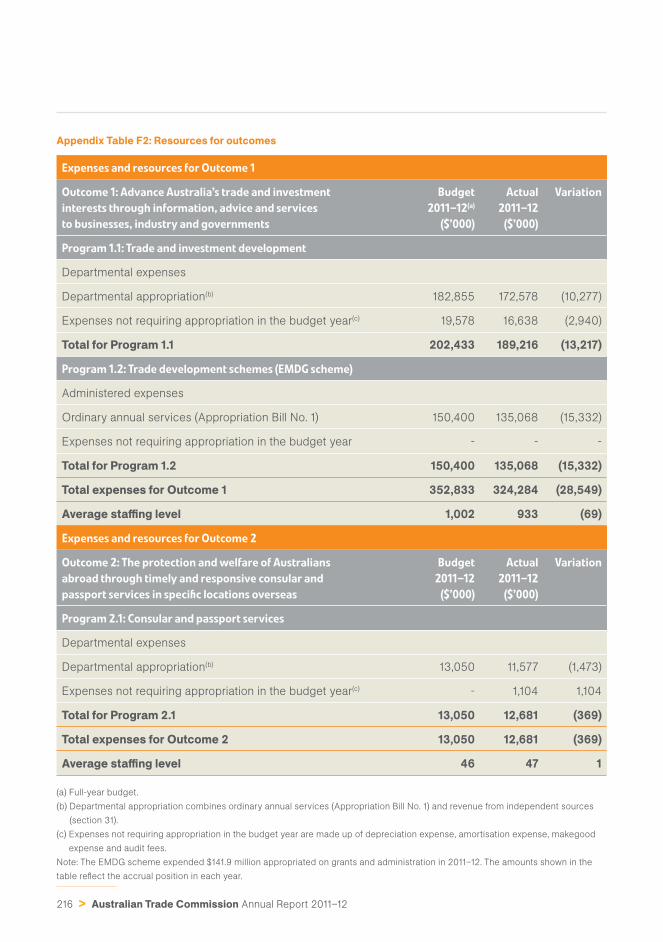
216 > Australian Trade Commission Annual Report 2011–12
Appendix Table F2: Resources for outcomes
Expenses and resources for Outcome 1
Outcome 1: Advance Australia’s trade and investment
interests through information, advice and services
to businesses, industry and governments
Budget
2011–12(a)
($’000)
Actual
2011–12
($’000)
Variation
Program 1.1: Trade and investment development
Departmental expenses
Departmental appropriation(b) 182,855 172,578 (10,277)
Expenses not requiring appropriation in the budget year(c) 19,578 16,638 (2,940)
Total for Program 1.1 202,433 189,216 (13,217)
Program 1.2: Trade development schemes (EMDG scheme)
Administered expenses
Ordinary annual services (Appropriation Bill No. 1) 150,400 135,068 (15,332)
Expenses not requiring appropriation in the budget year - - -
Total for Program 1.2 150,400 135,068 (15,332)
Total expenses for Outcome 1 352,833 324,284 (28,549)
Average staffi ng level 1,002 933 (69)
Expenses and resources for Outcome 2
Outcome 2: The protection and welfare of Australians
abroad through timely and responsive consular and
passport services in specifi c locations overseas
Budget
2011–12
($’000)
Actual
2011–12
($’000)
Variation
Program 2.1: Consular and passport services
Departmental expenses
Departmental appropriation(b) 13,050 11,577 (1,473)
Expenses not requiring appropriation in the budget year(c) - 1,104 1,104
Total for Program 2.1 13,050 12,681 (369)
Total expenses for Outcome 2 13,050 12,681 (369)
Average staffi ng level 46 47 1
(a) Full-year budget.
(b) Departmental appropriation combines ordinary annual services (Appropriation Bill No. 1) and revenue from independent sources
(section 31).
(c) Expenses not requiring appropriation in the budget year are made up of depreciation expense, amortisation expense, makegood
expense and audit fees.
Note: The EMDG scheme expended $141.9 million appropriated on grants and administration in 2011–12. The amounts shown in the
table refl ect the accrual position in each year.
Australian Trade Commission Annual Report 2011–12 > 217
5Appendix G
APPEN
DIXES
A
pp
end
ix G
: Eco
log
ically
susta
inab
le d
evelo
pm
ent a
nd e
nviro
nm
enta
l perfo
rmance
Ecologically sustainable development and environmental performance
Austrade is committed to identifying areas
of continuous improvement to support
ecologically sustainable business practices
across Austrade’s global footprint. Austrade’s
performance with respect to the requirements
of section 516A of the Environment Protection
and Biodiversity Conservation Act 1999 is
summarised below. Austrade’s results against
its energy effi ciency performance indicators
are outlined in Appendix Table G1.
Eff ects of Austrade’s activities on the environment
Austrade’s Environmental Working Group, with
representation from Austrade’s onshore and
off shore network, met twice during 2011–12.
The working group reviewed Austrade’s
environmental policy and considered
ecologically sustainable practices for
implementation across the agency’s network.
As a dispersed international organisation, Austrade
has actively sought opportunities for reduction
in travel throughout 2011–12, including through
greater use of technology-enabled communication
such as video and web conferencing. During
2011–12, a range of video and web conferencing
enhancements were implemented. In September
and October 2011, Austrade replaced 105 room-
based videoconference endpoints and
296 desktop computer videoconference clients.
During 2011–12, the videoconference network
was used for 49,000 hours, a 9 per cent increase
on the 44,743 hours recorded in 2010–11.
Energy effi ciency
Austrade reported energy consumption in its
Australian operations as required by the Energy
Effi ciency in Government Operations Policy.
The report entitled Energy use in the Australian
Government’s operations 2007–08, released
in December 2009, outlines the levels of
energy usage and emissions for the Australian
Government, at both a whole-of-government
and an individual agency level. During 2010–11,
Austrade’s total electrical energy consumption
as a tenant was 957,820 kilowatt hours, a
reduction of 100,890 kilowatt hours on 2009–10.
Austrade continued with existing approaches
to minimise its environmental impact, including
purchasing 10 per cent green power for its
computer centres in its Canberra offi ce, duplex
printing and copying as the default option,
and establishing recycling systems for a
range of offi ce supplies and consumables.
Austrade also updated its plan to optimise energy
effi ciency in its data centres (see page 123).
Earth Hour
Austrade coordinated the participation of
32 offi ces across Australia and overseas as part
of Earth Hour 2012. This was the third year of
global participation by Austrade, after having
previously participated within Australia. Where
practical, many of these offi ces switched off their
lights, printers and photocopiers for the weekend
of 31 March to 1 April 2012. Staff also received
advice on how they could participate personally in
Earth Hour as well as through their offi ce activity.
218 > Australian Trade Commission Annual Report 2011–12
Waste
Austrade’s Canberra offi ce has established
approaches for minimising its environmental
impact and reducing waste. These practices
include setting duplex printing and copying as the
default option and establishing recycling systems
within both the workspace and staff kitchens.
Building managers throughout the Austrade
network continue to work with building owners
to identify mechanisms to reduce waste
and implement better practice initiatives.
Water
Water consumption is more diffi cult to measure
on a broader scale for Austrade as most
Austrade tenancies are not separately metered
for water consumption. Where possible,
Austrade facility and property managers have
worked with building owners to install dual-
fl ush toilets and fl ow restrictors on taps.
Austrade Head Offi ce – Sydney
In December 2011, Austrade’s head offi ce in
Sydney confi rmed environmental sustainability
activities related to carpet care and maintenance
had saved 7,438 litres of water, 1,041 megajoules
of energy and 0.37 tonnes of CO2 for the year. This
equates to a total saving of 44,452 litres of water,
6,222 megajoules of energy and 2.18 tonnes of
CO2 saved for the six years from 2006 to 2011.
Principles of ecologically sustainable development
Austrade operates under the Australian Trade
Commission Act 1985 and administers the
Export Market Development Grants scheme
pursuant to the Export Market Development
Grants Act 1997. While neither Act makes
specifi c reference to ecologically sustainable
development or sustainability principles, Austrade
adheres to government policy and ministerial
directives in accordance with the principles
of ecologically sustainable development.
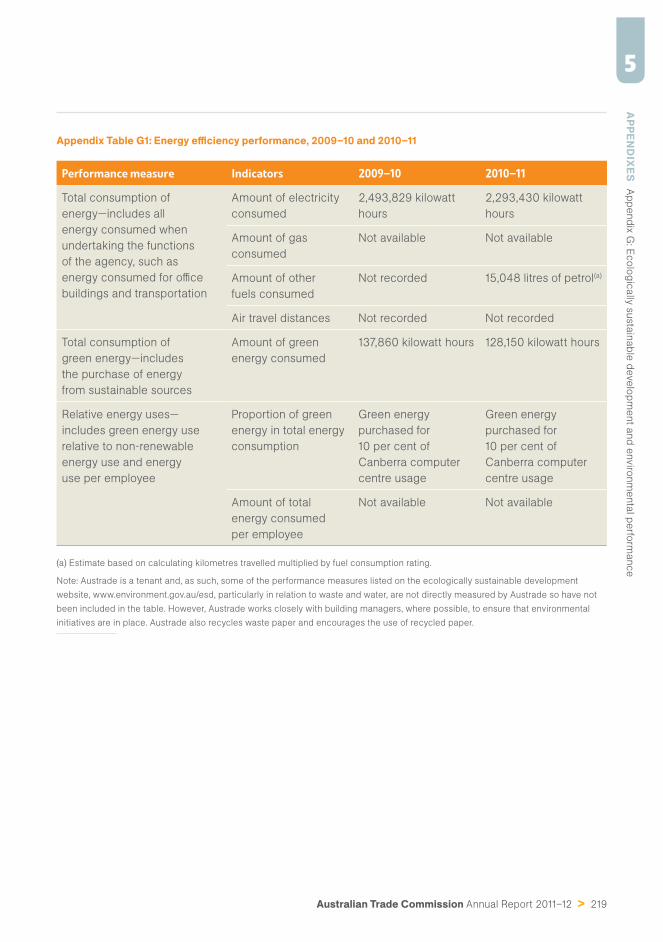
Australian Trade Commission Annual Report 2011–12 > 219
5A
PPEND
IXES
Ap
pend
ix G
: Eco
log
ically
susta
inab
le d
evelo
pm
ent a
nd e
nviro
nm
enta
l perfo
rmance
Appendix Table G1: Energy effi ciency performance, 2009–10 and 2010–11
Performance measure Indicators 2009–10 2010–11
Total consumption of
energy—includes all
energy consumed when
undertaking the functions
of the agency, such as
energy consumed for offi ce
buildings and transportation
Amount of electricity
consumed
2,493,829 kilowatt
hours
2,293,430 kilowatt
hours
Amount of gas
consumed
Not available Not available
Amount of other
fuels consumed
Not recorded 15,048 litres of petrol(a)
Air travel distances Not recorded Not recorded
Total consumption of
green energy—includes
the purchase of energy
from sustainable sources
Amount of green
energy consumed
137,860 kilowatt hours 128,150 kilowatt hours
Relative energy uses—
includes green energy use
relative to non-renewable
energy use and energy
use per employee
Proportion of green
energy in total energy
consumption
Green energy
purchased for
10 per cent of
Canberra computer
centre usage
Green energy
purchased for
10 per cent of
Canberra computer
centre usage
Amount of total
energy consumed
per employee
Not available Not available
(a) Estimate based on calculating kilometres travelled multiplied by fuel consumption rating.
Note: Austrade is a tenant and, as such, some of the performance measures listed on the ecologically sustainable development
website, www.environment.gov.au/esd, particularly in relation to waste and water, are not directly measured by Austrade so have not
been included in the table. However, Austrade works closely with building managers, where possible, to ensure that environmental
initiatives are in place. Austrade also recycles waste paper and encourages the use of recycled paper.
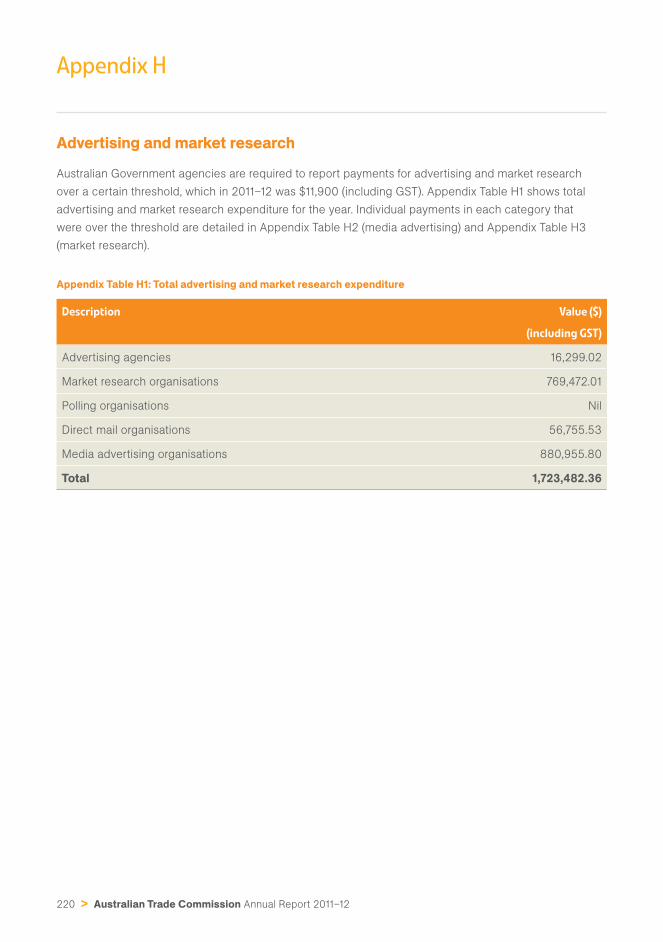
220 > Australian Trade Commission Annual Report 2011–12
Appendix H
Advertising and market research
Australian Government agencies are required to report payments for advertising and market research
over a certain threshold, which in 2011–12 was $11,900 (including GST). Appendix Table H1 shows total
advertising and market research expenditure for the year. Individual payments in each category that
were over the threshold are detailed in Appendix Table H2 (media advertising) and Appendix Table H3
(market research).
Appendix Table H1: Total advertising and market research expenditure
Description Value ($)
(including GST)
Advertising agencies 16,299.02
Market research organisations 769,472.01
Polling organisations Nil
Direct mail organisations 56,755.53
Media advertising organisations 880,955.80
Total 1,723,482.36
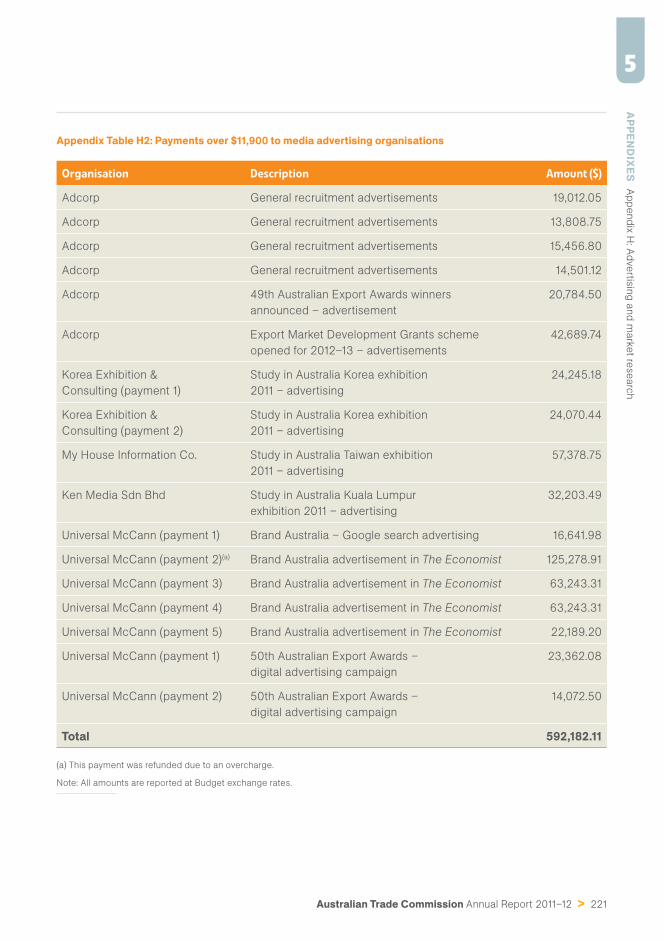
Australian Trade Commission Annual Report 2011–12 > 221
5A
PPEND
IXES
Ap
pend
ix H
: Ad
vertis
ing a
nd m
ark
et re
searc
h
Appendix Table H2: Payments over $11,900 to media advertising organisations
Organisation Description Amount ($)
Adcorp General recruitment advertisements 19,012.05
Adcorp General recruitment advertisements 13,808.75
Adcorp General recruitment advertisements 15,456.80
Adcorp General recruitment advertisements 14,501.12
Adcorp 49th Australian Export Awards winners
announced – advertisement
20,784.50
Adcorp Export Market Development Grants scheme
opened for 2012–13 – advertisements
42,689.74
Korea Exhibition &
Consulting (payment 1)
Study in Australia Korea exhibition
2011 – advertising
24,245.18
Korea Exhibition &
Consulting (payment 2)
Study in Australia Korea exhibition
2011 – advertising
24,070.44
My House Information Co. Study in Australia Taiwan exhibition
2011 – advertising
57,378.75
Ken Media Sdn Bhd Study in Australia Kuala Lumpur
exhibition 2011 – advertising
32,203.49
Universal McCann (payment 1) Brand Australia – Google search advertising 16,641.98
Universal McCann (payment 2)(a) Brand Australia advertisement in The Economist 125,278.91
Universal McCann (payment 3) Brand Australia advertisement in The Economist 63,243.31
Universal McCann (payment 4) Brand Australia advertisement in The Economist 63,243.31
Universal McCann (payment 5) Brand Australia advertisement in The Economist 22,189.20
Universal McCann (payment 1) 50th Australian Export Awards –
digital advertising campaign
23,362.08
Universal McCann (payment 2) 50th Australian Export Awards –
digital advertising campaign
14,072.50
Total 592,182.11
(a) This payment was refunded due to an overcharge.
Note: All amounts are reported at Budget exchange rates.
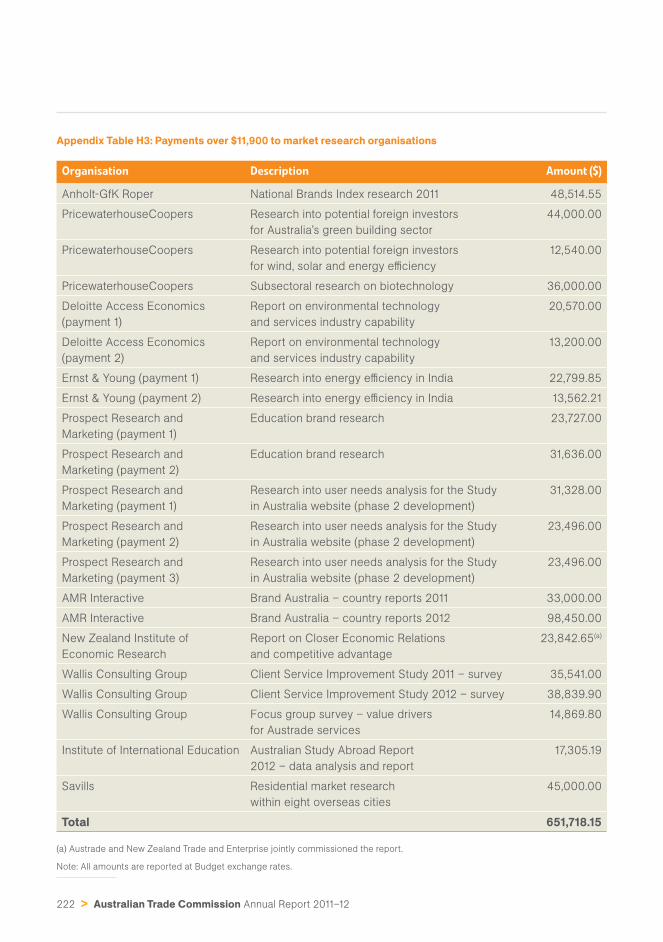
222 > Australian Trade Commission Annual Report 2011–12
Appendix Table H3: Payments over $11,900 to market research organisations
Organisation Description Amount ($)
Anholt-GfK Roper National Brands Index research 2011 48,514.55
PricewaterhouseCoopers Research into potential foreign investors
for Australia’s green building sector
44,000.00
PricewaterhouseCoopers Research into potential foreign investors
for wind, solar and energy effi ciency
12,540.00
PricewaterhouseCoopers Subsectoral research on biotechnology 36,000.00
Deloitte Access Economics
(payment 1)
Report on environmental technology
and services industry capability
20,570.00
Deloitte Access Economics
(payment 2)
Report on environmental technology
and services industry capability
13,200.00
Ernst & Young (payment 1) Research into energy effi ciency in India 22,799.85
Ernst & Young (payment 2) Research into energy effi ciency in India 13,562.21
Prospect Research and
Marketing (payment 1)
Education brand research 23,727.00
Prospect Research and
Marketing (payment 2)
Education brand research 31,636.00
Prospect Research and
Marketing (payment 1)
Research into user needs analysis for the Study
in Australia website (phase 2 development)
31,328.00
Prospect Research and
Marketing (payment 2)
Research into user needs analysis for the Study
in Australia website (phase 2 development)
23,496.00
Prospect Research and
Marketing (payment 3)
Research into user needs analysis for the Study
in Australia website (phase 2 development)
23,496.00
AMR Interactive Brand Australia – country reports 2011 33,000.00
AMR Interactive Brand Australia – country reports 2012 98,450.00
New Zealand Institute of
Economic Research
Report on Closer Economic Relations
and competitive advantage
23,842.65(a)
Wallis Consulting Group Client Service Improvement Study 2011 – survey 35,541.00
Wallis Consulting Group Client Service Improvement Study 2012 – survey 38,839.90
Wallis Consulting Group Focus group survey – value drivers
for Austrade services
14,869.80
Institute of International Education Australian Study Abroad Report
2012 – data analysis and report
17,305.19
Savills Residential market research
within eight overseas cities
45,000.00
Total 651,718.15
(a) Austrade and New Zealand Trade and Enterprise jointly commissioned the report.
Note: All amounts are reported at Budget exchange rates.
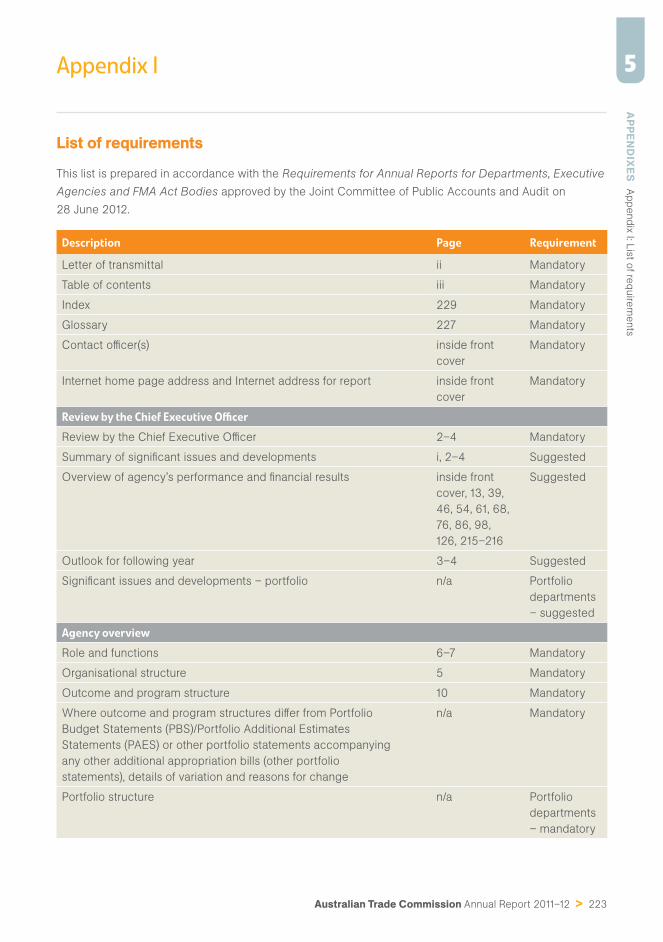
Australian Trade Commission Annual Report 2011–12 > 223
5Appendix I
APPEN
DIXES
A
pp
end
ix I: L
ist o
f req
uire
ments
List of requirements
This list is prepared in accordance with the Requirements for Annual Reports for Departments, Executive
Agencies and FMA Act Bodies approved by the Joint Committee of Public Accounts and Audit on
28 June 2012.
Description Page Requirement
Letter of transmittal ii Mandatory
Table of contents iii Mandatory
Index 229 Mandatory
Glossary 227 Mandatory
Contact offi cer(s) inside front
cover
Mandatory
Internet home page address and Internet address for report inside front
cover
Mandatory
Review by the Chief Executive Offi cer
Review by the Chief Executive Offi cer 2–4 Mandatory
Summary of signifi cant issues and developments i, 2–4 Suggested
Overview of agency’s performance and fi nancial results inside front
cover, 13, 39,
46, 54, 61, 68,
76, 86, 98,
126, 215–216
Suggested
Outlook for following year 3–4 Suggested
Signifi cant issues and developments – portfolio n/a Portfolio
departments
– suggested
Agency overview
Role and functions 6–7 Mandatory
Organisational structure 5 Mandatory
Outcome and program structure 10 Mandatory
Where outcome and program structures diff er from Portfolio
Budget Statements (PBS)/Portfolio Additional Estimates
Statements (PAES) or other portfolio statements accompanying
any other additional appropriation bills (other portfolio
statements), details of variation and reasons for change
n/a Mandatory
Portfolio structure n/a Portfolio
departments
– mandatory
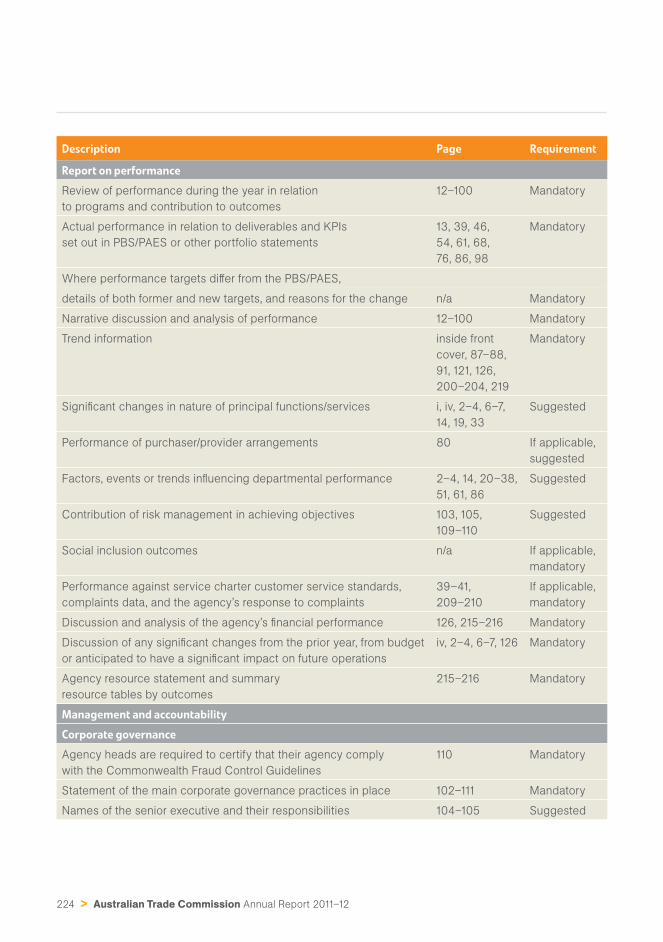
224 > Australian Trade Commission Annual Report 2011–12
Description Page Requirement
Report on performance
Review of performance during the year in relation
to programs and contribution to outcomes
12–100 Mandatory
Actual performance in relation to deliverables and KPIs
set out in PBS/PAES or other portfolio statements
13, 39, 46,
54, 61, 68,
76, 86, 98
Mandatory
Where performance targets diff er from the PBS/PAES,
details of both former and new targets, and reasons for the change n/a Mandatory
Narrative discussion and analysis of performance 12–100 Mandatory
Trend information inside front
cover, 87–88,
91, 121, 126,
200–204, 219
Mandatory
Signifi cant changes in nature of principal functions/services i, iv, 2–4, 6–7,
14, 19, 33
Suggested
Performance of purchaser/provider arrangements 80 If applicable,
suggested
Factors, events or trends infl uencing departmental performance 2–4, 14, 20–38,
51, 61, 86
Suggested
Contribution of risk management in achieving objectives 103, 105,
109–110
Suggested
Social inclusion outcomes n/a If applicable,
mandatory
Performance against service charter customer service standards,
complaints data, and the agency’s response to complaints
39–41,
209–210
If applicable,
mandatory
Discussion and analysis of the agency’s fi nancial performance 126, 215–216 Mandatory
Discussion of any signifi cant changes from the prior year, from budget
or anticipated to have a signifi cant impact on future operations
iv, 2–4, 6–7, 126 Mandatory
Agency resource statement and summary
resource tables by outcomes
215–216 Mandatory
Management and accountability
Corporate governance
Agency heads are required to certify that their agency comply
with the Commonwealth Fraud Control Guidelines
110 Mandatory
Statement of the main corporate governance practices in place 102–111 Mandatory
Names of the senior executive and their responsibilities 104–105 Suggested
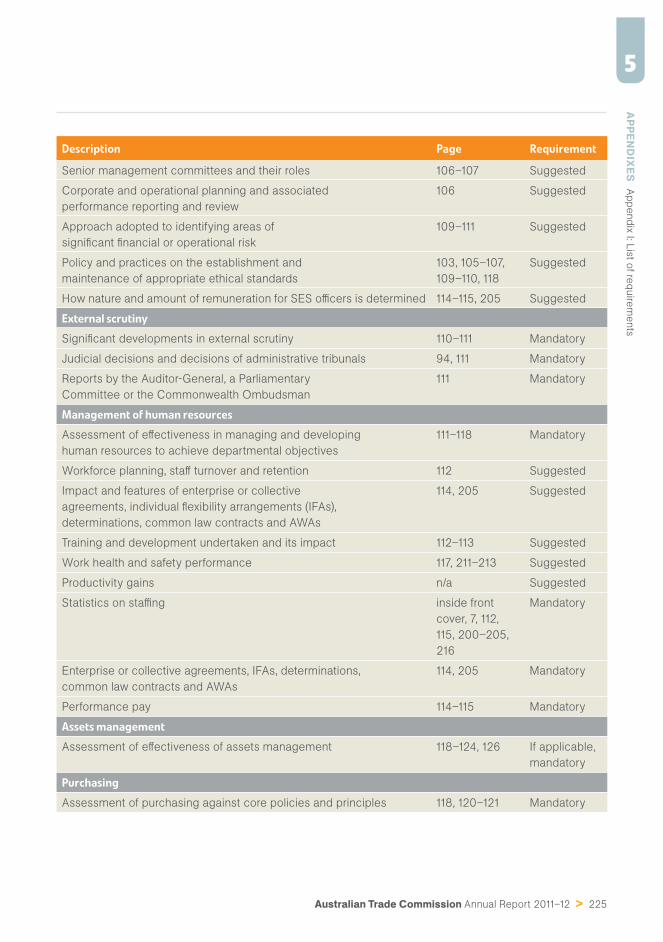
Australian Trade Commission Annual Report 2011–12 > 225
5A
PPEND
IXES
Ap
pend
ix I: L
ist o
f req
uire
ments
Description Page Requirement
Senior management committees and their roles 106–107 Suggested
Corporate and operational planning and associated
performance reporting and review
106 Suggested
Approach adopted to identifying areas of
signifi cant fi nancial or operational risk
109–111 Suggested
Policy and practices on the establishment and
maintenance of appropriate ethical standards
103, 105–107,
109–110, 118
Suggested
How nature and amount of remuneration for SES offi cers is determined 114–115, 205 Suggested
External scrutiny
Signifi cant developments in external scrutiny 110–111 Mandatory
Judicial decisions and decisions of administrative tribunals 94, 111 Mandatory
Reports by the Auditor-General, a Parliamentary
Committee or the Commonwealth Ombudsman
111 Mandatory
Management of human resources
Assessment of eff ectiveness in managing and developing
human resources to achieve departmental objectives
111–118 Mandatory
Workforce planning, staff turnover and retention 112 Suggested
Impact and features of enterprise or collective
agreements, individual fl exibility arrangements (IFAs),
determinations, common law contracts and AWAs
114, 205 Suggested
Training and development undertaken and its impact 112–113 Suggested
Work health and safety performance 117, 211–213 Suggested
Productivity gains n/a Suggested
Statistics on staffi ng inside front
cover, 7, 112,
115, 200–205,
216
Mandatory
Enterprise or collective agreements, IFAs, determinations,
common law contracts and AWAs
114, 205 Mandatory
Performance pay 114–115 Mandatory
Assets management
Assessment of eff ectiveness of assets management 118–124, 126 If applicable,
mandatory
Purchasing
Assessment of purchasing against core policies and principles 118, 120–121 Mandatory
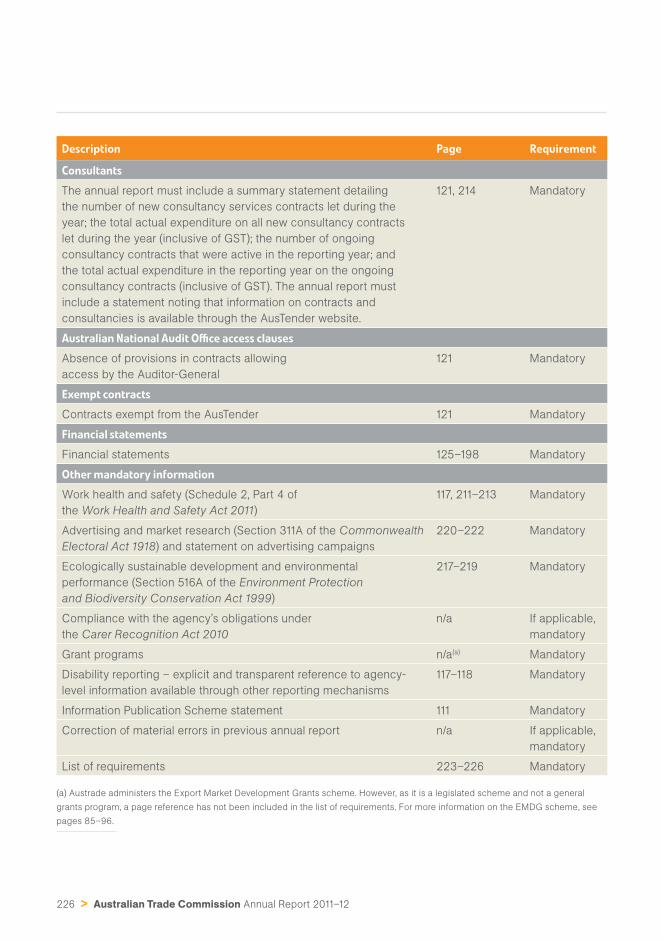
226 > Australian Trade Commission Annual Report 2011–12
Description Page Requirement
Consultants
The annual report must include a summary statement detailing
the number of new consultancy services contracts let during the
year; the total actual expenditure on all new consultancy contracts
let during the year (inclusive of GST); the number of ongoing
consultancy contracts that were active in the reporting year; and
the total actual expenditure in the reporting year on the ongoing
consultancy contracts (inclusive of GST). The annual report must
include a statement noting that information on contracts and
consultancies is available through the AusTender website.
121, 214 Mandatory
Australian National Audit Offi ce access clauses
Absence of provisions in contracts allowing
access by the Auditor-General
121 Mandatory
Exempt contracts
Contracts exempt from the AusTender 121 Mandatory
Financial statements
Financial statements 125–198 Mandatory
Other mandatory information
Work health and safety (Schedule 2, Part 4 of
the Work Health and Safety Act 2011)
117, 211–213 Mandatory
Advertising and market research (Section 311A of the Commonwealth
Electoral Act 1918) and statement on advertising campaigns
220–222 Mandatory
Ecologically sustainable development and environmental
performance (Section 516A of the Environment Protection
and Biodiversity Conservation Act 1999)
217–219 Mandatory
Compliance with the agency’s obligations under
the Carer Recognition Act 2010
n/a If applicable,
mandatory
Grant programs n/a(a) Mandatory
Disability reporting – explicit and transparent reference to agency-
level information available through other reporting mechanisms
117–118 Mandatory
Information Publication Scheme statement 111 Mandatory
Correction of material errors in previous annual report n/a If applicable,
mandatory
List of requirements 223–226 Mandatory
(a) Austrade administers the Export Market Development Grants scheme. However, as it is a legislated scheme and not a general
grants program, a page reference has not been included in the list of requirements. For more information on the EMDG scheme, see
pages 85–96.
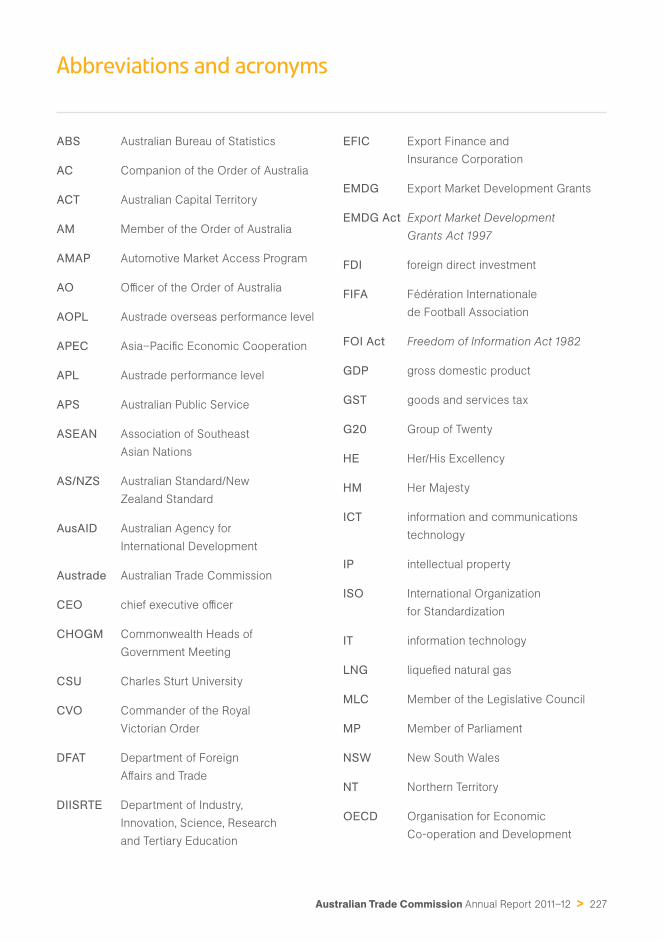
Australian Trade Commission Annual Report 2011–12 > 227
Abbreviations and acronyms
ABS Australian Bureau of Statistics
AC Companion of the Order of Australia
ACT Australian Capital Territory
AM Member of the Order of Australia
AMAP Automotive Market Access Program
AO Offi cer of the Order of Australia
AOPL Austrade overseas performance level
APEC Asia–Pacifi c Economic Cooperation
APL Austrade performance level
APS Australian Public Service
ASEAN Association of Southeast
Asian Nations
AS/NZS Australian Standard/New
Zealand Standard
AusAID Australian Agency for
International Development
Austrade Australian Trade Commission
CEO chief executive offi cer
CHOGM Commonwealth Heads of
Government Meeting
CSU Charles Sturt University
CVO Commander of the Royal
Victorian Order
DFAT Department of Foreign
Aff airs and Trade
DIISRTE Department of Industry,
Innovation, Science, Research
and Tertiary Education
EFIC Export Finance and
Insurance Corporation
EMDG Export Market Development Grants
EMDG Act Export Market Development
Grants Act 1997
FDI foreign direct investment
FIFA Fédération Internationale
de Football Association
FOI Act Freedom of Information Act 1982
GDP gross domestic product
GST goods and services tax
G20 Group of Twenty
HE Her/His Excellency
HM Her Majesty
ICT information and communications
technology
IP intellectual property
ISO International Organization
for Standardization
IT information technology
LNG liquefi ed natural gas
MLC Member of the Legislative Council
MP Member of Parliament
NSW New South Wales
NT Northern Territory
OECD Organisation for Economic
Co-operation and Development
228 > Australian Trade Commission Annual Report 2011–12
OHS Act Occupational Health and
Safety Act 1991
PC Privy Councillor
PNG Papua New Guinea
QC Queen’s Counsel
QLD Queensland
R&D research and development
RMB renminbi
RSS really simple syndication
SA South Australia
SC Senior Counsel
SME small to medium-sized enterprise
TAFE technical and further education
TAS Tasmania
TESOL teaching English to speakers
of other languages
UAE United Arab Emirates
US United States (of America)
VIC Victoria
WA Western Australia
WHS Act Work Health and Safety Act 2011
WIGB Women in Global Business
Australian Trade Commission Annual Report 2011–12 > 229
Index
A
Administrative Appeals Tribunal, 94
Administrative Appeals Tribunal Act 1975, 120
Advanced Polymer Technology, 15
advertising, 220–1
Africa, 2, 31, 73, 74, 77. see also North Africa;
South Africa; Sub-Saharan Africa; West Africa
Agency Risk Management Plan 2011–12, 109
agribusiness sector, 16, 28–30
Agricultural Emergency Plan, 77
Agwest International, 29
AirAsia, 95
alumni events, 31, 46, 48, 53, 70
Annual Procurement Plan, 121
annual reports, 118, 121, 223–6
anti-bribery. see bribery and corruption
APEC Leaders Week, 82
APS Statistical Bulletin, 118
ASEAN, 22
markets, 33
Asialink Leaders Program, 112
Asian Games, 15
Asian market opportunities and barriers: audit of
potential trade into Asia and other markets, 79
Association of Southeast Asian Nations (ASEAN).
see ASEAN
Attorney-General’s Department, 120
Audit and Risk Committee, 102, 105, 107, 109,
110, 111
Auditor-General, 111
audits, 109, 110–11, 121, 127–8, 211, 212, 223
AusAID, 31, 58, 77, 103
Austcham–Austrade Australian Business
Promotion Award, 60
AusTender, 121
Austin, 122
Austrade Direct, 40
Austrade Employee Collective Agreement, 114
Austrade Enterprise Agreement 2012–2014, 114
Austrade Student Centre website. see Study in
Australia website
Austrade Studies Assistance scheme, 113
Australia and New Zealand School of Government,
Institute for Governance, iv, 102
Australia–China Alumni Association, 53
Australia–China Alumni Awards, 46, 48
Australia–China Careers Fair, Shanghai, 20, 53
Australia–China 2.0 trade mission, i, 20, 60, 71, 72,
76, 77
Australia–China Wanwu Eco-country initiative, 58
Australia Day Achievement Medallions, 115, 116
Australia–Europe Brief, 71
Australia–Germany Solar Future Forum, Berlin, 58
Australia Gulf Council, 28, 76, 78
Australia in the Asian Century Reference Group,
76, 78
Australia in the Asian Century White Paper, 78
Australia–Japan–Vietnam trilateral business
mission, 33
Australia Lounge, 32
Australia–Malaysia Logistics Roundtable, 24
Australia Unlimited brand, i, 3, 4, 6, 12, 15, 38, 68,
69, 71
Australia Unlimited iPad magazine, i, 68, 69–70,
71, 73, 75, 116
Australian Advanced Remediation Group, 58
Australian Agency for International Development.
see AusAID
Australian Automotive Aftermarket Association, 35
Australian Automotive Week, 34
Australian Commercial Galleries Association’s
exhibition, Seoul, 71
Australian Education International, 49, 51, 80
Australian Export Awards (49th), 71, 73–4
Australian Government Information Management
Offi ce, 124
Australian High Commission, Wellington, 100
Australian Industry Group, 26
Australian International Marine Export Group, 25, 70
Australian National Audit Offi ce (ANAO), 110, 111, 121
Australian Public Service, code of conduct, 109
Australian Public Service Commission, 117
Career Development Assessment Centre, 113
230 > Australian Trade Commission Annual Report 2011–12
Australian Renewable Energy Agency, 59
Australian Scientifi c Instruments (ASI), 30
Australian Solar Institute, 58
Australian standards, 110
Australian Suppliers Database, 42
Australian Taxation Offi ce, 44, 103
Australian Tourism Investment Guide, 67
Australian Trade Commission Act 1985, 6, 104,
110, 218
Australian Water Association, 58
Australia’s reputation, 69
Automotive Market Access Program (AMAP), 3, 12,
21, 54–5, 56
automotive sector, 21, 34–5, 54–6
aviation alternative fuels, 57–8
awards
export, 71, 73–4
staff , 115–17
B
Bahrain, 28
BCI Performance Warehouse, 34
Belgium, 37
Book Industry Strategy Group, 77
Brand Australia. see Australia Unlimited brand
Brazil, 2, 4, 15, 19, 26–7, 78, 82, 119
bribery and corruption, 4, 12, 103, 108–10, 112,
116, 120
briefi ngs. see parliamentary inquiries and briefi ngs
Brunei, 18
Budget, 2011–12, 2, 10, 86, 93, 108, 126, 216
Building Brand Australia program, i, 3, 4, 6, 38, 47,
68, 69, 70
Business Advisory Group, 107
business assurance, 118
business continuity plans, 119
business systems, 122
Buy Australian at Home and Abroad, 13, 25, 77
C
call centres, 123
Canada, 35
capability, 112
Capability Framework 2011–12, 112–13
Career Development Assessment Centre, 113
Central Europe, 30
Charles Sturt University (CSU), 45
Chief Executive Offi cer (CEO), 104, 118
instructions, 109
report, 2–4
Chief Finance Offi cer’s report, 126
Chile, 13, 17, 18, 24, 25, 26, 82
China, 14, 16, 18, 19, 20, 32, 42, 45, 46, 53, 54, 55
Clean Energy and Environment Export Directory, 57
clean energy and environment sector, 56–60
Clean Energy Finance Corporation, 59
Clean Energy Future
briefi ng series, 59
plan, 57, 59
Clean Energy Trade and Investment Strategy, 3, 12,
54, 56–7
Clean Power Asia conference, Bali, 58
clean technology seminars, 21
client service, 40, 94
Client Service Charter, 40, 209
Client Service Improvement Study, 2011–12,
39–40, 106
codes of conduct, 109
collaboration with state and territory governments, 79
Colombia, iv, 2, 4, 13, 19, 25, 26, 27, 78, 82, 120
Commonwealth Business Forum, 68, 75
Commonwealth Disability Strategy, 118. see also
National Disability Strategy
Commonwealth Financial Management
Framework, 103
Commonwealth of Independent States, 29
Community and Public Sector Union, 114
Comscentre, 95
Confederation of Indian Industries’ Green Building
Centre, 21
Connect, 122
consular services, i, 98
deliverables, 97
Japan, 100
New Zealand, 100
objective, 97
outcomes, 97, 98
performance, 98
visas, 52
Australian Trade Commission Annual Report 2011–12 > 231
Consulate-General
Auckland, New Zealand, 100
Bogota, Colombia, 19, 27
Sao Paulo, Brazil, 100
Ulaanbaatar, Mongolia, i, 19, 32
consulates, i, 4, 6, 98–100
consultancies, 121, 214
consultants, 121
corporate data, 124
corporate governance, 102–9
Corporate Governance Forum, 103
Corporate Governance Framework, 102, 109
Corporate Plan, 106, 109
corporate planning, 105, 106, 109
Costa Concordia cruise ship, 99
CostaExchange, 29
Council for Australian–Arab Relations, 78
Council of Australian Governments, 118
Council of Australian Governments’ International
Student Strategy for Australia, 48
Council on Australia Latin America Relations, 78
‘Creating Your Future through Education’ seminar, 52
Criminal Code 1995, 103
Cultural Mentor Program, 113
Curtin University, 21, 22
Czech Republic, 42, 55
D
data centres, 123
Defence Signals Directorate, 122
Department of Agriculture, Fisheries and Forestry,
77, 80, 82
Department of Business and Innovation, Vic, 55,
80
Department of Defence, 120
Department of Education, Employment and
Workplace Relations, 117
Department of Finance and Deregulation, 103
Department of Foreign Aff airs and Trade (DFAT),
32, 81, 98, 100
Overseas Property Offi ce, 119
Department of Immigration and Citizenship, 30,
49, 77, 78, 80, 103
Department of Industry, Innovation, Science,
Research and Tertiary Education (DIISRTE),
26, 34, 77, 79
Department of Resources, Energy and Tourism,
42, 58, 59, 67, 71, 76, 77
Department of the Prime Minister and Cabinet,
77, 82
Diamond Jubilee. see HM Queen Elizabeth II’s
Diamond Jubilee
disability action plan, 117
Disability Discrimination Act 1992, 117
Duratray International, 31
E
Earth Hour, 217
East Asia and Pacifi c Water Days 2011
conference, 58
East Asian Growth Markets, 7
ecologically sustainable development, 217–19
Education and Career Fair, Moscow, 78
education sector
activities, 45, 46, 51, 52–3
Asian market, 52–3
communications and media strategy, 47–9
Future Unlimited brand, i, 3, 46, 47–9, 52, 53,
68, 69, 71, 78, 83
international education and training framework,
47–8
licensed educational institutions, 48
market research and intelligence, 50–1
outcome, 46
performance measure, 46
priorities, 47
student enrolments in Australia, 47
Study in Australia, 46, 48, 49, 52
video platform repositions, 46, 47–8, 49, 68,
71, 83
Education Visa Consultative Committee, 51, 52
Elders Limited, 56
emerging markets, 7, 19–32
employees. see also staff
agreements, 114
communication, 108–9
Indigenous, 117
overseas-engaged, 114
people with disability, 117–18
232 > Australian Trade Commission Annual Report 2011–12
recognition, 115–17
training and development, 109, 112
employment frameworks, 114
energy effi ciency, 217, 219
Energy Effi ciency in Government Operations
Policy, 217
energy sector, 57–8
Energy use in the Australian Government’s
operations 2007–08, 217
Enterprise Bargaining Committee, 114
Enterprise Connect, 13, 18
Envac, 57, 66
Environment Protection and Biodiversity
Conservation Act 1999, 217
environmental industries. see clean energy and
environment sector
environmental performance, 217–19
environmental remediation, 58
Established Markets, 7, 33–5, 37–8
Ethics Committee, 102, 105–6, 107, 118
events organisation, 15, 32, 46, 48, 53, 70–1, 79
Expomin trade show, 13, 17, 18, 26, 82
Export Finance and Insurance Corporation (EFIC),
71, 76, 77
Export Market Development Grants Act 1997, 94,
110, 111, 218
Export Market Development Grants (EMDG)
scheme, i, iv, 6, 85–94
appeals, 94
communication and promotion, 93
Comscentre, 95
deliverables, 85
fraud control, 94
funding, 93
Halfbrick Studios Pty Ltd, 96
objective, 85
outcomes, 85, 86
payments, 87
performance, 86
recipient profi les, 88–93
risk management, 94
exports, 14
external scrutiny, 110
F
Federation of Automotive Products Manufacturers,
55
FIFA World Cup, 15
Fiji, 119
Film Victoria, 22
Financial Management and Accountability Act 1997,
6, 102, 110
fi nancial performance, 7
management, 118
performance, 126
fi nancial resources, 215–16
fi nancial services sector, 36, 78
fi nancial statements, 129–98
Flickr account, 42
food and beverage sector, 16, 18, 28
Food and Hotel Asia 2012, 13, 18
Food Safety Operations Queensland, 29
foreign direct investment (FDI), iv, 6, 12, 27, 33, 57, 72
Austrade’s role, 61
Canada, 35
operating model, 61–2
outcome, 61
performance measure, 61
priority setting, 62
projects, 63–4
stock of, 37, 61, 63
strategy, 62
tourism, 67, 77
United States, 34, 36
Western European countries, 37
whole-of-government approach, 64
foreign language sites, 41–2
France, 37, 95
fraud control, 110
Fraud Control Plan, 110
freedom of information, 111
Freedom of Information Act 1982, 111
Fujitsu, 51
Future Unlimited brand, i, 3, 46, 47–9, 52, 53, 68,
69, 71, 78, 83
Futuris Automotive, 56
Australian Trade Commission Annual Report 2011–12 > 233
G
G’day USA 2012, 68, 71
Germany, 37, 42, 55, 58, 63, 70, 71, 92, 96
Ghana, 2, 19, 31, 32
Global Austrade Staff Awards, 115, 116
Global Education News (GEN), 46, 48, 50
Global investment promotion best practices 2012
report (World Bank), 42
Global News, 108
Globe 2012, Vancouver, 35, 59
governance review, 102
Green Morocco Plan, 28
Group of Eight (Australian universities), 26–7
Growth and Emerging Markets, 7, 19–32
Gulf Cooperation Council, 13, 28
Gulfood 2012, 28
H
Halfbrick Studios Pty Ltd, 96
Harrop Engineering, 35
Harvard ManageMentor, 112
head offi ce, Sydney, 218
HM Queen Elizabeth II’s Diamond Jubilee, 37
Hong Kong, 18, 42
How Australia is Faring report, 118
human resources management, 111–18
I
ICEF workshops, 30
ICT systems, 123, 124
immigration services, 30, 49, 78
Income Tax Assessment Act 1936, 12, 44, 120
independent audits, 111, 127–8
India, 16, 21–2, 23, 50, 54, 55, 57, 77, 79, 95
Indigenous Australian Government Development
Program, 2012, 117
Indonesia, 18, 22–3, 24, 58, 79, 82, 95, 120
Industry Capability Network, 13, 18, 55, 58
information and communications technology
sector, 95–6
Information Privacy Principles, 111
Information Publication Scheme, 111
information security, 122
information systems, 122–4
business systems, 122
corporate data, 124
data centres, 123
mobility support, 124
security, 122
infrastructure sector, 16, 24, 28, 30, 31, 33, 42, 62,
67, 71
Institute of Continuing & TESOL Education
(University of Queensland), 51
Institute of Languages (University of New South
Wales), 51
Intelligent Risks, 15
internal audit, 110
internal controls, 102, 109–10, 118
International Readiness Indicator, iv, 41
Intersolar trade fair, Munich, 58
investment development. see trade and
investment development
inward investment, i, 2, 3, 19, 33, 55, 61, 63
J
Japan, 14, 16, 24, 33–4, 42, 43, 51, 56, 59, 61, 63,
79, 81, 92, 96, 100, 116
Japan Women’s Innovative Network (J-Win), 43
Joint Committee on International Education, 52
Joint Standing Committee on Foreign Aff airs,
Defence and Trade, 81
Jordan, 28
judicial decisions, 111
K
Kazakhstan, 30
Knight report, 49
knowledge management, 122–4
Korea. see Republic of Korea
KPMG Australia, 110
Kuwait, 28
Kyushu EPCo, 33–4
L
language policy, 113
Latin America, 2, 25–7, 54, 58, 73, 77, 78
Leader Products, 29
234 > Australian Trade Commission Annual Report 2011–12
legal services, 120
legislation, 110
letter to Minister, ii
LinkedIn profi le, 42
locations, 8–9, 206–8, back cover
London Olympic Delivery Authority, 15
long service certifi cates, 117
low-emissions technology and services, 58
M
Malaysia, 18, 23–4, 46, 48, 50, 79, 95
Malaysia–Australia Free Trade Agreement, 23
management committees, 106–7
manufacturing sector, 79
Marina Industries Association of Australia, 25
Market Information Package, 50
market research, 220, 222
‘Maximising Our Value’ workshops, 108, 112, 113
Meat & Livestock Australia, 18, 28, 29
mentoring, 113
Middle East, 6, 13, 28, 42, 50, 55, 77
mining and resources sector, 13, 17, 23, 26, 29, 30,
31, 32, 35, 74, 77. see also Ozmine
mining equipment, technology and services
industries, 13, 25, 29, 32, 77. see also Expomin
trade show
Mining for Development Initiative, 31, 77
Mining Indaba 2012, 32
Minister for Trade and Competitiveness, inside
front cover, i, iv, 6, 76, 81, 82, 102, 104, 105
ministerial activities
in Australia, 81
overseas visits, 82–3
mobile site, 41
Mongolia, i, iv, 2, 4, 19, 32, 42, 43, 73, 74, 77, 120
Morocco, 28–9
N
National Disability Strategy, 118
National Food Plan Green Paper, 77
National Investment Advisory Board, 80
National Trade Development Working Group, 80
network, 6–7, 19
New Zealand, 23, 24, 38, 100
Ningxia Forestry Industry Centre (NFIC), 45
Ningxia Institute of Desertifi cation Prevention and
Control, 45
North Africa, 13, 28–9, 50
O
OBE Company Pty Ltd, 28
occupational health and safety. see work health
and safety
Occupational Health and Safety Act 1991, 117, 213
OECD, 42
OISE Sydney, 51
Olympic Games, London 2012, 15, 38
Oman, 28, 78
One Team Australia, 38
online services, 41
organisational design, 112
organisational structure, 5
OTEK Australia, 60
overseas assignments, 113
Overseas Property Offi ce (DFAT), 119
Ozmine 2012, 23, 72, 120
OzWater, Sydney, 58
P
Pakistan, 120
parliamentary inquiries and briefi ngs, 81
Parliamentary Joint Committee on the Australian
Commission for Law Enforcement Integrity, 81
Parliamentary Secretary for Trade, inside front
cover, 47, 49, 81, 82
partnering arrangements, 42
passport services, 98, 99
performance bonus payments, 115
performance framework, 10
performance plan, 114
Performance Racing magazine, 34
performance reporting, 11
Peru, 13, 25, 26
Philippines, 18, 23, 95, 120
Poland, 30, 42
Portfolio Budget Statements 2011–12, 10
portfolio, program and project management
maturity model. see P3M3
Australian Trade Commission Annual Report 2011–12 > 235
Prime Minister’s Taskforce on Manufacturing, 79
privacy, 111
Privacy Act 1988, 111
procurement, 121
property management, 119
Prospectors and Developers Association of
Canada, 35
protective security, 119–20
Protective Security Policy Framework, 119
Protective Security Team, 120
PT PLN (Persero) 1000 Islands program, 58
P3M3, 124
Public Service Act 1999, 6, 102, 103, 110
Public Service Medal, 115, 116, 117
publications, 50, 71
purchasing, 120–1
Q
Qatar, 15, 28, 78
R
railways sector, 13, 22
RallySport Direct, 34
reform, trade, iii
Reform of the Australian Trade Commission:
maximising our value, 106
Republic of Korea, 15, 24–5, 81
Review Implementation Taskforce, 106
review of Austrade (2010), iv, 6, 7, 14, 40, 62, 106,
108, 109, 113, 122, 126
risk management, 109–10
Road & Track magazine, 34
role of Austrade, 6
Rubicon Water, 29
Rugby World Cup, New Zealand, 100
Russia, 15, 29–30, 32, 42, 49, 55, 78, 82, 83
Russian Coal and Mining exhibition, Siberia, 29
S
Saudi Arabia, 28
Science without Borders scholarship program
(Brazil), 26–7
security, 119. see also information security;
protective security
Security Advisory Group, 107
Senior Executive Group, 102, 104, 105, 106, 107,
119, 123, 212
Senior Executive Service (SES), 114, 115, 204
Senior Offi cials Trade and Investment Group,
79–80
Service Policy Handbook, 103
short-term overseas assignments, 113
Siemens, 37
Singapore, 13, 18, 42, 92
Social Inclusion Measurement and Reporting
Strategy, 118
social media presences, 42
South Africa, 32
South Asia, 18, 28
Spain, 37, 42
sports events, 14
staff . see also employees
awards, 115–17
induction, 113
leadership development, 113
numbers, 7
overview, 112, 200–5
performance, 114
resources, 215–16
turnover, 112
workplace diversity, 117
standards, 109, 110, 209
Standing Council on Community, Housing and
Disability Services, 118
State of the Service Report, 118
State Street Global Markets, 36
Stay in Touch program, 108
Strategic Review of the Student Visa Program
2011, 49
Study in Australia website, 46, 48, 49, 52
Sub-Saharan Africa, 31–2
Surf Life Saving Australia, 38
Sweden, 37, 66
T
Taiwan, 18, 52
Team Australia Automotive, 34, 55
TedX Sydney, 72
236 > Australian Trade Commission Annual Report 2011–12
telephony, 123
Terry Barr Sales, 55
Thailand, 18, 23, 56, 58, 70
Total Channel Control, 29
tourism
foreign direct investment, 67, 77
infrastructure, 3, 38, 42, 62, 67, 71
Tourism Australia, 42, 51, 67, 71, 76, 77
tourisminvestment.com.au, 42
trade and investment development. see also
individual countries
benefi ts, 68
deliverables, 12
emerging markets, 19–32
established markets, 7, 33–5, 37–8
external organisations, 18–19
international business activities, 19
objective, 12
online services, 41–2
outcomes, 12, 13, 54, 68
partners and referrals, 42
performance measures, 13, 16, 39, 54, 68
trade opportunities for business, 13, 14, 16–18
trade services to enterprises, 39–41
Trade Commissioners
Accra, Ghana, 2, 19
Sao Paulo, Brazil, 2
trade development schemes. see Export Market
Development Grants (EMDG) scheme
trade services, 39–40
TradeStart program, 6, 7, 39, 44, 45
Twitter account @Austrade, 42
U
United Arab Emirates (UAE), 28, 50, 78
United Kingdom, 37, 38, 61, 63, 70, 92, 95, 96
United States of America, 14, 24, 34, 50, 55, 57–8,
61, 63, 70, 81, 92, 96
University of Canberra, Institute for Governance,
iv, 102
US Federal Aviation Administration, 58
V
values, 109, 209
Victorian Super Trade Mission, 21
videoconferencing, 123
Vietnam, 18, 23, 24, 33, 50, 58, 79
visits, foreign government representatives, 84
W
waste, 218
Water Australia, 54, 58
water consumption (Austrade), 218
water sector, 58
Water Supplier Advocate, 54, 58
web accessibility, 124
Web Content Accessibility Guidelines (WCAG),
124
webinars, 72
websites, 41, 42
West Africa, 19, 31, 32
Western Europe, 37
wheat trade, 24
Wheatstone, 34
WIGB Lore (e-newsletter), 43
Wine Australia, 13, 18, 80
Women in Global Business program, 43
work health and safety, 117, 211–12
Work Health and Safety Act 2011, 117, 211, 213
workplace diversity, 117
workplace planning, 112
Workplace Relations Committee, 107, 114
workstation fl eet, 124
World Bank, 42, 58
X
Xtralis, 22
Y
Yeosu Expo 2012, 24–5, 49
YouTube channel, 42, 49
Z
Zhaopin Limited, 20, 53
Auditors
Internal
KPMG
20 Brindabella Circuit
Brindabella Business Park
Canberra Airport ACT 2609
Australia
External
Australian National Audit Offi ce
Centenary House
19 National Circuit
Barton ACT 2600
Australia
Creative Commons
With the exception of the Commonwealth Coat of Arms and where
otherwise noted (including photographs protected by copyright),
this report is licensed under a Creative Commons Attribution 3.0
Australia licence, http://creativecommons.org/licenses/by/3.0/au/.
The report should be attributed as the Australian Trade Commission Annual Report 2011–12.
Use of the Coat of Arms
The terms under which the Coat of Arms can be used are detailed on the It’s an Honour website,
www.itsanhonour.gov.au/coat-arms/index.cfm.
ISSN: 1030–5904
This report is available at www.austrade.gov.au/annualreport.
All amounts are in Australian dollars unless otherwise specifi ed.
Editing and indexing: Wilton Hanford Hanover
Design and production: L&L Design and Production
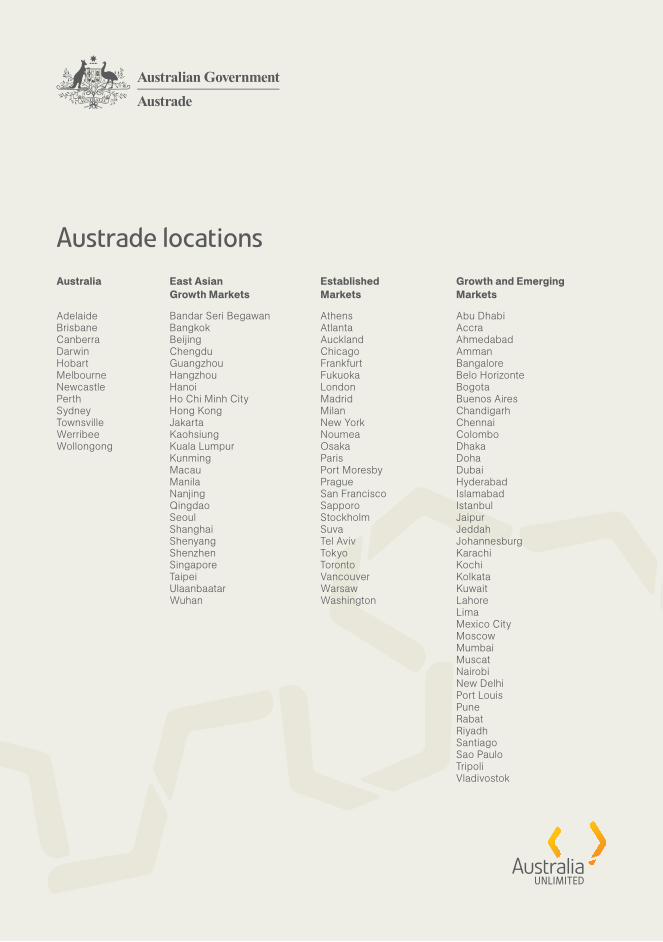
Austrade locations
Australia East Asian Growth Markets
Established Markets
Growth and Emerging Markets
Adelaide Bandar Seri Begawan Athens Abu Dhabi
Brisbane Bangkok Atlanta Accra
Canberra Beijing Auckland Ahmedabad
Darwin Chengdu Chicago Amman
Hobart Guangzhou Frankfurt Bangalore
Melbourne Hangzhou Fukuoka Belo Horizonte
Newcastle Hanoi London Bogota
Perth Ho Chi Minh City Madrid Buenos Aires
Sydney Hong Kong Milan Chandigarh
Townsville Jakarta New York Chennai
Werribee Kaohsiung Noumea Colombo
Wollongong Kuala Lumpur Osaka Dhaka
Kunming Paris Doha
Macau Port Moresby Dubai
Manila Prague Hyderabad
Nanjing San Francisco Islamabad
Qingdao Sapporo Istanbul
Seoul Stockholm Jaipur
Shanghai Suva Jeddah
Shenyang Tel Aviv Johannesburg
Shenzhen Tokyo Karachi
Singapore Toronto Kochi
Taipei Vancouver Kolkata
Ulaanbaatar Warsaw Kuwait
Wuhan Washington Lahore
Lima
Mexico City
Moscow
Mumbai
Muscat
Nairobi
New Delhi
Port Louis
Pune
Rabat
Riyadh
Santiago
Sao Paulo
Tripoli
Vladivostok