Australian Institutional Investor Presentation 25 August 2016 · Abano is focused on the private...
38
Australian Institutional Investor Presentation 25 August 2016
Transcript of Australian Institutional Investor Presentation 25 August 2016 · Abano is focused on the private...

Australian Institutional Investor Presentation
25 August 2016

DEMAND FOR HEALTHCARE IS GROWING
Growing number of baby boomers, medical advances, longevity and rising incomes pushing up demand for healthcare
Governments cannot continue funding healthcare at current levels of growth for increasing healthcare demands
PRIVATE SECTOR PARTICIPATION
Private sector provision can and currently does supply capital and expertise
Use of private sector resources removes the pressure on public facilities
Private payment and healthcare insurance would free up the public system for those that most need it
THE HEALTHCARE MARKET

Abano is focused on the private healthcare market
PRIVATE HEALTH SPEND 2015/16
AUSTRALIA
Est. A$30.6 billion
Approx. 30% of health spend is private payment
NEW ZEALAND
Est. NZ$3.3 billion
Approx. 17% of health spend is private payment
FUNDING OF HEALTHCARE
CHARACTERISTICS OF PUBLIC HEALTH FUNDING:Short term, Fixed price contracts vs fee for service, Tender process, Constrained funding environment
Healthcare in New Zealand and Australia is funded by a mix of public (government) funding and private payment (insurance and payment by private individuals)

ABANO’S HEALTHCARE STRATEGY
Our Strategy Is To Invest Into Businesses In The Private Healthcare Market, Which Are Not Constrained By Government Funding, And Where There Is Proven, High Demand For Our ServicesINVESTMENT STRATEGY
Our investment decisions are based on sound and proven principles:
• PRIVATE MEDICAL SERVICES AND HEALTHCARE SECTOR, particularly dental, as well as a small investment into radiology
• ESTABLISHED BUSINESSES with the potential to grow
• Operating in SCALABLE MARKETS with sustainable growth for our services
• Predominantly funded by PRIVATE REVENUE and on a fee for service basis
• Where we can PARTNER WITH LEADING CLINICIANS AND MANAGEMENT to add value, assist in growth and realise the organisation’s potential
• DIVERSIFICATION across income streams and geographical regions to reduce risk
• OUR PEOPLE ARE OUR BUSINESS and we invest in them to help them realise their full potential

RADIOLOGYNew Zealand Radiology Market~NZ$250 million
Invested in market since 200571% ownershipAscot Radiology: NZ5% of FY16 Abano Gross Revenue
Abano Healthcare Group Limited is an investor in and operator of healthcare businesses, in New Zealand and Australia.
OUR VISION
To build market-leading brands and healthcare businesses that have the competitive advantage of size, scale and reputation.
OUR LONG TERM STRATEGY
Invest in scalable businesses in the private, fee for service healthcare market where we can add value, build capability and help them to grow
DENTALTrans-Tasman Dental Market~NZ$11 billion
Invested in market since 2002100% ownershipLumino The Dentists: NZMaven Dental Group: Australia81% of FY16 Abano Gross Revenue
ABOUT ABANO

GROSS REVENUE ANALYSISFunding Source
Diversification Across Income Streams And Geographical Regions To Reduce Risk.Investment into Businesses Predominantly Funded By Private Revenue On A Sustainable Fee For Service Basis
Over 50% of our gross revenue will be generated in Australia. This is slightly less than FY16 due to the sale of the audiology business
Gross revenue includes audiology and gross dental revenues before the payment of dentists’ commissions
Dental is expected to provide over 95% of gross revenue in FY17
Approximately 98% of revenue will be from private payment in FY17

BUSINESS OVERVIEW

OUR BUSINESSES
DENTAL
Lumino The Dentists
Maven Dental Group
DIAGNOSTICS
Ascot Radiology

THE DENTAL SECTOR
Trans-Tasman dental market
Worth approx. NZ$11 billion
Corporate providers hold less than 10% of the market
Changing Workforce
Over 18,000 registered dentists in NZ and Australia
Increasing number of dentists, with more wanting to work part–time
Increase in supply of new graduates, majority being female, with a preference for flexible working conditions offered by a dental corporate
Predominantly privately funded
Over 90% of revenue from patient payments or their health insurance
Health insurance larger component in Australia than New Zealand
Minimal reliance on Government funding
Long Term Growth Trend
Aging population, better oral health, retention of natural teeth
More services on offer
Increasing demand for cosmetic and restorative services
Huge Pool of Practices
Estimated market size ~14,000 practices Highly fragmented with significant potential for acquisition and network expansion

CORPORATE DENTAL MODEL
Growing acceptance and popularity of the corporate dental model
• Increased awareness of the dental corporate model
• More dentists are choosing to join a corporate dental group
• There are a number of competitors actively building scale in Australia
• Each corporate group has a different growth strategy, business model and revenue focus
Corporate consolidators are estimated to own less than 5% of practices and have less than 10% of revenues

OUR DENTAL STRATEGYTo Be A Leading Trans-Tasman Dental Provider
GROWTH STRATEGY
• Focus on mid to high end, private market
• Acquisition growth: Immediate earnings
• Organic growth: Expanding and maximising capacity in existing clinics
• Greenfield growth: Targeted greenfield clinic development
• Risk sharing mechanism on acquisition
• Long term engagement and retention of dentists
• Investment into highly scalable infrastructure
• Focus on branding and marketing to attract and retain customers
• Margin expansion through cost efficiencies, realising synergies across the two businesses and benefits of scale including procurement and training
OUR STRENGTHS
• Size and scale: Second largest trans-Tasman network
• Successful branding and marketing strategy
• High level of patient engagement and satisfaction
• Minimal reliance on Government contracts or insurance work
• Leaders in clinical excellence with long standing and respected Clinical Advisory Boards
• Experienced and proven leadership team
• Developing our people with training programs, mentoring, conferences and career development opportunities
• More than 1,800 staff

PATIENTS
• ~900,000 patient visits per annum
• High quality dental care and excellent patient experience
• Wide range of services on offer including increasing access to dental specialists
• Engaging advertising and recognisable brands
• Marketing offers and innovative finance options to make dentistry more accessible
• Focus on patient engagement and long term loyalty
OUR DENTAL STRATEGYTo Be A Leading Trans-Tasman Dental Provider
SUCCESSFUL DENTIST PARTNERSHIP PHILOSOPHY
• Entered dental sector in 2002
• 477 dentists and growing
• Long term retention
• Majority of dentists remain post-earnout; less than 20% currently on earnout
• Competitive commission-based remuneration
• Frees up dentists from admin to focus on providing excellent clinical care
• Treatment and referral decisions remain with the dentist
• Training, mentoring, conferences and career development opportunities

INVESTMENT INTO GROWTHTwo Well Established And Fast Growing Dental Networks
Second largest trans-Tasman dental corporate
Largest private dental network in NZ and second largest in Australia
Acquiring one practice on average every two to three weeks
New Zealand practices are smaller on average than Australian practices (Turnover: NZ>NZ$1.0m vs AUS>A$1.7m)
Currently generating in excess of $254 million in annualised gross revenue (AUS:NZ exchange rate 0.9303)

LUMINO THE DENTISTS
New Zealand103 practices as at 15 August 2016Estimated 13% market share
WHAT WE LIKE
• Market leadership (size and offer)
• Predominantly private payment
• Well established business with strong infrastructure and culture across the group and experienced management
• Indepth knowledge base and industry experience
• Leading the way in best practice and clinical excellence
• Innovative marketing campaigns and ability to leverage national brand presence
• Long term engagement with dentists post-acquisition

NATIONAL ADVERTISING AND BRANDINGA Key Part of Our Success
THE POWER OF MARKETING
National marketing and TV campaign launched 2011
Today 1 in 10 New Zealanders are Lumino patients
With 85% brand awareness , almost 9 out of 10 NZers know the Lumino name (up from 2 in 10 five years ago)
For every marketing dollar spent on TV and Online, Lumino generates approx. $5 in treatment spend
Almost 500,000 patient visits last year and more than $100 million in treatment
26,000 Lumino patients have completed their treatment with the help of Qcard
The Lumino website attracts 41,000 unique visitors each month. That’s more than the population of Gisborne
Commenced Net Promoter Score tracking in 2016 with ranking currently at 64 (July 2016) and increasing
Currently running third Lumino advertising campaign “Do what makes you smile”

MAVEN DENTAL GROUP
Australia89 practices as at 15 August 2016
Estimated 1.4% market share
WHAT WE LIKE
• Huge market potential
• Second largest dental consolidator in Australia; experienced inhouse acquisitions team
• Revenue predominantly from private payment
• Benefits of scale starting to be seen
• Building strong infrastructure to support continued growth
• New brand will allow future national marketing and brandpromotion
• Ability to share knowledge and learn from successes in NewZealand market

MAVEN DENTAL GROUP NETWORKFocus On Building Geographical Diversity
29
6
35
3
4
7
5
39% of practices located in Queensland
53% of practices located in Queensland and northern NSW

FY16 DENTAL PERFORMANCEProvided 81% of Abano’s Gross Revenue
LUMINO THE DENTISTS
• NZ$105.4 million in gross revenue• Improving financial performance, with increased gross revenue
and Underlying EBITDA. Third year of improved margins• Same store sales of 2.7% outperforming the market. Ninth
consecutive quarter of positive same store growth• Acquired 12 practices and opened 1 greenfield practice
MAVEN DENTAL GROUP
• A$124.6 million in gross revenue• Positive same store growth in some states, but overall
performance impacted by challenging Australian economy, particularly in Queensland and Northern NSW, with overall same store revenue down 3.6%
• Acquisition of 6 large practices

ROLLOUT OF NEW MAVEN DENTAL GROUP BRAND
Brand rollout underway
Initiated in December 2015
16 practices successfully rebranded by end-August 2016 and more underway
Local branded advertising has been initiated for those practices where new branding is in place
Initial feedback is very positive
Looking to introduce marketing and finance offers across the Maven Dental Group in the coming months

DENTAL PRIORITIES FOR FY17
LUMINO THE DENTISTS
Further acquisition and merger of closely located practices
Rollout of innovative marketing and finance options including Lumino Dental Plan
MAVEN DENTAL GROUP
Rollout of brand and introduction of branded marketing offers
Focus on digital strategy including website, marketing and operational opportunities
GROUP-WIDE
Continuing acquisition growth - expect to acquire practices providing approximately $30 million in annualised gross revenues
Increased collaboration and sharing of knowledge and expertise across the group
Focus on providing excellent patient service and experience
Focus on performance improvements and operational efficiencies
Continue to improve financial performance

THE OPPORTUNITY IN RADIOLOGY
GROWING DEMANDMedical advances and new technology providing improved diagnosis, and at an earlier stageGrowing acceptance and demand for new technologies as benefits are understoodAgeing demographics pushing up demand
NEW TECHNOLOGIES DRIVING INDUSTRY CHANGEPET-CT scanning for cancer and other medical conditionsDigital breast mammography including digital tomosynthesisMRI guided breast biopsyMove from film to digital imagesGreater collaboration with other clinicians in patient treatmentIncreasing demand for radiologists with sub-specialities
CHANGING INDUSTRY DYNAMICSMarket dominated by private practice groupsApprox. 100 to 150 individual radiology clinics in NZIncreasing consolidation of the market
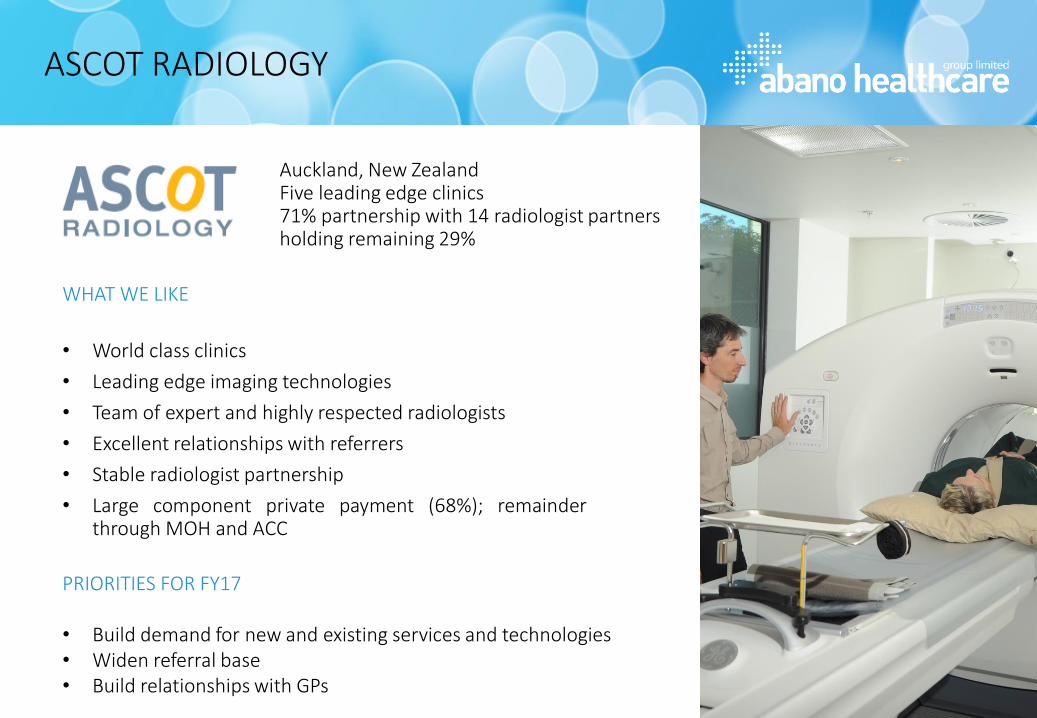
ASCOT RADIOLOGY
WHAT WE LIKE
• World class clinics
• Leading edge imaging technologies
• Team of expert and highly respected radiologists
• Excellent relationships with referrers
• Stable radiologist partnership
• Large component private payment (68%); remainderthrough MOH and ACC
Auckland, New ZealandFive leading edge clinics71% partnership with 14 radiologist partners holding remaining 29%
PRIORITIES FOR FY17
• Build demand for new and existing services and technologies• Widen referral base• Build relationships with GPs

DIAGNOSTICS FY16 PERFORMANCEProvided 5% of Abano’s Gross Revenue
ASCOT RADIOLOGY
• Graphs reflect sale of pathology business in FY15.Radiology is now the only Diagnostics sector business
• Investment into improved customer service and upgrades at Ascot clinics to provide an enhanced customer experience
• Investment into digital tomosynthesis mammography technology
• Opening of new CT scanning room in Mauranui Clinic in Epsom in Auckland
• Expansion of obstetric ultrasound offer with new maternity scanning service established on Auckland’s North Shore

LATEST RESULTSFor the year ended 31 May 2016

FY16 HIGHLIGHTS
Investment into growth Dental: Added 19 dental practices; Trans-Tasman dental network of 188 practices as at 31 May 2016
Bay Australia: Opened six greenfield stores and relocated two stores
Divestment of Audiology ShareholdingSold for $32 million resulting in gain on sale of $20.2 million
Performance at top end of profit guidanceNPAT $28.4m including $20.2m gain on sale of audiology shareholdingUnderlying NPAT $8.8 millionFull year dividend of 30cps, up 20%
Results from continuing businesses well ahead of prior yearGross revenue up 12%EBITDA up 18%Underlying NPAT increased by 57%
Finalist INFINZ Award 2016Emerging Leaders Best Corporate Communicator
Management SuccessionRichard Keys appointed CEO and Rachel Walsh appointed as CFO
Launch of Maven Dental Group brandBrand rollout activated in December 2015

FY16 FULL YEAR RESULTS SNAPSHOT
$ Millions FY16Statutory
FY15 Continuing
FY15 Statutory
Gross Revenue 297.1 265.8 300.4
Revenue 213.7 187.6 222.2
Underlying EBITDA 27.2 23.6 30.7
EBITDA 26.6 22.5 29.6
NPAT/NLAT 28.4 4.5 (1.3)
Underlying NPAT 8.8 5.6 8.8
See glossary slide for explanation of gross revenue and underlying earnings
Results were at the top end of guidance excluding the impact of the Bay sale
Net Profit After Tax of $28.4m including $20.2m gain on sale of Bay International shareholding
CONTINUING BUSINESSES:
• EBITDA up 18% and Underlying EBITDA up 15%, both above guidance
• Underlying NPAT result of $8.8 million up 57% on previous year
FY16 results exclude earnings from Bay International for the month of May 2016 as it ceased to be recognised as an equity accounted investment from 30 April 2016
FY16 results exclude earnings from Pathology and Orthotics businesses which were divested during the FY15 year
See glossary slide for explanation of gross revenue and underlying earnings

FY16 REVENUE GROWTH
Continuing Businesses: Gross Revenue And Revenue Growth Well Ahead of Previous Year
Growth in revenues primarily driven by strong New Zealand dental performance, improvements from the audiology joint venture and a stable performance from the radiology business.
Gross revenue includes audiology and gross dental revenues before the payment of dentists’ commissionsContinuing businesses: Rehabilitation business divested in FY13; Pathology and Orthotics divested FY15; Bay International divested May 2016, results exclude Bay International earnings for May 2016
FY16: $297.1m
FY16: $213.7m

UNDERLYING EBITDA GROWTH
DENTAL• Continuing year on year growth in dental • Investment into brand launch and rollout, and
development of new initiatives in Australia
DIAGNOSTICS • Radiology: Growing demand from referrers and
investment into expanded capacity and offering• Pathology business divested 1 May 2015
AUDIOLOGY• Improving performance from Bay International
See glossary slide for explanation of Underlying EBITDA
Underlying EBITDA Results Reflect Long Term Strategy To Invest Into Growth And Expansion Of Businesses

UNDERLYING NPAT GROWTH
Underlying NPAT FY06 to FY16
Investment into growth of dental, audiology and radiology businesses
Increasing Returns As We Invest Into Our Growth Businesses
FY16 $8.8m

UNDERLYING EARNINGS PER SHARE
42% growth in FY16 Underlying Earnings Per Share from continuing businesses
Primarily driven by investment into dental delivering growing returns
Continuing businesses exclude Pathology and Orthotics sold FY15 and Audiology sold FY16
Weighted Average Number of Shares

DIVIDEND
Dividend Policy
Subject to relevant factors at the time, including working capital and growth, the annual dividend paid will be between 50-70% of Underlying Net Profit After Tax
Increasing future earnings out of Australia will reduce imputation credits attached to dividends
FY16 Final Dividend
33% increase in final dividend to 20 cents per share
Full year dividend of 30 cents per share, up 20% on previous year
Equal to 72% of Underlying NPAT
Dividend Reinvestment Plan (DRP)
DRP allows shareholders to choose between receiving a dividend or reinvesting back into the company
The DRP continues to be well supported with an average of approximately 50% of dividends taken up in shares under the DRP over the past 5 years.

BALANCE SHEET
$m FY15 FY16 FY16 adjustedfor Bay sale
Cash 3.9 4.3 4.3
Other current assets 12.0 43.5 11.5
Property, plant and equipment 40.6 46.4 46.4
Intangible assets 147.4 173.9 173.9
Other non current assets 17.2 5.5 5.5
TOTAL ASSETS 221.1 273.6 241.6
Current liabilities 27.5 27.3 27.3
Non current borrowings 89.9 117.8 85.8
Other non current liabilities 13.3 13.5 13.5
TOTAL LIABILITIES 130.7 158.6 126.6
Total equity 90.4 115.0 115.0
TOTAL EQUITY AND LIABILITIES 221.1 273.6 241.6
Significant change in balance sheet following settlement of sale of shareholding in Bay International
Intangible assets predominantly goodwill in dental acquisitions
Following settlement of Bay International on 17 June 2016, undrawn facilities of approx. $55 million providing headroom for continued growth
Strong, long term relationship with banking partner

LOOKING FORWARDFY17 Priorities
INVESTMENT INTO GROWTH, FOCUS ON IMPROVING MARGINS AND MANAGING COSTS
Selective acquisition of quality dental practice acquisition and organic growth
Build demand for high end modalities and services in radiology
DELIVERY OF EXCELLENT CUSTOMER SERVICE
Through engaging with customers through a variety of channels, ensuring ease of customer interaction, exemplary customer experience and high levels of customer satisfaction
INVEST INTO AND GROW OUR PEOPLE
Invest into our people to help them realise their potential
Providing access to inhouse and external training, mentoring and career development opportunities
Create world class working environments and foster cultures that recognise excellence
UTILISE AND LEVERAGE TECHNOLOGY
Deliver improved business processes and systems, operating efficiencies and data analysis
Use digital channels to engage with customers and improve the customer experience/interaction
DELIVER IMPROVING SHAREHOLDER RETURNS
Targeting >15% year on year increase in underlying earnings per share on continuing businesses
Balance growth requirements with attractive dividend payments
Deliver improving underlying EBITDA and underlying NPAT

QUESTIONS

MANAGEMENT
ABANO LEADERSHIP TEAM
Richard Keys(2002)
Chief Executive Officer
Rachel Walsh(2013)
Chief Financial Officer
Andy Tapper(2005)
CEO Abano Dental
Dr David Rogers(2005)
Managing Partner Ascot Radiology
DENTAL CLINICAL ADVISORY BOARDS
Lumino Maven
Dr Ben Harris Dr Adam DoudneyDr Werner EichholzDr Anna WalkerDr Andrew BrownDr Chris BrooksDr Garry Rae
Dr Fred CalavassyDr Greg DuguidDr Joseph ChauDr Ruchira SinghiDr Mark CullDr Martin PynorDr Michael BarberDr Sean SlotarDr Rod Ashton
A number of clinicians also sit on the management teams of each Abano dental business

GLOSSARY
All numbers in NZ currency unless otherwise stated.
Revenue excludes any audiology revenues, as this is a joint venture and is therefore equity accounted, and only includes Australian dental revenues after the payment of dentists’ commissions.
Gross revenue is reported within the segment note in the Financial Statements and includes audiology revenues and Australian dental revenues before payment of dentists’ commissions.
Earnings Before Interest, Tax, Depreciation and Amortisation (“EBITDA”) is reported within the segment note in the Financial Statements and is Net Profit After Tax (“NPAT”) excluding GAAP compliant net finance expenses, gains/losses arising on sale of businesses, equity accounted investments, non-controlling interests, tax, depreciation and amortisation costs. Particularly, it excludes profit/losses generated by the Bay Group, in which Abano holds a 50% shareholding. Due to this being a joint venture, the results for the Bay Group are equity accounted and therefore not included in the consolidated EBITDA.
Underlying earnings are reported for both NPAT (a GAAP compliant measure) and EBITDA (a non-GAAP financial measure) and excludes gains/losses arising on sale of businesses, IFRS adjustments and impairments, including their tax effect. Both measures are reconciled back to reported NPAT. It is the measure used within the Company to evaluate performance, establish strategic goals and to allocate resources.
More information on gross revenue and underlying earnings, which are non-GAAP financial measures and are not prepared in accordance with NZ IFRS, is available on the Abano website at www.abano.co.nz/underlyingearnings.

DISCLAIMER
This Company presentation dated 25 August 2016 includes comment on Abano’s financial performance including financial results for the year ended 31 May 2016, which were released by Abano Healthcare Group on 27 July 2016. As such, it should be read in conjunction with, and subject to, the explanations and views provided in that material.
The information in this presentation is an overview and does not contain all information necessary to make an investment decision. It is intended to constitute a summary of certain information relating to the performance of Abano Healthcare Group (“Abano”).
The information in this presentation does not purport to be a complete description of Abano. This presentation is not investment advice or financial advice. Abano, its directors and employees do not give or make any recommendation or opinion in relation to acquiring or disposing of Abano shares. In making an investment decision, investors must rely on theirown examination of Abano, including the merits and risks involved. Investors should consult with their own legal, tax, business and/or financial advisors in connection with any acquisition of securities.
The information contained in this presentation has been prepared in good faith by Abano. No representation or warranty, express or implied, is made as to the accuracy, adequacy or reliability of any statements, estimates or opinions or other information contained in this presentation, any of which may change without notice. To the maximum extent permitted by law, Abano, its directors, officers, employees and agents disclaim all liability and responsibility (including without limitation any liability arising from fault or negligence on the part of Abano, its directors, officers, employees and agents) for any direct or indirect loss or damage which may be suffered by any recipient through use of or reliance on anything contained in, or omitted from, this presentation.
This presentation is not a prospectus, investment statement or disclosure document, or an offer of shares for subscription, or sale, in any jurisdiction.
This presentation includes non-GAAP financial measures in various sections. This information has been included on the basis that management and the Board believe that this information assists readers with key drivers of the performance of Abano which are not disclosed as part of the financial statements.

IFRS REPORTING IMPACT ON THE REPORTED RESULTS
RECONCILIATION OF EBITDA TO UNDERLYING EBITDA ($m)
2012 2013 2014 2015 2016
EBITDA 25.7 27.7 27.8 29.6 26.6
Add back Acquisition & Transaction Costs 1.6 0.9 1.3 1.1 0.6
Underlying EBITDA 27.3 28.6 29.1 30.7 27.2
RECONCILIATION TO UNDERLYING EARNINGS (DUE TO CHANGES IN IFRS IN 2010)
2012 2013 2014 2015 2016
NPAT 1.6 2.8 4.9 (1.3) 28.4
Loss/Gain on sale of subsidiary - (1.6) 0.2 9.0 (20.3)
Impairment tax asset - 1.9 - - -
Fair value movement and amortisation of deferred acquisition consideration
0.1 0.5 (0.3) - 0.1
Acquisition and Transaction costs 1.3 0.9 1.3 1.1 0.6
Underlying NPAT 3.0 4.5 6.1 8.8 8.8
More information on underlying earnings, which is a non GAAP financial measure and is not prepared in accordance with NZIFS, is available at www.abano.co.nz/underlyingearnings