Australian fisheries and aquaculture statistics...
124
Australian fisheries and aquaculture statistics 2013 Research by the Australian Bureau of Agricultural and Resource Economics and Sciences NOVEMBER 2014 Revised December 2014
Transcript of Australian fisheries and aquaculture statistics...

iABARESAustralian fisheries and aquaculture statistics 2013
Australian fisheries and aquaculture statistics 2013
Research by the Australian Bureau of Agricultural and Resource Economics and Sciences
NOVEMBER 2014
Revised December 2014

ii ABARESAustralian fisheries and aquaculture statistics 2013
© Commonwealth of Australia 2014
Ownership of intellectual property rights Unless otherwise noted, copyright (and any other intellectual property rights, if any) in this publication is owned by the Commonwealth of Australia (referred to as the Commonwealth).
Creative Commons licence All material in this publication is licensed under a Creative Commons Attribution 3.0 Australia Licence, save for content supplied by third parties, logos and the Commonwealth Coat of Arms.
Creative Commons Attribution 3.0 Australia Licence is a standard form licence agreement that allows you to copy, distribute, transmit and adapt this publication provided you attribute the work. A summary of the licence terms is available from creativecommons.org/licenses/by/3.0/au/deed.en. The full licence terms are available from creativecommons.org/licenses/by/3.0/au/legalcode.
Cataloguing data This publication (and any material sourced from it) should be attributed as Stephan, M & Hobsbawn, P 2014, Australian fisheries and aquaculture statistics 2013, Fisheries Research and Development Corporation project 2010/208. ABARES, Canberra, November. CC BY 3.0.
ISSN 1037-6879 ISBN 978-1-74323-213-2 (online) ISBN 978-1-74323-211-9 (printed)
Internet Australian fisheries and aquaculture statistics 2013 is available at: agriculture.gov.au/abares/publications.
Contact Australian Bureau of Agricultural and Resource Economics and Sciences (ABARES)
Postal address GPO Box 858 Canberra ACT 2601 Switchboard +61 2 6272 3933 Facsimile +61 2 6272 2001 Email [email protected] Web agriculture.gov.au/abares
Inquiries regarding the licence and any use of this document should be sent to [email protected].
The Australian Government acting through the Department of Agriculture, represented by the Australian Bureau of Agricultural and Resource Economics and Sciences, has exercised due care and skill in preparing and compiling the information and data in this publication. Notwithstanding, the Department of Agriculture, ABARES, its employees and advisers disclaim all liability, including for negligence and for any loss, damage, injury, expense or cost incurred by any person as a result of accessing, using or relying upon information or data in this publication to the maximum extent permitted by law.
Acknowledgements
ABARES thanks state and territory fisheries departments and the Australian Fisheries Management Authority, researchers and industry representatives for their contribution of fisheries and aquaculture production data presented in this report. The authors would like to thank staff from the Australian Bureau of Agricultural and Resource Economics and Sciences for their assistance with the data preparations: Dianne Stefanac, Qt Tran and Maggie Skirtun. Thanks also go to the Australian Bureau of Statistics for supplying trade data.
Australian fisheries and aquaculture statistics 2013 is supported by funding from the Fisheries Research and Development Corporation.
Note Commercial fish and invertebrates are referred to in this report by the names specified in Australian Fish Names Standard AS SSA 5300–2011. In this report, standard fish names for groups of species are not capitalised and initial capital letters are only used for proper nouns. This approach, which differs from the Australian Fish Names Standard, complies with general usage and Australian Government requirements for web content accessibility.
Revised 9 December 2014 with corrections Corrections to pages 2, 7, 8, 11, 13 and 18

iiiABARESAustralian fisheries and aquaculture statistics 2013
Foreword
Since 1991 Australian fisheries statistics has presented annual updates of fisheries production and trade data. The report is a comprehensive source of information for the fishing and aquaculture industry, fisheries managers, policymakers and researchers. Estimates of the gross value of production provided in the report are used for a range of purposes, including to determine Commonwealth, state and territory fisheries research funding arrangements each year.
The structure of the report has changed this year to include introductory information about Australia’s seafood trade and seafood consumption. The series title has also changed to reflect the growing contribution of Australian aquaculture production to overall seafood production.
The report contains data on the volume and value of production from state and Commonwealth commercial fisheries, and on the volume and value of Australian fisheries trade, by destination, source and product. Profiles of Australian commercial and aquaculture fisheries in 2011–12 and 2012–13 are also provided. These profiles display the number of licence holders by selected species and fishing methods for all Commonwealth, state and territory fisheries. Information on recreational and customary fishing is also included.
Australian fisheries and aquaculture statistics is part of a suite of ABARES publications that provides a comprehensive account of historical trends in, and the outlook for, Australian fisheries. Agricultural commodity statistics presents production and trade statistics for fisheries, and a range of other commodities. Forecasts for major fisheries commodities are updated each quarter in Agricultural commodities. The annual Australian fisheries survey report presents detailed analysis of the economic performance of selected Commonwealth fisheries. An assessment of the economic performance of fisheries managed by the Australian Fisheries Management Authority is provided in the annual Fishery status reports.
Karen Schneider Executive Director ABARES November 2014


vABARESAustralian fisheries and aquaculture statistics 2013
Contents
Australia’s seafood industry: trade and consumption 1
Production 7
Trade 24
Employment 37
Recreational and charter fishing 40
Customary fishing 47
Profile of Australian fisheries in 2011–12 and 2012–13 52
Glossary 60
References 62
Statistical tables 67
Fisheries inquiries 115
Figures
1 Volume and value of Australian fisheries exports, 1989–90 to 2012–13 2
2 Australian dollar exchange rate, against the US dollar and Japanese yen, 2002–03 to 2012–13 3
3 Australian volume of apparent consumption, domestic supply and imports of seafood, 2001–02 to 2012–13 5
4 Australian per person apparent consumption of meats and seafood, 2000–01 to 2012–13 6
5 Real value of Australian fisheries production, by sector, 2002–03 to 2012–13 9
6 Real value of Australian wild-catch production, 2002–03 to 2012–13 11
7 Real value of Australian aquaculture production, 2002–03 to 2012–13 13
8 Shares in gross value of Australian wild-catch and aquaculture production, by jurisdiction, 2002–03 and 2012–13 15
9 Value of Australian fisheries production, by jurisdiction, 2012–13 16

Contents
vi ABARESAustralian fisheries and aquaculture statistics 2013
10 Real value of Australian fisheries exports and imports, 2002–03 to 2012–13 26
11 Real value of Australian fisheries exports, 2002–03 to 2012–13 27
12 Value of Australian fisheries exports, by key species group, 2011–12 and 2012–13 28
13 Australian exports of edible fisheries products, by destination, 2002–03 to 2012–13 30
14 Real value of Australian fisheries imports, 2002–03 to 2012–13 32
15 Value of Australian imports of fisheries products, 2011–12 and 2012–13 32
16 Australian imports of edible fisheries products (excluding live), by source, 2002–03 to 2012–13 34
17 Real value of Australian imports of selected edible fisheries products from China, 2002–03 to 2012–13 35
18 Real value of Australian imports of selected edible fisheries products from Vietnam, 2002–03 to 2012–13 35
19 FIGURE 19 Employment in the Australian commercial fishing and aquaculture sectors, 2002–03 to 2012–13 37
Boxes
1 Exchange rates and unit value 3
2 Deriving apparent consumption of Australian seafood 5
3 Gross value of fisheries production 10

1ABARESAustralian fisheries and aquaculture statistics 2013
Australia’s seafood industry: trade and consumption
Fast factsFrom 2000–01 to 2012–13• Australian fisheries export a range of high unit value seafood products, with
export earnings accounting for 49 per cent of the total production value in 2012–13. However, in global terms Australia is a minor player, producing less than 0.2 per cent of global seafood supply.
• Japan was the major export destination for Australian seafood products until 2004–05. Since then exports of Australia’s seafood products to Japan have continued to decline and the pattern of Australian seafood exports has shifted towards the Hong Kong, China and Vietnam region.
• Australian exports of seafood to Japan declined at an average annual rate of 7 per cent in volume terms and 12 per cent in real value terms between 2002–03 and 2012–13.
• Australia’s apparent consumption of seafood increased at an average annual rate of 3 per cent between 2000–01 and 2012–13, from 248 515 tonnes to 345 326 tonnes.
• Domestic seafood supply over this period grew by less than apparent consumption, at an average annual rate of 1 per cent. Imports of seafood increased to fill the gap between demand and available domestic supply at an average annual rate of 4 per cent between 2000–01 and 2012–13.
• In 2012–13 imports accounted for 66 per cent of Australia’s total apparent seafood consumption.
• Apparent per person consumption of seafood has increased at an average annual rate of 1 per cent between 2000–01 and 2012–13, reaching 15 kilograms per person in that year.
Australia’s seafood trade in the global contextGlobal seafood supply has increased since the 1950s, at an average annual rate of 3 per cent (FAO 2014). The apparent global per person seafood consumption (whole weight equivalent) increased from 10 kilograms in the 1960s to 19 kilograms in 2012. This increase in consumption is attributed to rising incomes and urbanisation, expansion of aquaculture production and increased efficiency of distribution channels. Much of this growth has been in Asia, particularly in China.

Australia’s seafood industry: trade and consumption
2 ABARESAustralian fisheries and aquaculture statistics 2013
In global terms Australia’s seafood industry is a minor player, producing less than 0.2 per cent of global seafood supply. However, the industry exports a range of high unit value seafood products, with export earnings accounting for 49 per cent of the total production value in 2012–13.
Australia’s trade in seafood is driven by a number of factors, including the level of the exchange rate, the proximity of Australia to the growing seafood market in Asia, and Australia’s reputation as a reliable and high quality supplier of high unit value seafood products. Changing population, income levels, urbanisation trends, and changes in preferences in the main export markets are also important factors. Other factors such as changes in trade agreements between Australia and its trading partners, and the macroeconomic factors of competing exporting countries, can also contribute to Australia’s overall competitiveness in the global market.
Australia’s real export value and volume of seafood exports increased between 1989–90 and 2000–01, then declined between 2000–01 and 2012–13 (Figure 1). Driving the decline in exports from 2000–01 were lower export volumes of prawns (8207 tonnes), tuna (5860 tonnes) and rock lobster (5525 tonnes).
Australia’s main export markets for fisheries products (edible and non-edible) in value terms in 2012–13 were Hong Kong ($371 million), Vietnam ($294 million), Japan ($269 million), China ($48 million) and United States ($39 million). Japan was the major export destination for Australian seafood products until 2004–05. Since then exports of Australia’s seafood products to Japan have continued to decline and the pattern of Australian seafood exports has shifted towards the combined Hong Kong, China and Vietnam region.
Of significant importance to Australia’s competitiveness in the seafood export market are changes in the exchange rate. In general, a real depreciation of the domestic currency makes exports more competitive and imports less competitive, thereby increasing demand for domestically produced goods. Export trends are in line with exchange rate movements; the Australian dollar depreciated against the US dollar and Japanese yen between 1989–90 and 2001–02, and appreciated against those currencies between 2001–02 and 2012–13 (Box 1, Figure 2).
FIGURE 1 Volume and value of Australian seafood exports, 1989–90 to 2012–13
2012–13$b
kt
Real value (right axis)Total quantity
2012–13
2009–10
2006–07
2003–04
2000–01
1997–98
1994–95
1991–92
0.5
1.0
1.5
2.0
2.5
3.0
3.5
4.0
10
20
30
40
50
60
70
80
Source: Australian Bureau of Statistics

Australia’s seafood industry: trade and consumption
3ABARESAustralian fisheries and aquaculture statistics 2013
Australian exports of seafood products to Japan declined at an average annual rate of 7 per cent in volume terms and 12 per cent in value terms between 2002–03 and 2012–13. The decline in exports to Japan over that decade can be linked to the appreciation of the Australian dollar against the yen, a decline in per person seafood consumption in Japan since 2001 (FAO 2014), a rise in Asian prawn aquaculture production, which has displaced exports of Australian prawns, and a change in the structure of export demand, resulting from rising demand from Hong Kong and China.
Box 1 Exchange rates and unit valueAustralia is a small producer and exporter of fisheries products, so the prices Australian producers receive are generally set on world markets in foreign currencies. If all other things are equal, a depreciating Australian dollar results in producers receiving a higher export price in Australian dollar terms, while an appreciating Australian dollar results in a lower export price.
The strong appreciation of the Australian dollar since 2001–02 has made exports less competitive on international markets while simultaneously increasing the cost competitiveness of imports for domestic consumers. From 2001–02 the Australian dollar appreciated against both the US dollar and the Japanese yen, which contributed to Australian export prices falling. From 2001–02 to 2007–08 the Australian dollar appreciated by 53 per cent against the US dollar and 41 per cent against the yen (Figure 2). A depreciation of the Australian dollar against these currencies in 2008 –09 (17 per cent against the US dollar and 25 per cent against the yen) increased Australian export unit prices in that year. Between 2008–09 and 2012–13 the Australian dollar appreciated against these currencies, by 38 per cent against the US dollar and 21 per cent against the yen, which put downward pressure on export unit prices.
FIGURE 2 Australian dollar exchange rate, against the US dollar and Japanese yen, 2002–03 to 2012–13
00
¥/A$ (right axis)US$/A$
20
40
60
80
100
120
0.2
0.4
0.6
0.8
1.0
1.2
Source: ABARES
2012–13
2009–10
2006–07
2003–04
2000–01
1997–98
1994–95
1991–92

Australia’s seafood industry: trade and consumption
4 ABARESAustralian fisheries and aquaculture statistics 2013
Australia’s consumption of seafoodAustralia’s apparent consumption of seafood increased at an average annual rate of 3 per cent between 2000–01 and 2012–13, from an estimated 248 515 tonnes in 2000–01 to 345 326 tonnes in 2012–13 (Figure 3). Over the same period domestic seafood supply increased more slowly, at an average annual rate of 1 per cent. Imports of seafood have increased to fill the gap between seafood demand and local seafood supply. Imports of seafood into Australia increased at an average annual rate of 4 per cent, from 143 849 tonnes in 2000–01 to 228 391 tonnes in 2012–13. The largest imported products by value over this period were prepared and preserved fish, most of which was canned fish such as tuna, frozen fish, frozen prawns, and prepared and preserved prawns. In 2012–13 imports accounted for 66 per cent of Australia’s total apparent consumption of seafood, compared with 58 per cent in 2000–01.
Apparent consumption of seafood per person (edible equivalent) increased at an average annual rate of 1 per cent, from 13 kilograms per person in 2000–01 to 15 kilograms per person in 2012–13, with most of the growth occurring from 2000–01 to 2003–04. This level of consumption is around 10 kilograms less per person than that estimated by the FAO, with the difference in estimates mainly attributed to different methods used to estimate consumption. The FAO applies a consistent method of estimation for all countries and provides its estimates on a whole weight basis. Moreover, there is no adjustment made by the FAO in its estimates for Australia to account for sardines used as feed in aquaculture enterprises. The method applied here is consistent with that used by ABARES to estimate apparent consumption of other agricultural commodities produced in Australia (Box 2).
Per person consumption of seafood ranks fourth out of the five most consumed meats in Australia (Figure 4). Between 2000–01 and 2012–13 poultry meats and beef and veal accounted for the greatest proportion of total meats consumed per person in Australia. However, per person consumption of beef and veal has declined since 2006–07. In contrast, per person consumption of pig and poultry meat increased by an average annual rate of 3 per cent between 2000–01 and 2012–13. Seafood consumption per person exceeds the consumption of sheep meat and lamb, but per person consumption of seafood and sheep meat and lamb has been constant since 2003–04.
In 2011 the Australian Seafood Cooperative Research Centre, together with the University of South Australia and the Ehrenberg-Bass Institute for Marketing Science, undertook a survey to determine the species composition of Australian seafood consumption, how frequently seafood is consumed, and how prevalent this consumption is in at-home and out-of-home meals (Danenberg & Mueller 2011). The findings showed that Australians were consuming on average 3.1 meals a week that included a seafood component. When extended over a year, the survey showed that the top five species consumed were prawns (73 per cent of respondents consumed prawns sometime during the previous year), canned tuna (64 per cent), crumbed and battered fish (56 per cent), squid (48 per cent), and fresh salmon (48 per cent). The key reasons provided by survey respondents for consuming seafood included for better health, taste, ease of preparation, diversification from meat consumption and reasonable prices.

Australia’s seafood industry: trade and consumption
5ABARESAustralian fisheries and aquaculture statistics 2013
FIGURE 3 Australian volume of apparent consumption, domestic supply and imports of seafood, 2001–02 to 2012–13
kt
ImportsDomestic supply
Apparent consumption
50
100
150
200
250
300
350
2012–13
2010–11
2008–09
2006–07
2004–05
2002–03
2000–01
Source: ABARES; Australian Bureau of Statistics
Box 2 Deriving apparent consumption of Australian seafoodAnnual apparent consumption is estimated by adding the total edible quantity of seafood supplied domestically—that is, total production less exports of seafood—in Australia to the total quantity of seafood imported. Apparent consumption provides an estimate of the total amount of seafood consumed in Australia, but does not account for any stock changes. Apparent consumption is a measure often used to track the consumption of agricultural commodities over time.
The production volume for Australian fisheries and aquaculture products is reported in this publication on a whole weight basis, whereas trade data are reported on a processed basis. To align the units of measurement between production and trade data it is necessary to convert production volume to a processed edible equivalent. Production volumes are adjusted to an edible quantity basis using species specific conversion rates and excluding species that are known to be predominantly supplied for non-human consumption purposes, such as for aquaculture feed or bait. Imports and exports of seafood are sourced from Australian Bureau of Statistics trade data and are reported as edible weight. The apparent consumption per person is calculated as the total apparent consumption divided by the total Australian population in each year.
The Food and Agriculture Organization of the United Nations also compiles statistics on apparent consumption of seafood. Their statistics indicate annual consumption of seafood in Australia at around 25 kilograms per person, around 10 kilograms higher than the estimates presented here (FAO 2014). The discrepancy between FAO and ABARES estimates reflects differences in methodological approaches to estimating consumption. Whereas ABARES has estimated seafood consumption on a processed edible basis, the FAO provides its estimates on a whole weight basis. Moreover, the FAO estimates of seafood consumption include sardines caught for feed to aquaculture farms. These are excluded from the ABARES estimates.

Australia’s seafood industry: trade and consumption
6 ABARESAustralian fisheries and aquaculture statistics 2013
FIGURE 4 Australian per person apparent consumption of meats and seafood, 2000–01 to 2012–13
kg percapita
PoultryPig meatSeafoodSheep meat
Beef and veal
10
20
30
40
50
Note: Seafood (edible equivalent). Pig meat, sheep meat and beef and veal are carcass weight equivalent.Source: ABARES
2012–13
2010–11
2008–09
2006–07
2004–05
2002–03
2000–01

7ABARESAustralian fisheries and aquaculture statistics 2013
Production
Fast factsIn 2012–13• The gross value of Australian commercial fisheries production increased by
3 per cent to $2.4 billion (Table 1).• Tasmania accounted for the largest share of gross value of production (29 per cent),
followed by South Australia (19 per cent), Western Australia (18 per cent) and Queensland (12 per cent). Commonwealth fisheries accounted for 13 per cent of gross value of production.
• The value of production for the wild-catch sector increased by 6 per cent to $1.4 billion, while production volume decreased by 1 per cent to 157 252 tonnes. The wild-catch sector contributed 57 per cent of the gross value of Australian fisheries and aquaculture production in 2012–13.
• The gross value of aquaculture production (including southern bluefin tuna wild-catch input to the South Australian tuna farming sector) declined by $7 million to $1 billion, and accounted for 43 per cent of the gross value of Australian fisheries production. The volume of aquaculture production declined slightly, by 2 per cent to 80 066 tonnes, accounting for 35 per cent of Australian fisheries and aquaculture production.
• The value of farmed salmonids declined by 3 per cent to $497 million. However, farmed salmonids continue to be the largest aquaculture species group produced and, in terms of gross value, the most valuable fisheries product in Australia. Salmonids accounted for 48 per cent of the total value of Australian aquaculture production and 21 per cent of the total value of fisheries and aquaculture production.
• In volume terms, Australian fisheries production declined slightly, by 3480 tonnes (1 per cent) to 233 119 tonnes (Table 5).
• Between 2011–12 and 2012–13 salmonids was the fisheries commodity with the largest quantity produced. Before this, from 2003–04 to 2010–11 Australian sardine, a relatively low valued product, was the largest single species produced.

Production
8 ABARESAustralian fisheries and aquaculture statistics 2013
From 2002–03 to 2012–13• The total volume of fisheries and aquaculture production decreased by
21 019 tonnes (8 per cent), while the real gross value of production fell by $524 million (18 per cent).
• Most of the decline in value occurred from 2002–03 to 2004–05, when the real gross value of production declined by 13 per cent. Since 2004–05 the real gross value of production decreased by 8 per cent, representing a slowing in the rate of decline.
• The decline in the production volume is attributed to reductions in wild-catch production, particularly of Commonwealth wild-catch production, which declined by 37 532 tonnes (49 per cent) between 2002–03 and 2012–13. Driving the fall in production value was the decline in the gross value of wild-caught and aquaculture tuna, prawns, and rock lobster and abalone production. The combined value of these four species groups fell by 38 per cent in real terms over this period, and their combined contribution to total fisheries production fell from 59 per cent to 46 per cent.
• In contrast, farmed salmonids, predominantly from Tasmania, increased significantly in both value and volume terms. Over this decade, the value of farmed salmonids increased by 222 per cent ($343 million) and its production volume rose by 179 per cent (27 553 tonnes).
Top five by volume and value in 2012–13
Volume(wild-catch and aquaculture—Tables 2 and 17)
Value(wild-catch and aquaculture—Tables 2 and 17)
Species Volume Species Value
Salmonids 42 978 tonnes Salmonids $497 million
Australian sardine 38 437 tonnes Rock lobster $451 million
Prawns 21 145 tonnes Prawns $277 million
Oyster 12 530 tonnes Abalone $190 million
Tuna 11 376 tonnes Tuna $177 million
Production by sectorThe gross value of Australian Commonwealth and jurisdiction wild-catch fisheries and aquaculture production, is given in Table 1. Production and value summaries for each sector are given in Table 2 (wild-catch sector) and Tables 15 to 17 (aquaculture sector).
In 2012–13 the total volume of Australian fisheries production declined slightly, by 1 per cent (3480 tonnes) to 233 119 tonnes, not including southern bluefin tuna caught in the Southern Bluefin Tuna Fishery and introduced into farms in South Australia. The gross value of Australian fisheries production rose by 3 per cent ($77 million), to reach $2.4 billion in 2012–13. This was primarily driven by increases in the production value of Western Australian and Tasmanian wild-catch fisheries and increases in the production value of South Australian and Northern Territory aquaculture.

Production
9ABARESAustralian fisheries and aquaculture statistics 2013
Wild-catch fisheries continue to contribute most to Australian fisheries production, both in value and volume terms. However, since 2004–05 Australia’s aquaculture sector has followed an increasing trend. In 2012–13 the wild-catch sector was valued at $1.4 billion, representing 57 per cent of Australian total fisheries production, and the aquaculture sector contributed $1 billion (43 per cent) to total fisheries production (Figure 5). The value for aquaculture production has been adjusted to exclude southern bluefin tuna inputs into South Australian tuna farms.
From 2002–03 to 2012–13 the value of state and territory wild-catch production decreased by $554 million (34 per cent) in real terms (Figure 5). The value of Commonwealth fisheries production also declined, by $222 million (41 per cent) from $541 million in 2002–03 to $320 million in 2012‒13. The real value of aquaculture production (excluding southern bluefin tuna farm input) increased by $172 million (21 per cent) over the same period.
FIGURE 5 Real value of Australian fisheries production, by sector, 2002–03 to 2012–13a
2012–13$b
Aquaculture
State and territorywild catchCommonwealth wild catch
2012–13p
2010–11
2008–09
2006–07
2004–05
2002–03
a Aquaculture total has been adjusted to exclude southern bluefin tuna caught in the Commonwealth Southern Bluefin Tuna Fishery and introduced into farms in South Australia. This avoids double counting.p Preliminary estimate.Source: ABARES
0.5
1.0
1.5
2.0
2.5
3.0
3.5

Production
10 ABARESAustralian fisheries and aquaculture statistics 2013
Box 3 Gross value of fisheries productionGross value of fisheries production is a useful measure that provides industry and policymakers with information about the gross income generated from the harvest of wild-catch stocks and aquaculture production, within wild-catch and aquaculture fisheries and across jurisdictions. These values also provide an estimate of the activity level, in value terms, of fisheries and relative value of harvest across species.
The use of gross value of production as a measure of the production value of Australian fisheries in official statistics began in the early 1900s; it is a measure of the value of fisheries production generated by commercial fishers or produced by aquaculture farmers. The publication of official gross value of production statistics for Australian fisheries, by jurisdiction and at a national level, was undertaken by the Australian Bureau of Statistics (ABS) from 1935 to the late 1980s (ABS 1989; CBCS 1936). The ABS no longer collects statistics on Australian fisheries. Since the early 1990s ABARES has produced the Australian fisheries statistics publication. This publication presents statistics on the value of production of fisheries products for each Australian fishery jurisdiction, using data provided by each state or territory jurisdiction. Information on the international trade in fisheries products is drawn from ABS data.
The gross value of production is calculated by multiplying the weight of production by the landed unit value. The landed unit value is defined as the beach price for fish species caught in wild-catch fisheries and the farmgate price for fisheries products produced in aquaculture establishments. When defined this way these prices broadly reflect the unit prices that fishers receive for their catch or that aquaculture farmers receive for their production. The unit landed value does not include any margins associated with the marketing (including freight) and services added when seafood is processed and on-sold. The use of landed value (beach price) in deriving gross value of production is common across jurisdictions.
Price data can be derived from a range of sources, including fishers and aquaculture farm operators, seafood markets and seafood buyers and processors. For some jurisdictions, the values are collected by the fisheries management authority; other jurisdictions depend on information provided by a relatively small sample of buyers. As most fish is sold on a market away from the point of landing or aquaculture farm gate, transport and marketing margins usually need to be subtracted to estimate the beach/farmgate price received by commercial fishers and aquaculture farmers, respectively.
To value production at the point of landing, whole weight equivalents are used in the gross value of production calculation for each species being valued. By valuing production in whole weight equivalents, comparisons across regions and species are possible. Whole weight equivalents for semi-processed fish are obtained by applying conversions factors for each species where production is not landed whole, but in a semi-processed state such as gutted, headed and gutted, or otherwise reduced condition.

Production
11ABARESAustralian fisheries and aquaculture statistics 2013
Wild catchIn 2012–13 the total production volume of the wild-catch sector declined by 2084 tonnes (1 per cent) to 157 252 tonnes. This was mainly driven by declines in the production volume of finfish species, which decreased by 5444 tonnes (5 per cent). By contrast, the production volume of wild-catch molluscs increased by 28 per cent (3389 tonnes) between 2011–12 and 2012–13, reaching 15 643 tonnes.
In value terms, wild-catch production increased by 6 per cent ($78 million) to $1.4 billion in 2012–13 (Figure 6). This was driven by increases in the production values of molluscs and crustaceans, which increased by 13 per cent ($24 million) and 10 per cent ($64 million), respectively. By contrast, the production value of finfish declined by 1 per cent ($6 million) to $446 million. The wild-catch production value increased in 2012–13 primarily because of rises in production volume of high valued products, such as rock lobster and scallops. A 15 per cent increase in the volume of rock lobster contributed to the value of rock lobster increasing by 14 per cent ($57 million) to $451 million in 2012–13. The 89 per cent (3187 tonnes) increase in the production volume of scallops led to a 78 per cent ($6 million) increase in its production value.
Since 2002–03 the real gross value of wild-catch production decreased by 36 per cent ($775 million) in real terms (Figure 6). Falls occurred across all major wild-caught species over this decade. The largest declines occurred for prawns ($186 million), rock lobster ($143 million), abalone ($111 million) and tuna ($104 million).
FIGURE 6 Real value of Australian wild-catch production, 2002–03 to 2012–13
OtherOther finfish Tuna
AbalonePrawnsRock lobster
2012–13p
2010–11
2008–09
2006–07
2004–05
2002–03
p Preliminary estimate.Source: ABARES
0.5
1.0
1.5
2.0
2.5
2012–13$b
FinfishKey species: tuna, Australian sardine, sharks, coral trout, flat head, whiting
Tuna continued to dominate the value of wild-catch finfish production in 2012–13, with a value of $61 million (14 per cent of total wild-caught fish production). However, this was a 2 per cent ($1 million) decline in production value compared with 2011–12. This was the result of a decline in the unit price of tuna, which declined by 9 per cent. Most commercial tuna produced in Australia comes from Commonwealth fisheries. The two largest Commonwealth tuna fisheries are the Southern Bluefin Tuna Fishery and the Eastern Tuna and Billfish Fishery.

Production
12 ABARESAustralian fisheries and aquaculture statistics 2013
The Southern Bluefin Tuna Fishery and Eastern Tuna and Billfish Fishery wild-catch production each accounted for 11 per cent of total Commonwealth production by volume. In 2012–13 the value of southern bluefin tuna caught in the Southern Bluefin Tuna Fishery declined by 6 per cent ($2 million) as a result of a 7 per cent (309 tonnes) decline in the volume of production. The value and volume of tuna production in the Eastern Tuna and Billfish Fishery fell by 11 per cent ($3 million) and 8 per cent (360 tonnes), respectively.
In volume terms, Australian sardine dominated the landings in Australia’s wild-catch finfish sector. With a volume of 38 437 tonnes, Australian sardine contributed 35 per cent to the total volume of fish species landed in the wild-catch sector in 2012–13. Other key fish species caught in 2012–13 included sharks ($27 million, 5720 tonnes), coral trout ($25 million, 774 tonnes), flathead ($26 million, 3892 tonnes) and whiting ($17 million, 2851 tonnes).
Between 2002–03 and 2012–13 the real gross value of wild-catch finfish production decreased by 37 per cent ($263 million) in real terms. Reductions in value occurred across most major wild-caught species over this period. The largest declines occurred for tuna, which decreased by 63 per cent ($104 million).
CrustaceansKey species: rock lobster, prawns
Rock lobster remains the highest value species group for wild-caught crustaceans in 2012–13. The value of rock lobster production rose by 14 per cent ($57 million) to $451 million, in line with a 15 per cent (1403 tonnes) increase in its production volume. In 2012–13 rock lobster accounted for 62 per cent of total wild-caught crustaceans by value and 32 per cent by volume.
Despite a 6 per cent (1091 tonnes) fall in its production volume, prawns remain the highest wild-caught crustacean species by volume. In 2012–13 prawn production accounted for 53 per cent (17 403 tonnes) of total volume of wild-caught crustaceans and 30 per cent ($217 million) of total value.
Between 2002–03 and 2012–13 the real gross value of wild-catch crustaceans production decreased by 33 per cent ($352 million) in real terms. Falls occurred across all major wild-caught species over this period. The largest declines occurred for prawns and rock lobster, which decreased by 46 per cent ($186 million) and 24 per cent ($143 million), respectively.
MolluscsKey species: abalone, scallops
For wild-caught mollusc production, abalone was the highest valued species in 2012–13 with a 10 per cent ($15 million) increase in its production value to $166 million. The increase in production value was primarily driven by a 9 per cent increase in the average unit price for abalone and a 1 per cent (65 tonnes) increase in the production volume. In 2012–13 abalone production was valued at $166 million, constituting 81 per cent of total mollusc production.

Production
13ABARESAustralian fisheries and aquaculture statistics 2013
In volume terms, scallops have historically been the largest species group produced, accounting for an average of 48 per cent of total mollusc production from 2002–03 to 2010–11. However, in 2011–12 scallop production decreased considerably, by 49 per cent (3392 tonnes) to 3563 tonnes, leaving abalone as the largest mollusc species group by volume and value. The fall in scallop production volume in 2011–12 reflects both poorer abundance and condition of scallops across Commonwealth and state fisheries. Scallop production volume recovered in 2012–13 with an 89 per cent (3187 tonnes) increase, which led to its production value increasing by 78 per cent ($6 million) to $15 million in 2012–13.
AquacultureIn 2012–13 the total production volume of the aquaculture sector declined by 1767 tonnes (2 per cent) to 80 066 tonnes. This was mainly driven by a decline in the production volume of fishfin species and crustaceans, which declined by 2291 tonnes (4 per cent) and 283 tonnes (7 per cent), respectively. The production volume of aquaculture molluscs remained relatively constant at 16 838 tonnes.
In value terms, the gross value of aquaculture production decreased by $6.7 million (1 per cent) to $1 billion in 2012–13 (Figure 7). This was driven by declines in the production value of finfish, molluscs, and crustaceans, which declined by 3 per cent ($24 million), 6 per cent ($14 million) and 1 per cent ($0.3 million), respectively. The decline in the value of finfish production was most prominent in 2012–13 and was driven primarily by the decline in production value of salmonids, which declined by 3 per cent ($17 million).
Since 2002–03 the real gross value of aquaculture production has increased by 12 per cent ($108 million), in real terms. The largest increase over this decade came from the production value of salmonids and edible oysters. Salmonids value of production rose by $343 million (222 per cent), while the value of edible oysters increased by $14 million (17 per cent).
FIGURE 7 Real value of Australian aquaculture production, 2002–03 to 2012–13
OtherPrawnsEdible oyster
Pearl oysterSalmonidsTuna
2012–13p
2010–11
2008–09
2006–07
2004–05
2002–03
p Preliminary estimate.Source: ABARES
2012–13$b
0.2
0.4
0.6
0.8
1.0
1.2

Production
14 ABARESAustralian fisheries and aquaculture statistics 2013
FinfishKey species: salmonids, tuna
The largest contributor to Australian aquaculture production in 2012–13 was salmonids, which made up 54 per cent of total aquaculture production volume and 48 per cent of the value. The production value of farmed salmonids declined by $17 million (3 per cent) between 2011–12 and 2012–13, to $497 million. This was driven by a 3 per cent (1173 tonnes) decrease in production volume. Most salmonids production (97 per cent) occurs in Tasmania. Rapid growth of this species group in Tasmania since 2005–06 has contributed significantly to expanded Australian salmonids production. Compared with 2004–05, the real value of Australian farmed salmonids production increased by 172 per cent ($314 million). The volume of production also increased considerably, by 152 per cent (25 915 tonnes), over the same period.
Farmed tuna is the second largest contributor by value and volume to Australian aquaculture production. Southern bluefin tuna is caught from Commonwealth waters using purse seine methods, then fattened in farms near Port Lincoln in South Australia. Australian farmed tuna consists solely of farmed southern bluefin tuna from South Australia, which accounted for 15 per cent of the total value of Australian aquaculture production in 2012–13. The value of farmed tuna production rose by $4 million (2 per cent) between 2011–12 and 2012–13, to $154 million. This was primarily due to a 6 per cent (399 tonnes) increase in its volume of production. Almost 90 per cent of Australia’s tuna production is exported, mostly to the Japanese sashimi market and the United States, but increasingly to Thailand. As a result, tuna prices depend on the exchange rate between the Australian dollar and the Japanese yen, demand from the Japanese market and global tuna production. The average tuna price declined in 2012–13, owing to slowing Japanese demand for tuna (FAO Globefish 2013).
CrustaceansKey species: prawns
Aquaculture prawns dominated the production of crustaceans in 2012–13 by value and volume. In 2012–13 prawns accounted for 6 per cent of the total value of Australian aquaculture production. Between 2011–12 and 2012–13 the value of farmed prawns remained relatively stable at $60 million despite a 7 per cent (279 tonnes) decrease in its production volume.
Between 2002–03 and 2012–13 the gross value of aquaculture crustaceans production declined by 20 per cent ($15 million) in real terms. The largest decline over this period was for the production value of prawns, which declined by $13 million (18 per cent). By contrast, the production volume of prawns increased by 11 per cent (377 tonnes) over the same period.
MolluscsKey species: edible oysters
Aquaculture edible oysters dominated the production of molluscs in 2012–13 by value and volume. In 2012–13 edible oysters accounted for 9 per cent of the total value of Australian aquaculture production. Between 2011–12 and 2012–13 edible oysters increased in value by $4 million (5 per cent) to $95 million. This was primarily the result of a 5 per cent increase in its average unit price.

Production
15ABARESAustralian fisheries and aquaculture statistics 2013
Between 2002–03 and 2012–13 the gross value of aquaculture molluscs production declined by 20 per cent ($51 million) in real terms. The largest decline over this period came from the production value of pearl oysters, which declined by $83 million (51 per cent). By contrast, the production volume of aquaculture molluscs increased by 25 per cent (3347 tonnes) over the same period. This was driven primarily by the production volume of edible oysters, which increased by 17 per cent (1852 tonnes) between 2002–03 and 2012–13.
Production by jurisdictionThe gross volume and value of Australian fisheries and aquaculture production by jurisdiction and location of catch is given in Tables 3 to 6. Production and value summaries for each jurisdiction are given in Tables 7 to 14.
In 2012–13 Tasmania had the largest gross value of production ($696 million), accounting for 29 per cent of total fisheries production, followed by South Australia ($441 million, 19 per cent) and Western Australia ($427 million, 18 per cent) (Figure 8). Percentages are calculated based on the sum of gross jurisdictional production values, which have not been adjusted for tuna caught in the Southern Bluefin Tuna Fishery and introduced into South Australian farms. Commonwealth-managed fisheries accounted for 13 per cent ($318 million) of the gross value of production.
FIGURE 8 Shares in gross value of Australian wild-catch and aquaculture production, by jurisdiction, 2002–03 and 2012–13a
2002–03
2012–13p
New South Wales 7%
Victoria 5%
Queensland 13%Western Australia 25%
South Australia 22%
Tasmania 12%
Northern Territory 2%
Commonwealth 18%
New South Wales 5%
Victoria 3%
Queensland 12%Western Australia 18%
South Australia 19%
Tasmania 29%
Northern Territory 2%
Commonwealth 13%
a Percentages are calculated based on the sum of gross jurisdictional production values. These values have notbeen adjusted for southern bluefin tuna caught in the Southern Bluefin Tuna Fishery and introduced into farms in South Australia. p Preliminary estimates.Source: ABARES

Production
16 ABARESAustralian fisheries and aquaculture statistics 2013
FIGURE 9 Value of Australian fisheries production, by jurisdiction, 2012–13ap
$m
JurisdictionLocation of catch
100
200
300
400
500
600
700
800
New SouthWales
Victoria
Queensland
Western Australia
SouthAustralia
Tasmania
NorthernTerritory
Commonwealth
a Location of catch and aquaculture production have been adjusted to exclude southern bluefin tuna caught inthe Southern Bluefin Tuna Fishery and introduced into farms in South Australia. Jurisdiction has not been adjusted.p Preliminary estimates.Source: ABARES
By location of catch—where Commonwealth catch is distributed to the states according to where it was caught—Tasmania accounted for the largest share of value (30 per cent), followed by Western Australia (21 per cent), South Australia (19 per cent) and Queensland (14 per cent).
New South WalesKey species groups: prawns (wild catch), sea mullet (wild catch), oysters (aquaculture)
In 2012–13 the gross value of New South Wales fisheries production was $124 million, of which the wild-catch sector accounted for $76 million or 62 per cent (Table 7). The aquaculture sector, which was valued at $48 million, accounted for 38 per cent. Compared with 2011–12, the gross value of NSW fisheries production declined by 0.2 per cent ($0.2 million) in 2012–13. This occurred along with a 10 per cent (1706 tonnes) decrease in production volumes, which fell to 15 783 tonnes (from 17 489 tonnes in 2011–12).
Wild catchIn 2012–13 the New South Wales wild-catch sector produced 11 597 tonnes of seafood, a decrease of 12 per cent (1603 tonnes) compared with 2011–12. The value of wild-catch production decreased marginally, by 1 per cent ($0.8 million) to $76 million. This was primarily attributable to a 10 per cent ($4 million) decline in the total value of finfish species, particularly yellowtail kingfish which declined by 53 per cent ($1.3 million), snapper by 22 per cent ($0.7 million) and school whiting by 19 per cent ($0.7 million).

Production
17ABARESAustralian fisheries and aquaculture statistics 2013
The most valuable wild-caught fisheries product in New South Wales was prawns. On average, it accounted for around 22 per cent of the total value of wild-catch production between 2002–03 and 2012–13. In 2012–13 the NSW wild-catch sector harvested 1487 tonnes of prawns, worth $17 million. School prawns often comprised a large proportion of the catch, accounting for 56 per cent (832 tonnes) of the total volume of production of wild-caught prawns in 2012–13, and contributing $6 million to the total value of production of the wild-catch sector. King prawns accounted for a smaller proportion of the catch (43 per cent or 641 tonnes), but contributed about $11 million in value terms.
The NSW wild-catch sector also comprised a range of finfish species in 2012–13, including sea mullet (2278 tonnes, valued at $7 million), eastern school whiting (837 tonnes, $3 million), bream (253 tonnes, $3 million), eastern Australian salmon (1316 tonnes, $2 million), snapper (230 tonnes, $2 million), and yellowtail kingfish (100 tonnes, $1 million). In 2012–13 the volume of production of wild-caught finfish decreased by 17 per cent (1831 tonnes) to 9014 tonnes compared with 2011–12. Thiswas mainly a result of a large decrease in the landed volume of sea mullet, which fell by 30 per cent (989 tonnes). The value of wild-caught finfish also decreased, by 10 per cent ($4 million) to $38 million in 2012–13.
AquacultureThe New South Wales aquaculture sector produced 4186 tonnes of seafood in 2012–13, a decrease of 2 per cent (103 tonnes) compared with 2011–12. Farmed oyster is the main aquaculture species produced in New South Wales, with a production value in 2012–13 of $36 million. Overall, the value of aquaculture production rose by 1 per cent ($0.6 million) to $48 million in 2012–13. This increase was largely driven by a 20 per cent (33 tonnes) increase in the volume of trout production to 198 tonnes. Compared with 2011–12, the value of farmed trout production rose by $0.3 million (19 per cent). The value of other New South Wales aquaculture products also increased in 2012–13. These included farmed oyster ($0.7 million, 2 per cent) and mussels ($0.2 million, 210 per cent). The increase in the production value of oysters was a result of an increase in the average unit price and the increase in the production value of mussels was the result of an increase in production volume.
VictoriaKey species groups: abalone (wild catch, aquaculture), southern rock lobster (wild catch), trout (aquaculture)
In 2012–13 the gross value of Victorian fisheries production was estimated to be $75 million. The wild-catch sector, valued at $54 million, accounted for 73 per cent of this total value (Table 8). The aquaculture sector accounted for the remaining 27 per cent, valued at $21 million. Compared with 2011–12, the gross value of fisheries production rose by 3 per cent ($1.8 million) in 2012–13, despite a 12 per cent decrease in the total volume of production.
Wild catchThe Victorian wild-catch sector produced 4236 tonnes of seafood in 2012–13, with a production value of $54 million. This was $0.9 million (2 per cent) lower than in 2011–12, largely because of a 45 per cent ($1.3 million) decline in the production value of wild-caught King George whiting ($1.3 million, 45 per cent) and southern rock lobster ($0.9 million, 5 per cent).

Production
18 ABARESAustralian fisheries and aquaculture statistics 2013
Production values of a large number of finfish species also declined, including eels, Australian sardine and Australian salmon. The key wild-caught species in Victoria in 2012–13 included abalone, valued at $26 million and 48 per cent of wild-catch production, southern rock lobster ($17 million, 31 per cent), King George whiting ($1.6 million, 3 per cent), snapper ($1 million, 2 per cent) and eels ($1 million, 2 per cent).
AquacultureThe value of Victorian aquaculture production rose by 16 per cent ($3 million) to $21 million in 2012–13. Abalone accounted for a large proportion of Victorian aquaculture production in value terms between 2008–09 and 2012–13. In 2012–13 aquaculture abalone production was valued at $11 million, contributing 54 per cent to total Victorian aquaculture production. This compares with a real production value of $7 million in 2008–09 (in 2012–13 dollars). Aquaculture abalone values for 2009–10 and 2010–11 were not reported because of confidentiality restrictions. The second highest valued aquaculture species group in 2012–13 was salmonids, contributing 27 per cent ($6 million) to total Victorian aquaculture production. Compared with 2011–12, the value and volume of salmonids production increased by 5 per cent ($0.3 million) and 38 per cent (281 tonnes), respectively.
QueenslandKey species groups: prawns (wild catch, aquaculture), coral trout (wild catch), crabs (wild catch), barramundi (aquaculture)
In 2012–13 Queensland fisheries’ gross value and volume of production increased by 3 per cent to $277 million and 10 per cent to 30 998 tonnes, respectively. Wild-catch production accounted for the majority of Queensland fisheries production, contributing $195 million (70 per cent) to total value and 24 859 tonnes (80 per cent) to total volume. The aquaculture sector made up the remaining 30 per cent ($82 million) of total value and 20 per cent (6140 tonnes) of total volume (Table 9).
Wild catchBetween 2002–03 and 2012–13 the largest wild-caught fisheries product in Queensland was prawns. An estimated 6093 tonnes of prawns were landed in 2012–13. This was an increase of 17 per cent (904 tonnes) compared with 2011–12. As a result, total value of wild-caught prawn production rose by 15 per cent ($9 million) compared with 2011–12, to $68 million in 2012–13. The increase in prawn production came primarily from increases in banana and king prawn catches, together increasing by 780 tonnes.
The second most valuable species caught in Queensland in 2012–13 was crabs. A total of 2835 tonnes were landed, which contributed $30 million to total production value in the wild-catch sector. This was 5 per cent ($1.2 million) lower than in 2011–12. Other key species landed in Queensland’s wild-catch sector included coral trout ($25 million, 751 tonnes), lobsters (mainly Queensland bugs) ($18 million, 728 tonnes), scallops ($12 million, 5393 tonnes), and barramundi ($9 million, 1028 tonnes).
All of these species improved in production value in 2012–13 except for barramundi, which fell by 31 per cent ($4 million). Overall, total Queensland wild-catch production increased by 5 per cent ($10 million), largely owing to increases in lobsters, prawns and scallops.

Production
19ABARESAustralian fisheries and aquaculture statistics 2013
AquacultureAquaculture production declined slightly in 2012–13, by 1 per cent ($0.7 million) to $82 million, which was primarily driven by a 4 per cent (278 tonnes) decline in production volumes. The highest valued aquaculture product in 2012–13 was farmed prawns, which was valued at $57 million and accounted for 69 per cent of total aquaculture production in Queensland. This was followed by farmed barramundi, with a value of $20 million (24 per cent), silver perch ($1 million, 1 per cent) and redclaw ($1 million, 1 per cent). In volume terms, farmed prawns and barramundi contributed 3519 tonnes and 2319 tonnes to Queensland aquaculture production, respectively. This reflects a reduction in the production of both species compared with 2011–12, with prawn production falling by 232 tonnes (6 per cent) and barramundi by 97 tonnes (4 per cent).
South AustraliaKey species groups: southern bluefin tuna (aquaculture), southern rock lobster (wild catch), prawns (wild catch), abalone (wild catch), oysters (aquaculture)
The gross value of fisheries production in South Australia rose by 1 per cent ($3 million), from $437 million in 2011–12 to $441 million in 2012–13. The aquaculture sector accounted for the largest proportion of this value, making up $243 million (55 per cent) of the state’s total production value. Wild-catch production was valued slightly lower, at $198 million, accounting for the remaining 45 per cent of the state’s total fisheries value.
Wild catchThe value of wild-catch production in South Australia declined in 2012–13, by 5 per cent ($11 million) to $198 million. This was mainly the result of a 10 per cent ($10 million) decline in the value of southern rock lobster production. Southern rock lobster is the most valuable wild-caught fisheries product in South Australia, accounting for 43 per cent ($86 million) of the state’s total wild-catch production by value in 2012–13. The 10 per cent decrease in production value of southern rock lobster was attributable to a 10 per cent decline in its average unit value.
By volume, Australian sardine was the largest single species caught in the South Australian wild-catch sector in 2012–13. It constituted around 79 per cent of total catch and 11 per cent of total value in the sector. Between 2011–12 and 2012–13 the volume of Australian sardine production declined by 5 per cent (1897 tonnes). By contrast, the production value increased by 2 per cent to $21 million.
Other key species landed in the South Australian wild-catch sector included prawns ($30 million, 1881 tonnes), abalone ($30 million, 876 tonnes), snapper ($4 million, 549 tonnes) and crabs ($4 million, 652 tonnes). In 2012–13 the value of wild-caught prawns rose by 5 per cent ($1.2 million) despite a 4 per cent decline in production volume. The production value and volume of abalone increased by 2 per cent ($1 million) and 6 per cent (53 tonnes), respectively. The production value and volume of crabs declined by 30 per cent ($2 million) and 13 per cent (96 tonnes), respectively.

Production
20 ABARESAustralian fisheries and aquaculture statistics 2013
AquacultureIn 2012–13 South Australian aquaculture production increased by 6 per cent ($14 million) in value terms. This was primarily driven by an increase in the value of oysters and southern bluefin tuna, which increased by $4 million (13 per cent) and $4 million (2 per cent), respectively. Southern bluefin tuna is the most valuable fishery species produced in South Australia, accounting for 63 per cent of aquaculture production value and 35 per cent of total fisheries production value in South Australia in 2012–13. Most southern bluefin tuna in Australia is caught by Commonwealth-endorsed vessels in the Great Australian Bight and delivered to aquaculture farms off Port Lincoln in South Australia for fattening. Almost all farmed southern bluefin tuna is exported to Japan. The increase in the production value of southern bluefin tuna followed a 6 per cent (399 tonnes) increase in its production volume.
Western AustraliaKey species groups: western rock lobster (wild catch), pearls (aquaculture), prawns (wild catch)
The gross value of Western Australian fisheries production was $427 million in 2012–13. This represents an increase of 10 per cent ($38 million) compared with 2011–12. The total value of fisheries production for Western Australia included $331 million of wild-catch production, 78 per cent of the state’s total fisheries production value, and $96 million of aquaculture production (the remaining 22 per cent). The total volume of fisheries production also increased in 2012–13, by 2 per cent (432 tonnes) to 20 378 tonnes. Most of the increase in production value and volume in 2012–13 came from the wild-catch sector.
Wild catchProduction value of the Western Australian wild-catch sector rose by 18 per cent ($51 million) in 2012–13, mainly because of increases in the value of western rock lobster production. The value of western rock lobster production increased by 34 per cent ($60 million) to $237 million, which was primarily driven by a 24 per cent (1176 tonnes) increase in the volume of western rock lobster production.
The production of other wild-caught crustaceans declined in value and volume terms. The value of prawns declined by 19 per cent ($6 million) and the value of crabs fell by 4 per cent. Both decreases were the result of falls in the volume of production. In 2012–13 the volume of prawn and crab production decreased by 23 per cent (703 tonnes) and 17 per cent (93 tonnes), respectively. Similarly, the production value of most finfish species decreased. These included tropical snappers, which declined by 7 per cent or $1 million, Australian sardine (23 per cent) and emperors (14 per cent).

Production
21ABARESAustralian fisheries and aquaculture statistics 2013
AquacultureIn contrast to wild-catch production, the value of aquaculture production in Western Australia decreased in 2012–13, falling by 12 per cent ($13 million) to $96 million. This was mainly driven by a 15 per cent ($14 million) decrease in the value of pearls, which is the most valuable aquaculture product in the state. Pearls accounted for around 83 per cent ($79 million) of total aquaculture production by value in 2012–13. Edible aquaculture accounted for the remaining 17 per cent. Edible aquaculture in Western Australia mainly consists of marron, mussels and fish species. This component of aquaculture has been increasing in recent years. In 2012–13 the value of edible aquaculture products increased by 5 per cent ($1 million) to $16 million. This was driven mostly by increases in the value of aquaculture fish species (9 per cent, $1 million).
TasmaniaKey species groups: salmonids (aquaculture), abalone (wild catch), southern rock lobster (wild catch)
In 2012–13 the gross value of Tasmanian fisheries production increased slightly, by $3 million to $696 million, and the volume of production increased by 951 tonnes to 54 146 tonnes. Most of Tasmania’s fisheries production comes from the aquaculture sector, which contributed 86 per cent (46 375 tonnes) to total production in volume terms and 75 per cent ($520 million) in value terms. The wild-catch sector accounted for the remaining 14 per cent (7771 tonnes) of production volume and 25 per cent ($176 million) of production value.
Wild catchThe volume of wild-catch production increased by 64 per cent (3039 tonnes) from 2011–12 to 2012–13. This contributed to a 13 per cent ($20 million) increase in the value of Tasmanian wild-catch production. Most of the increase came from molluscs production, particularly scallops, which increased from 85 tonnes to to 811 tonnes. Abalone is Tasmania’s highest value wild-caught species. It accounted for 55 per cent ($97 million) of wild-catch production in value terms in 2012–13. This represented a 16 per cent ($13 million) increase compared with 2011–12 and was driven primarily by a 15 per cent increase in its unit value. Rock lobster is the second most valuable wild-caught species in Tasmania and accounted for 37 per cent ($65 million) of wild-catch production by value in 2012–13. Compared with 2011‒12, this represents a 3 per cent ($2 million) increase.
AquacultureCompared with 2011–12, Tasmanian aquaculture production declined by 4 per cent (2088 tonnes) in 2012–13. This was primarily driven by a decline in salmonids production. Salmonids is the largest aquaculture species group in Tasmania, in both value and volume terms. In 2012–13 salmonids production accounted for 90 per cent of Tasmania’s aquaculture production volume and 94 per cent of the value of Tasmanian aquaculture. Both the value and volume of salmonids production declined in 2012–13. The volume of salmonids production decreased by 3 per cent (1487 tonnes) to 41 762 tonnes and production value declined by 3 per cent ($17 million) to $489 million.

Production
22 ABARESAustralian fisheries and aquaculture statistics 2013
Another important Tasmanian aquaculture product is edible oysters, which accounted for 7 per cent of the state’s aquaculture production volume in 2012–13 and contributed $23 million towards Tasmania’s gross value of production. The remainder of Tasmania’s aquaculture production in 2012–13 consisted of mussels (1041 tonnes, valued at $4 million) and abalone (123 tonnes, $4 million).
Northern TerritoryKey species groups: pearls (aquaculture), goldband snapper (wild catch), mud crab (wild catch), barramundi (wild catch, aquaculture), mackerel (wild catch)
Fisheries production in the Northern Territory was valued at $58 million in 2012–13, which was a 13 per cent ($7 million) increase from 2011–12. Wild-catch production was valued at $34 million and accounted for 59 per cent of the Northern Territory’s total production value. The aquaculture sector was valued at $24 million and accounted for the remaining 41 per cent. The total volume of production declined by 17 per cent (1163 tonnes) between 2011–12 and 2012–13.
Wild catchIn 2012–13 the Northern Territory wild-catch sector harvest declined by around 10 per cent, amounting to 619 tonnes of seafood. The value of wild-catch production also declined, by 4 per cent ($1 million) to $34 million. This was mainly driven by declines in the value of crab and shark production, which dropped by $2 million (22 per cent) and $1 million (58 per cent), respectively. In 2012–13 crab production constituted 19 per cent of total wild-catch production by value. This is followed by gold band snapper (15 per cent), mackerel (12 per cent) and barramundi (11 per cent).
AquacultureThe Northern Territory’s value of aquaculture production increased by 39 per cent ($7 million) in 2012–13 compared with 2011–12. By contrast, the volume of aquaculture production in the Northern Territory decreased by 17 per cent (1163 tonnes) to 5805 tonnes in 2012–13. The species value of production breakdown cannot be provided for 2012–13 because of confidentiality requirements.
CommonwealthKey species groups: prawns (wild catch), tuna (wild catch), sharks (wild catch)
In 2012–13 the gross value of production of Commonwealth fisheries increased by 4 per cent ($11 million) to $320 million compared with 2011–12. The increase in value was primarily the result of increases in the production value of tiger prawns caught in the Northern Prawn Fishery, and the total production value of the Torres Strait fisheries and the Southern and Eastern Scalefish and Shark Fishery. In 2012–13 the volume of tiger prawn production in the Northern Prawn Fishery increased by 55 per cent (475 tonnes). As a result, the value of tiger prawns increased by 57 per cent ($9 million) to $26 million. The total production value of the Torres Strait fisheries increased by 13 per cent ($3 million) because of an increase in the average unit prices as production volume declined by 9 per cent. The increase in the production value of the Southern and Eastern Scalefish and Shark Fishery (9 per cent, $7 million) was also a result of an increase in the average unit price of species caught in the fishery.

Production
23ABARESAustralian fisheries and aquaculture statistics 2013
The Southern and Eastern Scalefish and Shark Fishery was the most valuable Commonwealth fishery in 2012–13. It comprises three separate fishery sectors: the Commonwealth Trawl Sector ($56 million), the Gillnet, Hook and Trap Sector ($22 million) and the Great Australian Bight Trawl Sector ($12 million). In 2012–13 the value of the largest Southern and Eastern Scalefish and Shark Fishery sector, the Commonwealth Trawl Sector, increased by 11 per cent ($5.7 million) compared with 2011–12. Most of this increase was attributable to increases in the production values of blue grenadier, tiger flathead and school whiting, which together increased by $7 million to $34 million. The increase in the production value of these three species was mainly attributable to increases in the species’ average unit prices. Production value of the Commonwealth Trawl Sector continued to be dominated by tiger flathead, blue grenadier, pink ling, school whiting and silver warehou. In 2012–13 these species collectively accounted for 63 per cent (8557 tonnes) of the sector’s production volume and 71 per cent ($40 million) of production value.
In 2012–13 the Northern Prawn Fishery remained the second most valuable Commonwealth fishery with a 10 per cent ($6 million) increase in its gross value of production. This increase was attributable to a rise in the value of tiger prawn production, which increased by 57 per cent ($9 million) compared with 2011–12.
Prawns remained the most valuable species caught in Commonwealth fisheries in 2012–13, valued at $75 million. This was followed by tuna ($59 million). Together these products accounted for 42 per cent of the gross value of Commonwealth fisheries production in 2012–13. Other valuable species included tropical rock lobster ($20 million), flathead ($24 million), gummy shark ($16 million) and blue grenadier ($16 million), which collectively accounted for 23 per cent of Commonwealth fisheries’ gross value of production.

24 ABARESAustralian fisheries and aquaculture statistics 2013
Trade
Fast factsExports
In 2012–13• Australian fisheries products export earnings (edible and non-edible) declined
by 4 per cent ($52 million) to $1.2 billion.• The share of export earnings derived from edible fishery products increased
from 82 per cent in 2011–12 to 85 per cent in 2012–13. This was the result of an increase in the earnings from edible crustaceans and molluscs, which increased by 5 per cent.
• Total export earnings from edible fishery products remained relatively constant at $1 billion despite a 13 per cent reduction in the export volume of edible fisheries products.
• Non-edible products made up the remaining 15 per cent of Australian export earnings, with pearls remaining the highest contributor (88 per cent) to total non-edible export earnings.
From 2002–03 to 2012–13• The real value of Australian fisheries product exports dropped by 51 per cent
($1.2 billion).• Most of the decline in value occurred in the first half of the decade, a period in
which the Australian dollar strongly appreciated. Between 2004–05 and 2012–13 the real value of Australian fisheries product exports continued to decline, but at a slower pace.
• The real value of edible fisheries exports fell by 41 per cent ($944 million). Most of this decline was attributed to the decline in crustacean and mollusc exports ($567 million decrease), with the remaining decline attributed to a decrease in fish product exports (by $378 million).
• The real value of non-edible fisheries exports declined by 59 per cent ($299 million). Most of this decline can be attributed to the decrease in the value of pearl exports, which decreased by 62 per cent ($284 million).

Trade
25ABARESAustralian fisheries and aquaculture statistics 2013
Top five export value and destination, 2012–13
Value(edible and non-edible: Table 18)
Destination (edible and non-edible: Tables 24 and 25)
Species Value Destination Value
Rock lobster $447 million Hong Kong $371 million
Abalone $186 million Vietnam $294 million
Tuna $163 million Japan $269 million
Pearls a $151 million China $48 million
Prawns $52 million United States $39 million
a Includes items temporarily exported and re-imported.
Imports
In 2012–13• The total value of Australian imports of fisheries products (edible and non-edible)
increased by 3 per cent to $1.65 billion.• The value of edible fishery imports increased by 4 per cent ($54 million) to
$1.4 billion and contributed 87 per cent to the total import value of Australian fisheries products.
• Import value of non-edible fishery products made up the remaining 13 per cent, and was dominated by pearls that were temporarily exported.
From 2002–03 to 2012–13• The real value of Australian fisheries imports increased by 5 per cent ($76 million).• The real value of edible imports increased by 15 per cent ($185 million). This was
due to higher imports of edible fish, which increased by $123 million (16 per cent), and imports of edible crustaceans and molluscs, which rose by $62 million (13 per cent).
• The real value of non-edible fisheries imports decreased by 33 per cent ($109 million). Most of this decline was a result of a decrease in pearl imports (mainly re-imports of exported products), by 51 per cent to $108 million.
Top five imports by value and source, 2012–13
Value(edible and non-edible: Table 29)
Source(edible and non-edible: Tables 37 and 38)
Imported product Value Source Value
Prepared or preserved fish a $467 million Thailand $406 million
Frozen fish $275 million New Zealand $215 million
Frozen prawns $190 million China $205 million
Prepared or preserved prawns $114 million Vietnam $163 million
Pearls b $105 million Malaysia $81 million
a Includes items temporarily exported and re-imported. b Mostly re-imports.

Trade
26 ABARESAustralian fisheries and aquaculture statistics 2013
Exports and importsHistorically Australia has been a net importer of fisheries products in volume terms but a net exporter in value terms. This disparity reflects the different composition of Australian fisheries exports compared with imports. Australian fisheries exports are dominated by high value products, such as rock lobster, tuna and abalone, while imports largely consist of lower value products, such as frozen and canned fish, and frozen prawns.
In recent years the value of the net export gap closed and in 2007–08 Australia became a net importer of fisheries products in value terms (Figure 10). This continued in 2012–13, with the value of imports increasing by $42 million (3 per cent) compared with 2011–12. Export value fell by $52 million (4 per cent), further increasing the net import gap in the trade value of Australian fisheries products. In 2012–13 the total value of Australian fisheries exports was $1.2 billion. Exports of edible fisheries products, such as fish, crustaceans and molluscs were valued at $1 billion and accounted for 85 per cent of the total export value. Exports of non-edible fisheries products, such as pearls, fish meals and marine fats and oils, accounted for the remaining 15 per cent ($173 million) of total fishery exports.
FIGURE 10 Real value of Australian fisheries exports and imports, 2002–03 to 2012–13
Imports
Exports
2012–13$b
0.5
1.0
1.5
2.0
2.5
2012–13
2010–11
2008–09
2006–07
2004–05
2002–03
Source: Australian Bureau of Statistics
In real terms, the value of Australian fisheries exports fell by 51 per cent ($1.2 billion) from $2.4 billion in 2002–03, to $1.2 billion in 2012–13, with most of the fall occurring between 2002–03 and 2007–08 (Figure 10). The main factors contributing to the decline between 2002–03 and 2012–13 were a 43 per cent (26 419 tonnes) decrease in the volume of edible exports and falling unit export prices for most major export products, particularly prawns, tuna and abalone. The decline in unit export prices was the result, in part, of an appreciation in the Australian dollar against both the Japanese yen and the US dollar between 2002–03 and 2012–13. Between 2004–05 and 2012–13 the real value of Australian fisheries exports decreased by 39 per cent ($752 million) as a result of lower export unit prices following a 37 per cent appreciation of the Australian dollar against the US dollar.
Trade
27ABARESAustralian fisheries and aquaculture statistics 2013
In 2012–13 the total value of Australian fisheries imports increased by 3 per cent ($42 million) to $1.65 billion. Approximately 87 per cent of import value consisted of edible fishery products, which increased in value terms by 4 per cent ($54 million) to $1.4 billion. Between 2004–05 and 2012–13 the value of Australian fisheries imports, in real terms, rose by 13 per cent ($185 million), following a decline between 2001–02 and 2003–04. The main factor contributing to this increase was a 23 per cent (42 176 tonnes) increase in the quantity of edible imports (excluding live products), which was distributed between fish, crustacean and mollusc products.
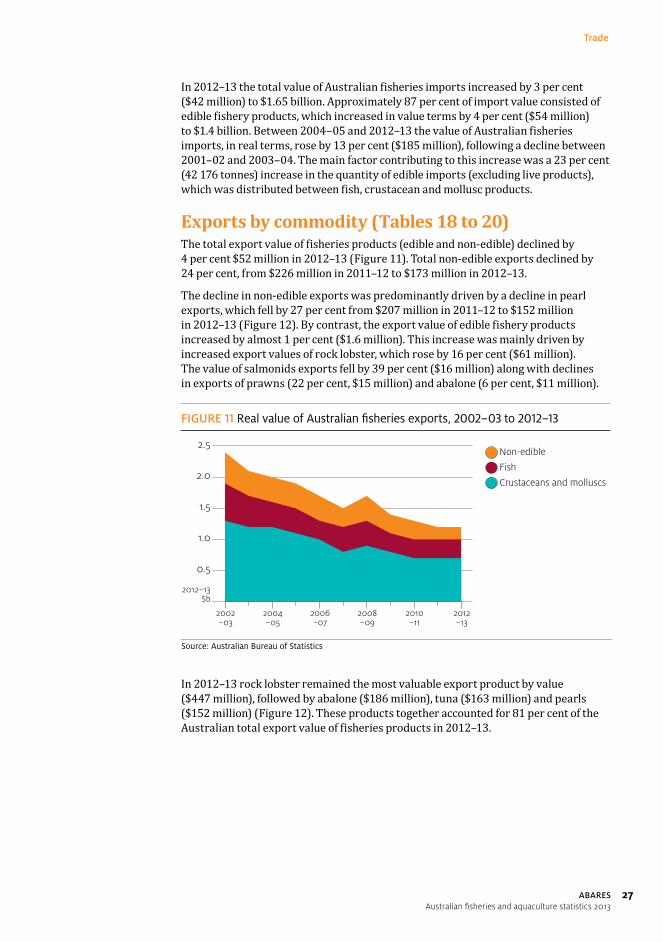
Exports by commodity (Tables 18 to 20)The total export value of fisheries products (edible and non-edible) declined by 4 per cent $52 million in 2012–13 (Figure 11). Total non-edible exports declined by 24 per cent, from $226 million in 2011–12 to $173 million in 2012–13.
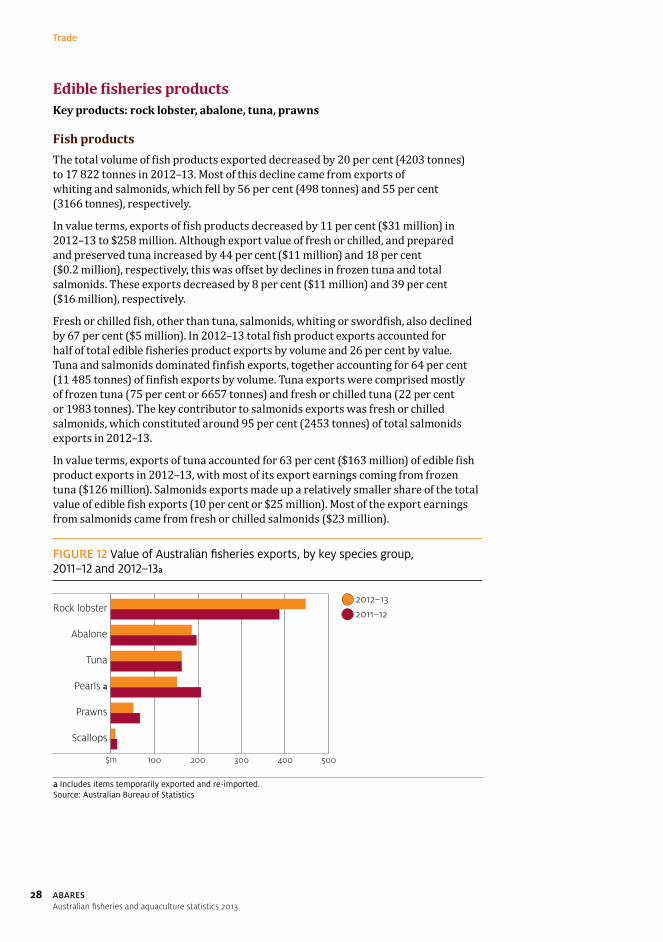
The decline in non-edible exports was predominantly driven by a decline in pearl exports, which fell by 27 per cent from $207 million in 2011–12 to $152 million in 2012–13 (Figure 12). By contrast, the export value of edible fishery products increased by almost 1 per cent ($1.6 million). This increase was mainly driven by increased export values of rock lobster, which rose by 16 per cent ($61 million). The value of salmonids exports fell by 39 per cent ($16 million) along with declines in exports of prawns (22 per cent, $15 million) and abalone (6 per cent, $11 million).
FIGURE 11 Real value of Australian fisheries exports, 2002–03 to 2012–13
2012–13$b
Non-edible
Fish
Crustaceans and molluscs
2012–13
2010–11
2008–09
2006–07
2004–05
2002–03
0.5
1.0
1.5
2.0
2.5
Source: Australian Bureau of Statistics
In 2012–13 rock lobster remained the most valuable export product by value ($447 million), followed by abalone ($186 million), tuna ($163 million) and pearls ($152 million) (Figure 12). These products together accounted for 81 per cent of the Australian total export value of fisheries products in 2012–13.
Trade
28 ABARESAustralian fisheries and aquaculture statistics 2013
Edible fisheries productsKey products: rock lobster, abalone, tuna, prawns
Fish productsThe total volume of fish products exported decreased by 20 per cent (4203 tonnes) to 17 822 tonnes in 2012–13. Most of this decline came from exports of whiting and salmonids, which fell by 56 per cent (498 tonnes) and 55 per cent (3166 tonnes), respectively.
In value terms, exports of fish products decreased by 11 per cent ($31 million) in 2012–13 to $258 million. Although export value of fresh or chilled, and prepared and preserved tuna increased by 44 per cent ($11 million) and 18 per cent ($0.2 million), respectively, this was offset by declines in frozen tuna and total salmonids. These exports decreased by 8 per cent ($11 million) and 39 per cent ($16 million), respectively.
Fresh or chilled fish, other than tuna, salmonids, whiting or swordfish, also declined by 67 per cent ($5 million). In 2012–13 total fish product exports accounted for half of total edible fisheries product exports by volume and 26 per cent by value. Tuna and salmonids dominated finfish exports, together accounting for 64 per cent (11 485 tonnes) of finfish exports by volume. Tuna exports were comprised mostly of frozen tuna (75 per cent or 6657 tonnes) and fresh or chilled tuna (22 per cent or 1983 tonnes). The key contributor to salmonids exports was fresh or chilled salmonids, which constituted around 95 per cent (2453 tonnes) of total salmonids exports in 2012–13.
In value terms, exports of tuna accounted for 63 per cent ($163 million) of edible fish product exports in 2012–13, with most of its export earnings coming from frozen tuna ($126 million). Salmonids exports made up a relatively smaller share of the total value of edible fish exports (10 per cent or $25 million). Most of the export earnings from salmonids came from fresh or chilled salmonids ($23 million).
FIGURE 12 Value of Australian fisheries exports, by key species group, 2011–12 and 2012–13a
2012–13
2011–12
$m
Scallops
Prawns
Pearls a
Tuna
Abalone
Rock lobster
100 200 300 400 500
a Includes items temporarily exported and re-imported.Source: Australian Bureau of Statistics

Trade
29ABARESAustralian fisheries and aquaculture statistics 2013
Crustacean and mollusc productsIn 2012–13 exports of crustaceans and molluscs increased by 5 per cent ($33 million) in value terms, to $744 million, but decreased by 5 per cent (955 tonnes) in volume terms, to 17 482 tonnes. The increase in value was primarily driven by an increase in the export value of rock lobster, which rose by 16 per cent ($61 million) to $447 million. Apart from rock lobster, which increased by 13 per cent in volume (904 tonnes), the fall in volume came from all other export species of crustaceans and molluscs: prawns (27 per cent or 1475 tonnes), crabs (44 per cent, 355 tonnes), abalone (11 per cent, 331 tonnes) and scallops (6 per cent, 26 tonnes).
Crustacean and mollusc exports accounted for 49 per cent of total edible export volume and 74 per cent of edible export value in 2012–13. Rock lobster exports accounted for 60 per cent ($447 million) of crustacean and mollusc exports in value terms. This was followed by abalone (25 per cent or $186 million) and prawns (7 per cent or $52 million). Prawn and abalone exports decreased in value in 2012–13, by 22 per cent ($15 million) and 6 per cent ($11 million), respectively.
Non-edible fisheries productsKey products: pearls
The value of non-edible fisheries product exports decreased by 24 per cent ($53 million) in 2012–13, to $173 million. This decline was mostly a result of a 27 per cent ($55 million) decrease in the value of pearl exports. Pearl exports were valued at $152 million in 2012–13, making it the most valuable non-edible export product. Pearls accounted for 88 per cent of the total non-edible export value and 13 per cent of the total value of fisheries products exports. A large portion of this is temporarily exported and then re-imported into Australia. In 2012–13 re-imported pearls were valued at $82 million. The remaining 12 per cent of non-edible fisheries product exports was made up of marine fats and oils, ornamental fish, fish meal and other non-edible products.
Exports by destination (Tables 21 to 25)Edible fisheries products
Main destinations: Hong Kong, VietnamIn 2012–13 Australia’s major seafood export destinations were Hong Kong ($317 million), Vietnam ($293 million), Japan ($236 million), China ($45 million) and Singapore ($31 million), which together accounted for 92 per cent of the total value of Australian seafood exports in 2012–13 (Figure 13). Japan was Australia’s main export destination for fisheries products from 2002–03 to 2004–05. Since then, the majority of Australian fisheries products are exported to Hong Kong.
Most finfish products were exported to Japan (mainly tuna and salmonids), Hong Kong (live fish) and Vietnam (fresh or chilled salmonids). Hong Kong and Japan remained the primary markets for Australia’s exports of crustaceans and molluscs. Hong Kong remained the largest market for all preparations (live, fresh or chilled, frozen or cooked and prepared or preserved) of abalone. China became a large market for live, fresh or chilled abalone and unfrozen rock lobster exports.

Trade
30 ABARESAustralian fisheries and aquaculture statistics 2013
FIGURE 13 Australian exports of edible fisheries products, by destination, 2002–03 to 2012–13a
2012–13$b
2012–13
2010–11
2008–09
2006–07
2004–05
2002–03
a Includes live fish.Source: Australian Bureau of Statistics
Other
Singapore
VietnamChina
Hong Kong
Japan
0.5
1.0
1.5
2.0
In 2011–12 Vietnam imported 468 tonnes of rock lobster, which represented 7 per cent of all Australian rock lobster exports. This increased to 4304 tonnes in 2012–13, at a value of $256 million.
Although the value of Australian fisheries products exported to Hong Kong has followed a declining trend since 2008–09, Hong Kong remained Australia’s major export destination for edible fisheries products in 2012–13, accounting for 32 per cent of the total export value of these products. Rock lobster and abalone were the main fishery products exported to Hong Kong; rock lobster accounted for 47 per cent of the total value of exports to Hong Kong and abalone 30 per cent. In 2012–13 the export value of rock lobster to Hong Kong declined by 48 per cent ($140 million) to $150 million, and exports of abalone fell by 7 per cent ($7 million) to $95 million. Exports of prawns, salmonids, crabs and dried, salted or smoked fish accounted for most of the remainder of total edible fisheries product exports to Hong Kong.
Vietnam has become Australia’s second major export destination for edible fisheries products, accounting for 29 per cent of total export value of edible fisheries products in 2012–13. The value of edible fisheries products exported to Vietnam increased by 385 per cent between 2011–12 and 2012–13, from $60 million to $293 million. The main edible fisheries products exported to Vietnam were rock lobster, abalone, and prawns, together accounting for 95 per cent of the total edible exports to Vietnam in value terms. Unfrozen rock lobster was the most important export product to Vietnam, contributing 87 per cent ($256 million) of the total export value to Vietnam. Vietnam accounted for 57 per cent of total export earnings from rock lobster in 2012–13.
Other important export destinations in 2012–13 included Japan, China and Singapore. Japan is an important export market for tuna, accounting for 98 per cent of the value of Australian tuna exports in 2012–13. China and Singapore are important export markets for abalone, accounting for 12 per cent and 11 per cent, respectively, of the value of Australian abalone exports in 2012–13.

Trade
31ABARESAustralian fisheries and aquaculture statistics 2013
Non-edible fisheries products
Main destinations: Hong Kong, Japan, United StatesThe key export destinations for Australian non-edible fisheries products in value terms in 2012‒13 were Hong Kong ($54 million), Japan ($33 million) and the United States ($21 million). Together, these countries comprised 63 per cent of non-edible fisheries product exports in value terms. The major product exported to these markets was pearls, with Hong Kong accounting for 35 per cent, Japan 20 per cent and the United States 11 per cent of total pearl exports.
Exports by state (Tables 26 to 28)In 2012–13 Western Australia and South Australia were the largest exporters of edible fisheries products in value terms at $304 million and $266 million, respectively. They were followed by Victoria ($138 million), Tasmania ($132 million) and Queensland ($131 million). Together, these five states accounted for 97 per cent of the total value of edible exports.
The key commodity exported from Western Australia in 2012–13 was rock lobster ($282 million), accounting for 93 per cent of Western Australia’s export earnings from edible fisheries products. South Australia’s largest export product was southern bluefin tuna. In 2012‒13 the value of South Australian tuna exports was $152 million, accounting for 57 per cent of South Australia’s edible fisheries product exports. Other edible fisheries products exported from South Australia included rock lobster ($59 million) and abalone ($36 million).
The major fisheries products exported from Victoria in 2012–13 were rock lobster ($59 million) and abalone ($56 million), which accounted for 86 per cent of Victoria’s total edible fisheries products exported. Tasmania’s 2012–13 exports comprised mainly of abalone ($84 million), salmonids ($22 million) and rock lobster ($17 million). The key edible export products for Queensland were prawns ($31 million), live fish ($28 million) and tropical rock lobster ($26 million).
Non-edible exports, predominantly pearls ($152 million), were dominated by exports from Western Australia (54 per cent, $82 million) and the Northern Territory (20 per cent, $30 million).
Imports by commodity (Tables 29 to 31)The total value of Australian fisheries imports rose by 3 per cent ($42 million) to $1.65 billion in 2012–13. Approximately 87 per cent of this value consisted of edible products (valued at $1.4 billion). Edible imported products in 2012–13 included $894 million of finfish (63 per cent of total edible imports) and $533 million of crustaceans and molluscs (37 per cent). Non-edible products accounted for the remaining 13 per cent ($221 million) of total fisheries imports by value and included pearls, marine fats and oils and fish meal (Figure 14).
The largest imported product in 2012–13 by value was prepared and preserved fish at $467 million, of which most was canned fish such as tuna. This was followed by frozen fish ($275 million), frozen prawns ($190 million), prepared and preserved prawns ($114 million) and pearls ($105 million) (Figure 15).
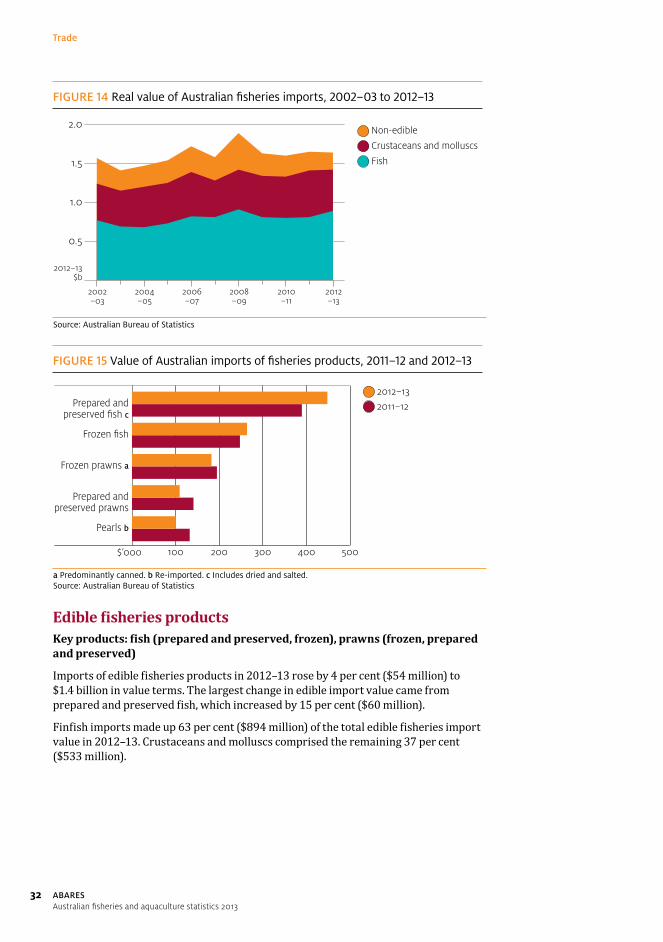
Trade
32 ABARESAustralian fisheries and aquaculture statistics 2013
FIGURE 14 Real value of Australian fisheries imports, 2002–03 to 2012–13
2012–13$b
Non-edible
Crustaceans and molluscs
Fish
2012–13
2010–11
2008–09
2006–07
2004–05
2002–03
Source: Australian Bureau of Statistics
0.5
1.0
1.5
2.0
FIGURE 15 Value of Australian imports of fisheries products, 2011–12 and 2012–13
2012–13
2011–12
$’000
Pearls b
Prepared andpreserved prawns
Frozen prawns a
Frozen sh
Prepared andpreserved sh c
100 200 300 400 500
a Predominantly canned. b Re-imported. c Includes dried and salted.Source: Australian Bureau of Statistics
Edible fisheries productsKey products: fish (prepared and preserved, frozen), prawns (frozen, prepared and preserved)
Imports of edible fisheries products in 2012–13 rose by 4 per cent ($54 million) to $1.4 billion in value terms. The largest change in edible import value came from prepared and preserved fish, which increased by 15 per cent ($60 million).
Finfish imports made up 63 per cent ($894 million) of the total edible fisheries import value in 2012–13. Crustaceans and molluscs comprised the remaining 37 per cent ($533 million).

Trade
33ABARESAustralian fisheries and aquaculture statistics 2013
FinfishThe largest categories of edible finfish imports in value terms were prepared and preserved fish ($467 million) and frozen fish ($275 million). Most of the prepared or preserved fish imported in 2012–13 were tuna ($254 million), salmonids ($59 million), sardines ($18 million), anchovies ($10 million) and mackerel ($5 million). For frozen fish, the largest single species imported in value terms was hake, at $23 million.
The value of finfish imports rose by 13 per cent ($105 million) in 2012–13, mainly because of the higher import value of prepared or preserved fish. Prepared and preserved fish imports rose by 15 per cent, from $406 million in 2010–11 to $467 million in 2012–13. Most of this increase came from tuna imports, which rose by 25 per cent or $51 million. The value of prepared and preserved salmonids imports also increased, by 4 per cent ($2 million).
The import value of frozen fish increased by 6 per cent ($17 million) in 2012–13, mainly as a result of increased salmonids imports, which more than tripled. This was a result of an increase in volume of frozen salmonids imports. The value of smoked, dried or salted fish product imports increased by 13 per cent ($6 million) to $55 million, owing to a 42 per cent ($11 million) increase in the value of smoked salmonids imported.
Crustaceans and molluscsIn 2012–13 crustacean and mollusc imports declined by 9 per cent ($52 million) to $533 million. Crustacean and mollusc imports consisted mainly of prawns ($305 million), followed by squid and octopus ($98 million) and scallops ($41 million). Most of the prawns imported in 2012‒13 were frozen ($190 million) and prepared and preserved prawns ($114 million). Scallop, and squid and octopus imports were primarily frozen products ($40 million and $69 million, respectively).
The decline in value of crustacean and mollusc imports was mainly driven by a significant decrease in the import value of prawns, which declined by 13 per cent ($46 million) (Table 31). The value of frozen squid and scallops also declined, by 11 per cent ($8 million) and 7 per cent ($3 million), respectively. By contrast, the value of frozen mussels and crabs increased by 14 per cent ($1 million) and 6 per cent ($0.7 million), respectively.
Imports by source (Tables 32 to 38)Edible fisheries products
Key sources: Thailand, New Zealand, China, VietnamThe major sources for Australian edible imports (excluding live products) in 2012–13 were Thailand, New Zealand, China and Vietnam (Figure 16). Thailand remained the largest source by value ($400 million), accounting for 28 per cent of the total edible import value. New Zealand overtook China as the second largest source of edible fisheries imports in 2012–13 with a total import value of $206 million, representing 14 per cent of total edible imports by value. China and Vietnam accounted for 14 per cent and 11 per cent of the total edible import value, respectively.

Trade
34 ABARESAustralian fisheries and aquaculture statistics 2013
FIGURE 16 Australian imports of edible fisheries products (excluding live), by source, 2002–03 to 2012–13
2012–13$m
ThailandNew ZealandVietnamChina
Other
2012–13
2010–11
2008–09
2006–07
2004–05
2002–03
100
200
300
400
500
600
Source: Australian Bureau of Statistics
The major import product from Thailand was prepared and preserved tuna, which accounted for about 59 per cent ($235 million) of the total value of edible fisheries products imported from Thailand in 2012–13. The second largest import product group from Thailand was prawns. However, in 2012–13 the value of prepared and preserved prawn imports from Thailand declined by 23 per cent ($13 million) to $44 million.
New Zealand was the second largest source of seafood imports for Australia in 2012–13. Total edible fishery imports from New Zealand increased by 5 per cent ($9 million) to $206 million. This was primarily driven by increases in unfrozen fish imports, which increased by 14 per cent ($8 million). The key imported products continued to be frozen and unfrozen fish. In 2012–13 Australia imported $72 million of frozen fish from New Zealand, most of which was fish other than hake and salmonids. The main imported products of unfrozen fish were salmonids ($6 million), shark ($4 million) and unfrozen fish other than shark and salmonids ($56 million).
Between 2002–03 and 2012–13 edible fisheries imports from China increased considerably (Figure 17). Over this period the volume and value of fishery imports from China increased by 24 422 tonnes (299 per cent) and $139 million (240 per cent) (in real terms), respectively. Historically, prawns have been the key commodity group imported from China and this trend continued in 2012–13. However, the value of frozen prawn products from China declined from $85 million in 2011–12 to $55 million in 2012–13. This was a result of a 25 per cent (2297 tonnes) decrease in the imported volume of frozen prawns from China. China has also become a large source of frozen squid and octopus imports in recent years. In 2012–13 the value of frozen squid and octopus imports from China declined to $35 million, but continued to represent around 50 per cent of all frozen squid and octopus imports into Australia.

Trade
35ABARESAustralian fisheries and aquaculture statistics 2013
Edible fishery imports from Vietnam also grew considerably between 2002–03 and 2012–13, although the growth slowed down from 2009–10 (Figure 17). In 2012–13 seafood imports from Vietnam declined by 7 per cent ($11 million). The reduction was mainly because of the 10 per cent ($9 million) decrease in the total value of prawns imported from Vietnam (Figure 18). This was primarily driven by a 20 per cent ($11 million) decline in the value of prepared and preserved prawns imported from Vietnam, which made up 28 per cent of total edible imports from that country. The largest commodity product imported from Vietnam was frozen fish, which declined by 9 per cent ($6 million) to $56 million in 2012–13.
FIGURE 17 Real value of Australian imports of selected edible fisheries products from China, 2002–03 to 2012–13
2012–13$m
Frozen other fish aFrozen prawnsPrepared and preservedother fish b
Frozen squid and octopus
2012–13
2010–11
2008–09
2006–07
2004–05
2002–03
20
40
60
80
100
a Fish other than hake. b Fish other than tuna, predominantly canned.Source: Australian Bureau of Statistics
Prepared and preserved prawns
FIGURE 18 Real value of Australian imports of selected edible fisheries products from Vietnam, 2002–03 to 2012–13
2012–13$m
Frozen fish Prepared andpreserved prawns
Frozen prawns
2012–13
2010–11
2008–09
2006–07
2004–05
2002–03
Source: Australian Bureau of Statistics
20
40
60
80
100
120

Trade
36 ABARESAustralian fisheries and aquaculture statistics 2013
Non-edible fisheries products
Key sources: Peru, Chile, Equador, IndonesiaImports of non-edible fisheries products fell by 5 per cent ($12 million) to $221 million in 2012–13. Imports classified as being re-imported Australian product were 37 per cent of this value and were the main cause of the decrease in 2012–13. Australian re-imports (mostly re-imported pearl products) accounted for $82 million in 2012–13, compared with $112 million in 2011–12.
In 2012–13 most imports of non-edible fisheries products that were not re-imports were sourced from Peru ($17 million), Chile ($11 million), Ecuador ($10 million), Indonesia ($9 million) and China ($9 million). Combined, these countries accounted for 26 per cent ($57 million) of the Australian total value of non-edible fisheries products imports in 2012–13. The major commodities imported from Peru in 2012–13 were fat and oil products ($5 million) and fish meal ($12 million). The main imported products from Chile were also fat and oil products ($7 million) and fish meal ($5 million).

37ABARESAustralian fisheries and aquaculture statistics 2013
Employment
Fast facts• In 2012–13, 8608 people were employed in the commercial fishing and aquaculture
industry, with 5050 employed in the fishing and 3558 in aquaculture enterprises.• Of this total, 5817 people (68 per cent) worked full-time and 2792 (32 per cent)
part-time.• In 2012–13 the commercial fishing sector employed 4375 males (87 per cent)
and 675 females (13 per cent). Aquaculture enterprises employed 2942 males (83 per cent) and 617 females (17 per cent).
• Compared with 2011–12, total employment in the commercial fishing and aquaculture industry decreased by 14 per cent (1425 people) in 2012–13. Full-time employment decreased by 20 per cent (1458 people) and part-time employment increased by 1 per cent (34 people).
FIGURE 19 Employment in the Australian commercial fishing and aquaculture sectors, 2002–03 to 2012–13
Aquaculture sectorFishing sector
2012–13
2010–11
2008–09
2006–07
2004–05
2002–03
’000persons
2
4
6
8
10
12
14

Employment
38 ABARESAustralian fisheries and aquaculture statistics 2013
Employment in the Australian commercial fishing and aquaculture industry, 2008–09 to 2012–13a
Sector 2008–09 2009–10 2010–11 2011–12 2012–13
no. no. no. no. no.
Fishing
Full time Male 1 275 3 575 4 275 3 650 3 475
Female 0 267 100 225 0
Total 1 275 3 842 4 375 3 875 3 475
Part time Male 550 400 550 1 375 900
Female 600 350 725 533 675
Total 1 150 750 1 275 1 908 1 575
Total 2 425 4 592 5 650 5 783 5 050
Aquaculture
Full time Male 3 700 2 625 2 775 3 200 2 175
Female 425 333 900 200 167
Total 4 125 2 958 3 675 3 400 2 342
Part time Male 300 825 550 550 767
Female 500 150 225 300 450
Total 800 975 775 850 1 217
Total 4 925 3 933 4 450 4 250 3 558
Grand total 7 350 8 525 10 100 10 033 8 608
a ANZIC 2006. Average employment is averages over four quarters. Source: Australian Bureau of Statistics
The estimated employment in the fishing and aquaculture sectors is derived from the ABS Labour Force Survey and the ABS Census 2011 data. The Labour Market survey data are averaged over four quarters and are presented in financial years for the fishing and aquaculture sectors separately. The number of people employed in the sectors is presented by full-time and part-time status as well as by gender. The ABS Census data provide sub-sector, jurisdiction employment data for the 2011 calendar year.
The Labour Force Survey (ABS 2013) shows that in 2012–13 the fishing and aquaculture industry employed 8608 people, a decrease of 1425 relative to 2011–12 (Figure 19). Employment in the aquaculture sector fell by 16 per cent (692 people) to 3558 people in 2012–13, and employment in the fishing sector fell by 13 per cent (733 people) to 5050 people.
Full-time employment accounted for 69 per cent of employment in the fishing sector; part-time employment made up the remaining 31 per cent. Compared with 2011–12, the total number of people employed in the fishing sector declined by 13 per cent (733 people) in 2012–13. The decline was driven by a 10 per cent (400 people) decrease in full-time employment and 17 per cent (333 people) decrease in part-time employment.
In the aquaculture sector, full-time and part-time employment accounted for 66 per cent and 34 per cent, respectively. Compared with 2011–12, the number of people employed full-time in the aquaculture sector decreased by 31 per cent (1058 people)

Employment
39ABARESAustralian fisheries and aquaculture statistics 2013
to 2342 people in 2012–13. By contrast, part-time employment in the aquaculture sector increased by 43 per cent (367 people), increasing from 850 people 2011–12 to 1217 people in 2012–13.
Males have historically dominated employment in the commercial fishing and aquaculture industry. In 2012–13 the number of males employed in the industry declined by 17 per cent (1458 males) and made up 85 per cent (7317 males) of total employment in the industry. This is a reduction from 87 per cent in 2011–12. The number of females employed in the industry increased between 2011–12 and 2012–13, from 1258 to 1292, and constituted 15 per cent of total employment in the industry.
Estimated employment in the Australian commercial fishing and aquaculture industry, 2011a
Category NSW Vic. Qld SA WA Tas. NT ACT Australia
no. no. no. no. no. no. no. no. no.
Aquaculture 44 94 83 150 55 97 4 0 527
Onshore aquaculture 93 101 344 122 60 82 20 0 822
Offshore longline and rack aquaculture 443 12 70 280 82 381 6 0 1 274
Offshore caged aquaculture 8 7 11 121 6 592 0 0 745
Rock lobster and crab potting 37 64 103 211 443 189 11 0 1 058
Prawn fishing 81 0 206 82 51 0 25 0 445
Line fishing 0 7 18 13 9 7 4 0 58
Fish trawling, seining and netting 24 22 33 40 4 10 0 0 133
Fishing, hunting and trapping 322 234 449 389 179 81 36 0 1 690
Other fishing 347 105 197 148 131 246 119 4 1 297
Fishing and aquaculture total 1 399 646 1 514 1 556 1 020 1 685 225 4 8 049
Seafood processing 277 209 298 320 348 312 15 4 1 783
Fish and seafood wholesaling 1 024 845 978 430 380 268 43 13 3 981
Processing and wholesaling total 1 301 1 054 1 276 750 728 580 58 17 5 764
Grand total 2 700 1 700 2 790 2 306 1 748 2 265 283 21 13 813
a Based on the 2011 ABS Census data. Categories are consistent with ANZIC 2006. Source: Australian Bureau of Statistics
The most recent ABS Census survey detailing employment in the fishing industry, by sector and by state, was conducted in 2011. Commercial fishing, hunting and trapping and aquaculture activities employed 8049 people, with 58 per cent (4681 people) engaged in commercial fishing and hunting and trapping activities and 42 per cent (3368 people) in aquaculture activities. Fish wholesaling and seafood processing employed 5764, with 69 per cent (3981 people) employed in fish wholesaling and 31 per cent (1783 people) in seafood processing.
The offshore longline and rack aquaculture sector employed the largest number of people (1274), followed by rock lobster fishing (1058). By state, excluding fishing, hunting and trapping, Western Australia employed the largest number of people in the wild-catch fishing sector (638 people), followed by Queensland (557 people) and New South Wales (489 people). Tasmania employed the largest number of people in the aquaculture sector (1152 people), followed by South Australia (673 people) and New South Wales (588 people).

40 ABARESAustralian fisheries and aquaculture statistics 2013
Recreational and charter fishing
Recreational fishing is a popular activity that contributes economic and social benefits to the Australian economy, particularly in regional areas. Campbell & Murphy (2005) estimate that about 3.4 million Australians engage in recreational fishing each year, directly contributing an estimated $1.8 billion to the economy.
Some industries depend either wholly on the recreational fishing sector (the fishing tackle and bait industry, and the fishing tour and charter industry) or rely on it for a large proportion of income (the recreational boating industry and the tourism industry in coastal regions). In 2003 the ABS estimated that the sector supports about 90 000 Australian jobs (ABS 2003). Campbell and Murphy (2005) estimated that recreational fishers spent $223 million on fishing gear, tackle and bait in the 12 months to May 2000 (including second-hand purchases). By contrast, Dominion Consulting (2005) estimated that the value of retail sales in the tackle and bait industry in 2003–04 was $665 million. For the recreational boating industry, annual turnover is estimated at around $500 million, of which 60 per cent is related to fishing (ABS 2003).
Individual state and territory authorities are responsible for managing recreational and charter fishing in Australia. Recreational fishers are not required to report their activities to fishery management agencies, although in some states charter operators report the total catch and fishing effort of tour groups as a condition of their licence. Some states require that recreational fishers be licensed and that anglers carry their licences while fishing.
Estimating the catch and harvest of fish by recreational fishers depends on surveys of the general population and targeted surveys of fishers who can be contacted via licence details or at known locations where fishers commonly have access to fish stocks.
State and territory governments use controls on fish size, bag limits, gear restrictions and seasonal and area closures to regulate recreational catches. Licensing requirements and regulations vary considerably between jurisdictions and often depend on location within a jurisdiction, the fishing method used and the species targeted.
It is difficult to value the recreational sector because, unlike commercial fishers who sell their catch on markets, recreational fishers do not have to pay for fish caught recreationally and, therefore, do not reveal the associated value they gain from catching fish. Although non-market valuation techniques are available to estimate the value

Recreational and charter fishing
41ABARESAustralian fisheries and aquaculture statistics 2013
of recreational fisheries, these techniques are often costly to apply. Such recreational values cannot be easily compared with gross value of production measures used for valuing the commercial sector. For these reasons, estimates of the economic value of recreational fishing are often not available. One of the FRDC Recfishing Research Priorities for 2015 is ‘estimating the economic value of recreational fishing in Australia, and its social contribution to Australian communities through employment and volunteering’ (Recfishing Research 2014). The Australian Government is also committed to conducting a recreational fishing survey every five years to collect data on the social and economic impact of recreational fishing (Australian Government 2013).
Australia-wideComprehensive national recreational fisheries statistics are not available for recent years. The last Australia-wide survey of the sector was the 2000–01 National Recreational and Indigenous Fishing Survey (NRIFS), conducted by Commonwealth and state fishery management agencies (Henry & Lyle 2003). The study used a telephone screening survey of the general population (March to April 2000) to estimate the number of recreational fishers in each state and territory, and a diary survey of recreational fishers (May 2000 to April 2001) to gather information on the extent of their activities.
The results from the survey indicated that 3.36 million fishers participated in recreational fishing in the 12 months to May 2000. Estimated expenditure on services and items related to recreational fishing was $1.8 billion over the diary survey period. New South Wales had the largest expenditure ($554 million), followed by Victoria ($396 million) and Queensland ($320 million). The annual average expenditure per fisher was highest in Victoria at $721 per fisher, followed by Western Australia ($706 per fisher) and the Northern Territory ($608 per fisher). The national average was $552 per fisher per year.
Since 2001 the NRIFS survey methodology has been repeated in some states and the Northern Territory, although not in concurrent timeframes. A comparison of key participation and fishing effort statistics from the NRIFS and subsequent statewide surveys shows that, for the states where the surveys have recently been repeated, there has been a moderate reduction in numbers of resident fishers and a more pronounced reduction in participation rate and total days spent fishing (see below). Statistics on expenditure by fishers are not available in the recent statewide surveys, except for the 2009–10 Northern Territory survey.
Participation statistics for National Recreational and Indigenous Fishing Survey and statewide surveys, 2000, 2007 and 2010a
Item Unit Australia Queensland South Australia Tasmania Northern Territory
2000 2000 2010 2000 2007 2000 2007 2000 2010
Participation ’000 3 400 747 700 317 236 125 118 44 32
% 19.5 23 17 23.4 16.1 29.4 26.1 31.6 22.3
Fishing days ’000 20 600 3 600 2 600 1 800 1 100 700 600 198 151
Average days per fisher 6.1 5.4 4 5.9 4.5 6.4 5 5 4.9
a Participation and fishing days statistics for South Australia, Tasmania and Queensland are only for residents of the state. Northern Territory statistics are for all residents surveyed in 2000 but excludes Aboriginal and Torres Strait Islander persons in 2009. Sources: Henry & Lyle 2003; Jones 2009; Lyle et al. 2009; Queensland DAFF 2012; West et al. 2012

Recreational and charter fishing
42 ABARESAustralian fisheries and aquaculture statistics 2013
New South WalesIn New South Wales, a recreational fishing licence is needed for all recreational fishing activities. Size and bag limits apply for many species, as do gear restrictions and area/seasonal closures. Separate recreational fishing rules apply for saltwater and freshwater fishing. Size limits, catch limits and area and seasonal closures are the primary management measures for these categories. Operators in the charter boat sector must hold a licence and maintain comprehensive catch records. People under the age of 18 or over the age of 60 and Indigenous people are exempt from holding a recreational fishing licence.
The NSW Department of Primary Industries conducted a survey of recreational fishers in the Greater Sydney region of New South Wales for two years, from March 2007 (Steffe & Murphy 2011). The survey provided estimates of fishing effort and catch for common recreational species in marine and estuarine fisheries within the region, by location and for the region as a whole. The Department of Primary Industries is currently undertaking a 2013–14 recreational fishing survey using the same methodology as the 2000–01 survey, which will help the department to measure any changes that may have occurred over time.
The Department of Primary Industries has collected data on gamefishing tournaments since the early 1990s (Park 2007). Catch and effort data are collected from scheduled radio reports routinely broadcast during tournaments and more detailed data from tournament results and post-fishing interviews with gamefishers. In 2013 and 2014 a statewide survey of recreational fishers was conducted, using the NRIFS design of a telephone screening/participation survey and a 12-month fisher diary survey. The diary survey concluded at the end of May 2014. For more information about recreational fishing in New South Wales, see the NSW Department of Primary Industries website.
VictoriaAn all-water recreational fishing licence is required for such activities in Victoria. Some recreational fisheries in the state are exempt, but limits and closures still apply. People under 18 years of age or 70 years of age or over are exempt from holding a recreational fishing licence.
Fisheries Victoria ran a Statewide Angler Fishing Diary Program to collect statistics on Victorian recreational fishing between 1997 and 2006 (Bridge & Conron 2010). A time series of catch rates and size composition information was generated for four key target species in four fishing regions of interest to Fisheries Victoria:• snapper in Port Phillip Bay and Western Port• King George whiting in Port Phillip Bay and Western Port• black bream in the Gippsland Lakes• rainbow and brown trout in the Goulburn River.
Currently, angler diary programmes are run in selected inland and estuarine water bodies where monitoring is required under fishery management plans (Conron et al. 2012). From March to July 2011 Fisheries Victoria conducted a survey of fishers targeting southern bluefin tuna in western Victoria. During interviews at boat ramps and while gathering catch, fishers were asked about fishing effort and size composition of retained southern bluefin tuna.

Recreational and charter fishing
43ABARESAustralian fisheries and aquaculture statistics 2013
Although a pilot statewide telephone diary survey was tested in 2006, there are no recent statewide estimates of participation, catch and fishing effort for Victorian recreational fishers that can be compared with the 2000–01 NRIFS. For more information about recreational fishing in Victoria, see the Victorian Department of Environment and Primary Industries website.
QueenslandRecreational fishers are not required to hold a licence to fish in Queensland waters. However, anglers over the age of 18 must purchase a permit to fish in certain Queensland dams. Many species have limits on the size (length) of fish that can be legally taken, including minimum size limits and some maximum size limits.
The 2011 report, Prospects for Queensland’s primary industries 2011–12, estimates the commercial equivalent of the state’s recreational catch at $73 million (DEEDI 2011). The report estimates recreational fishing expenditure in Queensland at more than $400 million (DEEDI 2011).
The Queensland Department of Agriculture, Fisheries and Forestry’s 2010 Statewide Recreational Fishing Survey collected reliable estimates of recreational participation rates, statewide and regional annual catch, common species caught by recreational fishers and regions where recreational fishing activities took place. The survey combined diary and telephone surveys to collect high-quality data over 12 months (Queensland DAFF 2012). Statistics for fisher participation are shown in the comparative table above. The final report was released in October 2012. For more information about recreational fishing in Queensland, see the Queensland Department of Agriculture, Fisheries and Forestry website.
South AustraliaThe Department of Primary Industries and Resources South Australia estimates that 236 000 South Australians participate in recreational fishing each year (PIRSA 2010). Recreational fishers are not required to hold a licence to fish in South Australian waters but registered rock lobster pots must be used to catch southern rock lobster for personal use. Minimum size limits, bag limits, vessel limits, gear restrictions and area and seasonal closures apply for many recreational species. Charter vessel operators must hold a charter boat fishery licence, and are also subject to these restrictions.
In 2007–08 the department conducted a recreational fishing survey that provided estimates of recreational fisher participation levels, demographics, fishing effort and catches for 12 key species (Jones 2009). For more information about recreational fishing in South Australia see South Australian Recreational Fishing Survey 2007–08 (Jones 2009).
Western AustraliaIn Western Australia, recreational fishing licences are required for abalone, rock lobster, marron, net fishing and freshwater angling. A statewide recreational boat fishing licence was introduced in 2009, along with new bag limits designed to preserve fish stocks. Seasonal closures are used to control fishing effort for some species, and size and bag limits also apply for most species.
Recreational and charter fishing
44 ABARESAustralian fisheries and aquaculture statistics 2013
Since 2001 operators in the aquatic tour industry, which includes charter fishing operators, have been required to hold a licence. However, fishers do not need a recreational fishing licence when fishing from a licensed charter vessel. A person fishing from a vessel without a motor does not require a recreational boat fishing licence. Indigenous fishers are not required to hold a recreational fishing licence if the fish are taken for personal use, rather than for a commercial purpose.
Results from the Western Australia Department of Fisheries Recreational Boat Fishing Survey 2011/12 were published in late 2013 (Ryan et al. 2013). The survey tracked fishing activity by 2977 randomly selected boat fishers, who were each issued with a logbook. An additional 5659 recreational fishers were interviewed about their catch and fishing effort at boat ramps. The survey provides estimates of the quantity of fish retained and released for each Western Australian fishing region. The survey found that 60 per cent of the recreational catch consisted of finfish species, with school whiting being the most caught finfish. More than half of the recreational catch of all finfish was released, with higher release rates recorded for finfish species such as pink snapper and western king wrasse. For more information about recreational fishing in Western Australia, see the WA Department of Fisheries website.
TasmaniaIn Tasmania, a licence for saltwater rod and line fishing is not required but fishers must hold an Inland Fisheries Licence for inland waters, including some river mouths and estuaries. Recreational fishing licences are needed for collecting abalone, southern rock lobster and scallops, and when using graball nets, mullet nets and beach seine nets. Fishing using any type of set line, including dropline or longline, also requires a licence. A range of gear restrictions, bag limits, size limits, seasonal closures and area restrictions apply for abalone, southern rock lobster, shellfish and scalefish.
Indigenous fishers undertaking customary fishing are exempt from holding a licence but must comply with all other fisheries rules, such as gear restrictions, possession limits, and size and seasonal restrictions. For Indigenous ceremonial activities, permits and exemptions are available. The Tasmanian Department of Primary Industries, Parks, Water and Environment and the Tasmanian Aquaculture and Fisheries Institute carried out the 2007–08 Survey of Recreational Fishing in Tasmania, which was funded by the Tasmanian Fishwise Community Grants programme (Lyle et al. 2009). The survey provided estimates of recreational fishing participation and landed catch between December 2007 and November 2008 and used the same survey methodology as the NRIFS.
Other surveys funded through the Tasmanian Fishwise Community Grants programme included assessments of the recreational rock lobster and abalone fisheries (Lyle & Tracey 2012), studies of net fishing, and a survey of gamefishing in Tasmania (Forbes, Tracey & Lyle 2009). For more information about recreational fishing in Tasmania, see the Tasmanian Department of Primary Industries, Parks, Water and Environment website.

Recreational and charter fishing
45ABARESAustralian fisheries and aquaculture statistics 2013
Northern TerritoryRecreational fishers are not required to hold a licence to fish in Northern Territory waters, although a temporary licence is needed for recreational fishing on and over Indigenous granted land and adjoining waters. Size and possession limits are the primary catch controls for recreational fishing. Seasonal and area closures also apply for many recreational species.
The Northern Territory Government conducted a recreational fishing survey from February 2009 to March 2010. The survey repeated the NRIFS methodology of a telephone screening/participation survey and fisher diary but also included surveys at boat ramps and accommodation establishments in key catchments (West et al. 2012). The survey results provided an estimate of $47 million annual expenditure by Northern Territory non-Indigenous residents on goods and services directly related to recreational fishing. Most of this ($33 million) was spent on boats and trailers. The Northern Territory Department of Primary Industry and Fisheries is current undertaking a recreational fishing survey. For more information about recreational fishing in the Northern Territory, see the Northern Territory Government website.
Australian Capital TerritoryRecreational fishers do not need a licence to fish in the Australian Capital Territory (ACT). However, a permit is required when using any type of powered vessel for recreational fishing on Canberra’s urban lakes. The main recreational species targeted are Murray cod, golden perch, trout, redfin and European carp. ACT public waters are opened for fishing all year round and are divided into three categories: open waters, permanently closed waters and trout waters. Bag and size limits and seasonal closures apply, as do restrictions on specific fishing gear and bait used for recreational fishing purposes. Enclosed traps, such as bait, minnow and yabby traps, are prohibited in ACT public waters. Some ACT waters are permanently closed to protect native fish species. These species are trout cod, Macquarie perch, silver perch, two-spined blackfish, and Murray River crayfish. If caught, these species must be returned to the water unharmed. ACT fishers were also surveyed for the 2013–14 NSW state-wide recreational fishing survey. For more information about recreational fishing in the ACT, see the ACT Government Environment and Planning Directorate website.
Commonwealth watersThe Australian Government does not manage recreational fishing in Commonwealth waters. Recreational fishing undertaken in Commonwealth waters is managed by, and under the management regulations of, the jurisdiction immediately adjacent to those waters. Recreational catch is of particular importance where the target species are also primary targets of commercial fisheries. Griffiths and Pepperell (2006) identified 245 such marine species, including tuna, billfish and deepwater finfish.
In October 2010 Recfish Australia released Recreational fishing in Commonwealth waters: a preliminary assessment. The report focuses on the level of recreational fishing in Commonwealth waters. The report found that in some regions in 2005–06, particularly Narooma–Bermagui, 47 per cent of fishing trips occurred in Commonwealth waters and generated about $27 million for the local community (Recfish Australia 2010).

Recreational and charter fishing
46 ABARESAustralian fisheries and aquaculture statistics 2013
Between December 2010 and May 2011, ABARES surveyed gamefishers, local businesses and community members at three eastern Australian sites where gamefishing tournaments were held several times a year (Ward et al. 2012). The sites were Mooloolaba, Port Stephens and Bermagui. Tournament game fishers surveyed at Mooloolaba averaged 13 gamefishing trips to that site, amounting to 15 days per year. Those at Port Stephens averaged six trips (nine days) and those at Bermagui, four trips (11 days) per year. On average fishers spent $4625 for a tournament trip to Port Stephens, $2698 per trip to Bermagui and $2378 per trip to Mooloolaba.
The net economic value of game fishing was also estimated. This is the ‘use value’ (non-financial) that individuals place on a gamefishing trip, in addition to their actual expenditure. The net economic value from a trip to Bermagui ($124 per individual per trip) was substantially higher than that for Port Stephens ($67), but survey respondents travelled greater distances to experience game fishing in Bermagui.

47ABARESAustralian fisheries and aquaculture statistics 2013
Customary fishing
Various definitions exist for customary, traditional or cultural fishing in Australia. The National Indigenous Fishing Technical Working Group defined customary fishing as ‘fishing in accordance with relevant Indigenous laws and customs for the purpose of satisfying personal, domestic or non-commercial communal needs’ (NNTT 2004). The Torres Strait Treaty is more specific, describing traditional fishing as: ‘the taking, by traditional inhabitants for their own or their dependants’ consumption or for use in the course of other traditional activities, of the living natural resources of the sea, seabed, estuaries and coastal tidal areas, including dugong and turtle’ (DFAT 1978).
Other definitions include slight variations on these. The New South Wales Department of Primary Industries defines cultural fishing as: ‘fishing activities and practices carried out by Aboriginal persons for the purpose of satisfying their personal, domestic or communal needs, or for educational or ceremonial purposes or other traditional purposes, and which do not have a commercial purpose’ (I&I NSW 2009).
The Western Australian Department of Fisheries defines customary fishing in its Customary Fishing Policy as fishing activities applying—within a sustainable fisheries management framework—to a person of ‘Aboriginal descent, fishing in accordance with the traditional law and custom of the area being fished and is fishing for the purpose of satisfying personal, domestic, ceremonial, educational or non-commercial communal needs’ (WA Fisheries 2009).
The definition for Aboriginal traditional fishing in the South Australian Fisheries Management Act 2007 is ‘fishing engaged in by an Aboriginal person for the purposes of satisfying personal, domestic or non-commercial, communal needs, including ceremonial, spiritual and educational needs, and using fish and other natural marine and freshwater products according to relevant Aboriginal custom’.
In late 2013 in Akiba v Commonwealth of Australia, the High Court of Australia found that commercial native title fishing rights still exist in the Torres Strait and are not extinguished by Commonwealth and State fisheries legislation (Butterly 2013). It remains unclear how this judgement will affect and/or change licence arrangements for Indigenous commercial fishing. As indicated by these definitions, the value attached to fishing activity and catches of individual species by Indigenous fishers extends beyond the values typically associated with commercial and recreational fishing. For Indigenous people, fish is often viewed as an important food source, as well as a component of many cultural, ceremonial and social events. The act of fishing also allows communities and families to retain their independence and

Customary fishing
48 ABARESAustralian fisheries and aquaculture statistics 2013
connection to their fishing areas, reinforce their social networks through the sharing of gathered food and maintain their Traditional Fishing Knowledge (TFK) systems (Campbell & Murphy 2005; Schnierer & Egan 2011). Fish and fishing are important educational tools in Indigenous communities, with TFK being passed on to successive generations to enable them to practice traditional ways. Indigenous fishers have also traditionally harvested a range of species that are prohibited for non-Indigenous Australians, including crocodiles, turtles and dugong. For these reasons, customary fishing by Indigenous people has become increasingly recognised as separate to other commercial and recreational fishing activities.
At the national level, the importance of Indigenous customary fishing was formally recognised with the establishment of the National Indigenous Fishing Technical Working Group in October 2003. The working group aims to enhance Indigenous people’s participation in protecting, sharing and using Australian fisheries (NNTT 2003). One of its key outputs has been The Principles Communiqué on Indigenous Fishing, which was endorsed by the Australian Government in August 2005. The principles represent a commitment from stakeholders to:• recognise customary fishing as a sector in its own right• integrate and protect customary fishing within fisheries management frameworks• implement strategies to engage Indigenous people in fisheries-related business• expedite processes to increase Indigenous involvement in fisheries management
and vocational training (NNTT 2005).
This has supported efforts at the state and territory level to separately recognise, support and protect customary Indigenous fishing activities. A common challenge across all jurisdictions has been implementing initiatives that support customary Indigenous fishing while also achieving sustainable fishing practices. Initiatives and measures implemented include:• The New South Wales Government released an Indigenous Fisheries Strategy
and Implementation Plan in December 2002. It aims to protect and enhance the traditional cultural fishing activities of Aboriginal communities (NSW DPI 2013). In 2010 the New South Wales Government also amended its Fisheries Management Act 1994 to formally recognise cultural fishing, and established an Aboriginal Fishing Advisory Council to advise the NSW fishing agency on cultural fishing issues.
• The Northern Territory’s Fisheries Act 1988 exempts Indigenous people from bag limits, size limits, and taking protected species when fishing in traditional areas. The Northern Territory Government also has an Indigenous Fishing Development Strategy 2012–2014 (DPIF 2012). This aims to support sustainable, culturally appropriate, business and employment opportunities for Aboriginal communities in fisheries activities.
• South Australia’s Fisheries Management Act 2007 explicitly accounts for management of Aboriginal traditional fishing (the previous Act did not). It allows for Aboriginal traditional fishing management plans to be developed, in association with the fishing Indigenous Land Use Agreement, that are consistent with the objectives of the Act.
• The Tasmanian Living Marine Resources Management Act 1995 provides for Aboriginal activities, including non-commercial fishing, and taking of prescribed fish for the manufacture of artefacts for sale. The Act also allows for the issuing of permits and exemptions (DPIPWE 2013).

Customary fishing
49ABARESAustralian fisheries and aquaculture statistics 2013
• The Victorian Department of Environment and Primary Industries released an Aboriginal Fishing Strategy in August 2012. This strategy provides a guide to addressing Native Title, customary fishing, economic development opportunities and increasing Aboriginal participation in fisheries management (VIC DPI 2012).
• Western Australian law has recognised customary fishing by Indigenous people since 1905 (WA Fisheries 2012). The Western Australian Government drafted a new policy in December 2009 to recognise these activities in its fisheries management (WA Fisheries 2009).
In line with The Principles Communiqué on Indigenous Fishing and to better ensure sustainable outcomes, there has also been a focus on promoting greater Indigenous engagement in fisheries management. For example, in the Northern Territory there are currently three Aboriginal Fisheries Consultative Committees that better allow Indigenous groups to participate in fisheries management (DPIF 2012). In the Torres Strait, the Torres Strait Regional Authority established a Land and Sea Management Unit under the Land and Sea Management Strategy in June 2006. This unit provides support for Torres Strait Islander and Aboriginal communities to care for land and sea resources in the Torres Strait region (TSRA 2010). In NSW an Aboriginal Fishing Advisory Council was established to advise the NSW fisheries agency on a range of issues relating to cultural fishing. Similarly, Fisheries Victoria’s Aboriginal Fishing Strategy (VIC DPI 2012) aims to increase Aboriginal participation in fisheries management. The importance of customary Indigenous fishing is widely recognised but there is a relative paucity of data on such fishing activities, compared with commercial and recreational fishing activities. This is likely to reflect several factors, including the relative isolation of many Indigenous fishing activities and the small-scale and dispersed nature of these activities.
A comprehensive evaluation of Indigenous fishing activities in Northern Australia was completed in 2003 as part of the National Recreational and Indigenous Fishing Survey (NRIFS) (Henry & Lyle 2003). This survey aimed to better understand the level of Indigenous fishing by surveying Indigenous people aged five years and older, living in coastal communities across the north of Australia, from Broome in Western Australia to Cairns in Queensland (excluding those living in the Torres Strait). The survey showed that an estimated 37 000 Indigenous people living in the north of Australia fished at least once during 2000–01. This was equivalent to 91.7 per cent of the Indigenous population in the region. These individuals spent an estimated total of 420 000 days fishing in that year (Henry & Lyle 2003).
This fishing was estimated to be associated with a harvest of approximately 900 000 finfish, 1.1 million molluscs, 660 000 prawns and yabbies, 180 000 crabs and rock lobsters and smaller numbers of other species during 2000–01 (Henry & Lyle 2003). The major finfish species groups harvested were mullet, catfish, tropical snapper, bream and barramundi. Major non-finfish species groups included mussels, freshwater prawn, mud crabs, prawns and oysters. A large proportion (70 per cent) of this Indigenous harvest was taken from inshore and coastal waters that are relatively more accessible to traditional fishing methods. Methods typically used include lines, traps, nets and more traditional methods such as spear and hand collection methods (Campbell & Murphy 2005).
Based on the NRIFS, Henry and Lyle (2003) estimated that 186 200 Indigenous people (excluding those living in the Torres Strait) participated in non-commercial fishing during the survey year and that a total expenditure of $22.52 million was incurred by these fishers. Expenditure on fishing by Indigenous people residing in northern Australia was estimated to be $2.35 million, and for those that resided in southern Australia was $20.6 million.

Customary fishing
50 ABARESAustralian fisheries and aquaculture statistics 2013
More recent research on Indigenous cultural fishing was conducted in New South Wales to determine a methodology for estimating cultural catch (Schnierer & Egan 2011). The report found that cultural fishing in the Tweed River region occurred on a regular basis, was predominantly shore-based and focused around the estuary and adjacent coastal waters. The main gear types used were rods and handlines, with nets, traps and spears used to catch some species. The top 10 culturally most important species, based on a ranking given by participants, comprised a mix of finfish and invertebrates. Pipis and mud crabs were the top two, followed by sea mullet, tailor, sand whiting, dusky flathead, beach worms, Sydney rock oysters and the bait yabby.
A separate project in New South Wales identified the participation of Aboriginal people in the commercial fishing sector (Schnierer & Egan 2012). This study found that 28 Aboriginal people operated in share management fisheries in New South Wales; most operated in the Estuary General Fishery and Ocean Haul Fishery. Aboriginal people hold approximately 2.7 per cent of the total shares available in all of the Share Management Fisheries in New South Wales. More than 90 per cent of Aboriginal commercial fishers indicated that they gave some of their commercial catch to their local Aboriginal communities. These contributions ranged from 5 per cent to 20 per cent of annual catch with the average contribution approximately 9.8 per cent.
In recognising Torres Strait Island and Aboriginal people as a key stakeholder group, the FRDC increased its focus on improving the research and information available on Indigenous fishing. In 2010 it established an Interim Indigenous Reference Group to provide expert advice on the FRDC’s investment in research development and extension (RD&E) for Australia’s Aboriginal and Torres Strait Islander fishing and seafood industry. The first face-to-face meeting of the group occurred at the Cairns Forum 2011, which brought together more than 30 relevant experts. A key outcome of the forum was six Indigenous people being nominated to form the FRDC’s Indigenous Reference Group (IRG) (FRDC 2013b). The aim of the IRG was to develop a Fisheries and Aquaculture Research, Development and Extension Plan for Indigenous Australians. In line with this, the IRG has developed a futures plan that includes 11 key principles for Aboriginal and Torres Strait Islanders’ RD&E in the fishing and seafood industry. Drawing on the identified principles, the IRG has also developed a ‘Five RD&E Priorities for Indigenous Involvement in the Fishing and Seafood Industry’ document. These documents were endorsed at a second forum, the Cairns Forum 2012, and the principles and RD&E priorities were unanimously supported by Indigenous participants as a sound basis for guiding RD&E focused on Indigenous fishing.
The five strategic priorities for Indigenous participation in fishing and aquaculture in Australia were identified as:• Primacy for Indigenous people—Indigenous people have certain recognised rights
associated with and based on the prior and continued occupation of country and water, and activities (such as fishing and gathering) associated with using and managing these.
• Acknowledgement of Indigenous cultural practices—Indigenous people have the right to maintain and develop cultural practices to address spiritual, cultural, social and economic needs associated with aquatic resources and landscapes.
• Self-determination of Indigenous rights to use and manage cultural assets and resources—Indigenous people have the right to determine courses of action in using and managing aquatic biological resources.
Customary fishing
51ABARESAustralian fisheries and aquaculture statistics 2013
• Economic development opportunities arising from Indigenous peoples cultural assets and associated rights—Indigenous people have the right to engage in economic activity based on the use of traditional aquatic biological resources and/or the right to share in the benefits derived from the exploitation of aquatic biological resources.
• Capacity building opportunities for Indigenous people are enhanced—Indigenous people have the right to access capacity building activities to further their aspirations in using and managing aquatic biological resources (FRDC 2013a).
The IRG has identified RD&E actions to achieve these priorities and is now working to promote these to relevant stakeholders (FRDC 2013b) and encourage activities that deliver improved benefits to Aboriginal and Torres Strait Islander peoples. An important factor for realising improved benefits will be the willingness and capacity of other sectors to effectively engage with the Indigenous fishing sector and communities.

52 ABARESAustralian fisheries and aquaculture statistics 2013
Profile of Australian fisheries in 2011–12 and 2012–13
Commonwealth
Fishery Species Method Number(2011–12)
Number(2012–13)
Northern Prawn Banana prawn, tiger prawn,
Endeavour prawn and king prawn
Otter trawl 55 vessels 54 vessels
Torres Strait a Prawns, tropical rock
lobster, Spanish mackerel,
pearl shell, trochus, finfish,
sea cucumber, crab
Otter trawl, troll, hand
line, free dive, hookah
328 Rock lobster
licences
226 Rock lobster
licences
155 mackerel 107 mackerel
118 pearl shell 118 pearl shell
61 prawn 61 prawn
59 sea
cucumber
30 sea cucumber
68 trochus 39 trochus
80 crab 80 crab
134 line 103 line
SESSF
Commonwealth
Trawl Sector
Mixed fish species, particularly
pink ling, blue grenadier,
flathead, silver warehou
Otter trawl, Danish seine 50 vessels 50 vessels
SESSF Gillnet, Hook
and Trap Sector
Mixed fish species particularly
pink ling, blue-eye trevalla,
gummy shark
Demersal gillnet, demersal
longline, dropline, trotline,
trap, purse seine
90 vessels 82 vessels
SESSF Great
Australian Bight
Trawl Sector
Deepwater flathead,
Bight redfish
Demersal otter, limited
midwater trawl
5 vessels 6 vessels
Southern Bluefin
Tuna
Southern bluefin tuna Purse seine, pole and line,
longline, trolling
19 vessels 25 vessels
Eastern Tuna
and Billfish
Yellowfin tuna, bigeye tuna,
skipjack tuna, albacore, billfish
Pelagic longline, purse
seine, pole, trolling, rod
and reel, handline
56 vessels 47 vessels
continued ...

Profile of Australian fisheries in 2011–12 and 2012–13
53ABARESAustralian fisheries and aquaculture statistics 2013
Commonwealth
Fishery Species Method Number(2011–12)
Number(2012–13)
Western Tuna
and Billfish
Yellowfin tuna, bigeye tuna,
skipjack tuna, albacore, billfish
Pole and line, purse seine,
pelagic longline, troll, rod
and reel, handline
95 SFRs,
4 vessels
96 SFRs,
6 vessels
Bass Strait Scallop Scallop Dredge 66 permits,
12 vessels
65 concession
holders,
12 vessels
Small Pelagic b Blue mackerel, jack mackerel,
redbait, Australian sardine
Purse seine,
midwater trawl
70 permits,
3 vessels
Changed to
SFRs in 2012,
3 vessels
Southern Squid Jig Gould’s squid Jig 56 SFR
packages,
17 vessels
51 SFR packages,
8 vessels
Sub Antarctic Patagonian toothfish,
mackerel icefish
Trawl (demersal and
midwater), longline, trial
pot fishing
4 vessels 5 vessels
Patagonian toothfish Demersal trawl – –
Western Deepwater
Trawl
Mixed fish species Otter trawl 11 permits,
1 vessel
11 permits,
2 vessels
North West
Slope Trawl
Scampi Otter trawl 7 permits,
2 vessels
7 permits,
1 vessel
Coral Sea Reef fish including shark,
trochus, tropical rock lobster,
sea cucumber, aquarium fish,
live rock
Demersal line, trawl and
fish trap, hand collection
with and without
breathing apparatus,
hand-held scoop,
seine nets
16 permits 16 permits
South Tasman Rise Orange roughy, smooth oreodory,
spikey oreodory
Deepwater demersal trawl closed closed
a Numbers of active transferable vessel holder and traditional inhabitant licences in the Torres Strait with commercial fishing endorsements. b Includes four permits held in the Informally Managed Fishery. SESSF Southern and Eastern Scalefish and Shark Fishery. SFR Statutory fishing right. Source: Australian Fisheries Management Authority 2014
continued

Profile of Australian fisheries in 2011–12 and 2012–13
54 ABARESAustralian fisheries and aquaculture statistics 2013
New South Wales
Fishery Species Method Number(2011–12)
Number(2012–13)
Abalone Blacklip abalone (only) Diving 47 shareholdings 48 shareholdings
Rock Lobster Eastern rock lobster Trapping 100 shareholdings 101 shareholdings
Ocean Trawl Prawns, flathead and
school whiting
Otter board trawling 216 shareholdings 205 shareholdings
Ocean Trap and Line Snapper, leatherjacket,
bonito and spanner crab
Fish and spanner
crab traps, handline
and dropline
357 shareholdings 352 shareholdings
Ocean Hauling Mullet, Australian sardine
and eastern Australian
salmon
Hauling (seine) nets
and purse seine net
280 shareholdings 276 shareholdings
Southern Fish Trawl Flathead, school whiting
and squid
Otter board trawling 23 entitlements 23 entitlements
Estuary Prawn Trawl School prawn, squid
and king prawn
Otter board trawling 169 shareholdings 165 shareholdings
Estuary General Mullet, bream, prawn
and crab
Mesh and hauling
(seine) nets, crab
and fish traps and
hand gathering
605 shareholdings 600 shareholdings
Inland Yabby and European
carp (only)
Yabby traps and gillnets 26 entitlements 27 entitlements
Sea Urchin and
Turban Shell
Sea urchin and
periwinkle
Diving 37 entitlements 37 entitlements
Aquaculture a Prawns Pond culture 10 licence holders 10 licence holders
Yabby Ponds and farm dams 72 licence holders 73 licence holders
Oyster Rack tray and stick 322 licence holders 318 licence holders
Silver perch Pond 77 licence holders 76 licence holders
Trout Ponds and raceway 20 licence holders 22 licence holders
Snapper na 9 licence holders 9 licence holders
Barramundi Pond culture 6 licence holders 7 licence holders
a Aquaculture licence holders may culture more than one species per licence. na Not applicable. Note: All New South Wales shares/entitlements are held in fishing businesses that may have shares and/or entitlements in one or more fisheries. The Abalone, Rock Lobster, Ocean Trawl (Prawn and Northern Fish Trawl), Ocean Trap and Line, Ocean Hauling, Estuary General and Estuary Prawn Trawl Fisheries are share management fisheries. The Sea Urchin and Turban Shell, Southern Fish Trawl and Inland Fisheries are restricted fisheries. Source: New South Wales Department of Primary Industries 2014

Profile of Australian fisheries in 2011–12 and 2012–13
55ABARESAustralian fisheries and aquaculture statistics 2013
Victoria
Fishery Species Method Number(2011–12)
Number(2012–13)
Abalone Greenlip abalone,
blacklip abalone
Diving 71 licences 71 licences
Scallops Scallop Dredge 91 licences 91 licences
Bay and Inlet Mixed species Various 89 licences 89 licences
Rock Lobster Southern rock lobster Pots 116 licences
and 7235 pots
116 licences
and 7235 pots
Giant Crab Giant crab Pots 25 licences 25 licences
Inshore Trawl Mixed species Various 60 licences 60 licences
Wrasse (Ocean) Wrasse Hand lines 25 licences 25 licences
Bait (General) Mixed species Various 26 licences 25 licences
Ocean (General) Mixed species Various 221 licences 221 licences
Aquaculture a
Abalone Flow-through systems 15 licences 15 licences
Freshwater eel,
longfin eel
Recirculation units and
cultured waters
12 licences 13 licences
Mussels Longlines 24 licences 19 licences
Ornamental fish Recirculation units and ponds 7 licences 10 licences
Yabby Recirculation units, ponds
and farm dams
15 licences 14 licences
Salmonids Recirculation units and raceways 21 licences 20 licences
Warm-water finfish Recirculation units, flow through
system and ponds
23 licences 19 licences
Other na 19 licences 18 licences
a Aquaculture licence holders may culture more than one species on their licence. na Not applicable. Source: Victorian Department of Environment and Primary Industries 2013

Profile of Australian fisheries in 2011–12 and 2012–13
56 ABARESAustralian fisheries and aquaculture statistics 2013
Queensland
Fishery Species Method Number(2011–12)
Number(2012–13)
East Coast Trawl Tiger prawn, banana prawn,
king prawn, Endeavour
prawn, bay prawn, saucer
scallop, bug
Otter trawl 396 licence holders 388 licence holders
River and Estuary Trawl Banana prawn, bay prawn,
tiger prawn
Beam trawl 109 licence holders 105 licence holders
Gulf of Carpentaria
Inshore
Barramundi, king threadfin,
blue threadfin, shark, grey mackerel
Net 92 licence holders 90 licence holders
East Coast Net
(mainly Tropical)
Barramundi, king threadfin,
blue threadfin, shark, grey mackerel
Net 159 licence holders 141 licence holders
East Coast Net
(mainly Subtropical)
Mullet, tailor, whiting, bream,
grey mackerel, shark
Net 162 licence holders 125 licence holders
East Coast Shark Various shark species Net 155 licence holders 147 licence holders
East Coast Handline
(mainly Tropical)
Coral trout, redthroat emperor,
various other reef species
Handline 204 licence holders 202 licence holders
East Coast Handline
(mainly Subtropical)
Snapper, pearl perch, other rocky
reef species
Handline 241 licence holders 238 licence holders
Line RQ (Handline) a Coral trout, redthroat emperor,
various other reef species
Handline 370 licence holders 364 licence holders
Line SM (Trolling) b Spanish mackerel Trolling 255 licence holders 252 licence holders
Estuary Crab Mud crab, blue swimmer crab Pot 437 licence holders 436 licence holders
Oceanic Crab Spanner crab Pot 234 licence holders 237 licence holders
Aquaculture Prawns Pond culture 63 development
approvals
(20 producing)
63 development
approvals
(20 producing)
Barramundi Pond and cage
culture (incl. tank
culture)
268 development
approvals
(17 producing)
250 development
approvals
(20 producing)
Oyster Rack and stick
culture
98 development
approvals
(20 producing)
98 development
approvals
(22 producing)
Redclaw Pond culture 189 development
approvals
(28 producing)
179 development
approvals
(24 producing)
Freshwater fish Pond and tank
culture
255 development
approvals
(25 producing
190 development
approvals
(20 producing
Eel Pond and tank
culture
44 development
approvals
(4 producing)
34 development
approvals
(3 producing)
a Coral Reef Fin Fish Fishery; the RQ symbol can be used only in the area defined for the East Coast Line Fishery symbol(s) appearing on the same licence. b Spanish Mackerel Fishery; the SM symbol can be used only in the area defined for the East Coast Line Fishery symbol(s) appearing on the same licence. Source: Fisheries Queensland, Department of Agriculture, Fisheries and Forestry 2014

Profile of Australian fisheries in 2011–12 and 2012–13
57ABARESAustralian fisheries and aquaculture statistics 2013
South Australia
Fishery Species Method Number(2011–12)
Number(2012–13)
Blue Crab Blue swimmer crab Pots 9 licence holders 9 licence holders
Central Zone Abalone Greenlip abalone,
blacklip abalone
Diving 6 licence holders 6 licence holders
Gulf St Vincent Prawn King prawn Trawl 10 licence holders 10 licence holders
Lakes and Coorong Freshwater finfish, marine
finfish, molluscs
Netting, line fishing,
handlines
36 licence holders 36 licence holders
Marine Scalefish Various finfish, crustaceans,
molluscs
Netting, line fishing,
handlines and traps
330 licence holders 326 licence holders
Miscellaneous Various finfish, crustaceans,
molluscs, worms
Traps, diving, etc 19 licence holders 18 licence holders
Northern Zone Rock Lobster Southern rock lobster Pots 68 licence holders 68 licence holders
Restricted Marine Scalefish Various finfish,
crustaceans, molluscs
Netting, line fishing,
handlines, traps
12 licence holders 10 licence holders
River Fishery Freshwater finfish,
crustaceans
Netting, pots 6 licence holders 6 licence holders
Southern Zone Rock Lobster Southern rock lobster Pots 181 licence holders 181 licence holders
Southern Zone Abalone Greenlip abalone,
blacklip abalone
Diving 6 licence holders 6 licence holders
Spencer Gulf Prawn King prawn Trawl 39 licence holders 39 licence holders
West Coast Prawn King prawn Trawl 3 licence holders 3 licence holders
Western Zone Abalone Greenlip abalone,
blacklip abalone
Diving 23 licence holders 23 licence holders
Aquaculture
Land-based Category A:
native species to local area,
e.g. yabby
Ponds, dams 65 licences 65 licences
Land-based Category B:
exotic species to locality,
e.g. marron, barramundi
Ponds, dams and
recirculation systems
38 licences 39 licences
Land-based Category C:
high risk, e.g. abalone
Ponds, recirculation
systems
15 licences 15 licences
Marine: abalone Seacages, contained
longlines, uncontained
benthic structures
17 licences 16 licences
Marine: intertidal molluscs,
e.g. oyster
Contained racks and
contained longlines
339 licences 344 licences
Marine: subtidal molluscs,
e.g. blue mussel
Longlines 38 licences 38 licences
Marine: tuna Seacages 41 licences 41 licences
Marine: finfish Seacages 32 licences 32 licences
Sources: Department of Primary Industries and Regions South Australia 2013; South Australian Research and Development Institute

Profile of Australian fisheries in 2011–12 and 2012–13
58 ABARESAustralian fisheries and aquaculture statistics 2013
Western Australia
Fishery Species Method Number(2011–12)
Number(2012–13)
West Coast Rock
Lobster a
Western rock lobster Pots 292 active licences 274 active licences
Abalone bc Greenlip abalone, brownlip
abalone, Roe’s abalone
Diving 40 boats 39 boats
Shark Bay Prawn King prawn, tiger prawn,
Endeavour prawn, saucer scallop
Trawl 18 licences 18 licences
Exmouth Gulf Prawn King prawn, tiger prawn,
Endeavour prawn
Trawl 15 licences 15 licences
Nickol Bay Prawn King prawn, banana prawn Trawl 14 licences 14 licences
Aquaculture
Pearls Longlines – –
Yabby Ponds and farm dams – –
Marron Ponds and farm dams – –
Blue mussel Longlines – –
a 2011–12 and 2012–13 number of active licences provided rather than the number of active boats due to a change of data collection process. b 2012–13 number of active boats; actual number of licences is 45. c 2012–13 number of active boats; actual number of licences is 40. Source: Western Australian Department of Fisheries 2014
Tasmania
Fishery Species Method Number(2011–12)
Number(2012–13)
Abalone Blacklip abalone, greenlip
abalone
Diving 121 licence holders 120 licence holders
Rock Lobster Southern rock lobster Pots 312 licence holders 311 licence holders
Giant Crab Giant crab Pots 85 licence holders 84 licence holders
Scallop Commercial scallop, doughboy
scallop, queen scallop
Scallop harvester 74 licence holders 73 licence holders
Scalefish Various Netting/hooks 307 licence holders 302 licence holders
Aquaculture
Atlantic salmon Sea cages 42 licence holders 44 licence holders
Pacific oyster Racking/line system 111 licence holders 103 licence holders
Blue mussel Longlines 13 licence holders 10 licence holders
Rainbow trout Sea cages 6 licence holders 7 licence holders
Other – 4 licence holders 4 licence holders
Abalone Seacages and
land-based tanks
8 licence holders 7 licence holders
Source: Tasmanian Department of Primary Industries, Parks, Water and Environment 2014

Profile of Australian fisheries in 2011–12 and 2012–13
59ABARESAustralian fisheries and aquaculture statistics 2013
Northern Territory
Fishery Species Method Number(2011–12)
Number(2012–13)
Coastal Finfish and bait Line, net and trap 60 licence holders 63 licence holders
Offshore a Mackerel, shark, reef fish Trolling, hand and
longline net, trap
and trawling
79 licence holders 80 licence holders
Barramundi Barramundi and threadfin Gillnet 20 licence holders 20 licence holders
Mud crab Mud crab Crab pots 49 licence holders 49 licence holders
Other Molluscs, oyster, sea cucumber,
squid and aquarium fish
Hand harvest, jigging
and a variety of
other methods
25 licence holders 26 licence holders
Aquaculture b Prawns – 8 endorsements 8 endorsements
Barramundi – 8 endorsements 8 endorsements
Others – 29 endorsements 29 endorsements
Pearls – 8 licence holders 9 licence holders
a Changes in the Timor Reef Fishery and Demersal Fishery have changed the management arrangements and licence holder criteria. This fishery is now managed by individual transferrable quota and there are no restrictions on the amount of licences that can be issued or held. b Aquaculture licence holders may culture more than one species on their licences. The number of licences is included once for each type; that is, if a licence is approved for barramundi, prawns and other species, it will be listed once in each category. Source: Northern Territory Department of Primary Industry and Fisheries 2014

60 ABARESAustralian fisheries and aquaculture statistics 2013
aquaculture commercial growing of marine or freshwater animals and
aquatic plants
aquaculture production live weight quantity of aquaculture product produced and
marketed by aquaculturists
aquaculture value assessed value received by aquaculturists on the basis of an ‘at
farm gate’ equivalent, for product marketed
export quantity data supplied by the Australian Bureau of Statistics (ABS) on the
basis of the net product weight (excluding packaging) exported.
Exports are identified by the ABS according to source state or
territory, not state or territory in which the product was caught
or farmed
export value data supplied by the ABS, and valued on a free-on-board (fob) basis at
the Australian port of export. The costs of freight, insurance and
other distributive services beyond the Australian customs border
are not included
fisheries refers to Commonwealth, state and territory waters in which
marine and freshwater animals are commercially caught or
farmed, unless otherwise specified
fisheries production refers to commercial production of wild-caught and aquaculture
marine or freshwater animals from Commonwealth, state and
territory waters and aquaculture farms, unless otherwise specified
import quantity data supplied by the ABS on the basis of the net product weight
(excluding packaging) imported
import value data supplied by the ABS on the basis of product cost. Imports
are valued on a customs value for duty basis that is identical to a
free on board (fob) basis. The customs value for duty is the price
actually paid at the port of origin, including inland freight and
insurance costs incurred in delivering the product(s) to the port of
origin. The freight and insurance costs of delivering the product(s)
to the Australian port of destination are excluded.
production quantity measure of the quantity of fish product landed by a fishery, usually
on the basis of catch records
Glossary

Glossary
61ABARESAustralian fisheries and aquaculture statistics 2013
production value assessed value at the point of landing for the quantity produced
(excludes transport and marketing costs)
real terms/real prices historical or future prices adjusted to reflect changes to the
purchasing power of money (most commonly measured by the
consumer price index)
re-exports goods (included in merchandise exports statistics) originally imported
and then exported in either the same condition in which they
were imported, or after undergoing repair or minor alterations that
leave them essentially unchanged. Not considered to be Australian
production or manufacture. Minor operations include blending,
packaging, bottling, cleaning and sorting.
re-imports goods (included in merchandise import statistics) originally exported
and then imported in either the same condition in which they
were exported, or after undergoing repair or minor operations
that leave them essentially unchanged. Minor operations include
blending, packaging, bottling, cleaning and sorting.
reals and rounding real 2012–13 dollars or real terms refer to conversion of nominal
dollar values to take account of inflation. Comparison from year
to year is expressed in nominal terms unless stated otherwise.
Small discrepancies in totals are generally caused by the rounding
components.
seafood any fish or other aquatic plant or animal intended for human
consumption; excludes non-edible fisheries products.
southern bluefin tuna sold from aquaculture farms in South Australia and reported at
its market value (farmgate aquaculture value). The input value
of those tuna is also included as a production output from the
Commonwealth’s Southern Bluefin Tuna Fishery. To avoid double
counting, the input value is netted out of Australian totals.
wild catch marine or freshwater animals commercially taken from the wild
rather than farmed inland or along coastal areas.
Note on jurisdictionsAustralian fisheries are defined as those fisheries falling within the Australian Exclusive Economic Zone (EEZ), which extends to 200 nautical miles from coastal baselines. Australia does have some jurisdiction over the seabed outside the EEZ, where the continental shelf extends beyond the zone. This extended continental shelf area is currently of limited importance to the Australian fishing industry as jurisdiction is restricted to sedentary marine organisms. To simplify jurisdiction, maritime boundaries (determined by legislation) specify the default management responsibility of the state, Northern Territory and Commonwealth governments. Each state and the Northern Territory has responsibility for fisheries that lie within its internal waters (for example, river, lake and estuarine fisheries) and, where applicable, adjacent fisheries within three nautical miles from the coastline (coastal waters).
The Commonwealth has jurisdiction for fisheries that lie between 3 and 200 nautical miles from the coastline. When a fishery falls within two or more jurisdictions, an offshore constitutional settlement arrangement is generally developed and responsibility is passed to one jurisdiction.
For more information about maritime boundaries, see the Geoscience Australia website.

62 ABARESAustralian fisheries and aquaculture statistics 2013
ABS 2013, Labour force, Australia, detailed, quarterly, cat. no. 6291.0, Australian Bureau of Statistics, Canberra, April.
ABS 2012, ‘Working population profile’, 2011 Census community profile series, cat. no. 2006.0, Australian Bureau of Statistics, Canberra.
ABS 2003, Year book Australia 2003, cat. no. 1301.0, Australian Bureau of Statistics, Canberra.
ABS 1989, Year book Australia 1989, no. 72, Australian Bureau of Statistics, Canberra.
Australian Government 2013, The coalition’s policy for a more competitive and sustainable fisheries sector, Canberra.
Bridge, N & Conron, S 2010, State-wide angler fishing diary program 1997–2006: Recreational Fishing Grant Program final report, project no. R/03/04/05, Department of Primary Industries, Melbourne.
Butterly, L 2013, ‘Unfinished Business in the Straits: Akiba v Commonwealth of Australia’ HCA 33, Indigenous Law Bulletin, vol. 8, Issue 8, September/October.
Campbell, D & Murphy, JJ 2005, The 2000–01 National Recreational Fishing Survey economic report: a Fisheries Action Program project, FRDC project no. 99/158, Natural Heritage Trust, Department of Agriculture, Fisheries and Forestry, Canberra.
CBCS 1936, Official yearbook of the Commonwealth of Australia 1935, no. 28, Commonwealth Bureau of Census and Statistics, Canberra.
CIA 2014, CIA World Factbook 2014 Japan Demographics Profile 2014, available at indexmundi.com/japan/demographics_profile.html.
Conron, S, Bridge, NF, Oliveiro, P & Bruce, TK 2012, Angler diary monitoring of recreational fishing in selected Victorian waters during 2010/11: Recreational Fishing Grant Program final report, Department of Primary Industries, Melbourne.
Danenverg, N & Mueller S, ‘Omnibus Consumer Research Findings wave 2’, Australian seafood cooperative research centre, project no. 2008/779.
References

References
63ABARESAustralian fisheries and aquaculture statistics 2013
DEEDI 2011, Prospects for Queensland’s primary industries 2011–12, Fisheries Queensland, Department of Employment, Economic Development and Innovation, Brisbane.
DFAT 1978, Treaty between Australia and the Independent State of Papua New Guinea concerning Sovereignty and Maritime Boundaries in the area between the two Countries, including the area known as Torres Strait, and Related Matters, Australian treaty series 1985, no. 4, Department of Foreign Affairs, Canberra.
Dominion Consulting Pty Ltd 2005, An economic profile of the Australian fishing tackle industry, final report to the Australian Fishing Tackle Association, Sydney, October.
DPIF 2012, Indigenous Fisheries Development Strategy 2012–2014, Fisheries Division, Department of Primary Industries and Fisheries, Northern Territory Government, available at nt.gov.au/d/Fisheries/Content/File/indigenous/Indigenous_Fisheries_Development_Strategy.pdf (pdf 1.5mb).
DPIPWE 2013, Aboriginal Fishing Activities, Department of Primary Industries, Parks, Water and Environment, available at dpiw.tas.gov.au/inter.nsf/WebPages/HMUY-5TD8PT?open.
FAO Globefish 2013, Tuna – May 2013, Globefish, FAO Fisheries and Aquaculture Department, available at globefish.org/tuna-may-2013.html.
FAO 2014, State of world fisheries and aquaculture opportunities and challenges, Food and Agriculture Organization of the United Nations.
Forbes, E, Tracey, S & Lyle, J 2009, Assessment of the 2008 recreational gamefish fishery of southeast Tasmania, with particular reference to southern bluefin tuna, Tasmanian Aquaculture and Fisheries Institute, University of Tasmania, Hobart.
FRDC 2013a, Indigenous Research, Development and Extension (RD&E) Priorities for Fishing and Aquaculture, endorsed at the Cairns Forum 2012, November 2012. available at frdc.com.au/environment/indigenous_fishing/Documents/Indigenous Priorities for Fishing and Aquaculture - endorsed Cairns Forum 2012.pdf (754 kb).
FRDC 2013b, Terms of Reference For the Fisheries Research and Development Corporation (FRDC) Indigenous Reference Group (IRG) as at January 2013, available at frdc.com.au/environment/indigenous_fishing/Documents/ToR IRG phase 2 - Final Jan 2013.pdf (792 kb).
FRDC 2010, Working together: The National Fishing and Aquaculture RD&E Strategy 2010, report for the Strategy Working Group, Fisheries Research and Development Corporation, Canberra.
FRDC 2005, Investing for tomorrow’s fish: the FRDC’s research and development plan, 2005 to 2010, Fisheries Research and Development Corporation, Canberra.
Green C, Brown P, Giri K, Bell J & Conron S 2012, Quantifying the recreational catch of southern bluefin tuna off the Victorian coast, no. R09/10/03, Recreational Fishing Grants Program Research Report, Fisheries Victoria, Department of Primary Industries, Melbourne, June.
Griffiths, SP & Pepperell, JG 2006, A preliminary synopsis of existing recreational fisheries data sources and the potential for monitoring recreational fishing activities in Commonwealth fisheries: a discussion paper, final report for project R06/822 to the Australian Fisheries Management Authority, Canberra.

References
64 ABARESAustralian fisheries and aquaculture statistics 2013
Henry, GW & Lyle, JM (eds) 2003, The National Recreational and Indigenous Fishing Survey, FRDC project no. 99/158, Department of Agriculture, Fisheries and Forestry, Canberra.
I&I NSW 2009, Cultural fishing in NSW, Industry and Investment New South Wales, Department of Primary Industries, Sydney, May.
International Markets Bureau 2010, The Japanese Consumer Behaviour, Attitudes and Perceptions toward Food Products, available at gov.mb.ca/agriculture/market-prices-and-statistics/trade-statistics/pubs/japan_consumer_report_en.pdf (928 kb).
Jones, K 2009, South Australian Recreational Fishing Survey 2007–08, South Australian Fisheries management series paper no. 54, PIRSA Fisheries, Adelaide, South Australia.
Lyle, JM & Tracey, SR 2012, Tasmanian recreational rock lobster and abalone fisheries: 2010–11 fishing season, Institute for Marine and Antarctic Studies, University of Tasmania, Hobart.
Lyle, JM, Tracey, SR, Stark, KE & Wotherspoon, S 2009, 2007–08 Survey of Recreational Fishing in Tasmania, Tasmanian Aquaculture and Fisheries Institute, University of Tasmania, Hobart.
NNTT 2005, Indigenous fishing bulletin, National Native Title Tribunal, Australia, November.
NNTT 2004, ‘Fishing principles to guide Indigenous involvement in marine management’, media release, National Native Title Tribunal, Australia, 22 December.
NNTT 2003, ‘Australia’s first Indigenous fishing rights conference draws local and international experts’, media release, National Native Title Tribunal, Australia, 27 October.
NSW DPI 2013, Indigenous Fisheries Strategy, New South Wales Department of Primary Industries, available at dpi.nsw.gov.au/fisheries/aboriginal-fishing/strategy
Park, T 2007, NSW gamefish tournament monitoring—Angling Research Tournament Monitoring Program, NSW Department of Primary Industries, Cronulla Fisheries Research Centre of Excellence, Cronulla, New South Wales.
PIRSA 2010, South Australian recreational fishing guide 2009, Department of Primary Industries and Resources South Australia, Adelaide.
Queensland DAFF 2012, 2010 Statewide Recreational Fishing Survey, Queensland Department of Agriculture, Fisheries and Forestry, Brisbane,Queensland.
Recfish Australia 2010, Recreational fishing in Commonwealth Waters: a preliminary assessment, Recfish Australia, Brisbane.
Recfishing Research 2014, Recfishing Research Priorities for 2015, Recfishing Research, available at recfishingresearch.org/wp-content/uploads/2012/03/RR-Priorities-2015-Annual-Competitive-Round-030514.pdf (123 kb).
Ryan, KL, Wise, BS, Hall, NG, Pollock, KH, Sulin, EH & Gaughan, DJ 2013, An integrated system to survey boat-based recreational fishing in Western Australia 2011/12’, Fishing Research Report no. 249, Department of Fisheries, Western Australia.
Schnierer, S & Egan, H 2012, Impact of management changes on the viability of Indigenous commercial fishers and the flow on effects to their communities: case study in New South Wales, report to the Fisheries Research and Development Corporation, Canberra.
References
65ABARESAustralian fisheries and aquaculture statistics 2013
Schnierer, S & Egan, H 2011, Aboriginal fisheries in New South Wales: determining catch, cultural significance of species and traditional fishing knowledge needs, report to the Fisheries Research and Development Corporation, Canberra.
Steffe, AS & Murphy, JJ, 2011, Recreational fishing surveys in the Greater Sydney Region, NSW Fisheries final report series no. 131, NSW Department of Primary Industries, Cronulla Fisheries Research Centre of Excellence, Cronulla, New South Wales.
TSRA 2010, TSLA land and sea management, Torres Strait Regional Authority, Thursday Island, Queensland.
VIC DPI 2012, Aboriginal Fishing Strategy, Victorian Department of Primary Industries.
WA Fisheries 2012, ‘Customary Fishing – frequently asked questions’, Western Australian Department of Fisheries, Perth, available at fish.wa.gov.au/Fishing-and-Aquaculture/Customary-Fishing/Pages/Customary-Fishing-FAQ.aspx, accessed 26 November 2012.
WA Fisheries 2009, Customary Fishing Policy, Western Australian Department of Fisheries, Perth, available at fish.wa.gov.au/Fishing-and-Aquaculture/Customary-Fishing/Pages/default.aspx, viewed 21 December 2009.
Ward, P, Mazur, K, Stenekes, N, Kancans, R, Curtotti, R, Summerson, R, Gibbs, C, Marton, N, Moore, A & Roach, J 2012, A socioeconomic evaluation of three eastern Australian game-fishing regions, ABARES report to client prepared for the Fisheries Research and Development Corporation, Canberra, August.
West, LD, Lyle, JM, Matthews, SR, Stark, KE & Steffe, AS 2012, Survey of Recreational Fishing in the Northern Territory, 2009–10, fishery report no. 109, Department of Primary Industry and Fisheries, Northern Territory Government, Darwin.
http://www.fish.wa.gov.au/Fishing-and-Aquaculture/Customary-Fishing/Pages/Customary-Fishing-FAQ.aspx

66 ABARESAustralian fisheries and aquaculture statistics 2013

References
67ABARESAustralian fisheries and aquaculture statistics 2013
Statistical tables

TABLE 1 Gross value of fisheries production, Australia PRODUCTIONPRODUCTION
1 G l f fi h i d i A li1Grossvalueoffisheriesproduction,Australia1Grossvalueoffisheriesproduction,Australia2010–11 2011–12 2012–13 pp
$’000 $’000 $’000$ $ $State wild‐catch fisheriesNew South Wales 80 202 77 040 76 220State wild‐catch fisheries New South Wales 80 202 77 040 76 220Vi t i 51 258 55 474 54 527Victoria 51 258 55 474 54 527Queensland 194 484 185 712 195 345Queensland 9 8 85 95 3 5South Australia 195 440 208 928 198 105South Australia 195 440 208 928 198 105Western Australia 285 890 279 877 330 805Western Australia 285 890 279 877 330 805Tasmania 163 053 155 982 175 865Tasmania 163 053 155 982 175 865N th T it 33 353 35 510 34 090Northern Territory 33 353 35 510 34 090Total 1 003 680 998 523 1 064 957Aquaculture aNew South Wales 48 087 46 959 47 547Aquaculture aNew South Wales 48 087 46 959 47 547Victoria 18 839 17 882 20 682Victoria 18 839 17 882 20 682Q l dQueensland 82 471 82 509 81 771South Australia 216 708 228 519 242 740South Australia 216 708 228 519 242 740Western Australia 112 448 109 235 95 954Western Australia 112 448 109 235 95 954Tasmania 448 740 536 965 520 031Tasmania 448 740 536 965 520 031Northern Territory 26 980 17 214 23 900Northern Territory 26 980 17 214 23 900T t l 954 272 1 039 284 1 032 626Total 954 272 1 039 284 1 032 626C l h fi h iCommonwealth fisheries Northern Prawn 94 828 64 708 71 039Northern Prawn 94 828 64 708 71 039Torres Strait 33 932 23 914 26 919Torres Strait 33 932 23 914 26 919SESSF Commonwealth Trawl Sector 48 579 50 644 56 345SESSF Commonwealth Trawl Sector 48 579 50 644 56 345SESSF Gillnet Hook and Trap Sector 23 830 20 860 22 023SESSF Gillnet, Hook and Trap Sector 23 830 20 860 22 023SESSF G t A t li Bi ht T l S t 11 074 11 639 11 995SESSF Great Australian Bight Trawl Sector 11 074 11 639 11 995gEastern Tuna and Billfish – Longline and minor line 30 917 28 035 24 842Eastern Tuna and Billfish Longline and minor line 30 9 8 035 8Southern Bluefin Tuna 31 473 42 045 37 154Southern Bluefin Tuna 31 473 42 045 37 154Western Tuna and Billfish np np npWestern Tuna and Billfish np np npBass Strait Scallop 2 946 1 027 502Bass Strait Scallop 2 946 1 027 502S th S id Ji 1 657 2 075Southern Squid Jig 1 657 2 075 naOther fisheries b 42 508 64 774 67 655Other fisheries bTotal 321 744 309 722 318 473Total 321 744 309 722 318 473Total value c 2 248 053 2 304 841 2 381 482Total value c 2 248 053 2 304 841 2 381 482E l d th l f h t h fi h d ti b I l d t i k d d S ll P l i M i I l d C l S H da Excludes the value of hatchery fishery production. b Includes entries marked np and Small Pelagics, Macquarie Island, Coral Sea, Heard
and McDonald Islands, SESSF Victorian coastal waters sector, Norfolk Island, South Tasman Rise, Eastern and Western Skipjack Tuna, East , , , , pj ,Coast Deepwater Trawl, North West Slope Trawl, and Western Deepwater Trawl fisheries because of confidentiality requirements. c ToCoast Deepwater Trawl, North West Slope Trawl, and Western Deepwater Trawl fisheries because of confidentiality requirements. c To avoid double counting total value has been reduced to allow for southern bluefin tuna caught in the Commonwealth Southern Bluefin Tunaavoid double counting, total value has been reduced to allow for southern bluefin tuna caught in the Commonwealth Southern Bluefin Tuna Fi h i t t f i S th A t li N t il bl N t f bli ti b f fid ti lit i t I l d d iFishery, as an input to farms in South Australia. na Not available. np Not for publication because of confidentiality requirements. Included in Other fisheries. p Preliminary. SESSF Southern and Eastern Scalefish and Shark Fishery.Other fisheries. p Preliminary. SESSF Southern and Eastern Scalefish and Shark Fishery.Sources: ABARES; Australian Fisheries Management Authority; Department of Fisheries, Western Australia; Department of PrimarySources: ABARES; Australian Fisheries Management Authority; Department of Fisheries, Western Australia; Department of Primary Industries New South Wales; Department of Primary Industries Parks Water and Environment Tasmania; Fisheries QueenslandIndustries, New South Wales; Department of Primary Industries, Parks, Water and Environment, Tasmania; Fisheries Queensland, D t t f A i lt Fi h i d F t Fi h i Vi t i D t t f E i t d P i I d t i N th T itDepartment of Agriculture, Fisheries and Forestry; Fisheries Victoria, Department of Environment and Primary Industries; Northern Territory Department of Primary Industry and Fisheries; Primary Industries and Regions, South Australia; South Australian Research and Development Department of Primary Industry and Fisheries; Primary Industries and Regions, South Australia; South Australian Research and Development InstituteInstitute
68
Production
ABARESAustralian fisheries and aquaculture statistics 2013

TABLE 2 Wild catch fisheries production a 2 Wild catch fisheries production a2Wildcatchfisheriesproductiona2010 11 2011 12 2012 13 pt $’000 t $’000 t $’000
2010–11 2011–12 2012–13 pt $’000 t $’000 t $’000
FishAustralian salmon 1 802 2 123 2 581 3 122 2 820 4 002FishAustralian salmon 1 802 2 123 2 581 3 122 2 820 4 002A t li di 38 225 22 970 41 319 24 541 38 437 23 820Australian sardine 38 225 22 970 41 319 24 541 38 437 23 820Barramundi 2 080 17 532 2 259 18 291 1 582 13 017Barramundi 2 080 17 532 2 259 18 291 1 582 13 017Bream 1 113 5 887 1 037 5 979 1 106 5 930Bream 1 113 5 887 1 037 5 979 1 106 5 930Coral trout 846 26 973 764 24 268 774 24 738Coral trout 846 26 973 764 24 268 774 24 738D i 938 2 871 818 3 139 559 2 296Dories 938 2 871 818 3 139 559 2 296Flathead 3 944 22 454 4 125 23 462 3 892 25 627Flathead 3 944 22 454 4 125 23 462 3 892 25 627Gemfish 247 687 208 643 144 422Gemfish 247 687 208 643 144 422Pink ling 1 105 7 180 1 217 6 680 1 002 6 342Pink ling 1 105 7 180 1 217 6 680 1 002 6 342
llMullet 5 826 14 935 5 430 13 265 4 722 13 721Orange roughy 280 1 025 264 1 365 217 1 036Orange roughy 280 1 025 264 1 365 217 1 036Shark b 6 622 27 597 6 010 25 154 5 720 26 608Shark b 6 622 27 597 6 010 25 154 5 720 26 608S i h k l 1 149 8 152 1 190 8 976 1 196 9 128Spanish mackerel 1 149 8 152 1 190 8 976 1 196 9 128Tuna 7 120 55 250 7 554 63 548 8 089 59 495TunaWhiting 4 002 20 429 3 165 18 572 2 851 16 778Whiting 4 002 20 429 3 165 18 572 2 851 16 778Other 35 881 177 004 35 931 212 317 35 317 211 643Other 35 881 177 004 35 931 212 317 35 317 211 643T t l 111 182 413 069 113 873 453 321 108 430 444 602Total 111 182 413 069 113 873 453 321 108 430 444 602CrustaceansCrab 5 805 57 079 5 030 58 143 4 634 52 630Crab 5 805 57 079 5 030 58 143 4 634 52 630Prawns 23 191 250 736 18 494 205 999 17 403 217 016Prawns 23 191 250 736 18 494 205 999 17 403 217 016Rock lobster 9 925 391 816 9 146 394 257 10 549 450 973Rock lobster 9 925 391 816 9 146 394 257 10 549 450 973Other 292 4 613 310 5 942 397 7 631Ot eTotal 39 213 704 244 32 980 664 341 32 983 728 250Total 39 213 704 244 32 980 664 341 32 983 728 250MolluscsAbalone 4 737 161 965 4 464 150 478 4 529 165 974MolluscsAbalone 4 737 161 965 4 464 150 478 4 529 165 974Octopus 657 3 611 464 3 617 556 5 629pPipi 394 3 749 464 4 109 561 4 895Pipi 394 3 749 464 4 109 561 4 895Scallop 6 956 22 074 3 563 8 240 6 750 14 685Scallop 6 956 22 074 3 563 8 240 6 750 14 685Squid 2 146 9 883 3 061 13 505 2 929 12 656Squid 2 146 9 883 3 061 13 505 2 929 12 656Other 251 4 554 238 1 614 318 1 723Total 15 139 205 835 12 254 181 562 15 643 205 562Total 15 139 205 835 12 254 181 562 15 643 205 562Other NEI 264 1 355 229 7 578 196 6 223Other NEI 264 1 355 229 7 578 196 6 223T t l ild ht 165 799 1 324 502 159 336 1 306 803 157 252 1 384 636Total wild caught 165 799 1 324 502 159 336 1 306 803 157 252 1 384 636a State and Commonwealth wild‐catch production. b Shark converted to whole weight. NEI Not elsewhere included. p Preliminary.a State and Commonwealth wild catch production. b Shark converted to whole weight. NEI Not elsewhere included. p Preliminary.Sources: ABARES; Australian Fisheries Management Authority; Department of Fisheries, Western Australia; Department of Primary Industries, New South Wales;Sources: ABARES; Australian Fisheries Management Authority; Department of Fisheries, Western Australia; Department of Primary Industries, New South Wales; Department of Primary Industries Parks Water and Environment Tasmania; Fisheries Queensland Department of Agriculture Fisheries and Forestry; Fisheries VictoriaDepartment of Primary Industries, Parks, Water and Environment, Tasmania; Fisheries Queensland, Department of Agriculture, Fisheries and Forestry; Fisheries Victoria, D t t f E i t d P i I d t i N th T it D t t f P i I d t d Fi h i P i I d t i d R i S th A t liDepartment of Environment and Primary Industries; Northern Territory Department of Primary Industry and Fisheries; Primary Industries and Regions, South Australia; South Australian Research and Development InstituteSouth Australian Research and Development Institute
69
Production
ABARESAustralian fisheries and aquaculture statistics 2013
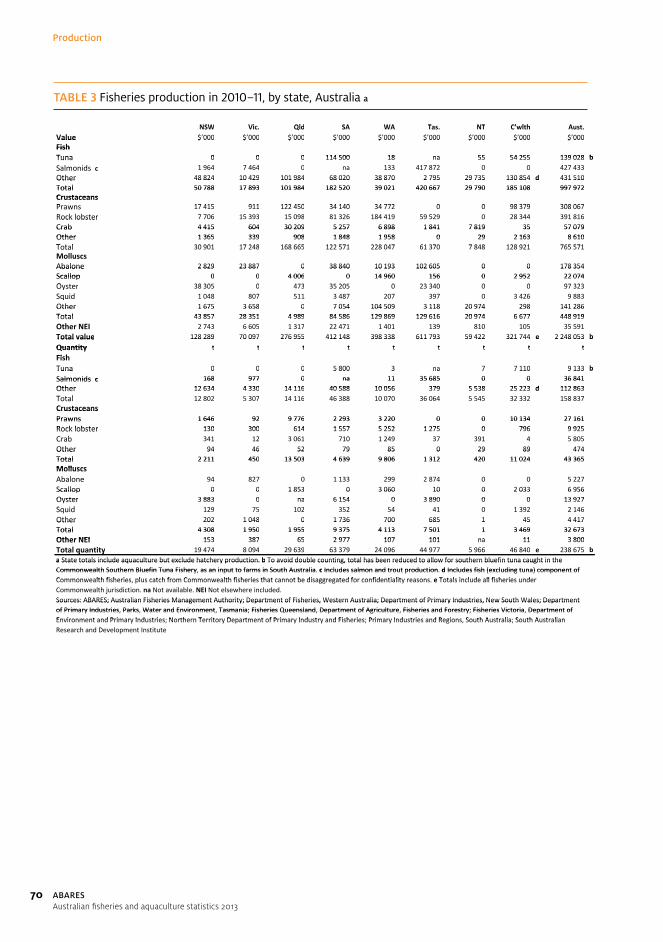
TABLE 3 Fisheries production in 2010–11, by state, Australia a 3 Fisheries production in 2010–11 by state Australia a3Fisheriesproductionin2010–11,bystate,AustraliaaNSW Vi Qld SA WA T NT C’ lth A tNSW Vic. Qld SA WA Tas. NT C’wlth Aust.
Value $’000 $’000 $’000 $’000 $’000 $’000 $’000 $’000 $’000Value $ 000 $ 000 $ 000 $ 000 $ 000 $ 000 $ 000 $ 000 $ 000FishTuna 0 0 0 114 500 18 na 55 54 255 139 028 bFishTuna 0 0 0 114 500 18 na 55 54 255 139 028 bl id 1 964 7 464 0 133 417 872 0 0 427 433Salmonids c 1 964 7 464 0 na 133 417 872 0 0 427 433
Other 48 824 10 429 101 984 68 020 38 870 2 795 29 735 130 854 d 431 510Other 48 824 10 429 101 984 68 020 38 870 2 795 29 735 130 854 d 431 510Total 50 788 17 893 101 984 182 520 39 021 420 667 29 790 185 108 997 972Total 50 788 17 893 101 984 182 520 39 021 420 667 29 790 185 108 997 972CrustaceansCrustaceansP 17 415 911 122 450 34 140 34 772 0 0 98 379 308 067Prawns 17 415 911 122 450 34 140 34 772 0 0 98 379 308 067Rock lobster 7 706 15 393 15 098 81 326 184 419 59 529 0 28 344 391 816Rock lobsterCrab 4 415 604 30 209 5 257 6 898 1 841 7 819 35 57 079Crab 4 415 604 30 209 5 257 6 898 1 841 7 819 35 57 079Other 1 365 339 908 1 848 1 958 0 29 2 163 8 610Other 1 365 339 908 1 848 1 958 0 29 2 163 8 610T t l 30 901 17 248 168 665 122 571 228 047 61 370 7 848 128 921 765 571Total 30 901 17 248 168 665 122 571 228 047 61 370 7 848 128 921 765 571MolluscsAbalone 2 829 23 887 0 38 840 10 193 102 605 0 0 178 354Abalone 2 829 23 887 0 38 840 10 193 102 605 0 0 178 354Scallop 0 0 4 006 0 14 960 156 0 2 952 22 074Scallop 0 0 4 006 0 14 960 156 0 2 952 22 074O t 38 305 0 473 35 205 0 23 340 0 0 97 323Oyster 38 305 0 473 35 205 0 23 340 0 0 97 323Squid 1 048 807 511 3 487 207 397 0 3 426 9 883SquidOther 1 675 3 658 0 7 054 104 509 3 118 20 974 298 141 286Other 1 675 3 658 0 7 054 104 509 3 118 20 974 298 141 286Total 43 857 28 351 4 989 84 586 129 869 129 616 20 974 6 677 448 919Total 43 857 28 351 4 989 84 586 129 869 129 616 20 974 6 677 448 919Oth NEI 2 743 6 605 1 317 22 471 1 401 139 810 105 35 591Other NEI 2 743 6 605 1 317 22 471 1 401 139 810 105 35 591Total value 128 289 70 097 276 955 412 148 398 338 611 793 59 422 321 744 e 2 248 053 bTotal value 128 289 70 097 276 955 412 148 398 338 611 793 59 422 321 744 e 2 248 053 bQuantity t t t t t t t t tQuantity t t t t t t t t tFishFishTuna 0 0 0 5 800 3 na 7 7 110 9 133 bTuna 0 0 0 5 800 3 na 7 7 110 9 133 bSalmonids c 168 977 0 na 11 35 685 0 0 36 841Salmonids c 168 977 0 na 11 35 685 0 0 36 841Other 12 634 4 330 14 116 40 588 10 056 379 5 538 25 223 d 112 863Other 12 634 4 330 14 116 40 588 10 056 379 5 538 25 223 d 112 863T l 12 802 5 307 14 116 46 388 10 070 36 064 5 545 32 332 158 837Total 12 802 5 307 14 116 46 388 10 070 36 064 5 545 32 332 158 837CrustaceansPrawns 1 646 92 9 776 2 293 3 220 0 0 10 134 27 161CrustaceansPrawns 1 646 92 9 776 2 293 3 220 0 0 10 134 27 161Rock lobster 130 300 614 1 557 5 252 1 275 0 796 9 925Rock lobster 130 300 614 1 557 5 252 1 275 0 796 9 925
bCrab 341 12 3 061 710 1 249 37 391 4 5 805Other 94 46 52 79 85 0 29 89 474Other 94 46 52 79 85 0 29 89 474Total 2 211 450 13 503 4 639 9 806 1 312 420 11 024 43 365Total 2 211 450 13 503 4 639 9 806 1 312 420 11 024 43 365MolluscsMolluscsAbalone 94 827 0 1 133 299 2 874 0 0 5 227AbaloneScallop 0 0 1 853 0 3 060 10 0 2 033 6 956Scallop 0 0 1 853 0 3 060 10 0 2 033 6 956Oyster 3 883 0 na 6 154 0 3 890 0 0 13 927Oyster 3 883 0 na 6 154 0 3 890 0 0 13 927S id 129 75 102 352 54 41 0 1 392 2 146Squid 129 75 102 352 54 41 0 1 392 2 146Other 202 1 048 0 1 736 700 685 1 45 4 417Other 202 1 048 0 1 736 700 685 1 45 4 417Total 4 308 1 950 1 955 9 375 4 113 7 501 1 3 469 32 673Total 4 308 1 950 1 955 9 375 4 113 7 501 1 3 469 32 673Other NEI 153 387 65 2 977 107 101 na 11 3 800Other NEI 153 387 65 2 977 107 101 na 11 3 800T l i 9 8 09 29 639 63 3 9 2 096 9 966 6 8 0 238 6 bTotal quantity 19 474 8 094 29 639 63 379 24 096 44 977 5 966 46 840 e 238 675 bq ya State totals include aquaculture but exclude hatchery production. b To avoid double counting, total has been reduced to allow for southern bluefin tuna caught in the a State totals include aquaculture but exclude hatchery production. b To avoid double counting, total has been reduced to allow for southern bluefin tuna caught in the Commonwealth Southern Bluefin Tuna Fishery as an input to farms in South Australia c Includes salmon and trout production d Includes fish (excluding tuna) component ofCommonwealth Southern Bluefin Tuna Fishery, as an input to farms in South Australia. c Includes salmon and trout production. d Includes fish (excluding tuna) component of Commonwealth fisheries plus catch from Commonwealth fisheries that cannot be disaggregated for confidentiality reasons e Totals include all fisheries underCommonwealth fisheries, plus catch from Commonwealth fisheries that cannot be disaggregated for confidentiality reasons. e Totals include all fisheries under
l h d l bl l h l d dCommonwealth jurisdiction. na Not available. NEI Not elsewhere included.jSources: ABARES; Australian Fisheries Management Authority; Department of Fisheries, Western Australia; Department of Primary Industries, New South Wales; Department Sources: ABARES; Australian Fisheries Management Authority; Department of Fisheries, Western Australia; Department of Primary Industries, New South Wales; Department of Primary Industries Parks Water and Environment Tasmania; Fisheries Queensland Department of Agriculture Fisheries and Forestry; Fisheries Victoria Department ofof Primary Industries, Parks, Water and Environment, Tasmania; Fisheries Queensland, Department of Agriculture, Fisheries and Forestry; Fisheries Victoria, Department of Environment and Primary Industries; Northern Territory Department of Primary Industry and Fisheries; Primary Industries and Regions South Australia; South AustralianEnvironment and Primary Industries; Northern Territory Department of Primary Industry and Fisheries; Primary Industries and Regions, South Australia; South Australian Research and Development Institutep
70
Production
ABARESAustralian fisheries and aquaculture statistics 2013

TABLE 4 Fisheries production in 2011–12, by state, Australia a 3 Fisheries production in 2011–12 by state Australia a3Fisheriesproductionin2011–12,bystate,AustraliaaNSW Vi Qld SA WA T NT C’ lth A tNSW Vic. Qld SA WA Tas. NT C’wlth Aust.
Value $’000 $’000 $’000 $’000 $’000 $’000 $’000 $’000 $’000Value $ 000 $ 000 $ 000 $ 000 $ 000 $ 000 $ 000 $ 000 $ 000FishTuna 0 0 0 150 000 9 na 56 62 041 172 303 bFishTuna 0 0 0 150 000 9 na 56 62 041 172 303 bl id 1 839 5 292 0 61 506 446 0 0 513 638Salmonids c 1 839 5 292 0 na 61 506 446 0 0 513 638
Other 45 341 11 954 96 074 57 504 55 989 4 256 33 343 151 821 d 456 282Other 45 341 11 954 96 074 57 504 55 989 4 256 33 343 151 821 d 456 282Total 47 180 17 246 96 074 207 504 56 059 510 701 33 399 213 862 1142 223Total 47 180 17 246 96 074 207 504 56 059 510 701 33 399 213 862 1142 223CrustaceansCrustaceansP 17 807 911 116 515 28 588 32 907 0 0 69 724 266 453Prawns 17 807 911 116 515 28 588 32 907 0 0 69 724 266 453Rock lobster 8 094 17 875 15 604 96 060 177 149 63 418 0 16 057 394 257Rock lobsterCrab 4 423 604 31 270 5 967 5 882 1 752 8 196 50 58 143Crab 4 423 604 31 270 5 967 5 882 1 752 8 196 50 58 143Other 2 034 350 792 1 042 1 905 0 1 3 085 9 209Other 2 034 350 792 1 042 1 905 0 1 3 085 9 209T t l 32 358 19 740 164 181 131 657 217 843 65 170 8 197 88 916 728 062Total 32 358 19 740 164 181 131 657 217 843 65 170 8 197 88 916 728 062MolluscsAbalone 3 404 33 287 0 35 335 10 575 87 068 0 0 169 669Abalone 3 404 33 287 0 35 335 10 575 87 068 0 0 169 669Scallop 3 0 6 114 0 870 167 0 1 086 8 240Scallop 3 0 6 114 0 870 167 0 1 086 8 240O t 35 182 0 513 30 970 0 23 406 0 0 90 071Oyster 35 182 0 513 30 970 0 23 406 0 0 90 071Squid 991 807 758 5 449 504 1 145 0 3 850 13 505SquidOther 1 445 2 276 0 7 210 95 761 5 150 9 438 506 121 786Other 1 445 2 276 0 7 210 95 761 5 150 9 438 506 121 786Total 41 025 36 370 7 385 78 965 107 710 116 937 9 438 5 442 403 272Total 41 025 36 370 7 385 78 965 107 710 116 937 9 438 5 442 403 272Oth NEI 3 436 0 580 19 321 7 500 139 284 24 31 284Other NEI 3 436 0 580 19 321 7 500 139 284 24 31 284Total value 123 999 73 356 268 221 437 447 389 112 692 947 51 318 309 722 e 2 304 841 bTotal value 123 999 73 356 268 221 437 447 389 112 692 947 51 318 309 722 e 2 304 841 bQuantity t t t t t t t t tQuantity t t t t t t t t tFishFishTuna 0 0 0 7 087 1 na 11 7 542 10 071 bTuna 0 0 0 7 087 1 na 11 7 542 10 071 bSalmonids c 165 733 0 na 4 43 249 0 0 44 151Salmonids c 165 733 0 na 4 43 249 0 0 44 151Other 11 085 4 112 12 670 42 111 10 352 659 6 505 25 578 d 113 072Other 11 085 4 112 12 670 42 111 10 352 659 6 505 25 578 d 113 072T l 11 250 4 845 12 670 49 198 10 358 43 908 6 516 33 120 167 294Total 11 250 4 845 12 670 49 198 10 358 43 908 6 516 33 120 167 294CrustaceansPrawns 1 612 92 8 940 1 965 3 023 0 0 6 883 22 515CrustaceansPrawns 1 612 92 8 940 1 965 3 023 0 0 6 883 22 515Rock lobster 142 300 639 1 550 4 890 1 098 0 527 9 146Rock lobster 142 300 639 1 550 4 890 1 098 0 527 9 146
bCrab 303 12 2 948 748 535 38 441 5 5 030Other 146 48 41 33 73 0 0 113 454Other 146 48 41 33 73 0 0 113 454Total 2 203 452 12 569 4 296 8 521 1 136 441 7 527 37 145Total 2 203 452 12 569 4 296 8 521 1 136 441 7 527 37 145MolluscsMolluscsAbalone 110 1 157 0 1 001 283 2 518 0 0 5 068AbaloneScallop 0 0 2 828 0 158 85 0 492 3 563Scallop 0 0 2 828 0 158 85 0 492 3 563Oyster 3 417 0 na 5 241 0 3 901 0 0 12 559Oyster 3 417 0 na 5 241 0 3 901 0 0 12 559S id 114 75 152 513 36 211 0 1 961 3 061Squid 114 75 152 513 36 211 0 1 961 3 061Other 147 877 0 1 845 555 1 335 11 68 4 838Other 147 877 0 1 845 555 1 335 11 68 4 838Total 3 788 2 109 2 980 8 601 1 032 8 050 11 2 520 29 090Total 3 788 2 109 2 980 8 601 1 032 8 050 11 2 520 29 090Other NEI 248 na 32 2 647 35 101 na 7 3 069Other NEI 248 na 32 2 647 35 101 na 7 3 069T l i 89 0 28 2 0 6 9 9 6 3 9 6 968 3 86 236 99 bTotal quantity 17 489 7 405 28 250 64 741 19 946 53 194 6 968 43 186 e 236 599 bq ya State totals include aquaculture but exclude hatchery production. b To avoid double counting, total has been reduced to allow for southern bluefin tuna caught in the a State totals include aquaculture but exclude hatchery production. b To avoid double counting, total has been reduced to allow for southern bluefin tuna caught in the Commonwealth Southern Bluefin Tuna Fishery as an input to farms in South Australia c Includes salmon and trout production d Includes fish (excluding tuna) component ofCommonwealth Southern Bluefin Tuna Fishery, as an input to farms in South Australia. c Includes salmon and trout production. d Includes fish (excluding tuna) component of Commonwealth fisheries plus catch from Commonwealth fisheries that cannot be disaggregated for confidentiality reasons e Totals include all fisheries underCommonwealth fisheries, plus catch from Commonwealth fisheries that cannot be disaggregated for confidentiality reasons. e Totals include all fisheries under
l h d l bl l h l d dCommonwealth jurisdiction. na Not available. NEI Not elsewhere included.jSources: ABARES; Australian Fisheries Management Authority; Department of Fisheries, Western Australia; Department of Primary Industries, New South Wales; Department Sources: ABARES; Australian Fisheries Management Authority; Department of Fisheries, Western Australia; Department of Primary Industries, New South Wales; Department of Primary Industries Parks Water and Environment Tasmania; Fisheries Queensland Department of Agriculture Fisheries and Forestry; Fisheries Victoria Department ofof Primary Industries, Parks, Water and Environment, Tasmania; Fisheries Queensland, Department of Agriculture, Fisheries and Forestry; Fisheries Victoria, Department of Environment and Primary Industries; Northern Territory Department of Primary Industry and Fisheries; Primary Industries and Regions South Australia; South AustralianEnvironment and Primary Industries; Northern Territory Department of Primary Industry and Fisheries; Primary Industries and Regions, South Australia; South Australian Research and Development Institutep
71
Production
ABARESAustralian fisheries and aquaculture statistics 2013

TABLE 5 Fisheries production in 2012–13, by state, Australia a 3 Fisheries production in 2012–13 by state Australia a3Fisheriesproductionin2012–13,bystate,AustraliaaNSW Vi Qld SA WA T NT C’ lth A tNSW Vic. Qld SA WA Tas. NT C’wlth Aust.
Value $’000 $’000 $’000 $’000 $’000 $’000 $’000 $’000 $’000Value $ 000 $ 000 $ 000 $ 000 $ 000 $ 000 $ 000 $ 000 $ 000FishTuna 0 0 0 153 500 18 na 18 59 454 177 215 bFishTuna 0 0 0 153 500 18 na 18 59 454 177 215 bl id 2 189 5 577 0 64 489 033 0 0 496 863Salmonids c 2 189 5 577 0 na 64 489 033 0 0 496 863
Other 40 123 11 130 89 345 54 033 54 884 5 978 27 704 158 142 d 441 339Other 40 123 11 130 89 345 54 033 54 884 5 978 27 704 158 142 d 441 339Total 42 312 16 707 89 345 207 533 54 966 495 011 27 722 217 596 1115 417Total 42 312 16 707 89 345 207 533 54 966 495 011 27 722 217 596 1115 417CrustaceansCrustaceansP 20 270 454 124 994 30 135 26 715 0 0 74 511 277 078Prawns 20 270 454 124 994 30 135 26 715 0 0 74 511 277 078Rock lobster 7 487 16 997 17 752 86 168 236 964 65 499 0 20 106 450 973Rock lobsterCrab 4 582 120 29 728 4 196 5 631 1 960 6 354 59 52 630Crab 4 582 120 29 728 4 196 5 631 1 960 6 354 59 52 630Other 2 688 334 738 1 077 1 967 1 0 4 166 10 970Other 2 688 334 738 1 077 1 967 1 0 4 166 10 970T t l 35 027 17 905 173 212 121 576 271 277 67 460 6 354 98 841 791 652Total 35 027 17 905 173 212 121 576 271 277 67 460 6 354 98 841 791 652MolluscsAbalone 3 838 37 496 0 38 225 9 136 100 964 0 0 189 659Abalone 3 838 37 496 0 38 225 9 136 100 964 0 0 189 659Scallop 2 0 11 659 0 1 692 776 0 556 14 683Scallop 2 0 11 659 0 1 692 776 0 556 14 683O t 35 907 0 523 35 000 0 23 109 0 0 94 539Oyster 35 907 0 523 35 000 0 23 109 0 0 94 539Squid 919 457 661 4 933 483 3 073 0 2 130 12 656SquidOther 1 968 2 645 0 7 908 83 251 5 404 13 424 101 614Other 1 968 2 645 0 7 908 83 251 5 404 13 424 101 614Total 42 634 40 597 12 843 86 066 94 562 133 327 14 3 110 413 151Total 42 634 40 597 12 843 86 066 94 562 133 327 14 3 110 413 151Oth NEI 3 794 0 1 717 25 670 5 954 99 23 900 130 61 263Other NEI 3 794 0 1 717 25 670 5 954 99 23 900 130 61 263Total value 123 767 75 209 277 116 440 845 426 759 695 896 57 990 318 473 e 2 381 482 bTotal value 123 767 75 209 277 116 440 845 426 759 695 896 57 990 318 473 e 2 381 482 bQuantity t t t t t t t t tQuantity t t t t t t t t tFishFishTuna 0 0 0 7 486 3 na 11 7 279 11 376 bTuna 0 0 0 7 486 3 na 11 7 279 11 376 bSalmonids c 198 1 014 0 na 4 41 762 0 0 42 978Salmonids c 198 1 014 0 na 4 41 762 0 0 42 978Other 9 213 2 972 12 150 39 358 10 344 1 879 5 473 24 188 d 105 577Other 9 213 2 972 12 150 39 358 10 344 1 879 5 473 24 188 d 105 577T l 9 411 3 986 12 150 46 844 10 351 43 641 5 484 31 467 159 932Total 9 411 3 986 12 150 46 844 10 351 43 641 5 484 31 467 159 932CrustaceansPrawns 1 710 46 9 612 1 881 2 320 0 0 5 576 21 145CrustaceansPrawns 1 710 46 9 612 1 881 2 320 0 0 5 576 21 145Rock lobster 138 307 728 1 552 6 066 1 312 0 446 10 549Rock lobster 138 307 728 1 552 6 066 1 312 0 446 10 549
bCrab 325 10 2 835 652 442 45 318 7 4 634Other 173 30 41 33 75 0 0 186 538Other 173 30 41 33 75 0 0 186 538Total 2 346 393 13 216 4 118 8 903 1 358 318 6 215 36 866Total 2 346 393 13 216 4 118 8 903 1 358 318 6 215 36 866MolluscsMolluscsAbalone 120 1 196 0 1 112 259 2 566 0 0 5 253AbaloneScallop 0 0 5 393 0 292 811 0 255 6 750Scallop 0 0 5 393 0 292 811 0 255 6 750Oyster 3 371 0 na 5 710 0 3 449 0 0 12 530Oyster 3 371 0 na 5 710 0 3 449 0 0 12 530S id 96 37 132 459 37 1 055 0 1 112 2 929Squid 96 37 132 459 37 1 055 0 1 112 2 929Other 229 937 0 2 095 504 1 190 4 61 5 020Other 229 937 0 2 095 504 1 190 4 61 5 020Total 3 816 2 170 5 525 9 376 1 092 9 071 4 1 428 32 482Total 3 816 2 170 5 525 9 376 1 092 9 071 4 1 428 32 482Other NEI 210 na 108 3 407 32 76 na 8 3 840Other NEI 210 na 108 3 407 32 76 na 8 3 840T l i 83 6 9 30 998 63 20 3 8 6 80 39 233 9 bTotal quantity 15 783 6 549 30 998 63 745 20 378 54 146 5 805 39 114 e 233 119 bq ya State totals include aquaculture but exclude hatchery production. b To avoid double counting, total has been reduced to allow for southern bluefin tuna caught in the a State totals include aquaculture but exclude hatchery production. b To avoid double counting, total has been reduced to allow for southern bluefin tuna caught in the Commonwealth Southern Bluefin Tuna Fishery as an input to farms in South Australia c Includes salmon and trout production d Includes fish (excluding tuna) component ofCommonwealth Southern Bluefin Tuna Fishery, as an input to farms in South Australia. c Includes salmon and trout production. d Includes fish (excluding tuna) component of Commonwealth fisheries plus catch from Commonwealth fisheries that cannot be disaggregated for confidentiality reasons e Totals include all fisheries underCommonwealth fisheries, plus catch from Commonwealth fisheries that cannot be disaggregated for confidentiality reasons. e Totals include all fisheries under
l h d l bl l h l d dCommonwealth jurisdiction. na Not available. NEI Not elsewhere included.jSources: ABARES; Australian Fisheries Management Authority; Department of Fisheries, Western Australia; Department of Primary Industries, New South Wales; Department Sources: ABARES; Australian Fisheries Management Authority; Department of Fisheries, Western Australia; Department of Primary Industries, New South Wales; Department of Primary Industries Parks Water and Environment Tasmania; Fisheries Queensland Department of Agriculture Fisheries and Forestry; Fisheries Victoria Department ofof Primary Industries, Parks, Water and Environment, Tasmania; Fisheries Queensland, Department of Agriculture, Fisheries and Forestry; Fisheries Victoria, Department of Environment and Primary Industries; Northern Territory Department of Primary Industry and Fisheries; Primary Industries and Regions South Australia; South AustralianEnvironment and Primary Industries; Northern Territory Department of Primary Industry and Fisheries; Primary Industries and Regions, South Australia; South Australian Research and Development Institutep
72
Production
ABARESAustralian fisheries and aquaculture statistics 2013

TABLE 6 Fisheries production in 2012–13, by location of catch and production, Australia ap 6 Fisheries production in 2012–13 by location of catch and production Australia ap6Fisheriesproductionin2012–13,bylocationofcatchandproduction,AustraliaapNSW Vic Qld SA WA Tas NT Other b AustNSW Vic. Qld SA WA Tas. NT Other b Aust.
Value $’000 $’000 $’000 $’000 $’000 $’000 $’000 $’000 $’000Value $ 000 $ 000 $ 000 $ 000 $ 000 $ 000 $ 000 $ 000 $ 000FishTuna 6 954 0 12 696 154 707 1 942 1 18 0 177 215FishTuna 6 954 0 12 696 154 707 1 942 1 18 0 177 215S l id 2 189 5 577 0 0 64 489 033 0 0 496 863Salmonids 2 189 5 577 0 0 64 489 033 0 0 496 863Other 55 187 54 418 95 651 68 807 57 658 22 797 27 704 58 917 441 339Other 55 187 54 418 95 651 68 807 57 658 22 797 27 704 58 917 441 339Total 64 330 59 995 108 347 223 513 59 664 511 831 27 722 58 917 1 115 417Total 64 330 59 995 108 347 223 513 59 664 511 831 27 722 58 917 1 115 417CrustaceansCrustaceansPrawns 20 807 454 137 398 30 135 85 498 0 2 775 13 277 078Rock lobster 7 487 16 997 26 302 86 168 236 964 65 499 0 0 450 973Rock lobster 7 487 16 997 26 302 86 168 236 964 65 499 0 0 450 973Crab 4 593 157 29 728 4 196 5 631 1 970 6 354 0 52 630Crab 4 593 157 29 728 4 196 5 631 1 970 6 354 0 52 630Other 2 711 400 13 199 1 077 3 922 1 90 1 128 10 970Other 2 711 400 13 199 1 077 3 922 1 90 1 128 10 970Total 35 598 18 008 206 626 121 576 332 015 67 470 9 218 1 140 791 652MolluscsAbalone 3 838 37 496 0 38 225 9 136 100 964 0 0 189 659MolluscsAbalone 3 838 37 496 0 38 225 9 136 100 964 0 0 189 659S ll 2 491 11 659 1 711 787 35 0 14 683Scallop 2 491 11 659 na 1 711 787 35 0 14 683Oyster 35 907 na 523 42 490 na 23 109 0 0 94 539Oyster 35 907 na 523 42 490 na 23 109 0 0 94 539Squid 1 543 1 057 676 5 352 537 3 216 1 274 12 656Squid 1 543 1 057 676 5 352 537 3 216 1 274 12 656Other 2 083 2 847 1 7 909 83 254 5 506 13 0 101 614Other 2 083 2 847 1 7 909 83 254 5 506 13 0 101 614T l 43 374 41 891 12 859 93 976 94 638 133 582 49 274 413 151Total 43 374 41 891 12 859 93 976 94 638 133 582 49 274 413 151Other NEI 3 794 7 1 717 25 670 5 954 99 23 900 122 61 263Other NEI 3 794 7 1 717 25 670 5 954 99 23 900 122 61 263Total value 147 095 119 901 329 548 464 736 492 271 712 981 60 890 60 454 2 381 482 cTotal value 147 095 119 901 329 548 464 736 492 271 712 981 60 890 60 454 2 381 482 cQuantity t t t t t t t t tQuantity t t t t t t t t tFi hFishTuna 904 0 1 939 7 486 168 0 11 0 11 376Tuna 904 0 1 939 7 486 168 0 11 0 11 376Salmonids 198 1 014 0 0 4 41 762 0 0 42 978Salmonids 198 1 014 0 0 4 41 762 0 0 42 978Other 12 721 12 006 13 610 42 174 10 605 5 398 5 473 3 564 105 577Other 12 721 12 006 13 610 42 174 10 605 5 398 5 473 3 564 105 577Total 13 823 13 020 15 549 49 660 10 778 47 160 5 484 3 564 159 932otaCrustaceansPrawns 1 949 46 10 580 1 881 6 518 0 168 3 21 145CrustaceansPrawns 1 949 46 10 580 1 881 6 518 0 168 3 21 145R k l b t 138 307 613 1 552 6 066 1 312 0 0 10 549Rock lobster 138 307 613 1 552 6 066 1 312 0 0 10 549Crab 326 14 2 835 652 442 46 318 0 4 634Crab 326 14 2 835 652 442 46 318 0 4 634Other 174 33 641 33 173 0 4 41 538Other 174 33 641 33 173 0 4 41 538Total 2 587 401 14 669 4 118 13 199 1 358 490 44 36 866Total 2 587 401 14 669 4 118 13 199 1 358 490 44 36 866M llMolluscsAbalone 120 1 196 0 1 112 259 2 566 0 0 5 253Abalone 120 1 196 0 1 112 259 2 566 0 0 5 253Scallop na 238 5 393 na 295 816 8 0 6 750Scallop na 238 5 393 na 295 816 8 0 6 750Oyster 3 371 na na 9 430 na 3 449 0 0 16 250Oyster 3 371 na na 9 430 na 3 449 0 0 16 250
dSquid 448 426 136 548 50 1 155 0 165 2 929qOther 245 966 0 2 095 504 1 206 4 0 5 020Other 245 966 0 2 095 504 1 206 4 0 5 020Total 4 183 2 827 5 529 13 185 1 109 9 191 12 165 32 482Total 4 183 2 827 5 529 13 185 1 109 9 191 12 165 32 482Other NEI 210 2 108 3 407 32 76 0 5 3 840Other NEI 210 2 108 3 407 32 76 0 5 3 840Total quantity 20 804 16 249 35 855 70 370 25 117 57 786 5 986 3 779 233 119 cTotal quantitya Commonwealth, state and territory production is allocated according to the state or territory waters in which the catch was taken. The totals include aquaculture a Commonwealth, state and territory production is allocated according to the state or territory waters in which the catch was taken. The totals include aquaculture production but exclude hatchery production b Includes Commonwealth fisheries that have been aggregated for reasons of confidentiality; they are Small Pelagicsproduction but exclude hatchery production. b Includes Commonwealth fisheries that have been aggregated for reasons of confidentiality; they are, Small Pelagics, M i I l d H d d M D ld I l d C l S N th W t Sl S th S id d W t D t T l fi h i T t l i l d fid ti lMacquarie Island, Heard and McDonald Islands, Coral Sea, North West Slope, Southern Squid and Western Deepwater Trawl fisheries. c Totals include confidential Commonwealth landings and only sum across. NEI Not elsewhere included. p Preliminary.Commonwealth landings and only sum across. N I Not elsewhere included. p Preliminary.Sources: ABARES; Australian Fisheries Management Authority; Department of Fisheries, Western Australia; Department of Primary Industries,Sources: ABARES; Australian Fisheries Management Authority; Department of Fisheries, Western Australia; Department of Primary Industries, New South Wales; Department of Primary Industries Parks Water and Environment Tasmania; Fisheries Queensland Department of Agriculture Fisheries and Forestry;New South Wales; Department of Primary Industries, Parks, Water and Environment, Tasmania; Fisheries Queensland, Department of Agriculture, Fisheries and Forestry; Fi h i Vi t i D t t f P i I d t i N th T it D t t f P i I d t d Fi h i P i I d t i d R i S th A t liFisheries Victoria, Department of Primary Industries; Northern Territory Department of Primary Industry and Fisheries; Primary Industries and Regions, South Australia; South Australian Research and Development InstituteSouth Australian Research and Development Institute
73
Production
ABARESAustralian fisheries and aquaculture statistics 2013

TABLE 7 Fisheries production, New South Wales 7 Fisheries production New South Wales7Fisheriesproduction,NewSouthWales2010 11 2011 12 2012 13 p2010–11 2011–12 2012–13 pt $’000 t $’000 t $’000$ $ $
CrustaceansRock lobster 130 7 706 142 8 094 138 7 487CrustaceansRock lobster 130 7 706 142 8 094 138 7 487Ki 489 9 258 484 8 614 641 10 878King prawn 489 9 258 484 8 614 641 10 878g pSchool prawn 979 6 140 841 5 311 832 5 773School prawn 979 6 140 841 5 311 832 5 773Other prawn a 30 285 17 217 14 135Other prawn a 30 285 17 217 14 135Crab 341 4 415 303 4 423 325 4 582Crab 341 4 415 303 4 423 325 4 582Other b 75 1 148 129 1 763 158 2 413Total c 2 044 28 952 1 916 28 422 2 108 31 268Total c 2 044 28 952 1 916 28 422 2 108 31 268MolluscsBlacklip abalone 94 2 829 110 3 404 120 3 838MolluscsBlacklip abalone 94 2 829 110 3 404 120 3 838Cuttlefish 61 208 47 180 31 145Pipi 9 319 18 326 48 591Pipi 9 319 18 326 48 591Octopus 118 938 71 764 76 741Octopus 118 938 71 764 76 741S id 68 840 67 811 65 774Squid 68 840 67 811 65 774Other d 46 254 40 268 55 359Other d 6 5 0 68 55 359Total c 396 5 388 353 5 753 395 6 448Total c 396 5 388 353 5 753 395 6 448FishS ll 3 598 8 973 3 267 7 408 2 278 7 092FishSea mullet 3 598 8 973 3 267 7 408 2 278 7 092Silver trevally 96 320 145 533 163 672Silver trevally 96 320 145 533 163 672Yellowtail kingfish 292 2 043 243 2 541 100 1 202Yellowtail kingfish 292 2 043 243 2 541 100 1 202Jack mackerel na na 4 4 1 1Jack mackerel na na 4 4 1 1l k b d ll f bBlack bream and yellowfin bream 337 3 703 249 2 991 253 3 026y
Eastern Australian salmon 792 1 008 933 1 240 1 316 1 827Eastern Australian salmon 792 1 008 933 1 240 1 316 1 827Snapper 298 2 882 300 3 131 230 2 435Snapper 298 2 882 300 3 131 230 2 435Gre mor ong 32 159 32 168 30 163Grey morwong 32 159 32 168 30 163Mulloway 84 674 82 765 69 700u o aySand whiting 145 1 924 106 1 398 78 1 141Sand whiting 145 1 924 106 1 398 78 1 141Luderick 362 580 407 584 353 557Luderick 362 580 407 584 353 557E t h l hiti 1 243 3 291 1 086 3 783 837 3 069Eastern school whiting 1 243 3 291 1 086 3 783 837 3 069Dusky flathead 175 1 247 171 1 252 117 1 102Dusky flathead 175 1 247 171 1 252 117 1 102Other e 4 865 18 268 3 820 16 148 3 189 14 656Other e 4 865 18 268 3 820 16 148 3 189 14 656Total c 12 319 45 072 10 845 41 946 9 014 37 643Total c 12 319 45 072 10 845 41 946 9 014 37 643
hOther NEI g 46 790 86 919 80 861gTotal wild caught 14 805 80 202 13 200 77 040 11 597 76 220Total wild caught 14 805 80 202 13 200 77 040 11 597 76 220Aquaculture hP 148 1 732 270 3 665 223 3 484Aquaculture hPrawns 148 1 732 270 3 665 223 3 484Yabby 19 217 17 271 15 275YabbyOyster 3 883 38 305 3 417 35 182 3 371 35 907Oyster 3 883 38 305 3 417 35 182 3 371 35 907Silver perch 240 2 814 190 2 695 149 1 879Silver perch 240 2 814 190 2 695 149 1 879T t 168 1 964 165 1 839 198 2 189Trout 168 1 964 165 1 839 198 2 189Blue mussel 29 164 18 90 50 279Blue mussel 29 164 18 90 50 279Barramundi 75 938 50 700 50 601Barramundi 75 938 50 700 50 601Ornamental fish na 436 na 453 na 355Ornamental fish na 436 na 453 na 355Other i 107 1 517 162 2 064 130 2 578Total 4 669 48 087 4 289 46 959 4 186 47 547Total 4 669 48 087 4 289 46 959 4 186 47 547Total production c 19 474 128 289 17 489 123 999 15 783 123 767Total production c 19 474 128 289 17 489 123 999 15 783 123 767aMainl incl des tiger pra n ro al red pra n and greas back pra n bMainl incl des Balmain b g abb and nippers c E cl des catches in thea Mainly includes tiger prawn, royal red prawn and greasyback prawn. b Mainly includes Balmain bug, yabby and nippers. c Excludes catches in the Commonwealth and other jurisdiction fisheries landed into New South Wales. d Mainly includes cockle, periwinkle, whelk and blue mussel. e Mainly j y , p , yincludes Australian sardine, blue mackerel, leatherjacket, flathead, bonito, yellowtail scad, sandy sprat, tailor, silver biddy and eel. g Mainly includes includes Australian sardine, blue mackerel, leatherjacket, flathead, bonito, yellowtail scad, sandy sprat, tailor, silver biddy and eel. g Mainly includes beachworms and sea urchin h Excludes hatchery production iMainly includes longfin eel golden perch Murray cod mulloway and pearl oysterbeachworms and sea urchin. h Excludes hatchery production. i Mainly includes longfin eel, golden perch, Murray cod, mulloway and pearl oyster. P li i N t il bl NEI N t l h i l d dp Preliminary. na Not available. NEI Not elsewhere included.
Source: Department of Primary Industries, New South Walesp y ,
74
Production
ABARESAustralian fisheries and aquaculture statistics 2013

TABLE 8 Fisheries production, Victoria a
t $’000 t $’000 t $’000
Rock lobster 300 15 393 300 17 875 307 16 997Prawns 92 911 92 911 46 454Crab 12 604 12 604 10 120Other 43 310 43 310 27 304Total 447 17 218 447 19 700 390 17 875
Abalone 827 23 887 827 23 606 831 26 345Scallop na na 0 0 0 0Squid b 75 807 75 807 37 457Octopus 28 176 28 176 24 215Other 38 113 38 113 142 425Total 968 24 983 968 24 702 1 034 27 442
Australian sardine 2 628 1 550 1 923 1 096 1 134 669Black bream 75 456 111 1 057 90 754Southern garfish 70 321 63 353 49 314Shark c 49 196 49 38 44 111Snapper 120 758 202 1 364 152 1 081Eel 42 521 113 1 391 86 1 146Australian salmon 415 220 773 448 364 200King George whiting 173 2 701 187 2 878 104 1 593Other 562 2 335 565 2 447 789 3 342Total 4 134 9 057 3 986 11 072 2 812 9 210Total wild caught 5 549 51 258 5 401 55 474 4 236 54 527
Abalone e na na 330 9 681 365 11 151Blue mussel 982 3 368 811 1 987 771 2 005Yabby e 3 30 5 40 3 30Salmonids f 977 7 464 733 5 292 1 014 5 577Warmwater finfish g 196 1 372 126 882 160 1 920Ornamental fish no na no na no naOther h 387 6 605 na na na naTotal 2 545 18 839 2 004 17 882 2 313 20 682Total production 8 094 70 097 7 405 73 356 6 549 75 209
8Fisheriesproduction,Victoriaa
Crustaceans
Molluscs
Fish
Aquaculture d
a Victorian Department of Primary Industries did not collect prices for wild fisheries during the 2010–11 and 2011–12 financial years and for aquaculture species in 2008–09, 2009–10 and 2010–11. Values were estimated using prices collected by ABARES. Quantities for individual species are provided by Fisheries Victoria. b Gould's squid taken by machine jig are now being reported to the Commonwealth. c Shark data only includes Victorian bays and inlets and small quantities taken in ocean waters by non‐shark fishers operating in state proclaimed waters. d Excludes hatchery production. e Insufficient data to report because of policy requirement to protect commercial confidentiality of data. f Includes salmon and trout production. g Includes Australian bass, barramundi, catfish, golden perch, Murray cod and silver perch. h Includes abalone, yabby and eel. p Preliminary. na Not available. no Only number of fish is reported; 3135 thousand fish for 2009–10, 3161 thousand fish for 2010–11 and 2832 thousand fish for 2011–12.Source: ABARES; Fisheries Victoria, Department of Environment and Primary Industries
2010–11 2011–12 2012–13 p
75
Production
ABARESAustralian fisheries and aquaculture statistics 2013

TABLE 9 Fisheries production, Queensland
t $’000 t $’000 t $’000
Prawns Banana prawn 1 264 10 346 541 4 426 835 6 834 Endeavour prawn 524 3 768 503 3 613 489 3 519 King prawn 2 296 29 384 2 702 34 587 3 188 40 802 Tiger prawn 1 319 20 175 920 14 079 856 13 101 Other 552 3 178 524 3 021 725 4 159 Total 5 954 66 850 5 189 59 726 6 093 68 415 Crab 3 061 30 209 2 948 31 270 2 835 29 728Rock lobster and bug 614 15 098 639 15 604 728 17 752Total 9 629 112 157 8 777 106 600 9 656 115 896
Scallop 1 853 4 006 2 828 6 114 5 393 11 659Squid a 102 511 152 758 132 661Total 1 955 4 516 2 980 6 872 5 525 12 320
Snapper 77 627 65 530 57 461Tropical snapper 675 4 249 600 3 736 233 1 303Barramundi 1 373 12 594 1 500 13 756 1 028 9 428Bream (including tarwhine) 111 886 128 1 026 158 1 260Mullet 1 675 4 187 1 740 4 349 2 020 5 050Tailor na na na na na naWhiting 1 421 4 706 795 3 057 1 096 3 842Coral trout 803 26 229 727 23 749 751 24 563Redthroat emperor 248 1 669 226 1 521 218 1 467Blue threadfin 191 762 181 725 215 860King threadfin 485 2 109 555 2 415 439 1 907Shark 696 2 088 574 1 722 538 1 614Spanish mackerel 495 3 465 529 3 703 512 3 586Grey mackerel 1 057 5 865 971 5 388 979 5 434Other species 1 782 7 931 1 441 6 252 1 359 5 828Total 11 151 77 811 10 076 72 239 9 677 67 130Other NEI na na na na 0 0Total wild caught 22 735 194 484 21 833 185 712 24 859 195 345
Prawns 3 822 55 600 3 751 56 789 3 519 56 578Barramundi 2 764 21 200 2 416 21 295 2 319 19 660Oyster na 473 na 513 na 523Pearls na na na na na naSilver perch 114 1 360 75 886 95 1 143Barcoo grunter 24 303 31 368 na naRedclaw 52 908 41 792 41 738Aquarium fish c na 471 na 463 na 667Other d 128 2 156 104 1 403 167 2 462Total 6 904 82 471 6 418 82 509 6 140 81 771Total production 29 639 276 955 28 250 268 221 30 998 277 116a Includes cuttlefish. b Excludes hatchery production. c Exotic and native species (including Australian lungfish, northern saratoga and southern saratoga). d Includes eel, Murray cod, golden perch, sleepy cod, Australian bass, marine finfish, crab (and pearls in 2008–09 and 2009–10). p Preliminary. na Not available. NEI Not elsewhere included.Source: Fisheries Queensland, Department of Agriculture, Fisheries and Forestry
9Fisheriesproduction,Queensland
Crustaceans
Molluscs
Aquaculture b
Fish
2010–11 2011–12 2012–13 p
76
Production
ABARESAustralian fisheries and aquaculture statistics 2013

TABLE 10 Fisheries production, South Australia 10 Fisheries production South Australia10Fisheriesproduction,SouthAustralia2010 11 2011 12 2012 13 p2010–11 2011–12 2012–13 p
t $’000 t $’000 t $’000$ $ $CrustaceansPrawns 2 293 34 140 1 965 28 588 1 881 30 135CrustaceansPrawns 2 293 34 140 1 965 28 588 1 881 30 135S th k l b t 1 557 81 326 1 550 96 060 1 552 86 168Southern rock lobster 1 557 81 326 1 550 96 060 1 552 86 168Crab 710 5 257 748 5 967 652 4 196Crab 710 5 257 748 5 967 652 4 196Other 42 816 21 699 22 697Other 42 816 21 699 22 697Total 4 602 121 539 4 284 131 314 4 107 121 196Total 4 602 121 539 4 284 131 314 4 107 121 196
llMolluscsAbalone 816 27 998 823 28 925 876 29 625Abalone 816 27 998 823 28 925 876 29 625Pipi 300 2 221 374 2 713 443 3 283Pipi 300 2 221 374 2 713 443 3 283Squid 352 3 487 513 5 449 459 4 933Squid 352 3 487 513 5 449 459 4 933Other 262 2 408 194 1 820 172 1 685Total 1 730 36 114 1 904 38 907 1 950 39 526Total 1 730 36 114 1 904 38 907 1 950 39 526Fish aFish aW t A t li l 162 270 212 348 75 149Western Australian salmon 162 270 212 348 75 149Mullet 271 1 113 177 714 237 1 112Mullet 3 3Australian herring 118 343 99 342 137 401Australian herring 118 343 99 342 137 401Snapper 972 6 513 878 6 373 549 4 485Snapper 972 6 513 878 6 373 549 4 485Ki G hi i 340 5 081 307 4 465 307 4 603King George whiting 340 5 081 307 4 465 307 4 603g g gGarfish 261 1 530 249 1 609 242 1 758Garfish 261 1 530 249 1 609 242 1 758Leatherjacket 88 266 116 282 106 282Leatherjacket 88 266 116 282 106 282Australian sardine 33 220 19 268 36 962 20 699 35 065 21 039Australian sardine 33 220 19 268 36 962 20 699 35 065 21 039ll f hYellowfin whiting 98 768 104 773 152 1 073g
Snook 62 213 47 185 47 211Snook 62 213 47 185 47 211Golden perch 68 870 57 649 34 341Golden perch 68 870 57 649 34 341Other 1 140 1 552 1 165 2 268 1 207 1 929Other 1 140 1 552 1 165 2 268 1 207 1 929Total 36 800 37 787 40 373 38 707 38 158 37 383otaTotal wild caught 43 132 195 440 46 561 208 928 44 215 198 105Total wild caught 43 132 195 440 46 561 208 928 44 215 198 105Aquaculture bAquaculture bM d bb 37 1 032 12 343 11 380Marron and yabby c 37 1 032 12 343 11 380y yOyster d 6 154 35 205 5 241 30 970 5 710 35 000Oyster d 6 154 35 205 5 241 30 970 5 710 35 000Southern bluefin tuna e 5 800 114 500 7 087 150 000 7 486 153 500Southern bluefin tuna e 5 800 114 500 7 087 150 000 7 486 153 500Abalone 317 10 842 178 6 410 236 8 600Abalone g 317 10 842 178 6 410 236 8 600l lBlue mussel 1 174 2 425 1 277 2 677 1 480 2 940
Other h 6 765 52 704 4 385 38 118 4 607 42 320Other h 6 765 52 704 4 385 38 118 4 607 42 320Total 20 247 216 708 18 180 228 519 19 530 242 740Total 20 247 216 708 18 180 228 519 19 530 242 740Total production 63 379 412 148 64 741 437 447 63 745 440 845Total production 63 379 412 148 64 741 437 447 63 745 440 845a Excludes catch from Commonwealth waters. b Excludes hatchery production. c Marron and yabby are grouped together to protect y p y y g p g pcommercial confidentiality. d Excludes spat. e Processed weight. Input of wild caught southern bluefin tuna from Commonwealth Southern commercial confidentiality. d Excludes spat. e Processed weight. Input of wild caught southern bluefin tuna from Commonwealth Southern Bluefin Tuna Fishery was 3931 tonnes in 2009–10 3786 tonnes in 2010–11 and 4570 tonnes in 2011–12 g Includes the value of local spat salesBluefin Tuna Fishery was 3931 tonnes in 2009–10, 3786 tonnes in 2010–11 and 4570 tonnes in 2011–12. g Includes the value of local spat sales. h I l d b di ll t il ki fi h ll i b t t l d b i h i d ti It l i l d th l f l lh Includes barramundi, yellowtail kingfish, mulloway, rainbow trout, algae and brine shrimp production. It also includes the value of local fingerling sales for 2009–10. p Preliminary. na Not available.g g p ySources: Primary Industries and Regions, South Australia; South Australian Research and Development InstituteSources: Primary Industries and Regions, South Australia; South Australian Research and Development Institute
77
Production
ABARESAustralian fisheries and aquaculture statistics 2013

TABLE 11 Fisheries production, Western Australia11 Fisheries production Western Australia11Fisheriesproduction,WesternAustralia2010 11 2011 12 2012 13 p2010–11 2011–12 2012–13 p
t $’000 t $’000 t $’000$ $ $CrustaceansRock lobster 5 252 184 419 4 890 177 149 6 066 236 964CrustaceansRock lobster 5 252 184 419 4 890 177 149 6 066 236 964P 3 220 34 772 3 023 32 907 2 320 26 715Prawns 3 220 34 772 3 023 32 907 2 320 26 715Crab 1 249 6 898 535 5 882 442 5 631Crab 1 249 6 898 535 5 882 442 5 631Other 14 149 4 84 4 50Other 14 149 4 84 4 50Total 9 735 226 238 8 452 216 022 8 832 269 360Total 9 735 226 238 8 452 216 022 8 832 269 360M llMolluscsAbalone 299 10 193 283 10 575 259 9 136Abalone 299 10 193 283 10 575 259 9 136Scallop 3 060 14 960 158 870 292 1 692Scallop 3 060 14 960 158 870 292 1 692Squid 54 207 36 504 37 483Squid 54 207 36 504 37 483Other a 335 4 045 205 1 332 261 3 064Other aTotal 3 748 29 405 682 13 281 849 14 375Total 3 748 29 405 682 13 281 849 14 375FishT 3 18 1 9 3 18FishTuna 3 18 1 9 3 18Shark 980 3 024 887 3 725 928 3 838Shark 980 3 0 88 3 5 9 8 3 838Sharkfin na 613 na 407 na 441Sharkfin na 613 na 407 na 441Western Australian salmon 101 44 206 124 236 162Western Australian salmon 101 44 206 124 236 162E bbl 68 404 64 356 54 277Estuary cobbler 68 404 64 356 54 277ySilver cobbler na na na na na naSilver cobbler na na na na na naWest Australian dhufish 74 1 011 86 1 480 81 1 420West Australian dhufish 74 1 011 86 1 480 81 1 420Spanish mackerel 286 1 732 276 2 517 309 2 575Spanish mackerel 286 1 732 276 2 517 309 2 575
llSea mullet 234 519 200 608 154 392Yelloweye mullet 24 36 22 31 27 33Yelloweye mullet 24 36 22 31 27 33Australian sardine 2 371 2 134 2 410 2 676 2 222 2 053Australian sardine 2 371 2 134 2 410 2 676 2 222 2 053A stralian herring 147 59 167 179 288 214Australian herring 147 59 167 179 288 214Whiting 169 806 165 1 071 181 1 076t gBream 109 510 95 637 89 610Bream 109 510 95 637 89 610Emperor 532 1 830 496 2 793 461 2 413Emperor 532 1 830 496 2 793 461 2 413S 456 2 267 479 4 017 480 4 059Snapper 456 2 267 479 4 017 480 4 059Rockcod 345 1 618 395 3 231 422 3 331Rockcod 345 1 618 395 3 231 422 3 331Tropical snapper 1 673 9 143 1 686 14 043 1 671 13 107Tropical snapper 1 673 9 143 1 686 14 043 1 671 13 107Other 1 602 4 158 1 544 6 174 1 537 5 917Other 1 602 4 158 1 544 6 174 1 537 5 917T l 9 174 29 926 9 179 44 078 9 143 41 936Total 9 174 29 926 9 179 44 078 9 143 41 936Other NEI b 107 321 35 6 496 32 5 134Other NEI b 107 321 35 6 496 32 5 134Total wild caught 22 764 285 890 18 348 279 877 18 856 330 805Total wild caught 22 764 285 890 18 348 279 877 18 856 330 805Aq ac lt re
lAquaculture cPearls na 99 107 na 93 062 na 79 170Yabby 20 390 19 377 19 415Yabby 20 390 19 377 19 415Marron 51 1 419 50 1 444 52 1 501Marron 51 1 419 50 1 444 52 1 501Bl l 365 1 357 350 1 367 243 1 017Blue mussel 365 1 357 350 1 367 243 1 017Fish 896 8 888 1 179 11 842 1 208 12 848FishGoldfish and European carp na 207 na 140 na 182Goldfish and European carp na 207 na 140 na 182Ornamental fish na 108 na 58 na 69Ornamental fish na 108 na 58 na 69O h 972 946 751Other d na 972 na 946 na 751Total 1 332 112 448 1 598 109 235 1 522 95 954Total 1 332 112 448 1 598 109 235 1 522 95 954Total production 24 096 398 338 19 946 389 112 20 378 426 759Total production 24 096 398 338 19 946 389 112 20 378 426 759Note: Historical valuation of Western Australia’s wild harvested pearl shells were based on limited data An external review has provided moreNote: Historical valuation of Western Australia’s wild harvested pearl shells were based on limited data. An external review has provided more
d h l f h ll h d d h l f h f l d l l d h d f h laccurate data on the value of shell harvested and the value of mother of pearl and pearl meat realised at the end of the aquaculture process. p p q pFuture valuation of pearl shells will be based on the principles developed from the review. a Value includes pearl oyster shells taken, including Future valuation of pearl shells will be based on the principles developed from the review. a Value includes pearl oyster shells taken, including those taken for mother of pearl and octopus b Includes sea cucumber sea urchin and others previously reported under molluscs otherthose taken for mother of pearl, and octopus. b Includes sea cucumber, sea urchin and others previously reported under molluscs other. c Aquaculture excludes algae production for betacarotene and hatchery production Some quantity data not available because of confidentialityc Aquaculture excludes algae production for betacarotene and hatchery production. Some quantity data not available because of confidentiality restrictions. d Includes other molluscs and crustaceans. p Preliminary. na Not available. NEI Not elsewhere included.p ySource: Department of Fisheries, Western AustraliaSource: Department of Fisheries, Western Australia
78
Production
ABARESAustralian fisheries and aquaculture statistics 2013

TABLE 12 Fisheries production, Tasmania 12 Fisheries production Tasmania12Fisheriesproduction,Tasmania2010 11 2011 12 2012 13 p2010–11 2011–12 2012–13 p
t $’000 t $’000 t $’000$ $ $CrustaceansSouthern rocklobster 1 275 59 529 1 098 63 418 1 312 65 499CrustaceansSouthern rocklobster 1 275 59 529 1 098 63 418 1 312 65 499Gi t b 37 1 841 38 1 752 45 1 960Giant crab 37 1 841 38 1 752 45 1 960Other 0 0 0 0 0 1Other 0 0 0 0 0 1Total 1 312 61 370 1 136 65 170 1 358 67 460Total 1 312 61 370 1 136 65 170 1 358 67 460Molluscsb l
MolluscsAbalone 2 701 97 058 2 421 83 968 2 443 97 030Octopus 51 417 51 417 90 781Octopus 51 417 51 417 90 781Scallop a 10 156 85 167 811 776Scallop a 10 156 85 167 811 776Other 110 1 117 279 1 865 1 114 3 741Other 110 1 117 279 1 865 1 114 3 741Total 2 872 98 748 2 836 86 417 4 458 102 329Fish bAustralian salmon 65 176 189 439 404 1 048Fish bAustralian salmon 65 176 189 439 404 1 048S th k d 2 4 2 8 2 5Southern rock cod 2 4 2 8 2 5Garfish 23 201 55 456 53 359Garfish 3 0 55 56 53 359Banded morwong 50 1 022 56 1 029 52 1 015Banded morwong 50 1 022 56 1 029 52 1 015Jackass morwong 2 5 3 7 1 5Jackass morwong 2 5 3 7 1 5El h fi h 1 2 1 2 2 6Elephantfish 1 2 1 2 2 6pBastard trumpeter 7 37 9 49 9 45Bastard trumpeter 7 37 9 49 9 45Striped trumpeter 7 46 16 188 12 151Striped trumpeter 7 46 16 188 12 151Eastern school whiting 34 105 16 56 22 112Eastern school whiting 34 105 16 56 22 112Wrasse 49 624 66 850 63 802Shark 7 59 12 97 11 104Shark 7 59 12 97 11 104Other 132 514 233 1 076 1 248 2 327Other 132 514 233 1 076 1 248 2 327Total 379 2 795 659 4 256 1 879 5 978Total 379 2 795 659 4 256 1 879 5 978Other NEI c 101 139 101 139 76 99Other NEI cTotal wild caught 4 662 163 053 4 732 155 982 7 771 175 865Total wild caught 4 662 163 053 4 732 155 982 7 771 175 865Aquaculture dS l id 35 685 417 872 43 249 506 446 41 762 489 033Aquaculture dSalmonids e 35 685 417 872 43 249 506 446 41 762 489 033Oyster 3 890 23 340 3 901 23 406 3 449 23 109Oyster 3 890 23 340 3 901 23 406 3 449 23 109Blue mussel 566 1 981 1 216 4 012 1 041 3 955Blue mussel 566 1 981 1 216 4 012 1 041 3 955Abalone 173 5 547 97 3 101 123 3 934Abalone 173 5 547 97 3 101 123 3 934T l 40 314 448 740 48 463 536 965 46 375 520 031Total 40 314 448 740 48 463 536 965 46 375 520 031Total production 44 977 611 793 53 194 692 947 54 146 695 896Total production 44 977 611 793 53 194 692 947 54 146 695 896aWeight is based on whole weight Value of fishery is calculated on meat weight No commercial scallop season in 2009–10 2010–11 anda Weight is based on whole weight. Value of fishery is calculated on meat weight. No commercial scallop season in 2009–10, 2010–11 and 2011 12 Production statistics for 2010 11 and 2011 12 are landings from pre season surveys b Excludes shark from the Commonwealth2011–12. Production statistics for 2010–11 and 2011–12 are landings from pre‐season surveys. b Excludes shark from the Commonwealth
h h k h l h l h h l l h (hSouthern Shark Fishery. c Includes sea urchins. d Excludes hatchery production. e Includes salmon and rout production, weight in HOGG (head on, y y p p , g ( ,gilled and gutted). p Preliminary. na Not available. NEI Not elsewhere included.gilled and gutted). p Preliminary. na Not available. NEI Not elsewhere included.Source: Department of Primary Industries Parks Water and Environment TasmaniaSource: Department of Primary Industries, Parks, Water and Environment, Tasmania
79
Production
ABARESAustralian fisheries and aquaculture statistics 2013

TABLE 13 Fisheries production, Northern Territory
t $’000 t $’000 t $’000
Crab 391 7 819 441 8 196 318 6 354Other 29 29 0 1 0 0Total 391 7 848 441 8 197 318 6 354
Other 1 4 11 188 4 13Total 1 4 11 188 4 14
Tuna 7 55 11 56 11 18Shark 891 1 749 888 2 482 439 1 043Tropical snapper 174 911 337 1 406 114 527Barramundi 707 4 938 759 4 534 554 3 589Threadfin salmon 319 1 087 383 1 108 283 894Black jewfish 165 555 167 407 184 574Emperor 82 672 113 640 145 971Rockcod 25 86 64 241 73 303Mackerel 701 4 814 741 3 600 608 4 063Goldband snapper 444 3 137 636 4 962 691 5 125Saddletail snapper a 1 114 5 352 1 252 5 371 na naOther 439 2 145 621 2 319 2 382 10 614Total 5 068 25 501 5 972 27 126 5 484 27 722Total wild caught 5 489 33 353 6 424 35 510 5 805 34 090
Barramundi 651 5 200 881 7 680 na naPearls na 20 970 na 9 250 na naOther c na 810 na 284 na 23 900Total 651 26 980 881 17 214 na 23 900Total production 5 966 59 422 6 968 51 318 5 805 57 990a Includes some crimson snapper. b These values are based on derived estimates from a limited number of operators. Excludes hatchery production. Quantities not available because of confidentiality restrictions. c Includes aquarium production. p Preliminary. na Not available.Source: Northern Territory Department of Primary Industry and Fisheries
13Fisheriesproduction,NorthernTerritory
Crustaceans
Molluscs
Fish
Aquaculture b
2010–11 2011–12 2012–13 p
80
Production
ABARESAustralian fisheries and aquaculture statistics 2013

TABLE 14 Fisheries production, Commonwealth 14 Fisheries production Commonwealth14Fisheriesproduction,Commonwealth2010 11 2011 12 2012 13 p2010–11 2011–12 2012–13 p
t $’000 t $’000 t $’000$ $ $Northern PrawnNorthern PrawnPrawnsTi 1 627 28 305 864 16 617 1 340 26 041Prawns Tiger prawn 1 627 28 305 864 16 617 1 340 26 041g p Banana prawn 7 577 61 372 4 855 41 961 2 990 37 859 Banana prawn 7 577 61 372 4 855 41 961 2 990 37 859Endeavour prawn 426 4 558 498 4 491 500 4 221 Endeavour prawn 426 4 558 498 4 491 500 4 221King prawn 10 95 8 78 15 232 King prawn 10 95 8 78 15 232
h Other prawn 0 7 2 18 2 15p Total prawn 9 640 94 336 6 228 63 166 4 847 68 369 Total prawn 9 640 94 336 6 228 63 166 4 847 68 369Other species 33 492 77 1 543 153 2 670Other species 33 492 77 1 543 153 2 670Total 9 673 94 828 6 304 64 708 4 999 71 039Total 9 673 94 828 6 304 64 708 4 999 71 039
iTorres StraitPrawnsTiger prawn 278 3 136 377 5 171 382 4 781Prawns Tiger prawn 278 3 136 377 5 171 382 4 781E d 91 593 117 928 102 784 Endeavour prawn 91 593 117 928 102 784 King prawn 5 52 5 64 2 27 King prawn 5 5 5 6Other prawn 2 11 0 0 0 1 Other prawn 2 11 0 0 0 1Other a 16 413 20 561 19 414 Other a 16 413 20 561 19 414
l Total 393 4 206 520 6 724 505 6 007Tropical rock lobster 796 28 344 527 16 057 446 20 106Tropical rock lobster 796 28 344 527 16 057 446 20 106Spanish mackerelS i h k l 75 595 78 577 85 613Spanish mackerel Spanish mackerel 75 595 78 577 85 613 Other species 1 2 0 1 0 0 Other speciesTotal 75 597 78 577 85 613 Total 75 597 78 577 85 613Reef Line b 46 785 42 556 24 194Reef Line b 46 785 42 556 24 194T lTotal 1 310 33 932 1 167 23 914 1 061 26 919SESSF Commonwealth Trawl Sector cOrange roughy 165 620 229 1 187 217 1 036SESSF Commonwealth Trawl Sector cOrange roughy 165 620 229 1 187 217 1 036Bl di 4 014 10 636 4 047 11 695 4 007 15 507Blue grenadier 4 014 10 636 4 047 11 695 4 007 15 507Tiger flathead 2 658 13 901 2 835 14 573 2 607 16 529Tiger flatheadRedfish 141 402 86 298 64 245Redfish 141 402 86 298 64 245Blue warehou 107 249 98 402 46 142Blue warehou 107 249 98 402 46 142Sil h 1 298 2 271 1 031 2 030 786 1 729Silver warehou 1 298 2 271 1 031 2 030 786 1 729Eastern school whiting 339 936 344 936 500 1 805Eastern school whiting 339 936 344 936 500 1 805Jackass morwong 390 984 404 1 041 335 1 321Jackass morwong 390 984 404 1 041 335 1 321Pink ling 743 4 831 752 4 126 657 4 157Pink ling 743 4 831 752 4 126 657 4 157
f hGemfish 174 493 130 401 107 312Silver trevally 219 608 180 701 90 585Silver trevally 219 608 180 701 90 585Mirror dory 625 1 587 548 1 217 351 926Mirror dory 625 1 587 548 1 217 351 926R l d 108 239 150 378 238 534Royal red prawn 108 239 150 378 238 534Ocean perch 204 558 205 657 1 6Ocea pe cJohn dory 78 532 89 597 78 561John dory 78 532 89 597 78 561Blue‐eye trevalla 27 212 16 149 9 82Blue‐eye trevalla 27 212 16 149 9 82G h k 134 927 144 916 165 1 137Gummy shark 134 927 144 916 165 1 137School shark 34 172 24 114 14 79School shark 34 172 24 114 14 79Sawshark 149 288 125 274 134 364Sawshark 149 288 125 274 134 364Elephantfish 47 35 51 50 48 87Elephantfish 47 35 51 50 48 87O h 2 950 8 096 3 263 8 904 3 212 9 201Other 2 950 8 096 3 263 8 904 3 212 9 201Total 14 603 48 579 14 749 50 644 13 665 56 345Total 14 603 48 579 14 749 50 644 13 665 56 345
ContinuedContinued
81
Production
ABARESAustralian fisheries and aquaculture statistics 2013

t $’000 t $’000 t $’000
Blue‐eye trevalla 401 3 201 341 3 187 300 2 767Blue warehou 10 24 7 30 3 9Pink ling 354 2 303 453 2 487 341 2 157Gummy shark 2 111 14 633 1 920 12 233 2 054 14 192School shark 292 1 482 212 988 185 1 023Sawshark 170 327 116 254 137 371Elephantfish 68 51 77 75 72 130Other Shark 245 223 185 247 181 247Other species 404 1 586 318 1 360 245 1 126Total 4 055 23 830 3 631 20 860 3 517 22 023
Orange roughy 116 405 34 178 0 0Deepwater flathead 968 6 679 973 6 716 1 028 7 092Bight redfish 298 1 488 341 1 707 273 1 367Leatherjacket 172 310 209 313 215 425Angel shark 158 295 184 227 240 492Yellowspotted boarfish 64 224 77 238 100 313Jackass morwong 34 86 35 90 33 130Squid 24 133 34 156 89 417Knifejaw 28 18 41 140 35 118Gemfish 40 107 65 201 26 75Blue grenadier 10 26 28 81 5 19Blue morwong 19 47 22 149 na naSilver warehou 1 1 1 2 na naSchool shark 2 9 1 3 1 5Gummy shark 78 539 85 538 79 549Sawshark 47 91 26 56 43 117Elephantfish 0 0 0 0 0 0Other 157 616 206 841 223 876Total 2 215 11 074 2 363 11 639 2 389 11 995
Continued
14Fisheriesproduction,Commonwealthcontinued
SESSF Gillnet, Hook and Trap Sector c
SESSF Great Australian Bight Trawl Sector c
2010–11 2011–12 2012–13 p
TABLE 14 Fisheries production, Commonwealth continued
82
Production
ABARESAustralian fisheries and aquaculture statistics 2013

14 Fisheries production Commonwealth continued14Fisheriesproduction,Commonwealthcontinued2010 11 2011 12 2012 13 p2010–11 2011–12 2012–13 p
t $’000 t $’000 t $’000$ $ $Eastern Tuna and Billfish – Longline and minor lineAlbacore 662 1 766 784 1 802 739 1 848Eastern Tuna and Billfish – Longline and minor lineAlbacore 662 1 766 784 1 802 739 1 848Skipjack tuna na na na na na napjYellowfin tuna 2 026 16 635 1 459 12 606 1 393 11 394Yellowfin tuna 2 026 16 635 1 459 12 606 1 393 11 394Bigeye tuna 425 4 135 493 5 377 553 5 027Bigeye tuna 425 4 135 493 5 377 553 5 027B dbill dfi h 1 039 5 443 1 254 5 856 1 065 4 610Broadbill swordfish 1 039 5 443 1 254 5 856 1 065 4 610Striped marlin 278 1 216 310 1 450 256 1 022Striped marlinOther billfish 28 23 12 17 12 18Other billfish 28 23 12 17 12 18Other 711 1 699 421 926 356 922Other 711 1 699 421 926 356 922T lTotal 5 169 30 917 4 733 28 035 4 374 24 842Southern Bluefin Tuna 3 900 31 473 4 659 42 045 4 350 37 154Southern Bluefin Tuna 3 900 31 473 4 659 42 045 4 350 37 154Western Tuna and Billfishlb
Western Tuna and BillfishAlbacore 18 np 15 np 20 npp p pSkipjack tuna 0 np 0 np 0 npSkipjack tuna 0 np 0 np 0 npYellowfin tuna 17 np 26 np 36 npYellowfin tuna 17 np 26 np 36 npBi t 61 106 182Bigeye tuna 61 np 106 np 182 npOther tuna 0 np 0 np 0 npOther tuna p p pBillfish 247 np 210 np 260 npBillfish 247 np 210 np 260 npOther species 9 np 6 np 16 npOther species 9 np 6 np 16 npT lTotal 352 np 362 np 513 npp p pBass Strait Scallop 2 032 2 946 484 1 027 244 502Bass Strait Scallop 2 032 2 946 484 1 027 244 502Southern Squid Jig 650 1 657 830 2 075 na naSouthern Squid Jig 650 1 657 830 2 075 na naOther fisheries d 8 083 42 508 3 903 64 774 4 002 67 655Other fisheries d 8 083 508 3 903 6 00 6 655Total production 46 840 321 744 43 186 309 722 39 114 318 473Total production 46 840 321 744 43 186 309 722 39 114 318 473aMainly Moreton Bay bug scallop and squid b Includes fish other than Spanish mackerel caught by line fishing c Shark converted to wholea Mainly Moreton Bay bug, scallop and squid. b Includes fish other than Spanish mackerel caught by line fishing. c Shark converted to whole weight. d Includes entries marked np and Small Pelagics, Macquarie Island, Coral Sea, Cocos and Christmas islands, Heard and McDonald g p g , q , , ,Islands, SESSF Victorian coastal waters sector, Norfolk Island, South Tasman Rise, Western Skipjack, East Coast Deepwater Trawl, North Islands, SESSF Victorian coastal waters sector, Norfolk Island, South Tasman Rise, Western Skipjack, East Coast Deepwater Trawl, North West Slope Trawl and Western Deepwater Trawl fisheries because of confidentiality requirements np Not for publication because ofWest Slope Trawl and Western Deepwater Trawl fisheries because of confidentiality requirements. np Not for publication because of confidentialit req irements Incl ded in Other fisheries p Preliminar SESSF So thern and Eastern Scalefish and Shark Fisherconfidentiality requirements. Included in Other fisheries. p Preliminary. SESSF Southern and Eastern Scalefish and Shark Fishery.Sources: ABARES; Australian Fisheries Management Authority; g y
TABLE 14 Fisheries production, Commonwealth continued
83
Production
ABARESAustralian fisheries and aquaculture statistics 2013

TABLE 15 Aquaculture production in 2010–11, by state, Australia a
NSW Vic. Qld SA WA Tas. NT Aust.Value $’000 $’000 $’000 $’000 $’000 $’000 $’000 $’000
Salmonids b 1 964 7 464 0 na 133 417 872 0 427 433Tuna 0 0 0 114 500 0 0 0 114 500Silver perch 2 814 0 1 360 na 311 0 0 4 485Barramundi 938 0 21 200 na 8 392 0 5 200 35 730Other c 0 1 372 1 613 30 233 259 0 0 33 477Total 5 716 8 836 24 173 144 733 9 095 417 872 5 200 615 625
Prawns 1 732 0 55 600 0 0 0 0 57 332Yabby 217 30 0 0 390 0 0 637Marron 0 0 0 1 032 1 419 0 0 2 451Redclaw 0 0 908 na 0 0 0 908Total 1 949 30 56 508 1 032 1 809 0 0 61 328
Edible oyster 38 305 0 473 35 205 0 23 340 0 97 323Pearl oyster 0 0 na 0 99 107 0 20 970 120 077Abalone 0 na 0 10 842 0 5 547 0 16 389Blue mussel 164 3 368 0 2 425 1 357 1 981 0 9 296Total 38 469 3 368 473 48 472 100 464 30 868 20 970 243 084Other NEI d 1 953 6 605 1 317 22 471 1 080 na 810 27 631Total value 48 087 18 839 82 471 216 708 112 448 448 740 26 980 954 272Quantity t t t t t t t t
Salmonids b 168 977 0 na 11 35 685 0 36 841Tuna 0 0 0 5 800 0 0 0 5 800Silver perch 240 0 114 na 18 0 0 372Barramundi 75 0 2 764 na 862 0 651 4 352Other c 0 196 87 3 788 5 0 0 4 075Total 483 1 173 2 965 9 588 896 35 685 651 51 441
15Aquacultureproductionin2010–11,bystate,Australiaa
Fish
Crustaceans
Molluscs
Fish
CrustaceansPrawns 148 0 3 822 0 0 0 0 3 970Yabby 19 3 0 0 20 0 0 42Marron 0 0 0 37 51 0 0 88Redclaw 0 0 52 na 0 0 0 52Total 167 3 3 874 37 71 0 0 4 152
Edible oyster 3 883 0 na 6 154 0 3 890 0 13 927Pearl oyster 0 0 na 0 na 0 na naAbalone 0 na 0 317 0 173 0 491Blue mussel 29 982 0 1 174 365 566 0 3 115Total 3 912 982 na 7 645 365 4 629 na 17 534Other NEI d 107 387 65 2 977 na na na 3 149Total quantity 4 669 2 545 6 904 20 247 1 332 40 314 651 76 662a Excludes hatchery production, crocodiles, microalgae and aquarium worms. b Includes salmon and trout production. c Includes eel, other native fish and aquarium fish. d Includes aquaculture production not elsewhere specified because of confidentiality restrictions. In Victoria, this includes abalone, warmwater finfish, ornamental fish, other shellfish, shrimps and aquatic worms. Total only sums across. na Not available. NEI Not elsewhere included.Sources: ABARES; Australian Fisheries Management Authority; Department of Fisheries, Western Australia; Department of Primary Industries, New South Wales; Department of Primary Industries, Parks, Water and Environment, Tasmania; Fisheries Queensland, Department of Agriculture, Fisheries and Forestry; Fisheries Victoria, Department of Environment and Primary Industries; Northern Territory Department of Primary Industry and Fisheries; Primary Industries and Regions, South Australia; South Australian Research and Development Institute
Molluscs
Crustaceans
84
Production
ABARESAustralian fisheries and aquaculture statistics 2013

TABLE 16 Aquaculture production in 2011–12, by state, Australia a
NSW Vic. Qld SA WA Tas. NT Aust.Value $’000 $’000 $’000 $’000 $’000 $’000 $’000 $’000
Salmonids b 1 839 5 292 0 na 61 506 446 0 513 638Tuna 0 0 0 150 000 0 0 0 150 000Silver perch 2 695 0 886 na 254 0 0 3 835Barramundi 700 0 21 295 na 11 135 0 7 680 40 811Other c 0 882 1 654 18 797 531 0 0 21 864Total 5 234 6 174 23 835 168 797 11 981 506 446 7 680 730 147
Prawns 3 665 0 56 789 0 0 0 0 60 454Yabby 271 40 0 0 377 0 0 688Marron 0 0 0 343 1 444 0 0 1 787Redclaw 0 0 792 na 0 0 0 792Total 3 936 40 57 581 343 1 821 0 0 63 721
Edible oyster 35 182 0 513 30 970 0 23 406 0 90 071Pearl oyster 0 0 na 0 93 062 0 9 250 102 312Abalone 0 9 681 0 6 410 0 3 101 0 19 192Blue mussel 90 1 987 0 2 677 1 367 4 012 0 10 134Total 35 272 11 668 513 40 058 94 429 30 519 9 250 221 709Other NEI d 2 517 0 580 19 321 1 004 na 284 23 706Total value 46 959 17 882 82 509 228 519 109 235 536 965 17 214 1 039 284Quantity t t t t t t t t
Salmonids b 165 733 0 na 4 43 249 0 44 151Tuna 0 0 0 7 087 0 0 0 7 087Silver perch 190 0 75 na 14 0 0 279Barramundi 50 0 2 416 na 1 127 0 881 4 473Other c 0 126 103 1 738 34 0 0 2 001Total 405 859 2 593 8 825 1 179 43 249 881 57 991
16Aquacultureproductionin2011–12,bystate,Australiaa
Fish
Crustaceans
Molluscs
Fish
CrustaceansPrawns 270 0 3 751 0 0 0 0 4 021Yabby 17 5 0 0 19 0 0 40Marron 0 0 0 12 50 0 0 62Redclaw 0 0 41 na 0 0 0 41Total 287 5 3 793 12 69 0 0 4 165
Edible oyster 3 417 0 na 5 241 0 3 901 0 12 559Pearl oyster 0 0 na 0 na 0 na naAbalone 0 330 0 178 0 97 0 604Blue mussel 18 811 0 1 277 350 1 216 0 3 672Total 3 435 1 141 na 6 697 350 5 214 na 16 836Other NEI d 162 0 32 2 647 na na na 2 841Total quantity 4 289 2 004 6 418 18 180 1 598 48 463 881 81 833a Excludes hatchery production, crocodiles, microalgae and aquarium worms. b Includes salmon and trout production. c Includes eel, other native fish and aquarium fish. d Includes aquaculture production not elsewhere specified because of confidentiality restrictions. In Victoria, this includes abalone, warmwater finfish, ornamental fish, other shellfish, shrimps and aquatic worms. Total only sums across. na Not available. NEI Not elsewhere included.Sources: ABARES; Australian Fisheries Management Authority; Department of Fisheries, Western Australia; Department of Primary Industries, New South Wales; Department of Primary Industries, Parks, Water and Environment, Tasmania; Fisheries Queensland, Department of Agriculture, Fisheries and Forestry; Fisheries Victoria, Department of Environment and Primary Industries; Northern Territory Department of Primary Industry and Fisheries; Primary Industries and Regions, South Australia; South Australian Research and Development Institute
Molluscs
Crustaceans
85
Production
ABARESAustralian fisheries and aquaculture statistics 2013

TABLE 17 Aquaculture production in 2012–13, by state, Australia a
NSW Vic. Qld SA WA Tas. NT Aust.Value $’000 $’000 $’000 $’000 $’000 $’000 $’000 $’000
Salmonids b 2 189 5 577 0 na 64 489 033 0 496 863Tuna 0 0 0 153 500 0 0 0 153 500Silver perch 1 879 0 1 143 na 255 0 0 3 277Barramundi 601 0 19 660 na 12 510 0 na 32 771Other c 0 1 920 1 412 16 650 202 0 0 20 184Total 4 669 7 497 22 216 170 150 13 030 489 033 na 706 595
Prawns 3 484 0 56 578 0 0 0 0 60 062Yabby 275 30 0 0 415 0 0 720Marron 0 0 0 380 1 501 0 0 1 881Redclaw 0 0 738 na 0 0 0 738Total 3 759 30 57 316 380 1 917 0 0 63 402
Edible oyster 35 907 0 523 35 000 0 23 109 0 94 539Pearl oyster 0 0 na 0 79 170 0 na 79 170Abalone 0 11 151 0 8 600 0 3 934 0 23 685Blue mussel 279 2 005 0 2 940 1 017 3 955 0 10 195Total 36 186 13 155 523 46 540 80 187 30 998 0 207 589Other NEI d 2 933 0 1 717 25 670 820 na 23 900 55 040Total value 47 547 20 682 81 771 242 740 95 954 520 031 23 900 1 032 626Quantity t t t t t t t t
Salmonids b 198 1 014 0 na 4 41 762 0 42 978Tuna 0 0 0 7 486 0 0 0 7 486Silver perch 149 0 95 na 13 0 0 256Barramundi 50 0 2 319 na 1 190 0 na 3 560Other c 0 160 59 1 200 1 0 0 1 420Total 397 1 174 2 473 8 686 1 208 41 762 na 55 700
17Aquacultureproductionin2012–13,bystate,Australiaa
Fish
Crustaceans
Molluscs
Fish
CrustaceansPrawns 223 0 3 519 0 0 0 0 3 742Yabby 15 3 0 0 19 0 0 37Marron 0 0 0 11 52 0 0 63Redclaw 0 0 41 na 0 0 0 41Total 238 3 3 560 11 71 0 0 3 883
Edible oyster 3 371 0 na 5 710 0 3 449 0 12 530Pearl oyster 0 0 na 0 na 0 na naAbalone 0 365 0 236 0 123 0 724Blue mussel 50 771 0 1 480 243 1 041 0 3 584Total 3 421 1 136 na 7 426 243 4 613 na 16 838Other NEI d 130 0 108 3 407 na na na 3 645Total quantity 4 186 2 313 6 140 19 530 1 522 46 375 na 80 066a Excludes hatchery production, crocodiles, microalgae and aquarium worms. b Includes salmon and trout production. c Includes eel, other native fish and aquarium fish. d Includes aquaculture production not elsewhere specified because of confidentiality restrictions. In Victoria, this includes abalone, warmwater finfish, ornamental fish, other shellfish, shrimps and aquatic worms. Total only sums across. na Not available. NEI Not elsewhere included.Sources: ABARES; Australian Fisheries Management Authority; Department of Fisheries, Western Australia; Department of Primary Industries, New South Wales; Department of Primary Industries, Parks, Water and Environment, Tasmania; Fisheries Queensland, Department of Agriculture, Fisheries and Forestry; Fisheries Victoria, Department of Environment and Primary Industries; Northern Territory Department of Primary Industry and Fisheries; Primary Industries and Regions, South Australia; South Australian Research and Development Institute
Molluscs
Crustaceans
86
Production
ABARESAustralian fisheries and aquaculture statistics 2013

TABLE 18 Exports of fisheries products, Australia 18 Exports of fisheries products Australia18Exportsoffisheriesproducts,Australia2011 12 2012 132010 11
$’ $’ $’2011–12 2012–132010–11
t $’000 t $’000 t $’000EdibleEdibleFishLive a 880 33 372 930 31 953 832 30 664Fish Live a 880 33 372 930 31 953 832 30 664 Tuna 7 809 131 388 8 888 162 703 8 901 162 636 Salmonids b 6 378 54 437 5 750 41 779 2 584 25 402 Salmonids b 6 378 54 437 5 750 41 779 2 584 25 402Swordfish 428 4 464 509 4 241 455 3 929 Swordfish 428 4 464 509 4 241 455 3 929Whiting 1 786 4 979 892 2 535 394 1 355 Whiting 1 786 4 979 892 2 535 394 1 355 Other fish 5 466 58 143 5 056 46 166 4 657 34 179Total fish c 22 747 286 784 22 025 289 377 17 822 258 166Total fish c 22 747 286 784 22 025 289 377 17 822 258 166Crustaceans and molluscsR k l b t 7 017 369 271 6 916 386 710 7 819 447 263Crustaceans and molluscsRock lobster 7 017 369 271 6 916 386 710 7 819 447 263Prawns 6 419 77 096 5 393 66 677 3 917 51 797Prawns 6 419 77 096 5 393 66 677 3 917 51 797Abalone 3 424 212 036 3 149 197 255 2 818 185 996Abalone 3 424 212 036 3 149 197 255 2 818 185 996Scallop 567 15 423 443 15 347 417 10 792Scallop 567 15 423 443 15 347 417 10 792C bCrab 970 13 440 801 10 961 446 8 155Other 1 220 16 296 1 735 34 391 2 064 40 171Other 1 220 16 296 1 735 34 391 2 064 40 171Total 19 616 703 562 18 436 711 342 17 482 744 175Total 19 616 703 562 18 436 711 342 17 482 744 175T t l dibl 42 363 990 346 40 461 1 000 719 35 304 1 002 341Total edible c 42 363 990 346 40 461 1 000 719 35 304 1 002 341Non‐edibleMarine fats and oils na 5 416 na 7 254 na 10 041Non edibleMarine fats and oils na 5 416 na 7 254 na 10 041Fish meal na 1 562 na 392 na 1 038Fish meal na 1 562 na 392 na 1 038P lPearls d na 241 331 na 206 623 na 151 501Ornamental fish na 2 273 na 2 344 na 3 772Ornamental fish na 2 273 na 2 344 na 3 772Other non‐edible na 7 282 na 9 437 na 6 495Other non‐edible na 7 282 na 9 437 na 6 495Total non edible 257 865 226 050 172 848Total non‐edible na 257 865 na 226 050 na 172 848Total fisheries products na 1 248 211 na 1 226 769 na 1 175 189Total fisheries products na 1 248 211 na 1 226 769 na 1 175 189a Includes all species of live fish exports b Predominantly salmon Includes trout and salmon like products c Excludes live tonnage but includes livea Includes all species of live fish exports. b Predominantly salmon. Includes trout and salmon like products. c Excludes live tonnage but includes live value d Includes items temporarily exported and re imported (see Table 29) na Not availablevalue. d Includes items temporarily exported and re‐imported (see Table 29). na Not available.Source: Australian Bureau of Statistics, International Trade, Australia, cat. no. 5465.0, Canberra, , , ,
87
Exports
ABARESAustralian fisheries and aquaculture statistics 2013

TABLE 19 Exports of fish, Australia
t $’000 t $’000 t $’000Live 880 33 372 930 31 953 832 30 664
Fresh or chilled 2 715 39 910 1 721 24 355 1 983 35 109 Frozen 4 909 90 453 6 921 137 107 6 657 126 068 Prepared and preserved 185 1 025 246 1 241 260 1 459Total 7 809 131 388 8 888 162 703 8 901 162 636
Fresh or chilled 6 182 52 267 5 500 39 074 2 453 23 380 Frozen 158 1 819 162 1 742 80 1 327 Smoked 15 293 34 658 22 435 Prepared and preserved 23 57 54 304 29 261Total 6 378 54 437 5 750 41 779 2 584 25 402
Total c 428 4 464 509 4 241 455 3 929
Total 1 786 4 979 892 2 535 394 1 355
Fresh or chilled 1 505 16 021 752 7 011 248 2 333 Fillets 70 1 175 124 537 13 132 Other 1 435 14 846 628 6 474 235 2 202 Frozen 3 366 18 877 3 701 21 051 3 855 18 225 Fillets 1 384 8 993 1 308 7 635 812 3 476 Other 1 982 9 884 2 393 13 417 3 044 14 749 Prepared and preserved 412 4 380 475 4 392 313 3 087 Dried, salted and smoked 183 18 865 128 13 712 126 10 266 Other 0 0 na na 115 268Total d 5 466 58 143 5 056 46 166 4 657 34 179Total fish d 22 747 286 784 22 025 289 377 17 822 258 166
19Exportsoffish,Australia
Tuna a
Salmonids b
Swordfish
Whiting
Other fish
a Includes all species of live fish exports. b Predominantly salmon. Includes trout and salmon like products. c Predominantly fresh or chilled. d Includes live tonnage and live value. na Not available.Source: Australian Bureau of Statistics, International Trade, Australia, cat. no. 5465.0, Canberra
2010–11 2011–12 2012–13
88
Exports
ABARESAustralian fisheries and aquaculture statistics 2013

TABLE 20 Exports of crustaceans and molluscs, Australia 20Exportsofcrustaceansandmolluscs,Australiat $’000 t $’000 t $’000
Frozen Whole 641 25 458 234 10 608 167 7 440 Tails 366 23 388 252 14 914 200 12 743 Other 199 2 833 140 2 026 94 1 331 Unfrozen 5 811 317 593 6 290 359 162 7 359 425 748Total 7 017 369 271 6 916 386 710 7 819 447 263
Frozen 6 377 76 702 5 252 65 328 3 871 51 269 Unfrozen 4 77 40 452 22 261 Prepared or preserved 37 317 101 897 24 267Total 6 419 77 096 5 393 66 677 3 917 51 797
Frozen 474 3 544 396 3 232 208 2 872 Unfrozen 496 9 891 387 7 531 236 5 277 Prepared or preserved 0 5 18 198 1 7Total 970 13 440 801 10 961 446 8 155
Live, fresh or chilled 1 676 88 116 1 583 81 167 1 415 79 568 Frozen or cooked 773 58 645 772 56 735 701 54 846 Prepared or preserved 974 65 276 794 59 352 701 51 583Total 3 424 212 036 3 149 197 255 2 818 185 996
Live, fresh or chilled 0 5 1 25 6 247 Frozen or cooked 567 15 417 443 15 323 412 10 545Total 567 15 423 443 15 347 417 10 792
Prepared or preserved 39 272 108 627 166 709 Dried, salted or smoked 926 6 384 1 176 24 799 1 263 32 440 Other 254 9 640 451 8 965 635 7 022Total 1 220 16 296 1 735 34 391 2 064 40 171Total crustaceans and molluscs 19 616 703 562 18 436 711 342 17 482 744 175
2010–11 2011–12 2012–13
Source: Australian Bureau of Statistics, International Trade, Australia, cat. no. 5465.0, Canberra
Rock lobster
Prawns
Crabs
Abalone
Scallops
Other crustaceans and molluscs
89
Exports
ABARESAustralian fisheries and aquaculture statistics 2013
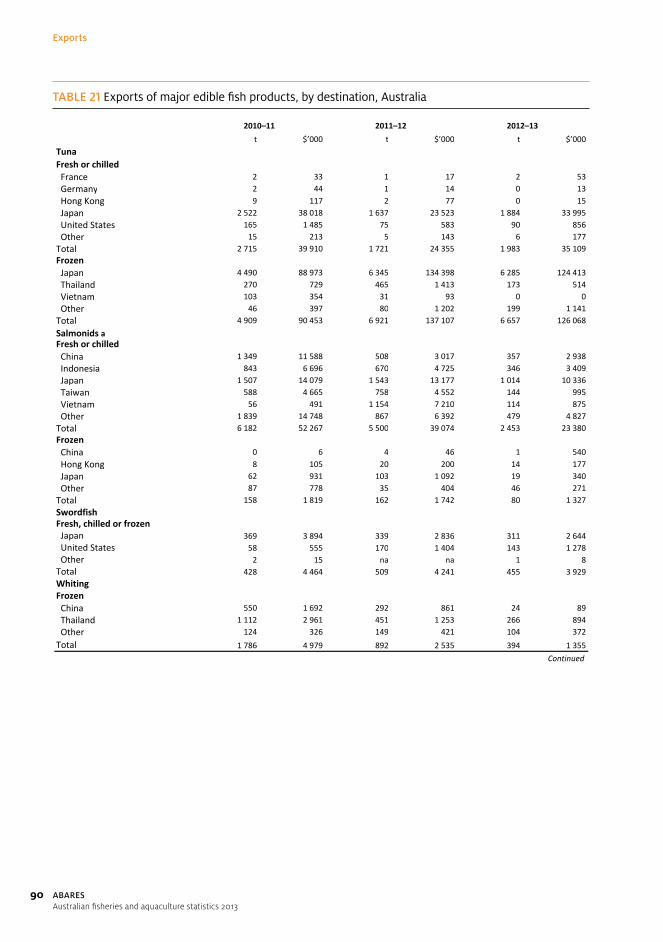
TABLE 21 Exports of major edible fish products, by destination, Australia 21Exportsofmajorediblefishproducts,bydestination,Australiat $’000 t $’000 t $’000
France 2 33 1 17 2 53 Germany 2 44 1 14 0 13 Hong Kong 9 117 2 77 0 15 Japan 2 522 38 018 1 637 23 523 1 884 33 995 United States 165 1 485 75 583 90 856 Other 15 213 5 143 6 177Total 2 715 39 910 1 721 24 355 1 983 35 109
Japan 4 490 88 973 6 345 134 398 6 285 124 413 Thailand 270 729 465 1 413 173 514 Vietnam 103 354 31 93 0 0 Other 46 397 80 1 202 199 1 141Total 4 909 90 453 6 921 137 107 6 657 126 068
China 1 349 11 588 508 3 017 357 2 938 Indonesia 843 6 696 670 4 725 346 3 409 Japan 1 507 14 079 1 543 13 177 1 014 10 336 Taiwan 588 4 665 758 4 552 144 995 Vietnam 56 491 1 154 7 210 114 875 Other 1 839 14 748 867 6 392 479 4 827Total 6 182 52 267 5 500 39 074 2 453 23 380
China 0 6 4 46 1 540 Hong Kong 8 105 20 200 14 177 Japan 62 931 103 1 092 19 340 Other 87 778 35 404 46 271Total 158 1 819 162 1 742 80 1 327Swordfish
Japan 369 3 894 339 2 836 311 2 644 United States 58 555 170 1 404 143 1 278 Other 2 15 na na 1 8Total 428 4 464 509 4 241 455 3 929
China 550 1 692 292 861 24 89 Thailand 1 112 2 961 451 1 253 266 894 Other 124 326 149 421 104 372Total 1 786 4 979 892 2 535 394 1 355
Continued
Salmonids aFresh or chilled
Frozen
Fresh, chilled or frozen
WhitingFrozen
2010–11 2011–12 2012–13
Tuna Fresh or chilled
Frozen
90
Exports
ABARESAustralian fisheries and aquaculture statistics 2013

TABLE 21 Exports of major edible fish products, by destination, Australia continued 21 Exports of major edible fish products by destination Australia continued21Exportsofmajorediblefishproducts,bydestination,Australia continued2011 12 2012 132010 11
$’ $’ $’2011–12 2012–132010–11
t $’000 t $’000 t $’000Prepared and preservedPrepared and preservedTunaG 2 0 23Tuna Guam 2 7 11 40 5 23 New Zealand 167 905 189 978 155 1 015 New Zealand 167 905 189 978 155 1 015Papua New Guinea 8 65 16 108 7 66 Papua New Guinea 8 65 16 108 7 66Other 9 48 31 115 93 354 Other 9 48 31 115 93 354
lTotal 185 1 025 246 1 241 260 1 459Salmonids aNew Zealand 2 17 53 282 28 245Salmonids a New Zealand 2 17 53 282 28 245P N G i 1 9 0 14 0 4 Papua New Guinea 1 9 0 14 0 4 Singapore 0 1 0 3 0 0 Singapore 0 1 0 3 0 0Other 20 30 0 5 0 11 Other 20 30 0 5 0 11Total 23 57 54 304 29 261Total 23 57 54 304 29 261Oth fi hOther fish Hong Kong 186 3 021 138 2 434 9 1 404 Hong Kong 186 3 021 138 2 434 9 1 404Malaysia 3 47 1 6 83 585 Malaysia 3 47 1 6 83 585Micronesia 80 148 110 242 83 193 Micronesia 80 148 110 242 83 193
l d New Zealand 101 818 165 968 98 708 Other 42 346 62 741 39 198 Other 42 346 62 741 39 198Total 412 4 380 475 4 392 313 3 087Total 412 4 380 475 4 392 313 3 087Dried salted or smokedDried, salted or smokedSalmonids aDenmark 0 0 12 204 7 96 Denmark 0 0 12 204 7 96Hong Kong 4 86 1 14 1 26 Hong Kong 4 86 1 14 1 26N Z l d 3 54 1 18 8 151 New Zealand 3 54 1 18 8 151 Other 8 154 21 422 6 162 Other 8 154 21 422 6 162Total 15 293 34 658 22 435Total 15 293 34 658 22 435Other fishH KOther fish Hong Kong 130 16 534 94 11 652 89 8 295g g Japan 7 672 8 791 9 943 Japan 7 672 8 791 9 943Singapore 8 824 11 1 064 9 742 Singapore 8 824 11 1 064 9 742Other 38 835 16 205 19 286 Other 38 835 16 205 19 286Total 183 18 865 128 13 712 126 10 266Total 183 18 865 128 13 712 126 10 266a Predominantly salmon Includes trout and salmon like productsa Predominantly salmon. Includes trout and salmon like products.S A t li B f St ti ti I t ti l T d A t li t 5465 0 C bSource: Australian Bureau of Statistics, International Trade, Australia, cat. no. 5465.0, Canberra
91
Exports
ABARESAustralian fisheries and aquaculture statistics 2013

TABLE 22 Exports of crustaceans, by destination, Australia 22 Exports of crustaceans by destination Australia22Exportsofcrustaceans,bydestination,Australia2010 11 2011 12 2012 132010–11 2011–12 2012–13
t $’000 t $’000 t $’000$ $ $Rock lobsterRock lobsterFrozenFrozen France 23 937 5 211 1 46 Hong Kong 68 2 342 29 904 51 2 068 Hong Kong 68 2 342 29 904 51 2 068Japan 301 8 466 230 6 974 177 5 847 Japan 301 8 466 230 6 974 177 5 847Si 12 458 6 258 0 0 Singapore 12 458 6 258 0 0 Taiwan 326 12 662 100 4 191 27 1 199 Taiwan 326 12 662 100 4 191 27 1 199United States 370 23 066 241 14 188 184 11 655 United States 370 23 066 241 14 188 184 11 655Other 106 3 749 15 821 19 701 Other 106 3 749 15 821 19 701T t l 206 6 8 626 2 8 6 2Total 1 206 51 678 626 27 548 461 21 514Unfrozen China 1 355 69 433 201 12 032 125 7 445Unfrozen China 1 355 69 433 201 12 032 125 7 445Hong Kong 3 993 223 624 5 185 289 982 2 695 149 595 Hong Kong 3 993 223 624 5 185 289 982 2 695 149 595J Japan 197 10 369 194 10 309 143 7 728p Taiwan 68 3 068 33 1 480 13 613 Taiwan 68 3 068 33 1 480 13 613Thailand 69 4 597 127 9 529 4 236 Thailand 69 4 597 127 9 529 4 236Vietnam 0 8 468 30 900 4 304 256 076 Vietnam 0 8 468 30 900 4 304 256 076 Other 128 6 494 82 4 930 74 4 056Total 5 811 317 593 6 290 359 162 7 359 425 748Total 5 811 317 593 6 290 359 162 7 359 425 748PrawnsPrawnsFFrozen China 1 327 10 862 578 4 308 323 3 027 China 1 327 10 862 578 4 308 323 3 027Hong Kong 882 11 213 780 8 380 366 5 190 Hong Kong 882 11 213 780 8 380 366 5 190Japan 1 930 33 350 1 573 29 048 1 207 22 355 Japan 1 930 33 350 1 573 29 048 1 207 22 355M l i Malaysia 557 4 252 145 1 111 263 2 327y New Zealand 149 1 825 243 2 850 245 3 026 New Zealand 149 1 825 243 2 850 245 3 026Vietnam 691 6 352 1 489 14 698 482 6 288 Vietnam 691 6 352 1 489 14 698 482 6 288Other 841 8 849 444 4 933 986 9 056 Other 841 8 849 444 4 933 986 9 056
lTotal 6 377 76 702 5 252 65 328 3 871 51 269UnfrozenHong Kong 1 10 4 87 7 60Unfrozen Hong Kong 1 10 4 87 7 60New Zealand 3 55 0 6 0 0 New Zealand 3 55 0 6 0 0 Vietnam 0 0 0 0 0 0Other 1 11 0 10 15 201 Other 1 11 0 10 15 201Total 4 77 40 452 22 261Total 4 77 40 452 22 261P d dPrepared or preserved China 13 78 8 69 22 124 China 13 78 8 69 22 124Thailand 44 390 0 0 75 722 Thailand 44 390 0 0 75 722Vietnam 36 298 0 0 1 22 Vietnam 36 298 0 0 1 22O h Other 40 351 30 248 2 29Total 133 1 117 37 317 101 897Total 133 1 117 37 317 101 897
Continued
92
Exports
ABARESAustralian fisheries and aquaculture statistics 2013

TABLE 22 Exports of crustaceans, by destination, Australia continued
t $’000 t $’000 t $’000
China 115 748 83 693 93 1 586 Hong Kong 28 390 11 157 14 178 Japan 32 380 5 50 1 19 Singapore 1 30 11 283 1 61 Taiwan 118 569 84 467 75 426 United States 11 226 7 230 4 137 Other 170 1 202 195 1 352 20 465Total 474 3 544 396 3 232 208 2 872
China 145 4 802 156 4 067 87 2 624 Hong Kong 137 1 988 74 1 221 65 1 113 Japan 78 800 58 550 39 322 Singapore 24 805 20 794 15 619 Taiwan 96 817 72 599 21 193 Other 16 678 6 300 9 407Total 496 9 891 387 7 531 236 5 277
China 25 0 14 1 015 72 1 756 Hong Kong 88 5 726 179 13 633 63 4 204 Thailand 26 1 389 21 1 357 12 165 Vietnam 0 0 0 0 187 11 758 Other 37 510 21 856 29 531Total 176 9 146 268 19 538 363 18 414Source: Australian Bureau of Statistics, International Trade, Australia, cat. no. 5465.0, Canberra
2010–11 2011–12 2012–13
22Exportsofcrustaceans,bydestination,Australiacontinued
CrabsFrozen
Unfrozen
Other crustaceans
93
Exports
ABARESAustralian fisheries and aquaculture statistics 2013

TABLE 23 Exports of molluscs, by destination, Australia 23 Exports of molluscs by destination Australia23Exportsofmolluscs,bydestination,Australiap , y ,2010–11 2011–12 2012–13
t $’000 t $’000 t $’000t $ 000 t $ 000 t $ 000AbaloneAbaloneLive, fresh or chilledChina 690 36 262 473 24 363 380 21 840Live, fresh or chilled China 690 36 262 473 24 363 380 21 840Hong Kong 830 44 148 917 46 887 692 39 007 Hong Kong 830 44 148 917 46 887 692 39 007 Japan 113 5 635 97 4 757 81 4 254p Singapore 15 861 17 1 178 7 574 Singapore 15 861 17 1 178 7 574Taiwan 21 897 14 532 20 756 Taiwan 21 897 14 532 20 756Vi t 0 20 60 3 175 232 12 981 Vietnam 0 20 60 3 175 232 12 981 Other 8 293 5 274 3 156 OtherTotal 1 676 88 116 1 583 81 167 1 415 79 568Total 1 676 88 116 1 583 81 167 1 415 79 568Frozen or cookedC d 8 866 6 660 10 1 136Frozen or cooked Canada 8 866 6 660 10 1 136 China 49 4 480 73 5 477 25 1 130 China 49 4 480 73 5 477 25 1 130Hong Kong 314 30 201 231 22 906 240 25 990 Hong Kong 314 30 201 231 22 906 240 25 990Japan 224 12 270 290 15 360 271 14 105 Japan 224 12 270 290 15 360 271 14 105i Singapore 108 6 687 119 8 739 97 7 715g p
United States 31 1 770 12 1 009 9 864 United States 31 1 770 12 1 009 9 864Other 39 2 370 42 2 585 50 3 906 Other 39 2 370 42 2 585 50 3 906Total 773 58 645 772 56 735 701 54 846Total 773 58 645 772 56 735 701 54 846
d dPrepared or preservedHong Kong 511 36 736 412 31 797 378 29 880p p
Hong Kong 511 36 736 412 31 797 378 29 880Japan 68 4 694 62 5 072 49 3 944 Japan 68 4 694 62 5 072 49 3 944M l i 28 1 669 15 974 15 970 Malaysia 28 1 669 15 974 15 970y Singapore 293 17 376 227 16 040 198 12 389 Singapore 293 17 376 227 16 040 198 12 389Taiwan 42 2 708 25 1 691 19 1 342 Taiwan 42 2 708 25 1 691 19 1 342United States 18 1 166 31 2 163 18 1 295 United States 18 1 166 31 2 163 18 1 295h Other 13 928 21 1 615 24 1 764
Total 974 65 276 794 59 352 701 51 583 Total 974 65 276 794 59 352 701 51 583ScallopScallopLive fresh or chilledLive, fresh or chilled Hong Kong 0 0 0 22 4 197 Hong KongIndonesia 0 0 0 0 0 0 Indonesia 0 0 0 0 0 0Malaysia 0 0 0 0 1 49 Malaysia 0 0 0 0 1 49O h 0 5 0 3 0 0 Other 0 5 0 3 0 0 Total 0 5 1 25 6 247 Total 0 5 1 25 6 247Frozen or cookedChina 0 2 0 9 17 73Frozen or cooked China 0 2 0 9 17 73 Hong Kong 290 8 540 215 8 232 186 7 049g g Malaysia 47 1 170 19 529 19 632 Malaysia 47 1 170 19 529 19 632Singapore 197 5 274 202 6 381 55 1 972 Singapore 197 5 274 202 6 381 55 1 972Oth 33 432 6 172 134 820 Other 33 432 6 172 134 820 Total 567 15 417 443 15 323 412 10 545 Total Other molluscsCanada 44 134 102 639 75 552Other molluscs Canada 44 134 102 639 75 552Chi 162 941 207 1 420 205 1 637 China 162 941 207 1 420 205 1 637 Hong Kong 459 3 566 706 7 946 749 11 674 Hong Kong 459 3 566 706 7 946 749 11 674Japan 84 767 115 2 132 66 1 767 Japan 84 767 115 2 132 66 1 767Malaysia 33 257 36 376 21 293 Malaysia 33 257 36 376 21 293 Singapore 100 791 129 1 268 174 3 268g pOther 162 694 172 1 072 411 2 565 Other 162 694 172 1 072 411 2 565Total 1 044 7 150 1 468 14 853 1 701 21 757Total 1 044 7 150 1 468 14 853 1 701 21 757Source: Australian Bureau of Statistics, International Trade, Australia, cat. no. 5465.0, Canberra, , , ,
94
Exports
ABARESAustralian fisheries and aquaculture statistics 2013

TABLE 24 Exports of fisheries products, by destination, Australia 24 Exports fisheries products by destination Australia24Exportsfisheriesproducts,bydestination,Australia2010 11 2011 12 2012 132010–11 2011–12 2012–13
t $’000 t $’000 t $’000$ $ $Edible (including live fish)Canada 116 2 212 138 2 418 98 2 670
Edible (including live fish) Canada 116 2 212 138 2 418 98 2 670Chi China 5 938 143 225 2 723 58 533 1 808 45 193 France 339 5 978 252 3 005 109 1 671 France 339 5 978 252 3 005 109 1 671Germany 166 2 062 120 1 268 26 355 Germany 166 2 062 120 1 268 26 355H K 9 401 425 946 10 040 479 092 6 541 317 017 Hong Kong 9 401 425 946 10 040 479 092 6 541 317 017g g Indonesia 1 164 8 653 935 6 096 1 125 7 357 Indonesia 1 164 8 653 935 6 096 1 125 7 357Italy 267 6 338 53 7 292 68 1 371 Italy 267 6 338 53 7 292 68 1 371Japan 12 136 225 874 12 969 254 639 11 794 236 010 Japan 12 136 225 874 12 969 254 639 11 794 236 010M l i Malaysia 1 050 12 863 425 7 666 566 7 779y New Zealand 1 416 9 642 1 573 10 130 1 435 9 123 New Zealand 1 416 9 642 1 573 10 130 1 435 9 123Singapore 1 568 41 226 1 266 42 455 775 30 998 Singapore 1 568 41 226 1 266 42 455 775 30 998Taiwan 1 489 29 599 1 264 17 504 534 9 783 Taiwan 1 489 29 599 1 264 17 504 534 9 783h l d Thailand 2 230 16 003 1 802 18 136 1 732 9 268 Thailand 2 230 16 003 1 802 18 136 1 732 9 268United States 1 277 35 739 864 23 077 580 17 850 United States 1 277 35 739 864 23 077 580 17 850Vietnam 1 157 8 376 3 559 60 464 5 905 293 217 Vietnam 1 157 8 376 3 559 60 464 5 905 293 217Other 2 648 16 610 2 477 8 945 2 208 12 677 Other 2 648 16 610 2 477 8 945 2 208 12 677
Total 42 363 990 346 40 461 1 000 719 35 304 1 002 341Total 42 363 990 346 40 461 1 000 719 35 304 1 002 341Non‐edibleChina na 2 693 na 2 135 na 2 757
Non‐edible China na 2 693 na 2 135 na 2 757F France na 1 764 na 378 na 290 Germany na 808 na 549 na 1 719 Germany na 808 na 549 na 1 719Hong Kong na 145 102 na 96 603 na 54 310 Hong Kong na 145 102 na 96 603 na 54 310Indonesia 305 2 400 2 696 Indonesia na 305 na 2 400 na 2 696
l Italy na 1 094 na 1 579 na 580 Italy na 1 094 na 1 579 na 580Japan na 43 320 na 44 401 na 33 025 Japan na 43 320 na 44 401 na 33 025New Zealand na 2 750 na 2 864 na 2 905 New Zealand na 2 750 na 2 864 na 2 905Si Singapore na 1 766 na 1 427 na 2 727g p Switzerland na 2 812 na 6 102 na 1 576 Switzerland na 2 812 na 6 102 na 1 576Thailand na 2 202 na 1 473 na 5 416 Thailand na 2 202 na 1 473 na 5 416United Arab Emirates na 705 na 2 281 na 1 947 United Arab Emirates na 705 na 2 281 na 1 947U i d Ki d United Kingdom na 1 291 na 498 na 667g United States na 8 056 na 22 200 na 20 955 United States na 8 056 na 22 200 na 20 955Vietnam na 524 na 1 064 na 1 203 Vietnam na 524 na 1 064 na 1 203Other na 42 671 na 40 098 na 40 074 Other na 42 671 na 40 098 na 40 074
Total na 257 865 na 226 050 na 172 848Total na 257 865 na 226 050 na 172 848Total exports na 1 248 211 na 1 226 769 na 1 175 189Total exports na 1 248 211 na 1 226 769 na 1 175 189
N t il blna Not available.Source: Australian Bureau of Statistics, International Trade, Australia, cat. no. 5465.0, CanberraSource: Australian Bureau of Statistics, International Trade, Australia, cat. no. 5465.0, Canberra
95
Exports
ABARESAustralian fisheries and aquaculture statistics 2013

TABLE 25 Exports of seafood to selected countries, by product, Australia a 25 Exports of seafood to selected countries by product Australia a25Exportsofseafoodtoselectedcountries,byproduct,Australiaa2010 11 2011 12 2012 132010–11 2011–12 2012–13
t $’000 t $’000 t $’000t $ 000 t $ 000 t $ 000Hong KongRock lobster (unfrozen) 3 993 223 624 5 185 289 982 2 695 149 595Hong Kong Rock lobster (unfrozen) 3 993 223 624 5 185 289 982 2 695 149 595 Abalone 1 656 111 084 1 560 101 590 1 310 94 877 Prawns (frozen) 882 11 213 780 8 380 366 5 190 Prawns (frozen) 882 11 213 780 8 380 366 5 190Tuna 9 117 2 77 1 16 Tuna 9 117 2 77 1 16S l id 506 4 183 128 1 162 104 1 270 Salmonids 506 4 183 128 1 162 104 1 270 Crabs 165 2 383 85 1 379 79 1 291 Crabs 165 2 383 85 1 379 79 1 291Other 2 190 73 341 2 300 76 523 1 985 64 778 Other 2 190 73 341 2 300 76 523 1 985 64 778Total 9 401 425 946 10 040 479 092 6 541 317 017Total 9 401 425 946 10 040 479 092 6 541 317 017JJapan Tuna 7 012 126 991 7 982 157 921 8 169 158 408p
Tuna 7 012 126 991 7 982 157 921 8 169 158 408Prawns (frozen) 1 930 33 350 1 573 29 048 1 207 22 355 Prawns (frozen) 1 930 33 350 1 573 29 048 1 207 22 355Rock lobster (unfrozen) 197 10 369 194 10 309 143 7 728 Rock lobster (unfrozen) 197 10 369 194 10 309 143 7 728R k l b (f ) Rock lobster (frozen) 301 8 466 230 6 974 177 5 847( ) Abalone 404 22 599 449 25 189 400 22 303 Abalone 404 22 599 449 25 189 400 22 303Salmonids 1 572 15 061 1 647 14 284 1 034 10 723 Salmonids 1 572 15 061 1 647 14 284 1 034 10 723Crabs 109 1 180 63 599 40 341 Crabs 109 1 180 63 599 40 341 Scallops 0 0 0 0 0 0pSwordfish 369 3 894 339 2 836 311 2 644 Swordfish 369 3 894 339 2 836 311 2 644Other 240 3 964 492 7 478 313 5 660 Other 240 3 964 492 7 478 313 5 660T t l 12 136 225 874 12 969 254 639 11 794 236 010Total 12 136 225 874 12 969 254 639 11 794 236 010ChinaAbalone 741 40 812 547 29 998 405 22 987China Abalone 741 40 812 547 29 998 405 22 987Rock lobster (unfrozen) 1 355 69 433 201 12 032 125 7 445 Rock lobster (unfrozen) 1 355 69 433 201 12 032 125 7 445P (f ) Prawns (frozen) 1 327 10 862 578 4 308 323 3 027( ) Prawns (prepared and preserved) 8 69 22 124 0 0 Prawns (prepared and preserved) 8 69 22 124 0 0Crabs 260 5 550 239 4 760 180 4 210 Crabs 260 5 550 239 4 760 180 4 210Salmonids 1 350 11 593 512 3 063 359 3 494 Salmonids 1 350 11 593 512 3 063 359 3 494hi i Whiting 550 1 692 292 861 24 89g
Scallops 0 0 0 0 0 0 Scallops 0 0 0 0 0 0Other 348 3 214 332 3 387 393 3 942 Other 348 3 214 332 3 387 393 3 942Total 5 938 143 225 2 723 58 533 1 808 45 193Total 5 938 143 225 2 723 58 533 1 808 45 193United StatesRock lobster (frozen) 370 23 066 241 14 188 184 11 655 Rock lobster (frozen) 370 23 066 241 14 188 184 11 655Tuna 170 1 522 79 598 90 857 Tuna 170 1 522 79 598 90 857S l id 92 836 64 635 38 465 Salmonids 92 836 64 635 38 465 Crabs 14 300 7 241 6 232 Crabs 14 300 7 241 6 232Abalone 50 2 968 44 3 227 28 2 200 Abalone 50 2 968 44 3 227 28 2 200Swordfish 58 555 170 1 404 143 1 278 Swordfish 58 555 170 1 404 143 1 278O h Other 525 6 491 258 2 783 90 1 163Total 1 277 35 739 864 23 077 580 17 850Total 1 277 35 739 864 23 077 580 17 850
Contin edContinued
96
Exports
ABARESAustralian fisheries and aquaculture statistics 2013

25 Exports of seafood to selected countries by product Australia a continued25Exportsofseafoodtoselectedcountries,byproduct,Australiaacontinued2010 11 2011 12 2012 132010–11 2011–12 2012–13
t $’000 t $’000 t $’000$ $ $SingaporeAbalone 416 24 924 363 25 957 303 20 678Singapore Abalone 416 24 924 363 25 957 303 20 678
( ) Rock lobster (frozen) 12 458 6 258 0 0( ) Rock lobster (unfrozen) 25 1 449 17 1 144 25 1 607 Rock lobster (unfrozen) 25 1 449 17 1 144 25 1 607Scallops 197 5 274 202 6 381 55 1 972 Scallops 197 5 274 202 6 381 55 1 972C b 24 835 31 1 077 16 680 Crabs 24 835 31 1 077 16 680 Oysters 62 524 45 549 77 2 270 Oysters 62 524 45 549 77 2 270Salmonids 640 4 962 327 2 102 78 619 Salmonids 640 4 962 327 2 102 78 619Other 193 2 799 275 4 988 221 3 173 Other 193 2 799 275 4 988 221 3 173T t l 68 226 266 2 30 998Total 1 568 41 226 1 266 42 455 775 30 998TaiwanRock lobster (frozen) 326 12 662 100 4 191 27 1 199Taiwan Rock lobster (frozen) 326 12 662 100 4 191 27 1 199Rock lobster (unfrozen) 68 3 068 33 1 480 13 613 Rock lobster (unfrozen) 68 3 068 33 1 480 13 613Ab l Abalone 86 5 086 56 3 255 48 2 638 Salmonids 588 4 665 758 4 552 144 999 Salmonids 588 4 665 758 4 552 144 999Prawns (frozen) 36 408 38 707 83 1 260 Prawns (frozen) 36 408 38 707 83 1 260Crabs 214 1 386 157 1 066 96 618 Crabs 214 1 386 157 1 066 96 618 Other 170 2 325 122 2 253 123 2 456Total 1 489 29 599 1 264 17 504 534 9 783Total 1 489 29 599 1 264 17 504 534 9 783VietnamR k l b t ( f ) 0 8 468 30 900 4 304 256 076Vietnam Rock lobster (unfrozen) 0 8 468 30 900 4 304 256 076 Prawns (frozen) 691 6 352 1 489 14 698 482 6 288 Prawns (frozen) 691 6 352 1 489 14 698 482 6 288Prawns (unfrozen) 0 0 35 349 0 0 Prawns (unfrozen) 0 0 35 349 0 0Prawns (prepared and preserved) na na 1 22 10 99 Prawns (prepared and preserved) na na 1 22 10 99Ab l Abalone 1 61 64 3 477 258 15 292 Salmonids 56 494 1 163 7 255 139 1 022 Salmonids 56 494 1 163 7 255 139 1 022Tuna 103 354 31 94 0 0 Tuna 103 354 31 94 0 0Other 307 1 107 308 3 667 712 14 441 Other 307 1 107 308 3 667 712 14 441
lTotal 1 157 8 376 3 559 60 464 5 905 293 217APECRock lobster (unfrozen) 5 741 314 507 6 256 357 531 7 326 424 225APEC Rock lobster (unfrozen) 5 741 314 507 6 256 357 531 7 326 424 225Rock lobster (frozen) 1 108 47 334 607 26 587 443 20 872 Rock lobster (frozen) 1 108 47 334 607 26 587 443 20 872 Tuna 7 771 131 148 8 821 162 423 8 621 161 533Abalone 3 415 211 568 3 138 196 573 2 809 185 344 Abalone 3 415 211 568 3 138 196 573 2 809 185 344Prawns (frozen) 6 072 73 331 5 086 63 028 3 801 50 234 Prawns (frozen) 6 072 73 331 5 086 63 028 3 801 50 234S l id 6 192 52 877 5 592 40 099 2 490 24 447 Salmonids 6 192 52 877 5 592 40 099 2 490 24 447 Scallops 564 15 368 442 15 330 415 10 761 Scallops 564 15 368 442 15 330 415 10 761Crabs 953 12 879 791 10 781 434 7 863 Crabs 953 12 879 791 10 781 434 7 863Whiting 1 770 4 928 875 2 489 377 1 309 Whiting 1 770 4 928 875 2 489 377 1 309O h Other 6 257 100 687 6 664 109 863 6 660 102 835Total 39 843 964 627 38 275 984 703 33 375 989 423Total 39 843 964 627 38 275 984 703 33 375 989 423a Excludes livea Excludes live.S A li f S i i I i l d A li 46 0 C bSource: Australian Bureau of Statistics, International Trade, Australia, cat. no. 5465.0, Canberra
TABLE 25 Exports of seafood to selected countries, by product, Australia a continued
97
Exports
ABARESAustralian fisheries and aquaculture statistics 2013

TABLE 26 Seafood exports in 2010–11, by state, Australia a 26 Seafood exports in 2010–11 by state Australia a26Seafoodexportsin2010–11,bystate,AustraliaaNSW Vic Qld SA WA Tas NT Aust bNSW Vic. Qld SA WA Tas. NT Aust. b
Value $’000 $’000 $’000 $’000 $’000 $’000 $’000 $’000$ $ $ $ $ $ $ $FishLive 944 276 31 839 0 25 288 0 33 372Fish Live 944 276 31 839 0 25 288 0 33 372T 4 394 70 10 501 114 526 699 0 0 131 388 Tuna 4 394 70 10 501 114 526 699 0 0 131 388 Salmonids 18 3 298 338 795 5 49 854 0 54 437 Salmonids 18 3 298 338 795 5 49 854 0 54 437Swordfish 119 2 3 183 4 1 146 0 0 4 464 Swordfish 119 2 3 183 4 1 146 0 0 4 464Whiting 228 36 4 714 0 0 0 0 4 979 Whiting 228 36 4 714 0 0 0 0 4 979O h fi h Other fish 4 008 7 844 19 638 15 356 1 378 6 591 10 58 143Total fish 9 710 11 527 70 213 130 681 3 254 56 732 10 286 784Total fish 9 710 11 527 70 213 130 681 3 254 56 732 10 286 784Crustaceans and molluscsRock lobster 4 072 59 385 29 562 58 039 198 266 17 490 0 369 271Crustaceans and molluscs Rock lobster 4 072 59 385 29 562 58 039 198 266 17 490 0 369 271 Prawns 91 67 48 675 216 17 366 0 0 77 096 Abalone 1 801 74 576 1 117 38 369 7 774 88 381 0 212 036 Abalone 1 801 74 576 1 117 38 369 7 774 88 381 0 212 036Scallop 2 34 5 364 1 9 682 152 0 15 423 Scallop 2 34 5 364 1 9 682 152 0 15 423C b 17 1 903 6 204 1 133 3 513 405 79 13 440 Crab 17 1 903 6 204 1 133 3 513 405 79 13 440 Other 65 737 1 458 9 974 267 2 451 0 16 296 Other 65 737 1 458 9 974 267 2 451 0 16 296Total 6 049 136 702 92 382 107 732 236 867 108 879 79 703 562Total 6 049 136 702 92 382 107 732 236 867 108 879 79 703 562Total value 15 759 148 229 162 594 238 413 240 121 165 612 89 990 346Total value 15 759 148 229 162 594 238 413 240 121 165 612 89 990 346Q iQuantity t t t t t t t tyFish Live 54 10 795 0 2 19 0 880Fish Live 54 10 795 0 2 19 0 880Tuna 405 7 1 363 5 760 62 0 0 7 809 Tuna 405 7 1 363 5 760 62 0 0 7 809l d Salmonids 1 390 31 86 0 5 844 0 6 378
Swordfish 18 0 300 0 109 0 0 428 Swordfish 18 0 300 0 109 0 0 428Whiting 87 13 1 687 0 0 0 0 1 786 Whiting 87 13 1 687 0 0 0 0 1 786Oth fi h 410 602 889 1 349 492 1 096 1 5 466 Other fish 410 602 889 1 349 492 1 096 1 5 466Total fish 976 1 021 5 063 7 195 664 6 959 1 22 747Total fish 976 1 021 5 063 7 195 664 6 959 1 22 747Crustaceans and molluscsRock lobster 66 956 567 883 4 200 282 0 7 017Crustaceans and molluscs Rock lobster 66 956 567 883 4 200 282 0 7 017P 5 6 3 725 10 1 350 0 0 6 419 Prawns 5 6 3 725 10 1 350 0 0 6 419 Abalone 38 1 221 12 435 95 1 623 0 3 424 Abalone 38 1 221 12 435 95 1 623 0 3 424Scallop 0 4 189 0 338 20 0 567 Scallop 0 4 189 0 338 20 0 567Crab 2 31 644 24 243 5 4 970 Crab 2 31 644 24 243 5 4 970O h Other 7 185 161 516 30 65 0 1 220Total 118 2 404 5 297 1 867 6 256 1 996 4 19 616Total 118 2 404 5 297 1 867 6 256 1 996 4 19 616Total quantity 1 094 3 425 10 360 9 062 6 921 8 956 5 42 363Total quantity 1 094 3 425 10 360 9 062 6 921 8 956 5 42 363a State totals include Commonwealth fisheries exports. Exports are identified according to source state or territory, not state or territory in which the product was caught p p g y, y p gor farmed. b Includes Australian Capital Territory and re‐exports. na Not available.or farmed. b Includes Australian Capital Territory and re exports. na Not available.Source: Australian Bureau of Statistics International Trade Australia cat no 5465 0 CanberraSource: Australian Bureau of Statistics, International Trade, Australia, cat. no. 5465.0, Canberra
98
Exports
ABARESAustralian fisheries and aquaculture statistics 2013

TABLE 27 Seafood exports in 2011–12, by state, Australia a 27 Seafood exports in 2011–12 by state Australia a27Seafoodexportsin2011–12,bystate,AustraliaaNSW Vic Qld SA WA Tas NT Aust bNSW Vic. Qld SA WA Tas. NT Aust. b
Value $’000 $’000 $’000 $’000 $’000 $’000 $’000 $’000$ $ $ $ $ $ $ $FishLive 1 977 638 28 752 0 28 517 0 31 953Fish Live 1 977 638 28 752 0 28 517 0 31 953T 2 845 61 7 789 150 107 570 0 0 162 703 Tuna 2 845 61 7 789 150 107 570 0 0 162 703 Salmonids 395 4 537 303 864 22 35 417 0 41 779 Salmonids 395 4 537 303 864 22 35 417 0 41 779Swordfish 184 na 3 431 0 626 0 0 4 241 Swordfish 184 na 3 431 0 626 0 0 4 241Whiting na na 2 523 0 0 0 0 2 535 Whiting na na 2 523 0 0 0 0 2 535O h fi h Other fish 4 949 5 569 16 732 6 715 960 8 079 14 46 166Total fish 10 349 10 805 59 531 157 685 2 205 44 014 14 289 377Total fish 10 349 10 805 59 531 157 685 2 205 44 014 14 289 377Crustaceans and molluscsRock lobster 4 868 62 600 28 166 60 219 205 696 23 493 0 386 710Crustaceans and molluscs Rock lobster 4 868 62 600 28 166 60 219 205 696 23 493 0 386 710 Prawns 104 26 39 452 1 587 19 347 23 0 66 677 Abalone 1 829 67 201 836 33 889 5 061 88 362 0 197 255 Abalone 1 829 67 201 836 33 889 5 061 88 362 0 197 255Scallop 179 na 5 176 0 9 915 0 0 15 347 Scallop 179 na 5 176 0 9 915 0 0 15 347C b 2 1 880 4 517 617 3 200 139 39 10 961 Crab 2 1 880 4 517 617 3 200 139 39 10 961 Other 145 11 587 986 16 247 577 3 092 30 34 391 Other 145 11 587 986 16 247 577 3 092 30 34 391Total 7 127 143 295 79 133 112 558 243 797 115 109 69 711 342Total 7 127 143 295 79 133 112 558 243 797 115 109 69 711 342Total value 17 476 154 100 138 663 270 243 246 002 159 124 83 1 000 719Total value 17 476 154 100 138 663 270 243 246 002 159 124 83 1 000 719Q titQuantity t t t t t t t tyFish Live 109 41 741 0 2 37 0 930Fish Live 109 41 741 0 2 37 0 930Tuna 289 6 1 185 7 055 84 0 0 8 888 Tuna 289 6 1 185 7 055 84 0 0 8 888l id Salmonids 55 644 30 110 2 4 895 0 5 750
Swordfish 21 na 398 0 90 0 0 509 Swordfish 21 na 398 0 90 0 0 509Whiting na na 887 0 0 0 0 892 Whiting na na 887 0 0 0 0 892Other fish 435 436 1 389 639 358 1 178 1 5 056 Other fish 435 436 1 389 639 358 1 178 1 5 056Total fish 910 1 128 4 631 7 804 535 6 110 1 22 025Total fish 9 0 8 4 63 7 804 535 6 0 0 5Crustaceans and molluscsRock lobster 69 861 584 822 4 213 329 0 6 916Crustaceans and molluscs Rock lobster 69 861 584 822 4 213 329 0 6 916P 22 2 3 089 114 1 506 2 0 5 393 Prawns 22 2 3 089 114 1 506 2 0 5 393 Abalone 37 1 008 17 369 55 1 662 0 3 149 Abalone 37 1 008 17 369 55 1 662 0 3 149Scallop 5 na 121 0 313 0 0 443 Scallop 5 na 121 0 313 0 0 443Crab 0 30 471 9 250 2 2 801 Crab 0 30 471 9 250 2 2 801O h Other 12 629 80 637 17 90 0 1 735Total 147 2 531 4 363 1 950 6 354 2 084 2 18 436Total 147 2 531 4 363 1 950 6 354 2 084 2 18 436Total quantity 1 056 3 658 8 994 9 754 6 889 8 194 2 40 461Total quantity 1 056 3 658 8 994 9 754 6 889 8 194 2 40 461a State totals include Commonwealth fisheries exports. Exports are identified according to source state or territory, not state or territory in which the product was caught p p g y, y p gor farmed. b Includes Australian Capital Territory and re‐exports. na Not available.or farmed. b Includes Australian Capital Territory and re exports. na Not available.Source: Australian Bureau of Statistics International Trade Australia cat no 5465 0 CanberraSource: Australian Bureau of Statistics, International Trade, Australia, cat. no. 5465.0, Canberra
99
Exports
ABARESAustralian fisheries and aquaculture statistics 2013
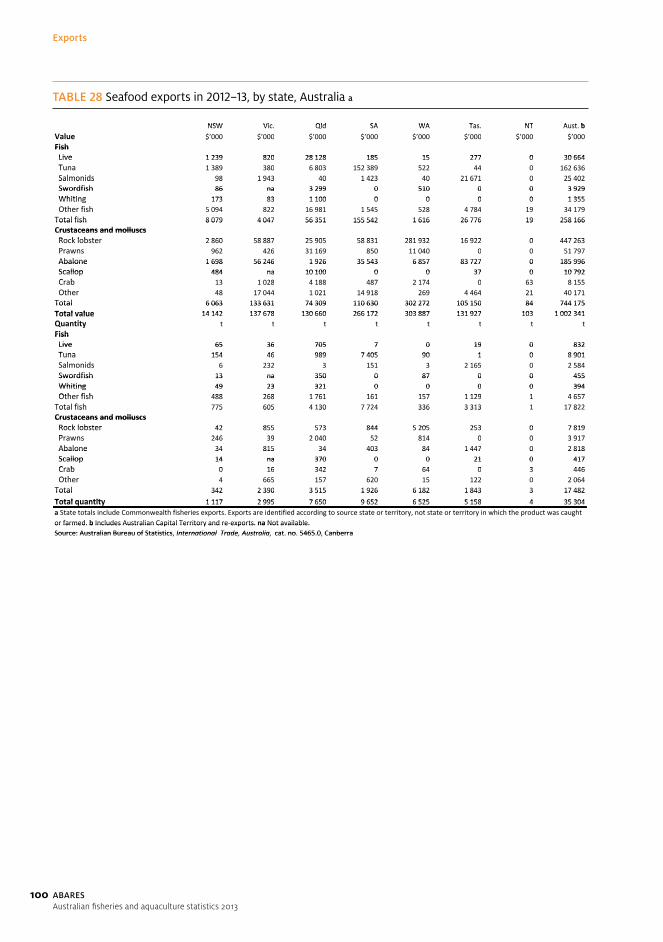
TABLE 28 Seafood exports in 2012–13, by state, Australia a 28 Seafood exports in 2012–13 by state Australia a28Seafoodexportsin2012–13,bystate,AustraliaaNSW Vic Qld SA WA Tas NT Aust bNSW Vic. Qld SA WA Tas. NT Aust. b
Value $’000 $’000 $’000 $’000 $’000 $’000 $’000 $’000$ $ $ $ $ $ $ $FishLive 1 239 820 28 128 185 15 277 0 30 664Fish Live 1 239 820 28 128 185 15 277 0 30 664T 1 389 380 6 803 152 389 522 44 0 162 636 Tuna 1 389 380 6 803 152 389 522 44 0 162 636 Salmonids 98 1 943 40 1 423 40 21 671 0 25 402 Salmonids 98 1 943 40 1 423 40 21 671 0 25 402Swordfish 86 na 3 299 0 510 0 0 3 929 Swordfish 86 na 3 299 0 510 0 0 3 929Whiting 173 83 1 100 0 0 0 0 1 355 Whiting 173 83 1 100 0 0 0 0 1 355O h fi h Other fish 5 094 822 16 981 1 545 528 4 784 19 34 179Total fish 8 079 4 047 56 351 155 542 1 616 26 776 19 258 166Total fish 8 079 4 047 56 351 155 542 1 616 26 776 19 258 166Crustaceans and molluscsRock lobster 2 860 58 887 25 905 58 831 281 932 16 922 0 447 263Crustaceans and molluscs Rock lobster 2 860 58 887 25 905 58 831 281 932 16 922 0 447 263 Prawns 962 426 31 169 850 11 040 0 0 51 797 Abalone 1 698 56 246 1 926 35 543 6 857 83 727 0 185 996 Abalone 1 698 56 246 1 926 35 543 6 857 83 727 0 185 996Scallop 484 na 10 100 0 0 37 0 10 792 Scallop 484 na 10 100 0 0 37 0 10 792C b 13 1 028 4 188 487 2 174 0 63 8 155 Crab 13 1 028 4 188 487 2 174 0 63 8 155 Other 48 17 044 1 021 14 918 269 4 464 21 40 171 Other 48 17 044 1 021 14 918 269 4 464 21 40 171Total 6 063 133 631 74 309 110 630 302 272 105 150 84 744 175Total 6 063 133 631 74 309 110 630 302 272 105 150 84 744 175Total value 14 142 137 678 130 660 266 172 303 887 131 927 103 1 002 341Total value 14 142 137 678 130 660 266 172 303 887 131 927 103 1 002 341Q titQuantity t t t t t t t tyFish Live 65 36 705 7 0 19 0 832Fish Live 65 36 705 7 0 19 0 832Tuna 154 46 989 7 405 90 1 0 8 901 Tuna 154 46 989 7 405 90 1 0 8 901l id Salmonids 6 232 3 151 3 2 165 0 2 584
Swordfish 13 na 350 0 87 0 0 455 Swordfish 13 na 350 0 87 0 0 455Whiting 49 23 321 0 0 0 0 394 Whiting 49 23 321 0 0 0 0 394Other fish 488 268 1 761 161 157 1 129 1 4 657 Other fish 488 268 1 761 161 157 1 129 1 4 657Total fish 775 605 4 130 7 724 336 3 313 1 17 822Total fish 775 605 4 30 7 7 4 336 3 3 3 7 8Crustaceans and molluscsRock lobster 42 855 573 844 5 205 253 0 7 819Crustaceans and molluscs Rock lobster 42 855 573 844 5 205 253 0 7 819P 246 39 2 040 52 814 0 0 3 917 Prawns 246 39 2 040 52 814 0 0 3 917 Abalone 34 815 34 403 84 1 447 0 2 818 Abalone 34 815 34 403 84 1 447 0 2 818Scallop 14 na 370 0 0 21 0 417 Scallop 14 na 370 0 0 21 0 417Crab 0 16 342 7 64 0 3 446 Crab 0 16 342 7 64 0 3 446O h Other 4 665 157 620 15 122 0 2 064Total 342 2 390 3 515 1 926 6 182 1 843 3 17 482Total 342 2 390 3 515 1 926 6 182 1 843 3 17 482Total quantity 1 117 2 995 7 650 9 652 6 525 5 158 4 35 304Total quantity 1 117 2 995 7 650 9 652 6 525 5 158 4 35 304a State totals include Commonwealth fisheries exports. Exports are identified according to source state or territory, not state or territory in which the product was caught p p g y, y p gor farmed. b Includes Australian Capital Territory and re‐exports. na Not available.or farmed. b Includes Australian Capital Territory and re exports. na Not available.Source: Australian Bureau of Statistics International Trade Australia cat no 5465 0 CanberraSource: Australian Bureau of Statistics, International Trade, Australia, cat. no. 5465.0, Canberra
100
Exports
ABARESAustralian fisheries and aquaculture statistics 2013
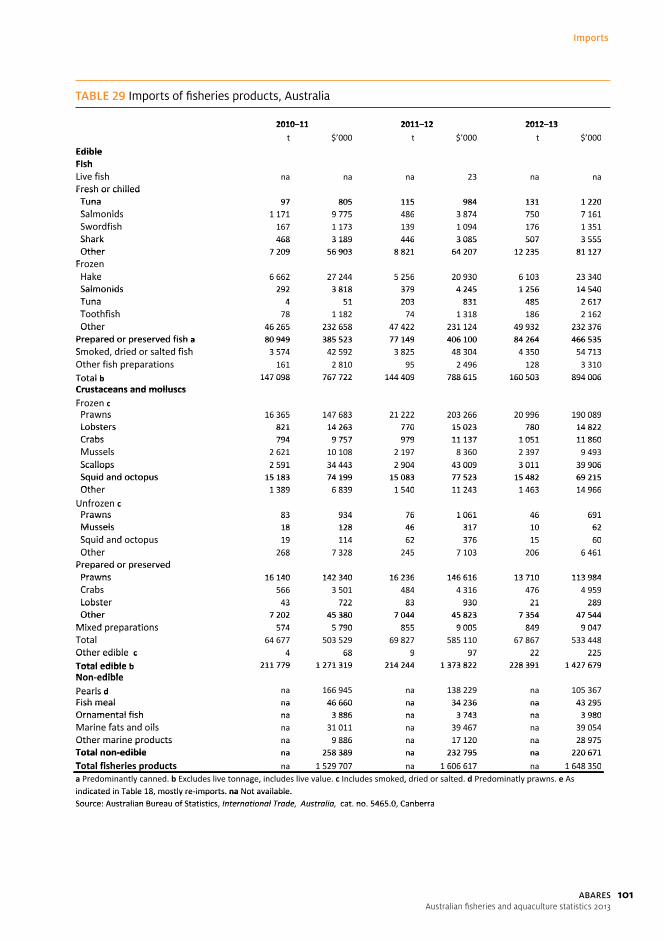
TABLE 29 Imports of fisheries products, Australia 29 Imports of fisheries products Australia29Importsoffisheriesproducts,Australia2010 11 2011 12 2012 13
$ $ $2010–11 2011–12 2012–13
t $’000 t $’000 t $’000$ $ $EdibleEdibleFishLi fi hFishLive fish na na na 23 na naFresh or chilledTuna 97 805 115 984 131 1 220Fresh or chilled Tuna 97 805 115 984 131 1 220Salmonids 1 171 9 775 486 3 874 750 7 161 Salmonids 1 171 9 775 486 3 874 750 7 161 Swordfish 167 1 173 139 1 094 176 1 351 Shark 468 3 189 446 3 085 507 3 555 Shark 468 3 189 446 3 085 507 3 555Other 7 209 56 903 8 821 64 207 12 235 81 127 Other 7 209 56 903 8 821 64 207 12 235 81 127FFrozen Hake 6 662 27 244 5 256 20 930 6 103 23 340 Hake 6 662 27 244 5 256 20 930 6 103 23 340Salmonids 292 3 818 379 4 245 1 256 14 540 Salmonids 292 3 818 379 4 245 1 256 14 540Tuna 4 51 203 831 485 2 617 Tuna 4 51 203 831 485 2 617T thfi h Toothfish 78 1 182 74 1 318 186 2 162 Other 46 265 232 658 47 422 231 124 49 932 232 376 Other 46 265 232 658 47 422 231 124 49 932 232 376Prepared or preserved fish a 80 949 385 523 77 149 406 100 84 264 466 535Prepared or preserved fish a 80 949 385 523 77 149 406 100 84 264 466 535Smoked dried or salted fish 3 574 42 592 3 825 48 304 4 350 54 713Smoked, dried or salted fish 3 574 42 592 3 825 48 304 4 350 54 713h f hOther fish preparations 161 2 810 95 2 496 128 3 310p p
Total b 147 098 767 722 144 409 788 615 160 503 894 006Total b 147 098 767 722 144 409 788 615 160 503 894 006Crustaceans and molluscsCrustaceans and molluscsFFrozen c Prawns 16 365 147 683 21 222 203 266 20 996 190 089 Prawns 16 365 147 683 21 222 203 266 20 996 190 089Lobsters 821 14 263 770 15 023 780 14 822 Lobsters 821 14 263 770 15 023 780 14 822Crabs 794 9 757 979 11 137 1 051 11 860 Crabs 794 9 757 979 11 137 1 051 11 860M l 2 621 10 108 2 197 8 360 2 397 9 493 Mussels 2 621 10 108 2 197 8 360 2 397 9 493 Scallops 2 591 34 443 2 904 43 009 3 011 39 906 Scallops 2 591 34 443 2 904 43 009 3 011 39 906Squid and octopus 15 183 74 199 15 083 77 523 15 482 69 215 Squid and octopus 15 183 74 199 15 083 77 523 15 482 69 215Other 1 389 6 839 1 540 11 243 1 463 14 966 Other 1 389 6 839 1 540 11 243 1 463 14 966Unfrozen c Prawns 83 934 76 1 061 46 691Unfrozen c Prawns 83 934 76 1 061 46 691Mussels 18 128 46 317 10 62 Mussels 18 128 46 317 10 62Sq id and o top s 19 114 62 376 15 60 Squid and octopus 19 114 62 376 15 60 Other 268 7 328 245 7 103 206 6 461Other 68 7 3 8 45 7 03 06 6 46Prepared or preservedPrawns 16 140 142 340 16 236 146 616 13 710 113 984Prepared or preserved Prawns 16 140 142 340 16 236 146 616 13 710 113 984C b 566 3 501 484 4 316 476 4 959 Crabs 566 3 501 484 4 316 476 4 959 Lobster 43 722 83 930 21 289 Lobster 43 722 83 930 21 289Other 7 202 45 380 7 044 45 823 7 354 47 544 Other 7 202 45 380 7 044 45 823 7 354 47 544Mixed preparations 574 5 790 855 9 005 849 9 047Mixed preparations 574 5 790 855 9 005 849 9 047T lTotal 64 677 503 529 69 827 585 110 67 867 533 448Other edible c 4 68 9 97 22 225Other edible c 4 68 9 97 22 225Total edible b 211 779 1 271 319 214 244 1 373 822 228 391 1 427 679Total edible b 211 779 1 271 319 214 244 1 373 822 228 391 1 427 679Non edibleNon‐ediblePearls d na 166 945 na 138 229 na 105 367Pearls dFish meal na 46 660 na 34 236 na 43 295Fish meal na 46 660 na 34 236 na 43 295Ornamental fish na 3 886 na 3 743 na 3 980Ornamental fish na 3 886 na 3 743 na 3 980M i f t d il 31 011 39 467 39 054Marine fats and oils na 31 011 na 39 467 na 39 054Other marine products na 9 886 na 17 120 na 28 975Other marine products na 9 886 na 17 120 na 28 975Total non‐edible na 258 389 na 232 795 na 220 671Total non‐edible na 258 389 na 232 795 na 220 671Total fisheries products na 1 529 707 na 1 606 617 na 1 648 350Total fisheries products na 1 529 707 na 1 606 617 na 1 648 350a Predominantly canned. b Excludes live tonnage, includes live value. c Includes smoked, dried or salted. d Predominatly prawns. e As y g , , y pindicated in Table 18, mostly re‐imports. na Not available.indicated in Table 18, mostly re‐imports. na Not available.Source: Australian Bureau of Statistics International Trade Australia cat no 5465 0 CanberraSource: Australian Bureau of Statistics, International Trade, Australia, cat. no. 5465.0, Canberra
101
Imports
ABARESAustralian fisheries and aquaculture statistics 2013

TABLE 30 Imports of fish, Australia 30 Imports of fish Australia30Importsoffish,Australia2010 11 2011 12 2012 132010–11 2011–12 2012–13
t $’000 t $’000 t $’000$ $ $Live fish na na na 23 na naLive fish na na na 23 na naTunaTunaFresh or chilled 97 805 115 984 131 1 220Fresh or chilledFrozen 4 51 203 831 485 2 617Frozen 4 51 203 831 485 2 617Prepared or preserved a 45 533 199 967 40 458 203 714 46 315 254 349Prepared or preserved a 45 533 199 967 40 458 203 714 46 315 254 349T t l 45 633 200 823 40 775 205 529 46 931 258 185Total 45 633 200 823 40 775 205 529 46 931 258 185SalmonidsFresh or chilled 1 171 9 775 486 3 874 750 7 161SalmonidsFresh or chilled 1 171 9 775 486 3 874 750 7 161Frozen 292 3 818 379 4 245 1 256 14 540Frozen 292 3 818 379 4 245 1 256 14 540S k dSmoked 1 155 21 210 1 544 26 859 2 250 38 216Prepared or preserved 7 319 49 599 7 778 56 850 7 689 58 916Prepared or preserved 7 319 49 599 7 778 56 850 7 689 58 916Total 9 938 84 402 10 186 91 828 11 945 118 833Total 9 938 84 402 10 186 91 828 11 945 118 833HakeHakeFrozen 6 662 27 244 5 256 20 930 6 103 23 340Fro enTotal b 6 662 27 244 5 258 20 946 6 107 23 366Total b 6 662 27 244 5 258 20 946 6 107 23 366SwordfishF h hill d 167 1 173 139 1 094 176 1 351SwordfishFresh or chilled 167 1 173 139 1 094 176 1 351Frozen 27 217 10 105 24 256Frozen 27 217 10 105 24 256Other preparations 7 76 2 13 10 95Other preparations 7 76 2 13 10 95Total 201 1 465 151 1 211 211 1 701Total 201 1 465 151 1 211 211 1 701T thfi hToothfishFrozen 78 1 182 74 1 318 186 2 162Frozen 78 1 182 74 1 318 186 2 162Other preparations b 8 195 na 0 0 0Other preparations b 8 195 na 0 0 0Total 87 1 377 74 1 318 186 2 162Total 87 1 377 74 1 318 186 2 162
iHerringsFresh or chilled 0 0 1 7 1 4
gFresh or chilled 0 0 1 7 1 4Frozen 147 101 1 11 889 654Frozen 147 101 1 11 889 654S k d lt d d i d 101 644 67 502 88 609Smoked, salted or dried 101 644 67 502 88 609Prepared or preserved 761 3 577 802 3 637 833 3 834Prepared or preserved 761 3 577 802 3 637 833 3 834Total 1 009 4 322 871 4 156 1 811 5 101Total 1 009 4 322 871 4 156 1 811 5 101
Continued
102
Imports
ABARESAustralian fisheries and aquaculture statistics 2013

TABLE 30 Imports of fish, Australia continued
t $’000 t $’000 t $’000
Fresh or chilled 468 3 189 446 3 085 507 3 555Frozen 0 4 6 52 11 85Smoked, salted or dried c 10 1 220 29 882 16 979Total 479 4 413 481 4 019 534 4 619
Fresh or chilled 7 201 56 707 8 818 64 184 12 229 81 097Frozen 46 091 232 337 47 405 230 956 49 009 231 380
Sardines 4 454 18 039 3 735 16 366 4 018 18 008 Anchovies 979 9 898 1 002 9 665 967 9 754 Mackerel 1 173 4 247 1 202 4 557 1 343 4 801 Other 20 730 100 196 22 172 111 311 23 099 116 874
Liver and roes 13 249 23 313 33 404 Anchovies 21 157 26 131 79 555 Cod 143 1 407 122 1 222 134 1 313 Other 2 133 17 704 2 015 18 396 1 749 12 637Caviar and pastes 154 2 735 92 2 483 117 3 215Total 83 090 443 676 86 612 459 585 92 779 480 038Total fish d 147 098 769 089 144 409 788 610 160 503 866 483a Predominantly canned. b Includes fresh or chilled. c Predominantly dried shark fins. d Excludes live tonnage but includes live value.Source: Australian Bureau of Statistics, International Trade, Australia, cat. no. 5465.0, Canberra.
2010–11 2011–12 2012–13
30Importsoffish,Australiacontinued
Shark
Other fish
Prepared or preserved fish a
Smoked, salted or dried
103
Imports
ABARESAustralian fisheries and aquaculture statistics 2013

TABLE 31 Imports of crustaceans and molluscs, Australia
t $’000 t $’000 t $’000
Frozen a 16 365 147 683 21 222 203 266 20 996 190 089Unfrozen a 83 934 76 1 061 46 691Prepared or preserved 16 140 142 340 16 236 146 616 13 710 113 984Total 32 588 290 957 37 534 350 943 34 752 304 764
Frozen a 821 14 263 770 15 023 780 14 822Unfrozen a 0 5 6 60 5 207Prepared or preserved 43 722 83 930 21 289Total 864 14 989 859 16 013 807 15 318
Frozen a 794 9 757 979 11 137 1 051 11 860Unfrozen a 0 12 4 70 0 4Prepared or preserved 566 3 501 484 4 316 476 4 959Total 1 360 13 269 1 467 15 523 1 527 16 824
Frozen a 2 621 10 108 2 197 8 360 2 397 9 493Unfrozen a 18 128 46 317 10 62Total b 2 639 10 236 2 792 11 690 3 685 17 102
Frozen a 2 591 34 443 2 904 43 009 3 011 39 906Unfrozen a 3 33 22 284 13 218Total b 2 594 34 476 2 952 43 584 3 121 41 062
Frozen a 15 183 74 199 15 083 77 523 15 482 69 215Unfrozen a 19 114 62 376 15 60Total b 15 202 74 313 16 972 90 377 19 860 97 658
Continued
Squid and octopus
31Importsofcrustaceansandmolluscs,Australia
Prawns
Lobsters
Crabs
Mussels
Scallops
2010–11 2011–12 2012–13
104
Imports
ABARESAustralian fisheries and aquaculture statistics 2013
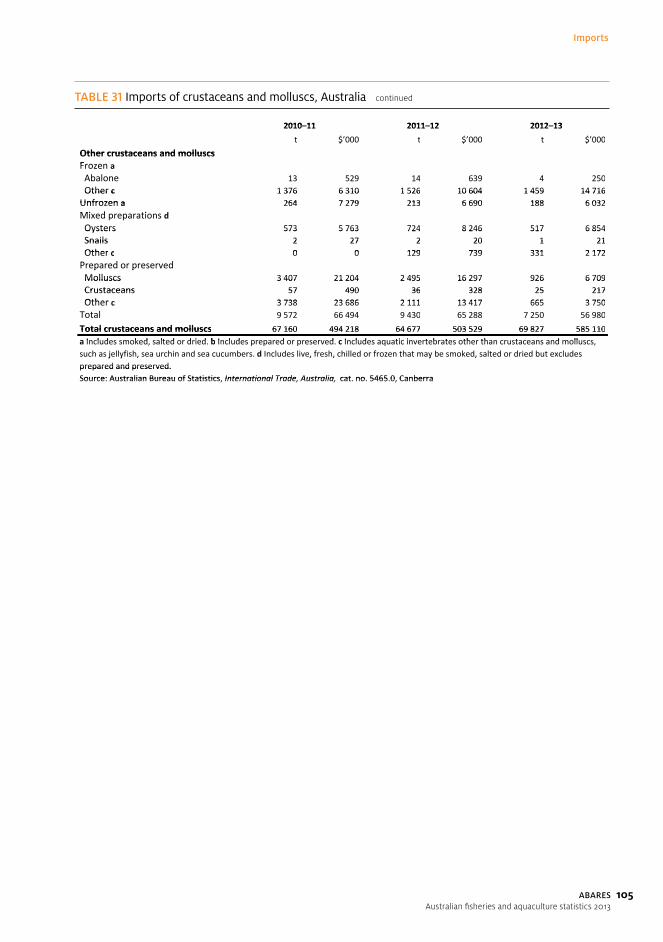
TABLE 31 Imports of crustaceans and molluscs, Australia continued31 Imports of crustaceans and molluscs Australia continued31Importsofcrustaceansandmolluscs,Australiacontinued2010 11 2011 12 2012 132010–11 2011–12 2012–13
t $’000 t $’000 t $’000$ $ $Other crustaceans and molluscsOther crustaceans and molluscsFrozen aFrozen a Abalone 13 529 14 639 4 250 Other c 1 376 6 310 1 526 10 604 1 459 14 716 Other c 1 376 6 310 1 526 10 604 1 459 14 716Unfrozen a 264 7 279 213 6 690 188 6 032Unfrozen a 264 7 279 213 6 690 188 6 032Mi d ti dMixed preparations d Oysters 573 5 763 724 8 246 517 6 854 Oysters 573 5 763 724 8 246 517 6 854Snails 2 27 2 20 1 21 Snails 2 27 2 20 1 21Other c 0 0 129 739 331 2 172 Other c 0 0 129 739 331 2 172P d dPrepared or preserved Molluscs 3 407 21 204 2 495 16 297 926 6 709
p p Molluscs 3 407 21 204 2 495 16 297 926 6 709Crustaceans 57 490 36 328 25 217 Crustaceans 57 490 36 328 25 217Other 3 738 23 686 2 111 13 417 665 3 750 Other c 3 738 23 686 2 111 13 417 665 3 750Total 9 572 66 494 9 430 65 288 7 250 56 980Total crustaceans and molluscs 67 160 494 218 64 677 503 529 69 827 585 110Total crustaceans and molluscs 67 160 494 218 64 677 503 529 69 827 585 110a I l d k d lt d d i d b I l d d d c I l d ti i t b t th th t d lla Includes smoked, salted or dried. b Includes prepared or preserved. c Includes aquatic invertebrates other than crustaceans and molluscs, such as jellyfish, sea urchin and sea cucumbers. d Includes live, fresh, chilled or frozen that may be smoked, salted or dried but excludes j y , , , y ,prepared and preserved. prepared and preserved. Source: Australian Bureau of Statistics International Trade Australia cat no 5465 0 CanberraSource: Australian Bureau of Statistics, International Trade, Australia, cat. no. 5465.0, Canberra
105
Imports
ABARESAustralian fisheries and aquaculture statistics 2013

TABLE 32 Imports of edible fish, by source, Australia32Importsofediblefish,bysource,Australiat $’000 t $’000 t $’000
Fiji 48 396 18 145 2 28 Indonesia 44 370 39 319 31 323 Maldives na na 42 378 75 719 New Zealand 5 37 16 142 9 68 Other 0 2 na na 14 81Total 97 805 115 984 131 1 220
Indonesia na na 18 206 80 1 001 Japan 0 34 0 76 1 112 Other 3 16 184 548 404 1 504Total 4 51 203 831 485 2 617
New Zealand 30 273 37 465 132 1 509 Norway 47 728 197 2 071 773 9 018 Other 216 2 818 145 1 709 352 4 013Total 292 3 818 379 4 245 1 256 14 540
Argentina 1 599 4 641 644 1 695 564 845 China 246 669 369 897 503 1 414 Namibia 1 331 6 179 1 008 4 357 1 220 5 200 New Zealand 1 761 6 326 1 771 6 189 1 763 5 114 South Africa 1 647 9 087 1 396 7 541 1 975 10 456 Other 79 341 67 250 77 311Total 6 662 27 244 5 256 20 930 6 103 23 340
Frozen New Zealand 2 20 10 226 23 165 Other a 76 1 162 65 1 092 163 1 997Total 78 1 182 74 1 318 186 2 162
Continued
Toothfish
Fresh or chilled
Frozen
Fresh or chilled
Frozen
2010–11 2011–12 2012–13
Tuna
Salmonids
Hake
106
Imports
ABARESAustralian fisheries and aquaculture statistics 2013

32 Imports of edible fish by source Australia continued32Importsofediblefish,bysource,Australiacontinued2010 11 2011 12 2012 132010–11 2011–12 2012–13
t $’000 t $’000 t $’000$ $ $SwordfishSwordfishFresh or chilledI d iFresh or chilled Indonesia 18 74 17 155 42 366 New Zealand 149 1 099 123 938 126 934 New Zealand 149 1 099 123 938 126 934Other 0 0 0 0 7 50 Other 0 0 0 0 7 50Total 167 1 173 139 1 094 176 1 351Total 167 1 173 139 1 094 176 1 351FrozenThailand 6 22 0 0 0 0 Thailand 6 22 0 0 0 0Vietnam 21 193 8 100 20 232 Vietnam 21 193 8 100 20 232Oth 0 23 Other 0 1 1 5 4 23Total 27 217 10 105 24 256Total 27 217 10 105 24 256HerringsHerringsFresh or chilledFresh or chilled Denmark 0 0 1 2 1 4 Denmark 0 0 1 2 1 4Other 0 0 0 5 0 0 Other 0 0 0 5 0 0Total 0 0 1 7 1 4Total 0 0 1 7 1 4FFrozen Philippines 1 1 0 0 0 1 Philippines 1 1 0 0 0 1Other 147 100 1 11 888 653 Other 147 100 1 11 888 653Total 147 101 1 11 889 654Total 147 101 1 11 889 654Sh kSharkFresh or chilledNew Zealand 465 3 163 444 3 078 507 3 555Fresh or chilled New Zealand 465 3 163 444 3 078 507 3 555Other 4 26 1 7 0 0 Other 4 26 1 7 0 0Total 468 3 189 446 3 085 507 3 555Total 468 3 189 446 3 085 507 3 555FrozenNew Zealand 0 0 6 51 11 85Frozen New Zealand 0 0 6 51 11 85Oth Other 0 4 0 1 0 0Total 0 4 6 52 11 85Total 0 4 6 52 11 85aMostly re importsa Mostly re‐imports. S A li B f S i i I i l T d A li 5465 0 C bSource: Australian Bureau of Statistics, International Trade, Australia, cat. no. 5465.0, Canberra
TABLE 32 Imports of edible fish, by source, Australia continued
107
Imports
ABARESAustralian fisheries and aquaculture statistics 2013

TABLE 33 Imports of prepared or preserved fish products, by source, Australia 33 Imports of prepared or preserved fish products by source Australia33Importsofpreparedorpreservedfishproducts,bysource,Australia2010 11 2011 12 2012 132010–11 2011–12 2012–13
t $’000 t $’000 t $’000$ $ $Prepared and preserved fishPrepared and preserved fish TunaTuna a China 181 367 238 596 174 503Indonesia 489 1 650 808 3 443 1 963 12 449 Indonesia 489 1 650 808 3 443 1 963 12 449Philippines 83 578 534 2 902 650 3 764 Philippines 83 578 534 2 902 650 3 764Th il d 44 228 193 838 38 497 194 205 43 096 234 548 Thailand 44 228 193 838 38 497 194 205 43 096 234 548 Other 552 3 534 382 2 568 432 3 085 Other 552 3 534 382 2 568 432 3 085Total 45 533 199 967 40 458 203 714 46 315 254 349Total 45 533 199 967 40 458 203 714 46 315 254 349SalmonidsC dSalmonids Canada 1 050 8 542 655 5 764 444 4 241 Norway 221 3 212 321 4 198 269 3 074 Norway 221 3 212 321 4 198 269 3 074Thailand 1 313 10 228 1 628 13 313 1 686 13 087 Thailand 1 313 10 228 1 628 13 313 1 686 13 087United States 4 254 24 750 4 959 32 093 5 105 37 257 United States 4 254 24 750 4 959 32 093 5 105 37 257 Other 482 2 867 215 1 482 184 1 257Total 7 319 49 599 7 778 56 850 7 689 58 916Total 7 319 49 599 7 778 56 850 7 689 58 916HerringsC d 217 1 166 191 1 013 206 1 108Herrings Canada 217 1 166 191 1 013 206 1 108 Estonia 201 513 220 564 207 531 Estonia 201 513 220 564 207 531Germany 229 1 350 265 1 492 285 1 492 Germany 229 1 350 265 1 492 285 1 492Other 114 548 126 567 135 704 Other 114 548 126 567 135 704T l Total 761 3 577 802 3 637 833 3 834SardinesCanada 867 3 288 1 004 3 331 988 3 322Sardines Canada 867 3 288 1 004 3 331 988 3 322Poland 677 3 641 439 3 965 377 3 533 Poland 677 3 641 439 3 965 377 3 533h l d Thailand 1 829 5 604 1 274 3 933 1 348 4 717
United Kingdom 203 1 523 205 1 440 239 1 650 United Kingdom 203 1 523 205 1 440 239 1 650Other 878 3 983 813 3 697 1 065 4 785 Other 878 3 983 813 3 697 1 065 4 785T t l 4 454 18 039 3 735 16 366 4 018 18 008Total 4 454 18 039 3 735 16 366 4 018 18 008AnchoviesChile 236 1 639 182 1 323 152 1 371Anchovies Chile 236 1 639 182 1 323 152 1 371Italy 468 4 706 537 5 019 452 4 621 Italy 468 4 706 537 5 019 452 4 621M 121 1 379 101 1 173 134 1 261 Morocco 121 1 379 101 1 173 134 1 261 Spain 94 1 650 75 1 286 59 1 231 Spain 94 1 650 75 1 286 59 1 231Other 60 524 108 864 170 1 270 Other 60 524 108 864 170 1 270Total 979 9 898 1 002 9 665 967 9 754Total 979 9 898 1 002 9 665 967 9 754M k lMackerels Germany 67 502 82 738 52 428 Germany 67 502 82 738 52 428Malaysia 101 331 109 407 112 441 Malaysia 101 331 109 407 112 441Thailand 444 1 104 459 1 152 718 1 748 Thailand 444 1 104 459 1 152 718 1 748 United Kingdom 107 689 94 619 100 718United Kingdom 07 689 94 6 9 00 7 8Other 453 1 620 457 1 641 360 1 466 Other 453 1 620 457 1 641 360 1 466Total 1 173 4 247 1 202 4 557 1 343 4 801Total 1 173 4 247 1 202 4 557 1 343 4 801OthOther China 3 383 15 724 4 194 19 953 4 292 21 064 China 3 383 15 724 4 194 19 953 4 292 21 064Malaysia 2 854 18 494 3 758 23 559 3 741 22 761 Malaysia 2 854 18 494 3 758 23 559 3 741 22 761New Zealand 5 635 29 749 4 730 26 598 4 164 25 588 New Zealand 5 635 29 749 4 730 26 598 4 164 25 588Th il d Thailand 5 585 18 834 5 795 20 177 6 537 21 439 Other 3 273 17 395 3 695 21 025 4 365 26 021 Other 3 273 17 395 3 695 21 025 4 365 26 021Total 20 730 100 196 22 172 111 311 23 099 116 874Total 20 730 100 196 22 172 111 311 23 099 116 874a Predominantly canned. ySource: Australian Bureau of Statistics, International Trade, Australia, cat. no. 5465.0, CanberraSource: Australian Bureau of Statistics, International Trade, Australia, cat. no. 5465.0, Canberra
108
Imports
ABARESAustralian fisheries and aquaculture statistics 2013

TABLE 34 Imports of dried, salted or smoked fish, by source, Australia 34 Imports of dried salted or smoked fish by source Australia34Importsofdried,saltedorsmokedfish,bysource,Australia2010 11 2011 12 2012 132010–11 2011–12 2012–13
t $’000 t $’000 t $’000$ $ $Smoked salted or driedSmoked, salted or driedSalmonids (smoked only)Salmonids (smoked only) Denmark 624 11 931 961 17 683 1 544 27 341 New Zealand 45 960 45 930 64 1 316 New Zealand 45 960 45 930 64 1 316Norway 464 7 917 519 7 887 603 8 930 Norway 464 7 917 519 7 887 603 8 930Oth 23 403 18 359 39 629 Other 23 403 18 359 39 629Total 1 155 21 210 1 544 26 859 2 250 38 216Total 1 155 21 210 1 544 26 859 2 250 38 216HerringsGreece 15 128 4 35 8 67Herrings Greece 15 128 4 35 8 67Phili i Philippines 5 23 6 28 6 24pp United Kingdom 76 470 51 418 70 499 United Kingdom 76 470 51 418 70 499Other 4 23 5 21 5 19 Other 4 23 5 21 5 19Total 101 644 67 502 88 609Total 101 644 67 502 88 609Sharks a China 3 544 3 363 2 431 China 3 544 3 363 2 431Hong Kong 1 294 0 37 3 41 Hong Kong 1 294 0 37 3 41I d i 4 138 9 253 2 284 Indonesia 4 138 9 253 2 284 Other 2 244 17 228 9 223 Other 2 244 17 228 9 223Total 10 1 220 29 882 16 979Total 10 1 220 29 882 16 979AchoviesGAchovies Greece 16 118 11 48 20 157 Malaysia 3 17 2 11 2 13 Malaysia 3 17 2 11 2 13Other 2 22 13 72 57 386 Other 2 22 13 72 57 386Total 21 157 26 131 79 555Total 21 157 26 131 79 555
dCod Italy 6 40 5 43 3 34 Italy 6 40 5 43 3 34Norway 62 669 76 809 45 462 Norway 62 669 76 809 45 462P t l 56 506 34 317 67 556 Portugal 56 506 34 317 67 556 Other 19 192 6 53 19 261 Other 19 192 6 53 19 261Total 143 1 407 122 1 222 134 1 313Total 143 1 407 122 1 222 134 1 313Livers and roesGLivers and roes Greece 1 11 6 18 17 48 Japan 11 218 12 233 16 328 Japan 11 218 12 233 16 328Other 1 20 5 62 1 28 Other 1 20 5 62 1 28Total 13 249 23 313 33 404Total 13 249 23 313 33 404
hOther China 74 1 101 36 588 21 469 China 74 1 101 36 588 21 469Denmark 187 3 440 276 4 839 71 795 Denmark 187 3 440 276 4 839 71 795Rep blic of Korea 99 772 93 721 81 708 Republic of Korea 99 772 93 721 81 708 Norway 127 2 063 205 3 068 140 1 625 Norway 127 2 063 205 3 068 140 1 625South Africa 864 5 036 798 4 707 785 4 677 South Africa 864 5 036 798 4 707 785 4 677Other 782 5 292 607 4 473 650 4 363 Other 782 5 292 607 4 473 650 4 363Total 2 133 17 704 2 015 18 396 1 749 12 637o aa Predominantly dried shark fin.a Predominantly dried shark fin. Source: Australian Bureau of Statistics International Trade Australia cat no 5465 0 CanberraSource: Australian Bureau of Statistics, International Trade, Australia, cat. no. 5465.0, Canberra
109
Imports
ABARESAustralian fisheries and aquaculture statistics 2013

TABLE 35 Imports of major crustaceans products, by source, Australia 35 Imports of major crustaceans products by source Australia35Importsofmajorcrustaceansproducts,bysource,Australia2010 11 2011 12 2012 132010–11 2011–12 2012–13
t $’000 t $’000 t $’000$ $ $PrawnsPrawnsFrozen aFrozen a China 4 655 42 358 9 061 84 549 6 764 55 046Malaysia 3 468 29 013 2 373 22 601 3 296 31 549 Malaysia 3 468 29 013 2 373 22 601 3 296 31 549Thailand 5 000 37 991 5 153 42 148 5 867 51 227 Thailand 5 000 37 991 5 153 42 148 5 867 51 227Vi t 2 215 25 728 3 050 35 673 3 646 37 224 Vietnam 2 215 25 728 3 050 35 673 3 646 37 224 Other 1 027 12 592 1 584 18 294 1 423 15 043 Other 1 027 12 592 1 584 18 294 1 423 15 043Total 16 365 147 683 21 222 203 266 20 996 190 089Total 16 365 147 683 21 222 203 266 20 996 190 089Prepared or preservedChiPrepared or preserved China 3 924 30 081 3 496 26 676 2 558 19 413 Thailand 5 129 43 901 6 264 57 404 4 971 44 473 Thailand 5 129 43 901 6 264 57 404 4 971 44 473Vietnam 6 382 63 371 5 738 56 558 5 622 45 589 Vietnam 6 382 63 371 5 738 56 558 5 622 45 589Other 705 4 987 738 5 979 558 4 509 Other 705 4 987 738 5 979 558 4 509
lTotal 16 140 142 340 16 236 146 616 13 710 113 984LobstersLobstersFrozen aC b 51 1 470 54 1 391 35 847Frozen a Cuba 51 1 470 54 1 391 35 847 Papua New Guinea 88 2 745 55 1 899 52 1 907 Papua New Guinea 88 2 745 55 1 899 52 1 907United States 285 4 837 212 4 710 186 3 332 United States 285 4 837 212 4 710 186 3 332Vietnam 163 2 359 163 2 021 127 1 835 Vietnam 163 2 359 163 2 021 127 1 835Oth Other 234 2 853 287 5 002 380 6 902Total 821 14 263 770 15 023 780 14 822Total 821 14 263 770 15 023 780 14 822Prepared or preservedJapan 1 24 1 20 0 0Prepared or preserved Japan 1 24 1 20 0 0 Taiwan 42 697 51 846 15 248 Other 0 0 32 64 0 0 Other 0 0 32 64 0 0Total 43 722 83 930 21 289Total 43 722 83 930 21 289CrabsCrabsFrozen aChile 72 1 006 148 2 393 112 1 828 Chile 72 1 006 148 2 393 112 1 828Myanmar 296 2 391 356 2 837 400 4 113 Myanmar 296 2 391 356 2 837 400 4 113Th il d 162 2 188 81 1 247 55 1 062 Thailand 162 2 188 81 1 247 55 1 062 Other 264 4 172 393 4 660 483 4 856 Other 264 4 172 393 4 660 483 4 856Total 794 9 757 979 11 137 1 051 11 860Total 794 9 757 979 11 137 1 051 11 860Prepared or preserved
d iPrepared or preserved Indonesia 71 1 089 133 1 712 138 2 257 Thailand 206 1 119 92 785 99 821 Thailand 206 1 119 92 785 99 821Vietnam 90 726 181 1 095 128 834 Vietnam 90 726 181 1 095 128 834Other 199 566 78 724 111 1 048 Other 199 566 78 724 111 1 048Total 566 3 501 484 4 316 476 4 959a Includes smoked, salted or dried.a Includes smoked, salted or dried.Source: Australian Bureau of Statistics International Trade Australia cat no 5465 0 CanberraSource: Australian Bureau of Statistics, International Trade, Australia, cat. no. 5465.0, Canberra
110
Imports
ABARESAustralian fisheries and aquaculture statistics 2013

TABLE 36 Imports of major molluscs products, by source, Australia 36 Imports of major molluscs products by source Australia36Importsofmajormolluscsproducts,bysource,Australia2010 11 2011 12 2012 132010–11 2011–12 2012–13
t $’000 t $’000 t $’000$ $ $MusselsMusselsFrozenFrozen Chile 1 32 56 173 180 643 New Zealand 2 566 9 733 2 117 8 083 2 192 8 775 New Zealand 2 566 9 733 2 117 8 083 2 192 8 775Vietnam 26 69 16 53 23 58 Vietnam 26 69 16 53 23 58Oth 28 274 8 50 3 17 Other 28 274 8 50 3 17Total 2 621 10 108 2 197 8 360 2 397 9 493Total 2 621 10 108 2 197 8 360 2 397 9 493UnfrozenUnfrozenNew Zealand 18 128 46 315 10 62 New Zealand 18 128 46 315 10 62Oth 0 0 0 2 0 0 Other 0 0 0 2 0 0Total 18 128 46 317 10 62Total 18 128 46 317 10 62ScallopsFrozenScallops
ChiFrozen China 1 387 16 482 1 361 17 578 1 918 22 332 Japan 508 8 120 550 10 080 527 7 765 Japan 508 8 120 550 10 080 527 7 765Thailand 162 1 254 362 4 082 80 882 Thailand 162 1 254 362 4 082 80 882United States 247 4 577 193 3 741 259 4 819 United States 247 4 577 193 3 741 259 4 819 Other 287 4 011 438 7 528 227 4 108Total 2 591 34 443 2 904 43 009 3 011 39 906Total 2 591 34 443 2 904 43 009 3 011 39 906UnfrozenTh il d 3 33 22 279 0 0Unfrozen Thailand 3 33 22 279 0 0 Other 0 0 0 5 13 218 Other 0 0 0 5 13 218Total 3 33 22 284 13 218Total 3 33 22 284 13 218Squid and octopusFSquid and octopusFrozen China 7 965 40 414 8 164 40 896 8 677 34 676 China 7 965 40 414 8 164 40 896 8 677 34 676Malaysia 923 3 827 852 4 372 754 3 974 Malaysia 923 3 827 852 4 372 754 3 974New Zealand 1 982 9 424 1 377 7 310 1 711 7 379 New Zealand 1 982 9 424 1 377 7 310 1 711 7 379 Taiwan 532 3 153 474 2 602 648 3 267 Thailand 1 589 8 380 1 636 9 748 1 524 9 577 Thailand 1 589 8 380 1 636 9 748 1 524 9 577Vietnam 707 2 724 1 074 5 230 599 2 988 Vietnam 707 2 724 1 074 5 230 599 2 988Other 1 485 6 278 1 507 7 364 1 568 7 353 Other 1 485 6 278 1 507 7 364 1 568 7 353 Total 15 183 74 199 15 083 77 523 15 482 69 215Total 5 83 74 99 5 083 77 5 3 5 48 69 5UnfrozenChina 0 0 55 317 10 32Unfrozen China 0 0 55 317 10 32N Z l d 2 16 1 11 1 4 New Zealand 2 16 1 11 1 4 South Africa 17 98 0 0 4 25 South Africa 17 98 0 0 4 25Other 0 0 6 48 0 0 Other 0 0 6 48 0 0Total 19 114 62 376 15 60 Total 19 114 62 376 15 60O h llOther molluscs aPrepared or preservedChina 1 184 7 219 978 6 695 515 3 813Prepared or preserved China 1 184 7 219 978 6 695 515 3 813Malaysia 242 1 707 142 964 28 420 Malaysia 242 1 707 142 964 28 420 New Zealand 1 232 8 187 787 5 133 32 219Thailand 179 996 251 1 345 256 1 387 Thailand 179 996 251 1 345 256 1 387Other 571 3 095 337 2 160 94 869 Other 571 3 095 337 2 160 94 869Total 3 407 21 204 2 495 16 297 926 6 709a Includes aquatic invertebrates.a Includes aquatic invertebrates. Source: Australian Bureau of Statistics International Trade Australia cat no 5465 0 CanberraSource: Australian Bureau of Statistics, International Trade, Australia, cat. no. 5465.0, Canberra
111
Imports
ABARESAustralian fisheries and aquaculture statistics 2013

TABLE 37 Imports of fisheries products, by source, Australia 37 Imports of fisheries products by source Australia37Importsoffisheriesproducts,bysource,Australia2010 11 2011 12 2012 132010–11 2011–12 2012–13
t $’000 t $’000 t $’000$ $ $Edible (excluding live fish)Argentina 2 153 7 263 1 633 6 341 1 040 3 166Edible (excluding live fish) Argentina 2 153 7 263 1 633 6 341 1 040 3 166 Canada 2 309 14 899 2 107 14 228 1 884 12 625Chile 767 4 477 816 5 549 876 5 301 Chile 767 4 477 816 5 549 876 5 301China 28 902 185 607 34 188 231 496 32 594 196 493 China 28 902 185 607 34 188 231 496 32 594 196 493D k 1 085 18 813 1 496 25 256 1 981 32 153 Denmark 1 085 18 813 1 496 25 256 1 981 32 153 Germany 590 5 001 550 4 166 634 4 341 Germany 590 5 001 550 4 166 634 4 341India 1 257 2 458 2 393 6 738 3 440 5 877 India 1 257 2 458 2 393 6 738 3 440 5 877Indonesia 3 821 27 949 4 801 36 296 6 342 50 865 Indonesia 3 821 27 949 4 801 36 296 6 342 50 865I l Italy 606 6 430 673 6 506 584 6 520y Japan 1 085 14 388 1 173 18 055 1 087 14 742 Japan 1 085 14 388 1 173 18 055 1 087 14 742Korea Republic of 1 280 6 221 1 067 6 589 1 202 7 061 Korea, Republic of 1 280 6 221 1 067 6 589 1 202 7 061Malaysia 9 950 71 184 9 918 73 188 10 823 80 965 Malaysia 9 950 71 184 9 918 73 188 10 823 80 965 Myanmar 1 222 7 906 1 317 8 544 1 528 10 664 Myanmar 1 222 7 906 1 317 8 544 1 528 10 664Namibia 1 443 6 728 1 205 5 274 1 588 6 815 Namibia 1 443 6 728 1 205 5 274 1 588 6 815New Zealand 33 530 209 979 31 669 197 275 32 700 206 286 New Zealand 33 530 209 979 31 669 197 275 32 700 206 286N 1 640 24 684 2 011 2 0 4 2 404 29 92 Norway 1 640 24 684 2 011 27 054 2 404 29 925y Philippines 684 3 003 1 163 5 472 1 263 6 641 Philippines 684 3 003 1 163 5 472 1 263 6 641Poland 793 4 535 543 4 452 573 5 280 Poland 793 4 535 543 4 452 573 5 280Singapore 761 3 984 715 3 924 639 3 663 Singapore 761 3 984 715 3 924 639 3 663
h f South Africa 4 418 28 231 4 939 31 315 5 603 35 101 Taiwan 6 333 39 465 6 295 38 931 7 947 48 147 Taiwan 6 333 39 465 6 295 38 931 7 947 48 147Thailand 68 440 340 213 63 528 362 148 68 700 399 778 Thailand 68 440 340 213 63 528 362 148 68 700 399 778U it d Ki d 459 3 267 431 3 195 487 3 779 United Kingdom 459 3 267 431 3 195 487 3 779 United States 5 904 39 894 6 182 45 143 7 050 52 151 United States 5 904 39 894 6 182 45 143 7 050 52 151Viet Nam 28 278 161 683 29 706 174 499 30 560 163 097 Viet Nam 28 278 161 683 29 706 174 499 30 560 163 097Other 4 069 33 056 3 726 32 165 4 865 36 240 Other 4 069 33 056 3 726 32 165 4 865 36 240T t l 2 9 2 3 9 2 2 3 3 99 228 39 2 6 9Total 211 779 1 271 319 214 244 1 373 799 228 391 1 427 679Non‐edibleChile na 4 133 na 2 461 na 11 388Non edible Chile na 4 133 na 2 461 na 11 388China na 4 221 na 5 651 na 8 970 China na 4 221 na 5 651 na 8 970
d Ecuador na 5 952 na 7 354 na 10 449 French Polynesia na 1 613 na 1 872 na 1 339 French Polynesia na 1 613 na 1 872 na 1 339Hong Kong na 2 791 na 3 872 na 3 944 Hong Kong na 2 791 na 3 872 na 3 944Indonesia 10 819 13 527 9 491 Indonesia na 10 819 na 13 527 na 9 491 Japan na 1 785 na 1 168 na 2 981 Japan na 1 785 na 1 168 na 2 981New Zealand na 4 899 na 8 597 na 8 840 New Zealand na 4 899 na 8 597 na 8 840Norway na 13 259 na 11 784 na 7 336 Norway na 13 259 na 11 784 na 7 336P Peru na 27 134 na 21 459 na 16 587 Samoa (American) na 6 967 na 6 798 na 8 936 Samoa (American) na 6 967 na 6 798 na 8 936Thailand na 3 161 na 4 173 na 5 993 Thailand na 3 161 na 4 173 na 5 993United States na 4 618 na 6 179 na 4 890 United States na 4 618 na 6 179 na 4 890O h Other a na 167 036 na 137 900 na 119 526Total na 258 389 na 232 795 na 220 671Total na 258 389 na 232 795 na 220 671Total imports na 1 529 707 na 1 606 594 na 1 648 350Total imports na 1 529 707 na 1 606 594 na 1 648 350a Predominantly re‐imports. na Not available. y pSource: Australian Bureau of Statistics, International Trade, Australia, cat. no. 5465.0, CanberraSource: Australian Bureau of Statistics, International Trade, Australia, cat. no. 5465.0, Canberra
112
Imports
ABARESAustralian fisheries and aquaculture statistics 2013

TABLE 38 Seafood imports from selected countries, by product, Australia a38 Seafood imports from selected countries by product Australia a38Seafoodimportsfromselectedcountries,byproduct,Australiaa2010 11 2011 12 2012 132010–11 2011–12 2012–13
t $’000 t $’000 t $’000$ $ $ThailandThailandPrepared or preservedPrepared or preserved Tuna b 44 228 193 838 38 497 194 205 43 096 234 548Salmonids 1 313 10 228 1 628 13 313 1 686 13 087 Salmonids 1 313 10 228 1 628 13 313 1 686 13 087Other fish 7 876 25 640 7 543 25 341 8 620 27 997 Other fish 7 876 25 640 7 543 25 341 8 620 27 997P 5 129 43 901 6 264 57 404 4 971 44 473 Prawns 5 129 43 901 6 264 57 404 4 971 44 473Frozen cFish meat 1 240 7 698 932 5 623 1 526 8 594Frozen c Fish meat 1 240 7 698 932 5 623 1 526 8 594Squid and octopus 1 589 8 380 1 636 9 748 1 524 9 577 Squid and octopus 1 589 8 380 1 636 9 748 1 524 9 577S ll Scallops 162 1 254 362 4 082 80 882p Crabs 162 2 188 81 1 247 55 1 062 Crabs 162 2 188 81 1 247 55 1 062Lobsters 43 574 79 972 92 1 310 Lobsters 43 574 79 972 92 1 310Prawns 5 000 37 991 5 153 42 148 5 867 51 227 Prawns 5 000 37 991 5 153 42 148 5 867 51 227
lTotal 68 440 340 213 63 528 362 148 68 700 399 778New ZealandNew ZealandFrozen cH k 1 761 6 326 1 771 6 189 1 763 5 114Frozen c Hake 1 761 6 326 1 771 6 189 1 763 5 114 Salmonids 30 273 37 465 132 1 509 Salmonids 30 273 37 465 132 1 509Otherfish 10 601 63 061 11 396 61 411 12 037 65 067 Otherfish 10 601 63 061 11 396 61 411 12 037 65 067Mussels 18 128 46 315 10 62 Mussels 18 128 46 315 10 62S id d t Squid and octopus 1 982 9 424 1 377 7 310 1 711 7 379q pUnfrozen cSalmonids 1 171 9 775 457 3 497 647 5 905Unfrozen c Salmonids 1 171 9 775 457 3 497 647 5 905Shark 465 3 163 444 3 078 507 3 555 Shark 465 3 163 444 3 078 507 3 555O h fi h Otherfish 6 550 52 906 6 410 51 256 7 048 56 410Smoked salted or driedSalmonids (smoked only) 45 960 45 930 64 1 316Smoked salted or dried Salmonids (smoked only) 45 960 45 930 64 1 316Shark d 0 86 16 90 7 67 Shark d 0 86 16 90 7 67Prepared or preservedFish 5 678 29 965 4 751 26 724 4 168 25 666p p
Fish 5 678 29 965 4 751 26 724 4 168 25 666Molluscs 1 232 8 187 787 5 133 32 219 Molluscs 1 232 8 187 787 5 133 32 219Mi d tiMixed preparations e Oysters 532 5 499 652 7 720 411 5 990 Oysters 532 5 499 652 7 720 411 5 990Total 33 530 209 979 31 669 197 275 32 700 206 286Total 33 530 209 979 31 669 197 275 32 700 206 286ChinaChina
d dPrepared or preserved Tuna 181 367 238 596 174 503
p p Tuna 181 367 238 596 174 503Other fish 3 919 17 639 4 500 21 012 4 586 22 265 Other fish 3 919 17 639 4 500 21 012 4 586 22 265Pra ns 3 924 30 081 3 496 26 676 2 558 19 413 Prawns 3 924 30 081 3 496 26 676 2 558 19 413 Molluscs 1 184 7 219 978 6 695 515 3 813Molluscs 84 7 9 978 6 695 5 5 3 8 3Frozen cHake 246 669 369 897 503 1 414Frozen c Hake 246 669 369 897 503 1 414Oth fi h 3 749 19 252 4 135 21 180 4 176 20 323 Other fish 3 749 19 252 4 135 21 180 4 176 20 323 Prawns 4 655 42 358 9 061 84 549 6 764 55 046 Prawns 4 655 42 358 9 061 84 549 6 764 55 046Squid and octopus 7 965 40 414 8 164 40 896 8 677 34 676 Squid and octopus 7 965 40 414 8 164 40 896 8 677 34 676Scallops 1 387 16 482 1 361 17 578 1 918 22 332 Scallops 1 387 16 482 1 361 17 578 1 918 22 332S k d l d d i dSmoked, salted or dried Fish 84 1 689 39 958 23 900
, Fish 84 1 689 39 958 23 900Total 28 902 185 607 34 188 231 496 32 594 196 493Total 28 902 185 607 34 188 231 496 32 594 196 493
ContinuedContinued
113
Imports
ABARESAustralian fisheries and aquaculture statistics 2013

TABLE 38 Seafood imports from selected countries, by product, Australia a continued38 Seafood imports from selected countries by product Australia a continued38Seafoodimportsfromselectedcountries,byproduct,Australiaacontinued2010 11 2011 12 2012 132010–11 2011–12 2012–13
t $’000 t $’000 t $’000$ $ $VietnamVietnamFrozen cFrozen c Fish 17 206 59 775 16 899 62 102 16 198 56 432 Prawns 2 215 25 728 3 050 35 673 3 646 37 224 Prawns 2 215 25 728 3 050 35 673 3 646 37 224Squid and octopus 707 2 724 1 074 5 230 599 2 988 Squid and octopus 707 2 724 1 074 5 230 599 2 988L b t 163 2 359 163 2 021 127 1 835 Lobsters 163 2 359 163 2 021 127 1 835 Crabs 33 310 60 525 71 627 Crabs 33 310 60 525 71 627Prepared or preservedPrawns 6 382 63 371 5 738 56 558 5 622 45 589Prepared or preserved Prawns 6 382 63 371 5 738 56 558 5 622 45 589Fi h Fish 1 057 4 266 847 3 485 1 047 4 010 Crabs 90 726 181 1 095 128 834 Crabs 90 726 181 1 095 128 834Total 28 278 161 683 29 706 174 499 30 560 163 097Total 28 278 161 683 29 706 174 499 30 560 163 097MalaysiaMalaysiaPrepared or preserved Mackerel 101 331 109 407 112 441
p p Mackerel 101 331 109 407 112 441Other fish 3 009 19 186 3 876 24 095 3 904 23 571 Other fish 3 009 19 186 3 876 24 095 3 904 23 571P 405 2 672 362 2 946 256 2 128 Prawns 405 2 672 362 2 946 256 2 128Frozen cPrawns 3 468 29 013 2 373 22 601 3 296 31 549Frozen c Prawns 3 468 29 013 2 373 22 601 3 296 31 549Squid and octopus 923 3 827 852 4 372 754 3 974 Squid and octopus 923 3 827 852 4 372 754 3 974Fi h Fish 72 567 91 543 175 844Unfrozen cFish 203 2 401 178 2 866 249 3 895Unfrozen c Fish 203 2 401 178 2 866 249 3 895Smoked salted or dried
hSmoked, salted or dried Fish 60 490 68 636 60 569Total 9 950 71 184 9 918 73 188 10 823 80 965Total 9 950 71 184 9 918 73 188 10 823 80 965APEC regionAPEC regionP d dPrepared or preserved Tuna 45 334 198 264 40 290 202 334 46 116 252 693 Tuna 45 334 198 264 40 290 202 334 46 116 252 693Salmonids 44 862 6 917 52 015 7 386 55 350 7 368 Salmonids 44 862 6 917 52 015 7 386 55 350 7 368Sardines 10 496 3 171 9 010 2 824 10 715 3 105 Sardines 10 496 3 171 9 010 2 824 10 715 3 105Oth fi h 21 544 101 458 22 230 108 480 22 727 110 132 Other fish 21 544 101 458 22 230 108 480 22 727 110 132 Prawns 16 030 141 467 16 047 145 176 13 553 112 787 Prawns 16 030 141 467 16 047 145 176 13 553 112 787Molluscs 3 386 20 938 2 476 16 146 917 6 625 Molluscs 3 386 20 938 2 476 16 146 917 6 625Frozen cFi hFrozen c Fish meat 139 1 721 355 3 004 898 7 239 Squid and octopus 14 912 73 163 14 617 75 706 15 218 68 193 Squid and octopus 14 912 73 163 14 617 75 706 15 218 68 193Prawns 16 224 145 740 20 775 198 408 20 516 185 552 Prawns 16 224 145 740 20 775 198 408 20 516 185 552Scallops 2 589 34 410 2 901 42 994 3 011 39 906 Scallops 2 589 34 410 2 901 42 994 3 011 39 906 Crabs 476 7 251 601 8 194 546 7 091Mixed preparations eOysters 573 5 763 724 8 246 517 6 854Mixed preparations e Oysters 573 5 763 724 8 246 517 6 854Total 192 864 1 134 428 194 145 1 223 025 204 356 1 257 504a Excludes live imports. b Predominantly canned. c Includes smoked, salted or dried. d Predominantly dried shark fin. e Includes live,a Excludes live imports. b Predominantly canned. c Includes smoked, salted or dried. d Predominantly dried shark fin. e Includes live, fresh chilled or frozen that may be smoked salted or dried but excludes prepared and preservedfresh, chilled or frozen that may be smoked, salted or dried but excludes prepared and preserved.S A t li B f St ti ti I t ti l T d A t li t 5465 0 C bSource: Australian Bureau of Statistics, International Trade, Australia, cat. no. 5465.0, Canberra
114
Imports
ABARESAustralian fisheries and aquaculture statistics 2013

115ABARESAustralian fisheries and aquaculture statistics 2013
Fisheries inquiriesNew South WalesDavid Makin (Wild sector) Department of Primary Industries Tel: 02 6648 3921 Fax: 02 6391 4709
Raelene Trenaman (Aquaculture) Department of Primary Industries Tel: 02 4916 3843 Fax: 02 4982 1107 Website: dpi.nsw.gov.au
VictoriaPaula Baker Fisheries Victoria, Department of Environment and Primary Industries Tel: 03 5258 0245 Fax: 03 5258 4553 Website: dpi.vic.gov.au
QueenslandNadia Engstrom (Wild sector) Department of Agriculture, Fisheries and Forestry Tel: 07 3037 8806 Fax: 07 3229 8182 Website: daff.qld.gov.au
South AustraliaNina White (Aquaculture) Department of Primary Industries and Regions SA Tel: 08 8226 2312 Fax: 08 8226 0330 Website: pir.sa.gov.au
Angelo Tsolos (Wild sector) South Australian Research and Development Institute Tel: 08 8207 5400 Fax: 08 8207 5415 Website: sardi.sa.gov.au
Western AustraliaEva Lai Western Australian Department of Fisheries Tel: 08 9203 0111 Fax: 08 9203 0199 Website: fish.wa.gov.au
TasmaniaDenise Garcia Department of Primary Industries, Parks, Water and Environment Tel: 03 6165 3017 Website: dpiw.tas.gov.au
Northern TerritoryAndria Handley (Fisheries) Department of Primary Industry and Fisheries Tel: 08 8999 2127 Fax: 08 8999 2065 Website: nt.gov.au/d/Fisheries
CommonwealthJohn Garvey (Licensing and Quota Management) Australian Fisheries Management Authority Tel: 1300 723 621 Fax: 02 6225 5440 Website: afma.gov.au


agriculture.gov.au/abares
Australian Bureau of Agricultural and Resource Economics and Sciences (ABARES)
Postal address GPO Box 858 Canberra ACT 2601
Switchboard +61 2 6272 3933
Facsimile +61 2 6272 2001
Email [email protected]
Web agriculture.gov.au/abares
The ‘Biosphere’ graphic elementThe biosphere is a key part of the department’s visual identity. Individual biospheres are used to visually describe the diverse nature of the work we do as a department, in Australia and internationally.
ABA
1734
_10
14