AUSTRALIAN CUSTOMS AND BORDER … strategic direction statement for the Australian Customs and...
29
AUSTRALIAN CUSTOMS AND BORDER PROTECTION SERVICE Agency resources and planned performance
Transcript of AUSTRALIAN CUSTOMS AND BORDER … strategic direction statement for the Australian Customs and...
AUSTRALIAN CUSTOMS AND
BORDER PROTECTION SERVICE
Agency resources and planned performance

AUSTRALIAN CUSTOMS AND BORDER PROTECTION
SERVICE
Section 1: Entity Overview and Resources .............................................................. 85
1.1 Strategic Direction .......................................................................................... 85
1.2 Entity Resource Statement ............................................................................. 85
1.3 Entity Measures table ..................................................................................... 88
1.4 Additional Estimates and variations ................................................................ 89
1.5 Breakdown of additional estimates by appropriation bill ................................ 91
Section 2: Revisions to Entity Resources and Planned Performance .................. 92
2.1 Resources and performance information ....................................................... 92
Section 3: Explanatory Tables and Budgeted Financial Statements ..................... 96
3.1 Explanatory Tables ......................................................................................... 96
3.2 Budgeted financial statements........................................................................ 96

ACBPS Additional Estimates Statements
85
AUSTRALIAN CUSTOMS AND BORDER PROTECTION
SERVICE
Section 1: Entity Overview and Resources
1.1 STRATEGIC DIRECTION
The strategic direction statement for the Australian Customs and Border Protection
Service (ACBPS) can be found in the 2014-15 Portfolio Budget Statements. There are
no changes to ACBPS’s strategic direction as a result of Additional Estimates.
1.2 ENTITY RESOURCE STATEMENT
The Entity Resource Statement details the resourcing for ACBPS at Additional
Estimates. Table 1.1 outlines the total resourcing available from all sources for the
2014-15 Budget year, including variations through Appropriation Bill Nos. 3 and No. 4.
ACBPS Additional Estimates Statements
86
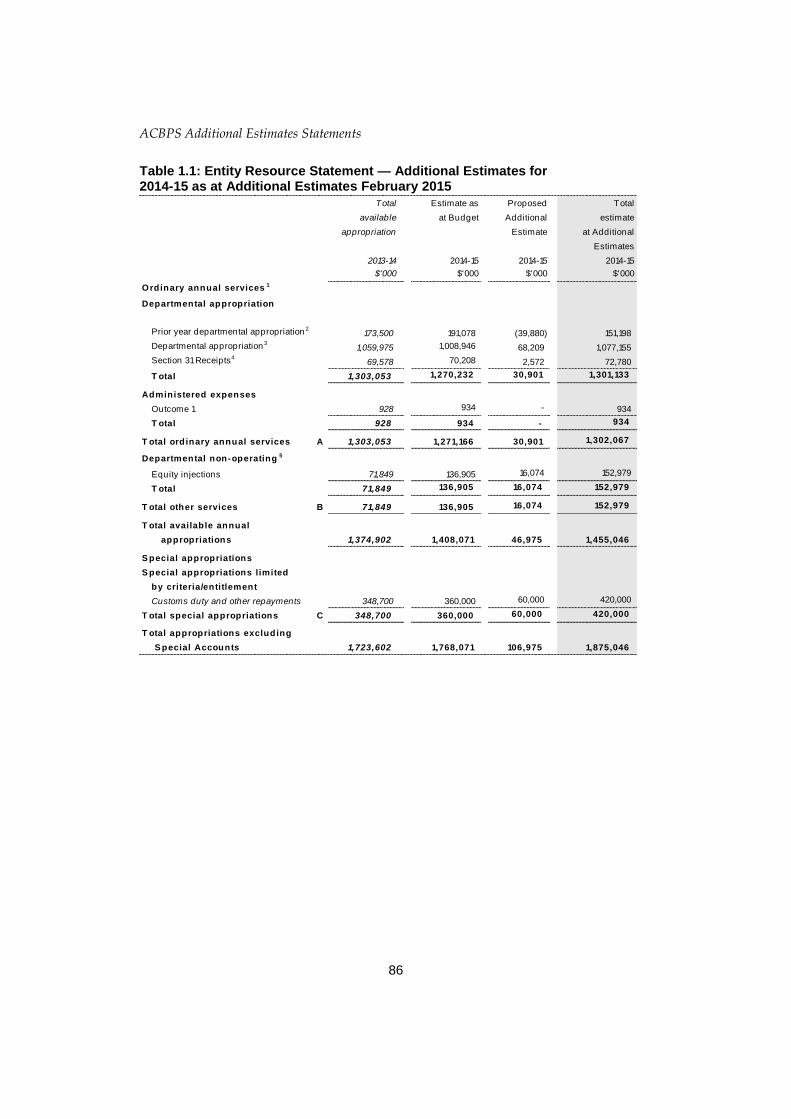
Table 1.1: Entity Resource Statement — Additional Estimates for 2014-15 as at Additional Estimates February 2015
Total Estimate as Proposed Total
available at Budget Additional estimate
appropriation Estimate at Additional
Estimates
2013-14 2014-15 2014-15 2014-15
$'000 $'000 $'000 $'000
Ordinary annual services 1
Departmental appropriation
Prior year departmental appropriation 2173,500 191,078 (39,880) 151,198
Departmental appropriation 31,059,975 1,008,946 68,209 1,077,155
Section 31 Receipts469,578 70,208 2,572 72,780
T otal 1,303,053 1,270,232 30,901 1,301,133
Administered expenses
Outcome 1 928 934 - 934
T otal 928 934 - 934
T otal ordinary annual services A 1,303,053 1,271,166 30,901 1,302,067
Departmental non-operating 5
Equity injections 71,849 136,905 16,074 152,979
T otal 71,849 136,905 16,074 152,979
T otal other services B 71,849 136,905 16,074 152,979
T otal available annual
appropriations 1,374,902 1,408,071 46,975 1,455,046
S pecial appropriations
S pecial appropriations limited
by criteria/entitlement
Customs duty and other repayments 348,700 360,000 60,000 420,000
T otal special appropriations C 348,700 360,000 60,000 420,000
T otal appropriations excluding
S pecial Accounts 1,723,602 1,768,071 106,975 1,875,046
ACBPS Additional Estimates Statements
87
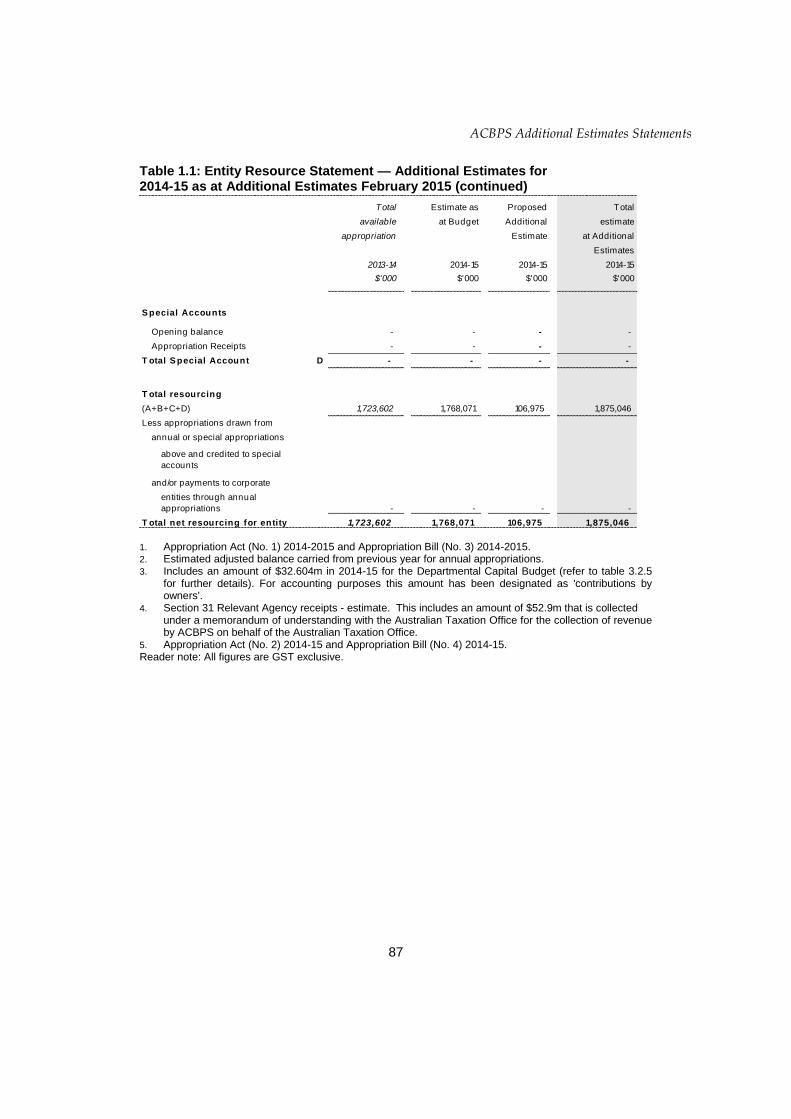
Table 1.1: Entity Resource Statement — Additional Estimates for 2014-15 as at Additional Estimates February 2015 (continued)
1. Appropriation Act (No. 1) 2014-2015 and Appropriation Bill (No. 3) 2014-2015. 2. Estimated adjusted balance carried from previous year for annual appropriations. 3. Includes an amount of $32.604m in 2014-15 for the Departmental Capital Budget (refer to table 3.2.5
for further details). For accounting purposes this amount has been designated as 'contributions by owners'.
4. Section 31 Relevant Agency receipts - estimate. This includes an amount of $52.9m that is collected under a memorandum of understanding with the Australian Taxation Office for the collection of revenue by ACBPS on behalf of the Australian Taxation Office.
5. Appropriation Act (No. 2) 2014-15 and Appropriation Bill (No. 4) 2014-15. Reader note: All figures are GST exclusive.
Total Estimate as Proposed Total
available at Budget Additional estimate
appropriation Estimate at Additional
Estimates
2013-14 2014-15 2014-15 2014-15
$'000 $'000 $'000 $'000
S pecial Accounts
Opening balance - - - -
Appropriation Receipts - - - -
T otal S pecial Account D - - - -
T otal resourcing
(A+B+C+D) 1,723,602 1,768,071 106,975 1,875,046
Less appropriations drawn from
annual or special appropriations
above and credited to special
accounts
and/or payments to corporate
entities through annual
appropriations - - - -
T otal net resourcing for entity 1,723,602 1,768,071 106,975 1,875,046
ACBPS Additional Estimates Statements
88
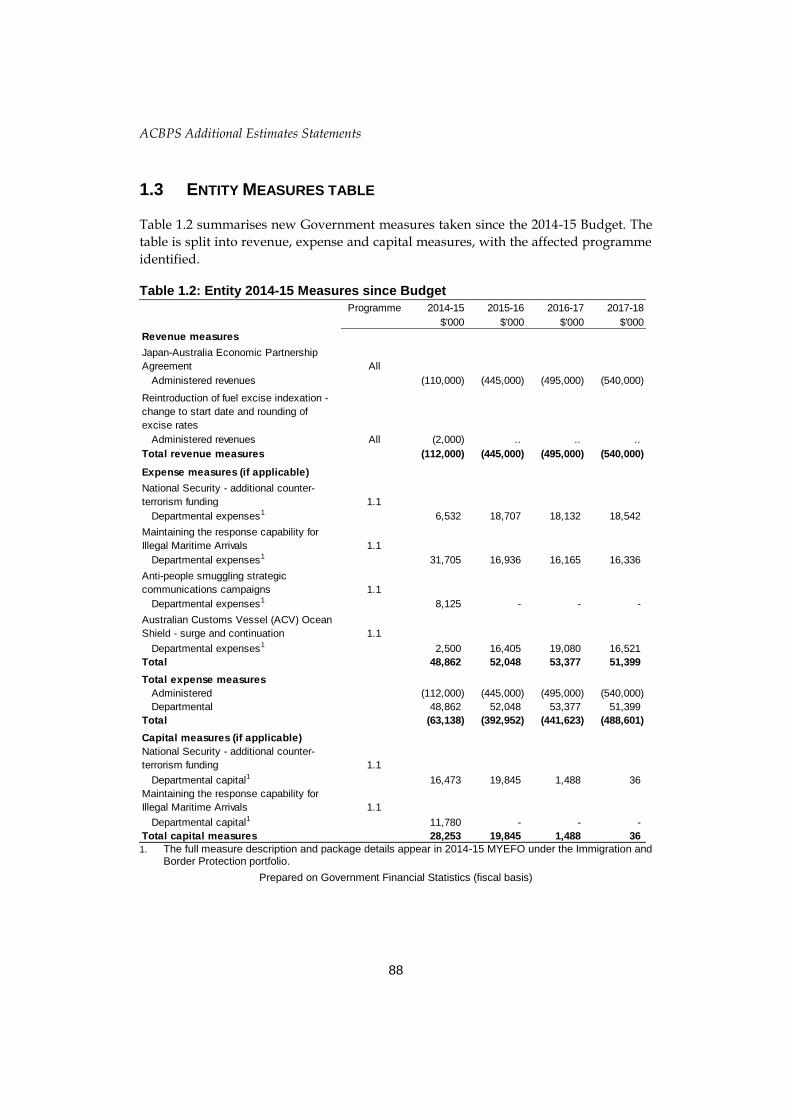
1.3 ENTITY MEASURES TABLE
Table 1.2 summarises new Government measures taken since the 2014-15 Budget. The
table is split into revenue, expense and capital measures, with the affected programme
identified.
Table 1.2: Entity 2014-15 Measures since Budget
1. The full measure description and package details appear in 2014-15 MYEFO under the Immigration and
Border Protection portfolio.
Prepared on Government Financial Statistics (fiscal basis)
Programme 2014-15 2015-16 2016-17 2017-18
$'000 $'000 $'000 $'000
Revenue measures
Japan-Australia Economic Partnership
Agreement All
Administered revenues (110,000) (445,000) (495,000) (540,000)
Reintroduction of fuel excise indexation -
change to start date and rounding of
excise rates
Administered revenues All (2,000) .. .. ..
Total revenue measures (112,000) (445,000) (495,000) (540,000)
Expense measures (if applicable)
National Security - additional counter-
terrorism funding 1.1
Departmental expenses1 6,532 18,707 18,132 18,542
Maintaining the response capability for
Illegal Maritime Arrivals 1.1
Departmental expenses1 31,705 16,936 16,165 16,336
Anti-people smuggling strategic
communications campaigns 1.1
Departmental expenses1 8,125 - - -
Australian Customs Vessel (ACV) Ocean
Shield - surge and continuation 1.1
Departmental expenses1 2,500 16,405 19,080 16,521
Total 48,862 52,048 53,377 51,399
Total expense measures
Administered (112,000) (445,000) (495,000) (540,000)
Departmental 48,862 52,048 53,377 51,399
Total (63,138) (392,952) (441,623) (488,601)
Capital measures (if applicable)
National Security - additional counter-
terrorism funding 1.1
Departmental capital1 16,473 19,845 1,488 36
Maintaining the response capability for
Illegal Maritime Arrivals 1.1
Departmental capital1 11,780 - - -
Total capital measures 28,253 19,845 1,488 36
ACBPS Additional Estimates Statements
89
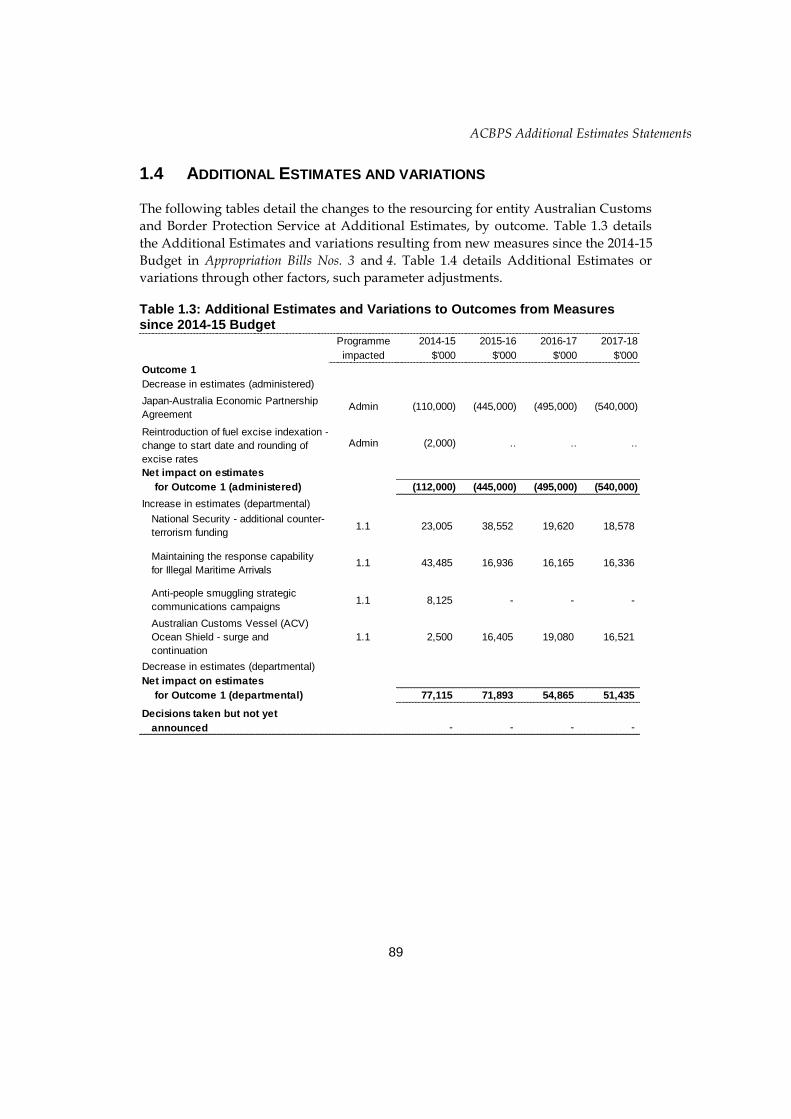
1.4 ADDITIONAL ESTIMATES AND VARIATIONS
The following tables detail the changes to the resourcing for entity Australian Customs
and Border Protection Service at Additional Estimates, by outcome. Table 1.3 details
the Additional Estimates and variations resulting from new measures since the 2014-15
Budget in Appropriation Bills Nos. 3 and 4. Table 1.4 details Additional Estimates or
variations through other factors, such parameter adjustments.
Table 1.3: Additional Estimates and Variations to Outcomes from Measures since 2014-15 Budget
Programme 2014-15 2015-16 2016-17 2017-18
impacted $'000 $'000 $'000 $'000
Outcome 1
Decrease in estimates (administered)
Japan-Australia Economic Partnership
AgreementAdmin (110,000) (445,000) (495,000) (540,000)
Reintroduction of fuel excise indexation -
change to start date and rounding of
excise rates
Admin (2,000) .. .. ..
Net impact on estimates
for Outcome 1 (administered) (112,000) (445,000) (495,000) (540,000)
Increase in estimates (departmental)
National Security - additional counter-
terrorism funding1.1 23,005 38,552 19,620 18,578
Maintaining the response capability
for Illegal Maritime Arrivals 1.1 43,485 16,936 16,165 16,336
Anti-people smuggling strategic
communications campaigns 1.1 8,125 - - -
Australian Customs Vessel (ACV)
Ocean Shield - surge and
continuation
1.1 2,500 16,405 19,080 16,521
Decrease in estimates (departmental)
Net impact on estimates
for Outcome 1 (departmental) 77,115 71,893 54,865 51,435
Decisions taken but not yet
announced - - - -
ACBPS Additional Estimates Statements
90
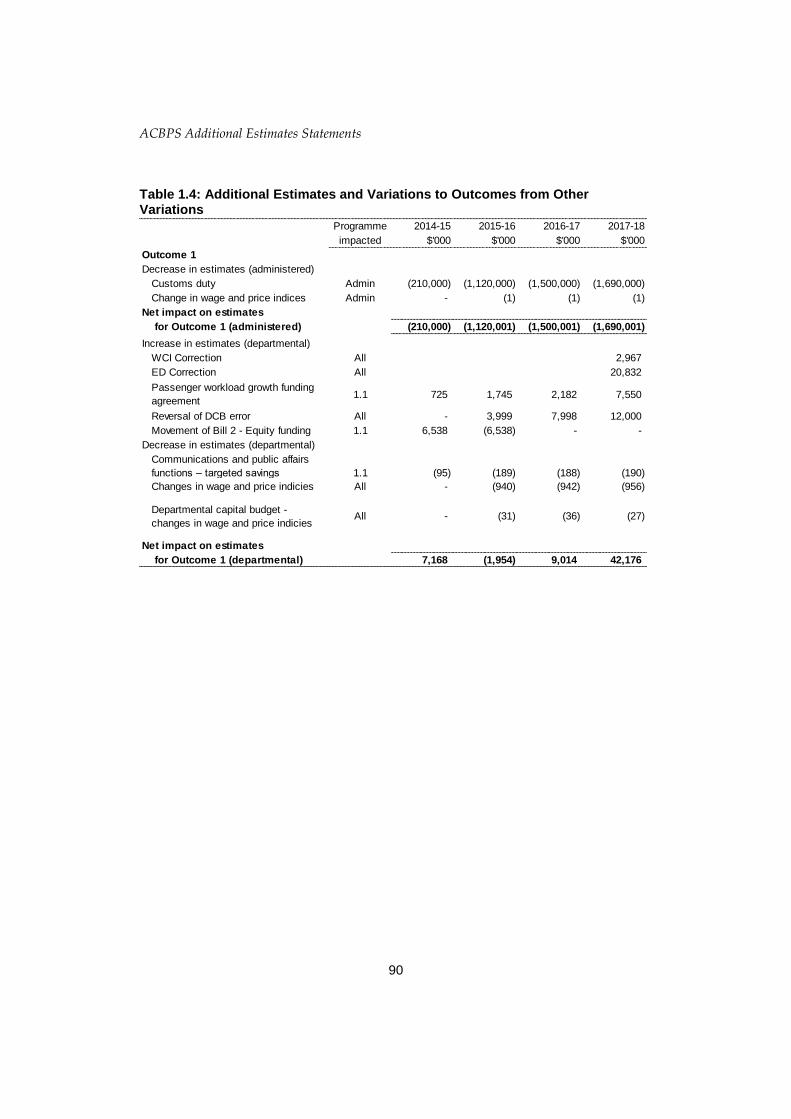
Table 1.4: Additional Estimates and Variations to Outcomes from Other Variations
Programme 2014-15 2015-16 2016-17 2017-18
impacted $'000 $'000 $'000 $'000
Outcome 1
Decrease in estimates (administered)
Customs duty Admin (210,000) (1,120,000) (1,500,000) (1,690,000)
Change in wage and price indices Admin - (1) (1) (1)
Net impact on estimates
for Outcome 1 (administered) (210,000) (1,120,001) (1,500,001) (1,690,001)
Increase in estimates (departmental)
WCI Correction All 2,967
ED Correction All 20,832
Passenger workload growth funding
agreement1.1 725 1,745 2,182 7,550
Reversal of DCB error All - 3,999 7,998 12,000
Movement of Bill 2 - Equity funding 1.1 6,538 (6,538) - -
Decrease in estimates (departmental)
Communications and public affairs
functions – targeted savings 1.1 (95) (189) (188) (190)
Changes in wage and price indicies All - (940) (942) (956)
Departmental capital budget -
changes in wage and price indiciesAll - (31) (36) (27)
Net impact on estimates
for Outcome 1 (departmental) 7,168 (1,954) 9,014 42,176
ACBPS Additional Estimates Statements
91
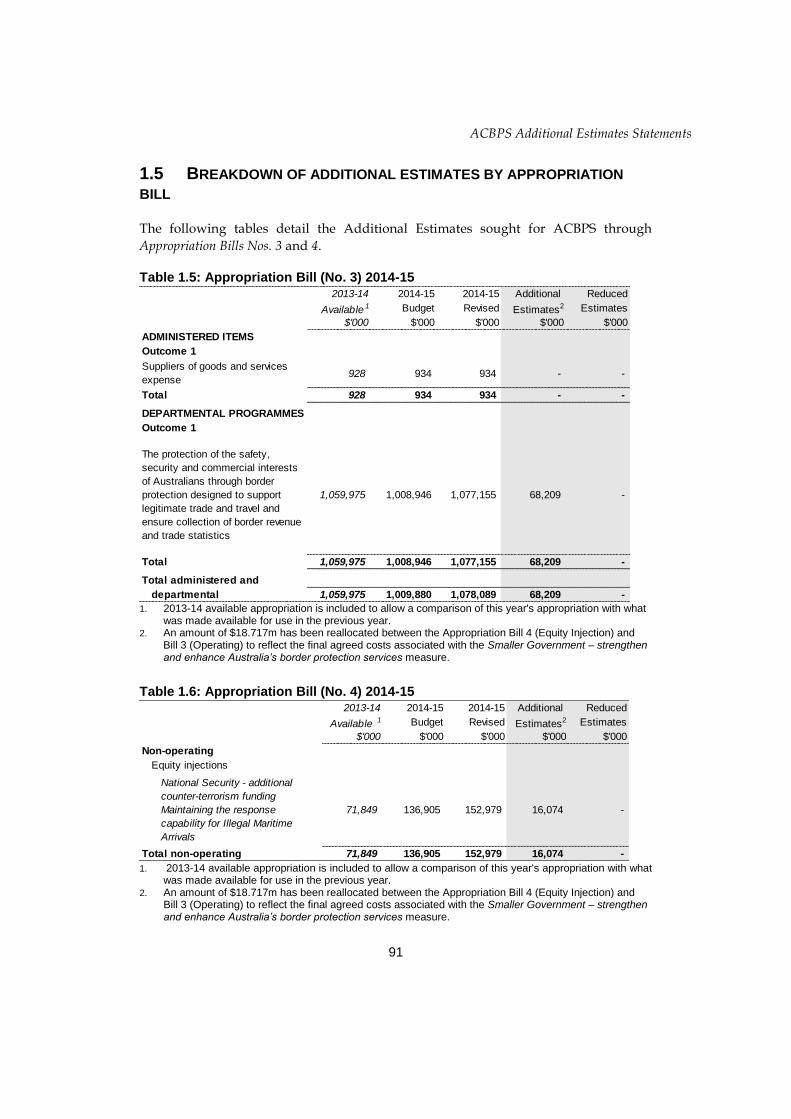
1.5 BREAKDOWN OF ADDITIONAL ESTIMATES BY APPROPRIATION
BILL
The following tables detail the Additional Estimates sought for ACBPS through
Appropriation Bills Nos. 3 and 4.
Table 1.5: Appropriation Bill (No. 3) 2014-15
1. 2013-14 available appropriation is included to allow a comparison of this year's appropriation with what
was made available for use in the previous year. 2. An amount of $18.717m has been reallocated between the Appropriation Bill 4 (Equity Injection) and
Bill 3 (Operating) to reflect the final agreed costs associated with the Smaller Government – strengthen and enhance Australia’s border protection services measure.
Table 1.6: Appropriation Bill (No. 4) 2014-15
1. 2013-14 available appropriation is included to allow a comparison of this year's appropriation with what
was made available for use in the previous year. 2. An amount of $18.717m has been reallocated between the Appropriation Bill 4 (Equity Injection) and
Bill 3 (Operating) to reflect the final agreed costs associated with the Smaller Government – strengthen and enhance Australia’s border protection services measure.
2013-14 2014-15 2014-15 Additional Reduced
Available 1 Budget Revised Estimates2 Estimates
$'000 $'000 $'000 $'000 $'000
ADMINISTERED ITEMS
Outcome 1
Suppliers of goods and services
expense928 934 934 - -
Total 928 934 934 - -
DEPARTMENTAL PROGRAMMES
Outcome 1
The protection of the safety,
security and commercial interests
of Australians through border
protection designed to support
legitimate trade and travel and
ensure collection of border revenue
and trade statistics
1,059,975 1,008,946 1,077,155 68,209 -
Total 1,059,975 1,008,946 1,077,155 68,209 -
Total administered and
departmental 1,059,975 1,009,880 1,078,089 68,209 -
2013-14 2014-15 2014-15 Additional Reduced
Available 1 Budget Revised Estimates2 Estimates
$'000 $'000 $'000 $'000 $'000
Non-operating
Equity injections
National Security - additional
counter-terrorism funding
Maintaining the response
capability for Illegal Maritime
Arrivals
71,849 136,905 152,979 16,074 -
Total non-operating 71,849 136,905 152,979 16,074 -
ACBPS Additional Estimates Statements
92
Section 2: Revisions to Entity Resources and Planned Performance
2.1 RESOURCES AND PERFORMANCE INFORMATION
There are no changes to the Australian Customs and Border Protection Services’
outcome and performance information as reported in the 2014-15 Portfolio Budget
Statements.
OUTCOME 1
Outcome 1 Strategy
There are no changes to the strategy for Outcome 1 as reported in the 2014-15 Portfolio
Budget Statements.
ACBPS Additional Estimates Statements
93
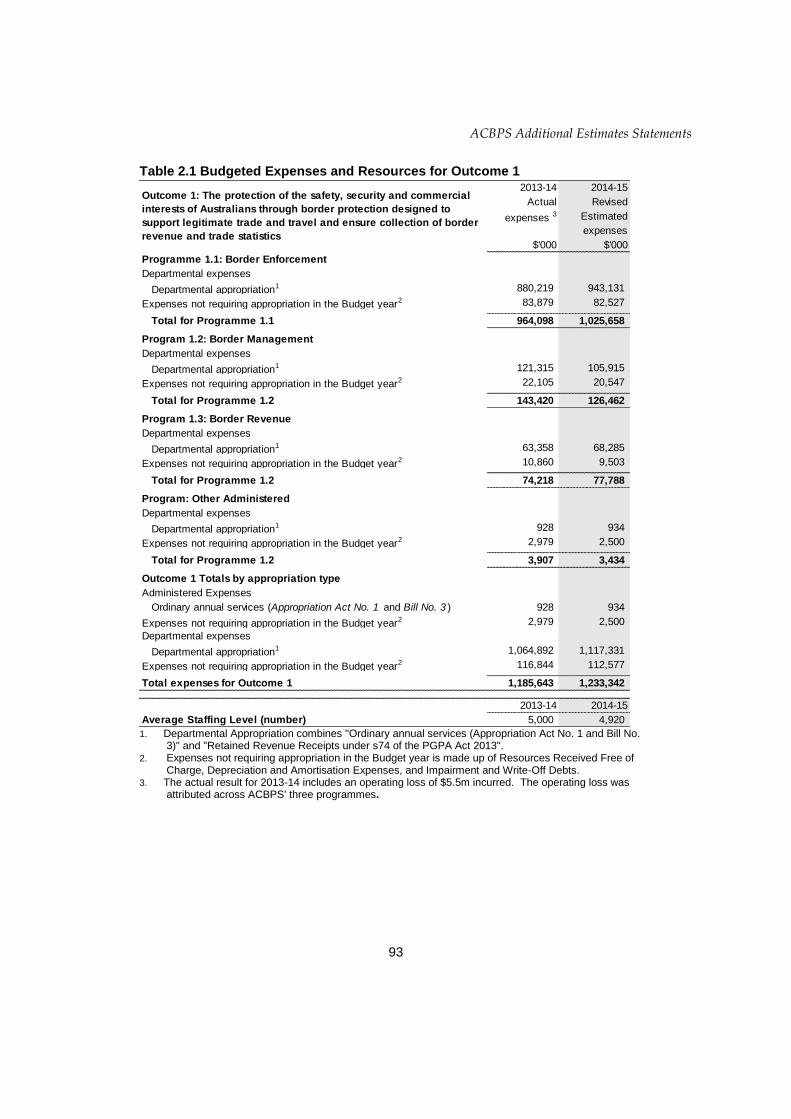
Table 2.1 Budgeted Expenses and Resources for Outcome 1
1. Departmental Appropriation combines "Ordinary annual services (Appropriation Act No. 1 and Bill No.
3)" and "Retained Revenue Receipts under s74 of the PGPA Act 2013". 2. Expenses not requiring appropriation in the Budget year is made up of Resources Received Free of
Charge, Depreciation and Amortisation Expenses, and Impairment and Write-Off Debts. 3. The actual result for 2013-14 includes an operating loss of $5.5m incurred. The operating loss was
attributed across ACBPS' three programmes.
2013-14 2014-15
Actual Revised
expenses 3 Estimated
expenses
$'000 $'000
Programme 1.1: Border Enforcement
Departmental expenses
Departmental appropriation1 880,219 943,131
Expenses not requiring appropriation in the Budget year2 83,879 82,527
Total for Programme 1.1 964,098 1,025,658
Program 1.2: Border Management
Departmental expenses
Departmental appropriation1 121,315 105,915
Expenses not requiring appropriation in the Budget year2 22,105 20,547
Total for Programme 1.2 143,420 126,462
Program 1.3: Border Revenue
Departmental expenses
Departmental appropriation1 63,358 68,285
Expenses not requiring appropriation in the Budget year2 10,860 9,503
Total for Programme 1.2 74,218 77,788
Program: Other Administered
Departmental expenses
Departmental appropriation1 928 934
Expenses not requiring appropriation in the Budget year2 2,979 2,500
Total for Programme 1.2 3,907 3,434
Outcome 1 Totals by appropriation type
Administered Expenses
Ordinary annual services (Appropriation Act No. 1 and Bill No. 3 ) 928 934
Expenses not requiring appropriation in the Budget year2 2,979 2,500
Departmental expenses
Departmental appropriation1 1,064,892 1,117,331
Expenses not requiring appropriation in the Budget year2 116,844 112,577
Total expenses for Outcome 1 1,185,643 1,233,342
2013-14 2014-15
Average Staffing Level (number) 5,000 4,920
Outcome 1: The protection of the safety, security and commercial
interests of Australians through border protection designed to
support legitimate trade and travel and ensure collection of border
revenue and trade statistics
ACBPS Additional Estimates Statements
94
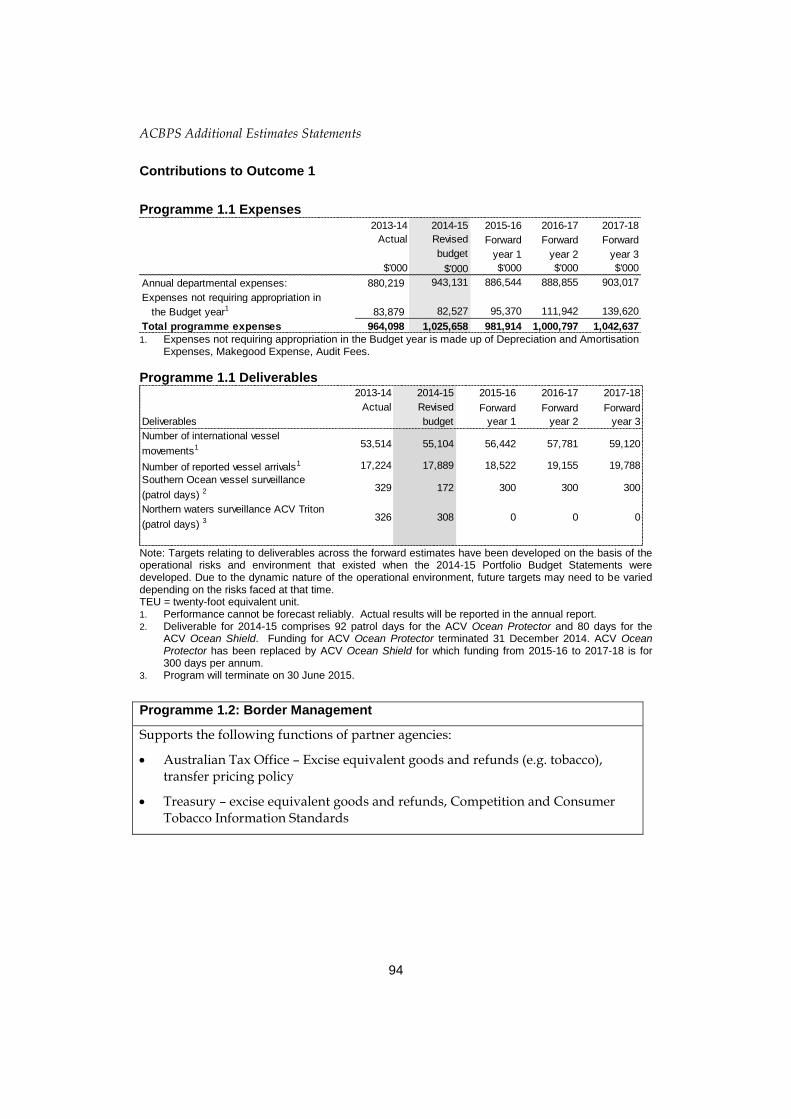
Contributions to Outcome 1
Programme 1.1 Expenses
1. Expenses not requiring appropriation in the Budget year is made up of Depreciation and Amortisation
Expenses, Makegood Expense, Audit Fees.
Programme 1.1 Deliverables
Note: Targets relating to deliverables across the forward estimates have been developed on the basis of the operational risks and environment that existed when the 2014-15 Portfolio Budget Statements were developed. Due to the dynamic nature of the operational environment, future targets may need to be varied depending on the risks faced at that time. TEU = twenty-foot equivalent unit. 1. Performance cannot be forecast reliably. Actual results will be reported in the annual report. 2. Deliverable for 2014-15 comprises 92 patrol days for the ACV Ocean Protector and 80 days for the
ACV Ocean Shield. Funding for ACV Ocean Protector terminated 31 December 2014. ACV Ocean Protector has been replaced by ACV Ocean Shield for which funding from 2015-16 to 2017-18 is for 300 days per annum.
3. Program will terminate on 30 June 2015.
Programme 1.2: Border Management
Supports the following functions of partner agencies:
Australian Tax Office – Excise equivalent goods and refunds (e.g. tobacco), transfer pricing policy
Treasury – excise equivalent goods and refunds, Competition and Consumer Tobacco Information Standards
2013-14 2014-15 2015-16 2016-17 2017-18
Actual Revised Forward Forward Forward
budget year 1 year 2 year 3
$'000 $'000 $'000 $'000 $'000
Annual departmental expenses: 880,219 943,131 886,544 888,855 903,017
Expenses not requiring appropriation in
the Budget year1 83,879 82,527 95,370 111,942 139,620
Total programme expenses 964,098 1,025,658 981,914 1,000,797 1,042,637
2013-14 2014-15 2015-16 2016-17 2017-18
Actual Revised Forward Forward Forward
Deliverables budget year 1 year 2 year 3
Number of international vessel
movements1 53,514 55,104 56,442 57,781 59,120
Number of reported vessel arrivals1 17,224 17,889 18,522 19,155 19,788
Southern Ocean vessel surveillance
(patrol days) 2 329 172 300 300 300
Northern waters surveillance ACV Triton
(patrol days) 3 326 308 0 0 0
ACBPS Additional Estimates Statements
95
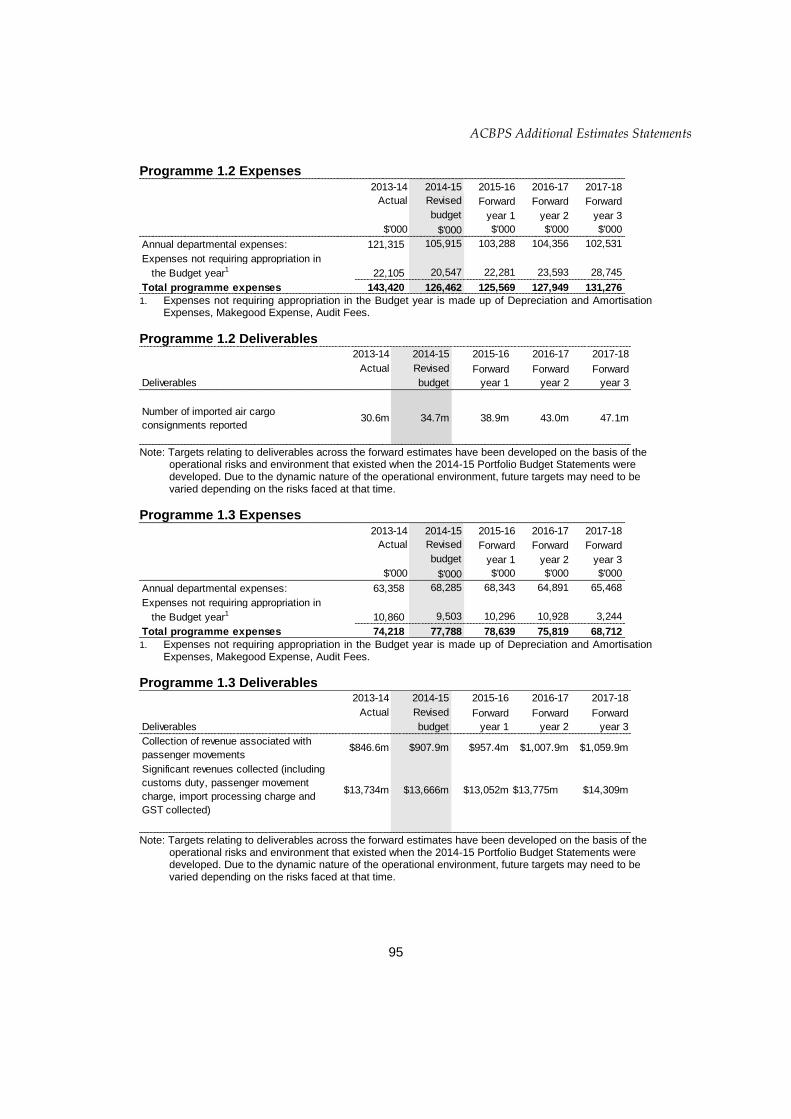
Programme 1.2 Expenses
1. Expenses not requiring appropriation in the Budget year is made up of Depreciation and Amortisation
Expenses, Makegood Expense, Audit Fees.
Programme 1.2 Deliverables
Note: Targets relating to deliverables across the forward estimates have been developed on the basis of the operational risks and environment that existed when the 2014-15 Portfolio Budget Statements were developed. Due to the dynamic nature of the operational environment, future targets may need to be varied depending on the risks faced at that time.
Programme 1.3 Expenses
1. Expenses not requiring appropriation in the Budget year is made up of Depreciation and Amortisation
Expenses, Makegood Expense, Audit Fees.
Programme 1.3 Deliverables
Note: Targets relating to deliverables across the forward estimates have been developed on the basis of the operational risks and environment that existed when the 2014-15 Portfolio Budget Statements were developed. Due to the dynamic nature of the operational environment, future targets may need to be varied depending on the risks faced at that time.
2013-14 2014-15 2015-16 2016-17 2017-18
Actual Revised Forward Forward Forward
budget year 1 year 2 year 3
$'000 $'000 $'000 $'000 $'000
Annual departmental expenses: 121,315 105,915 103,288 104,356 102,531
Expenses not requiring appropriation in
the Budget year1 22,105 20,547 22,281 23,593 28,745
Total programme expenses 143,420 126,462 125,569 127,949 131,276
2013-14 2014-15 2015-16 2016-17 2017-18
Actual Revised Forward Forward Forward
Deliverables budget year 1 year 2 year 3
Number of imported air cargo
consignments reported30.6m 34.7m 38.9m 43.0m 47.1m
2013-14 2014-15 2015-16 2016-17 2017-18
Actual Revised Forward Forward Forward
budget year 1 year 2 year 3
$'000 $'000 $'000 $'000 $'000
Annual departmental expenses: 63,358 68,285 68,343 64,891 65,468
Expenses not requiring appropriation in
the Budget year1 10,860 9,503 10,296 10,928 3,244
Total programme expenses 74,218 77,788 78,639 75,819 68,712
2013-14 2014-15 2015-16 2016-17 2017-18
Actual Revised Forward Forward Forward
Deliverables budget year 1 year 2 year 3
Collection of revenue associated with
passenger movements$846.6m $907.9m $957.4m $1,007.9m $1,059.9m
$14,309m
Significant revenues collected (including
customs duty, passenger movement
charge, import processing charge and
GST collected)
$13,734m $13,666m $13,052m $13,775m
ACBPS Additional Estimates Statements
96
Section 3: Explanatory Tables and Budgeted Financial Statements
3.1 EXPLANATORY TABLES
3.2 BUDGETED FINANCIAL STATEMENTS
3.2.1 Analysis of Budgeted Financial Statements
Departmental
Total estimated revenue in 2014-15 is $1,122.118m, a net increase of $66.335m from the
previously published estimate of $1,055.783m in the 2014-15 Portfolio Budget
Statements. This net increase in revenue from government in 2014-15 is due to:
funding of $6.532m to implement the National Security – additional counter-
terrorism funding measure;
funding of $31.705m to implement the Maintaining the response capability for
Illegal Maritime Arrivals Authority measure;
funding of $8.125m to implement the Anti-people smuggling strategic
communications campaigns measure;
funding of $2.500m to implement the Australian Customs Vessel (ACV) Ocean
Shield – surge and continuation measure;
funding of $18.717m in relation to the reallocation of Appropriation Act No. 4
to Appropriation Act No. 3 to the 2014-15 Budget measure Smaller Government
– strengthen and enhance Australia’s border protection services;
adjustments of $0.725m made to workload parameters as part of the passenger
workload growth agreement; and
offset by a reduction in funding resulting from whole of government savings
relating to Communications and Public Affairs Functions – targeted savings.
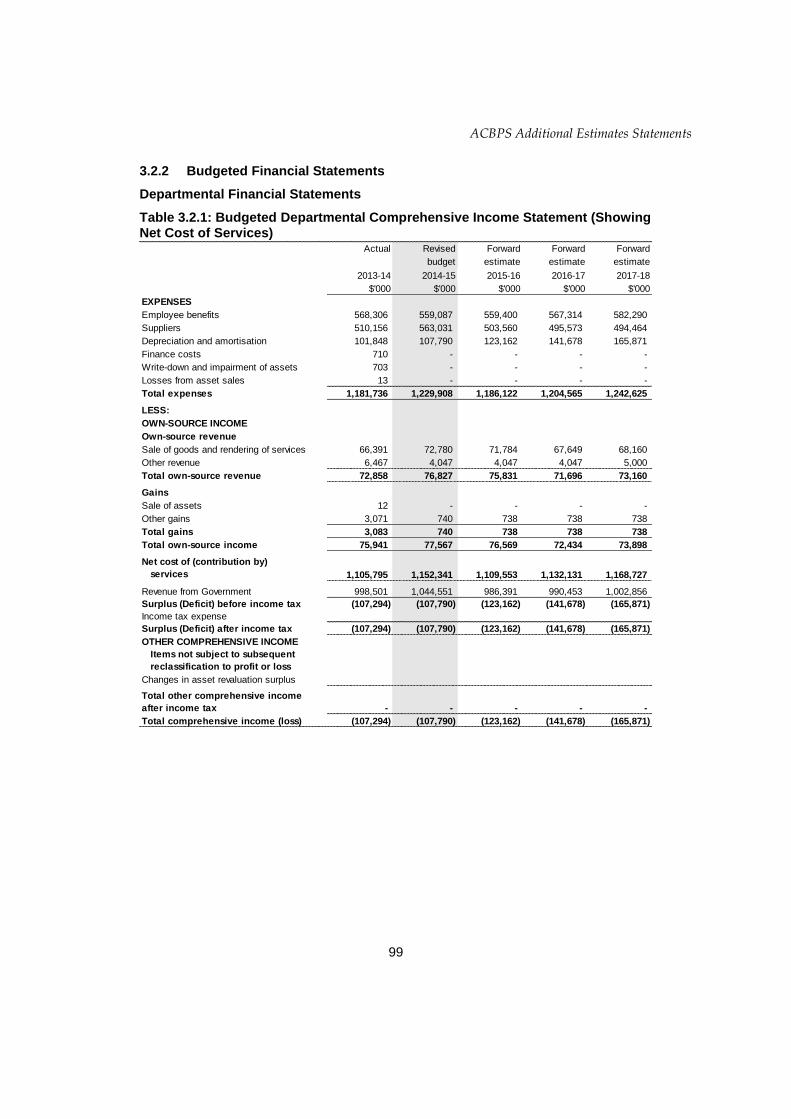
Total expenses for 2014-15 are estimated to be $1,229.908m, a net increase of $66.335m
since the 2014-15 Portfolio Budget Statements. This movement is a result of:
an increase of $51.974m in supplier expenses and an increase of $14.361m in
employee benefits reflecting the estimated expenses associated with
government decisions.
ACBPS Additional Estimates Statements
97
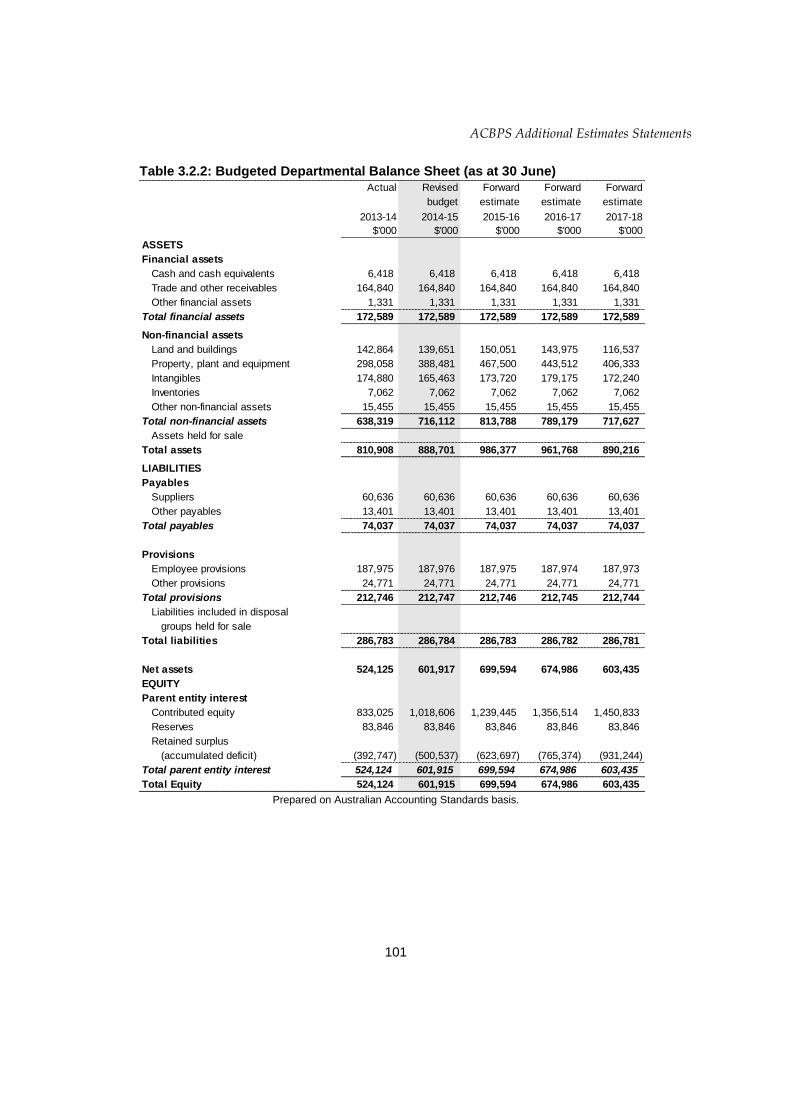
Balance sheet
The estimated 2014-15 net assets (equity) of $601.917m represents a net increase of $13.439m from the 2014-15 Portfolio Budget Statements. The variance is primarily due to the combined effect of the impact of the 2013-14 actuals flowing through to the 2014-15 opening balances and the net impact of government decisions.
The estimated total assets are $888.701m, representing a net decrease of $7.058m from
the 2014-15 Portfolio Budget Statements. The decrease is primarily due to 2013-14
actuals flowing through to the 2014-15 opening balances and the net impact of
government decisions.
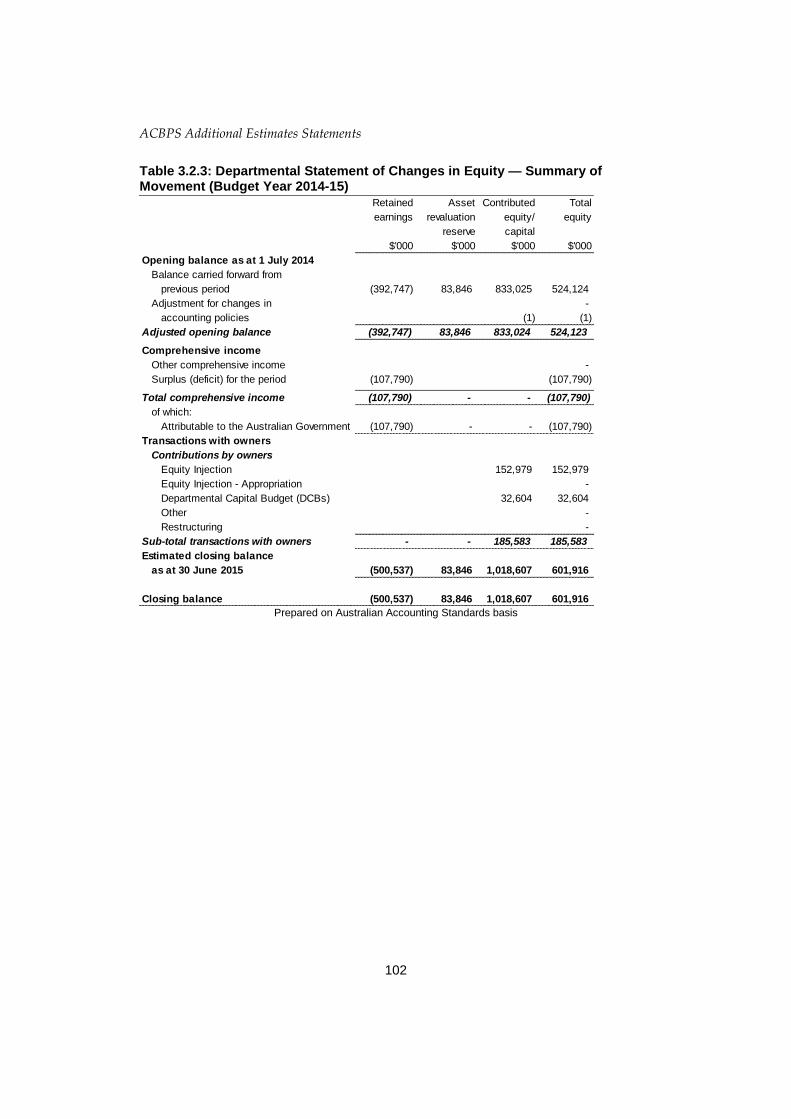
Statement of changes in equity
The changes in equity estimates from the 2014-15 Portfolio Budget Statements are due
to the impact of the 2013-14 actuals flowing through to the 2014-15 opening balances
and the net impact of government decisions.
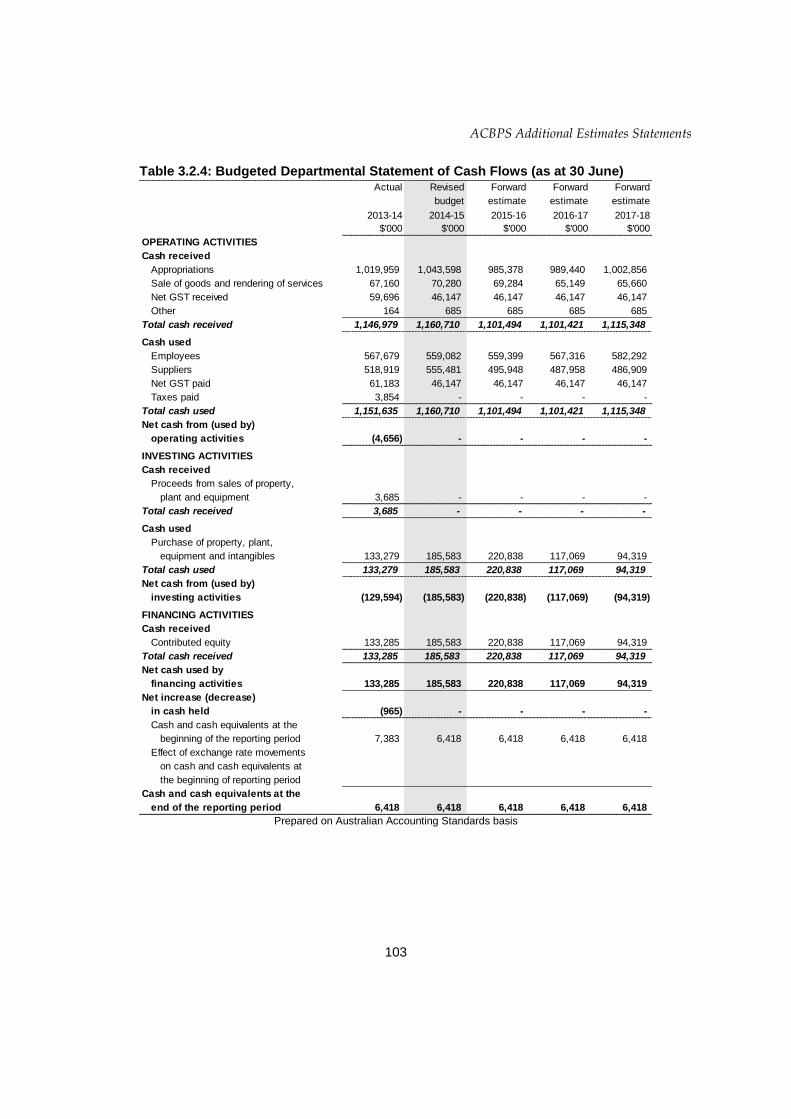
Statement of cash flows
Changes to the statement of cash flows from the 2014-15 Portfolio Budget Statements
are due to the movements in the income statement result from funding to be received
through measures and adjustments, but excluding the impact of depreciation and
amortisation.
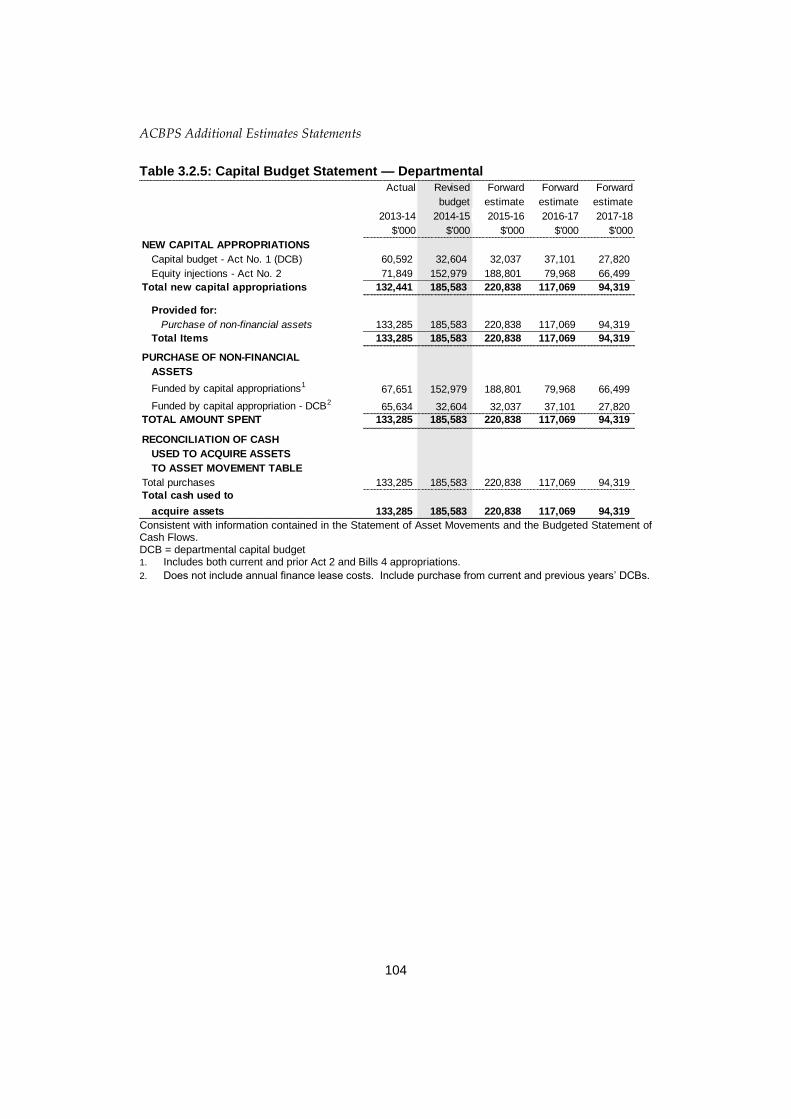
Capital budget statement
Changes to the capital budget statement from the 2014-15 Portfolio Budget Statements
are due to:
funding of $16.473m to implement the National Security - additional counter-
terrorism funding measure;
funding of $11.780m to implement the Maintaining the response capability for
Illegal Maritime Arrivals Authority measure; and
a reduction in funding of $18.717m in relation to the reallocation of
Appropriation Act No. 4 to Appropriation Act no. 3 to the 2014-15 Budget
measure Smaller Government – strengthen and enhance Australia’s border protection
services.
ACBPS Additional Estimates Statements
98
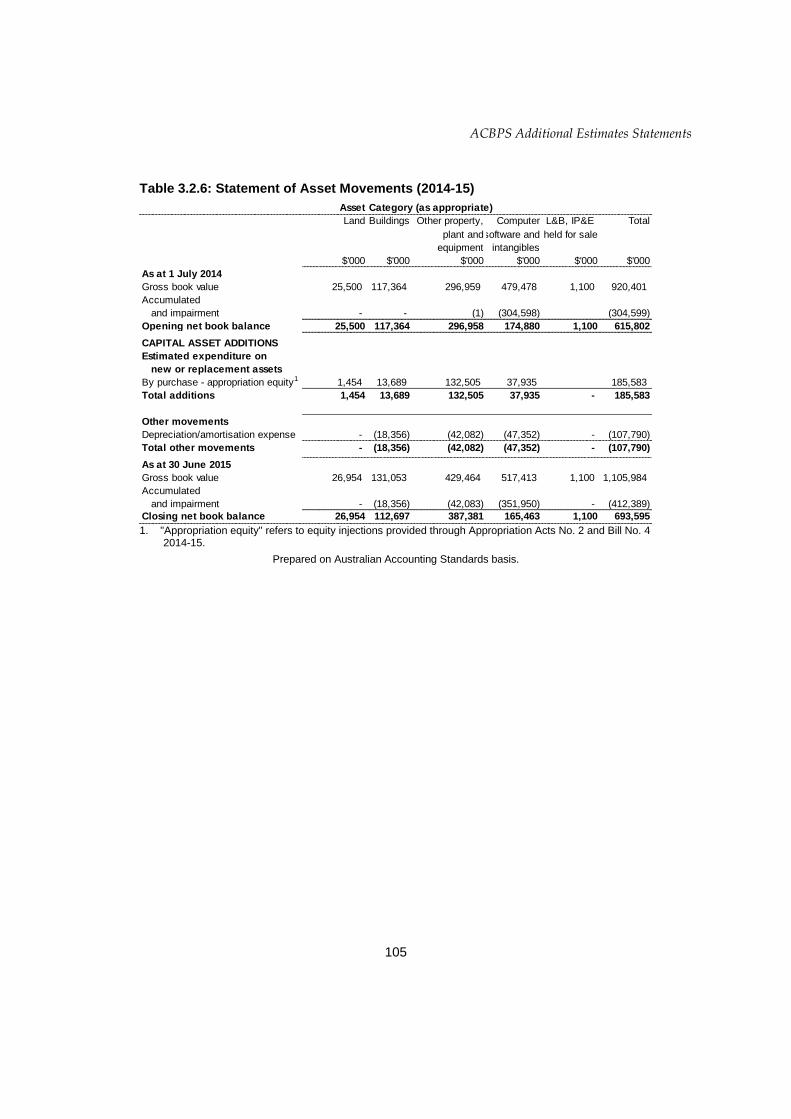
Statement of asset movements
Changes to the statement of asset movements from the 2014-15 Portfolio Budget
Statements are due to the impact of the 2014-15 Portfolio Budget Statements are due to
the impact of the 2013-14 actuals flowing through to the 2014-15 opening balances and
the net impact of government decisions.
Administered
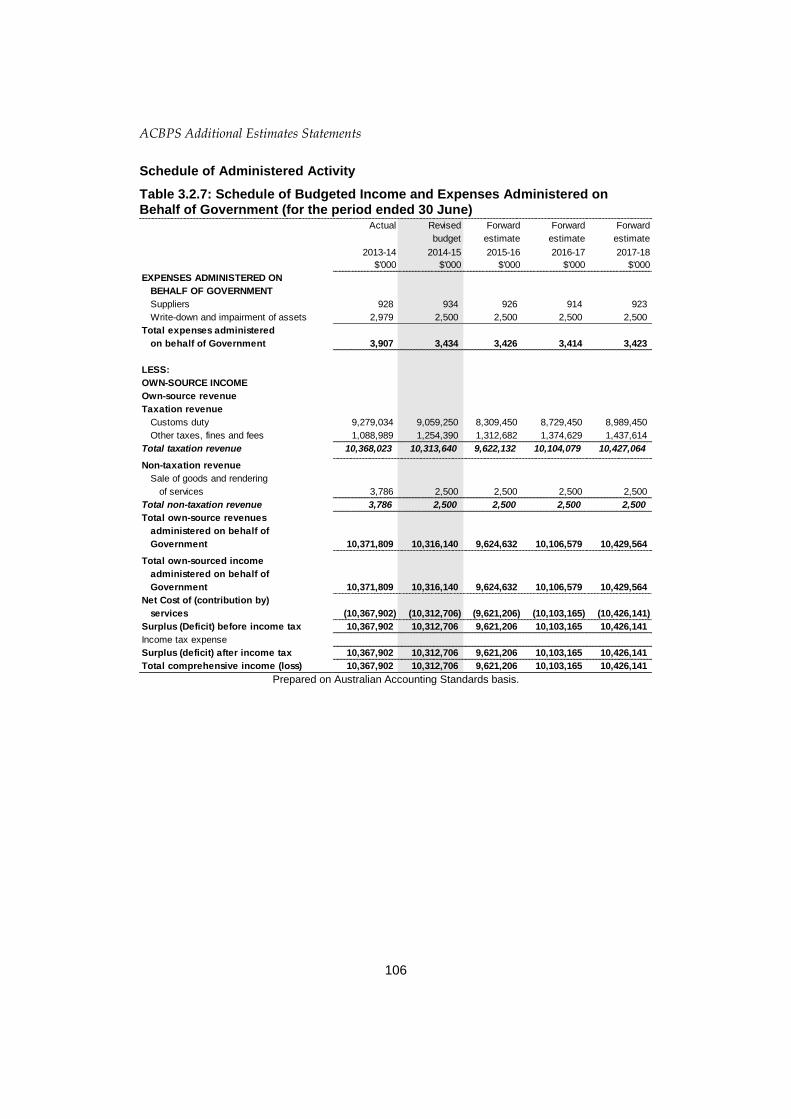
Schedule of budgeted income and expenses
In 2014-15 the ACBPS is estimated to collect $9,059.3 million in customs duty, a
decrease of $219.3 million (or 2.4%) over the 2013-14 actual results. This decrease is
due to the combined impact of government measures, changes in economic parameters
and an adjustment to the estimate for Refunds and Drawbacks.
The forward estimates include a provision for the Chine-Australia Free Trade
Agreement.
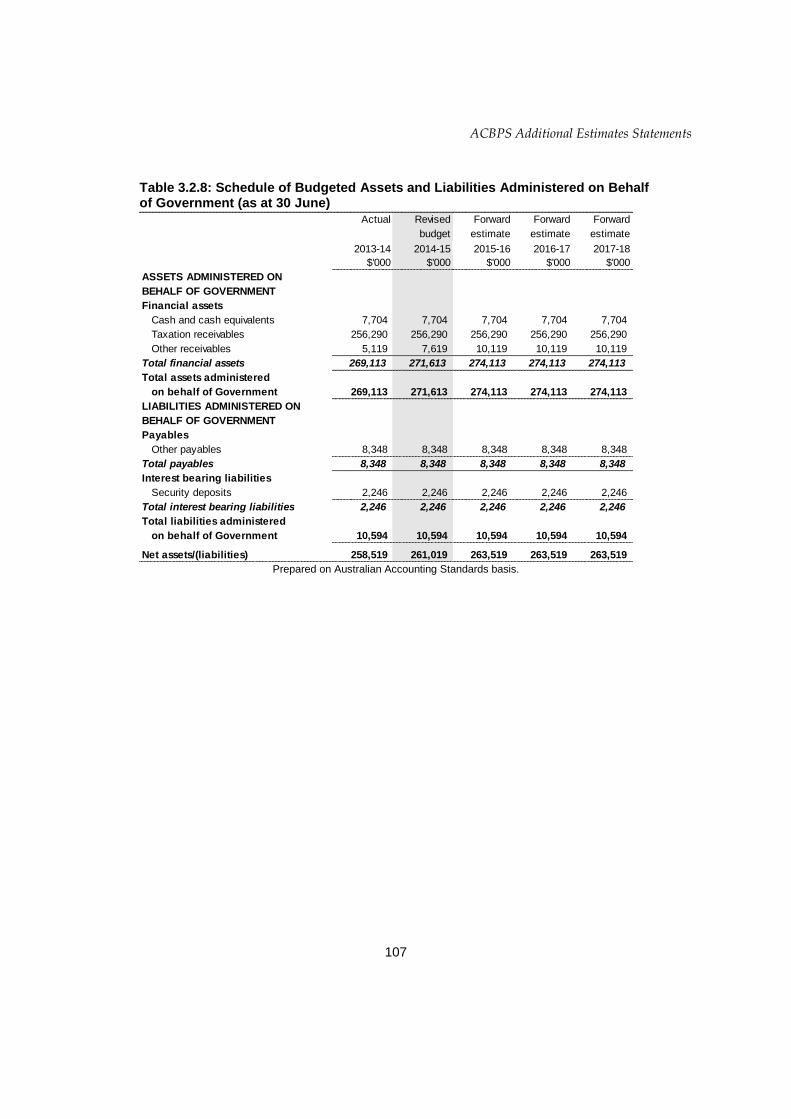
Schedule of budgeted assets and liabilities
The variance between the 2014-15 Portfolio Budget Statements estimates and the
revised estimates is due to the impact of the 2013-14 actuals flowing through to the
2014-15 opening balances.
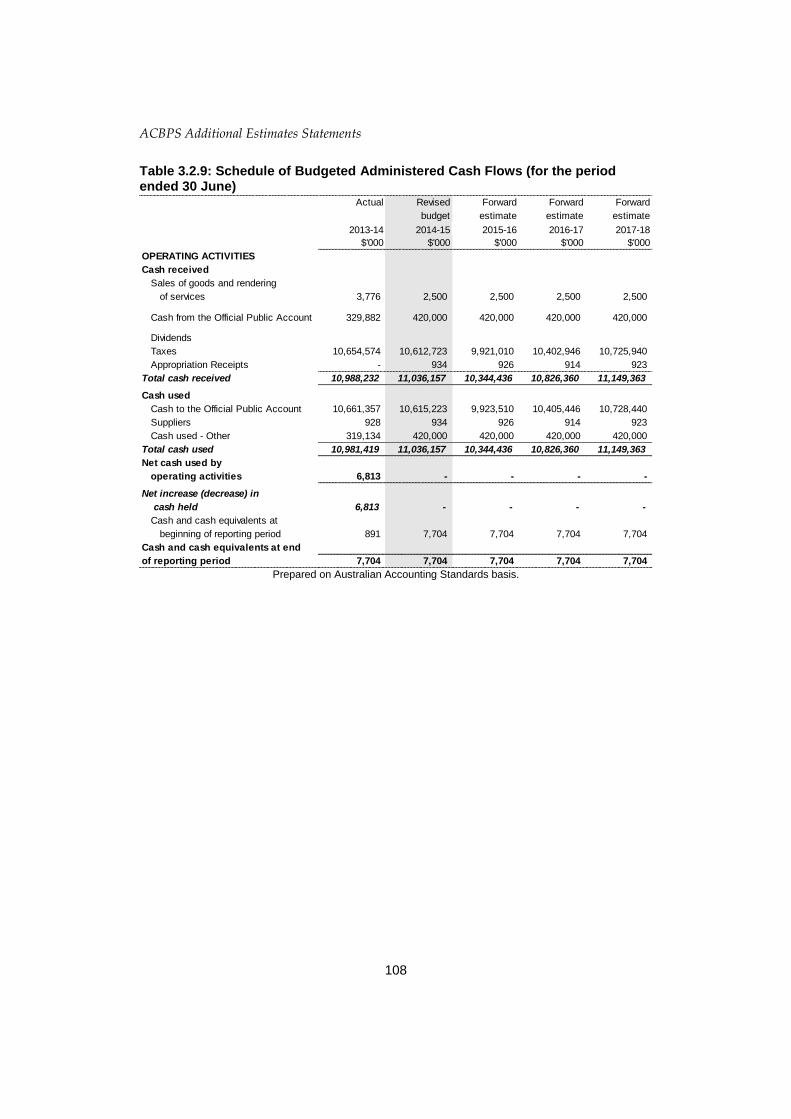
Schedule of administered cash flows
The changes in the budget administered cash flows reflect the adjustments made to
revenues collected by ACBPS on behalf of the Australian Government.
ACBPS Additional Estimates Statements
99
3.2.2 Budgeted Financial Statements
Departmental Financial Statements
Table 3.2.1: Budgeted Departmental Comprehensive Income Statement (Showing Net Cost of Services)
Actual Revised Forward Forward Forward
budget estimate estimate estimate
2013-14 2014-15 2015-16 2016-17 2017-18
$'000 $'000 $'000 $'000 $'000
EXPENSES
Employee benefits 568,306 559,087 559,400 567,314 582,290
Suppliers 510,156 563,031 503,560 495,573 494,464
Depreciation and amortisation 101,848 107,790 123,162 141,678 165,871
Finance costs 710 - - - -
Write-down and impairment of assets 703 - - - -
Losses from asset sales 13 - - - -
Total expenses 1,181,736 1,229,908 1,186,122 1,204,565 1,242,625
LESS:
OWN-SOURCE INCOME
Own-source revenue
Sale of goods and rendering of services 66,391 72,780 71,784 67,649 68,160
Other revenue 6,467 4,047 4,047 4,047 5,000
Total own-source revenue 72,858 76,827 75,831 71,696 73,160
Gains
Sale of assets 12 - - - -
Other gains 3,071 740 738 738 738
Total gains 3,083 740 738 738 738
Total own-source income 75,941 77,567 76,569 72,434 73,898
Net cost of (contribution by)
services 1,105,795 1,152,341 1,109,553 1,132,131 1,168,727
Revenue from Government 998,501 1,044,551 986,391 990,453 1,002,856
Surplus (Deficit) before income tax (107,294) (107,790) (123,162) (141,678) (165,871)
Income tax expense
Surplus (Deficit) after income tax (107,294) (107,790) (123,162) (141,678) (165,871)
OTHER COMPREHENSIVE INCOME
Items not subject to subsequent
reclassification to profit or loss
Changes in asset revaluation surplus
Total other comprehensive income
after income tax - - - - -
Total comprehensive income (loss) (107,294) (107,790) (123,162) (141,678) (165,871)
ACBPS Additional Estimates Statements
100
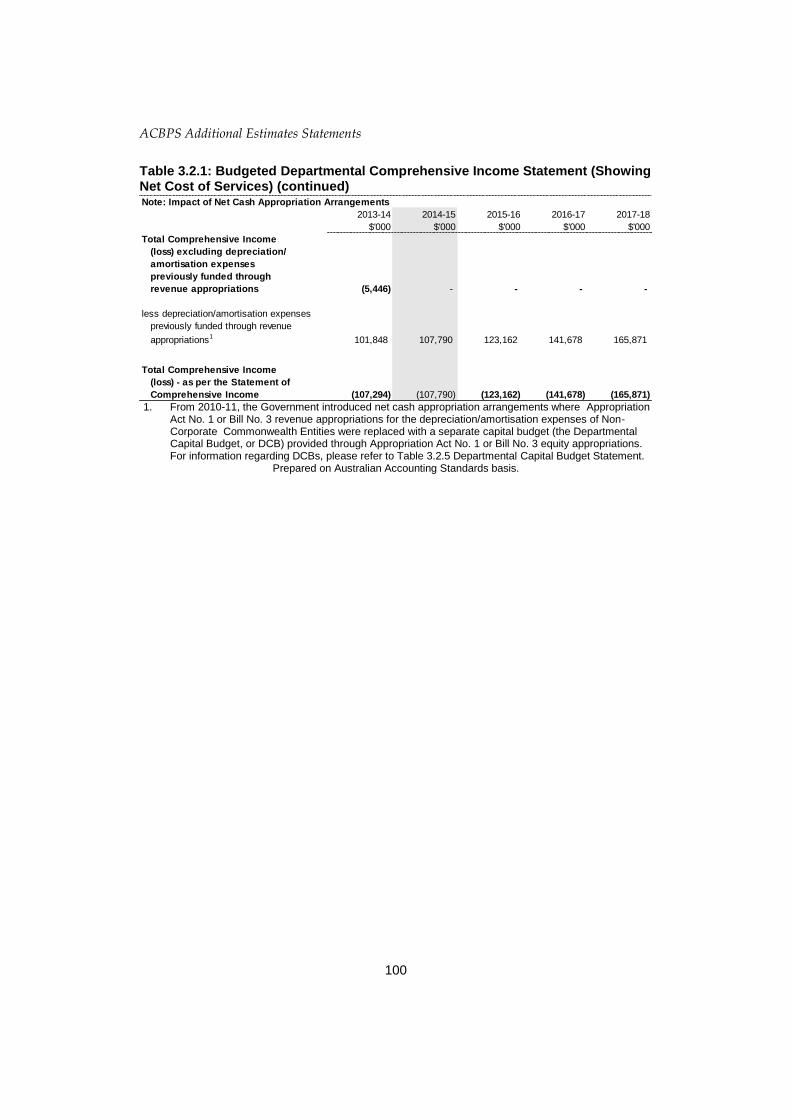
Table 3.2.1: Budgeted Departmental Comprehensive Income Statement (Showing Net Cost of Services) (continued)
1. From 2010-11, the Government introduced net cash appropriation arrangements where Appropriation Act No. 1 or Bill No. 3 revenue appropriations for the depreciation/amortisation expenses of Non- Corporate Commonwealth Entities were replaced with a separate capital budget (the Departmental Capital Budget, or DCB) provided through Appropriation Act No. 1 or Bill No. 3 equity appropriations. For information regarding DCBs, please refer to Table 3.2.5 Departmental Capital Budget Statement.
Prepared on Australian Accounting Standards basis.
Note: Impact of Net Cash Appropriation Arrangements
2013-14 2014-15 2015-16 2016-17 2017-18
$'000 $'000 $'000 $'000 $'000
Total Comprehensive Income
(loss) excluding depreciation/
amortisation expenses
previously funded through
revenue appropriations (5,446) - - - -
less depreciation/amortisation expenses
previously funded through revenue
appropriations1 101,848 107,790 123,162 141,678 165,871
Total Comprehensive Income
(loss) - as per the Statement of
Comprehensive Income (107,294) (107,790) (123,162) (141,678) (165,871)
ACBPS Additional Estimates Statements
101
Table 3.2.2: Budgeted Departmental Balance Sheet (as at 30 June)
Prepared on Australian Accounting Standards basis.
Actual Revised Forward Forward Forward
budget estimate estimate estimate
2013-14 2014-15 2015-16 2016-17 2017-18
$'000 $'000 $'000 $'000 $'000
ASSETS
Financial assets
Cash and cash equivalents 6,418 6,418 6,418 6,418 6,418
Trade and other receivables 164,840 164,840 164,840 164,840 164,840
Other financial assets 1,331 1,331 1,331 1,331 1,331
Total financial assets 172,589 172,589 172,589 172,589 172,589
Non-financial assets
Land and buildings 142,864 139,651 150,051 143,975 116,537
Property, plant and equipment 298,058 388,481 467,500 443,512 406,333
Intangibles 174,880 165,463 173,720 179,175 172,240
Inventories 7,062 7,062 7,062 7,062 7,062
Other non-financial assets 15,455 15,455 15,455 15,455 15,455
Total non-financial assets 638,319 716,112 813,788 789,179 717,627
Assets held for sale
Total assets 810,908 888,701 986,377 961,768 890,216
LIABILITIES
Payables
Suppliers 60,636 60,636 60,636 60,636 60,636
Other payables 13,401 13,401 13,401 13,401 13,401
Total payables 74,037 74,037 74,037 74,037 74,037
Provisions
Employee provisions 187,975 187,976 187,975 187,974 187,973
Other provisions 24,771 24,771 24,771 24,771 24,771
Total provisions 212,746 212,747 212,746 212,745 212,744
Liabilities included in disposal
groups held for sale
Total liabilities 286,783 286,784 286,783 286,782 286,781
Net assets 524,125 601,917 699,594 674,986 603,435
EQUITY
Parent entity interest
Contributed equity 833,025 1,018,606 1,239,445 1,356,514 1,450,833
Reserves 83,846 83,846 83,846 83,846 83,846
Retained surplus
(accumulated deficit) (392,747) (500,537) (623,697) (765,374) (931,244)
Total parent entity interest 524,124 601,915 699,594 674,986 603,435
Total Equity 524,124 601,915 699,594 674,986 603,435
ACBPS Additional Estimates Statements
102
Table 3.2.3: Departmental Statement of Changes in Equity — Summary of Movement (Budget Year 2014-15)
Prepared on Australian Accounting Standards basis
Retained Asset Contributed Total
earnings revaluation equity/ equity
reserve capital
$'000 $'000 $'000 $'000
Opening balance as at 1 July 2014
Balance carried forward from
previous period (392,747) 83,846 833,025 524,124
Adjustment for changes in -
accounting policies (1) (1)
Adjusted opening balance (392,747) 83,846 833,024 524,123
Comprehensive income
Other comprehensive income -
Surplus (deficit) for the period (107,790) (107,790)
Total comprehensive income (107,790) - - (107,790)
of which:
Attributable to the Australian Government (107,790) - - (107,790)
Transactions with owners
Contributions by owners
Equity Injection 152,979 152,979
Equity Injection - Appropriation -
Departmental Capital Budget (DCBs) 32,604 32,604
Other -
Restructuring -
Sub-total transactions with owners - - 185,583 185,583
Estimated closing balance
as at 30 June 2015 (500,537) 83,846 1,018,607 601,916
Closing balance (500,537) 83,846 1,018,607 601,916
ACBPS Additional Estimates Statements
103
Table 3.2.4: Budgeted Departmental Statement of Cash Flows (as at 30 June)
Prepared on Australian Accounting Standards basis
Actual Revised Forward Forward Forward
budget estimate estimate estimate
2013-14 2014-15 2015-16 2016-17 2017-18
$'000 $'000 $'000 $'000 $'000
OPERATING ACTIVITIES
Cash received
Appropriations 1,019,959 1,043,598 985,378 989,440 1,002,856
Sale of goods and rendering of services 67,160 70,280 69,284 65,149 65,660
Net GST received 59,696 46,147 46,147 46,147 46,147
Other 164 685 685 685 685
Total cash received 1,146,979 1,160,710 1,101,494 1,101,421 1,115,348
Cash used
Employees 567,679 559,082 559,399 567,316 582,292
Suppliers 518,919 555,481 495,948 487,958 486,909
Net GST paid 61,183 46,147 46,147 46,147 46,147
Taxes paid 3,854 - - - -
Total cash used 1,151,635 1,160,710 1,101,494 1,101,421 1,115,348
Net cash from (used by)
operating activities (4,656) - - - -
INVESTING ACTIVITIES
Cash received
Proceeds from sales of property,
plant and equipment 3,685 - - - -
Total cash received 3,685 - - - -
Cash used
Purchase of property, plant,
equipment and intangibles 133,279 185,583 220,838 117,069 94,319
Total cash used 133,279 185,583 220,838 117,069 94,319
Net cash from (used by)
investing activities (129,594) (185,583) (220,838) (117,069) (94,319)
FINANCING ACTIVITIES
Cash received
Contributed equity 133,285 185,583 220,838 117,069 94,319
Total cash received 133,285 185,583 220,838 117,069 94,319
Net cash used by
financing activities 133,285 185,583 220,838 117,069 94,319
Net increase (decrease)
in cash held (965) - - - -
Cash and cash equivalents at the
beginning of the reporting period 7,383 6,418 6,418 6,418 6,418
Effect of exchange rate movements
on cash and cash equivalents at
the beginning of reporting period
Cash and cash equivalents at the
end of the reporting period 6,418 6,418 6,418 6,418 6,418
ACBPS Additional Estimates Statements
104
Table 3.2.5: Capital Budget Statement — Departmental
Consistent with information contained in the Statement of Asset Movements and the Budgeted Statement of Cash Flows. DCB = departmental capital budget 1. Includes both current and prior Act 2 and Bills 4 appropriations.
2. Does not include annual finance lease costs. Include purchase from current and previous years’ DCBs.
Actual Revised Forward Forward Forward
budget estimate estimate estimate
2013-14 2014-15 2015-16 2016-17 2017-18
$'000 $'000 $'000 $'000 $'000
NEW CAPITAL APPROPRIATIONS
Capital budget - Act No. 1 (DCB) 60,592 32,604 32,037 37,101 27,820
Equity injections - Act No. 2 71,849 152,979 188,801 79,968 66,499
Total new capital appropriations 132,441 185,583 220,838 117,069 94,319
Provided for:
Purchase of non-financial assets 133,285 185,583 220,838 117,069 94,319
Total Items 133,285 185,583 220,838 117,069 94,319
PURCHASE OF NON-FINANCIAL
ASSETS
Funded by capital appropriations167,651 152,979 188,801 79,968 66,499
Funded by capital appropriation - DCB265,634 32,604 32,037 37,101 27,820
TOTAL AMOUNT SPENT 133,285 185,583 220,838 117,069 94,319
RECONCILIATION OF CASH
USED TO ACQUIRE ASSETS
TO ASSET MOVEMENT TABLE
Total purchases 133,285 185,583 220,838 117,069 94,319
Total cash used to
acquire assets 133,285 185,583 220,838 117,069 94,319
ACBPS Additional Estimates Statements
105
Table 3.2.6: Statement of Asset Movements (2014-15)
1. "Appropriation equity" refers to equity injections provided through Appropriation Acts No. 2 and Bill No. 4 2014-15.
Prepared on Australian Accounting Standards basis.
Asset Category (as appropriate)
Land Buildings Other property, Computer L&B, IP&E Total
plant andsoftware and held for sale
equipment intangibles
$'000 $'000 $'000 $'000 $'000 $'000
As at 1 July 2014
Gross book value 25,500 117,364 296,959 479,478 1,100 920,401
Accumulated
and impairment - - (1) (304,598) (304,599)
Opening net book balance 25,500 117,364 296,958 174,880 1,100 615,802-
CAPITAL ASSET ADDITIONS
Estimated expenditure on
new or replacement assets
By purchase - appropriation equity1 1,454 13,689 132,505 37,935 185,583
Total additions 1,454 13,689 132,505 37,935 - 185,583
Other movements
Depreciation/amortisation expense - (18,356) (42,082) (47,352) - (107,790)
Total other movements - (18,356) (42,082) (47,352) - (107,790)
As at 30 June 2015
Gross book value 26,954 131,053 429,464 517,413 1,100 1,105,984
Accumulated
and impairment - (18,356) (42,083) (351,950) - (412,389)
Closing net book balance 26,954 112,697 387,381 165,463 1,100 693,595
ACBPS Additional Estimates Statements
106
Schedule of Administered Activity
Table 3.2.7: Schedule of Budgeted Income and Expenses Administered on Behalf of Government (for the period ended 30 June)
Prepared on Australian Accounting Standards basis.
Actual Revised Forward Forward Forward
budget estimate estimate estimate
2013-14 2014-15 2015-16 2016-17 2017-18
$'000 $'000 $'000 $'000 $'000
EXPENSES ADMINISTERED ON
BEHALF OF GOVERNMENT
Suppliers 928 934 926 914 923
Write-down and impairment of assets 2,979 2,500 2,500 2,500 2,500
Total expenses administered
on behalf of Government 3,907 3,434 3,426 3,414 3,423
LESS:
OWN-SOURCE INCOME
Own-source revenue
Taxation revenue
Customs duty 9,279,034 9,059,250 8,309,450 8,729,450 8,989,450
Other taxes, fines and fees 1,088,989 1,254,390 1,312,682 1,374,629 1,437,614
Total taxation revenue 10,368,023 10,313,640 9,622,132 10,104,079 10,427,064
Non-taxation revenue
Sale of goods and rendering
of services 3,786 2,500 2,500 2,500 2,500
Total non-taxation revenue 3,786 2,500 2,500 2,500 2,500
Total own-source revenues
administered on behalf of
Government 10,371,809 10,316,140 9,624,632 10,106,579 10,429,564
Total own-sourced income
administered on behalf of
Government 10,371,809 10,316,140 9,624,632 10,106,579 10,429,564
Net Cost of (contribution by)
services (10,367,902) (10,312,706) (9,621,206) (10,103,165) (10,426,141)
Surplus (Deficit) before income tax 10,367,902 10,312,706 9,621,206 10,103,165 10,426,141
Income tax expense
Surplus (deficit) after income tax 10,367,902 10,312,706 9,621,206 10,103,165 10,426,141
Total comprehensive income (loss) 10,367,902 10,312,706 9,621,206 10,103,165 10,426,141
ACBPS Additional Estimates Statements
107
Table 3.2.8: Schedule of Budgeted Assets and Liabilities Administered on Behalf of Government (as at 30 June)
Prepared on Australian Accounting Standards basis.
Actual Revised Forward Forward Forward
budget estimate estimate estimate
2013-14 2014-15 2015-16 2016-17 2017-18
$'000 $'000 $'000 $'000 $'000
ASSETS ADMINISTERED ON
BEHALF OF GOVERNMENT
Financial assets
Cash and cash equivalents 7,704 7,704 7,704 7,704 7,704
Taxation receivables 256,290 256,290 256,290 256,290 256,290
Other receivables 5,119 7,619 10,119 10,119 10,119
Total financial assets 269,113 271,613 274,113 274,113 274,113
Total assets administered
on behalf of Government 269,113 271,613 274,113 274,113 274,113
LIABILITIES ADMINISTERED ON
BEHALF OF GOVERNMENT
Payables
Other payables 8,348 8,348 8,348 8,348 8,348
Total payables 8,348 8,348 8,348 8,348 8,348
Interest bearing liabilities
Security deposits 2,246 2,246 2,246 2,246 2,246
Total interest bearing liabilities 2,246 2,246 2,246 2,246 2,246
Total liabilities administered
on behalf of Government 10,594 10,594 10,594 10,594 10,594
Net assets/(liabilities) 258,519 261,019 263,519 263,519 263,519
ACBPS Additional Estimates Statements
108
Table 3.2.9: Schedule of Budgeted Administered Cash Flows (for the period ended 30 June)
Prepared on Australian Accounting Standards basis.
Actual Revised Forward Forward Forward
budget estimate estimate estimate
2013-14 2014-15 2015-16 2016-17 2017-18
$'000 $'000 $'000 $'000 $'000
OPERATING ACTIVITIES
Cash received
Sales of goods and rendering
of services 3,776 2,500 2,500 2,500 2,500
Cash from the Official Public Account 329,882 420,000 420,000 420,000 420,000
Dividends
Taxes 10,654,574 10,612,723 9,921,010 10,402,946 10,725,940
Appropriation Receipts - 934 926 914 923
Total cash received 10,988,232 11,036,157 10,344,436 10,826,360 11,149,363
Cash used
Cash to the Official Public Account 10,661,357 10,615,223 9,923,510 10,405,446 10,728,440
Suppliers 928 934 926 914 923
Cash used - Other 319,134 420,000 420,000 420,000 420,000
Total cash used 10,981,419 11,036,157 10,344,436 10,826,360 11,149,363
Net cash used by
operating activities 6,813 - - - -
Net increase (decrease) in
cash held 6,813 - - - -
Cash and cash equivalents at
beginning of reporting period 891 7,704 7,704 7,704 7,704
Cash and cash equivalents at end
of reporting period 7,704 7,704 7,704 7,704 7,704
ACBPS Additional Estimates Statements
109
Notes to the Financial Statements
Basis of accounting
The budgeted financial statements have been prepared on an accrual accounting basis, having regard to Statements of Accounting Concepts, and in accordance with the Finance Minister’s Orders, Australian Accounting Standards and other authoritative pronouncements of the Australian Accounting Standards Board.
Departmental
Revenue from government
Amounts appropriated for programmes are recognised as revenue, except for certain amounts that relate to activities that are reciprocal in nature, in which case revenue is recognised only when it has been earned. Appropriations receivable are recognised at their nominal amounts.
Employee expenses
Employee expenses consist of salaries, leave entitlements, redundancy expenses, superannuation and non-salary benefits.
Supplier expenses
Supplier expenses consist of administrative costs, consultants’ costs, travel expenses and property operating expenses.
Cash
Cash includes notes and coins held and any deposits held at call with a bank or other financial institution.
Assets
Assets are made up of cash, receivables, leasehold improvements and plant and equipment. All assets are held at fair value.
Liabilities
Liabilities are made up of employee salary and leave entitlements, property lease make-good provisions and amounts owed to creditors.
Administered
Revenues
All administered revenues relate to the core operating activities performed by the ACBPS on behalf of the Australian Government, including the collection of customs duty, revenue associated with the Tourist Refund Scheme and revenue associated with the passenger movement charge.