
Australia will gain from continued Asia Pacific trade ...
28
Peter A. Petri Brandeis International Business School Michael G. Plummer Johns Hopkins University Modelling Report September 2018
Transcript of Australia will gain from continued Asia Pacific trade ...

Peter A. PetriBrandeis International Business School
Michael G. PlummerJohns Hopkins University
Modelling Report
September 2018
This report on the economic impacts of the Trans-Pacific Partnership and other regional trade agreements on Australia was commissioned as a contribution to public discussion of trade policy on behalf of leading industry groups including: About the authors
Peter A. Petri is the Carl J. Shapiro Professor of International Finance at the Brandeis International Business School (IBS) and a Visiting Fellow at the Peterson Institute for International Economics. He was founding Dean of IBS from 1994 to 2006 and Interim Dean from 2016 to 2018, and has held visiting appointments at the Asian Development Bank Institute, the Brookings Institution, Fudan University, Keio University, Peking University, the OECD and the World Bank. He has consulted for APEC, the Asian Development Bank, the Asian Development Bank Institute, the World Bank and various governments.
Michael G. Plummer is the Director of SAIS Europe and Eni Professor of International Economics at the Johns Hopkins University, as well as (non-resident) Senior Fellow of the East-West Center. He was Head of the Development Division of the OECD between 2010 and 2012, and an Associate Professor of Economics at Brandeis University from 1992 to 2001. He has also been a Fulbright Chair in Economics and Pew Fellow in International Affairs, Harvard University; a research professor at Kobe University; and a Visiting Fellow at ISEAS, the University of Auckland and Doshisha University.
FTAFREIGHT & TRADE ALLIANCE

Contents6 Introduction 7 CPTPP 7 RCEP 8 Alternative policy scenarios 9 Modelling framework10 Real income effects12 Trade effects14 Sectoral effects15 Conclusions 16 Endnotes17 References 18 Modelling results
Charts and tables
11 Chart 1 Income gains in 203013 Chart 2 Export increases in 2030
18 Table 1 Australia’s free trade agreements19 Table 2 Trade policy scenarios for the Asia-Pacific20 Table 3 Incomes in 2030 (EV)21 Table 4 Exports in 203022 Table 5 Australian export destinations23 Table 6 Australian import destinations24 Table 7 Export composition changes, 203025 Table 8 Import composition changes, 203026 Table 9 Output composition changes, 2030

4 Peter A. Petri and Michael G. Plummer

5Australia will gain from continued Asia-Pacific trade integration
The two most important pathways are the Comprehensive and Progressive Trans-Pacific Partnership (CPTPP) process, which is based on an agreement among the remaining 11 members of the TPP and is likely to expand in the future, and the Regional Comprehensive Economic Partnership (RCEP) process among 16 Asian economies.
Australia stands to enjoy real income gains on both of these pathways. However, since Australia is already benefiting from its own liberal trade policies and many prior trade agreements, as well as from other negotiations currently underway, its benefits are relatively modest, typically below one per cent of real income. The withdrawal of the United States from the TPP is projected to cut its gains from the CPTPP by about 25 per cent; nevertheless, the expansion of the CPTPP to 16 members would more than offset the adverse effects of the departure of the United States.
Deeper integration through regional agreements will generate additional trade and output gains in Australia’s sectors of comparative advantage, including agriculture, mining, early stage processing activities related to these sectors and services. It also reduces slightly Australia’s output of durable manufactured products, which in turn represent areas of comparative advantages for key Asian partners. Agriculture and mining would be among industries benefiting from deeper integration.
New Asia-Pacific agreement or agreements would keep trade liberalisation on the global agenda and likely attract further cooperation from large partners, including Europe. Eventually, even the United States might find that it is losing out and change its mind about joining these larger trade blocs, with attendant benefits for Australia’s economy.
Abstract
In the wake of the withdrawal of the United States from the Trans-Pacific Partnership (TPP) in early 2017, other countries in the region have accelerated their efforts to conclude trade agreements and form more effective coalitions against rising protectionism.
Deeper integration through regional agreements will generate additional trade
and output gains in Australia’s sectors of comparative advantage.
6 Peter A. Petri and Michael G. Plummer
The withdrawal of the United States from the Trans-Pacific Partnership (TPP) in 2017 upended the Asia-Pacific trade agenda. In subsequent months, US trade policy actions and threats further raised uncertainty about the region’s international prospects. However, in recent months a new agenda has begun to take shape, confirming the region’s commitment to rules-based trade and even using the TPP and other regional negotiations as frameworks for promoting this agenda.
The shift to this new agenda is unprecedented and difficult. Historically, the United States offered not only the economic benefits of access to the world’s largest single market, but also leadership for managing negotiations. It supported regional economic integration by partnering with allies to build trans-Pacific institutions such as the Pacific Economic Cooperation Council (1980), the Asia-Pacific Economic Cooperation (1989) forum and the Enterprise for ASEAN Initiative (2002). It signed bilateral trade agreements with Australia, Canada, Chile, Mexico, Peru, Singapore and South Korea. Most recently, before President Trump, it envisioned an ‘Asian pivot’ that deepened ties through a high-standard TPP agreement.
Without the United States, a reasonably diverse Asian leadership has begun to emerge. The Comprehensive and Progressive Trans-Pacific Partnership (CPTPP)
track has been led by Japan, the largest member of this block after the departure of the United States, with strong contributions from Singapore, Australia and New Zealand, Latin American participants like Chile, and support from prospective members such as Thailand and Indonesia who in July 2018 participated in enlargement discussions.1
The Regional Comprehensive Economic Partnership (RCEP) track comprises 16 Asian economies, including notably India, and remains guided by China, Japan and Indonesia, often playing the role of representing ASEAN. Australia is also an active participant in RCEP negotiations.2
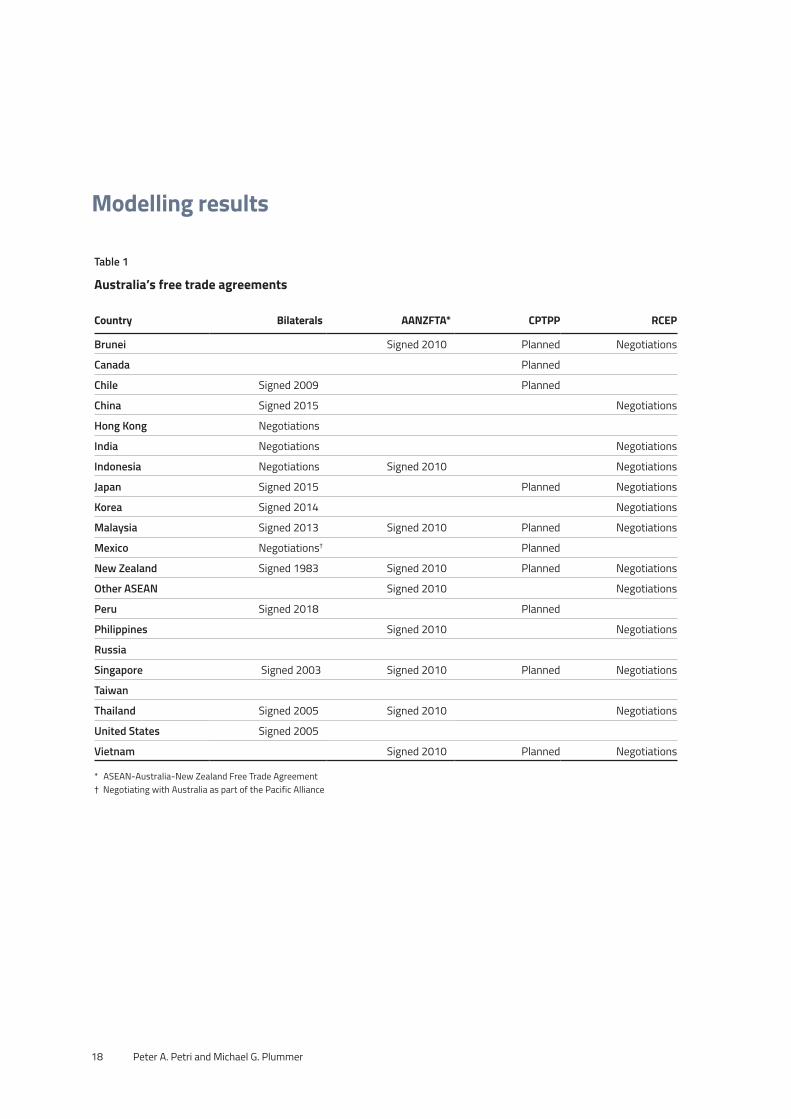
Indeed, although smaller than Japan, Australia has played a critical intellectual leadership role in these negotiations. Its Closer Economic Relations agreement with New Zealand set an early benchmark for high quality trade agreements and its inventory of agreements and negotiations in the region—defined as the 21-member economies of APEC—is extensive. As Table 1 shows, Australia has free trade agreements with 15 regional economies (counting also those included in the ASEAN-Australia-New Zealand agreement). Negotiations are underway with three more (Hong Kong, India and Mexico) leaving only Canada, Russia and Taiwan uncovered. Canada will be included in the CPTPP agreement.
Introduction
Australia has played a critical intellectual leadership
role in these [CPTPP and RCEP] negotiations.
7Australia will gain from continued Asia-Pacific trade integration
Efforts to sustain the TPP framework without the United States began shortly after President Trump announced the US withdrawal. Several countries, including Australia and New Zealand, indicated interest at a meeting in Vina del Mar in Chile in March 2017. Although Prime Minister Shinzo Abe of Japan deflated these efforts at first, perhaps anticipating an early return of the United States, by April 2017 he had appointed a deputy foreign minister as chief negotiator for a TPP without the United States.3 A series of high-level meetings followed and at the November 2017 APEC meetings in Vietnam the trade ministers of the 11 members agreed to the ’core elements’ of the CPTPP. The agreement was signed on 8 March 2018 by the 11 ministers in Santiago in Chile. At this writing, Mexico, Japan and Singapore have ratified the agreement.
Some provisions of the original TPP were suspended in the CPTPP. These included measures advocated primarily by the United States, such as market access for express carriers, extension of copyrights, extension of patents in case of delays and eight-year data-exclusivity protection for biosimilar drugs.4 Thus, some provisions that US negotiators fought hardest to achieve may now be falling by the wayside as the negotiations move forward without US participation. The resulting agreement may generate even stronger incentives for others to join. The agreement is structured as a ’living agreement’ with an accession clause designed to attract new members. Indonesia, Korea, the Philippines, Taiwan and Thailand all indicated interest in membership as the agreement was negotiated. Even the United Kingdom has expressed interest in joining post-Brexit.
CPTPP
RCEP is the culmination of three decades of Asia-centered integration efforts. It was launched by the ASEAN process, although China has played an important role in the negotiations (Petri and Plummer 2014).5 RCEP’s Principles envision ’a modern, comprehensive, high-quality and mutually beneficial economic partnership agreement … [to] cover trade in goods, trade in services, investment, economic and technical cooperation, intellectual property, competition, dispute settlement’ (ASEAN 2012). But the Principles also stress flexibility, so RCEP will include special and differential treatment for developing country members and is likely to avoid areas such as labour and environmental standards.
After the 22nd round of RCEP negotiations concluded in Tokyo on 1 July 2018, Gao Yan, Vice Minister of Commerce of China, noted that the negotiations had accelerated in pace.6 Trade ministers pledged to
endorse a ‘package of outcomes’ by the end of 2018, outlining the major results of the RCEP negotiations. Although previous deadlines have been missed, as often happens in negotiations, there appears to be forward momentum. RCEP would be an unusually impressive achievement—the largest and most sophisticated trade agreement ever negotiated by primarily developing economies.
Impediments to a conclusion include tariff concessions by India, which offered to eliminate only 80 per cent of tariffs on traded goods compared with 92 per cent by other economies. India, in turn, is asking for significant liberalisation of the temporary movement of professional workers, especially in the information technology sector, a sensitive area for some countries.7 If and when RCEP is concluded, the scale of the agreement is likely to dominate the details of its quality.
RCEP

8 Peter A. Petri and Michael G. Plummer
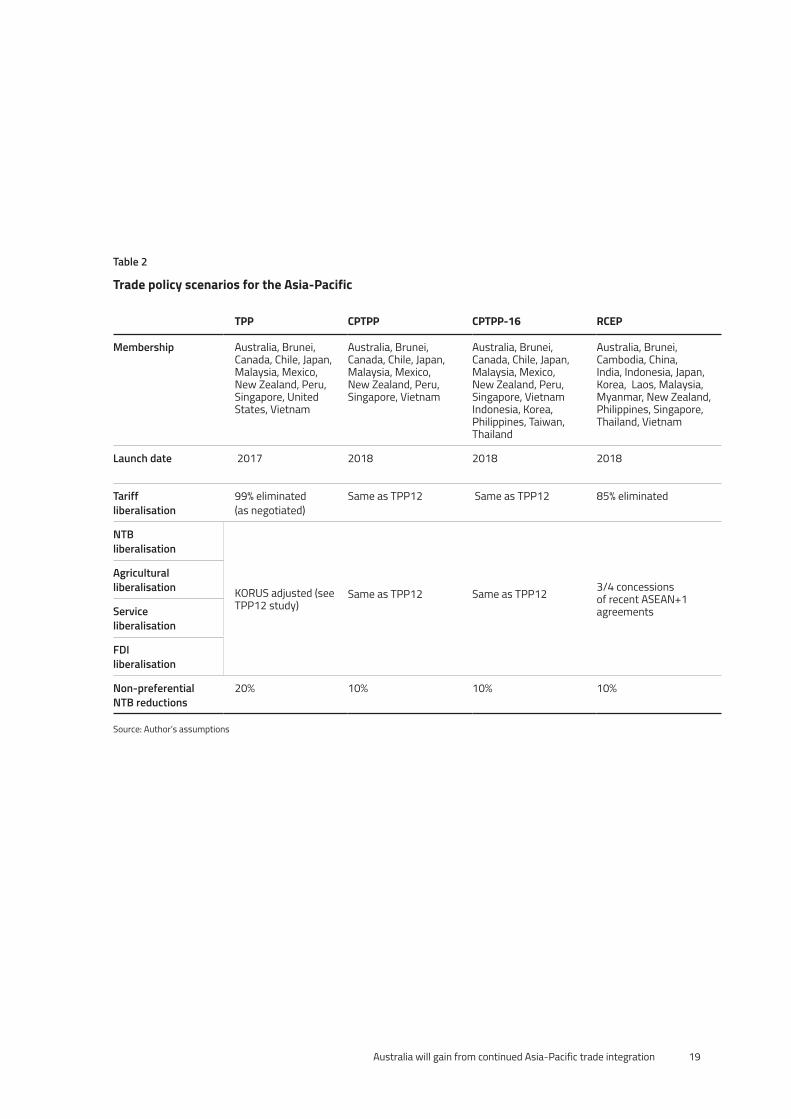
Table 2 operationalises assumptions about changes in trade and investment barriers under different policy scenarios. In addition to the TPP agreement signed on 4 February 2016, the policy scenarios include the 11-member CPTPP agreement reached on 8 March 2018, a 16-member version of the CPTPP which envisions five additional member economies, and RCEP, the 16-member agreement currently under negotiation.
•The TPP simulations are those reported in our earlier work.
•The CPTPP simulations assume most provisions agreed in the TPP, but some impact from suspended provisions. In addition, less spillover since the agreement is smaller.
•The CPTPP with 16 members assumes the same trade barriers as the 11-member CPTPP, but with the addition of Korea, Indonesia, the Philippines, Taiwan and Thailand.
•The RCEP scenario is more speculative than the others; a final agreement remains to be negotiated. Nevertheless, assumptions can be developed from reports of discussions in the 22 negotiating sessions completed so far. The challenge of RCEP is to overcome objections from the least open members in a very diverse membership, which also includes India. Thus, the RCEP assumptions include weaker tariff reductions than ASEAN-plus-one agreements; a limited positive list approach in services; investment provisions but with significant carve-outs; and few improvements in intellectual property rules.8
Alternative policy scenarios
CPTPP is structured as a ‘living agreement’ ... designed to attract new members.
9Australia will gain from continued Asia-Pacific trade integration
This study applies the computable general equilibrium (CGE) model used by Petri and Plummer (2016) and Petri, Plummer and Zhai (2012) to estimate the economic impacts of the different trade agreement scenarios on Australia.9 It does, however, include aggregate effects on other economies/regions. The model has an extensive publication history and detailed explanations of model components are available on the website www.asiapacifictrade.org. Below the essence of the model is described briefly.
The model divides the world into 24 economies and regions and, within each of these, into 18 economic sectors. The model estimates prices and production levels for each sector in each economy and region, as well as a full matrix of bilateral trade flows for each sector among the several economies and regions. In addition, it calculates aggregate results for production (GDP), real income, wages and profits, total exports and imports, and other familiar economic indicators.
The model includes data on various taxes, transport costs and trade barriers that affect the flows of goods and services. Simulations are carried out by first estimating a solution for a baseline configuration of trade barriers (current barriers plus changes already agreed previously) and then by estimating another solution for trade barriers consistent with a new agreement. The economic impact of the agreement is then calculated as the difference between these solutions.
CGE models have become increasingly sophisticated over time but are nevertheless criticised for: (i) underestimating economic changes that result from large and ambitious agreements, such as NAFTA (Kehoe, 2005); (ii) missing important effects such as increases in productivity and international investment; and (iii) overstating the effects of trade agreements by assuming complete regional liberalisation rather than the limited progress that is typically achieved (Productivity Commission, 2010).
Several innovations are incorporated in the model to address these concerns. A new type of trade model is used, incorporating productivity differences among firms within any given sector. In this model, as barriers are reduced, productive firms expand and unproductive ones exit. Also, trade agreements eliminate only a part of pre-agreement barriers. For example, a portion of non-tariff barriers is deemed not to be ‘actionable’, that is, accessible to policy measures. The share of the remaining actionable barriers that are eliminated is based on scores that reflect how the text of the agreement measures up to prior agreements. Finally, the effects of trade liberalisation are calculated only as incremental effects, that is, effects that go beyond changes implemented or committed in previous trade agreements.
Modelling framework

10 Peter A. Petri and Michael G. Plummer
Real income levels (roughly equivalent to GDP) provide an overall summary of the benefits attributable to trade agreements: conceptually, they measure the additional income that would have to be given to the citizens of a country to compensate them for giving up a trade agreement (‘equivalent variation’).
Income changes reported here represent sustained additions to income once a trade policy scenario is fully implemented. Income data are reported in terms of constant 2015 US dollars. The exchange rate in mid-2015 was 1.30 Australian dollars per US dollar. Thus, not only would US$15 billion (A$19.5 billion) be added to Australian incomes in 2030 under the TPP scenario, but a similar percentage would be added indefinitely into the future. The base income level of Australia is estimated to be US$2,590 billion in 2015 US dollars (A$3,367 billion), approximately 2 per cent of world income levels of US$133,801 billion (A$173,941 billion) in 2030.
All scenarios would benefit Australia on a permanent basis. As already noted, however, each of the four alternatives compared in Chart 1 would add less than 1 per cent to income. The reason is simple: Australia already benefits from extensive past liberalisation, especially with Asia-Pacific partners (see the inventory of Asia-Pacific trade agreements in Table 1). These data are tabulated for all economies in Table 3.
Among the policies examined, the ‘old’ TPP would be near the top of the options, raising Australian incomes by US$15 billion (A$19.5 billion) in 2030, or about 0.5 per cent of income.
The exit of the United States from the TPP will reduce Australia’s gains moderately to US$12 billion (A$15.6 billion) under the CPTPP. Although Australia-United States economic integration is protected by the bilateral Australia-US free trade agreement, the US exit would dampen overall regional trade and trade with other regions. For the world as a whole, the US exit reduces gains by US$345 billion (A$449 billion), including US losses from the exit as well as losses by other partners, due to more limited access to US markets.
Yet the decline from the TPP to the CPTPP can be largely offset in the CPTPP-16, which adds five economies that have already expressed strong interest in joining. For Australia, income gains in this scenario would rise to US$17 billion (A$22.1 billion), above TPP levels. For the world as a whole, gains would be US$449 billion (A$584 billion), in the same range but lower than for the TPP, although regional income rises more under the CPTPP-16.
Finally, RCEP would be less productive for Australia than either TPP or the two variants of the CPTPP. This is because Australia already has FTAs with all RCEP partners save India (under negotiation) and the agreement does not appear to offer sufficient improvements over current rules incorporated in those agreements. The worldwide effects of RCEP would also be limited, although almost twice as large as for the 11-member CPTPP.
Foreign Direct Investment (FDI) flows are also likely to increase and contribute to economic efficiency under the CPTPP and TPP liberalisation scenarios.
Real income effects

11Australia will gain from continued Asia-Pacific trade integration
20
15
10
5
0
Chart 1 Australian income gains in 2030 (US$ billion)
TPP CPTPP-16CPTPP RCEP
Under the CPTPP, easing investment barriers will raise the stock of FDI into Australia by US$6 billion, or 0.7 per cent, and stocks of Australian FDI abroad by US$20 billion, or 2.7 per cent in 2030. By comparison, the increases under the TPP with the United States would be 0.9 per cent and 3.0 per cent respectively. Since these gains depend mainly on reduced investment barriers in countries like Japan and not in the United States, the results under the CPTPP and the original TPP are similar. Real factor prices—wages, profits—will tend to rise at rates similar to real income changes; in other
words, the increase in productivity generated by trade policy will be passed on to workers and owners of capital. There are modest differences among the growth of different factor returns—the return to capital and the wages of unskilled workers rise by somewhat more than the wages of skilled workers. This reflects the fact that Australia’s industries of comparative advantage—agriculture, mining and related processing activities—are typically capital intensive. Because real income rises are modest and both unskilled wages and capital returns increase, the net income distribution impact is very small.
...the increase in productivity generated by trade policy will be passed on to workers and owners of capital.

12 Peter A. Petri and Michael G. Plummer
Trade policy affects income primarily by changing trade and investment. Thus, there is reason to expect a strong correlation between the income effects and the export and import effects of the several policy options. The trade results of the alternatives are compared in Chart 2 and shown for all economies in Table 4. (Only exports are shown; since the balance of trade is held fixed under the model’s long-term assumptions, export and import increases are the same.)
Export effects are similar to income effects in relative size (compare Chart 2 vs. Chart 1) but are about twice as large in absolute terms. Since about two-thirds of income effects are caused by the liberalisation of trade, the ratio of export gains to income gains based on trade gains is about three to one. In effect, each dollar of additional trade leads to about 33 cents of additional income. This ratio summarises various interactions within the model, including productivity gains that result from the expansion of productive firms within sectors, and the shift of labour and other resources from less efficient importing sectors to more efficient exporting ones. The ratio in income gain percentage is lower for Australia because a larger share of Australian exports consists of commodities where within-sector productivity differentials are more limited.
Australian exports overall increase by US$23 billion (A$29.9 billion) under the CPTPP scenario, less than under TPP but more than under RCEP. Under an expanded CPTPP exports rise by US$37 billion (A$48.1 billion), or 6.3 per cent above base exports, more than one-fourth higher than under the TPP.
Japan, Malaysia and Vietnam have the largest export increases in percentage terms among the members of these agreements (see Table 4). These are highly trade-oriented economies and benefit from the new value chains made possible by integrated regional markets.
Economies that are not members tend to gain least from the new alternatives, and if they are competitive with members they can even lose. For example, the United States, which would have seen its trade rise by 9.1 per cent under the TPP would experience declines under the CPTPP, from which it is excluded. Korea would have trade declines under the TPP and 11-member CPTPP in which it is not a member but would see its trade increase with the 16-economy CPTPP, in which it is. Similarly, China loses in the TPP/CPTPP scenarios because it is not a member, but gains very substantially from RCEP because it is.
Further analysis shows that most income gains reported in the scenarios are due to changes in trade and associated productivity gains, not trade diversion. Non-member economies are negatively affected in the aggregate only in the TPP scenarios without the United States, and even in this case trade creation far exceeds trade diversion for the world as whole.10 Trade agreements affect not just levels of economic well-being, but also patterns of bilateral relationships. Tables 5 and 6 show changes in Australia’s bilateral exports and imports, respectively, reflecting a shift in relationships toward new partners at the expense of old partners within and outside existing trade agreements.
Trade effects

13Australia will gain from continued Asia-Pacific trade integration
Changes in Australia’s export and import patterns induced by the TPP and CPTPP are broadly similar—they imply large increases in trade with Canada and Mexico, countries with which Australia does not have free trade agreements; Peru, with which an agreement was signed this year but had not yet been included in the model; and smaller but still substantial increases in trade with Chile, Japan, Malaysia and Vietnam, with which Australia has free trade agreements which would become more rigorous under CPTPP rules. The trade changes induced by RCEP would be smaller and focused on deeper relationships with India, Japan and Korea. Although Australia has trade agreements with Japan and Korea, more rigorous rules and a comprehensive regional framework under RCEP would enable greater regional integration.
40
35
30
25
20
15
10
5
0
Chart 2 Australian export increases in 2030 (US$ billion)
TPP CPTPP-16CPTPP RCEP
Australian exports overall increase by US$23 billion (A$29.9 billion) under the CPTPP scenario ... under an expanded CPTPP exports rise by US$37 billion (A$48.1 billion).

14 Peter A. Petri and Michael G. Plummer
Both the benefits and side effects of trade liberalisation depend on changes in production and specialisation patterns. On the one hand, these changes increase the efficiency of production, but on the other, they require factors of production to move from one firm or sector to another. These transitions may involve significant costs, which pose a challenge for public policy. Structural adjustment programs can be mobilised to compensate workers affected by displacement, including via retraining programs, job matching and other social programs such as short-term wage insurance.11
Australia has strong comparative advantage in primary sectors, including agriculture, mining and related processing activities, and in services associated with its highly skilled labour force. Thus, trade agreements that deepen economic relationships with Asia lead, on the one hand, to higher net exports of primary goods and services and early stage processed goods and, on the other hand, to higher net imports of manufactured products. The word ’net’ is important, since the heterogeneity of firms within each sector implies that even in sectors that increase net imports, liberalisation does enable some additional exports by efficient firms.
In the mining sector, Table 7 shows that exports would increase under the TPP by US$4 billion (A$5.2 billion) and under the CPTPP by US$1 billion (A$1.3 billion). Table 8 shows that imports would increase by US$2 billion (A$2.6 billion) and US$1 billion (A$1.3 billion), respectively. In addition, exports would increase by more than imports in
the metals sector, which includes ferrous and non-ferrous metals at early stages of processing. Finally, Table 9 shows about a 1.9 per cent increase in the output of the mining sector under the TPP and about a 0.7 per cent increase under the CPTPP. The results at this sectoral level are less reliable than for aggregate indicators, since the mining sector, for example, is not treated in sufficient detail to account for the effects that different agreements would have on potentially important subsectors.
Table 9 shows that the output effects under the TPP and CPTPP are most positive in percentage terms in the primary sectors (agriculture and mining) and to a lesser extent in processing industries, and are most negative in durable manufactures, including especially vehicles. These latter effects reflect the strong manufacturing and automobile sectors of partners such as Japan and Korea (under the CPTPP-16), coupled with the expanded production chains made possible by regional integration across Northeast Asian and Southeast Asian economies.
The largest absolute output gains are in services, especially domestic services associated with the additional real incomes generated by the trade agreements, but in percentage terms these effects are relatively small. Output changes under RCEP are smaller than under any of the TPP and CPTPP scenarios; as already noted, this agreement would represent relatively little additional liberalisation beyond Australia’s already extensive free-trade network across the Asian economies that participate in RCEP.
Sectoral effects

15Australia will gain from continued Asia-Pacific trade integration
Australia could gain additional real income from new agreements in the Asia-Pacific, despite the agreements it already has in place. Also, given its open economy, Australia has an especially large stake in a cooperative, rules-based system. Cutting-edge, comprehensive ‘mega-regional’ agreements like the CPTPP are filling the void created by the stalemate in rules-making at the multilateral level; Australia will gain disproportionately by participating in forums that are writing these new rules. Important middle powers, including Australia, have an interest in guiding the regional process toward an open regime.
The largest gains would come under a 16-member version of the CPTPP agreement. Wider agreements would mean benefits even for trade flows already covered by prior FTAs, since they will increase demand for inputs from Australia into production chains that operate in Mexico, Vietnam and other ASEAN countries. Larger zones typically also have higher preference utilisation rates, since it is easier to meet their rules of origin and the costs of compliance can be spread over more trade. Thus, an important Australian goal should be to strengthen regional production systems by transforming the current hub-and-spoke network of free trade areas
to consolidated FTAs that apply cumulated rules of origin to production systems within them. This goal would be well served by the CPTPP and to some extent by RCEP.
Finally, participation in these agreements would represent a powerful signal for international economic integration in the face of the rise of protectionism under the inward-looking policies of President Trump. As we have noted elsewhere, it would strengthen the global coalition of countries that support the rules-based system, including institutions such as the World Trade Organization and regional cooperation forums in the Asia- Pacific. Australia’s interests, as a sophisticated, mid-sized economy, argue for supply chains that connect seamlessly.
This requires (i) rules of origin that encompass many countries to allow unimpeded flows of inputs, (ii) efficient and harmonised trade procedures, and (iii) investment provisions that permit production facilities to locate freely. In addition, Australia has sectoral interests in environmental products, entertainment services, engineering and design. All these also require solid intellectual property protection and wide access to relatively wealthy markets.
Conclusion
Participation in these agreements would represent a powerful signal for international economic integration
in the face of the rise of protectionism under the inward-looking policies of President Trump.
16 Peter A. Petri and Michael G. Plummer
1 The 11 members of the CPTPP are: Australia, Brunei Darussalam, Canada, Chile, Japan, Malaysia, Mexico, New Zealand, Peru, Singapore and Vietnam.
2 RCEP includes all 10 ASEAN countries and economies with which ASEAN has a free-trade area in place, namely, Australia, China, India, Japan, Korea and New Zealand.
3 ‘Deputy foreign minister named as Japan’s chief TPP negotiator’, Japan Times, 25 April 2017.
4 Jun Yamazaki, ’”TPP 11” to freeze drug data protection demanded by US,’ Nikkei Asian Review, 31 August 2017.
5 ASEAN stands for Association of Southeast Asian Nations. ‘ASEAN centrality’ is enshrined in the process and members of RCEP must have a free trade area in place with ASEAN.
6 ‘RCEP negotiations speed up: vice commerce minister’, ECNS Newswire, 18 July 2018.
7 Asit Ranhan Mishra, ‘RCEP meeting in September likely to discuss India’s proposal on services pact’, Live Mint, 18 August 2017.
8 These assumptions are based on previously cited sources as well as conversations with individuals familiar with the policy process. For a compendium of ongoing reports on the RCEP negotiations, see https://aric.adb.org/fta/regional-comprehensive-economic-partnership.
9 The underlying data and results of this model, including its prior applications, are on the website: www.asiapacifictrade.org.
10 This result derives mainly from the lower spillover assumptions used in the scenarios of this study, as explained in the previous endnote. The spillover effect occurs due to close monitoring of the implementation of an agreement and is assumed not to occur in the same degree under the smaller regional agreements analysed in this paper as in the TPP12.
11 See, for example, OECD (2012) and Productivity Commission (2012).
Endnotes

17Australia will gain from continued Asia-Pacific trade integration
ASEAN (Association of Southeast Asian Nations). 2012. Guiding Principles and Objectives for Negotiating the Regional Comprehensive Economic Partnership, Available at http://www.meti.go.jp/policy/trade_policy/east_asia/dl/RCEP_GP_EN.pdf.
Damuri, Yose Rizal. 2016. RCEP Prospects and Challenges: Political Economy of East Asian Integration. In Trade Regionalism in the Asia-Pacific, ed. Sanchita Das Basu and Masahiro Kawai. Singapore: ISEAS-Yusof Ishak.
Kawasaki, Kenichi. 2017. Emergent Uncertainty in Regional Integration—Economic Impacts of Alternative RTA Scenarios. GRIPS Discussion Paper 16-28 (January). Available at https://ideas.repec.org/p/ngi/dpaper/16-28.html.
Kehoe, Timothy J. 2005. An Evaluation of the Performance of Applied General Equilibrium Models on the Impact of NAFTA, in Frontiers in Applied General Equilibrium Modeling: In Honor of Herbert Scarf, edited by T.J. Kehoe, T.N. Srinivasan, and J. Whalley. Cambridge: Cambridge University.
OECD, 2012. Policy Priorities for International Trade and Jobs, Edited by Douglas Lippoldt (Paris, OECD). Available at: http://www.oecd.org/site/tadicite/50258009.pdf.
Petri, Peter A., and Michael G. Plummer. 2016. The Economic Effects of the TPP: New Estimates. In Assessing the Trans-Pacific Partnership, Volume 1: Market Access and Sectoral Issues, PIIE Briefing 16-1, ed. Cathleen Cimino-Isaacs and Jeffrey J. Schott. [Also published as PIIE Working Paper 16-2, available at www.piie.com/publications/interstitial.cfm?ResearchID=2906).
Petri, Peter A., and Michael G. Plummer. 2014. ASEAN Centrality and the ASEAN-US Economic Relationship, Policy Series 69, (Honolulu, East-West Center, March). Available at: https://www.eastwestcenter.org/sites/default/files/private/ps069.pdf.
Petri, Peter A., Michael G. Plummer, and Fan Zhai. 2014. The Effects of a China-US Free Trade and Investment Agreement. In Bridging the Pacific:
Toward Free Trade and Investment between China and the United States, ed. C. Fred Bergsten, Gary Clyde Hufbauer, and Sean Miner. Washington: Peterson Institute for International Economics.
Petri, Peter A., Michael G. Plummer, and Fan Zhai. 2012. The Trans-Pacific Partnership and Asia-Pacific Integration: A Quantitative Assessment. Policy Analyses in International Economics 98. Washington: Peterson Institute for International Economics.
Productivity Commission, 2010. Bilateral and Regional Trade Agreements, Research Report, Productivity Commission, Canberra, November.
Productivity Commission, 2012. Trade & Assistance Review 2010-11, Annual Report Series, Productivity Commission, Canberra, May.
Schott, Jeffrey, J. 2017. US Trade Policy Options in the Pacific Basin: Bigger is Better. PIIE Policy Brief 17-7 (February). Washington: Peterson Institute for International Economics. Available at https://piie.com/system/files/documents/pb17-7.pdf.
Schott, Jeffrey, J., Euijin Jung, and Cathleen Cimino-Isaacs. 2015. An Assessment of the Australia-China Free Trade Agreement. PIIE Policy Brief 15-24 (December). Washington: Peterson Institute for International Economics. Available at https://piie.com/publications/policy-briefs/assessment-Australia-china-free-trade-agreement.
Todo, Yasuyuki. 2013. Estimating the TPP’s Expected Growth Effects. RIETI Policy Update 048. Tokyo: Research Institute of Economy, Trade and Industry.
Zhai, Fan. 2008. Armington Meets Melitz: Introducing Firm Heterogeneity in a Global CGE Model of Trade, Journal of Economic Integration 23(3): 575-604.
Zhai, Fan. 2017. China’s Belt and Road Initiative: A Preliminary Quantitative Assessment. Paper presented at the National University of Singapore International Conference on Trade, Industrialisation and Structural Reforms in ASEAN, January, Ho Chi Minh City.
References
18 Peter A. Petri and Michael G. Plummer
Table 1
Australia’s free trade agreements
Country Bilaterals AANZFTA* CPTPP RCEP
Brunei Signed 2010 Planned Negotiations
Canada Planned
Chile Signed 2009 Planned
China Signed 2015 Negotiations
Hong Kong Negotiations
India Negotiations Negotiations
Indonesia Negotiations Signed 2010 Negotiations
Japan Signed 2015 Planned Negotiations
Korea Signed 2014 Negotiations
Malaysia Signed 2013 Signed 2010 Planned Negotiations
Mexico Negotiations† Planned
New Zealand Signed 1983 Signed 2010 Planned Negotiations
Other ASEAN Signed 2010 Negotiations
Peru Signed 2018 Planned
Philippines Signed 2010 Negotiations
Russia
Singapore Signed 2003 Signed 2010 Planned Negotiations
Taiwan
Thailand Signed 2005 Signed 2010 Negotiations
United States Signed 2005
Vietnam Signed 2010 Planned Negotiations
* ASEAN-Australia-New Zealand Free Trade Agreement† Negotiating with Australia as part of the Pacific Alliance
Modelling results
19Australia will gain from continued Asia-Pacific trade integration
Table 2
Trade policy scenarios for the Asia-Pacific
TPP CPTPP CPTPP-16 RCEP
Membership Australia, Brunei, Canada, Chile, Japan, Malaysia, Mexico, New Zealand, Peru, Singapore, United States, Vietnam
Australia, Brunei, Canada, Chile, Japan, Malaysia, Mexico, New Zealand, Peru, Singapore, Vietnam
Australia, Brunei, Canada, Chile, Japan, Malaysia, Mexico, New Zealand, Peru, Singapore, Vietnam Indonesia, Korea, Philippines, Taiwan, Thailand
Australia, Brunei, Cambodia, China, India, Indonesia, Japan, Korea, Laos, Malaysia, Myanmar, New Zealand, Philippines, Singapore, Thailand, Vietnam
Launch date 2017 2018 2018 2018
Tariff liberalisation
99% eliminated(as negotiated)
Same as TPP12 Same as TPP12 85% eliminated
NTB liberalisation
KORUS adjusted (see TPP12 study)
Same as TPP12
Same as TPP12
3/4 concessions of recent ASEAN+1 agreements
Agricultural liberalisation
Service liberalisation
FDI liberalisation
Non-preferential NTB reductions
20% 10% 10% 10%
Source: Author’s assumptions

20 Peter A. Petri and Michael G. Plummer
Table 3
Incomes in 2030 (EV)
Incomes (US$ billion) Per cent of Base Income
Base TPP CPTPP CPTPP-16 RCEP TPP CPTPP CPTPP-16 RCEP
Americas 39,569 208 49 72 2 0.5 0.1 0.2 0.0
Canada 2,717 37 22 29 0 1.3 0.8 1.1 0.0 Chile 463 4 3 5 0 0.9 0.7 1.1 0.0 Colombia 684 0 0 0 0 0.0 0.0 0.0 0.0 Mexico 2,169 22 16 33 0 1.0 0.7 1.5 0.0 Peru 442 11 10 11 0 2.6 2.2 2.5 0.0 United States 25,754 131 -2 -6 1 0.5 0.0 0.0 0.0 Latin America nie 7,341 3 0 -1 0 0.0 0.0 0.0 0.0
Asia 50,659 202 69 316 253 0.4 0.1 0.6 0.5
Brunei 31 2 1 1 0 5.9 2.6 3.7 0.9 China 27,839 -18 -10 -53 101 -0.1 0.0 -0.2 0.4 Hong Kong 461 6 1 1 2 1.2 0.2 0.3 0.4 India 5,487 -5 -4 -16 57 -0.1 -0.1 -0.3 1.0 Indonesia 2,192 -2 -1 18 1 -0.1 -0.1 0.8 0.0 Japan 4,924 125 46 98 56 2.5 0.9 2.0 1.1 Korea 2,243 -8 -3 84 24 -0.3 -0.1 3.8 1.1 Malaysia 675 52 21 36 6 7.6 3.1 5.4 0.9 Philippines 680 -1 0 13 1 -0.1 0.0 1.9 0.2 Singapore 485 19 13 19 2 3.9 2.7 3.8 0.4 Taiwan 776 1 0 60 -3 0.2 0.0 7.8 -0.4 Thailand 812 -7 -5 30 3 -0.8 -0.6 3.6 0.3 Vietnam 497 41 11 25 2 8.1 2.2 5.1 0.5 ASEAN nie 283 -1 0 0 1 -0.4 0.0 -0.1 0.2 Asia nie 3,272 0 0 -1 0 0.0 0.0 0.0 0.0
Oceania 2,854 21 15 22 7 0.7 0.5 0.8 0.2
Australia 2,590 15 12 17 5 0.6 0.5 0.7 0.2 New Zealand 264 6 3 5 2 2.2 1.1 2.0 0.6
Rest of World 40,720 60 14 39 23 0.1 0.0 0.1 0.1
Africa (Sub-Sahara) 4,068 0 0 -1 1 0.0 0.0 0.0 0.0 Europe 23,189 48 12 22 16 0.2 0.0 0.1 0.1 EMENA 10,001 9 2 15 5 0.1 0.0 0.1 0.0 Russia 3,371 2 0 2 1 0.1 0.0 0.1 0.0 ROW 90 0 0 0 0 0.2 0.1 0.0 0.1
WORLD 133,801 492 147 449 286 0.4 0.1 0.3 0.2
Source: Author’s computations

21Australia will gain from continued Asia-Pacific trade integration
Exports (US$ billion) Per cent of Base Exports
Base TPP CPTPP CPTPP-16 RCEP TPP CPTPP CPTPP-16 RCEP
Americas 7,068 478 72 103 -1 6.8 1.0 1.5 0.0
Canada 835 58 39 56 -1 7.0 4.6 6.7 -0.1 Chile 147 8 6 8 -1 5.3 4.3 5.7 -0.5 Colombia 120 1 0 0 0 0.9 0.1 0.0 0.0 Mexico 670 32 23 45 -2 4.7 3.5 6.7 -0.2 Peru 135 14 12 15 0 10.3 9.0 10.8 -0.2 United States 3,906 357 -10 -22 3 9.1 -0.3 -0.6 0.1 Latin America nie 1,255 9 1 1 0 0.7 0.1 0.1 0.0
Asia 12,905 511 172 874 668 4.0 1.3 6.8 5.2
Brunei 16 1 1 1 0 9.0 3.5 4.9 0.9 China 4,976 9 -9 -44 259 0.2 -0.2 -0.9 5.2 Hong Kong 357 4 1 1 -1 1.0 0.2 0.2 -0.3 India 1,360 1 -3 -13 132 0.1 -0.2 -1.0 9.7 Indonesia 446 -4 -3 49 17 -1.0 -0.6 11.1 3.8 Japan 1,190 276 97 225 136 23.2 8.1 18.9 11.4 Korea 1,089 -11 -6 203 62 -1.0 -0.6 18.7 5.7 Malaysia 491 99 42 71 17 20.1 8.6 14.4 3.4 Philippines 184 -1 0 29 4 -0.4 -0.2 16.0 2.2 Singapore 470 35 29 33 3 7.5 6.2 7.0 0.6 Taiwan 506 4 0 170 -7 0.8 -0.1 33.6 -1.5 Thailand 561 -9 -7 68 24 -1.6 -1.3 12.0 4.3 Vietnam 357 107 31 84 17 30.1 8.8 23.5 4.9 ASEAN nie 93 -3 0 -1 4 -2.8 -0.4 -1.5 3.9 Asia nie 810 2 1 0 1 0.2 0.1 -0.1 0.1
Oceania 673 38 28 45 17 5.6 4.2 6.6 2.5
Australia 589 29 23 37 14 4.9 4.0 6.3 2.4 New Zealand 84 9 5 8 3 10.2 5.8 9.2 3.1
Rest of World 15,503 79 14 10 -7 0.5 0.1 0.1 0.0
Africa (Sub-Sahara) 883 5 1 0 1 0.5 0.1 0.0 0.1 Europe 9,706 49 8 -7 -9 0.5 0.1 -0.1 -0.1 EMENA 4,021 20 4 14 1 0.5 0.1 0.3 0.0 Russia 851 5 1 2 1 0.5 0.1 0.3 0.1 ROW 43 0 0 0 0 1.1 0.3 -0.2 -0.1
WORLD 36,149 1,106 287 1,032 677 3.1 0.8 2.9 1.9
Table 4
Exports in 2030
Source: Author’s computations

22 Peter A. Petri and Michael G. Plummer
Exports in 2030 (US$ billion) Per cent of 2030 Base
Base TPP CPTPP CPTPP-16 RCEP TPP CPTPP CPTPP-16 RCEP
Americas 37 44 43 42 37 19.0 17.1 15.8 -0.4
Canada 3 6 7 7 3 91.2 95.4 95.5 -0.4 Chile 1 1 1 2 1 34.2 32.2 38.1 -0.9 Colombia 0 0 0 0 0 3.0 0.3 -1.2 -0.5 Mexico 2 4 4 4 1 143.9 146.2 138.2 -0.5 Peru 0 1 1 1 0 134.2 134.3 130.1 -0.5 United States 26 27 26 25 26 3.1 0.3 -1.1 -0.4 Latin America nie 4 5 4 4 4 2.5 0.5 -0.6 -0.5
Asia 473 494 490 503 488 4.3 3.5 6.4 3.1
Brunei 0 0 0 0 0 -5.4 -1.8 -5.5 -2.6 China 305 309 305 301 303 1.4 0.0 -1.3 -0.6 Hong Kong 8 9 8 8 8 3.1 0.5 -0.1 -0.3 India 25 25 25 25 33 1.8 0.2 -0.4 34.5 Indonesia 13 13 13 15 14 0.2 -1.3 13.0 8.4 Japan 33 44 46 48 37 31.1 36.6 42.8 11.9 Korea 30 30 30 37 33 1.0 -0.1 22.6 10.9 Malaysia 11 12 12 12 11 12.5 16.1 8.2 0.0 Philippines 4 4 4 4 4 1.5 -0.4 9.8 -1.1 Singapore 8 9 9 9 9 6.4 6.9 6.3 0.3 Taiwan 8 8 8 14 8 2.2 0.3 75.3 -1.3 Thailand 13 12 12 14 13 -0.5 -1.2 15.2 1.2 Vietnam 7 10 10 9 7 37.9 33.5 27.1 2.1 ASEAN nie 1 1 1 1 1 -2.7 -1.9 -4.0 1.9 Asia nie 7 7 7 6 6 0.5 -1.3 -3.7 -4.3
Oceania 17 16 17 18 16 -2.8 1.2 7.5 -2.5
Australia 0 0 0 0 0
New Zealand 17 16 17 18 16 -2.8 1.2 7.5 -2.5
Rest of World 63 65 63 62 62 3.4 0.6 -0.3 -0.6
Africa (Sub-Sahara) 6 6 6 6 6 2.7 0.1 -1.3 -1.7 Europe 29 30 29 29 29 3.6 0.7 -0.1 -0.2 EMENA 22 22 22 22 22 3.4 0.6 -0.2 -0.7 Russia 2 2 2 2 2 3.5 0.7 0.1 -0.7 ROW 4 4 4 4 4 3.1 0.9 -0.5 -0.5
WORLD 589 618 612 626 603 4.9 4.0 6.3 2.4
Table 5
Australian export destinations
Source: Author’s computations

23Australia will gain from continued Asia-Pacific trade integration
Imports in 2030 (US$ billion) Per cent of 2030 Base
Base TPP CPTPP CPTPP-16 RCEP TPP CPTPP CPTPP-16 RCEP
Americas 98 105 102 100 93 7.7 4.4 2.1 -4.3
Canada 5 9 9 9 4 107.6 101.5 95.4 -3.3 Chile 3 3 3 2 3 -3.1 -2.7 -6.6 -1.5 Colombia 0 0 0 0 0 10.8 6.0 7.5 4.2 Mexico 3 8 7 8 3 175.3 171.0 175.9 -7.2 Peru 1 1 1 1 1 130.3 126.0 125.3 2.0 United States 80 77 75 73 76 -3.9 -7.1 -9.5 -4.8 Latin America nie 6 7 6 6 6 3.6 -0.1 -1.2 0.2
Asia 336 354 355 373 355 5.3 5.5 10.9 5.7
Brunei 3 3 3 3 3 8.8 9.1 6.6 -0.9 China 156 142 145 141 156 -9.1 -6.8 -9.4 0.2 Hong Kong 5 6 6 6 5 13.4 7.6 8.5 4.6 India 12 12 12 12 20 0.6 -2.0 -5.7 63.4 Indonesia 16 15 15 19 17 -5.2 -4.2 18.9 3.8 Japan 38 77 73 75 44 103.7 92.9 98.6 17.2 Korea 21 17 18 25 27 -17.4 -14.5 20.8 28.7 Malaysia 18 19 19 19 17 10.9 9.3 9.2 -0.6 Philippines 3 3 3 3 3 -3.1 -1.9 7.0 -0.4 Singapore 19 19 19 19 19 2.7 2.4 0.7 -1.0 Taiwan 6 6 6 12 6 2.5 -0.3 112.5 -1.0 Thailand 26 19 20 23 24 -24.5 -20.8 -10.1 -7.8 Vietnam 7 6 7 8 7 -6.0 6.7 9.6 1.3 ASEAN nie 1 1 1 1 1 -0.3 -2.1 -1.9 -1.3 Asia nie 7 8 8 8 7 10.1 5.3 5.2 2.2
Oceania 16 16 17 16 15 4.5 6.1 5.5 -2.8
Australia 0 0 0 0 0
New Zealand 16 16 17 16 15 4.5 6.1 5.5 -2.8
Rest of World 119 122 118 116 118 2.7 -0.4 -2.7 -1.0
Africa (Sub-Sahara) 8 7 7 7 7 -2.6 -4.9 -7.6 -2.7 Europe 85 88 85 83 84 2.8 -0.5 -2.9 -1.3 EMENA 14 15 15 14 14 4.9 1.6 -0.4 1.2 Russia 3 3 3 3 3 4.8 1.5 1.5 2.1 ROW 8 9 9 8 8 2.9 1.0 -2.6 -1.4
WORLD 568 597 592 604 582 5.2 4.1 6.4 2.4
Table 6
Australian import origins
Source: Author’s computations

24 Peter A. Petri and Michael G. Plummer
Export changes (US$ billion) Per cent of 2030 Base
Base TPP CPTPP CPTPP-16 RCEP TPP CPTPP CPTPP-16 RCEP
Aggregated sectors
Primary sectors 284 4 1 2 3 1.2 0.3 0.6 1.1 Non-durable manufactures 59 9 11 17 7 15.8 18.4 28.2 11.8 Durable manufactures 88 7 7 10 3 8.5 7.4 11.2 3.2 Domestic services 46 1 0 1 0 1.9 0.7 1.5 0.0 Traded Services 112 8 5 8 1 7.0 4.4 7.2 1.0 Total 589 29 23 37 14 4.9 4.0 6.3 2.4
Detailed sectors
Grains 16 0 0 1 0 0.5 1.8 4.3 1.2 Other agriculture 36 0 -1 -1 2 -0.2 -1.9 -3.8 5.4 Mining 233 4 1 2 1 1.5 0.5 1.1 0.4 Food processing 37 7 8 13 6 18.9 22.9 36.4 16.2 Textiles 2 0 0 0 0 9.1 7.9 3.1 11.5 Apparel 2 0 0 0 0 5.9 2.4 -2.4 1.4 Chemicals 14 2 2 3 1 11.3 13.0 18.8 4.1 Metals 61 5 5 7 2 9.0 7.7 11.7 3.8 Vehicles 6 0 0 1 0 7.4 6.1 13.2 5.5 Electrical equipment 1 0 0 0 0 2.0 1.7 -1.3 -1.3 Machinery 12 1 1 1 0 6.2 6.6 8.1 0.6 Other manufacturing 12 1 1 2 0 10.0 9.1 12.7 2.3 Utilities 1 0 0 0 0 3.1 1.1 1.1 0.3 Construction 1 0 0 0 0 7.8 4.0 33.6 4.1 Trade 70 4 2 2 0 5.4 2.4 2.9 0.1 Communications 4 0 0 1 0 11.4 8.5 15.4 0.9 Finance 14 1 1 2 0 6.1 4.1 11.1 -0.2 Private services 23 3 2 4 1 11.8 9.8 16.6 4.5 Social services 45 1 0 0 0 1.8 0.6 1.1 -0.1 Total 589 29 23 37 14 4.9 4.0 6.3 2.4
Table 7
Export composition changes, 2030
Source: Author’s computations

25Australia will gain from continued Asia-Pacific trade integration
Import changes (US$ billion) Per cent of 2030 Base
Base TPP CPTPP CPTPP-16 RCEP TPP CPTPP CPTPP-16 RCEP
Aggregated sectors
Primary sectors 284 4 1 2 3 3.0 2.5 3.3 0.7 Non-durable manufactures 59 9 11 17 7 2.7 2.6 5.4 2.1 Durable manufactures 88 7 7 10 3 4.2 3.8 6.6 2.8 Domestic services 46 1 0 1 0 1.5 1.4 2.6 0.3 Traded Services 112 8 5 8 1 11.6 7.5 9.0 3.0 Total 589 29 23 37 14 5.0 4.0 6.3 2.4
Detailed sectors
Grains 0 0 0 0 0 8.9 8.2 11.8 8.9 Other agriculture 6 0 0 0 0 4.0 4.9 7.2 5.5 Mining 57 2 1 2 0 2.9 2.3 2.9 0.2 Food processing 23 1 1 2 0 5.4 5.0 6.6 1.9 Textiles 8 0 0 1 0 2.6 2.1 7.4 4.2 Apparel 10 0 0 0 0 0.4 0.3 1.6 1.5 Chemicals 59 1 1 3 1 2.5 2.3 5.4 1.5 Metals 42 1 1 4 1 3.0 2.6 8.5 2.9 Vehicles 81 10 9 13 5 12.6 11.2 15.9 6.0 Electrical equipment 46 0 0 0 0 0.2 0.2 0.6 0.1 Machinery 94 0 0 1 1 0.4 0.4 1.0 0.7 Other manufacturing 41 0 1 2 2 1.1 1.9 5.5 4.4 Utilities 1 0 0 0 0 0.0 0.5 1.0 0.1 Construction 1 0 0 0 0 6.8 4.4 12.4 1.9 Trade 81 9 5 6 3 10.8 6.1 7.1 3.3 Communications 3 0 0 0 0 10.5 9.2 11.7 3.2 Finance 7 1 1 1 0 14.9 11.3 15.9 3.4 Private services 15 2 2 2 0 14.8 13.3 16.1 0.9 Social services 18 0 0 0 0 1.3 1.3 2.1 0.2 Total 592 30 24 37 14 5.0 4.0 6.3 2.4
Table 8
Import composition changes, 2030
Source: Author’s computations

26 Peter A. Petri and Michael G. Plummer
Output changes (US$ billion) Per cent of 2030 Base
Base TPP CPTPP CPTPP-16 RCEP TPP CPTPP CPTPP-16 RCEP
Aggregated sectors
Primary sectors 287 6 3 4 5 2.0 1.1 1.5 1.8 Non-durable manufactures 89 2 3 3 1 2.5 3.1 3.4 1.5 Durable manufactures 94 -2 -2 -4 -3 -1.8 -2.0 -4.2 -2.8 Domestic services 1,100 9 7 10 4 0.8 0.6 0.9 0.4 Traded Services 1,020 3 3 6 2 0.3 0.3 0.6 0.2 Total 2,590 19 14 20 9 0.7 0.5 0.8 0.4
Detailed sectors
Grains 17 0 0 1 0 1.9 2.7 5.1 2.7 Other agriculture 79 2 2 2 4 2.4 2.0 2.7 4.6 Mining 192 4 1 1 1 1.9 0.7 0.8 0.6 Food processing 46 2 2 4 2 4.4 5.4 8.8 4.0 Textiles 4 0 0 0 0 -0.3 -0.1 -9.3 -1.8 Apparel 4 0 0 0 0 1.8 0.6 -2.1 -1.4 Chemicals 18 0 0 -1 0 -0.6 0.3 -3.4 -0.8 Metals 36 1 1 1 0 3.6 2.8 1.9 0.4 Vehicles 12 -4 -3 -5 -2 -30.9 -27.8 -37.4 -17.0 Electrical equipment 3 0 0 0 0 2.4 0.6 -3.3 -2.7 Machinery 10 0 0 0 0 2.4 1.8 0.3 -2.8 Other manufacturing 50 1 0 0 -1 1.4 0.9 0.2 -1.1 Utilities 41 0 0 0 0 1.1 0.9 0.9 0.3 Construction 269 3 2 4 2 1.1 0.9 1.4 0.6 Trade 481 0 1 2 0 0.0 0.2 0.3 0.0 Communications 42 0 0 0 0 0.7 0.5 0.9 0.1 Finance 223 1 1 2 0 0.6 0.4 0.9 0.2 Private services 274 2 1 2 1 0.6 0.5 0.9 0.4 Social services 789 6 4 6 2 0.7 0.5 0.7 0.3 Total 2,590 19 14 20 9 0.7 0.5 0.8 0.4
Table 9
Output composition changes, 2030
Source: Author’s computations


FTAFREIGHT & TRADE ALLIANCE