Australia-Japan Stocktake Report 2020
60
Australia-Japan Stocktake Report 2020 Benjamin J. Ascione Australia-Japan Research Centre Crawford School of Public Policy ANU College of Asia & the Pacific
Transcript of Australia-Japan Stocktake Report 2020

Australia-Japan Stocktake
Report 2020
Benjamin J. Ascione
Australia-Japan Research Centre
Crawford School of Public Policy
ANU College of Asia & the Pacific

Contents
Executive Summary ............................................................................................................................... 1
1. Introduction ....................................................................................................................................... 3
2. Historical background ....................................................................................................................... 6
3. Australia–Japan economic relations .................................................................................................. 8
3.1 Foundational Economic Agreements .......................................................................................... 8
3.2 Trade ............................................................................................................................................. 9
3.3 Investment .................................................................................................................................. 15
4. Australia–Japan people-to-people links .......................................................................................... 19
4.1 Sister City Arrangements........................................................................................................... 19
4.2 Education .................................................................................................................................... 22
4.3 Sister School Arrangements ...................................................................................................... 24
4.4 Senior High Schools Exchanges ................................................................................................ 25
4.5 Japanese Students in Australian Tertiary Education ................................................................ 28
4.6 Australian Students in Japanese Tertiary Education ................................................................ 29
4.7 Working holiday arrangements ................................................................................................ 30
4.8 Tourism Between Australia and Japan ...................................................................................... 33
5. The Whaling Dispute....................................................................................................................... 35
6. Australia–Japan Diplomatic and Security Cooperation ................................................................. 38
6. 1 Political Engagement ................................................................................................................ 38
6. 2 Bilateral Security Cooperation ................................................................................................. 39
6.3 The Australia-Japan submarine saga ......................................................................................... 41
6.4 Trilateral and Quadrilateral Cooperation with the United States and India .......................... 43
6.5 Regional Institution Building .................................................................................................... 44
7. Selected Bibliography of Australia-Japan Relations ....................................................................... 46
7.1 Economic Diplomacy and Regionalism .................................................................................... 46
7.2 History and Culture ................................................................................................................... 47
7.3 International Relations, Security and Diplomacy .................................................................... 48
Appendices ........................................................................................................................................... 49

Australia-Japan Research Centre 1
Executive Summary
Australia and Japan have a deep, broad and close relationship that is anchored in strong
complementarity in economic relations, rich people-to-people connections, and diplomatic and
security cooperation characterised by a shared commitment to stability, peace and inclusive regional
order building.
This report takes stock of the bilateral relationship as it was in 2020 and acts as a snapshot of the
economic, people-to-people and political-security relationship as the world headed into the COVID-
19 pandemic. It does not aim to comprehend all the dimensions of the relationship but aims to
highlight the main trends, features and provide data and links for researchers, officials and those who
have responsibility for and an interest in the relationship.
The Australia-Japan economic relationship was built on the base of some key agreements. The 1957
Commerce Agreement normalised Australia’s trade relations with Japan after World War II, its
revision in 1963 and the 1976 Basic Treaty of Friendship and Cooperation between (known as the
NARA Treaty) which extended non-discriminatory treatment to investment and people movement
were the foundations of the relationship. More recently the Japan-Australia Economic Partnership
Agreement, signed in 2014, and the various regional trade agreements and initiatives that Australia
and Japan have been instrumental in concluding, have brought the two economies closer together.
Complementarity drives the Australia-Japan economic partnership.
Japan relies on imports for over 90 per cent of its energy needs and Australia is its most important and
stable supplier. Australia supplies more than half of Japan’s coal imports and more than a third of
Japan’s LNG imports. Australia is also Japan’s major supplier of strategic raw materials including iron
ore, bauxite, alumina, aluminium, and nickel. In 2020 Japan was Australia’s second largest two-way
trade partner accounting for almost 10 per cent of Australia’s goods and services trade, while
Australia was Japan’s fifth largest two-way trade partner accounting for over 4 per cent of Japan’s
goods exports and imports.
Japan is the fourth largest source of foreign investment in Australia with a stock of AU$241.1 billion
dollars as of 2019, comprising 6.3 per cent of foreign investment in Australia, and over half this is
concentrated in mining.
The Australia-Japan relationship is anchored in its deep people-to-people links.
Australia has more sister-city and sister-state relationships with Japan than any other country with
107 such arrangements, while Australia ranks fourth in Japan (after the United States, China and
South Korea) despite its relatively smaller population. The two countries also have 553 sister-school
relationships at the high school level making Australia the most popular partner country in Japan for
these arrangements. Japanese is the most widely taught foreign language in Australia with over
405,000 students across the primary to tertiary levels. This ranks Australia fourth globally (behind

Australia-Japan Research Centre 2
China, Indonesia and South Korea) and first on a per capita basis. Australia and Japan concluded a
reciprocal working holiday agreement that commenced in 1980 which was Japan’s first such
agreement and Australia’s first with a non-Western and non-English speaking country. Since that
time Australia has firmly established itself as the most popular destination for Japanese working
holiday makers. Tourism between the two countries has also boomed in recent years with over
620,000 Australians visiting Japan and 450,000 Japanese visiting Australia in 2019.
Shared commitment to regional order building.
Australia-Japan diplomatic and security cooperation has been characterised by a shared commitment
to inclusive regional order building. This includes joint cooperation and leadership in the creation of
the Asia Pacific Economic Cooperation (APEC) forum. More recently, Australia and Japan were close
partners in the negotiation of the CPTPP and RCEP. Australia and Japan have also spearheaded
cooperation in areas of diplomacy such as the International Commission on Nuclear Non-
proliferation and Disarmament, maritime capacity building cooperation in Southeast Asia, and a
range of non-traditional security issues.
Security partnership.
Australia and Japan have come to be each other’s second most important security partner after their
respective alliances with the United States. Deepening Australia-Japan security cooperation has been
institutionalized through the Joint Declaration on Security Cooperation in 2007, the establishment of
a Special Strategic Partnership in 2014, and it is expected that a Reciprocal Access Agreement will
soon be concluded. Dialogue has also been held regularly at the highest levels of government. Since
1957, Australian prime ministers have made 26 visits to Japan while Japanese prime ministers have
made 11 visits to Australia. In 2007, Australia and Japan inaugurated the 2+2 foreign and defence
ministers meeting which has been held eight times.
There are a number of blind spots and gaps in the relationship and areas that are under potential,
including the failed submarine bid and the whaling issue, that are highlighted in the report that
follows.
The report was possible with the generous support of the Australia–Japan Foundation and the hope is
that some of the data that has been brought together in it will help inform further work on the
development of this important bilateral relationship.
Shiro Armstrong
Director
Australia–Japan Research Centre
The Australian National University

Australia-Japan Research Centre 3
Australia-Japan Stocktake Report 2020
Benjamin J. Ascione
The Australia-Japan Research Centre (AJRC) is the centre of research, teaching and outreach on the
Japanese economy in Australia. Established in 1980 with support from the governments and business
communities in both Australia and Japan, our research encompasses trade, finance, macroeconomics,
as well as international economic relations.
AJRC is located in the Crawford School of Public Policy in the ANU College of Asia & the Pacific,
The Australian National University.
Address: J. G. Crawford Building
132 Lennox Crossing
Acton ACT 2601 Australia
Contact: [email protected]
Funding and support: Australia-Japan Foundation

Australia-Japan Research Centre 4
1. Introduction
The Australia–Japan relationship is one of growing importance in regional and global affairs. Australia
and Japan have developed a closeness of cooperation that not only benefits both countries but also
promotes regional stability. As well as being advanced economies and key allies of the United States,
Australia and Japan have forged extensive people-to-people, economic, and security and diplomatic
cooperation based on a shared commitment to free trade and inclusive regional institution and order
building. However, with future uncertainty afflicting the Asia Pacific region across issues from the US–
China rivalry, climate change and the COVID-19 pandemic, bolstering cooperation is more important
than ever.
This report provides a snapshot of the health of the Australia–Japan relationship by providing key data
on three of its key pillars: economic relations, people-to-people relations, and security and diplomatic
cooperation. Bringing this data together in one place, the report seeks to provide a foundation for the
future of research and the planning of future cooperation. It makes available a set of benchmarks against
which the health of the Australia–Japan relationship can be measured. At the same time, it is hoped
the report can provide a starting point for the analysis of the impact of the COVID-19 pandemic on the
relationship.
The report is divided into seven self-contained chapters. The present chapter introduces the content,
scope and aims of the report. The second chapter provides a brief sketch of the historical background
of the Australia–Japan relationship up until the end of the Second World War. This includes the role
of the White Australia policy and wartime internment on diminishing relations.
Chapter three analyses Australia–Japan trade and investment and the significance of foundational
bilateral economic agreements. Complementarity is highlighted as a key feature of the economic
partnership, with Australian natural resource exports playing a critical role in helping to power the
Japanese economy and with Japanese investment playing a significant role in driving Australia’s mining
sector. At the same time, capitalising on economic complementarity required political commitment,
which was built through the 1957 Commerce Agreement and the 1976 Basic Treaty of Friendship and
Cooperation.
The fourth chapter analyses the deep people-to-people relations Australia and Japan have cultivated
over the decades, which help to provide a foundation for meaningful cooperation and engagement.
This includes the state of sister city relationships, educational cooperation, tourism and working
holidays between the two countries. The two countries have established an excellent record of
achievement in building engagement and cross-cultural understanding across these dimensions.
However, there is no room for complacency. Continued support is needed to rebuild in areas where
there have been setbacks in order to maintain people-to-people relations as a pillar of strength into the
future. This is especially important given the setback to international people flows the COVID-19
pandemic caused.
Australia-Japan Research Centre 5
The fifth chapter gives a brief sketch of the whaling issue. Significant cultural differences and domestic
political forces shape both countries’ approach to and understanding of the issue, meaning there is little
prospect for a resolution based on shared understandings. However, as the biggest blind spot in the
relationship, it is important that Australia and Japan continue to manage the issue carefully so as to
prevent the disagreement from spilling over into other areas of cooperation. Understanding the cultural
assumptions and domestic political barriers on both sides is critical to avoid inflaming nationalist
responses that further entrench confrontational posturing.
Chapter six looks at Australia–Japan diplomatic and security cooperation. This includes the deepening
institutionalisation of bilateral security cooperation, with Australia and Japan having become each
other’s most important security partner in the Asia Pacific after their respective alliances with the
United States. This is despite Australia’s decision to award France rather than Japan the contract to
provide it with 12 new submarines, which left Tokyo disappointed. This choice highlighted the
importance of proper processes which can help to avoid unnecessary disappointments or
misunderstandings. At the same time, Australia and Japan’s security cooperation has been further
deepened through mutual participation in trilateral and quadrilateral arrangements with the United
States and India. Diplomatically, the shared commitment of the two countries to inclusive regional
order building has seen them lead regional institutional building efforts, such as APEC, as well as
cooperating with ASEAN nations in the building of ASEAN-led institutions such as the ASEAN
Regional Forum, ASEAN+6, the East Asia Summit and the ASEAN Defense Ministers’ Meeting Plus.
Lastly, the seventh chapter provides a bibliography of resources on Australia–Japan relations for further
reading. This spans resources covering the history of the relationship across the three pillars of people-
to-people, economic, and security and diplomatic cooperation. This report provides a snapshot of the
health of the Australia–Japan relationship. It is hoped this bibliography will be a useful resource for
future research.

Australia-Japan Research Centre 6
2. Historical background
The first record of contact between Australia and Japan is from 1830 after the brig Cyprus was hijacked
by convict mutineers off Tasmania and sailed to China via Japan. After anchoring in waters off the coast
of Shikoku in modern-day Tokushima prefecture near the town of Mugi, the Cyprus was chased away
by cannon, in line with Japan’s isolationist policy at the time.1
As the Tokugawa Shogunate started to lose power and Japan began its Meiji Restoration in 1868, contact
between Australia and Japan gradually started to open up. The first Japanese to enter Australia were an
acrobatic troupe, The Great Dragon Troupe, who performed at Melbourne’s Princess Theatre in 1867.2
A later troupe then gave Australia its first Japanese settler, Rikinosuke Sakuragawa, who married a local
woman in Melbourne in 1875.3
A small number of Japanese migrants—mostly contract labourers and small merchants—started
moving to Australia working in the sugar cane, sea-cucumber and pearl diving industries, especially in
Broome, Darwin and Thursday Island. 4 When the Immigration Restriction Act (White Australia
Policy) was passed in 1901 there were about 3500 Japanese in Australia. The new law had the effect of
freezing the number of Japanese arrivals.5 However, due to a lack of skilled divers the pearl industry
was able to gain an exemption.
Pre-Second World War trade between Australia and Japan grew rapidly in the 1920s and early 1930s
with Japan exporting a range of goods, such as textiles, wood and wicker, chinaware, and glassware,
while Australian exports were dominated by wool, flour and wheat. By 1931, Japan had become
Australia’s third biggest trading partner.6 And by the mid-1930s, Japan ranked as Australia’s second
biggest export market after Great Britain. 7 Yet Australia–Japan trade subsequently suffered under
Australia’s protectionist trade policy, its discriminatory preferences for trade with Britain, and a bitter
1 Joshua Robertson, ‘Australian Convict Pirates in Japan: Evidence of 1830 Voyage Unearthed’, The Guardian, 28 May 2017,
http://www.theguardian.com/australia-news/2017/may/28/australian-convict-pirates-in-japan-evidence-of-1830-voyage-
unearthed. 2 David Sissons, Bridging Australia And Japan: Volume 1, ed. Arthur Stockwin and Keiko Tamura (Canberra: ANU Press,
2016), 50, https://press.anu.edu.au/publications/series/asian-studies/bridging-australia-and-japan-volume-1. 3 Steve Dawson, ‘The First Recorded Japanese in Australia: Steve Dawson’s Family Story’, Nikkei Australia (blog), 29 August
2020, https://www.nikkeiaustralia.com/the-first-recorded-japanese-in-australia-steve-dawsons-family-story/. 4 Sissons, Bridging Australia And Japan: Volume 1, 97–117; Yuriko Nagata, ‘The Japanese in Torres Strait’, in Navigating
Boundaries: The Asian Diaspora in Torres Strait, ed. Anna Shnukal, Guy Malcolm Ramsay, and Yuriko Nagata (Canberra:
ANU Press, 2017), 139–60; Japan Club of Australia, Japanese in Australia – Japanese Footprints over a Century (Nikkei
Australia, 1998), 30, https://tinyurl.com/y58txsek. 5 Yuriko Nagata, ‘Japanese Internment in Australia during World War II’ (PhD Thesis, University of Adelaide, 1993), 23,
https://digital.library.adelaide.edu.au/dspace/handle/2440/21427. 6 DFAT Economic Analytical Unit, ‘Shaping Forces: Complementarity and Distance’, in Australia and Japan: A Remarkable
Commercial Relationship (Canberra: Department of Foreign Affairs and Trade, 2008), https://www.dfat.gov.au/about-
us/publications/trade-investment/australia-japan-commercial-relationship/Pages/chapter-2-shaping-forces-
complementarity-and-distance. 7 Chow Misuzu Hanihara, The Study of Japan in Australia : A Unique Development over Eighty Years (International
Research Center for Japanese Studies, 2003), 48, http://doi.org/10.15055/00003839.

Australia-Japan Research Centre 7
dispute in 1936 whereby Australia effectively banned the export of iron ore to Japan. Trade then ceased
entirely for a time after the outbreak of the Second World War.8
During the Second World War, the lives of Australia’s Japanese community came to an abrupt halt.
The Australian government interned over 4000 Japanese as prisoners of war (POW). This included over
1100 local civilians—almost all registered as Japanese ‘aliens’ in the country—as well as over 3100
Japanese soldiers who had been captured overseas.9 Among the POWs were a group of more than 1000
Japanese soldiers who attempted to escape in August 1944 during the Cowra breakout, which resulted
in the deaths of four Australian soldiers and over 200 Japanese prisoners.10 After the end of the war,
almost all of the Japanese POWs, both civilians and soldiers, were repatriated to Japan.
First contacts between Australia and Japan
8 Senate Standing Committee on Foreign Affairs, Defence and Trade, ‘Australia and Japan—A Trading Tradition’, in Japan’s
Economy: Implications for Australia (Parliament of the Commonwealth of Australia, 2000), https://tinyurl.com/y3rkpzvc. 9 Nagata, ‘Japanese Internment in Australia during World War II’, 2. 10 Keiko Tamura, ‘カウラ脱走と日豪間の記憶 [The Cowra Breakout and Its Memories in Japan and Australia]’, オーストラリア研究
19, no. 17 (2006): 33–37.

Australia-Japan Research Centre 8
3. Australia–Japan economic relations
3.1 Foundational Economic Agreements When Australia and Japan concluded the 1957 Commerce Agreement just 12 years after the end of the
Second World War, memories of the conflict were still fresh and anti-Japan prejudices still ran deep in
Australia. However, the deal had a significant economic and psychological impact. The Commerce
Agreement was a watershed moment as Australia became the first country to normalise its trade
relations with Japan after the Second World War through the provision of equal tariff treatment on a
Most Favoured Nation (MFN) basis. In the words of T.W. Eckersley, the former Acting Japanese
Secretary for the Australian Legation in Tokyo, the agreement carried ‘political and psychological
significance not measurable … in terms of money. The removal of discrimination is the removal of a
thorn which has troubled the Japanese almost since the time when they first came into contact with
the West’.11
The timing was fortuitous as the Commerce Agreement served to undergird Australia’s role as a stable
supplier of goods to Japan, particularly in energy and strategic raw materials. As Japan sought to recover
from the devastation of the war, trade with Australia contributed to its rapid economic growth. The
agreement also opened up for Australia a key market in Asia at a time when the United Kingdom was
shifting its focus away from trade through Commonwealth auspices and towards Europe, as momentum
built for the establishment of the European Economic Community. By 1967, Japan overtook West
Germany to become the second largest economy in the free world.
In 1976, Australia and Japan concluded the Basic Treaty of Friendship and Cooperation between
Australia and Japan (known as the NARA Treaty). This was another important foundational document
that carried both economic and psychological impacts. The NARA Treaty extended MFN ‘non-
discriminatory treatment beyond trade to all commercial dealings between Australia and Japan’ and
helped bring about increased investment and people flows between the two countries.12 Further, as the
first such friendship and cooperation treaty signed by Australia with another country, it came to
symbolise that ‘memories of Japanese conduct during the Second World War had finally and officially
been put to rest’.13
Building on these foundational agreements, the two countries concluded the Japan-Australia
Economic Partnership Agreement (JAEPA) in 2014. JAEPA was lauded the first Japanese trade
agreement ‘with any significant commitment to liberalization of agriculture, even though
11 Department of Foreign Affairs and Trade, ‘Memorandum From Eckersley To Department Of External Affairs’, 10 July
1957, https://www.dfat.gov.au/about-us/publications/historical-documents/Pages/volume-19/225-memorandum-from-
eckersley-to-department-of-external-affairs. 12 Peter Drysdale, ‘Did the NARA Treaty Make a Difference?’, Australian Journal of International Affairs 60, no. 4 (2006):
490, https://doi.org/10.1080/10357710601006994. 13 Takashi Terada, ‘Thirty Years of the Australia–Japan Partnership in Asian Regionalism: Evolution and Future Directions’,
Australian Journal of International Affairs 60, no. 4 (2006): 537, https://doi.org/10.1080/10357710601007026.

Australia-Japan Research Centre 9
liberalization was limited’.14 The deal saw Japan agree ‘to small, quantitative increases in imports by
means of staged reductions in tariffs over one to two decades’ on beef, processed cheese, high polarity
sugars and pork but avoid any liberalisation on other sensitive products such as rice, sugars, wheat,
butter and fresh cheese.15 Australia lowered its tariffs on Japanese electronics, whitegoods and cars.
While this was the first time Japan made concessions on agriculture with ‘a major economy with a
strong agricultural sector’, they were relatively small compared to Australia’s trade agreements with
South Korea and China, also signed the same year.16 For instance, tariffs on Australian beef imports to
Japan are being incrementally lowered from 38.5 per cent in 2014 to 19.5 per cent by April 2031.17 By
contrast, China and South Korea will incrementally lower tariffs on Australian beef imports to zero
by 2024 and 2028 respectively.18 Given the complications surrounding Japan’s agricultural politics,
further liberalisation of its so-called sacred products can be expected to be slow despite the structural
pressures for reform from globalisation.19
3.2 Trade From the abovementioned foundations, trade grew and continues to be a key pillar of the Australia–
Japan relationship. In 1967, Japan overtook the United Kingdom as Australia’s largest export market, a
position it held until 2009 when it was overtaken by China.20 In 2019, Japan was Australia’s second
biggest trading partner behind China (see Table 2). For Japan, Australia was its fifth largest trading
partner behind China, the United States, South Korea and Taiwan (see Table 1). The trade relationship
has continued to witness significant growth over the last three decades. Total two-way trade in goods
and services between Australia and Japan expanded from AU$19.4 billion in 1987 to AU$87 billion in
2019. Despite this growth, as Australia diversified its trade relationships, Japan’s share of goods and
services trade with Australia decreased from 19.76 per cent in 1987 to 9.48 per cent in 2019 (see Table
2). At the same time, Australia’s share of trade in goods with Japan increased from 3.06 per cent in 2004
to 4.2 per cent in 2019 (see Table 1).
As might be expected, the Australia–Japan trade relationship tilts towards Australian exports with a
deficit of over AU$34 billion in 2019 (see Figure 1). Australian goods and services exports to Japan rose
from AU$10.8 billion in 1987 to AU$60.6 billion in 2019. During this period, Japan’s share of Australian
goods and services exports fell from 22.69 per cent to 12.31 per cent. Yet Japan still ranks as Australia’s
14 Shiro Armstrong, ‘Economic Diplomacy and Economic Security under Abe’, Asian Economic Policy Review, 2021, 3,
https://doi.org/10.1111/aepr.12335. 15 Aurelia George Mulgan, ‘Japan and Australia “Beef up” Relations’, East Asia Forum, 15 April 2014,
https://www.eastasiaforum.org/2014/04/15/japan-and-australia-beef-up-relations/. 16 ABC News, ‘Abbott Hails Free Trade Deal with Japan’, 7 April 2014, https://www.abc.net.au/news/2014-04-07/australia-
japan-free-trade-deal/5372242. 17 Department of Foreign Affairs and Trade, ‘JAEPA Fact Sheet: Agriculture and Processed Food’, August 2018,
https://tinyurl.com/8733smkz. 18 Department of Foreign Affairs and Trade, ‘KAFTA and Trade in Goods’, August 2018, https://tinyurl.com/f25tmcwx;
Department of Foreign Affairs and Trade, ‘ChAFTA Fact Sheet: Agriculture and Processed Food’, August 2018,
https://tinyurl.com/55n2yy5h. 19 Aurelia George Mulgan and Masayoshi Honma, eds., The Political Economy of Japanese Trade Policy, Critical Studies of
the Asia-Pacific (Palgrave Macmillan, 2015), 94, https://doi.org/10.1057/9781137414564. 20 DFAT Economic Analytical Unit, ‘Shaping Forces: Complementarity and Distance’.

Australia-Japan Research Centre 10
second largest export destination behind only China (see Table 2). Australia ranked as Japan’s third
largest source of goods imports behind China and the United States (see Table 1).
Figure 1: Australia–Japan Trade in Good and Services (country totals) 1987–2019 (AU$ billions)
Source: Department of Foreign Affairs and Trade, Trade Time Series Data, Australia's direction of goods and services trade –
calendar years from 1987 to present; see also Australian Bureau of Statistics, catalogue number 5368.0.
Figure 2: Australia–Japan Trade in Goods and Services (Differentiated) 1987–2019 (AU$ billions)
Source: Department of Foreign Affairs and Trade, Trade Time Series Data, Australia's direction of goods and services trade –
calendar years from 1987 to present; see also Australian Bureau of Statistics, International Trade in Goods and Services,
Australia, catalogue number 5368.0.
While observing the trade deficit, it should be noted that Japan has offshored the production of many
of its goods to other Asian countries, such as China and Southeast Asian nations. In other words, ‘“Made
in Japan” has increasingly become “made by Japan elsewhere”’.21 Between 1990 and 2007, the share of
21 DFAT Economic Analytical Unit, ‘A Remarkable Relationship’, in Australia and Japan: A Remarkable Commercial
Relationship (Canberra: Department of Foreign Affairs and Trade, 2008), https://www.dfat.gov.au/about-
us/publications/trade-investment/australia-japan-commercial-relationship/Pages/chapter-1-a-remarkable-relationship.
-
10
20
30
40
50
60
70
19
87
19
88
19
89
19
90
19
91
19
92
19
93
19
94
19
95
19
96
19
97
19
98
19
99
20
00
20
01
20
02
20
03
20
04
20
05
20
06
20
07
20
08
20
09
20
10
20
11
20
12
20
13
20
14
20
15
20
16
20
17
20
18
20
19
Australian Goods and Services to Japan Japanese Goods and Services to Australia
0
10
20
30
40
50
60
70
80
90
1987
1988
1989
19
90
1991
1992
1993
1994
1995
1996
1997
1998
1999
2000
2001
2002
20
03
2004
2005
2006
2007
2008
2009
2010
2011
2012
2013
2014
2015
2016
2017
2018
2019
Services: Jpn > Aus Services: Aus > Jpn Goods: Jpn > Aus Goods: Aus > Jpn

Australia-Japan Research Centre 11
Japanese electronics manufacturing output produced offshore rose from 11.4 per cent to 45.5 per cent.22
Japanese electronic brands that continue to be popular in Australia—such as Toyota, Honda, Sanyo,
Sharp, Sony, Hitachi and Panasonic—are often manufactured in China. 23 Similarly, Japanese fast
fashion retailer Uniqlo has set up factories across Asia, especially in China and Vietnam.24
When comparing goods and services, it is evident that the bulk of trade tilts towards goods. In 2019,
out of the AU$60.6 billion total Australian exports to Japan, AU$57.9 billion was in goods while AU$2.7
billion was in services. Similarly, of the AU$26.4 billion in Japanese imports into Australia, AU$21.6
were in goods while AU$4.8 were in services (see Figure 2).
Table 1: Japan’s top two-way goods trading partners, 2019 (US$ millions)
Rank Country/Area Exports Imports Total Share
1 China 134,697 169,262 303,960 21.31%
2 United States 139,884 79,215 219,099 15.36%
3 South Korea 46,249 29,586 75,836 5.32%
4 Taiwan 43,016 26,857 69,873 4.90%
5 Australia 14,491 45,463 59,955 4.20%
6 Thailand 30,186 25,360 55,546 3.89%
7 Germany 20,229 24,966 45,194 3.17%
8 Vietnam 16,496 22,489 38,985 2.73%
9 Hong Kong 33,631 2,062 35,693 2.50%
10 United Arab Emirates 7,186 26,201 33,387 2.34% Source: Japan External Trade Organization, Japanese Trade and Investment Statistics.
Table 2: Australia's top two-way goods & services trading partners, 2019 (AU$ millions)
Rank Country/Area Goods Services Total Share
Exports Imports Exports Imports
1 China 149,783 79,491 19,346 3396 252,016 27.46%
2 Japan 57,928 21,645 2,705 4766 87,044 9.48%
3 United States 15,192 37,199 10,248 18462 81,101 8.84%
4 Republic of Korea 26,012 12,211 2,234 886 41,343 4.50%
5 United Kingdom 15,357 7,224 5,851 10068 38,500 4.19%
6 Singapore 11,915 10,529 4,951 5933 33,328 3.63%
7 New Zealand 10,291 7,791 6,275 6805 31,161 3.39%
8 India 14,280 4,671 7,593 2786 29,330 3.20%
9 Malaysia 9,042 10,985 2,660 1276 23,962 2.61%
10 Thailand 4,496 14,878 1,197 2522 23,093 2.52% Source: Department of Foreign Affairs and Trade, Trade Time Series Data, Australia's direction of goods and services trade –
calendar years from 1987 to present; see also Australian Bureau of Statistics, International Trade in Goods and Services,
Australia, catalogue number 5368.0.
22 Peter Drysdale, ‘Time to Re-Think the Economic Partnership with Japan in Asia’, East Asia Forum, 13 September 2009,
https://www.eastasiaforum.org/2009/09/13/time-to-re-think-the-economic-partnership-with-japan-in-asia/. 23 DFAT Economic Analytical Unit, ‘A Remarkable Relationship’. 24 Yoshihiro Hara, ‘Uniqlo Discloses All Garment Factories for First Time’, Nikkei Asian Review, 11 May 2019,
https://asia.nikkei.com/Business/Companies/Uniqlo-discloses-all-garment-factories-for-first-time.

Australia-Japan Research Centre 12
Australian exports to Japan are dominated by energy, resources and foodstuffs (see Figure 3). The top
categories in 2019 were natural gas, coal, iron ore, confidential items, beef, copper, aluminium, wood
chips, cheese and curds, sugars, molasses and honey, meats other than beef and wheat. This correlates
broadly with the key sectors of Japanese investment in Australia.
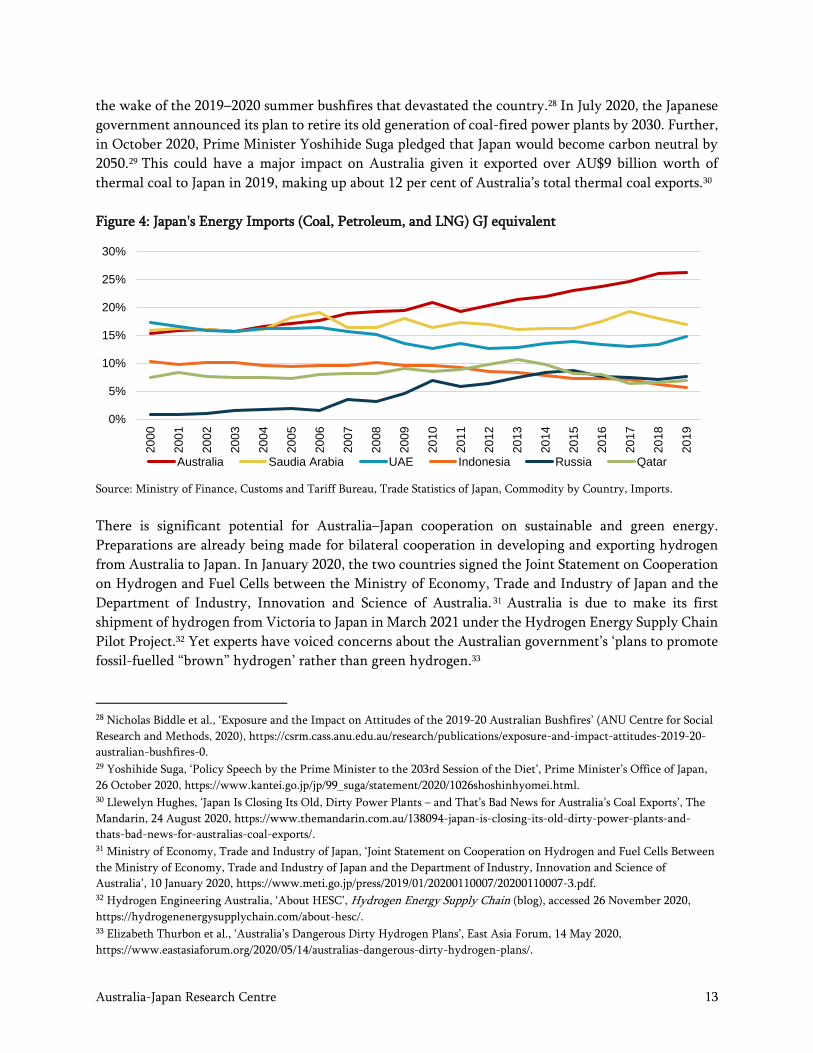
Japan relies on imports for over 90 per cent of its energy needs and Australian exports play a critical
role in helping to power the Japanese economy. 25 Australia is the major supplier of energy and strategic
raw materials to Japan. Australia accounts for over a quarter of Japan's energy imports in coal, LNG and
oil when measured in gigajoule (GJ) equivalent (see Figure 4). Australia supplies more than half of
Japan’s coal imports and more than a third of Japan’s LNG imports. Australia also supplies over half of
Japan’s iron ore and is the major supplier of bauxite, alumina, aluminium and nickel to Japan.26
Figure 3: Australia's Merchandise Exports to Japan (AU$ billions): Top Categories
Source: Department of Foreign Affairs and Trade, Trade Statistical Pivot Tables, Country and commodity pivot table 2006 to
2019; See also Australian Bureau of Statistics, International Trade in Goods and Services, Australia, catalogue number 5368.0.
Given this high level of Australia’s energy exports, the global shift away from fossil fuels to mitigate
climate change has the potential to significantly affect the composition of Australia–Japan trade. The
Reserve Bank of Australia has forewarned of the uncertain long-term global outlook for Australia’s coal
exports.27 The Australian public has become increasingly conscious of the impacts of climate change in
25 Ministry of Economy, Trade and Industry, Japan’s Energy 2019, 1. 26 Ministry of Finance, ‘Trade Statistics of Japan, Commodity by Country, Imports’, Japan Customs, accessed 25 September
2020, https://www.customs.go.jp/toukei/info/tsdl.htm. 27 Michelle Cunningham, Luke Van Uffelen, and Mark Chambers, ‘The Changing Global Market for Australian Coal’, RBA
Bulletin September (2019), https://www.rba.gov.au/publications/bulletin/2019/sep/the-changing-global-market-for-
australian-coal.html.
0
10
20
30
40
50
60
2006 2007 2008 2009 2010 2011 2012 2013 2014 2015 2016 2017 2018 2019
Natural gas Coal Iron ores & concentratesConfidential items Beef Copper ores & concentratesAluminium Other
Australia-Japan Research Centre 13
the wake of the 2019–2020 summer bushfires that devastated the country.28 In July 2020, the Japanese
government announced its plan to retire its old generation of coal-fired power plants by 2030. Further,
in October 2020, Prime Minister Yoshihide Suga pledged that Japan would become carbon neutral by
2050.29 This could have a major impact on Australia given it exported over AU$9 billion worth of
thermal coal to Japan in 2019, making up about 12 per cent of Australia’s total thermal coal exports.30
Figure 4: Japan's Energy Imports (Coal, Petroleum, and LNG) GJ equivalent
Source: Ministry of Finance, Customs and Tariff Bureau, Trade Statistics of Japan, Commodity by Country, Imports.
There is significant potential for Australia–Japan cooperation on sustainable and green energy.
Preparations are already being made for bilateral cooperation in developing and exporting hydrogen
from Australia to Japan. In January 2020, the two countries signed the Joint Statement on Cooperation
on Hydrogen and Fuel Cells between the Ministry of Economy, Trade and Industry of Japan and the
Department of Industry, Innovation and Science of Australia. 31 Australia is due to make its first
shipment of hydrogen from Victoria to Japan in March 2021 under the Hydrogen Energy Supply Chain
Pilot Project.32 Yet experts have voiced concerns about the Australian government’s ‘plans to promote
fossil-fuelled “brown” hydrogen’ rather than green hydrogen.33
28 Nicholas Biddle et al., ‘Exposure and the Impact on Attitudes of the 2019-20 Australian Bushfires’ (ANU Centre for Social
Research and Methods, 2020), https://csrm.cass.anu.edu.au/research/publications/exposure-and-impact-attitudes-2019-20-
australian-bushfires-0. 29 Yoshihide Suga, ‘Policy Speech by the Prime Minister to the 203rd Session of the Diet’, Prime Minister’s Office of Japan,
26 October 2020, https://www.kantei.go.jp/jp/99_suga/statement/2020/1026shoshinhyomei.html. 30 Llewelyn Hughes, ‘Japan Is Closing Its Old, Dirty Power Plants – and That’s Bad News for Australia’s Coal Exports’, The
Mandarin, 24 August 2020, https://www.themandarin.com.au/138094-japan-is-closing-its-old-dirty-power-plants-and-
thats-bad-news-for-australias-coal-exports/. 31 Ministry of Economy, Trade and Industry of Japan, ‘Joint Statement on Cooperation on Hydrogen and Fuel Cells Between
the Ministry of Economy, Trade and Industry of Japan and the Department of Industry, Innovation and Science of
Australia’, 10 January 2020, https://www.meti.go.jp/press/2019/01/20200110007/20200110007-3.pdf. 32 Hydrogen Engineering Australia, ‘About HESC’, Hydrogen Energy Supply Chain (blog), accessed 26 November 2020,
https://hydrogenenergysupplychain.com/about-hesc/. 33 Elizabeth Thurbon et al., ‘Australia’s Dangerous Dirty Hydrogen Plans’, East Asia Forum, 14 May 2020,
https://www.eastasiaforum.org/2020/05/14/australias-dangerous-dirty-hydrogen-plans/.
0%
5%
10%
15%
20%
25%
30%
2000
2001
2002
2003
2004
2005
2006
2007
2008
20
09
2010
2011
2012
2013
2014
20
15
2016
2017
2018
2019
Australia Saudia Arabia UAE Indonesia Russia Qatar

Australia-Japan Research Centre 14
Japan’s goods and services exports to Australia rose from AU$8.6 billion in 1987 to AU$26.4 billion in
2019 (see Figure 1). This saw Australia’s share of Japan’s goods exports maintain at over 2 per cent
between 2004 and 2019. At the same time, this represented a decrease of Japan’s share of Australia’s
imports from 17 per cent in 1987 to 6.21 per cent in 2019. Japan ranks as Australia’s third largest source
of imports behind China and the United States while Australia ranks as Japan’s tenth largest export
destination. The top categories of Japanese exports to Australia in 2019 included passenger motor
vehicles, refined petroleum, goods vehicles, civil engineering equipment, gold, rubber tyres, treads and
tubes, vehicle parts, office machines, electrical machinery, and heating and cooling equipment (see
Figure 5).
Figure 5: Australia's Merchandise Imports from Japan (AU$ billions): Top Categories
Source: Department of Foreign Affairs and Trade, Trade Statistical Pivot Tables, Country and commodity pivot table 2006 to
2019; See also Australian Bureau of Statistics, International Trade in Goods and Services, Australia, catalogue number 5368.0.
Fun fact Australia is the only foreign country trusted to produce wheat for Japan’s lucrative premium udon
noodle market. Noodle technicians from the Australian wheat industry and the Japanese Flour
Millers Association have worked together for over three decades to cultivate specialised varieties of
Australian wheat for Japanese udon noodles to ensure the best dough elasticity and soft-firm balance
(mochi mochi).34
34 Bridget FitzGerald, ‘Australian Wheat the Key Ingredient in Japan’s Udon Noodles’, ABC Radio (Australian Broadcasting
Corporation, 15 October 2019), https://www.abc.net.au/radio/programs/am/australian-wheat-key-ingredient-in-japans-
famous-udon-noodles/11602512.
0
5
10
15
20
25
30
2006 2007 2008 2009 2010 2011 2012 2013 2014 2015 2016 2017 2018 2019
Passenger motor vehicles Refined petroleumGoods vehicles Civil engineering equipment & partsGold Rubber tyres, treads & tubesVehicle parts & accessories Other
Australia-Japan Research Centre 15
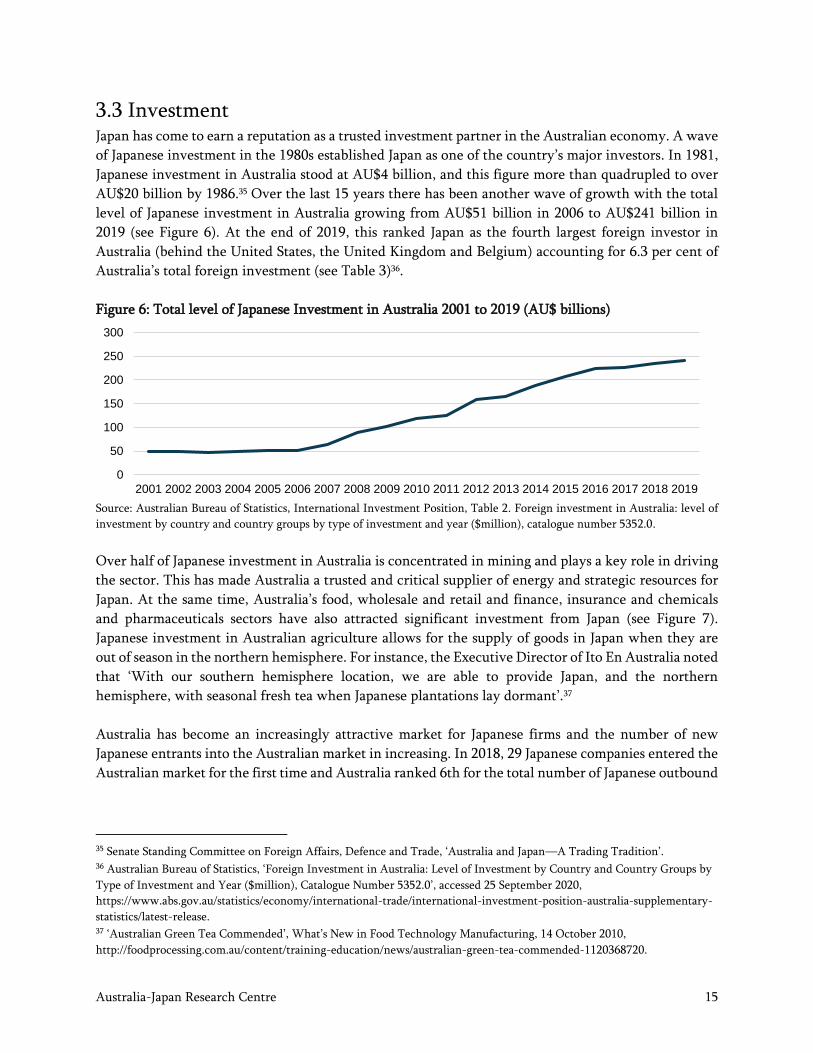
3.3 Investment Japan has come to earn a reputation as a trusted investment partner in the Australian economy. A wave
of Japanese investment in the 1980s established Japan as one of the country’s major investors. In 1981,
Japanese investment in Australia stood at AU$4 billion, and this figure more than quadrupled to over
AU$20 billion by 1986.35 Over the last 15 years there has been another wave of growth with the total
level of Japanese investment in Australia growing from AU$51 billion in 2006 to AU$241 billion in
2019 (see Figure 6). At the end of 2019, this ranked Japan as the fourth largest foreign investor in
Australia (behind the United States, the United Kingdom and Belgium) accounting for 6.3 per cent of
Australia’s total foreign investment (see Table 3)36.
Figure 6: Total level of Japanese Investment in Australia 2001 to 2019 (AU$ billions)
Source: Australian Bureau of Statistics, International Investment Position, Table 2. Foreign investment in Australia: level of
investment by country and country groups by type of investment and year ($million), catalogue number 5352.0.
Over half of Japanese investment in Australia is concentrated in mining and plays a key role in driving
the sector. This has made Australia a trusted and critical supplier of energy and strategic resources for
Japan. At the same time, Australia’s food, wholesale and retail and finance, insurance and chemicals
and pharmaceuticals sectors have also attracted significant investment from Japan (see Figure 7).
Japanese investment in Australian agriculture allows for the supply of goods in Japan when they are
out of season in the northern hemisphere. For instance, the Executive Director of Ito En Australia noted
that ‘With our southern hemisphere location, we are able to provide Japan, and the northern
hemisphere, with seasonal fresh tea when Japanese plantations lay dormant’.37
Australia has become an increasingly attractive market for Japanese firms and the number of new
Japanese entrants into the Australian market in increasing. In 2018, 29 Japanese companies entered the
Australian market for the first time and Australia ranked 6th for the total number of Japanese outbound
35 Senate Standing Committee on Foreign Affairs, Defence and Trade, ‘Australia and Japan—A Trading Tradition’. 36 Australian Bureau of Statistics, ‘Foreign Investment in Australia: Level of Investment by Country and Country Groups by
Type of Investment and Year ($million), Catalogue Number 5352.0’, accessed 25 September 2020,
https://www.abs.gov.au/statistics/economy/international-trade/international-investment-position-australia-supplementary-
statistics/latest-release. 37 ‘Australian Green Tea Commended’, What’s New in Food Technology Manufacturing, 14 October 2010,
http://foodprocessing.com.au/content/training-education/news/australian-green-tea-commended-1120368720.
0
50
100
150
200
250
300
2001 2002 2003 2004 2005 2006 2007 2008 2009 2010 2011 2012 2013 2014 2015 2016 2017 2018 2019

Australia-Japan Research Centre 16
M&A deals, up from 12th in 2000.38 This is the result of a number of long-term trends including
Australia’s stable legal and political system, Australia’s growing population, Japan’s ageing and
shrinking population, the weakening of the Australian dollar, the strengthening of the Japanese yen
and Japan’s negative interest rates under Abenomics. At the same time, the Australian Treasury’s
Foreign Investment Review Board has not rejected an investment deal from Japan in over 25 years.39
Table 3: Top foreign investors in Australia by level of investment on 31 December 2019 (AU$ billions)
Rank Country/Area Investment ($AU bn)
1 United States 983.7
2 United Kingdom 686.1
3 Belgium 348.1
4 Japan 241.1
5 Hong Kong (SAR of China) 140.7
6 Singapore 99.9 Source: Australian Bureau of Statistics, International Investment Position, Table 2. Foreign investment in Australia: level of
investment by country and country groups by type of investment and year ($million), catalogue number 5352.0.
Figure 7: Japan's FDI Position in Australia by Sector (2005–2019)
Source: Bank of Japan, Balance of Payments, Direct Investment Position.
Japanese M&A deals in Australia have grown in size in recent years. In 2019, five Japanese M&A mega-
deals exceeded AU$1 billion. 40 Namely, Asahi’s acquisition of Carlton United Breweries from
Anhheuser-Busch for AU$16 billion, Mitsubishi UFJ Trust and Banking Corporation’s acquisition of
Colonial First State Global Asset Management from the Commonwealth Bank of Australia for AU$4.2
billion, Nippon Paint’s AU$3.8 billion takeover of paint manufacturer Dulux, Nippon Paper’s AU$1.7
billion acquisition of fibre packing business Orora, and Sumitomo Chemical’s AU$1.2 billion
acquisition of agricultural chemical company Nufarm.
38 Herbert Smith Freehills, ‘Japan-Australia M&A Review and Trends (2017–2019)’, 18 March 2019, 3,
https://www.herbertsmithfreehills.com/latest-thinking/japan-australia-ma-review-and-trends-2017%E2%80%932019. 39 Herbert Smith Freehills, ‘Japan-Australia M&A Review and Trends (2017-2020)’, 10 March 2020, 2,
https://www.herbertsmithfreehills.com/latest-thinking/Japan-Australia-M-A-Review-and-Trends-2017-2020. 40 Herbert Smith Freehills, 1.
0%
10%
20%
30%
40%
50%
60%
70%
2005 2006 2007 2008 2009 2010 2011 2012 2013 2014 2015 2016 2017 2018 2019
Mining Food Wholesale and retail Finance and insuarance

Australia-Japan Research Centre 17
Research by the Australian Business Cooperation Committee shows that the profile of Japanese
companies entering Australia in 2019 comprised four key characteristics. First, they were established
firms with a median age of 72 years. Second, they were international firms with international
operations in a median of 20 countries. Third, they were large companies with a median annual
turnover of AU$17.4 billion. Finally, Japanese firms that invested in Australia in 2019 identified
acquiring Australian know-how and extending their sales network as key objectives for their
investments.41
One future area where the know-how of Australian companies could prove useful for prospective
Japanese investors is digitisation. The COVID-19 pandemic has shown the importance of telework as
an option for workers. It has also exposed the challenges Japanese companies face in shifting to higher
rates of telework as a result of a low level of digitisation in Japan.42 Moreover, Japanese Prime Minister
Yoshihide Suga has further identified digitisation as a key objective for his government.
With regard to Australian foreign investment, Japan was the third ranked destination after the United
States and the United Kingdom as of 31 December 2019 (see Table 4). There has been significant growth
in the last 10 years with Australian investment in Japan rising from AU$30.8 billion in 2010 to
AU$139.6 billion in 2019 (see Figure 8). This represents 4.7 per cent of Australian investment abroad.43
The most notable growth in Australian investment has been in the transportation sector while there
have also been more significant flows in iron and non-ferrous metals, finance and insurance, and
services (see Figure 9).
Figure 8: Australian investment in Japan, levels, 31 December 2019 (AU$ billions)
Source: Australian Bureau of Statistics, Table 5. Australian Investment Abroad: Level of Investment by Country and Country
Groups by Type of Investment and Year ($million), catalogue number 5352.0.
41 Australia Japan Business Cooperation Committee, ‘Why Are Japanese Companies Investing in Australia?’, June 2020, 3–6,
https://www.ajbcc.asn.au/reports/why-are-japanese-companies-investing-in-australia-ajbcc/. 42 Hiroaki Richard Watanabe, ‘Low Levels of Digitalisation Are a Barrier to Telework in Japan’, East Asia Forum, 20 June
2020, https://www.eastasiaforum.org/2020/06/20/low-levels-of-digitalisation-are-a-barrier-to-telework-in-japan/. 43 Australian Bureau of Statistics, ‘Australian Investment Abroad: Level of Investment by Country and Country Groups by
Type of Investment and Year ($million), Catalogue Number 5352.0’, accessed 25 September 2020,
https://www.abs.gov.au/statistics/economy/international-trade/international-investment-position-australia-supplementary-
statistics/latest-release.
0
20
40
60
80
100
120
140
160
2001 2002 2003 2004 2005 2006 2007 2008 2009 2010 2011 2012 2013 2014 2015 2016 2017 2018 2019

Australia-Japan Research Centre 18
Table 4: Australian investment abroad, levels, 31 December 2019 (AU$ billions)
Rank Country/Area Investment level
1 United States 837.4
2 United Kingdom 507.4
3 Japan 139.6
4 New Zealand 130.5
5 Germany 97.1
6 China 85.3 Source: Australian Bureau of Statistics, Table 5. Australian Investment Abroad: Level of Investment by Country and Country
Groups by Type of Investment and Year ($million), catalogue number 5352.0.
Figure 9: Australia's FDI Position in Japan by sector (2008–2019)
Source: Bank of Japan, Balance of Payments, Direct Investment Position.
0%
10%
20%
30%
40%
50%
60%
70%
80%
2008 2009 2010 2011 2012 2013 2014 2015 2016 2017 2018 2019
Iron, non-ferrous, and metals Transportation Finance and insurance Services

Australia-Japan Research Centre 19
4. Australia–Japan people-to-people links
Australia–Japan relations are anchored in deep people-to-people links. These links span sister city
arrangements, education exchanges, mutual working holiday arrangements and tourist flows.
Symbolic of these links is that at the age of 14, Japanese Emperor Naruhito (then Crown Prince
Naruhito) chose Australia as the destination for his first overseas trip and high school homestay
where he stayed with a family in Melbourne for a week in August 1974.44
4.1 Sister City Arrangements Australia has more sister city and sister state arrangements with Japan than any other country. The 101
Australia–Japan sister city arrangements and six sister state arrangements comprise almost 20 per cent
of Australia’s such international arrangements outstripping China (99), the United States (86) and the
United Kingdom (44).45 At the same time, Australia ranks fourth—behind the United States (456),
China (374) and South Korea (164) despite its relatively smaller population—with a share of over 6 per
cent of Japan’s 1773 sister city and sister prefecture arrangements.46 Australia and Japan also maintain
five sister port arrangements, more than half of Australia’s sister ports.47
Figure 10: Growth of Australia–Japan Sister City Arrangements (1963–2020)
Source: Council of Local Authorities for International Relations, Sister Affiliations between Australia and Japan.
The first Australia–Japan sister city arrangement was established in 1963 between the cities of Lismore
in New South Wales and Yamato Takada in Nara prefecture. This pioneering relationship came about
through the efforts of missionary Father Paul Glynn who organised for businesses from his hometown
44 Ben Hills, Princess Masako: Prisoner of the Chrysanthemum Throne (Random House, 2006), 55–62. 45 Sister Cities Australia, ‘2020 Directory of Australian Sister City and Friendship City Affiliations’, 2020, 11,
http://sistercitiesaustralia.com/images/images_media/Documents/Aust_SCA_Affiliations.pdf. 46 CLAIR, ‘相手国・地域別姉妹提携数’, 1 October 2020, http://www.clair.or.jp/j/exchange/shimai/countries/.
47 Sister Cities Australia, ‘2020 Directory of Australian Sister City and Friendship City Affiliations’, 39.
0
20
40
60
80
100
120
19
63
19
65
19
66
19
68
19
69
19
71
19
72
19
74
19
75
19
77
19
78
19
80
19
81
19
83
19
84
19
86
19
87
19
89
19
90
19
92
19
93
19
95
19
96
19
98
19
99
20
01
20
02
20
04
20
05
20
07
20
08
20
10
20
11
20
13
20
14

Australia-Japan Research Centre 20
of Lismore to fund the establishment of the Takada Catholic Kindergarten. 48 Subsequently, the
establishment of new sister city relationships greatly accelerated in the 1980s and 1990s after the
conclusion of the NARA Treaty (see Figure 10).
In terms of distribution across Australian states, New South Wales (38) hosts over a third of Australia–
Japan sister city arrangements followed by Queensland (21) and Victoria (17) (see Figure 11). In Japan,
the prefectures playing host to the most sister city arrangements with Australia are Tokyo (9), Osaka
(8), Aichi (7) and Hyogo (7) (see Figure 12).
There has been considerable debate about what objectives sister city arrangements should incorporate.
Some of those discussed include objectives such as promoting post-war reconciliation, advancing
exchanges of friendship, culture and language, fostering commercial relations, and developing inter-
subnational government cooperation.
In terms of post-war reconciliation and promoting exchanges at the local level, Australia–Japan sister
city arrangements have been exceedingly successful.49 For instance, the town of Cowra in New South
Wales and Joetsu City in Niigata prefecture—which were both sites of prisoner of war camps during
the Second World War holding detainees from each country—maintain a unique friendship agreement.
Cowra is now home, in the name of peace and remembrance, to the Cowra Japanese War Cemetery
and the Cowra Japanese Garden and Cultural Centre, the largest Japanese garden in the southern
hemisphere. 50 Moreover, since 2011 four Australia–Japan sister city partnerships have won an
International Exchange Commendation from the Japanese Ministry for Internal Affairs and
Communications.51
Figure 11: Number of Australia–Japan Sister City Arrangements by State
Source: Council of Local Authorities for International Relations, Sister Affiliations between Australia and Japan.
48 CLAIR, ‘Yamato Takada-Lismore Sister City Association International Exchange Commendation’, 28 April 2017,
http://www.jlgc.org.au/wp-content/uploads/2013/02/2016Yamato_e_full.pdf. 49 CLAIR Sydney, ‘Sister City Achievements’, accessed 11 October 2020, http://www.jlgc.org.au/international-exchange-
2/sister-city-exchange/results-of-this-initiative/. 50 Embassy of Japan, ‘The Cowra Japanese War Cemetery Online Database’, accessed 11 October 2020,
https://www.cowrajapanesecemetery.org/. 51 CLAIR, ‘International Exchange Commendation’, accessed 11 October 2020, http://www.clair.or.jp/.
0
5
10
15
20
25
30
35
40
AustralianCapital
Territory
New SouthWales
NorthernTerritory
Queensland SouthAustralia
Tasmania Victoria WesternAustralia

Australia-Japan Research Centre 21
Figure 12: Number of Australia–Japan Sister City Arrangements per Prefecture
Source: Council of Local Authorities for International Relations, Sister Affiliations between Australia and Japan.
A comprehensive survey by Hiroaki Mori in 2020 of Japanese local governments with a sister city
arrangement with Australia investigated the portfolio of activities and the degree of satisfaction with
current arrangements. Mori’s survey shows that educational exchanges are the dominant form of
cooperation with almost 90 per cent of Australia–Japan sister city arrangements engaged in such
activities. This is followed by mayor/councillor visits (46.4 per cent), cultural and sporting exchanges
(39.1 per cent), and staff exchanges (15.1 per cent) (see Figure 12). 52 The local entities participating in
sister city programs were most commonly schools (76.5 per cent), sister city committees (60.9 per
cent) international exchange associations (58.6 per cent), individual volunteers (27.6 per cent), and
local Australia–Japan societies (23.8 per cent).53 The reported benefits included student education
(92.6 per cent), greater cultural awareness (83.8 per cent), promoting citizens’ interest in the sister
city and Australia (79.4 per cent), and opportunities to learn English (67.2 per cent).54
Figure 13 Portfolio of Australia–Japan Sister City Activities
Source: Hiroaki Mori, ‘Making old friendships match more: strategic development of Japan-Australia sister-city arrangement’,
Research Report of the Competitive Research Promotion Grant at the University of Kitakyushu, p. 7.
52 Hiroaki Mori, ‘Making Old Friendships Match More: Strategic Development of Japan-Australia Sister City Arrangement’
(The University of Kitakyushu, 2020), 7, https://tinyurl.com/4zehxxn6. 53 Mori, 8. 54 Mori, 12.
0123456789
10A
ich
i
Ao
mo
ri
Ch
iba
Fu
ku
sh
ima
Gifu
Gu
nm
a
Ho
kka
ido
Hyo
go
Iba
raki
Ish
ika
wa
Iwa
te
Ka
gosh
ima
Ka
nag
aw
a
Ko
ch
i
Ku
ma
mo
to
Kyo
to
Miy
aza
ki
Na
ga
sa
ki
Na
ra
Oita
Oka
ya
ma
Osa
ka
Sa
ita
ma
Sh
izuo
ka
To
ch
igi
To
ku
sh
ima
To
kyo
To
ya
ma
Wa
ka
ya
ma
Ya
ma
ga
ta
Ya
ma
gu
ch
i
Ya
ma
na
sh
i
11.8
4.3
2.9
4.3
39.1
89.9
15.9
46.4
0 10 20 30 40 50 60 70 80 90 100
Others
Problem Solving
Trade and Investment
Tourism
Cultural and Sporting Exchange
Educational Exchange
Staff Exchange
Mayoral/Councillor Visits

Australia-Japan Research Centre 22
Previous research shows that most local government are interested in developing commercial
relations and tourism as new dimensions of their sister city relationships.55 This research recommends
establishing policy guidelines and a framework to guide the potential commercial aspects of sister city
relationships.56 However, the number of Japanese local governments reporting activities in these areas
stood at only 2.9 per cent (trade and investment) and 4.3 per cent (tourism) respectively.57
Overall, despite reporting a number of challenges, the sister city relationships appear to be relatively
successful in achieving their objectives. The two biggest problems reported were a lack of resources
(55.9 per cent) and personnel rotation in local governments affecting communication channels (44.1
per cent).58 Yet a vast majority of cities (82.6 per cent) reported that they intended to continue with
their current programs.59
Sister state relationships could be used as a vehicle for inter-subnational government cooperation on a
range of global challenges, such as global sustainable development. A case study of the Western
Australia–Hyogo partnership suggests that Australia–Japan sister state relationships seem to be
underutilised in pursuit of such objectives.60 While further research is needed on cooperation
between sister states, a lack of awareness of the opportunities and a lack of resources appear to be the
primary impediments to further development in this area.
4.2 Education Education is a further anchor underpinning Australia and Japan’s strong people-to-people relations.
Japanese is the most widely taught foreign language in Australia with over 405,000 students across
primary and tertiary levels. This ranks Australia fourth globally behind China, Indonesia and South
Korea, and the highest in the world on a per capita basis (see Figure 14).61 However, the vast majority
of Australia’s Japanese language learners are concentrated in the primary and lower secondary levels.
Greater research is needed to investigate the factors leading to low retention rates in the upper
secondary and tertiary cohorts.62
55 Kevin O’Toole, ‘Kokusaika and Internationalisation: Australian and Japanese Sister City Type Relationships’, Australian
Journal of International Affairs 55, no. 3 (1 November 2001): 403–19, https://doi.org/10.1080/10357710120095243. 56 Mona Chung and Bruno Mascitelli, ‘A New Dimension of Sister City Relationships in the 21st Century : A Pilot Study in
Australia’, Business Strategies and Technological Innovations for Sustainable Development : Creating Global Prosperity for Humanity : Global Business and Technology Association : Eleventh International Conference Readings Book, 1 January
2009, 228; Kevin O’Toole, ‘From Mates to Markets: Australian Sister City Type Relationships’, Policy, Organisation and Society 19, no. 1 (1 June 2000): 43–64, https://doi.org/10.1080/10349952.2000.11876718. 57 Mori, ‘Making Old Friendships Match More: Strategic Development of Japan-Australia Sister City Arrangement’, 7. 58 Mori, 13. 59 Mori, 16. 60 Yasuo Takao, ‘Reinvigorating the Transnational Links of Sub-National Governments between Australia and Japan with
Special Reference to Western Australia–Hyogo Sister-State Relations’, The Pacific Review 23, no. 4 (13 August 2010): 453–
77, https://doi.org/10.1080/09512748.2010.496000. 61 The Japan Foundation, ‘Survey Report on Japanese-Language Education Abroad 2018’, 2020, 13,
https://www.jpf.go.jp/j/project/japanese/survey/result/dl/survey2018/Report_all_e.pdf. 62 Anne de Kretser and Robyn Spence-Brown, ‘The Current State of Japanese Language Education in Australian Schools’,
Department of Education, Employment and Workplace Relations, 2010, 73,
https://docs.education.gov.au/documents/current-state-japanese-language-education-australian-schools; Robyn Spence-

Australia-Japan Research Centre 23
More than half of Australia’s universities (24 out of 43) offer Japanese language or Japanese society
courses. Yet only six universities have dedicated Japanese studies programs (The Australian National
University, the University of Sydney, the University of New South Wales, the University of Melbourne,
Monash University and the University of Western Australia). At the same time, ‘a large proportion of
the students of Japanese language [at Australian universities] are international students from Asia.
While this had been a positive factor for the financial sustainability of Japanese studies programs until
2020, it has made them particularly vulnerable to loss of enrolments during the COVID-19 crisis’.63
In Japan, studies of Australia have been spearheaded by the Australian Studies Association of Japan
(ASAJ) since its establishment in 1989. This includes the publication of the Journal of Australian Studies
and the organisation of an annual conference.64 The University of Tokyo’s Centre for Pacific and
American Studies established a Visiting Professorship in Australian Studies in 1999, supported by the
Australia-Japan Foundation, ‘to promote a deeper understanding of Australia and its regional
engagement’.65 Australians have also contributed to the study of English and international exchange in
Japanese high schools. One example of this is the Japan Exchange and Teaching (JET) Programme. Since
its establishment in 1987, Australia has sent almost 10,000 participants to Japan in Assistant Language
Teacher, Coordinator for International Relations, and Sports Exchange Advisor positions. In 2019,
Australia sent 343 participants accounting for 6 per cent of all participants that year (see Figure 15).
This ranked Australia fourth (behind the United States, the United Kingdom and Canada) out of 57
participating countries.66
Figure 14: Number of Japanese Language Learners by Country, Primary to Tertiary Levels (1998–2018)
Source: The Japan Foundation, Survey on Japanese-Language Education Abroad (1998–2018).
Brown, ‘On Rocky Ground: Monolingual Educational Structures and Japanese Language Education in Australia’, in Dynamic Ecologies: A Relational Perspective on Languages Education in the Asia-Pacific Region, ed. Neil Murray and Angela Scarino,
Multilingual Education (Dordrecht: Springer Netherlands, 2014), 183–98, https://doi.org/10.1007/978-94-007-7972-3_12. 63 Rebecca Suter, ‘The Current State of Japanese Studies in Australia in 2020’, Asian Studies Association of Australia, 19 May
2020, http://asaa.asn.au/the-current-state-of-japanese-studies-in-australia-in-2020/. 64 Australian Studies Association of Japan, ‘Objectives of the Association’, accessed 22 October 2020,
http://australianstudies.jp/about/objectives_of_the_association_e.html. 65 Kate Darian-Smith, ‘Visiting Professor in Australian Studies: University of Tokyo’, International Australian Studies
Association (blog), 30 August 2019, https://inasa.org/blog/visiting-professor-in-australian-studies-university-of-tokyo/. 66 CLAIR, ‘Participating Countries’, JET Programme, 2 August 2019, http://jetprogramme.org/en/countries/.
0
200,000
400,000
600,000
800,000
1,000,000
1,200,000
1998 2003 2006 2009 2012 2015 2018
China Indonesia South Korea Australia
Thailand Vietnam Taiwan USA

Australia-Japan Research Centre 24
Figure 15: Number of Australian JET Programme Participants (1987–2019)
Source: Council of Local Authorities for International Relations, JET Programme Participating Countries; Ministry of Foreign
Affairs, Number of JET participants since 1987.
4.3 Sister School Arrangements With 553 Australia–Japan sister school arrangements at the senior high school level as of 2018, Japan
has more such arrangements with Australia than with any other country. This positions Australia ahead
of the United States (424), Canada (315), South Korea (309) and New Zealand (299). The most
significant period of growth for Australia–Japan sister high schools came in the 1990s when the number
of arrangements expanded from 131 in 1993 to 387 in 1999. Australia’s share of Japan’s total number of
arrangements peaked at over 25 per cent in 2009 before falling back to its 1993 level of just over 18 per
cent in 2018. This is a significant achievement given that a number of new countries have established
sister school relations with Japan since 2016 (see Figure 16 and Figure 17). 67
Figure 16: Sister School Arrangements between Japanese & Australian High Schools
Source: Ministry of Education, Culture, Sports, Science and Technology, ‘平成 29年度高等学校等における国際交流等の状況について [The Condition of High School International Student Exchanges 2019]’, p. 10.
67 MEXT, ‘高等学校等における国際交流等の状況について [The Condition of High School International Student
Exchanges]’, 27 August 2019, 10, https://www.mext.go.jp/a_menu/koutou/ryugaku/koukousei/1323946.htm.
0%
2%
4%
6%
8%
10%
0
100
200
300
400
5001
98
7
19
88
19
89
19
90
19
91
19
92
19
93
19
94
19
95
19
96
19
97
19
98
19
99
20
00
20
01
20
02
20
03
20
04
20
05
20
06
20
07
20
08
20
09
20
10
20
11
20
12
20
13
20
14
20
15
20
16
20
17
20
18
20
19
Number of Australian Jet Programme Participants Per cent
0.0%
5.0%
10.0%
15.0%
20.0%
25.0%
30.0%
0
100
200
300
400
500
600
1993 1995 1997 1999 2001 2003 2005 2007 2009 2012 2014 2016 2018
Australia-Japan Sister-School Arrangements Per cent (of Japan's total arrangements)

Australia-Japan Research Centre 25
Figure 17: Sister School Arrangements with Japanese High Schools by Country
Source: Ministry of Education, Culture, Sports, Science and Technology, ‘平成 29年度高等学校等における国際交流等の状況について [The Condition of High School International Student Exchanges 2019]’, p. 10.
Sister school arrangements can take diverse forms. For instance, the Victorian state government
identified sister school arrangements based on a range of different objectives such as language-based
partnerships, community link programs, topic-specific partnerships, information and communication
technology-based links, social justice-based partnerships, professional development programs, cultural-
based partnerships, and network and region-specific programs. 68 In some cases sister school
arrangements have grown out of sister city relationships, such as the 13 sister school partnerships
between Canberra and Nara.69
4.4 Senior High Schools Exchanges
Japan’s Ministry of Education, Culture, Sports, Science and Technology (MEXT) divides student
exchanges and study trips by senior high school students into three categories: overseas study trips (研
修旅行), student exchanges (留学) and overseas school excursions (修学旅行).70 Overseas study trips are
defined as trips for less than three months where students participate in language training, study or
international exchange. Student exchange programs are defined as study abroad where the student is
hosted by an overseas school in-country for three months or more. Overseas school excursions by
Japanese senior high school students to Australia are not as strictly defined and may be aimed at cultural
learning and sightseeing more generally. Overseas school excursions by Australian high school students
to Japan are defined as those that include an accompanying visit hosted by a Japanese senior high school.
68 Department of Education and Training, State of Victoria, ‘Sister School Resource Kit’, 2018, 10,
https://www.study.vic.gov.au/Shared%20Documents/en/Sister-Schools/Sister-schools-resource-kit.pdf. 69 ACT Treasury and Economic Development Directorate, ‘Exchange Activities’, accessed 22 October 2020,
https://www.cmtedd.act.gov.au/communication/cir/nara_japan/activities. 70 While there is a lack of publicly available data about overseas high school exchanges on the Australian side, the data
presented here is a summary of Japanese-language statistics from MEXT translated into English.
0
200
400
600
800
1000
1200
1993 1995 1997 1999 2001 2003 2005 2007 2009 2012 2014 2016 2018
Australia USA Canada S.Korea NZ Other

Australia-Japan Research Centre 26
Figure 18: Japanese Senior High School Student Trips to Australia by Category
Source: Ministry of Education, Culture, Sports, Science and Technology, 平成 29年度高等学校等における国際交流等の状況について
[The Current Condition of High School International Student Exchanges 2019].
School excursions have been the most popular type of trip on both sides. For Japanese high school
excursions to Australia, numbers grew rapidly from just over 2300 in 1992 to almost 39,000 in 2006.
They plateaued at about 20,000 in the last four MEXT surveys between 2011–2017 (see Figure 18). This
made Australia the fourth most popular destination in 2017 (after Taiwan, the United States and
Singapore) accounting for 12.2 per cent of Japanese students participating in overseas high school
excursions globally (see Appendices 9 & 10).
On the Australian side, high school excursion students to Japan (accompanied by a visit to a Japanese
high school) have fluctuated between a low of 1265 in 2011 and a high of 3647 in 2017 for the seven
survey years with data between 2004 and 2017 (see Figure 19). This saw Australia’s share of incoming
international high school excursion students to Japan range from a high of 12.2 per cent in 2004 to a
low of 7.3 per cent in 2013. In the most recent survey in 2017, Australia ranked fifth (behind Taiwan,
South Korea, China, and the United States) and accounted for 9.2 per cent of high school excursion
students visiting Japan (see Appendices 11 & 12).
Study trips have also accounted for a significant flow of high school students between Australia and
Japan. Australia is the most popular destination for Japanese students going on overseas study trips with
numbers growing from just over 2300 in 1992 to a peak of over 11,200 in 2004, maintaining at least
8200 in the six MEXT surveys since (see Figure 18). This means that since 1998, Australia has
outstripped the other native English speaking countries that round out the top five destinations (the
United States, Canada, the United Kingdom and New Zealand) while accounting for between a third
and a quarter of all Japanese high school students going on overseas study trips (see Appendices 1 &
2).71
71 MEXT, ‘高等学校等における国際交流等の状況について [The Condition of High School International Student Exchanges]’, 3–4.
0
5,000
10,000
15,000
20,000
25,000
30,000
35,000
40,000
45,000
50,000
1992 1994 1996 1998 2000 2002 2004 2006 2008 2011 2013 2015 2017
Study Trips School Excursions Student Exchanges

Australia-Japan Research Centre 27
Figure 19: Australian High School Student Trips to Japan by Category
Source: Ministry of Education, Culture, Sports, Science and Technology, 平成 29年度高等学校等における国際交流等の状況について
[The Condition of High School International Student Exchanges 2019].
Australia sent more high school students to Japan on study trips than any other country for all 11
MEXT survey years (1996–2017) except 2015. On average, Australia sent over 1100 students per
survey year (see Figure 19). In the most recent survey in 2017, Australia sent 764 students,
accounting for over 22 per cent of all high school students who visited Japan on study trips (see
Appendices 3 & 4).72
Japanese students participating in overseas exchange programs to Australia have been relatively stable
across the 13 MEXT survey years between 1992–2017, fluctuating between a low of 386 students (12
per cent) in 2011 and a high of 741 students (17 per cent) in 2004. In the most recent survey in 2017,
Australia hosted 522 Japanese senior high school exchange students (see Figure 18). This ranked
Australia fourth behind the United States, Canada and New Zealand (see Appendices 5 & 6). 73
By contrast, Australian students going on exchange programs hosted by a Japanese high school have
seen a startling decline. In 1994, Australia sent 380 students accounting for almost a third of the total
high school exchange students hosted in Japan. However, in the most recent survey in 2017, Australia
sent 81 students representing just over 3 per cent (see Figure 19). As a result, Australia’s rank has fallen
from 2nd in 1992 (behind China) to 7th in 2017 (behind China, Thailand, the United States, South
Korea, Germany, and Taiwan) (see Appendices 7 & 8).74
72 MEXT, 7. 73 MEXT, 4–5. 74 MEXT, 18.
0
500
1000
1500
2000
2500
3000
3500
4000
4500
5000
1992 1994 1996 1998 2000 2002 2004 2006 2008 2011 2013 2015 2017
Study Trips School Excursion (Accompanying School Visit) Student Exchanges

Australia-Japan Research Centre 28
4.5 Japanese Students in Australian Tertiary Education Japanese student participation in Australian tertiary education can be divided into four categories as
defined by the Australian Department of Education, Skills and Employment. Namely, higher education
(HE) institutions such as universities, vocational education and training (VET) institutions (including
Technical and Further Education or TAFE), English Language Intensive Courses for Overseas Students
(ELICOS) programs, and non-award studies (such as enabling and foundation courses). The bulk of
Japanese student enrolments in the Australian tertiary sector are in ELICOS followed by VET.
Enrolment data is provided by the Australian Department of Education, Skills and Employment from
the Commonwealth Provider Registration and International Student Management System. This does
not necessarily represent the number of international students in Australia as a student enrolled in two
different sectors during the same reference period (such as a Bachelor degree and ELICOS) would both
be counted.75
Figure 20: Japanese Student Enrolments in Australian Tertiary Education by Sector
Source: Department of Education, Skills and Employment, International Education Group, International Student Data 2020,
Basic Pivot Table.
The number of Japanese student enrolments in Australian HE has seen a sustained decline in both
absolute numbers and share over the last two decades. From a peak of 3828 students accounting for
2.15 per cent in 2003, Japanese student HE enrolments declined to a pre-COVID-19 pandemic low of
1496 in 2016, accounting for 0.49 per cent of all international HE enrolments (see Appendix 13). As a
result of these declining numbers, Japan’s ranking as a sending country has dropped from 11th in 2002
to 24th in 2019.76 A lack of English ability among Japanese students appears to be an obstacle to greater
participation in Australian HE institutions as well as international study more broadly. In the most
75 Department of Education, Skills and Employment, ‘Explanatory Notes for International Student Enrolment Data’, 1 April
2020, https://tinyurl.com/rfdjkjft. 76 Department of Education, Skills and Employment, ‘International Student Data 2019, Basic Pivot Table 2002 Onwards’,
accessed 26 October 2020, https://tinyurl.com/24wkc5zb.
0
2,000
4,000
6,000
8,000
10,000
12,000
14,000
16,000
18,000
2002 2003 2004 2005 2006 2007 2008 2009 2010 2011 2012 2013 2014 2015 2016 2017 2018 2019 2020
Higher Education Vocational Education and Training ELICOS Non-award
Australia-Japan Research Centre 29
recent EF English Proficiency Index, Japan ranked 55 out of 100 countries putting it in the ‘low
proficiency’ band.77
The number of Japanese student enrolments at Australian VET institutions has by comparison
remained relatively more stable over the last two decades. In terms of absolute numbers, a first peak
occurred in 2004 with 4543 student enrolments. Numbers then declined to a low of 3006 in 2011 before
recovering again to a second peak of 4648 in 2018. Japan’s share of total international student
enrolments in Australian VET institutions, however, has declined from nearly 10 per cent in 2004 to
around 2 per cent between 2008 to 2019 (see Appendix 14). As a result, Japan’s ranking dropped from
3rd in 2002 to 16th in 2019.78 These larger numbers compared with HE seem to reflect the lower
English level threshold for entry. The drop in Japan’s share reflects the large overall growth in numbers
from other countries, such as India, Nepal, China and Brazil.
ELICOS programs are the most popular tertiary qualification for Japanese students to pursue. Between
2002 and 2020 there were over 127,000 Japanese ELICOS enrolments, averaging almost 6700
enrolments per year. Absolute numbers peaked in 2003 with 9271 enrolments, dropped to a low of
4759 enrolments in 2011, and recovered to a second peak of 7969 enrolments in 2017. Japan’s share of
ELICOS enrolments reached over 14 per cent in the early 2000s, after which it dropped to a low of 3.73
per cent in 2009. It plateaued at around 4–5 per cent between 2010–2020 (see Appendix 15). Japan’s
rank dropped from 2nd in 2002 to 5th in 2019.79 This reflects a significant growth in the overall number
of ELICOS students, especially from China, Colombia, Brazil, Thailand and India.
4.6 Australian Students in Japanese Tertiary Education By comparison there are relatively few Australian students enrolled in Japanese tertiary education
institutions. International student numbers in Japan are calculated by MEXT prior to 2003 and by the
Japan Student Services Organization (JASSO) after 2003 based on student visas across all tertiary
sectors.80 There have not been more than 150 Australian enrolled in a tertiary degree or award program
in Japan since 2001. University exchange programs, which are defined as study for one year or less,
have been a relatively more popular option for Australian students. Over the past two decades there
have been at least 200 Australian university exchange students in Japan most years, with a low of 125
students in 2011 and a high of 285 students in 2017 and 2018. Australia’s share of international students
enrolled in tertiary programs in Japan (including both degree students and exchange students) has
never been large, ranging from a high of 0.43 per cent in 2001 to a low of 0.17 in 2011 (see Figure 21).
Nevertheless, opportunities for Australian university students to study in Japan are increasing. More
Japanese universities are offering programs in English, such as forerunners Ritsumeikan Asia Pacific
University and Waseda University. Further, Australia and Japan are starting to establish dual degree
programs. Among these are the Australian National University and Ritsumeikan University dual degree
77 Education First, ‘EF English Proficiency Index 2020’, 2020, 6, https://www.ef.com/wwen/epi/. 78 Department of Education, Skills and Employment, ‘International Student Data 2019, Basic Pivot Table 2002 Onwards’. 79 Department of Education, Skills and Employment. 80 JASSO, ‘2019(令和元)年度外国人留学生在籍状況調査結果 [2019 Foreign Student Enrolments Survey Results]’, 2020,
https://www.studyinjapan.go.jp/ja/statistics/zaiseki/data/2019.html.

Australia-Japan Research Centre 30
program at the undergraduate level and the dual Master of Public Policy degree program between the
Australian National University and Tokyo University’s Graduate School of Public Policy. 81
Figure 21: Number of Australian Students Enrolled in Japanese Tertiary Institutions
Source: Japan Student Services Organization, 外国人留学生在籍状況調査 [Survey on the Situation of Foreign Student Enrolments]
(2001-2019).
4.7 Working holiday arrangements After the signing of the NARA Treaty in 1976, Australia and Japan concluded a reciprocal working
holiday agreement that commenced in 1980. This was Japan’s first of its 26 working holiday
agreements.82 For Australia it was the fourth of its 45 working holiday arrangements and the first with
a non-Western and non-English speaking country.83
Japan has been a relatively popular working holiday destination for Australian youths behind English-
speaking destinations such as the United Kingdom and Canada. Based on data from Japan Ministry of
Foreign Affairs (MOFA), over the last 13 years more than 12,000 Australians were issued working
holiday visas to Japan.84 During this time, Australia’s share of total working holiday maker visas issued
81 The Australian National University, ‘ANU and Ritsumeikan Forge Ahead with Innovative New Program’, 11 December
2018, https://asiapacific.anu.edu.au/news-events/all-stories/anu-and-ritsumeikan-forge-ahead-innovative-new-program.
The Australian National University, ‘ANU Signs Double Degree Agreement in Public Policy with University of Tokyo’, 29
March 2017, https://asiapacific.anu.edu.au/news-events/all-stories/anu-signs-double-degree-agreement-public-policy-
university-tokyo. 82 Ministry of Foreign Affairs, ‘ワーキング・ホリデー制度 [Japan’s Working Holiday System]’, 18 June 2020,
https://www.mofa.go.jp/mofaj/toko/visa/working_h.html. 83 Department of Home Affairs, ‘Working Holiday Maker Visa Program Report’, 30 June 2019, 6,
https://www.homeaffairs.gov.au/research-and-stats/files/working-holiday-report-jun-19.pdf. 84 MOFA, ‘ビザ(査証)発給統計 [Visa Issuance Statistics]’, E-Stat Japan, accessed 15 September 2020, https://www.e-
stat.go.jp/stat-search/files?page=1&toukei=00300500&result_page=1.
0.0%
0.1%
0.2%
0.3%
0.4%
0.5%
0.6%
0
50
100
150
200
250
300
2001
2002
2003
2004
2005
2006
2007
2008
2009
2010
2011
2012
20
13
2014
20
15
2016
2017
2018
2019
Degree/Program Enrolments
Study Abroad exchange students (1 year or less)
Total share (per cent)

Australia-Japan Research Centre 31
by Japan fell from a high of 14 per cent in 2007 to a low of 5 per cent in 2011 in the wake of the 3/11
Fukushima nuclear disaster. The largest year in terms of absolute numbers was 2019 with over 1600
Australians receiving Japanese working holiday visas, which comprised 9 per cent of total working
holiday maker visas issued by Japan that year (see Figure 22). This ranks Australia third behind South
Korea and Taiwan (see Appendix 16).
Figure 22: Working Holiday Visas Issued to Australian Citizens by Japan (2007–2019)
Source: Ministry of Foreign Affairs, e-Stat Japan, ビザ(査証)発給統計 [Visa Issuance Statistics] (2007–2019).
There is a dearth of research about the motivations of Australian working holiday makers. However,
casual observations suggest that Australians are attracted to Japan for its cultural opportunities, its stable
political environment and its high standard of living and technology. At the same time, the popularity
of skiing and snowboarding in Japan among Australian youths seems to be a big drawcard and a cheaper
alternative than Europe or North America. The large Australian presence in Japanese snow towns such
as Niseko further offers seasonal working holiday job opportunities for non-Japanese speakers.85
Australia is the most well established and popular destination for Japanese working holiday makers.
Analysis by the Japanese national broadcaster NHK shows that out of 24,000 Japanese working holiday
makers in 2017, almost half (over 11,000) visited Australia.86 Statistics from the Department of Home
Affairs show that between 2006 and 2019 an average of over 10,000 working holiday visas were issued
to Japanese citizens per year by the Australian government (visa subclass 417) (see Figure 23). In 2019,
Japan ranked sixth among all working holiday maker visas issued by Australia (behind the United
Kingdom, France, South Korea, Germany and Taiwan) (see Appendix 17).87
Australia’s popularity among Japanese working holiday makers is shaped by a number of push and pull
factors. Push factors include improving English language abilities, gaining travel experience, earning
85 Junko Hirabayashi, ‘G’day Niseko! Australian Skiers Flock to Japan’, Reuters, 13 June 2008,
https://www.reuters.com/article/us-japan-australia-niseko-idUSSP27388620080613. 86 NHK, ‘遊びながら働くはずが… [You Should Work While You Play, But...]’, NHK News, 31 January 2020,
https://www3.nhk.or.jp/news/html/20200131/k10012266791000.html. 87 Department of Home Affairs, ‘Working Holiday Maker Visas Granted Pivot Table’, 30 July 2020,
https://data.gov.au/data/dataset/visa-working-holiday-maker.
0%
2%
4%
6%
8%
10%
12%
14%
16%
0
200
400
600
800
1000
1200
1400
1600
2007 2008 2009 2010 2011 2012 2013 2014 2015 2016 2017 2018 2019
Visas Per cent

Australia-Japan Research Centre 32
money and escaping from routine. Pull factors that make Australia an attractive destination include a
stable working holiday visa arrangement, its status as an English speaking country, a positive perception
of Australia and job opportunities.88
Figure 23: Working Holiday Visas Issued to Japanese Citizens by Australia (2006–2020)
Source: Department of Home Affairs, Australian Government Data, Working Holiday Maker Visas Granted Pivot Table.
A key trend among Japanese working holiday makers to Australia is the imbalanced gender ratio (see
Figure 24). The proportion of female working holiday makers is almost double the number of males.
One may speculate that contributing factors underlying this trend might include Japan’s dual-track
labour market that disproportionately steers women into non-regular work and a workplace culture
that favours males for job promotions.89 However, further research is needed to determine possible
linkages with women’s working conditions in Japan.
Figure 24: Working Holiday Visas Issued by Australia to Japanese Citizens by Gender 2006–2019
Source: Department of Home Affairs, Australian Government Data, Working Holiday Maker Visas Granted Pivot Table.
88 Hayato Nagai, Pierre Benckendorff, and Aaron Tkaczynski, ‘Exploring the Motivations of Asian Working Holiday Makers
Travelling to Australia’, Wakayama University Association for Tourism Studies 18 (2018): 43–53. 89 Emma Dalton, ‘Is Womenomics Improving Japanese Working Women’s Lives?’, East Asia Forum Quarterly 10, no. 3 (28
September 2018): 30–31.
0%
1%
2%
3%
4%
5%
6%
7%
8%
9%
10%
-
2,000
4,000
6,000
8,000
10,000
12,000
14,000
2006
2007
2008
20
09
2010
2011
2012
20
13
2014
2015
2016
20
17
2018
2019
2020
Visas Per cent
0
1000
2000
3000
4000
5000
6000
7000
8000
9000
2006 2007 2008 2009 2010 2011 2012 2013 2014 2015 2016 2017 2018 2019 2020
Male Female

Australia-Japan Research Centre 33
4.8 Tourism Between Australia and Japan Historically, the number of Japanese tourists visiting Australia has outstripped the number of
Australian tourists visiting Japan, as might be expected given the population difference between the
two countries. The number of Japanese overseas travellers grew rapidly during the 1980s and 1990s.90
The number of Japanese tourists visiting Australia peaked at over 814,000 in 1997.91 However, since
2015, the trend has reversed, with Australian visitors to Japan now growing rapidly.
In the 2000s, Japanese short-term visitors to Australia declined from a peak of over 700,000 in 2003 to
just over 350,000 in 2009. Between 2010–2015, Japanese visitors to Australia plateaued between
330,000 and 400,000. Subsequently, from 2015 numbers started to grow again, reaching over 498,000
in 2019 (see Figure 25). 92 Japan’s share of total short-term visitors to Australia over the last decade
peaked at 6.75 per cent in 2010 and dropped to a low of 4.57 per cent in 2015. Since 2016 Japan has
maintained its share of around 5 per cent, keeping pace as the total visitors from all countries to
Australia grew from nearly 6.9 million in 2015 to 8.7 million in 2019 (see Figure 26).
Figure 25: Tourist Flows Between Australia and Japan (2003–2020)
Source: Japan National Tourism Organization, ‘国籍/月別 訪日外客数(2003年~2021年)’; Australian Bureau of Statistics, ‘Overseas
Arrivals and Departures, Australia, Table 5: Short-Term Movement, Visitors Arriving - Selected Countries of Residence:
Original.
The number of Australian tourists to Japan gradually rose during the 2000s from 172,000 in 2003 to
over 242,000 in 2008. Numbers dropped in 2011, the year of the 3/11 Fukushima nuclear disaster, to
162,000. Since then, there has been a rapid growth in Australian tourists visiting Japan, reaching a high
90 Japan National Tourism Organization, ‘年別 訪日外客数、出国日本人数の推移 (1964年‐2019年) [Change in the Number of Foreign
Visitors to Japan and the Number of Japanese Overseas Travellers by Year (1964-2019)]’, accessed 2 March 2021,
https://www.jnto.go.jp/jpn/statistics/visitor_trends/index.html. 91 Angus Grigg, ‘Japanese Tourists Are Back and Growing More Quickly than Chinese Arrivals’, Australian Financial
Review, 18 April 2017, sec. tourism, https://www.afr.com/companies/tourism/japanese-tourists-are-back-and-growing-
more-quickly-than-chinese-arrivals-20170418-gvmuya. 92 Australian Bureau of Statistics, ‘Overseas Arrivals and Departures, Australia, Table 5: Short-Term Movement, Visitors
Arriving - Selected Countries of Residence: Original’, 17 February 2021, https://www.abs.gov.au/statistics/industry/tourism-
and-transport/overseas-arrivals-and-departures-australia/latest-release.
-
100,000
200,000
300,000
400,000
500,000
600,000
700,000
800,000
2003
2004
2005
20
06
2007
2008
2009
2010
2011
2012
2013
2014
2015
2016
2017
2018
2019
2020
Australians visiting Japan Japanese visiting Australia

Australia-Japan Research Centre 34
of over 620,000 in 2019 (see Figure 25). 93 This rapid growth corresponds with a successful campaign by
the Japanese government to proactively increase tourism. The tourism boom that followed saw a high
of over 31 million tourists from all countries visit Japan in 2019. 94 Australia’s share of the total number
of overseas tourists visiting Japan peaked in 2003 at 3.3 per cent. Despite the rapid growth of Australian
tourists visiting Japan since 2013, Australia’s total share has remained below 2 per cent since 2015 in
light of the overall rapid growth of Japan’s tourist industry (see Figure 27).
Figure 26: Overseas Visitor Arrivals in Australia and Japan's Share
Source: Tourism Research Australia, International Visitor Survey Results 1: Trends Country Purpose Year Ending December
2019.
Figure 27: Total Overseas Visitor Arrivals in Japan and Australia's Share
Source: JTB Tourism Research & Consulting Co., Japan-bound Statistics.
93 Japan National Tourism Organization, ‘国籍/月別 訪日外客数(2003年~2021年) [Monthly Foreign Visitor Numbers to Japan by
Country (2003-2021)]’, accessed 2 March 2021, https://www.jnto.go.jp/jpn/statistics/since2003_visitor_arrivals.pdf. 94 Yoko Konishi, ‘Making the Most of Japan’s Tourism Boom’, East Asia Forum (blog), 25 June 2016,
https://www.eastasiaforum.org/2016/06/25/making-the-most-of-japans-tourism-boom/.
0%
1%
2%
3%
4%
5%
6%
7%
8%
9%
0
1
2
3
4
5
6
7
8
9
2009 2010 2011 2012 2013 2014 2015 2016 2017 2018 2019
Mill
ions
Total Visitors (all countries) Japan's share (per cent)
0.0%
0.5%
1.0%
1.5%
2.0%
2.5%
3.0%
3.5%
0
5
10
15
20
25
30
35
1990
1991
1992
1993
1994
1995
1996
1997
1998
1999
2000
2001
2002
2003
20
04
2005
2006
2007
2008
2009
2010
2011
2012
20
13
2014
2015
2016
2017
2018
2019
Mill
ions
Visitors to Japan (all countries) Australia's share (per cent)

Australia-Japan Research Centre 35
5. The Whaling Dispute
While Australia and Japan have forged strong people-to-people links, developed a strong and
complementary economic relationship and increasingly deepened and institutionalised strategic and
diplomatic cooperation, this does not mean that there have not been misunderstandings or
disagreements between the two countries. The biggest post-war disagreement, perhaps, has been
Japan’s whaling program. Friction over this issue dates back to the start of Japanese whaling operations
in the Antarctic in 1934, but Australia’s objections have evolved over the decades.
After Japan began whaling in the Antarctic, Australia’s sought to safeguard its territorial claim in
Antarctica, which had been transferred to it by the United Kingdom in 1933. Establishing Antarctic
whaling operations was seen as one of the few things Australia could practically do to protect its claim.
However, Australia never established an Antarctic whaling program out of concern that it would not
be commercially viable when other nations were exhausting whale stocks, and Japan was especially
singled out for blame.95
Australia also sought to protect its position as an active coastal whaling nation, until it abandoned
commercial whaling in 1978. This meant protecting Antarctic whale stocks that made their migratory
journey north past the Australian coastline. As such, Australia was an active participant in the 1931
Geneva Convention for Regulation of Whaling and the 1937 International Agreement for the
Regulation of Whaling, precursors to the current International Convention for the Regulation of
Whaling (ICRW) adopted in 1946.96
Japanese Antarctic whaling was also seen as a national security concern until after the end of the Second
World War. There were concerns that Japan would establish its own whaling base in the Antarctic.97
Australia and the United Kingdom successfully petitioned the United States to have Japan renounce ‘all
claim to any right or title to or interest in connection with any part of the Antarctic area’ under the
1951 San Francisco Peace Treaty.98
The nature of the whaling dispute shifted in the post-war era due to two key developments. First, after
Supreme Commander of the Allied Powers General Douglas MacArthur permitted Japan to restart
Antarctic whaling during the occupation period (1945–1952), whale meat consumption was
transformed from a localised practice into a dish that was eaten nationwide. Consumption peaked in
the 1960s, especially in school lunches.99 Second, environmental NGOs successfully proselytised their
message globally that whaling is unethical—both due to the threat of extinction and the fact whales
95 Shirley V. Scott and Lucia Meilin Oriana, ‘The History of Australian Legal Opposition to Japanese Antarctic Whaling’,
Australian Journal of International Affairs 73, no. 5 (2019): 469–70. 96 Scott and Oriana, 471–72. 97 ‘Japanese Whalers’, Sydney Morning Herald, 15 March 1937. 98 Shirley V. Scott, ‘Japan’s Renunciation of Territorial Rights in Antarctica and Australian Diplomacy’, Polar Record 35, no.
193 (1999): 99–106, https://doi.org/10.1017/S0032247400026449. 99 Jakobina Arch, ‘Whale Meat in Early Postwar Japan: Natural Resources and Food Culture’, Environmental History 21, no.
3 (2016): 468.

Australia-Japan Research Centre 36
are intelligent mammals—and the International Whaling Commission (IWC) adopted a moratorium
on commercial whaling in 1982.100
Subsequently, Japan used the scientific research provision (Article 8) in the ICRW as a loophole to
continue to catch hundreds of whales per year, while disputing the scientific basis of the moratorium.101
Bureaucrats from the Fisheries Agency who control Japan’s whaling policy are reticent to give it up as
it would likely lead to a decline in their political power. 102 Meanwhile, pro-whaling nationalist
politicians from Japan’s ruling Liberal Democratic Party and the Japanese Whaling Association have
framed the issue in terms of ‘sovereignty and national pride’.103
Pro-whaling Japanese nationalists portray themselves as ‘the victim of neo-colonial acts of foreign states,
who prevent it from following its cultural traditions’.104 At the same time, they willfully ignore the fact
that whale was not widely consumed in Japan prior to the Second World War and that European
countries such as Norway and Iceland engage in whaling.105 The ‘hard shaming’ tactics employed by
the Sea Shepherd Conservation Society, including ‘tracking down and attacking Japanese whaling
vessels by water-jetting, butyric acid attacks and shooting signal rockets at the fishermen’, seem to have
played into the hands of Japan’s pro-whaling nationalists and reinforced their narrative among the
Japanese public.106
Over the decades, Australian diplomats have sought to persuade Japan to cease whaling in the Southern
Ocean. In May 2010, after having failed to affect any change, Australia decided to initiate proceedings
at the International Court of Justice (ICJ) in The Hague with a legal strategy supported by research
from the International Fund for Animal Welfare (IFAW).107 In 2014, the ICJ found in Australia’s favour,
judging that Japan’s research output was not commensurate with the number of whales killed and
ordered Japan to end its Southern Ocean whaling program.108 Yet Australia’s victory was somewhat
short lived as Japan revised its research program to sidestep the ruling and resumed whaling in 2015.
In 2018, Japan announced its intention to withdraw from the IWC arguing that the institution no
longer upheld its original purpose to enable sustainable whaling. This enabled Japan to recommence
commercial whaling in its exclusive economic zone, to reduce subsidies to the whaling industry and to
avoid repairing its long-range Antarctic whaling vessel, which was estimated to cost about 10 billion
100 Michal Kolmaš, ‘International Pressure and Japanese Withdrawal from the International Whaling Commission: When
Shaming Fails’, Australian Journal of International Affairs 75, no. 2 (4 August 2020): 6,
https://doi.org/10.1080/10357718.2020.1799936. 101 ‘Conservation & Management - Total Catches’, International Whaling Commission, accessed 26 January 2021,
https://iwc.int/total-catches. 102 Keiko Hirata, ‘Why Japan Supports Whaling’, Journal of International Wildlife Law & Policy 8, no. 2–3 (2005): 145–46. 103 Kolmaš, ‘International Pressure and Japanese Withdrawal from the International Whaling Commission’, 8. 104 Kolmaš, 9. 105 Arne Kalland, ‘The Anti-Whaling Campaigns and Japanese Responses’, The Institute of Cetacean Research, 1998,
http://luna.pos.to/whale/icr_camp_kalland.html. 106 Kolmaš, ‘International Pressure and Japanese Withdrawal from the International Whaling Commission’, 10. 107 Donald R. Rothwell, ‘The Whaling Case: An Australian Perspective’, ed. Malgosia Fitzmaurice and Dai Tamada, Whaling
in the Antarctic: The Significance and the Implications of the ICJ Judgment, 1 January 2016, 276. 108 ‘Whaling in the Antarctic (Australia v Japan: New Zealand Intervening)’, § International Court of Justice (2014),
https://www.icj-cij.org/public/files/case-related/148/148-20140331-JUD-01-00-EN.pdf.

Australia-Japan Research Centre 37
yen (US$91.3 million).109 Despite appearances, the Japanese withdrawal from the IWC may actually
end up being a face-saving win-win for Japan, Australia and the international community. Less whales
are likely to be killed under this program and for the first time ever there will be no whaling conducted
in the Southern Ocean Whale Sanctuary.110
109 Akane Otsuku, ‘Why Japan Risked Condemnation to Restart Commercial Whaling’, Nikkei Asian Review, 19 February
2019, https://asia.nikkei.com/Spotlight/Asia-Insight/Why-Japan-risked-condemnation-to-restart-commercial-whaling. 110 Elizabeth Matsangou, ‘The Devil and the Deep Blue Sea – Japanese Whaling Brings Surprising Conservation Benefits’,
World Finance, 14 October 2019, https://tinyurl.com/y62ygdcz.

Australia-Japan Research Centre 38
6. Australia–Japan Diplomatic and Security Cooperation
Australia and Japan have significantly deepened their security cooperation throughout the post-Cold
War era. The two countries are considered the northern and southern anchors of the US-led network
of bilateral alliances in the Asia Pacific region, known as the San Francisco System or the hub-and-
spokes system.111 Since the end of the Cold War, Australia and Japan have deepened and
institutionalised their security cooperation. This cooperation is rooted in the shared objectives to
persuade the United States to stay engaged in the region, to increase burden sharing both with the
United States through the deepening of spoke-to-spoke security cooperation and to maintain shared
regional stability and prosperity under an inclusive and liberal regional order. Australia–Japan
security cooperation is arguably the most successful example of spoke-to-spoke cooperation in the
region and the two countries are considered each other’s most important security partner after their
respective alliances with the United States. Australia and Japan have also increasingly deepened
trilateral and quadrilateral security cooperation with the United States and India.
6. 1 Political Engagement The high level of Australia–Japan political engagement is underscored by the number of prime
ministerial summits held between the two countries. Beginning with prime minister Robert
Menzies’s visit to Japan in April 1957, there have been 42 prime ministerial summits held between
the two countries. This includes 28 visits by Australian prime ministers to Japan, 13 visits by Japanese
prime ministers to Australia, and one virtual summit held between Scott Morrison and Shinzo Abe in
July 2020 during the COVID-19 pandemic (see Appendix 18). Notably, prime minister Julia Gillard
was the first world leader to visit Japan in the wake of the Great East Japan Earthquake that triggered
the 3/11 triple disaster in 2011. In 2020, Prime Minister Scott Morrison was the first world leader to
hold a summit with Prime Minister Yoshihide Suga after he succeeded Shinzo Abe, despite the
obstacles to travel due to COVID-19 which required Morrison to quarantine at the Lodge for two
weeks upon his return to Australia.
Table 4: List of Diplomatic Missions Between Australia and Japan
City Diplomatic Service Est. Until City Diplomatic Service Est. Until
Tokyo Embassy 1952 present Canberra Embassy 1953 present
Osaka Consulate General 1965 present Sydney Consulate General 1954 present
Sendai Consulate 1992 2007 Melbourne Consulate General ---- present
Nagoya Consulate 1992 2009 Perth Consulate General 1966 present
Sapporo Consulate 1992 2019 Brisbane Consulate 1966 1972
Fukuoka Consulate 1992 2000 Brisbane Consulate General 1972 present
Fukuoka Consulate General 2000 2019 Cairns Consulate 1997 present
111 Thomas S. Wilkins, ‘From Strategic Partnership to Strategic Alliance?: Australia-Japan Security Ties and the Asia-Pacific’,
Asia Policy, no. 20 (2015): 100.

Australia-Japan Research Centre 39
6.2 Bilateral Security Cooperation Australia–Japan security cooperation has gradually deepened throughout the post-Cold War era. In
1992, Japan passed the International Peace Cooperation Act.112 It enabled the Japan Self-Defense Forces
(SDF) to be dispatched overseas for the first time and to participate in United Nations (UN)
peacekeeping operations (PKOs) in certain forms within the framework of the Article 9 ‘peace clause’
of Japan’s post-war constitution.113 This development saw the Australian Defence Force (ADF) and the
SDF work together for the first time under the banner of UN PKOs. Notably this included SDF troops
serving under Australian command during the 1992–1993 United Nations Transitional Authority in
Cambodia (UNTAC). The ADF and SDF also worked closely together during the 2002–2005 United
Nations Mission of Support to East Timor (UNMISET) where Australia and Japan were the largest
providers of troops.114 During the Iraq War, Australian troops provided protection for the SDF during
its 2004–2006 humanitarian assistance mission in Samawah.115
The two countries have institutionalised their cooperation through a number of declarations and
agreements as well as the regularisation of high-level meetings. A major step forward was the
conclusion in 2007 of the Joint Declaration on Security Cooperation (JDSC). The JDSC deepened
cooperation across a range of areas including law enforcement, border security, counter-terrorism,
disarmament, non-proliferation of weapons of mass destruction, maritime and aviation security,
humanitarian and disaster relief operations, and exchange of strategic assessments. It also helped to
strengthen practical cooperation between the ADF and the SDF including through the exchange of
personnel and joint exercises and training.116
A further outcome of the JDSC was the establishment of regular 2+2 Foreign and Defence Ministers
Meetings. Australia–Japan 2+2 meetings have been held eight times since 2007. The 2+2 meetings have
covered a wide range of issues including deepening Australia–Japan bilateral security cooperation,
mutual cooperation trilaterally with the United States, quadrilateral cooperation with the United States
and India, strategy on the Free and Open Indo-Pacific (FOIP), engagement with ASEAN countries, and
the situations in the South China Sea and in North Korea.117
In 2010, Australia–Japan concluded the Acquisition and Cross-Servicing Agreement (ACSA). The
ACSA provides a framework for the ADF and the SDF to engage in ‘the reciprocal provision of supplies
and services for such activities as: exercises and training, UN Peace Keeping Operations, humanitarian
112 The full official English name is the ‘Act on Cooperation with United Nations Peacekeeping Operations and Other
Operations’. 113 Akiho Shibata, ‘Japanese Peacekeeping Legislation and Recent Developments in U.N. Operations’, Yale Journal of
International Law 19, no. 2 (1994): 325, https://digitalcommons.law.yale.edu/yjil/vol19/iss2/2. 114 Yoichiro Sato, ‘Japan-Australia Security Cooperation: Jointly Cultivating the Trust of the Community’, Asian Affairs 35,
no. 3 (2008): 161–62. 115 Gerard Henderson, ‘Labor Tested by Japan’s Iraq Resolve’, The Sydney Morning Herald, 1 March 2005,
https://www.smh.com.au/opinion/labor-tested-by-japans-iraq-resolve-20050301-gdktwk.html. 116 MOFA, ‘Japan-Australia Joint Declaration on Security Cooperation’, 7 March 2007, https://www.mofa.go.jp/region/asia-
paci/australia/joint0703.html. 117 ‘Eighth Japan-Australia Foreign and Defence Ministerial Consultations’, Ministry of Foreign Affairs of Japan, 18 October
2018, https://www.mofa.go.jp/a_o/ocn/au/page3e_000949.html.

Australia-Japan Research Centre 40
relief operations, operations to cope with large scale disasters, transportation of nationals and others in
overseas exigencies, or other routine activities’.118 This was Japan’s second such agreement after its
ACSA with the United States signed in 1996.
In the wake of the Great East Japan Earthquake triple disaster on 11 March 2011, the ADF and the SDF
deepened their cooperation through Operation Pacific Assist. The Royal Australian Air Force
dispatched three C-17 Globemaster aircraft to assist the SDF with transportation from Okinawa to
Fukushima for the disaster response. This included the transport of over 450 tonnes of vehicles, people
and supplies as well as a remotely operated water cannon system that was used as part of the
containment operations after the meltdown at the Fukushima Daiichi Nuclear Power Plant.119
In May 2012, the two countries concluded an Information Security Agreement (ISA). The ISA provides
a strengthened legal framework for the exchange of classified information between Australia and
Japan.120 The ISA grew out of the JDSC, stipulating the ‘exchange of strategic assessments and related
information’ and the 2+2 meeting, which in 2008 called for the establishment of an ISA.121
In September 2012, Australia and Japan concluded the Common Vision and Objectives (Vision
Statement) at the fourth 2+2 meeting. The Vision Statement declares Australia and Japan to be ‘natural
strategic partners’ and envisions a ‘new phase of Japan-Australia defence cooperation’ with a focus on
‘how the two countries can cooperate in shaping the future of the Asia-Pacific region’.122 This vision
identified cooperation objectives across a wide range of areas, including building positive relations with
China to support its ‘constructive participation in the international rules-based order’, multilateral
cooperation for ‘long-term peace and stability on the Korean Peninsula’, strengthening the East Asia
Summit ‘to promote cooperation on political, security, economic and other challenges facing the region’,
and ‘strengthening joint efforts in support of sustainable development in the Pacific’.123
In July 2014, Australia and Japan concluded the Agreement Concerning the Transfer of Defence
Equipment and Technology. This agreement provides a legal framework for ‘Japan and Australia to
participate in the joint research, development, and production of defence equipment and technology,
and for the handling of defence equipment and technology to be transferred between Japan and
Australia’.124 Notably, this agreement came just months after the Japanese government replaced its 1967
118 ‘The Signing of the Japan-Australia Acquisition and Cross-Servicing Agreement’, Ministry of Foreign Affairs of Japan, 19
May 2010, https://www.mofa.go.jp/announce/announce/2010/5/0519_02.html. 119 Department of Defence, ‘Operation Pacific Assist’, 25 March 2011,
https://web.archive.org/web/20140211223933/http:/www.defence.gov.au/op/pacificassist/index.htm. 120 ‘Signing of the Japan-Australia Information Security Agreement’, Ministry of Foreign Affairs of Japan, 17 May 2012,
https://www.mofa.go.jp/announce/announce/2012/5/0517_01.html. 121 Yusuke Ishihara, ‘Japan-Australia Defence Cooperation in the Asia- Pacific Region’, in Beyond the Hub and Spokes:
Australia-Japan Security Cooperation, ed. William T. Tow and Tomonori Yoshizaki (Tokyo: NIDS, 2014), 102. 122 Ishihara, 104. 123 ‘Australia and Japan - Cooperating for peace and stability: Common Vision and Objectives’, Ministry of Foreign Affairs of
Japan, 14 September 2012, https://www.mofa.go.jp/files/000034392.pdf. 124 ‘Signing of the Agreement between the Government of Japan and the Government of Australia Concerning the Transfer
of Defence Equipment and Technology’, Ministry of Foreign Affairs of Japan, 8 July 2014,
https://www.mofa.go.jp/press/release/press4e_000349.html.

Australia-Japan Research Centre 41
Three Principles on Arms Exports (that effectively banned arms exports) with the Three Principles on
Transfer of Defense Equipment and Technology, as the Abe government sought to promote the export
of Japanese arms and military equipment.125
On the back of the defence technology transfer agreement, Australia and Japan upgraded their security
cooperation to the level of ‘Special Strategic Partnership’. The joint statement accompanying the
announcement emphasised the comprehensive nature of the relationship. According to the statement,
the relationship encompasses economic relations, security and defence cooperation, cooperation on
regional and international issues, and cultural and people-to-people exchanges. Further, the statement
emphasised a new level of political commitment with Australian prime minister Tony Abbott and
Japanese prime minister Shinzo Abe confirming that the two countries’ leaders ‘would meet annually,
alternately in Australia and Japan, to take forward the special relationship’.126
In November 2020, Australian Prime Minister Scott Morrison went to Tokyo where he announced
with Japanese Prime Minister Yoshihide Suga an ‘in-principle’ agreement on a Reciprocal Access
Agreement (RAA). The RAA is intended to streamline the process for stationing ADF troops in Japan
and SDF troops in Australia, and to ‘facilitate joint military exercises and disaster relief and to bolster
interoperability’.127 While it is expected that a deal will be signed in 2021, a key sticking point regarding
the potential application of the death penalty for ADF personnel is yet to be resolved.128
It worth noting that in many cases the conclusion of security-related agreements with Australia were
often ground-breaking firsts for Japan outside of its alliance with the United States and opened the way
for agreements with other security partners. For instance, after the Australia–Japan JDSC in 2007, Japan
established similar security declarations with India (2008), Canada (2010) and the United Kingdom
(2017). After the Australia–Japan 2+2 in 2007, Japan established 2+2 frameworks with France (2014),
the United Kingdom (2015), Indonesia (2015) and India (2019). The Australia–Japan ACSA in 2010 was
followed by similar deals with the United Kingdom (2017) and Canada (2018).
6.3 The Australia-Japan submarine saga A hiccup in Australia–Japan security cooperation came in 2016 because of decisions made about
Australia’s Future Submarine Program (SEA1000). Australia awarded French firm DCNS the contract
to build its next generation of submarines ahead of Japanese and German bids. Japan was left
disappointed after believing it was the frontrunner for the contract.
125 Purnendra Jain, ‘Japanese Arms for Sale’, East Asia Forum, 15 February 2017,
https://www.eastasiaforum.org/2017/02/16/japanese-arms-for-sale/. 126 ‘Prime Minister Abbott and Prime Minister Abe Joint Statement: Special Strategic Partnership for the 21st Century
Japan’, Ministry of Foreign Affairs of Japan, 8 July 2014, https://www.mofa.go.jp/files/000044543.pdf. 127 Ben Ascione, ‘Australia-Japan Pact Is about US’, Australian Financial Review, 22 November 2020,
https://www.afr.com/world/asia/australia-japan-pact-is-about-us-20201122-p56gta. 128 Donald Rothwell, ‘Legal Hurdles Remain in the Australia–Japan Reciprocal Access Agreement’, East Asia Forum, 30
November 2020, https://www.eastasiaforum.org/2020/12/01/legal-hurdles-remain-in-the-australia-japan-reciprocal-access-
agreement/.

Australia-Japan Research Centre 42
Expectations of an Australia–Japan submarine deal were built on a personal relationship between prime
minister Tony Abbott and prime minister Shinzo Abe. Abe’s desire to deepen cooperation with
Australia was part of his broader project to loosen the post-war restraints on Japanese security policy.129
Abbott was keen to strengthen US–Japan–Australia trilateral security cooperation on the
recommendations of his former national security advisor Andrew Shearer. 130 As such, both men
overpromised what they could deliver.
There was never a broad consensus in Australia about the relational aspect of the deal—entrenched by
its ‘40-year lifespan and ongoing service requirements’—to deepen US–Japan–Australia security
cooperation.131 A number of Australian commentators argued that the expectation that Australia align
itself strategically with Japan and the United States against a rising China was too big a constraint on
Australian independence and flexibility. Ultimately, it posed the risk of Australia having to either
automatically commit to support Japan in a possible future conflict against China or jeopardise Japanese
support in the upkeep of its submarines.132
The question of where to build the submarines became a political issue. Abe wanted to have the
submarines built in Japan to headline his efforts to position Japan as a new major player on the global
arms export stage. However, Japan’s defence companies, Mitsubishi Heavy Industries (MHI) and
Kawasaki Shipbuilding Corp (KSC), only have capacity to supply Japan’s Maritime Self-Defense Forces
and appeared less interested in the project than the Abe government.133 Before Abbott consulted his
cabinet about the necessity of a competitive tender process, he supported Abe’s plan. This is despite the
fact that in 2013 as leader of the Liberal party, Abbott supported a bipartisan consensus with the
opposition Labour government under Julia Gillard that Australian submarines would be built
domestically to create jobs in Adelaide.134 A number of politicians from his party in South Australia
were relying on the submarines being built there to shore up votes.135
After Abbott was ousted by Malcolm Turnbull in 2015, concerns came to the fore about Japan’s
inexperience in the arms export business and the lack of enthusiasm about the deal in Japan. Japan had
only recently revised its arms export law in 2014 and this was to be its first international deal on arms
and defence technology. Moreover, the Australian Department of Defence was reportedly concerned
that Abe’s enthusiasm about the deal was not shared by bureaucrats in Japan’s Ministry of Defense who
129 EAF Editorial Board, ‘Australia’s Fraught Decision on Submarines’, East Asia Forum (blog), 18 April 2016,
https://www.eastasiaforum.org/2016/04/18/australias-fraught-decision-on-submarines/. 130 Andrew Shearer, ‘Australia-Japan-U.S. Maritime Cooperation: Creating Federated Capabilities for the Asia Pacific’ (CSIS,
2016), 37, https://csis-website-prod.s3.amazonaws.com/s3fs-
public/publication/160401_Shearer_AustJapanUSMaritime_Web.pdf. 131 EAF Editorial Board, ‘Australia’s Fraught Decision on Submarines’. 132 Hugh White, ‘If We Strike a Deal with Japan, We’re Buying More than Submarines’, The Age, 14 March 2016,
www.theage.com.au/opinion/if-we-strike-a-deal-with-japan-were-buying-more-than-submarines-20160314-gni3hl.html. 133 Franz-Stefan Gady, ‘Why Japan Lost Aussie Sub Bid’, The Japan Times, 29 April 2016,
https://www.japantimes.co.jp/opinion/2016/04/29/commentary/japan-commentary/japan-lost-aussie-sub-bid/. 134 Graeme Dobell, ‘The Tacit Consensus for the White Paper’, The Strategist, 6 May 2013,
https://www.aspistrategist.org.au/the-tacit-consensus-for-the-white-paper/. 135 Graeme Dobell, ‘Tony Abbott and a Japanese Sub’, The Strategist, 24 May 2015, https://www.aspistrategist.org.au/tony-
abbott-and-a-japanese-sub/.

Australia-Japan Research Centre 43
were hesitant ‘about the transfer of sensitive submarine technology—the crown jewels of Japan’s naval
force’.136
6.4 Trilateral and Quadrilateral Cooperation with the United States
and India
One of the key underpinnings of Australia–Japan security cooperation is their mutual alliances with
the United States. As a result, trilateral US–Australia–Japan security cooperation has emerged as a key
objective for the three countries. At the same time, quadrilateral security cooperation with the
United States and India has also been developed gradually. However, the form and objectives of this
cooperation are contested and ill-defined.137
The origins of US–Australia–Japan trilateral security cooperation can be traced to the US–Japan Joint
Security Declaration and the Sydney Statement, which concluded in 1996. As argued by Satake, these
statements served to redefine the US–Japan and US–Australia alliances away ‘from a traditional
bilateral defense arrangement to one that focussed on addressing regional and global security
problems’. As such, ‘Tokyo and Canberra came to play a more explicit role in responding to both
regional and global contingencies such as terrorism, regional conflicts, and the proliferation of
weapons of mass destruction’.138
Subsequently, the three countries established a trilateral dialogue in 2002. At first the trilateral
dialogue met at the vice-ministerial level. It was then upgraded with the establishment of the
Trilateral Strategic Dialogue (TSD) in 2006 at the foreign minister level. Part of the motivation for
Australia and Japan was to keep the United States engaged in the Asia Pacific region through
increased burden sharing at a time when the United States was showing an increased focus on the
Middle East after the 9/11 terrorist attacks.139 The TSD also enabled the United States to promote
greater interoperability between Japan and Australia.140
Quadrilaterally, security cooperation between Australia, Japan, India and the United States emerged
in the wake of the 2004 Indian Ocean tsunami. This included the establishment of the ‘Tsunami Core
Group’ to ‘facilitate coordination of relief activities’.141 While this was only intended to serve the
immediate aftermath of the tsunami, it took on a broader scope after it was promoted further by
136 Jesse Johnson and Reiji Yoshida, ‘Australian Politics, Japan’s Lack of Experience behind Failed Bid to Build Subs’, The
Japan Times, 26 April 2016, www.japantimes.co.jp/news/2016/04/26/national/japan-loses-bid-build-australian-subs-french-
firm/. 137 H. D. P. Envall, ‘The Quadrilateral Security Dialogue: Towards An Indo-Pacific Order?’, RSIS Policy Report, 2019, 2,
https://www.rsis.edu.sg/rsis-publication/idss/the-quadrilateral-security-dialogue-towards-an-indo-pacific-order/. 138 Tomohiko Satake, ‘The Origin of Trilateralism? The US–Japan–Australia Security Relations in the 1990s’, International
Relations of the Asia-Pacific 11, no. 1 (2011): 2, https://doi.org/10.1093/irap/lcq020. 139 Tomohiko Satake and John Hemmings, ‘Japan–Australia Security Cooperation in the Bilateral and Multilateral Contexts’,
International Affairs 94, no. 4 (1 July 2018): 824, https://doi.org/10.1093/ia/iiy028. 140 Satake and Hemmings, 825. 141 Envall, ‘The Quadrilateral Security Dialogue: Towards An Indo-Pacific Order?’, 3.

Australia-Japan Research Centre 44
Japanese prime minister Shinzo Abe and foreign minister Taro Aso.142 It also found support in the
United States from vice president Dick Cheyney.143
In 2007, the four countries established the Quadrilateral Security Dialogue (Quad). The leaders of the
four countries met for the first Quad meeting in May 2007 on the sidelines of the ASEAN Regional
Forum in Manila. The four countries also held a number of joint military exercises. However,
disagreement over whether the Quad would unnecessarily aggravate China to the detriment of
regional stability saw former prime minister Kevin Rudd withdraw Australia from the grouping in
2008. The Quad thus lay dormant until it was resurrected in 2017.
The Quad appears to be hobbled by its unclear purpose. As argued by H. D. P. Envall, it must
overcome two key challenges if it is to be viable into the future. First, ‘it is unclear whether the four
powers will be able to maximise opportunities for cooperation while ensuring that wider geopolitical
rivalries do not again overwhelm the grouping’. Second, ‘given that it has been revived to support
th[e] ‘Indo-Pacific’ order, the [Quad] is constrained by the vagueness of the Indo-Pacific concept and
the absence of Indonesia’.144
6.5 Regional Institution Building Australia and Japan have played an instrumental role in establishing regional institutions to promote
shared regional stability and prosperity and deepen multilateral regional security cooperation. The
inclusivity of regionalism in the Asia Pacific is a shared concern of both Australia and Japan. For Japan,
multilateral forums provide a neutral venue to forge cooperation with regional neighbours with whom
questions of Japan’s legacy in the Second World War are still unresolved. For Australia, multilateral
forums have helped it forge a cooperative relationship with a region where it had long been perceived
as an outsider and the European colonial outpost.
In 1989, Australia and Japan cooperated to establish the Asia-Pacific Economic Cooperation (APEC).
This was the first forum where the heads of state from Asia Pacific countries could regularly meet.
Moreover, APEC has played a critical role in promoting free trade in the Asia Pacific. This is a critical
shared interest for Australia and Japan given their reliance on free trade for economic security.145
Australia and Japan also cooperated in promoting ASEAN centrality through ASEAN-led forums.
Australia–Japan cooperation contributed to the establishment of the ASEAN Regional Forum (ARF).
Japan played a critical role in championing the expansion of the ASEAN+3 forum into ASEAN+6, which
included Australia, New Zealand and India. This was the precursor to the East Asia Summit, which
now includes the United States and Russia as the seventh and eighth ASEAN partners. At the same
142 Taro Aso, ‘Arc of Freedom and Prosperity: Japan’s Expanding Diplomatic Horizons’, Ministry of Foreign Affairs of Japan,
30 November 2006, https://www.mofa.go.jp/announce/fm/aso/speech0611.html. 143 Brendan Nicholson, ‘China Warns Canberra on Security Pact’, The Age, 15 June 2007,
https://www.theage.com.au/national/china-warns-canberra-on-security-pact-20070615-ge54v5.html. 144 Envall, ‘The Quadrilateral Security Dialogue: Towards An Indo-Pacific Order?’, 1. 145 Takashi Terada, The Genesis of APEC: Australian-Japan Political Initiatives (Australia-Japan Research Centre, 1999),
https://crawford.anu.edu.au/pdf/pep/pep-298.pdf.

Australia-Japan Research Centre 45
time, Australia and Japan have worked closely to coordinate their cooperation in the ASEAN Defense
Ministers’ Meeting Plus (ADMM+).146
146 Brendan Taylor, ‘A Pragmatic Partner: Australia and the ADMM-Plus’, Asia Policy, no. 22 (July 2016): 83–88.
Australia-Japan Research Centre 46
7. Selected Bibliography of Australia-Japan Relations
7.1 Economic Diplomacy and Regionalism
Armstrong, Shiro. 2016. ‘Priorities in Australia’s Regional Economic Diplomacy’. In Agenda for
Change 2016, edited by Malcolm Davis, 49–54. Australian Strategic Policy Institute.
https://www.jstor.org/stable/resrep04227.12.
Crawford, John, and Saburo Okita, eds. 1979. Australia and Japan: Issues in the Economic
Relationship. Canberra: Australia-Japan Economic Relations Research Project.
De Brouwer, Gordon, and Tony Warren. 2001. Strengthening Australia-Japan Economic Relations.
Canberra: Department of Foreign Affairs and Trade.
Dee, Moreen. 2006. Friendship and Co-Operation: The 1976 Basic Treaty between Australia and
Japan. Australia in the World: The Foreign Affairs and Trade Files, no. 3. Canberra: Department of
Foreign Affairs and Trade. https://www.dfat.gov.au/sites/default/files/basic-treaty-between-australia-
and-japan.pdf.
Drysdale, Peter, ed. 1989. The Australia-Japan Relationship: Towards the Year 2000. Canberra:
Australia-Japan Research Centre.
Drysdale, Peter, and Roger Farrell. 1999. Perspectives on Japanese Investment, Employment and
Management in Australia. Pacific Economic Papers, no. 290. Canberra: Australia-Japan Research
Centre. https://crawford.anu.edu.au/pdf/pep/pep-290.pdf.
Ito, Go. 2010. Beyond ‘Asian Values’: Rationales for Australian-Japan Cooperation in Asian
Regionalism. Asia Pacific Economic Papers, no. 389. Canberra: Australia-Japan Research Centre.
https://crawford.anu.edu.au/pdf/pep/apep-389.pdf.
Pokarier, Christopher. 2009. ‘An Interest in Japan: The Political Economy of Australia‑Japan
Investment Linkages’. Presented at the Asia-Pacific Economic and Business History Conference,
February 18.
Rix, Alan. 1986. Coming to Terms: The Politics of Australia’s Trade with Japan, 1945-57. Allen &
Unwin.
———. 1992. The 1971-72 Senate Hearings on Japan, Sir John Crawford’s Evidence on the Australia-
Japan Relationship. Pacific Economic Papers, no. 212. Canberra: Australia-Japan Research Centre.
———. 1999. The Australia-Japan Political Alignment: 1952 to the Present. London: Routledge.
Terada, Takashi. 1999. The Genesis of APEC: Australian-Japan Political Initiatives. Australia-Japan
Research Centre. https://crawford.anu.edu.au/pdf/pep/pep-298.pdf.

Australia-Japan Research Centre 47
Walton, David. 2012. Australia, Japan and Southeast Asia: Early Post-War Initiatives in Regional
Diplomacy. UK edition. New York: Nova Science Pub Inc.
Woodard, Gary. 1989. The Australia-Japan Treaty of Friendship and Co-Operation: An Australian
Perspective. Pacific Economic Papers, no. 172. Canberra, Australia: Research School of Pacific
Studies, Australian National University.
7.2 History and Culture
Chapman, David, and Carol Hayes, eds. 2020. Japan in Australia: Culture, Context and Connections.
London: Routledge.
Clarke, Hugh V. 1965. Break-out! The Japanese POW Break-Out at Cowra, 1944. Melbourne:
Horwitz.
Clarke, Hugh V., and Takeo Yamashita. 1966. To Sydney by Stealth – Midget Subs Attack Sydney,
1942. Melbourne: Horwitz.
Frei, Henry. 1984. ‘Japan Discovers Australia. The Emergence of Australia in the Japanese World-
View, 1540s-1900’. Monumenta Nipponica 39 (1): 55–81. https://doi.org/10.2307/2384480.
Hamano, Takeshi. 2019. Marriage Migrants of Japanese Women in Australia. Springer.
Japan Club of Australia. 1998. Japanese in Australia – Japanese Footprints over a Century. Nikkei
Australia. https://tinyurl.com/y58txsek.
Miles, Melissa, and Robin Gerster. 2018. Pacific Exposures: Photography and the Australia–Japan
Relationship. ANU Press. http://doi.org/10.22459/PE.2018.
Nagata, Yuriko. 1996. Unwanted Aliens: Japanese Internment in Australia. St Lucia: University of
Queensland Press.
Sissons, David. 2016. Bridging Australia And Japan: Volume 1. Edited by Arthur Stockwin and Keiko
Tamura. Canberra: ANU Press. http://doi.org/10.22459/BAJ.12.2016.
———. 2020. Bridging Australia and Japan: Volume 2. Edited by Keiko Tamura and Arthur
Stockwin. ANU Press. https://doi.org/10.22459/BAJ.2020.
Tamura, Keiko, and Desmond Ball. 2013. Breaking Japanese Diplomatic Codes. ANU Press.
https://doi.org/10.22459/BJDC.09.2013.
Wurth, Bob. 2006. Saving Australia: Curtin’s Secret Peace with Japan. South Melbourne: Lothian
Books.

Australia-Japan Research Centre 48
7.3 International Relations, Security and Diplomacy
Ishihara, Yusuke. 2014. ‘Japan-Australia Defence Cooperation in the Asia-Pacific Region’. In Beyond
the Hub and Spokes: Australia-Japan Security Cooperation, edited by William T. Tow and Tomonori
Yoshizaki, 93–122. Tokyo: National Institute for Defense Studies.
———. 2016. ‘Australia: The Challenges of the Japan-Australia Quasi-Alliance’. In East Asian
Strategic Review 2016, 177–206. Tokyo: National Institute for Defense Studies.
http://www.nids.mod.go.jp/english/publication/east-asian/pdf/2016/east-asian_e2016_06.pdf.
———. 2018. ‘The Japanese Perspective on the Security Partnership with Australia’. In Japan’s New
Security Partnerships, edited by Wilhelm Vosse and Paul Midford. Manchester University Press.
Satake, Tomohiko. 2011. ‘The Origin of Trilateralism? The US–Japan–Australia Security Relations in
the 1990s’. International Relations of the Asia-Pacific 11 (1): 87–114.
https://doi.org/10.1093/irap/lcq020.
———. 2016. ‘The Japan-Australia Contribution to a Liberal and Inclusive Regional Order: Beyond
the “China Gap”’. Australian Journal of International Affairs 70 (1): 24–36.
https://doi.org/10.1080/10357718.2015.1077501.
Satake, Tomohiko, and John Hemmings. 2018. ‘Japan–Australia Security Cooperation in the Bilateral
and Multilateral Contexts’. International Affairs 94 (4): 815–34. https://doi.org/10.1093/ia/iiy028.
Tatsumi, Yuki, ed. 2015. US-Japan-Australia Security Cooperation: Prospects And Challenges.
Stimson Center. https://www.stimson.org/wp-content/files/file-attachments/US-Japan_Australia-
WEB.pdf.
Tow, W., and R. Kersten, eds. 2012. Bilateral Perspectives on Regional Security: Australia, Japan and
the Asia-Pacific Region. Critical Studies of the Asia-Pacific. Palgrave Macmillan UK.
https://doi.org/10.1057/9781137271204.
Wilkins, Thomas S. 2020. ‘Japan’s “Special” Strategic Partnership with Australia : “Decentering”
Underwrites “Recentering”’. In New Directions in Japan’s Security, edited by Paul Midford and
Wilhelm Vosse, 67–85. London: Routledge. https://doi.org/10.4324/9781003007623-7.

Australia-Japan Research Centre 49
Appendices
Appendix 1: Number of Japanese High School Students Participating in Overseas Study Trips
Source: Ministry of Education, Culture, Sports, Science and Technology, ‘平成 29年度高等学校等における国際交流等の状況について [The Condition of High School International Student Exchanges 2019]’, pp. 3-4.
Appendix 2: Number of Japanese High School Students Participating in Overseas Study Trips to
Australia
Source: Ministry of Education, Culture, Sports, Science and Technology, ‘平成 29年度高等学校等における国際交流等の状況について [The Condition of High School International Student Exchanges 2019]’, pp. 3-4.
0
2,000
4,000
6,000
8,000
10,000
12,000
14,000
16,000
1992 1994 1996 1998 2000 2002 2004 2006 2008 2011 2013 2015 2017
NZ UK Canada USA Australia Other
0.0%
6.0%
12.0%
18.0%
24.0%
30.0%
36.0%
0
2,000
4,000
6,000
8,000
10,000
12,000
1992 1994 1996 1998 2000 2002 2004 2006 2008 2011 2013 2015 2017
Number of Japanese students Per cent

Australia-Japan Research Centre 50
Appendix 3: Number of High School Students Participating in Overseas Study Trips to Japan
Source: Ministry of Education, Culture, Sports, Science and Technology, ‘平成 29年度高等学校等における国際交流等の状況について [The Condition of High School International Student Exchanges 2019]’, p. 7.
Appendix 4: Number of Australian High School Students Participating in Overseas Study Trips to Japan
Source: Ministry of Education, Culture, Sports, Science and Technology, ‘平成 29年度高等学校等における国際交流等の状況について [The Condition of High School International Student Exchanges 2019]’, p. 7.
0
200
400
600
800
1,000
1,200
1,400
1,600
1,800
1996 1998 2000 2002 2004 2006 2008 2011 2013 2015 2017
Australia USA S. Korea Taiwan China Other
0.0%
5.0%
10.0%
15.0%
20.0%
25.0%
30.0%
35.0%
40.0%
0
200
400
600
800
1,000
1,200
1,400
1,600
1,800
1996 1998 2000 2002 2004 2006 2008 2011 2013 2015 2017
Australian Students Per cent (total)

Australia-Japan Research Centre 51
Appendix 5: Number of Japanese High School Students Participating in Overseas Student Exchanges
Source: Ministry of Education, Culture, Sports, Science and Technology, ‘平成 29年度高等学校等における国際交流等の状況について [The Condition of High School International Student Exchanges 2019]’, pp. 4-5.
Appendix 6: Number of Japanese High School Students on Overseas Exchanges to Australia
Source: Ministry of Education, Culture, Sports, Science and Technology, ‘平成 29年度高等学校等における国際交流等の状況について [The Condition of High School International Student Exchanges 2019]’, pp. 4-5.
0
500
1,000
1,500
2,000
2,500
3,000
1992 1994 1996 1998 2000 2002 2004 2006 2008 2011 2013 2015 2017
USA Canada NZ Australia Other
0%
2%
4%
6%
8%
10%
12%
14%
16%
18%
0
100
200
300
400
500
600
700
800
1992 1994 1996 1998 2000 2002 2004 2006 2008 2011 2013 2015 2017
Number of Japanese students Per cent

Australia-Japan Research Centre 52
Appendix 7: Number of Australian Students on Overseas Exchanges at Japanese High Schools
Source: Ministry of Education, Culture, Sports, Science and Technology, ‘平成 29年度高等学校等における国際交流等の状況について [The Condition of High School International Student Exchanges 2019]’, p. 8.
Appendix 8: Number of International Students Hosted by Japanese High Schools on Student Exchanges
Source: Ministry of Education, Culture, Sports, Science and Technology, ‘平成 29年度高等学校等における国際交流等の状況について [The Condition of High School International Student Exchanges 2019]’, p. 8.
0.0%
5.0%
10.0%
15.0%
20.0%
25.0%
30.0%
35.0%
40.0%
0
50
100
150
200
250
300
350
400
1992 1994 1996 1998 2000 2002 2004 2006 2008 2011 2013 2015 2017
Australian students Per cent
0
200
400
600
800
1000
1200
1992 1994 1996 1998 2000 2002 2004 2006 2008 2011 2013 2015 2017
China Thailand USA S.Korea Germany Australia Other

Australia-Japan Research Centre 53
Appendix 9: Number of Japanese Students Participating in Overseas School Excursions
Source: Ministry of Education, Culture, Sports, Science and Technology, ‘平成 29年度高等学校等における国際交流等の状況について [The Condition of High School International Student Exchanges 2019]’, p. 6.
Appendix 10: Number of Japanese Students Participating in School Excursions to Australia
Source: Ministry of Education, Culture, Sports, Science and Technology, ‘平成 29年度高等学校等における国際交流等の状況について [The Condition of High School International Student Exchanges 2019]’, p. 6.
0
20,000
40,000
60,000
80,000
100,000
1992 1994 1996 1998 2000 2002 2004 2006 2008 2011 2013 2015 2017
Taiwan USA Singapore Australia Malaysia Other
0.0%
6.0%
12.0%
18.0%
24.0%
0
5,000
10,000
15,000
20,000
25,000
30,000
35,000
40,000
1992 1994 1996 1998 2000 2002 2004 2006 2008 2011 2013 2015 2017
Number of Japanese students Per cent

Australia-Japan Research Centre 54
Appendix 11: Number of International Students Participating in School Excursions to Japan Hosted by
a Japanese High School
Source: Ministry of Education, Culture, Sports, Science and Technology, ‘平成 29年度高等学校等における国際交流等の状況について [The Condition of High School International Student Exchanges 2019]’, p. 9.
Appendix 12: Number of Australian Students Participating in School Excursions to Japan Hosted by a
Japanese High School
Source: Ministry of Education, Culture, Sports, Science and Technology, ‘平成 29年度高等学校等における国際交流等の状況について [The Condition of High School International Student Exchanges 2019]’, p. 9.
0
2,000
4,000
6,000
8,000
10,000
12,000
14,000
16,000
2004 2006 2008 2011 2013 2015 2017
Taiwan S.Korea China USA Australia Other
0.0%
2.0%
4.0%
6.0%
8.0%
10.0%
12.0%
14.0%
0
500
1,000
1,500
2,000
2,500
3,000
3,500
4,000
2004 2006 2008 2011 2013 2015 2017
Australian students Per cent

Australia-Japan Research Centre 55
Appendix 13: Japanese Student Enrolments at Australian Higher Education Institutions
Source: Department of Education, Skills and Employment, International Education Group, International student data (2002-
2020).
Appendix 14: Japanese Student Enrolments at Australian Vocational Education and Training
Institutions
Source: Department of Education, Skills and Employment, International Education Group, International student data (2002-
2020).
0.0%
0.5%
1.0%
1.5%
2.0%
0
500
1,000
1,500
2,000
2,500
3,000
3,500
4,000
4,500
2002
2003
2004
2005
2006
2007
2008
20
09
2010
20
11
2012
20
13
2014
2015
2016
2017
2018
2019
2020
No. of Japanese Student HE Enrolments Percent of Total International HE Enrolments
0%
1%
2%
3%
4%
5%
6%
7%
8%
9%
10%
0
500
1,000
1,500
2,000
2,500
3,000
3,500
4,000
4,500
5,000
2002
2003
20
04
2005
2006
2007
2008
2009
2010
2011
2012
2013
2014
2015
2016
2017
20
18
2019
2020
No. of Japanese Student VET Enrolments Percent of Total International VET Enrolments

Australia-Japan Research Centre 56
Appendix 15: Japanese Student Enrolments in ELICOS Programs
Source: Department of Education, Skills and Employment, International Education Group, International student data (2002-
2020).
Appendix 16: Working Holiday Makers to Japan by Nationality
Source: Ministry of Foreign Affairs, e-Stat Japan, ビザ(査証)発給統計 [Visa Issuance Statistics] (2007-2019).
0.0%
1.5%
3.0%
4.5%
6.0%
7.5%
9.0%
10.5%
12.0%
13.5%
15.0%
0
1,000
2,000
3,000
4,000
5,000
6,000
7,000
8,000
9,000
10,000
20
02
20
03
20
04
20
05
20
06
20
07
20
08
20
09
20
10
20
11
20
12
20
13
20
14
20
15
20
16
20
17
20
18
20
19
20
20
No. of Japanese Student ELICOS Enrolments Percent of Total ELICOS Enrolments
0
2000
4000
6000
8000
10000
12000
14000
16000
18000
20000
2007 2008 2009 2010 2011 2012 2013 2014 2015 2016 2017 2018 2019
South Korea Taiwan (China) Australia
France United Kingdom Germany
Canada Hong Kong (China) Other

Australia-Japan Research Centre 57
Appendix 17: Working Holiday Visas (subclass 417 & 462) Issued by Australia
Source: Department of Home Affairs, Australian Government Data, Working Holiday Maker Visas Granted Pivot Table.
0
50,000
100,000
150,000
200,000
250,000
2006 2007 2008 2009 2010 2011 2012 2013 2014 2015 2016 2017 2018 2019
United Kingdom France South Korea Germany Taiwan
Japan Ireland Italy Canada United States
Netherlands PRC Other

Australia-Japan Research Centre 58
Appendix 18: List of Australia-Japan Prime Ministerial Summits
No Date Australian PM Japanese PM Location Source
1 Apr-1957 Robert Menzies Nobusuke Kishi Tokyo NAA: A463, 1956/1760 PART 1
2 Nov-1957 Robert Menzies Nobusuke Kishi Canberra NAA: A1533, 1957/3000
3 Sep-1963 Robert Menzies Hayato Ikeda Canberra, Sydney, Melbourne NAA: A1209, 1963/6541 PART
A
4 Oct-1967 Harold Holt Eisaku Sato Canberra, Sydney, Melbourne NAA: A4311, 677/2
5 May-1970 John Gorton Eisaku Sato Tokyo, Osaka NAA: AA1980/735, 197
6 Oct-1973 Gough Whitlam Kakuei Tanaka Tokyo NAA: M4472, Album 14
7 Oct-1974 Gough Whitlam Kakuei Tanaka Canberra, Sydney, Perth NAA: AA1980/735, 64
8 Jun-1976 Malclom Fraser Takeo Miki Tokyo NAA: AA1980/735, 215
9 Apr-1978 Malclom Fraser Takeo Fukuda Tokyo NAA: M4805, 6
10 Jan-1980 Malclom Fraser Masayoshi Ohira Canberra, Melbourne NAA: A1209, 1979/1730
11 Jul-1980 Malclom Fraser Zenko Suzuki Tokyo (PM Ohira funeral) NAA: M1343, 35
12 May-1982 Malclom Fraser Zenko Suzuki Tokyo NAA: M1269, 34
13 Feb-1984 Bob Hawke Yasuhiro Nakasone Tokyo NAA: M3856, 11
14 Jan-1985 Bob Hawke Yasuhiro Nakasone Canberra, Sydney, Melbourne NAA: A1209, 1983/1090
15 May-1986 Bob Hawke Yasuhiro Nakasone Tokyo NAA: A1209, 1986/286 PART1
16 Dec-1987 Bob Hawke Noboru Takeshita Tokyo NAA: M3856, 78
17 Jul-1988 Bob Hawke Noboru Takeshita Brisbane, Sydney, Canberra NAA: A463, 1988/3183
18 Sep-1990 Bob Hawke Toshiki Kaifu Tokyo NAA: M3856, 141
19 Sep-1992 Paul Keating Kiichi Miyazawa Tokyo NAA: A8281, 232
20 Apr-1993 Paul Keating Kiichi Miyazawa Canberra NAA: A463, 1993/1704
21 Sep-1994 Paul Keating Tomiichi Murayama Tokyo NAA: A8746, KN12/9/94
22 Nov-1995 Paul Keating Tomiichi Murayama Osaka (APEC) NAA: A8746, KN7/6/95
23 Sep-1996 John Howard Ryutaro Hashimoto Tokyo NAA: A13966, 961146-961190
24 Apr-1997 John Howard Ryutaro Hashimoto Canberra NAA: A463, 1997/1060-1070
25 Jul-1999 John Howard Keizo Obuchi Tokyo, Osaka NAA: A13966, 990500-990536
26 Jun-2000 John Howard Yoshiro Mori Tokyo (PM Obuchi funeral) MOFA
27 Aug-2001 John Howard Junichiro Koizumi Tokyo MOFA
28 May-2002 John Howard Junichiro Koizumi Canberra, Sydney MOFA
29 Jul-2003 John Howard Junichiro Koizumi Tokyo MOFA
30 Mar-2007 John Howard Shinzo Abe Tokyo MOFA
31 Jun-2008 Kevin Rudd Yasuo Fukuda Tokyo MOFA
32 Dec-2009 Kevin Rudd Yukio Hatoyama Tokyo MOFA
33 Apr-2011 Julia Gillard Naoto Kan Tokyo MOFA
34 Apr-2014 Tony Abbott Shinzo Abe Tokyo NLA
35 Jul-2014 Tony Abbott Shinzo Abe Canberra NLA
36 Dec-2015 Malcolm Turnbull Shinzo Abe Tokyo NLA
37 Jan-2017 Malcolm Turnbull Shinzo Abe Sydney NLA
38 Jan-2018 Malcolm Turnbull Shinzo Abe Tokyo PM of Australia
39 Nov-2018 Scott Morrison Shinzo Abe Darwin PM of Australia
40 Jun-2019 Scott Morrison Shinzo Abe G20, Osaka PM of Australia
41 Jul-2020 Scott Morrison Shinzo Abe Virtual Summit PM of Australia
42 Nov-2020 Scott Morrison Yoshihide Suga Tokyo East Asia Forum