
AUSTRALIA General Enquiries 03 8647 4838 Facsimile 03 9650 ...
49
Telstra Corporation Limited ACN 051 775 556 ABN 33 051 775 556 12 November 2020 The Manager Market Announcements Office Australian Securities Exchange 4 th Floor, 20 Bridge Street SYDNEY NSW 2000 Office of the Company Secretary Level 41 242 Exhibition Street MELBOURNE VIC 3000 AUSTRALIA General Enquiries 03 8647 4838 Facsimile 03 9650 0989 [email protected] Investor Relations Tel: 1800 880 679 [email protected] ELECTRONIC LODGEMENT Dear Sir or Madam Telstra Investor Day 2020 In accordance with the Listing Rules, I attach the presentation including speeches to be delivered by the CEO, CFO and Brendon Riley - CEO InfraCo, at Telstra’s Investor Day today, for release to the market. The briefing will be held virtually and webcast from 9am (AEDT), which is available at https://www.telstra.com.au/aboutus/investors/financial-information/investor-presentations A transcript of the event will be lodged with the ASX when available. Authorised for lodgement by: Sue Laver Company Secretary
Transcript of AUSTRALIA General Enquiries 03 8647 4838 Facsimile 03 9650 ...

Telstra Corporation Limited
ACN 051 775 556 ABN 33 051 775 556
12 November 2020 The Manager Market Announcements Office Australian Securities Exchange 4th Floor, 20 Bridge Street SYDNEY NSW 2000
Office of the Company Secretary Level 41 242 Exhibition Street MELBOURNE VIC 3000 AUSTRALIA General Enquiries 03 8647 4838 Facsimile 03 9650 0989 [email protected] Investor Relations Tel: 1800 880 679 [email protected]
ELECTRONIC LODGEMENT Dear Sir or Madam Telstra Investor Day 2020 In accordance with the Listing Rules, I attach the presentation including speeches to be delivered by the CEO, CFO and Brendon Riley - CEO InfraCo, at Telstra’s Investor Day today, for release to the market. The briefing will be held virtually and webcast from 9am (AEDT), which is available at https://www.telstra.com.au/aboutus/investors/financial-information/investor-presentations A transcript of the event will be lodged with the ASX when available. Authorised for lodgement by:
Sue Laver Company Secretary

1
Investor Day12 November 2020
Agenda
9.00am Introduction Andrew Penn
5G Technology Nikos Katinakis & & Product Kim Krogh Anderson
C&SB Michael Ackland
Enterprise David Burns
10.20am Q&A followed by break
11.05am Maximising value Vicki Brady
for Telstra Group
Telstra InfraCo Brendon Riley
Financial update Vicki Brady
12.00pm Q&A
12.30pm Event concludes
Copyright Telstra© Investor Day - November 2020Page 2
1
2

2
Introduction
Andrew Penn CEO
Copyright Telstra© Investor Day - November 2020Page 4
T22 why it matters
• When we launched T22 we had reached a tipping point where we knew we had to act more boldly to transform Telstra
• T22 is positioning us for the accelerating digital economy reinforced by COVID-19
• Progress on T22 means we are exceptionally well placed to respond and now lead in this new environment
• We have made foundational changes to our digital systems and functions over the last 2-3 years
economy and the work we have done through T22 gives us a winning competitive advantage
3
4

3
T22 what we have delivered so far
Copyright Telstra© Investor Day - November 2020Page 5
We have an ambition to return Telstra to growth and deliver underlying EBITDA in range of $7.5-8.5 billion by FY23 and we are targeting ROIC of
approximately 8% by FY231
• We had delivered, or were on track to deliver, more than three quarters of our strategic objectives as at the end of FY20
• We have simplified. C&SB in market plans reduced to 20
• We have digitised. 71% of C&SB service transactions via digital channels as at FY20, up from 53% in FY19
• We are working differently. >10,000 employees in Agile teams
• Our 5G network is the best in the country. 5G will reach more than 50% of the Australian population by end December 2020 and 75% by end of FY21. Launched 5G fixed wireless for select customers
• We are working our assets more effectively. Telstra InfraCo operational
• We are more efficient. Productivity program had delivered $1.8 billion of savings between FY16 and FY20 on track to $2.5 billion by FY22
1. These measures are not guidance and have been provided to illustrate some of the outcomes which management is focused on delivering as part of its medium-term ambitions. Refer to Financial update
T22 what we need to deliverTelstra InfraCo
Copyright Telstra© Investor Day - November 2020Page 6
• Why is this important? Greater transparency of infrastructure assets, improve the efficiency of how we manage those assets, and provide optionality
• What are we doing? We are announcing proposed restructure to create three separate legal entities within the Telstra Group1
InfraCo Fixed will own and operate our passive or physical infrastructure assets: the ducts, fibre, data centres, subsea cables and exchanges
InfraCo Towers will own and operate our passive or physical mobile tower assets, which we will look to monetise over time
ServeCo focus on how we create innovative products and services, support customers and deliver the best possible customer experience
• What are the key drivers? Increasing value of infrastructure assets globally, the importance of the digital economy, and the dependence of the digital economy on telecommunications
1. Any restructure will involve certain regulatory and other requirements. There may be delays in implementing parts of the program, or they may not be implemented at all. No final decisions have been made. There will be an update in February 2021.
5
6

4
T22 what we need to deliverContinued
Copyright Telstra© Investor Day - November 2020Page 7
• Meet our customer experience objectives
• Complete our digitisation program
• Improved fixed product economics. Including targeting nbn reseller EBITDA margins by FY231,2
• Complete the transformation of our Enterprise business
• Complete the 5G rollout we are the clear market leader in 5G
• Complete our productivity program. Digitisation and migration will also set us up for productivity beyond T22
• Growth in our core and adjacencies
1. These measures are not guidance and have been provided to illustrate some of the outcomes which management is focused on delivering as part of its medium-term ambitions. Refer to Financial update
2. Includes small-business unified communications earnings
Copyright Telstra© Investor Day - November 2020Page 8
Getting the settings right and leveraging the benefits of the digital economy
• We need to continue to build momentum behind the digital economy
• The potential economic benefits are enormous - modelling from PwC shows that more businesses embracing digital tools could
add up to $90 billion to the Australian economy
create up to 250,000 new jobs by 2025
• It is critical that we have a clear and shared vision for the telecommunications industry that is technology agnostic, pro-investment and pro-innovation
• Our structural changes announced today support such a vision
7
8

5
5G Technology and Product
Nikos Katinakis - Group Executive, Networks & IT
Kim Krogh Andersen - Group Executive, Product & Technology
Overview
• 5G rollout well progressed
• Clear roadmap to underpin 5G leadership and monetisation
• Developed partnerships to accelerate delivery of 5G
• Already monetising 5G
• Well placed to capitalise on further 5G monetisation opportunities
Investor Day - November 2020Page 10 Copyright Telstra©
9
10

6
Copyright Telstra© Investor Day - November 2020Page 11
Our 5G network now reaches 44% of the Australian population expanding to 75% by June 2021
We now have 5G sites in selected areas of more than 60cities and regional towns around Australia
There are more than 1,650 suburbs with 50% or greater
coverage of Telstra 5G
We have more than 2,250 5G sites across the country
Our 5G now covers an area that more than 12 million Australians live, work or pass through on a daily basis
We brought forward $500 million of planned capital
spend from FY21 into calendar year 2020 to increase capacity in our network, including accelerating the 5G rollout
Australia led the 2020 GSMA Mobile Connectivity Index for the sixth year running
2020
Investor Day - November 2020Page 12
Roadmap to underpin 5G market leadership and monetisation
202320222019 2021
Initial 3.6 GHz 5G Devices
5G Devices supporting 2600MHz DSS (+other 4G bands)
Early mmWavedevices
300 630
TBC
26 GHz Sites
Scaled mmWave devices
Initial 850MHz 5G Devices
+ gradually enable DSS on other 4G bands as we modernise equipment and traffic shifts
3.6GHz Sites1
850 / 700 MHz2
2600 MHz Dynamic Spectrum Sharing (4G/5G)3
Equip. modernisation and gradual re-farm of spectrum until eventual 3G shutdown
+ densification of network with small cells to cater for growth and potential new services
1. Lead in 5G first to market by deploying 3.6GHz, greater contiguous coverage, and driving 5G adoption to leverage efficient capacity.
2. Differentiate 5G 850MHz and 700MHz to improve in-building coverage and accelerate 5G pop coverage.
3. Improve customer experience evolving the 4G bands to 5G with Dynamic Spectrum Sharing (DSS), allowing 4G capacity investment to be re-purposed for 5G.
4. Additional spectrum, such as mmWave, allowing us to: (a) meet organic capacity growth, (b) scaled new services.
26 GHz Auction
4mmWave trials
With Apparatus licenses supporting range of deployment and use case scenarios (e.g. device testing, stadium, CBD, etc.)
Devices
Core5G slicing enables a specific service level connection for a range of different applications
The 5G Core will also distribute with edge compute to enable low latency, resiliency, data sovereignty and efficiency use cases
Commercial mid band in USA driving more device options
Apple iPhone 12
Samsung S20 5G
Cloud Native Hybrid Core Standalone Core Network Slices
Google Pixel 5
5G Band Enablement
5G Wi-Fi Pro Cradlepoint 5G
26/28 GHz AWL apparatus license
26 GHz AWL apparatus license
Copyright Telstra©
11
12

7
Investor Day - November 2020Page 13
We founded the 5G Future Forum and are developing partnerships to accelerate the ecosystem
Cloud Service Providers
Technology Vendors
5GFF
+ others
Copyright Telstra©
Investor Day - November 2020Page 14
We can bring elevated value to edge compute enhanced solutions
Telstra Network
Security
Resiliency
Privacy / Data Sovereignty
People Power
Define products that align network security to enterprise security across Network
Telstra Closed Loop Network and Service Assurance, Predictive Fault (AI)
Automation & Correlation
Latency
Service Orchestration
Field Workforce across Australia
Telstra Network and Service Design facilities use case latency requirements across
Australia
Localised Telstra solutions as opposed to Cloud Service Provider Global Zones
Flattened Webscale Architecture Self-sufficient Microzones
Real Estate / Edge Locations Distributed Network aligned to key locations
Copyright Telstra©
13
14
8
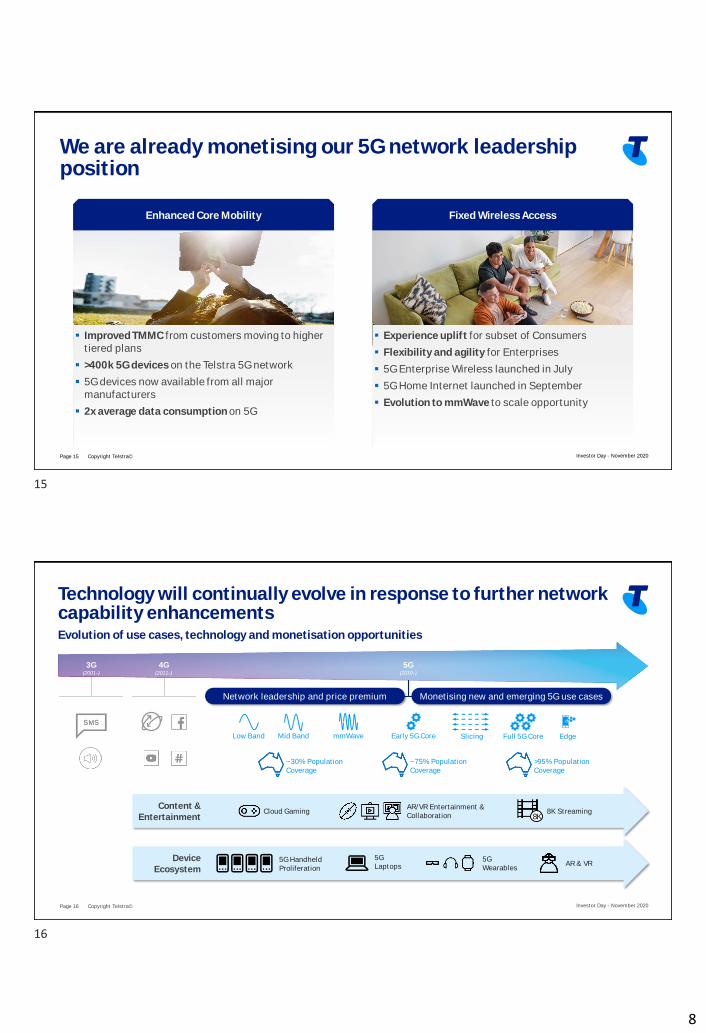
We are already monetising our 5G network leadership position
Enhanced Core Mobility Fixed Wireless Access
▪ Improved TMMC from customers moving to higher tiered plans
▪ >400k 5G devices on the Telstra 5G network
▪ 5G devices now available from all major manufacturers
▪ 2x average data consumption on 5G
▪ Experience uplift for subset of Consumers
▪ Flexibility and agility for Enterprises
▪ 5G Enterprise Wireless launched in July
▪ 5G Home Internet launched in September
▪ Evolution to mmWave to scale opportunity
Investor Day - November 2020Copyright Telstra©Page 15
Evolution of use cases, technology and monetisation opportunities
Technology will continually evolve in response to further network capability enhancements
3G(2001-)
4G(2011-)
5G(2019-)
Low Band Mid Band mmWave Early 5G Core Full 5G Core Edge
~30% Population Coverage
~75% Population Coverage
>95% Population Coverage
Network leadership and price premium Monetising new and emerging 5G use cases
Content &Entertainment
Device Ecosystem
Cloud GamingAR/VR Entertainment & Collaboration
8K Streaming8K
5G Handheld Proliferation
5GLaptops AR & VR
Slicing
5GWearables
Investor Day - November 2020Page 16 Copyright Telstra©
15
16

9
Investor Day - November 2020Page 17
The key technologies powering Industry 4.0
De
livere
d b
y
Industry focus
Powerful partnerships
Professional & Managed Services
Programmable Infrastructure
X-as-a-Service Business Models
Skills transformation
Copyright Telstra©
Consumer & Small Business
Michael Ackland Group Executive, Telstra Consumer & Small Business
17
18

10
Investor Day - November 2020
The Consumer and Small Business segments continue to evolve rapidly
nbn migration effectively complete FY21. Next wave of NBN investment of $4.5B
Structural shifts in the industry, altering competitive dynamics
5G reaching scale with new opportunities for growth through exciting launches of devices
Optimism around restoring value in mobiles
Customer behaviour has shifted quickly and at scale over the course of the pandemic
Page 19 Copyright Telstra©
Investor Day - November 2020
We are driving growth in the Consumer and Small Business segments through five value levers
Delivering value from the mobiles business through a return to ARPU growth in H2 FY21
Improving fixed economics through nbn trading levers and cost management across both nbn and legacy
Strong growth in new products and categories including media, gaming, SMB business services
Realising the commercial potential of Telstra Plus through redemption activity and partnerships
Delivering a step-change in customer experience with migration onto the new technology stack
Page 20 Copyright Telstra©
19
20

11
5G network leadership
Investor Day - November 2020
We have laid strong foundations for growth in mobiles
New network use cases
New & exciting device ecosystem
Broad segment reach through multi-brand
Simplified plans
Growth in mobiles
Key enablers
Premium sustained with +$2 TMMC in FY20; targeting a further uplift of +$2 TMMC by 1H FY21 (PCP basis)
Strong iPhone pre-orders with 72% of mix on top three plans
On-track for mobiles ARPU growth in 2H FY21 - further growth into FY22
Page 21 Copyright Telstra©
Smart Modem
Investor Day - November 2020
We are focused on delivering a step change in fixed product economics
New & exciting network add-ons
Improvements to Wi-Fi
Improving fixed economics1
Key enablers
Targeting nbn reseller EBTIDA margins by FY23 2
Triple the no. of customers on high speed tiers (to 15% mix)
Simplified cost structure with all nbn activations through new digital stack in FY22 (cease sale in legacy)
Accelerate on-net solutions
Uplifted Customer Experience
Contain diseconomies of scale in legacy
1. These measures are not guidance and have been provided to illustrate some of the outcomes which management is focused on delivering as part of its medium-term ambitions. Refer to Financial update
2. Includes small-business unified communications earnings
Page 22 Copyright Telstra©
21
22

12
Investor Day - November 2020
We are enabling our customers to thrive in new categories
▪ X-box partnerships with Microsoft
▪ 30k customers already on a gaming subscription
▪ Kayo▪ Binge▪ Live Sports▪ Telstra TV
▪ Within the first 5 months
trialists on Binge
▪ Launched on Sept 2020 (below-the-line)
▪ Providing fast speeds for a targeted group of customers
▪ Cyber security ▪ IT Support▪ Digital Marketing
▪ 17k SMB customers using our business services
▪ Parental Control
▪ Parental controls in MyTelstra app launched
▪ Cyber security product launching in 2021
Gaming Media Fixed Wireless Business Services Security
We will continue expanding our whole of customer proposition into new categories over FY21-22
Page 23 Copyright Telstra©
Investor Day - November 2020
We see strong commercial potential with Telstra Plus
Earn Points Redeem Points Enjoy Benefits
Strong engagement with customers An exciting new sales channel
▪ 2.5 million enrolled members
▪ +20pt strategic NPS difference vs non members
▪ Industry leading open & click-through rates
▪ New opportunities with partners to give customers more ways to earn points
▪ Redemptions growing at 32% QoQ
▪ Multiple ways to pay including pts plus repayment plan options for hardware and accessories
▪ Redemption on post-paid and prepaid services to drive uptake of the 2nd/3rd household SIMs
▪ Expansion of redemption options to drive uptake of add-ons to our core service offers
Page 24 Copyright Telstra©
23
24

13
Foundations largely complete for migrations onto the new digital stack. FY21 will be a pivotal year of transition
eNPS increased +9pts from Q4 FY18 to Q3 FY20 eNPS increasing by +3-6 pts annuallyCovid impacts
Simplified plans and customer priming
New CRM and digital interfaces
Launched T22 in June 2018
Reduced call volumes by 15m from FY18 to FY20
Launched simplified plansFrom 1800 to 20 core plans
Prepared customer base for migrations4.7m customers now have a Telstra ID; 1.9m on direct debit
Improved digital journeys Digital sales mix to 33%; digital service to 73% in Oct FY21
Launched MyTelstra App4.4 million customers already active
Launched new CRM to agents20k agents enabled on Console
Products, provisioning and customer migrations to the new stack
PPHH on the new stack Oct FY21
Commence Pre-paid migrations Nov FY21
Fixed on the new stack June FY21
Migration complete FY22Migrating 750k services/mth
Migrated 69m records From Siebel to Salesforce
C&SB Episode NPS:
FY19 FY20 FY21 FY22
Legacy cease salesMobiles FY21, Fixed FY22
Investor Day - November 2020Page 25 Copyright Telstra©
A simplified world for customers
is already well underway
Full migration to new tech stack
A transformed sales & service experience
Investor Day - November 2020
▪ Higher rates of digital conversion
▪ Reduced provisioning times (from 40 to 10 mins)
▪ Halve fault calls with proactive trouble shooting
▪ NPS upside
▪ Onshore support with 100% calls answered locally
▪ Rich digital experiences enhanced by Messaging
Customer reset already underway
▪ Significant increase in transactions via My Telstra
▪ Digital service interactions at 73%; digital sales mix at 33% (Oct FY21)
▪ Rapid launch of Messaging from 5% to 55% of interactions
Page 26 Copyright Telstra©
25
26

14
Investor Day - November 2020
▪ Well positioned as 5G reaches scale and nbn migration is completed
▪ Clear path to delivering growth in mobile and improved economics in fixed
▪ Our ongoing customer focus is delivering compelling new offers, removing customer pain points and improving economics
We are well positioned in FY21 to reach our T22 goals
Page 27 Copyright Telstra©Page 27 Copyright Telstra©
Enterprise
David Burns Group Executive, Telstra Enterprise
27
28

15
Telstra Enterprise is expected to return to revenue and EBITDA growth as a whole by FY22
Leading in 5G and network to maintain SIO share and stabilise ARPU with IoT to drive growth
Executing the next generation services strategy by rapidly scaling our business in key market growth areas and maintaining share and margin in existing profit pools
Setting our Data & IP portfolio up for long-term sustainable growth by migrating our customers to new plans and propositions
Continuing to execute international profitable growthstrategy, with focus on enterprise segment and efficiently leveraging our assets
1. Telstra Enterprise includes $292m (FY19: $254m) of inter-segment revenue treated as external expenses in other segments
Underlying Income FY20 segment results ($B)1
2.0
1.6
2.5
1.6
NAS
International
Enterprise
Mobile
Data & IP
Other
8.0
13.3
8.0
2.8
Telstra
Other
C&SB
Enterprise
24.1
Key enablers for growth by FY22:
Copyright Telstra© Investor Day - November 2020Page 29
Growth Drivers
We will leverage 5G and our network leadership with IoT to drive growth
▪ New simple, attractive 5G plans in market to grow revenue and improve margin
Stabilising ARPU trajectory target with $3-$5 uplift on 5G higher speed tiers and value-added services penetration up 8pp
New radically simpler 5G Adaptive Mobility plans, from over 2000 plans down to 12 or less
▪ Integration of 4G/5G with fixed access and 5G enterprise wireless opportunities
▪ Expanding IoT services to deliver industry solutions, doubling IoT services attach rate by FY23
▪ Developing Enterprise use cases (e.g. Slicing, Edge, AR/VR, Industry 4.0)
Fuelling 5G growth in Enterprise Mobility & IoT1Monetising
speed and VASSimplification
for marginFixed wireless
subscribersIoT at scale
Copyright Telstra© Investor Day - November 2020Page 30
1. These measures are not guidance and have been provided to illustrate some of the outcomes which management is focused on delivering as part of its medium-term ambitions. Refer to Financial update
29
30

16
transformation through next generation technology
▪ Deep hyperscaler partnerships will accelerate new technology adoption and growth
▪ Standardisation of managed services to improve customer outcomes and drive margin and recurring revenues
▪ Continued productivity improvements and mid teens EBITDA margins
▪ 1500+ Telstra Purple team with core strengths in Network, Security and UC and growing in Cloud and App Development, acquiring capabilities to enhance and grow
Leading technology services leveraging our networkGrowth Drivers
Telstra Purple capabilities
Managed services at scale
Hyperscaler partnerships
Productivity improvements
Copyright Telstra© Investor Day - November 2020Page 31
New Telstra Adaptive Networks plans and propositions position our Data & IP portfolio for growth
▪ New flexible, scalable Telstra Adaptive Networks plans to position ourselves for improved revenue and margin
Securing customers on our existing fibre and mitigating nbnoverbuild risk for our lit buildings
Market leading SDWAN offerings cloud networking requirements
Partnering with nbn to migrate regional Australian businesses to fibre/nbn, driving capital efficiency
▪ Targeting a return to EBITDA growth for our Data & IP portfolio by FY241
Securing our Enterprise Data & IP portfolioGrowth Drivers
Customer retention on Telstra fibre
SDWAN take-up
Leverage nbnLong-term
sustainable growth
Copyright Telstra© Investor Day - November 2020Page 32
1. These measures are not guidance and have been provided to illustrate some of the outcomes which management is focused on delivering as part of its medium-term ambitions. Refer to Financial update
31
32

17
Focused on continuing International profitable growth through network leadership and enterprise customer focus
▪ 20TB of new design capacity1 on new cable routes by FY22
▪ Continued global carrier value proposition to OTT and carrier customers
▪ Increasing focus on our Enterprise customer segment
▪ Driving EBITDA growth2 on constant currency, and maximisingcash return
1. Capacity will be lit up based on demand2. These measures are not guidance and have been provided to illustrate some of the outcomes which management is focused on delivering as part of its medium-term ambitions. Refer to Financial update
medium term ambitions.
Continued global leadershipGrowth Drivers
Global carrier propositions
Enterprise focus
Profitable growth
Maximise value from cable
investments
Copyright Telstra© Investor Day - November 2020Page 33
In summary, we are on track to deliver our T22 commitments and focused on enabling profitable growth
Simplification andcustomer experience
▪ Reduced Enterprise products by 35% since 2018, on track for 50% reduction by end of FY21
▪ Strategic NPS uplift across all segments
▪ Improved employee engagement
▪ Adaptive solutions suite, enhancing customer flexibility and monetising 5G
▪ Increased NAS EBITDA margin by 7pp2 to 18% in FY20, focused on maintaining mid-teens EBITDA margins
▪ Growth with next generation technologies on IoT, Security and Cloud
▪ Continued growth in International
▪ Launched Adaptive Mobility and Adaptive Networks
▪ Exceeded FY20 target of 4,000 active Enterprise customers on Telstra Connect platform, on track for 7,100 active customers by end of FY21
B2B digitisation
Profitable growth1
1. These measures are not guidance and have been provided to illustrate some of the outcomes which management is focused on delivering as part of its medium-term ambitions. Refer to Financial updatemedium term ambitions.
2. Overall Telstra NAS EBITDA margin increase. Telstra Enterprise accounted for ~75% of total FY20 NAS Revenue
Copyright Telstra© Investor Day - November 2020Page 34
33
34

18
Q&A
Maximising value for Telstra Group
Vicki Brady Chief Financial Officer
35
36

19
Overview
Preferred corporate structure
Key principles of Intercompany Agreements
Telstra InfraCo financials
Investor Day - November 2020Copyright Telstra©Page 37
Preferred corporate structure
Preferred simplified corporate structure • We intend to restructure Telstra to maximise optionality and provide
greater flexibility to monetise our infrastructure assets1
• This would include establishing subsidiaries -
• InfraCo Fixed would own and operate passive infrastructure: Ducts, Fibre, Data Centres, Subsea cables and Exchanges
• InfraCo Towers would own and operate passive tower assets
• ServeCo will own and operate our retail business and all active electronics
• Targeting company restructure to complete by end of CY2021, with further update on our progress in Feb 2021
• We intend to launch a process to monetise InfraCo Towers in CY21 while preserving the strategic differentiation our world-leading mobile network provides
• Our preferred corporate structure gives us the option to undertake further monetisations in the future
Exchange Co
Data Centre Co
Fibre Co
Telstra shareholders
InfraCo -Towers
ServeCo
Duct Co
Prior Monetisations
Subsea Co
Portfolio of 36
Exchanges
Clayton Data Centre;
Singapore Data Centre
InfraCo -Fixed
Telstra Group
1. Any restructure will involve certain regulatory and other requirements. There may be delays in implementing parts of the program, or they may not be implemented at all. No final decisions have been made. There will be an update in February 2021.
Copyright Telstra© Investor Day - November 2020Page 38
37
38

20
Key principles of Intercompany Agreements
InfraCoPassive
Business Continuity
ServeCo Differentiation
Market Competitiveness
Key PrinciplesEntity
ServeCo
InfraCoFixed and Towers
Standalone Business
Strong InfraCo
Fixed and Towers
Strong
Telstra Group
Strong ServeCo
Strategic Relationship
Copyright Telstra©Page 39 Investor Day - November 2020
$m
Revenue 4,303
EBITDA ~2,800
Net book value2 ~11,400
$m
Revenue 2,597
EBITDA ~1,700
Net book value2 ~11,400
$m
Revenue 1,706
EBITDA 1,075
FY20P Active wholesale
Copyright Telstra©Page 40
Telstra InfraCo financials
FY20P - Segment - New perimeter1
FY20P Passive only
Investor Day - November 2020
Telstra InfraCo Segment reporting includes Active Wholesale
Total of InfraCo Fixed and InfraCo Towers including the full costs of a standalone business
Active wholesale EBITDA does not include all costs of a standalone business e.g. infrastructure costs. These costs sit in ServeCo
1. Assets restated using asset boundaries announced in November 2019 Investor Day effective 1 July 2020. Asset change included inclusion of mobile towers & poles within InfraCo, inclusion of tower backhaul fibre within InfraCo, minor changes in network support infrastructure, and exclusion of legacy copper and associated assets from InfraCo.
2. Net tangible assets reflect the net book value of fixed assets per the fixed asset register as at 30 June 2020.
39
40

21
Copyright Telstra©Page 41
Focused on delivering optimal group outcomes and returns
Investor Day - November 2020
InfraCo Fixed and Towers ServeCo2 Eliminations3 TelstraGroup
FY20 Proforma1
Income $2,597m $24,907m $1,343m $26,161m
EBITDA4
Margin~$1,700m
~65%~$6,700m
~26%-
$8,411m32.2%
Underlying EBITDA5
Margin~$1,700m
~65%~$5,700m
~25%-
$7,409m30.7%
Underlying EBITDA includes:• $820m from nbn recurring DA• ~$0.7b from ServeCo for passive infra. • Only 2% from legacy including copper-
related sources
Telstra FY20 Estimated Product EBITDA margins after charges for passive Infrastructure:1
• Mobile ~32% • Data&IP ~54% • Fixed product excluding C2C ~8%
Medium-term attributesCapex/sales6 ~13-18% ~10-12% ~12%
Underlying EBITDAHigh margins with recurring, predictable,
indexed earnings growthGrowing from FY22 Growing from
FY22
Long-term contracts with nbnand ServeCo
Retained strategic differentiation and network leadership
1. All charges for passive infrastructure from Serve Co to InfraCo are represented as operating expenses in ServceCo and revenue in InfraCo (i.e. not AASB16 accounting). Lease payments that InfraCo makes, for example to lease property, are treated as an operating expense, whereas in Telstra Group these amounts would be below EBITDA consistent with AASB16.
2. ServeCo is Telstra Group excluding Telstra InfraCo passive infrastructure. ServeCo includes active wholesale which is included in InfraCo segment reporting.3. Represents payments from ServeCo to InfraCo for passive infrastructure only. No revenue recorded in ServeCo for payment of services provided to InfraCo.4.5. EBITDA excluding net one-off nbn DA receipts less nbn net C2C, one-off restructuring costs and guidance adjustments but includes depreciation of mobile lease right-of-use assets.6. Capex is measured on an accrued basis and excludes spectrum and guidance adjustments, externally funded capex, and capitalised leases. Capex/sales will be managed to group outcomes mix between
entities could vary. We are targeting a medium-term capex to sales ratio for the group excluding spectrum to be approximately 12%. Refer to Financial update
Telstra InfraCo
Brendon Riley Telstra InfraCo Chief Executive Officer
41
42

22
Telstra InfraCo is an integrated market-facing asset-based infrastructure business
Improve infrastructure
operating efficiency & service delivery
Provide optionality for Telstra in the
future
Provide greater transparency on the
underlying infrastructure
Employees
Customers
Shareholders
• Easier access to world-class infrastructure assets
• New product offerings & improved service
• Exposure to strong telco & IT infrastructure market trends
•
•
• Dedicated team with a growth focus as part of wider Telstra
Page 43
Stage 1Stand-alone infra business unit
Stage 2 Asset and business value creation
Structural optionality✓ Drive asset efficiencies
✓ Maintain existing customer and offering portfolio
✓ Establish intercompany agreements by asset class
• Build out asset-based businesses
• Evolve market offerings and brand
• Partnerships to drive growth
✓ Asset accountabilities
✓ Detailed operating agreements
✓ Organisational structure, core competencies and op model
✓ Financial reporting
✓ IT and process architecture
• Asset business & company structures
• Market offerings, customer segments and branding
• Capital and funding optionality
• Operational excellence
• Standalone processes and systems
FY19/20 FY21/22Post nbn
completion
Telstra InfraCo priorities
Keyprograms
• Long term shareholder value maximisation
• Readiness and flexibility
• Market options
• Co-operation options
Page 44
We are transitioning from business building to business operations & asset monetisation
43
44

23
The asset perimeter for Telstra InfraCo changed on 1st July 2020
Telstra InfraCo financials FY20 re-stated
F Y 20 R E P ORTE D OLD P E R I ME TE R F Y 20 P F NE W P E R I ME TE R
$m
Revenue 4,423
EBITDA 2,833
Net book value1 ~10,300
ASSE T C HANGE S
Towers:
➢ Inclusion of mobile towers & poles within InfraCo
Fibre:
➢ Inclusion of tower backhaul fibre within InfraCo
Exchanges & Infrastructure:
➢ Comprises data centres, exchanges,ducts, pits, and fixed network supporting infrastructure
Other:
➢ Exclusion of legacy copper and associated assets from InfraCo
FY20PF Net book value New perimeter2FY20PF Split legacy vs. core EBITDA
Page 45
19%
81%98%
2%
InfraCo (incl. Active) InfraCo (Passive only)
7.2
2.6
1.20.3
Subsea
E&I
Fibre
$11.4 billionLegacy Core
1 Net book values based on asset boundaries established in November 2019 Investor Day2 Represents the net book value of tangible assets per the fixed asset register as at 30 June 2020
$m
Revenue 4,303
EBITDA ~ 2,800
Net book value2 ~11,400
Passive assets
Towers
1) Exchanges and Infrastructure represent the aggregation of Ducts, Data Centres, Exchanges and fixed network supporting infrastructure
2) Subsea passive access EBITDA margins aligned to domestic FibreCo access margins pending further refinement
3) The passive asset financials are not shown on an AASB16 basis in that we have included relevant lease payments as part of operating expenses, and hence within the EBITDA. At a Telstra Group level these amounts would be below EBITDA consistent with AASB16.
4) Exclusive of intercompany eliminations between ServeCo and InfraCo such as corporate recharges, intercompany service charges etc.
Page 46
F Y 20 P F TE LSTR A I NF R AC O ($M)
Total NBN ISA revenue: $ 874 M
Revenue
L H L H
TowerCo 306 193 205 63% 67%
FibreCo 808 517 549 64% 68%
Exchanges & Infrastructure1 1,487 848 892 57% 60%
Subsea cables2 156 100 106 64% 68%
InterCompany Eliminations (160) - - n/a n/a
Total InfraCo Passive Assets3 2,597 1,657 1,753 64% 67%
Active business 1,706 63%
Total InfraCo4 4,303 2,732 2,828 63% 66%
EBITDA margin range EBITDA range
1,075
193 - 205
517 - 549
848 - 892
100 - 106
-
~ 1,700
~ 2,800
1,075
63% - 67%
64% - 67%
64% - 68%
57% - 60%
64% - 68%
63% - 66%
63%
Telstra and commercial works businesses
Asset categories passive & active
45
46

24
TowerCo
• 250,000 km of optical fibre cable
• 5,570 mobile towers• 2,630 non-mobile towers
• 2 data centres• 10,000 exchanges &
fixed network sites• 370,000 km duct length
Revenue FY20PF: $ 808MRevenue FY20PF: $ 306M Revenue FY20PF: $ 1,487M
FibreCo Exchanges & Infrastructure
• Largest stock of mobile towers in Australia, metro, regional & remote
• Currently the largest builder of mobile towers across Australia
• Strong, long term cash flows with price indexation
• Growth opportunities supported by industry trends
• Largest dedicated fibre footprint in the country (by access to business premises)
• Will have long term agreements with anchor tenants ServeCo & nbn
• Incremental dark fibre & backhaul fibre opportunity supported by industry trends
• Largest duct & pipe network in Australia
• Will have long term agreements with anchor tenants ServeCo & nbn
• largest cash generating business
• 36 exchanges and one data centre already monetised
• Growth opportunities with emerging distributed technologies
Page 47
Telstra main passive assets represent attractive optionality and growth opportunities
ServeCo
External
ServeCo
External
ServeCo
External
Telstra passive asset businesses
ASSE T STR UCTUR E
• net book value: $0.3b (as of 30 June 2020)
• TowerCo provides passive equipment facilities such as towers and
rooftops (antenna equipment is tenant-owned and maintained)
• priorities:
‒ Ensure the operational efficiency, safety & reliability of our tower
assets
‒ Augment existing towers and increase tenancy
‒ Offer access seekers integrated passive mobile tower solutions1
‒ Build new towers & rooftops for Telstra & access seekers across
the industry
‒ Provide sustainable returns & clear value proposition for investors
• We intend to launch a process to monetise TowerCo during calendar
year 2021
C OMME NTS
Towers Rooftops
Antenna equipment
Huts1Power1
Land parcel
Assets operated by TowerCo
Assets operated by Tenant
Page 48
Our TowerCo business operating and building new towers for Telstra and the industry
1) TowerCo service offering for new towers includes optional provision of power and hut facilities.
TowerCo overview
47
48

25
F I NANC I AL SNAP SHOT
Mobile towers 5,570 3
- Metro/Regional 4,410
- Remote 1,160
Average tenancy ratio today 1.34 4
Average tenancy ratio new towers 1.55
ME TR I C SNAP SHOT
• The leading towers business with largest
geographical footprint in Australia
• Uniquely positioned to serve industry
demand driven by 5G roll-outs
• Business underpinned by long term
contractual arrangements with
ServeCo
• Plan in place to increase tenancy ratios
on existing and new towers
• Pursuing efficiencies in build costs,
maintenance technology and lease costs
C OMME NTSP E E R C OMPAR I SON
E B I T DA MAR GI N
CAP E X/R E V E N U E
$M
Net book value of Assets 280
Revenue (FY20PF ) 306
EBITDA margin range1 63-67%
CAPEX/Revenue range 15-20%
OpFCF/NBV2 28-37%
60% 61% Avg.
60%
63%56% 59%
14% Median
14%
13%
36%
10%16%
Page 49
1) The passive asset financials are not shown on an AASB16 basis in that we have included relevant lease payments as part of operating expenses, and hence within the EBITDA. At a Telstra Group level these amounts would be below EBITDA consistent with AASB16.
2) NBV is based on historical depreciated book value of the relevant passive assets as at 30 June 2020, and the OpFCF metric is subject to change as a result of any future monetisation.
3) Includes ~520 government co-funded towers. Total number of towers, poles and masts: 8,200, including 2,630 USO and non-mobile towers.
4) Calculated based on 5,050 mobile towers, excluding government co-funded towers.
TowerCo business snapshot
ASSE T STR UCTUR E
• FibreCo net book value: $2.6b (as of 30 June 2020)
• assets:
‒ Regional & intercity fibre network
‒ Inter-exchange & data centre network
‒ Business premises access fibre network
‒ Mobile backhaul fibre network
• priorities:
Provide integrated access solutions & maximise network
utilisation across all fibre segments
Leverage technology uplifts & life cycle management to
sustain performance & growth
Develop new growth via dark fibre offerings & use cases
Provide a sustainable return profile & clear value proposition
for investors
Improve operational efficiency to deliver cost-effective
solutions to our customers
C OMME NTS
Exchanges and DCs
Business premises access fibre
Mobile backhaul fibre
Inter-exchange & DC fibre
Page 50
Regional & intercity fibre
Exchanges and DCs
Our FibreCo business design, construct, operate and maintain the passive fibre network
FibreCo overview
49
50

26
F I NANC I AL SNAP SHOT P E E R C OMPAR I SON
• Leading Australian fibre business with high
market share in business fibre connections
• Reach ~130,000 addressable business
locations and less than 180m from
additional ~700,000 business premises
• Business underpinned by long term
contractual arrangements with
ServeCo
• Further monetisation opportunities of
available fibre capacity
• New growth opportunities in dark fibre
segments
• Program to reduce costs through superior
asset management and improved capital
effectiveness
C OMME NTS
ME TR I C SNAP SHOT
$M
Net book value of Assets 2,616
Revenue (FY20PF) 808
EBITDA margin range1 64 68%
CAPEX/Revenue range 15-20%
OpFCF/NBV2 9-11%
E BI TDA MAR GI N
CAP E X/R E V E NUE
69%
Avg.
57%52%
68%57%
39%
Median:
35%
86%
69%
35%20% 16%
Page 51
Fibre segment3
Total fibre cable
Currently available for
monetisation
Inter-exchange & DC fibre (Metro)
30,000 5,000
Regional & intercity fibre
108,000 22,000
Business premises access fibre
112,000 50,000
1) The passive asset financials are not shown on an AASB16 basis in that we have included relevant lease payments as part of operating expenses, and hence within the EBITDA. At a Telstra Group level these amounts would be below EBITDA consistent with AASB16.
2) Operating free cash flow / Net book value. NBV is based on historical depreciated book value of the relevant passive assets as at 30 June 2020, and the OpFCF metric is subject to change as a result of any future monetisation.
3) Mobile backhaul fibre is a combination of the other three fibre segments
FibreCo business snapshot
ASSE T STR UCTUR E
Towers
Customer premises
Access fibre
Legacy copper
C OMME NTS
• Exchanges & Infrastructure net asset value:
$7.2b (as of 30 June 2020)
• Exchange & Infrastructure priorities:
‒ Ensure the operational efficiency, safety
& reliability of all assets
‒ Increase transparency on asset base to
drive utilisation & rationalisation
‒ Launch new solutions & develop sites to
support distributed emerging
technologies
‒ Provide a sustainable return profile &
clear value proposition for investors
Page 52
Ducts
Pits
Data centres
Fixed network sites
Backhaul fibre
Fixed network sites e.g., Exchanges
Our E&I business
Exchanges & Infrastructure overview
51
52

27
F I NANC I AL SNAP SHOT
•
of all Australian ducts
•
regional footprint capable of supporting distributed
emerging technology solutions
• Business underpinned by long term contractual
arrangements with ServeCo and nbn
• 1,500 exchanges suitable for external tenants
• Already monetised 36 high priority exchanges and 1 data
centre in metro areas
• New automated digital solution for ducts provides customers
with reservation capabilities and speed to market
• Pursuing efficiencies in build cost, enhanced facilities
monitoring, rationalisation of space and site divestments
C OMME NTS
ME TR I C SNAP SHOT
Duct distance (km) 370,000
- Metro 220,000
- Non-metro 150,000
$M
Net book value of Assets 7,202
Revenue (FY20PF) 1,487
EBITDA margin range1 57-60%
CAPEX/Revenue range 10-15%
OpFCF/NBV2 7-8%
Page 53
InfraCo exchanges and fixed network sites 10,000
- Data centres (2) & Exchanges with DC racks (9) 11
- Strategic sites 650
- Other exchanges ~4,300
- Other fixed network sites ~5,000
Data Centre Power utilisation effectiveness (PUE) 1.5-1.6
1) The passive asset financials are not shown on an AASB16 basis in that we have included relevant lease payments as part of operating expenses, and hence within the EBITDA. At a Telstra Group level these amounts would be below EBITDA consistent with AASB16.
2) Operating free cash flow / Net book value. NBV is based on historical depreciated book value of the relevant passive assets as at 30 June 2020, and the OpFCF metric is subject to change as a result of any future monetisation.
Exchanges & Infrastructure business snapshot
• A major program of work is underway to establish TowerCo as an independent operating business and subsidiary in the Telstra Group
• Key initiatives in progress include verifying all structures and land tenure, recruiting key talent, redesigning processes and implementing a new tower asset management system
• Majority of the work is expected to be complete by the end of financial year 2021
• Commencing discussions with employees, customers, suppliers, government, unions and regulators
• We intend to launch a process to monetise TowerCo during calendar year 2021
Work to set up TowerCo is well advanced
Page 54
53
54

28
❑ InfraCo has a set of diverse at scale assets with strong financials and major long-term customer agreements, which compare well to global peers
❑ We have a world class team who will unlock value by creating the structures to drive growth, operating efficiency and respond to market opportunities
❑ We are executing strongly to the plan tabled at Investor Day 2019 and are commencing the next stage of structural changesInfraCo
2020 +
Page 55
Financial update
Vicki Brady Chief Financial Officer
55
56

29
Copyright Telstra©Page 57
Overview
Building momentum and confidence
Strong progress in cost-out delivery
Reaffirm FY21 guidance
Investor Day - November 2020
Copyright Telstra©Page 58
Building momentum and confidence
Mobile Fixed Data&IP NAS Other Productivity
FY21 indicators
Monetising clear 5G leadership
TMMC lifting +$2 in 1H21
ARPU growth in 2H21 further growth into FY22
EBITDA growth from 2H21
nbn headwind tracking as expected, and to be largely complete by FY22
Expect similar level of decline in FY21 to FY20
Mid-teens EBITDA margins to continue
COVID impacts remain within our expectations
International growth
Productivity tracking to $400m target
Medium-term ambition1
Early stage of 5G growth cycle
EBITDA growth critical to achieving ambition
Mid-teens nbn resale EBITDA % margin by FY232
Less than $100m pa of losses in legacy
Accelerate on-net solutions
Return to growth by FY24
Continued growth
InfraCo unlocking value from efficiencies, utilisation and growth
New growth from adjacencies incl. Health & Energy
$2.5b by FY22
Further opportunity beyond FY22Enterprise back to revenue &
EBITDA growth by FY22 (mobile, DIP, NAS & International as a whole)
Lower capex to sales of ~12%3 to support free cash flow and ROIC target of ~8% by FY23
Ambition is to achieve $7.5b - $8.5b of underlying EBITDA by FY231
1. on with this ambition. Further, the information on this slide across Mobile, Fixed, Data&IP, NAS, Other and Productivity is not guidance and is provided to illustrate some of the outcomes which management is focused on delivering as part of this ambition. Each is subject to a range of assumptions and contingencies including the actions of third parties.
2. Includes small-business unified communications earnings3.Capex is measured on an accrued basis and excludes spectrum and guidance adjustments, externally funded capex, and capitalised leases.
Investor Day - November 2020
57
58

30
Underlying fixed costs1
Copyright Telstra©Page 59
Strong progress in cost-out delivery
$3.6b$2.7b ~$2.6b
$2.1b
$1.6b~$1.4b
$2.1b
$1.8b~$1.7b
FY16 FY20 FY21 target FY22 target
Direct Labour Indirect labour Non-labour
1. Historical costs re-stated on a post AASB16 basis
$7.9b
$6.1b~$5.7b ~$5.4b
$1.8b cost-out delivered over four years
~$400m cost-out expected in FY21 despite ~$100m delay due to COVID-19 response
Investor Day - November 2020
Targeting $2.5 net productivity by FY22 from FY16 base of underlying fixed costs. Net target includes absorbing inflation and re-investment, reduction in legacy access network costs and COVID-19 impacts
FY21 cost-out
• Predominantly through Indirect and Direct labour cost reductions, enabled by increased adoption of digital channels, ongoing focus on vendor costs and increased internal workforce efficiency
• Direct Labour cost reduction impacted by COVID-19 (deferred to Feb 21) will deliver run-rate reduction into FY22
FY22 cost-out
• Further product rationalisation, platform simplification, increased customer self service through digitisation and incremental indirect and direct labour cost reductions
Ongoing productivity benefits from T22 beyond FY22
• T22 progress gives confidence that transformation, especially digitisation, provides platform for further cost reduction. For example in legacy and IT costs, and benefits from digital platforms
FY20 FY21 guidance1
Total income $26.1b $23.2b to $25.1b
Underlying EBITDA2,3
- Included in-year nbn headwind4 $7.4b$6.5b to $7.0b
~$0.7b
Net one-off nbn DA receipts less nbn net C2C $1.5b $0.7b to $1.0b
Capex5 $3.2b $2.8b to $3.2b
Free cashflow after operating lease payments6 $3.4b $2.8b to $3.3b
Copyright Telstra©Page 60
FY21 guidance
Investor Day - November 2020
1. This guidance assumes no impairments in and to investments or non-current tangible and intangible assets, and excludes any proceeds on the sale of businesses, mergers and acquisitions and purchase of spectrum. The guidance is based on management best estimates of nbn impacts including input from the nbn Corporate Plan currently published at time of issue of this guidance.
2. Underlying EBITDA excludes net one-off nbn DA receipts less nbn net C2C, one-off restructuring costs and guidance adjustments but includes depreciation of mobile lease right-of-use assets.
3. Guidance for FY21 underlying EBITDA assumes an estimated negative impact from the COVID-19 pandemic in FY21 of approximately $400 million. This estimate is approximately $200 million greater than the estimated negative impact from the COVID-19 pandemic for FY20 underlying EBITDA.
4. In-year nbn headwind defined as the net negative recurring EBITDA impact on our business.5. Capex is measured on an accrued basis and excludes spectrum and guidance adjustments, externally funded capex, and capitalised leases.6. and excludes spectrum and guidance adjustments.
59
60

31
Q&A
DisclaimerThese presentations include certain forward-looking statements. The forward-looking statements are based on certain assumptions and information known by Telstra as at the date of these presentations.
The forward-looking statements are not guarantees of future performance and involve known and unknown risks, uncertainties and other factors, many of which are beyond the control of Telstra, which may cause rd-looking statements including general economic conditions in Australia; exchange
rates; competition in the markets in which Telstra will operate; the inherent regulatory risks in the businesses of Telstra; the substantial technological changes taking place in the telecommunications industry; the ongoing impacts of the COVID-19 pandemic; and the continuing growth in the data, internet, mobile and other telecommunications markets where Telstra will operate. A number of these risks, uncertainties and other
ciawww.telstra.com/investor.
In addition, there are particular risks and uncertainties in connection with the implementation of Telstra2022, including the response of customers to changes in products; the risks of disruption from changes to the organisation structure; that detailed business plans have not been developed for the entirety of the strategy and the full scope and cost of Telstra2022 may vary as plans are developed and third parties engaged;
e rproductivity initiatives and realise operational synergies, cost savings and revenue benefits in accordance with the plan.
The indicators provided in this presentation, including across Mobile, Fixed, Data&IP, NAS, Other and Productivity, is not guidance and is provided to illustrate some of the outcomes which management is currently focused on delivering as part of this ambition across the short to medium term. Each item and action remain subject to a range of assumptions and contingencies, including the actions of third parties. As with the implementation of Telstra2022, associated detailed business plans have not be developed in their entirety and the full scope and cost may vary as plans are developed and third parties engaged.business plans (once developed).
Investors should not place undue reliance on the forward-looking statements. To the maximum extent permitted by law, Telstra gives no representation, warranty or other assurance in connection with, and disclaims all responsibility for, the accuracy and completeness of the forward-looking statements, whether as a result of new information, future events or otherwise.
In terms of the information provided in these presentations relating to the proposed restructure of the Telstra Group, any restructure is a complex process and we will need to navigate a range of existing commercial, regulatory and operational requirements. There may be delays in implementing some parts of the program, or they may not be implemented at all. No final decision has been made, there is additional work to be done, uncertainty remains and there will be an update in February 2021.
dan
These presentations are not intended to (nor do they) constitute an offer or invitation by or on behalf of Telstra, its subsidiaries, or any other person to subscribe for, purchase or otherwise deal in any equity, debt instrument or other securities, nor are they intended to be used for the purpose of or in connection with offers or invitations to subscribe for, purchase or otherwise deal in any equity, debt instruments or other securities.
We have adopted AASB16 on a prospective basis and prior year comparatives on a reported basis have not been restated.
All forward-looking figures and proforma statements in these presentations are unaudited and based on A-IFRS unless otherwise indicated. Certain figures may be subject to rounding differences.
All market share information in these presentations is based on management estimates having regard to internally available information unless otherwise indicated.
All amounts are in Australian Dollars unless otherwise stated.
nbn nbn co and other nbn nbn co limited and used under licence.
ted. Other trademarks are the property of their respective owners.
Copyright Telstra© Investor Day - November 2020Page 62
61
62

CHECK AGAINST DELIVERY Page 1
CEO, CFO, TELSTRA INFRACO CEO SPEECH NOTES
TELSTRA INVESTOR DAY
12 NOVEMBER 2020
ANDREW PENN – CEO Slide 3 - Intro Good morning everybody and welcome. I hope everyone is continuing to stay safe and well. Thank you for investing the time to be with us today. Let me start by setting the scene for today's discussion. There are three things we would like to achieve today: Firstly, we want to update you on our operational performance, the key market dynamics we are seeing and our progress with our T22 strategy; Secondly, we want to provide a deep dive on key aspects of our strategy – including the next steps in the creation of Telstra InfraCo and our intention to create a new corporate structure; and, Thirdly, we want to give you the opportunity to hear directly from the broader management team. Slide 4 - T22 – why it matters As you join us today, we are almost 18 months out from the completion of our T22 program. This means we are closer to the end than the beginning so to set the scene, I wanted to start by reminding you why T22 is so important to Telstra - why it is so important we finish the job. When we launched T22, in June 2018, we had reached a tipping point. A tipping point where we knew we had to act more boldly. We could see our industry was changing rapidly, driven by technology innovation, competition and the changing expectations of customers hungry for digital experiences. And, of course, we had to deal with the profound impacts of the NBN on us. Our T22 strategy was created to respond to these trends by radically simplifying and digitising our business; eliminating customer pain points; removing legacy systems and processes; introducing new agile ways of working; further extending our network leadership including in 5G; reducing our cost base; and establishing a standalone infrastructure business to drive performance and create optionality post the nbn rollout. In other words, we were preparing the company for an accelerating digital economy. Little did we know that COVID would super-charge the digital economy and online working, learning and living would suddenly become the new normal. COVID has proven that when it comes to doing things digitally, with the right incentives in place, change can be embraced quickly. In the last nine months the digital economy has exploded through activities such as tele-health, online learning, remote working and e-commerce. Through the work we have already done with T22, we are exceptionally well placed to respond and now lead in this new environment.

CHECK AGAINST DELIVERY Page 2
I cannot emphasise enough the significance and scale of the foundational changes we have made to our digital systems and functions over the last 2-3 years – they are generational and we have only just scratched the surface of the benefits they will deliver. Telstra, as Australia’s largest telco, plays a central role in the digital economy and the work we have done through T22 gives us a winning competitive advantage. Slide 5 – T22 – what we have delivered so far As we move into the final 18 months of T22 we are extremely well progressed. We have delivered, or are on track to deliver, more than three quarters of our strategic objectives. The progress is visible right across the business. We have simplified. Consumer and Small Business in-market plans were cut from 1800 to 20 and today we have almost 6 million services on those plans. We have digitised. Many of the old, cumbersome legacy systems are gone and by the end of FY20 more than 70% of Telstra consumer and small business service transactions were via digital channels, up from 53% just 12 months before. We are working differently. More than 10,000 employees are now working in Agile teams where roadblocks have been removed and products and services are rolled out in weeks rather than months. Our 5G network is the best in the country and among the very best in the world. I expect us to cover more than 50% of the Australian population by the end of December and 75% by June 2021. As you will hear from Kim and Nikos shortly we will leverage this with new products and services such as our 5G fixed wireless broadband solution. We are working our assets more effectively. Telstra InfraCo is now fully operational as a standalone infrastructure business unit controlling assets with a book value of around $11 billion. I will return to InfraCo in a moment to comment on the deep dive we will take you through today. We have also become more efficient. Through our productivity work we have delivered $1.8 billion of savings so far and remain on track to reach our target of reducing annual underlying fixed costs by $2.5 billion by FY22 including a further $400 million this year. Our progress so far on productivity, along with the digital investments we have made, sets us up for what’s beyond T22 and importantly we believe we can deliver strong productivity in FY23 and beyond. Notwithstanding the significant progress, I know it is not sufficient if we do not deliver a strong financial performance for our shareholders too. While the impacts of competition and COVID mean we will not achieve our original ROIC goal in our original timeframe, our level of aspiration should not be interpreted as being capped at ROIC of 7% over time. Vicki is going to speak to this later and without stealing her thunder too much I do want you to hear from me that we are absolutely focussed on getting our underlying EBITDA into the $7.5-$8.5b range post the nbn. We are also upgrading our ROIC target in FY23 to around 8% given that is the ROIC, consistent with EBITDA, towards the lower end of that range. Importantly we can now see the point in FY23 when the nbn migration will be fully complete and its impact finally washed through our financials. This will be an historic moment because the net cost to Telstra of this has been huge – around $3.5 billion in recurring annual EBITDA when it is complete. But with this largely behind us, as you will hear from Vicki, we expect profit to return to growth from FY22.

CHECK AGAINST DELIVERY Page 3
Ultimately transforming Telstra and preparing and positioning it for the future post the rollout of the nbn has been what T22 is all about. We have made massive progress but there is still work to do – and that brings me to today’s agenda. Slide 6 – T22 – what we need to deliver – InfraCo announcement Today we want to take you through a deep dive on some of our key priorities for the remainder of the program. 18 months out from the end of T22 we are very clear about what we need to deliver. Let me start with Telstra InfraCo. In the last two years we have done a lot of work to set InfraCo up as a stand-alone business managing the vast majority of our infrastructure assets. It was created for three reasons – to provide greater transparency of Telstra’s infrastructure assets, to improve the efficiency of how we manage those assets, and thirdly to provide optionality in an evolving industry. Today we are announcing the next step, not just in Telstra Infra Co’s establishment, but in the future operations of Telstra overall. Vicki and Brendon will take you through the detail shortly but today we are announcing an important milestone in our T22 strategy – an important moment in Telstra’s long history – a proposed restructure of our business into three separate legal entities within the Telstra Group. The three entities will be InfraCo Fixed, InfraCo Towers and a third entity – ServeCo. Serve Co is not a new brand name, we are just using it today for the purpose of differentiating this entity which is focussed on products and services and customer support from the infrastructure business. InfraCo Fixed will own and operate our passive physical infrastructure assets: the ducts, fibre, data centres, subsea cables and exchanges that underpin our fixed telecommunications network. InfraCo Towers will own and operate our passive physical mobile tower assets, which we will look to monetise over time given the strong demand and compelling valuations for this type of high-quality infrastructure. ServeCo will focus on how we create and innovate products and services, support customers and deliver the best possible customer experience, including maintaining our significant network leadership. ServeCo will own the active parts of our network – things like software defined networking that allows us to operate in a dynamic way. It is important to understand that we are being very careful to retain key elements of our network in ServeCo – these include the Radio Access Network equipment on our mobile towers, our spectrum holdings and the electronics that light up the fibre in our fixed network - these underpin our strategic advantage and differentiation. We spoke about the key drivers for the establishment of InfraCo when we launched our T22 Strategy in June 2018. The challenges and disruptions over the last 6-12 months have reinforced these. Firstly, the increasing value of infrastructure assets globally; secondly, the importance of the digital economy, not only to business but to the whole of Australia and its economic recovery; and thirdly, the dependence of the digital economy on telecommunications as the platform.

CHECK AGAINST DELIVERY Page 4
As our collective fortunes become increasingly digitised our proposed new corporate structure reflects this new world and will help us build a foundation for it – one that is in the interests of our shareholders, our employees, our customers, and ultimately one that benefits the country overall. Any restructure is a complex process and this is undoubtedly our biggest and most complex since privatisation. It will take time to work our way through the many commercial, regulatory and operational issues. We are very conscious of the many stakeholders who will have an interest in these changes and that is why we have announced our intentions today. We wanted to do so ahead of implementation so we can undertake a comprehensive consultation program to detail the many benefits this structure delivers for our stakeholder and hear their input. Slide 7 – what we need to deliver Elsewhere in the business we also need to finish the T22 job. For our consumer customers, we need to finish radically simplifying our product offerings, eliminating pain points and creating all digital experiences. We have already made great progress. As I mentioned a moment ago more than 70% of our total service transactions are now through digital channels. That equates to almost 5 million transactions per month. Customers are using digital channels to make payments, download bills and update their credit card details and 95% of these transactions are now completed in digital. Digital sales have also dramatically increased over the past two years, up from 6% to 33% in October. Simple sales experiences such as plan changes are now over 55% via digital driven through new one click processes. Finishing this radical simplification and digitisation is a large and complex piece of work that Michael Ackland will take you through shortly. With so much change happening simultaneously for our customers it is inevitable we will see some issues, but we will address them as quickly as possible and ultimately, we will end up providing a better, more seamless experience. I mentioned earlier that T22 will not stand for anything if it does not lead to an improved outcome for our shareholders and we are confident it will. Similarly, it must lead to a transformed experience for our customers and we are now starting to see these benefits accelerate. Turning to our fixed business, the nbn headwinds we have faced are tracking as expected and the T22 changes will enable us to improve our Fixed EBITDA and we are targeting a mid-teens nbn resale margin in FY23. For our business customers, we need to complete the transformation of our Enterprise business including with initiatives such as Adaptive Networks to enable Australian companies to manage their connectivity needs and respond more quickly to changing dynamics. David will talk more about this shortly, but we expect to bring Enterprise back to growth in FY22 at the aggregate level in both revenue and EBITDA. In networks, as with the roll-out of 3G and 4G previously, Telstra is the clear market leader in 5G already and this reinforces that Telstra has, and will retain, by far the best network in Australia. Vicki will talk in more detail about our outlook, but we are confident our leadership in 5G will enable us to achieve 2H FY21 ARPU and EBITDA growth in mobiles. In Productivity, cost reductions are expected to come from further product rationalisation, platform simplification, increased customer self-service and incremental indirect and direct labour reductions.

CHECK AGAINST DELIVERY Page 5
And finally, as well as restoring growth in our core business, we intend to build on the strong performance we have achieved in Telstra Health. The business has built an impressive eco-system of digital services that can help with everything from a simple consultation with a GP via a telehealth platform to delivering paperless prescriptions to helping create new integrated capabilities in healthcare and aged care at a national level. It hit breakeven in the month of May this year and we expect positive an EBITDA contribution in FY21 with revenue growth in excess of 25%. We know that not all the investments Telstra has made in the past have gone well but we have learned from the experience. Our measured approach now means Telstra Health is incredibly well positioned and performing well. And I believe it will be a very strong contributor to the value of Telstra in the coming years. I also wanted to take this opportunity to share with you we are exploring the opportunity to re sell energy to our consumer customers. These plans are at an early stage but we about to apply for the necessary licenses and you will therefore become aware of them in the coming weeks. We are one of the largest consumers of electricity in the country and we have been heavily involved in the sector by underwriting renewable generation via PPAs, providing firming power capacity during times of extreme demand or grid instability, and neutralising the emissions from our total operations. We already underwrite projects that generate enough renewable energy to power about 100,000 homes. And we provide standby power that enables more renewable energy to be absorbed into the energy grid. We deploy machine learning and IoT to change the way that we use energy. We also have a very experienced energy team. All of these things help us affordably access more renewable energy. And we also help some of our large customers do the same. We are exploring bringing this experience to the table with a consumer offer leveraging our strong in home position with our customers, the investments we have made in the digitisation of our customer systems and our Telstra Plus loyalty program. We plan to do so with a simple affordable solution at a low cost for us. And we will do it with the same measured and conservative approach we have applied to Health over the last few years. I want to finish my remarks this morning by coming back to the digital economy and the importance of getting the policy and regulatory settings right for Australia’s future. Slide 8 – Getting the settings right… To its credit, the Federal Government has shown its commitment to the huge task of digitising our economy with recent announcements in the Budget. Only last month, the Prime Minister reiterated his commitment to this goal when he spoke of “upgrading the circuit boards” of our economy and “using the gains we have made this year as a springboard” to become a leader. What is important now is that we continue to build momentum behind the digital economy by removing barriers, incentivising growth and encouraging reform. If we get this right the potential economic benefits for Australia and Australians are enormous. Recent modelling from PwC showed that more businesses embracing digital tools could add up to $90 billion to the Australian economy and create up to 250,000 new jobs by 2025.

CHECK AGAINST DELIVERY Page 6
Telecommunications networks will make or break the country’s digital economy ambitions. With so much at stake it is therefore crucial we have a clear, shared vision for the telecommunications industry for the next decade. With the completion of the nbn rollout, there is now an opportunity for Australia to develop such a vision – one that is technology agnostic, one that provides an environment that is pro-investment and pro-innovation. A vision that not only considers the nbn but the success of the whole sector. Our initiatives with InfraCo and the structural changes we have announced today support such a vision. As do all of the changes we have made and are making as part of our T22 strategy. T22 is fundamentally about transforming Telstra for the future and being in the best possible position to grow strongly in the digital economy. I hope that helps to set the scene for today’s discussion and gives you a sense for our immediate priorities and the urgency with which we are facing into them. As we move further into FY21, and a point where we are closer to the finish of T22 than the start, we know we have more work to do to truly transform Telstra but we also know we have already made very significant progress. We therefore look to the future with growing confidence in our ability to deliver our strategic ambitions and return Telstra to growth. Thank you and with that I will hand over to Kim. VICKI BRADY – CFO Hello everyone and welcome back. I'm Vicki Brady, CFO of Telstra. I’m really pleased so many people could join us for our Investor Day, even if the circumstances are a bit different this year. Let me start by saying that I hope you and your loved ones are safe and well during this difficult time. I’d like to thank my colleagues who have presented so far – I think they’ve demonstrated the momentum we’ve built within our business. [Slide: Agenda] Shortly Brendon Riley will provide an update on InfraCo including an overview and financial snapshot of the passive asset-based businesses. Before he does, I wanted to discuss the structural implications for our whole business and our focus on delivering optimal group outcomes and returns. [Slide: Simplified preferred corporate structure] Today is an exciting milestone, as we take advantage of the progress InfraCo has made and set out our plans for the future. As Andy has mentioned, we intend to establish a corporate structure for Telstra that maximises long-term value for our shareholders and gives us the option to undertake further monetisations.

CHECK AGAINST DELIVERY Page 7
This structure would include InfraCo Fixed, InfraCo Towers and ServeCo as subsidiaries of the Telstra Group. We are targeting completing this restructure by the end of calendar year 2021. InfraCo Fixed would own and operate our passive infrastructure assets: ducts, fibre, data centres, subsea cables and exchanges. Under our preferred structure we would also establish separate asset co subsidiaries of InfraCo Fixed. InfraCo Towers would own and operate our passive tower assets. With strong demand from investors and compelling valuations for high-quality infrastructure assets, the time is right to review our options for unlocking value. We have already demonstrated our ability to successfully monetise infrastructure assets, particularly our exchanges and data centres. Today we take a further step forward through announcing an intention to monetise InfraCo Towers. We anticipate this will begin in 2021 and will follow a similar timeline to the rest of the restructuring process. We are confident we can do this while also preserving the strategic differentiation our world-leading mobile network provides. This is because of the choices we have made on setting asset perimeters, as well as the Intercompany Agreements we have created, which I will explain shortly. We also intend to maintain control of our strategic towers. Any transaction that we proceed with would, of course, be subject to being significantly value accretive for Telstra. As we have done with previous transactions, the proceeds from any future monetisation will be assessed in line with our capital management framework. And to deliver long-term value for our shareholders, we would consider earmarking proceeds to firstly maintaining our balance sheet strength, followed by a focus on returning proceeds directly to shareholders, or potentially reinvesting in the business for growth. In the proposed simplified structure, Telstra ServeCo would own and operate the rest of Telstra, including our Consumer & Small Business and Enterprise functions, along with all the elements of our network, other than passive assets. By defining the asset perimeter this way and keeping active elements of our network, such as the mobile Radio Access Network equipment, spectrum and fibre electronics within ServeCo, we are able to preserve the strategic differentiation we have built through decades of investment and innovation, making us Australia’s leading telco. The restructure will be a multi-faceted process and need to consider a broad range of commercial, regulatory and operational requirements. We will work collaboratively with shareholders, staff, customers and other stakeholders through this process. We will provide an update on our progress at our half year results in February 2021. [Slide: Key principles of Intercompany Agreements] Turning now to the principles underpinning our Intercompany Agreements. We have created a set of Intercompany Agreements between Telstra InfraCo and Telstra ServeCo that underpin their ongoing relationship and support strong and sustainable earnings for both. These agreements ensure that both organisations benefit from the strengths and capabilities of the other. They are also designed to maximise overall value for Telstra shareholders. The first principle is business continuity. InfraCo will provide all passive infrastructure services to Telstra ServeCo at today’s high level of quality. And Telstra ServeCo will support InfraCo on managing and optimising its operations.

CHECK AGAINST DELIVERY Page 8
The second principle is differentiation for Telstra ServeCo. As I just mentioned, the agreements and asset boundaries will maintain Telstra’s sources of infrastructure-led differentiation. The third principle is maintaining a strategic relationship. Telstra ServeCo will receive pricing and terms consistent with its status as a strategic partner and anchor customer of InfraCo and will commit to long-term contracts providing certainty to InfraCo. The fourth principle is market competitiveness, ensuring both entities are competitive in the market with respect to supply and demand for passive infrastructure. The final principle is that Telstra InfraCo operates as a fully operational stand-alone business with its own dedicated leadership team focused on delivering long-term value for customers and Telstra Group shareholders. We are confident we can have strong Infrastructure businesses and maintain Telstra’s strategic differentiation. [Slide: Telstra InfraCo financials] Let me turn now to Telstra InfraCo’s financials. The left-hand side of this slide, displays FY20 InfraCo pro forma segment view, which includes the asset perimeter changes which were effective from 1 July 2020. This segment view of InfraCo includes both passive assets and active wholesale. This is consistent with how we manage the business today, with Brendon leading a function that includes passive InfraCo and the active wholesale business. This is reflected in our current segment reporting. The proposed simplified new legal structure is consistent with Infraco Fixed and Towers being passive-only infrastructure businesses. As a result, in the financials, the active wholesale business is assessed as part of Telstra ServeCo. The FY20 pro forma InfraCo Fixed and Towers earnings reflect fully allocated costs consistent with them being a standalone business. The Active wholesale earnings, however, do not include all costs of a standalone business. This includes costs for infrastructure, including passive infrastructure. These costs sit in Telstra ServeCo. For these reasons, assessing Telstra ServeCo earnings should be done by excluding only InfraCo passive earnings not the segment view. This is shown on the next slide. [Slide: Focused on delivering optimal group outcomes and returns] There is one-view of the Telstra Group’s financial performance, and there will continue to be one-view. Our focus will remain on delivering optimal financial outcomes and returns for the entire Telstra group. We remain committed to our capital management framework including balance sheet strength. You can see on this slide the FY20 pro forma breakdown between InfraCo Fixed and Towers and Telstra ServeCo. At our 1HFY21 results in February, our management reporting will provide disclosure of InfraCo passive-only earnings for InfraCo Fixed and Towers separately. This will continue to be a secondary disclosure rather than included in our primary product-based management reporting. It is important to note InfraCo Fixed and Towers is an economic, rather than accounting, view which would include AASB16 – as such all lease costs are included as operating expenses.

CHECK AGAINST DELIVERY Page 9
Looking now at the financial attributes of InfraCo and ServeCo. Telstra InfraCo’s passive infrastructure delivers high EBITDA margins, with recurring, predictable, and indexed earnings growth, largely from long-term contracts with NBN Co and Telstra ServeCo. This can be seen in the FY20 Proforma EBITDA, which includes $820 million from nbn recurring DAs and around $700 million from Telstra ServeCo for passive infrastructure. Only 2 per cent is from legacy including copper-related sources. Telstra ServeCo has an ambitious growth profile, with a lower capital-intensity than the Telstra Group. After Brendon’s presentation I will talk in more detail about Telstra ServeCo’s ambitious earnings growth profile from FY22. In respect of our medium-term capex to sales target for the group of 12% excluding spectrum, we are committed to managing the allocation of capex between servo, infra fixed and Towers to achieve this outcome. I’m going to hand over to Brendon Riley before I come back and close with a financial update. After that, Andy, Brendon and I will take questions. So with that, I’ll pass to Brendon. BRENDON RILEY – TELSTRA INFRACO CEO Slide 43: Telstra InfraCo… Good morning. Telstra InfraCo was created just over two years ago with three key objectives in mind: 1. Provide greater transparency on the value of Telstra’s infrastructure assets 2. Implement strategies to improve asset efficiency, service delivery and financial returns 3. To provide optionality in an evolving industry Our intent was to shape InfraCo to be a business with a set of performance attributes readily identifiable and aligned to a dedicated infrastructure company. We’re now at the point in our execution – where the benefits of InfraCo are more apparent:
• For shareholders – InfraCo can respond to continued growth in fibre and mobile network rollouts and take advantage of structural and capital options to drive value.
• For customers – standing up InfraCo as a commercial operating business, affords easier access to our world class infrastructure, including a focus on improved service and new products and solutions; and
• For our people – InfraCo provides an exciting opportunity to be part of a new business – focused on growth, our customers and further developing our specialist infrastructure expertise – all as part of the broader Telstra group.
While we have much to deliver in the months and years ahead, today’s presentation and announcements will see an acceleration in our efforts to make InfraCo an unqualified success. Slide 44 – We are transitioning…. At Investor Day a year ago, I presented this framework. We have executed strongly over the past year and are transitioning from building the business to operating as a dedicated infrastructure business and preparing for asset monetisation.

CHECK AGAINST DELIVERY Page 10
In looking back over the past 12 months, we have completed the work required to establish an operational InfraCo and underpin the basis for today’s announcements. The work has included (8 items):
• Refinement of the asset perimeter settings, which I will cover shortly. • Establishing individual asset-based businesses, accountable for go-to-market offerings,
financial performance, long term agreements and service delivery. • Creating a new organisation, including leadership appointments and the transfer of
operational capabilities from Networks & IT. • Building a new financial and operational reporting system for InfraCo and each asset
business. • Putting in place long term inter-company agreements for asset-based services from
InfraCo to ServeCo – our anchor tenant. • Creating a core operations capability and operating efficiency program across all asset
businesses. • Building business plans, to drive growth and productivity for each AssetCo and InfraCo
overall, beyond our T22 commitments. • And updating our framework for risk, safety and asset lifecycle management which builds
on established practices and evolves InfraCo further. The presentation today will provide updates from the Stage 1 work, including InfraCo asset financials based on re-stated FY20 results. Given the state of the nbn completion and Andy and Vicki’s earlier comments on our corporate structure, we will include the optionality work as part of our Stage 2 program going forward. Slide 45 – InfraCo financials… Given changes to the asset perimeter between InfraCo and ServeCo, we wanted to re-state the overall financial profile for InfraCo for FY20. The new asset perimeter was effective from 1 July 2020. The asset perimeter changes announced at our 2019 Investor Day were: • Mobile towers and poles and backhaul fibre within InfraCo, resulting in a new total fibre view. • Legacy copper and associated assets to remain within ServeCo • Minor changes to network supporting infrastructure, mostly around power related assets. We have also updated the financials to reflect new asset charges between InfraCo and ServeCo as part of the Intercompany Agreements. The charges are based on market-rates and reflect ServeCo’s status – as an anchor tenant – and the long-term volume commitments it is making. The original charges were put in place during FY18 when InfraCo was established as a reporting segment – before the new operating business was created. When the FY20 results are re-stated for these changes, revenue and EBITDA declines slightly and net book value increases. In this presentation we also breakout InfraCo’s active and passive businesses. The active business is Telstra’s wholesale business which provides a range of fixed connectivity solutions as well as mobile services for MVNO’s. The re-stated FY20 numbers you see here – include the active and passive businesses – with active representing 38% of the total EBITDA. We think it is important to split the two – which we will do going forward – so it is easier to compare InfraCo with other dedicated infrastructure providers. It also shows that InfraCo’s passive business has limited exposure to legacy copper based business services which are progressively being substituted with nbn and other services across the industry. Slide 46 – Asset categories…

CHECK AGAINST DELIVERY Page 11
I’d now like to move on and discuss InfraCo’s asset businesses in more detail. This table shows the re-stated FY20 financials for revenue and then ranges for EBITDA. The reason we have included EBITDA ranges is that we are continuing to refine our cost base as we stand up our passive asset co’s as operational businesses. The InfraCo FY20 actual results did not reflect the increased opex from the operational transfers from N&IT into InfraCo – or the new skills and capabilities we are introducing to drive market facing business momentum. By providing an EBITDA range, we can normalise for these changes and provide a better view of InfraCo EBITDA going forward and its relativity to global peers. We will report the FY21 1st half actual results for both revenue and EBITDA by asset class at Telstra’s results presentation early next year. If we start at the bottom of the table, you can see the total revenue of $4.303B. Total EBITDA of approximately $2.8B is the midpoint of the EBITDA margin range of 63% to 66%. If we now subtract the active business, you can see the InfraCo passive business with a revenue of $2.597B, and an approximate EBITDA of $1.7B, which is the midpoint of the passive EBITDA margin range of 64% to 67%. While there are some differences between InfraCo and other global infrastructure businesses, the EBITDA margin range compares well. Looking to the asset businesses:
• TowerCo has revenue of $306M and an EBITDA margin range of 63% to 67% • FibreCo has revenue of $808M and an EBITDA margin range of 64% to 68% • Exchanges & Infrastructure, which includes ExchangeCo, DataCentreCo and DuctCo,
has revenue of $1.487B and an EBITDA margin range of 57% to 60% • Subsea cables revenue is $156M with an EBITDA margin between 64% and 68% • Inter-company eliminations are $160M and these relate to asset charges between the
asset businesses, which net out at the total InfraCo level. Most of the $160M are asset charges paid by FibreCo to DuctCo for duct access – as FibreCo sells duct space bundled with fibre to ServeCo and other customers.
I also wanted to highlight that in FY20, $874M of nbn ISA revenue landed in the Fibre – and Exchanges & Infrastructure portfolios. This is consistent with what we have previously disclosed. Slide 47 – InfraCo’s passive… InfraCo is Australia’s leading passive telco asset business, across towers, fibre, exchanges and ducts. Each business is unique with long term customer arrangements and strong financial returns. TowerCo has around 8200 towers, which is more in aggregate than any other provider across both metro and regional areas. 5,570 of our towers are mobile towers and 2,630 towers are USO and non-mobile towers. TowerCo is the largest builder of mobile towers in Australia, having built approximately 1000 towers over the past five years, and will have a long-term arrangement to build and manage ServeCo’s future passive tower infrastructure. With 250,000 km of optical fibre cable, FibreCo has the largest dedicated business fibre footprint in Australia and will also have long term anchor agreements in place. Incremental opportunities exist to supply additional fibre to ServeCo, nbn and the industry – to support mobile expansion and business connections. InfraCo’s largest cash generating business is the Exchanges and Infrastructure portfolio. The portfolio will have long term agreements in place with nbn and ServeCo for duct and exchange access – and can continue to rationalise and grow. The portfolio has 1500 exchanges with external tenants,

CHECK AGAINST DELIVERY Page 12
of which 650 are suitable for growth to support distributed emerging technology solutions. It’s important to note that 36 exchanges and one data centre in Australia have already been monetised. Slide 48 – TowerCo overview Moving to talk more about our TowerCo business which is led by Jon Lipton. TowerCo’s business model is the provision and management of passive equipment including towers, large poles, rooftop towers – and power to huts to support active assets managed by tenants. TowerCo’s focus is to:
• drive the operational efficiency, safety and reliability of the tower portfolio • increase tenancy ratios by augmenting existing towers or selling available space • build new towers and rooftops to support both ServeCo and industry expansion, including
collaboration with FibreCo on backhaul expansion • and, provide transparency on performance metrics and investor returns
As mentioned earlier by Andy and Vicki, we intend to launch a process to monetise TowerCo during calendar year 2021. Slide 49 – TowerCo business Moving to the TowerCo financials in more detail, we have looked at many other Tower businesses in different geographies. The key financial metrics which are reported and helpful to position TowerCo – are the underlying EBITDA, Capex and operating free cash flow. Going forward we expect EBITDA margin in the range of 63-67% which is slightly ahead of industry averages. CAPEX to revenue is close to the industry median in the 15-20% range and a resulting operating free cash flow to net book value in the 28-37% range. The overall tower numbers show TowerCo’s strong market position in all areas, with significantly more towers than all other tower businesses in Australia. We have a total tower base of 8,200 towers, of which 5,570 are mobile towers and 2,630 are USO and non-mobile towers. Some of our towers are government co-funded in regional and remote areas and the tenancy ratios we are reporting are for the 5,050 mobile towers that Telstra has owned and built outright. The average tenancy ratio on existing towers today of 1.34 is below industry average and this is due to two main factors:
1. Firstly, some of the existing towers have been built for ServeCo’s sole usage, meaning they cannot be physically hardened for addition tenants.
2. Secondly, the intercompany agreements facilitate ServeCo’s future requirements for 5G, and with 3G, 4G & 5G all in operation, there is no space for additional tenants on some of our towers.
That said, the plan is to increase tenancy ratios on the existing portfolio and look to build new towers with multi-tenancy where-ever possible. Our current plans are to build new towers with an average tenancy ratio of 1.5 – 1.6. This will bring our tenancy ratios closer to global industry averages over time, noting that tenancy ratios are specific to each geography. We are also simplifying our processes and pricing to make it easier for the industry to access our available portfolio and participate in joint tower builds. This is already unearthing some exciting new opportunities. From an operating efficiency perspective, around 60% of the cost base is rental, land access and government charges. TowerCo is well into the process of reviewing the entire portfolio, beefing up its in-house capabilities in this area and identifying medium to long term efficiencies. These include reducing the costs to build new towers, renegotiating leases – and use of new technologies to reduce maintenance costs.

CHECK AGAINST DELIVERY Page 13
Slide 50 – FibreCo overview Moving onto our FibreCo business, which is led by Kathryn Jones. FibreCo has an extensive national fibre presence including:
• Regional & inter- city fibre • Inter-exchange & data centre fibre • Business access fibre • Mobile backhaul fibre
FibreCo is the primary fibre provider to ServeCo and a significant fibre provider to nbn and the wider industry. Its priorities include:
• Providing simple market facing solutions to maximise network utilisation across all segments
• Effectively managing capital to drive growth and life cycle maintenance • Developing new uses cases for dark fibre, data centre and edge compute workloads • Providing transparency on performance metrics and investor returns.
Slide 51 – FibreCo business… In looking to the FibreCo financials, we expect EBITDA margin in the range of 64%-68%. CAPEX to revenue of 15%-20% at the lower end of industry averages and a resulting operating free cash flow to net book value in the 9%-11% range. FibreCo has a strong market position in the business fibre market and there remains opportunity to drive further utilisation with existing capacity and minor new builds, especially in the customer access market. FibreCo will have long term contractual arrangements with both nbn and ServeCo which underpin its market position. FibreCo is responsible for the design, build, operate and maintenance of all Telstra’s passive fibre needs, across the fixed and mobile portfolios. FibreCo is further developing its approach to life cycle maintenance of the fibre assets to optimise work-induced faults and field costs, including the use of predictive analytics to drive increased proactive maintenance. Slide 52 – Exchanges & Infrastructure… The Exchanges & Infrastructure portfolio, led by Rachel Johnson-Kelly, includes ducts, data centres, exchanges, other fixed network structures – such as portable exchange sites (known as SCAX huts) and repeaters – and supporting infrastructure. The ducts and exchanges play a crucial role in supporting the industry, by providing duct space for national connectivity – and powered racks in exchanges to facilitate active equipment and services. The exchanges can be broadly broken down into two categories. Those to be rationalised as the nbn rollout completes and the last 8% of the population, currently on copper services, migrate to newer technologies over the long-term. While the second category of exchanges will continue to support commercial arrangements as well as be a target for new use cases, such as edge compute and data centre services. There will be significant safety, life cycle maintenance, security and community matters to be managed across the exchange portfolio. Given this and the large number of exchanges set for rationalisation, the returns on the exchanges portfolio is expected to be lower – compared with ducts and data centres. Slide 53 – Exchanges business…

CHECK AGAINST DELIVERY Page 14
A significant attribute of the Exchanges & Infrastructure business is the high book value, with tangible net assets of $7.2B. While we expect EBITDA margins in the range of 57%-60%, CAPEX to revenue will be in the 10%-15% range and operating free cash flow to net book value in the 7%-8% range. Ducts is a lower growth business but is a strong investor proposition due to the long-term contracts that will be in place, its stable market position and strong operating free cash flows. We have recently launched a new Automated Duct Reservation system which has significantly increased speed to market for duct access for our customers. We have monetised one of our data centres in Australia (Clayton) and we have further opportunities to increase utilisation across both data centres – and data centre facilities in some of our exchanges. We already have active interest from customers in taking up additional rack space in our data centres. Nine of our exchanges have data centre floors and that also creates opportunities to provide more high-power density services. On the exchange portfolio we currently have around 1500 exchanges with external tenants, of which 650 exchanges will support new use cases such as edge compute and growth in regional data centre services. We are working with ServeCo on its edge compute requirements and we also believe these sites will be attractive to other customers. In terms of operating efficiency, we will focus on land costs, more efficient building management and monitoring, site optimisation and rationalisation – and power consumption and efficiency. With our data centres, we see an opportunity to bring our power utilisation efficiency (PUE) metric closer to industry standards. We will also continue to explore property divestments where we believe there is an attractive return from sale of the land. We will provide information on the Exchange & Infrastructure portfolio as part of our 1st half results announcement. Slide 54 – Work to set up TowerCo is well advanced As announced earlier, we will look to launch a process to monetise TowerCo during calendar year 2021. TowerCo will be an independent operating business. It will be the first of the Co’s to be established in this way. We are well advanced on our operational program of work. Key initiatives underway include verification of all tower structures and land tenure for all our sites, building out the TowerCo team with some selective specialist capabilities and implementation of an off the shelf Tower asset management system, which is the same system used by other major global tower companies. We are also redesigning our internal processes – to improve how we work with ServeCo and other customers to meet their tower requirements. We have site acquisitions and designs underway for new tower sites and are working closely with ServeCo as our anchor customer to support their 5G rollout. We expect the majority of our program of work to establish TowerCo as an independent operating company – to be complete by the end of financial year 2021. In light of today’s announcements, we will commence discussions with employees, customers and major stakeholders in the coming days. Slide 55 – Summary In closing, I wanted to leave all investors with three key take-outs.
1. We tabled a plan at last year’s Investor Day. We have executed strongly, and we are building good momentum in Telstra InfraCo. We’re now an established operating business and are commencing the next stage of structural changes.

CHECK AGAINST DELIVERY Page 15
2. InfraCo has a set of diverse at scale assets. Each Asset Co has strong financials, established long-term customer agreements and the businesses compare well to global peers.
3. We have a fantastic new team – with a rapidly emerging infrastructure mindset and culture. We are committed to driving the growth of InfraCo, building the metrics, operating efficiency and transparency you all wish to see. And of course, responding to the market shifts and opportunities that emerge.
I look forward to presenting our inaugural 1st half results as an operating business in February, providing more colour on the asset co’s and more on InfraCo’s plans for the future. Thank you. I’ll pass you back to Vicki. VICKI BRADY – CFO [Slide: Agenda] Thanks very much Brendon. As mentioned, I wanted to close today’s presentations with a brief discussion on the momentum we are building in growing underlying EBITDA, and discuss our FY21 guidance. [Slide: Building momentum and confidence] As Andy has spoken to many times before, as did our Chairman at the AGM last month, our view is that in order to support a 16-cent dividend under our current capital management framework, we need to achieve Underlying EBITDA in the range of $7.5 to $8.5 billion by FY23. While we do not provide financial guidance beyond the current financial year, our management team understands the importance of this range and it is our ambition to deliver results within it. If we are successful in delivering a result towards the bottom end of this range would equate to a ROIC of around 8 per cent. We took a conservative approach in August setting our FY23 ROIC target at greater than 7 per cent. With the increased confidence outlined today, we are updating our FY23 ROIC target from greater than 7 per cent to approximately 8 per cent. And we will continue to pursue opportunities to achieve a higher ROIC closer to our original target under T22. You’ve already heard today from my colleagues, so let me briefly reiterate how their work is contributing to our confidence. We reported Underlying EBITDA of $7.4 billion in FY20 and have guided to $6.5 to $7.0 billion in FY21. We believe we will turn underlying EBITDA back to growth in FY22, with the building blocks in place to achieve medium-term EBITDA consistent with our ambition. In our mobile business, we have an enormous opportunity to capitalise on a new multi-year cycle of growth driven by 5G thanks to our clear market leadership. Transacting minimum monthly commitment, our leading indicator of ARPU, has continued to grow in FY21. This, and other factors, supports confidence that we can achieve 2H21 mobile ARPU and EBITDA growth. In our fixed business, the nbn headwinds we have faced are tracking as expected, and will be largely complete by FY22.

CHECK AGAINST DELIVERY Page 16
We have a plan to improve our Fixed EBITDA by:
• Firstly, targeting mid-teens nbn resale margins in FY23, • Secondly managing the economic impact of the legacy copper network by limiting losses
to less than $100 million, • and finally accelerating on-net solutions including by leveraging our mobile network.
Our focus is on bringing our total Enterprise business back to growth in FY22 across mobile, Data & IP, NAS and International as a whole, as you have heard from David. We remain on track to deliver our productivity target of $2.5 billion in reductions by FY22, and see further opportunity beyond this point. And on the financial impacts of the COVID pandemic, measures including levels of bad debt remain within our expectations. In the medium term, we expect adjacencies such as Health to contribute to our turn around. Given these trends, we have increasing confidence that our underlying EBITDA ambition is achievable and is the right level of ambition be to be setting ourselves. [Slide: Strong progress in cost-out delivery] Turning now to a more detailed view of productivity. We continue to target $2.5 billion in net productivity by FY22. We delivered $1.8 billion of this from FY16 to FY20. This year we will deliver another $400 million. This $2.5 billion target is a net figure which includes absorbing all inflation, re-investment, reduction in legacy network costs and COVID-19 impacts. Our cost reductions in FY21 are expected to be achieved predominantly through indirect and direct labour, enabled by the shift of customers onto digital sales and service channels along with a strong focus on vendor costs and workforce efficiency. An example of the productivity improvements we are making is the optimisation of some of our Field service teams and vendors. Historically, tasks were tendered and scheduled in a reactive and discreet manner. Now, through proactive forecasting, vendor management and enhanced scheduling techniques, we are optimising the sequencing and prioritisation of this work to enable similar types of work in similar areas to be scheduled together. This is helping us bring down our costs. Direct labour cost reductions, which we deferred until February 2021, will deliver a full year of benefits in FY22. Other FY22 cost reductions are expected to come from further product rationalisation, platform simplification, increased customer self-service through digitisation and incremental indirect labour reductions. It is important to recognise that the transformation of our business which T22 delivers also enables ongoing productivity benefits beyond FY22. For example, as we migrate our customers and products to our new digital stack we will continue switching off our legacy IT systems. As we do this the associated support and maintenance activities can also be switched off. The new products and customer experiences we are launching are also focused on straight-through ordering and self-service, enabling further rationalisation of some of our support activities.

CHECK AGAINST DELIVERY Page 17
[Slide: FY21 guidance] Let me finish by turning to our FY21 guidance. We reaffirm our FY21 guidance provided to the market at our FY20 Full Year Results in August. However, as outlined in our FY20 result, I want to re-iterate that we expect FY21 Underlying EBITDA to be weighted to the second half, with cost reductions, COVID impacts and product trajectory - especially mobile - all more supportive of improved second half performance. Given the evolution of our business and our desire to deliver better clarity for the market, we are considering changes to our product hierarchy for our 1HFY21 results. If we proceed with any change, we will provide more details before our half year results. Thank you, and I will see you in just a moment for Q&A. [ENDS]