accounting homework help, accounting assignment, accounting tutor online,accounting homework helper

A
Australia 2018 Accounting Industry Performance ReportSee how your firm measures up and set a course to where you want to get to

B
Cover: Wendy Davies, Moore Stephens, Perth | Xero partner This page: Abigail Crompton, Third Drawer Down, Melbourne | Xero customer

1
ForewordWe’re very pleased to share with you this 2018 edition of our partner benchmarking
study for Australian accounting firms. This year’s report sharpens the focus on
forward planning, as partners have told us that the most valuable use of
previous reports was to inform their strategic and annual planning. We’ve also
added significantly more detail on marketing and advisory services, in line
with the feedback.
We produced our first detailed benchmarking reports – for the United Kingdom,
Australia, New Zealand, and the United States – in 2016 and 2017. Over 2000
firms took part in those studies, and now over 5000 accounting and bookkeeping
firms globally have participated in providing the rich data that lets Xero partners
compare their firm with other similar ones.
This report includes findings in three new areas.
• It shows results for firms who’ve taken different approaches to positioning
themselves in the market (see tables 3 to 5). It’s evident that raising these
questions helps firms agree and articulate their strategy for 2018 and the
following three to five years.
• It reveals the composition of advisory services revenues and what partners
are prioritising in 2018. In the ‘what if’ scenario in table 6, we show what the
2017 results would have been for a firm with 250 small business clients. This
demonstrates the potential revenue to be gained from advisory services.
• It shows the client and marketing communication method used by size of firm
(pages 28 to 37) and the sources of new clients. This information can help
accountants fine-tune their marketing and communications methods to attract
and serve the types of businesses they value most.
As you read through this report, you’ll see illuminating patterns emerge –
in client management, marketing, pricing, billing, employee compensation
and advisory services.
The findings in this report point to opportunities and ways for firms to achieve
their 2018 goals. We’re here to help you move your business forward and enjoy
the benefits of your efforts, so get in touch with your Xero account manager for
assistance to make it happen. Your account manager can also point you to more
resources to assist your firm as we couldn’t fit everything in here.
Please continue to share your questions and feedback with us as we plan for 2019
and beyond. You can reach me directly by email.
Doug LaBahn, Ph.D
Xero Practice Leadership Team

2
We love putting reports like this together to help you plan for the future. Thanks for reading.

3
ContentsHighlights ....................................................................................................................... 4
Participant profiles ......................................................................................................... 8
Insights to help your 2018 planning .............................................................................. 9
Marketing, performance and growth ............................................................................ 10
Client metrics for online firms ..................................................................................... 15
Advisory services opportunities .................................................................................. 21
Ingredients for success ................................................................................................ 24
Different size firms: a close-up look ............................................................................ 27
How we can help ........................................................................................................... 38
These stats are based on an online survey we did of 497 Xero Australian accounting partners. We aim to be as clear and concise as possible with this info, but we can’t promise that it’s free of rounding or other errors. The info and commentary in this report is just a guide and should not be taken as taxation, financial or legal advice – you should always check with an independent expert that what you’re doing is right for you and your firm.
List of figuresFigure 1. Sources of new clients
Figure 2. Investment in marketing
Figure 3. Growth in client numbers by age of firm
Figure 4. New clients in the last 12 months
Figure 5. Annual revenue per small business client
Figure 6. Revenue contribution per employee
Figure 7. Number of business clients per employee
Figure 8. Increases in employee compensation
Figure 9. Regretted client departures
Figure 10. Advisory service revenue
Figure 11. Comparison of firms with and without advisory services
List of tablesTable 1. Role and seniority of participants
Table 2. Growth in size and revenue over time
Table 3. Practice approaches
Table 4. Billing options
Table 5. Results for firms taking different approaches
Table 6. Contribution of advisory services to revenue
Table 7. Most attractive areas for advisory revenue growth
Table 8. Comparison of different size accounting firms
Table 9. Profile of sole practitioners
Table 10. Profile of small firms
Table 11. Profile of midsize firms
Table 12. Profile of large firms
Table 13. Profile of very large firms

4
Results across all practices
Highlights
Average revenue growth rate for Xero accounting and bookkeeping practices
in Singapore in the 12 months to December 2017*
Average annual billing per small business client**
Average revenue per employee including contractors
* 139 Singapore accounting and bookkeeping practices in December 2017.
** Small businesses are defined as businesses with up to 100 employees.
$137,200$137,200$137,200$137,200$137,200$137,200$137,200$137,200$137,200$137,200$137,200$137,200$137,200$137,200$137,200$137,200$137,200$137,200$137,200$137,200$137,200$137,200$137,200$137,200$137,200$137,200$137,200$137,200$137,200$137,200$137,200$137,200$137,200$137,200$137,200$137,200$137,200$137,200$137,200$137,200$137,200$137,200$137,200$137,200$137,200$137,200$137,200$137,200$137,200$137,200$137,200$137,200$137,200$137,200$137,200$137,200$137,200$137,200$137,200$137,200$137,200$137,200$137,200$137,200$137,200$137,200$137,200$137,200$137,200$137,200$137,200$137,200$137,200$137,200$137,200$137,200$137,200$137,200$137,200$137,200$137,200$137,200$137,200$137,200$137,200$137,200$137,200$137,200$137,200$137,200$137,200$137,200$137,200$137,200$137,200$137,200$137,200$137,200$137,200$137,200$137,200$137,200$137,200$137,200$137,200$137,200$137,200$137,200$137,200$137,200$137,200$137,200$137,200$137,200$137,200$137,200$137,200$137,200$137,200$137,200$137,200$137,200$137,200
11.2%11.2%11.2%11.2%11.2%11.2%11.2%11.2%11.2%11.2%11.2%11.2%11.2%11.2%11.2%11.2%11.2%11.2%11.2%11.2%11.2%11.2%11.2%11.2%11.2%11.2%11.2%11.2%11.2%11.2%11.2%11.2%11.2%11.2%11.2%11.2%11.2%11.2%11.2%11.2%11.2%11.2%11.2%11.2%11.2%11.2%11.2%11.2%11.2%11.2%11.2%11.2%11.2%11.2%11.2%11.2%11.2%11.2%11.2%11.2%11.2%11.2%11.2%11.2%11.2%11.2%11.2%11.2%11.2%11.2%11.2%11.2%11.2%11.2%11.2%11.2%11.2%11.2%11.2%11.2%11.2%11.2%11.2%11.2%11.2%11.2%11.2%11.2%11.2%11.2%11.2%11.2%11.2%11.2%11.2%11.2%11.2%11.2%11.2%11.2%11.2%11.2%11.2%11.2%11.2%11.2%11.2%11.2%11.2%11.2%11.2%11.2%11.2%11.2%11.2%11.2%11.2%11.2%11.2%11.2%11.2%11.2%
$164,200$164,200$164,200$164,200$164,200$164,200$164,200$164,200$164,200$164,200$164,200$164,200$164,200$164,200$164,200$164,200$164,200$164,200$164,200$164,200$164,200$164,200$164,200$164,200$164,200$164,200$164,200$164,200$164,200$164,200$164,200$164,200$164,200$164,200$164,200$164,200$164,200$164,200$164,200$164,200$164,200$164,200$164,200$164,200$164,200$164,200$164,200$164,200$164,200$164,200$164,200$164,200$164,200$164,200$164,200$164,200$164,200$164,200$164,200$164,200$164,200$164,200$164,200$164,200$164,200$164,200$164,200$164,200$164,200$164,200$164,200$164,200$164,200$164,200$164,200$164,200$164,200$164,200$164,200$164,200$164,200$164,200$164,200$164,200$164,200$164,200$164,200$164,200$164,200$164,200$164,200$164,200$164,200$164,200$164,200$164,200$164,200$164,200$164,200$164,200$164,200$164,200$164,200$164,200$164,200$164,200$164,200$164,200$164,200$164,200$164,200$164,200$164,200$164,200$164,200$164,200$164,200$164,200$164,200$164,200$164,200$164,200$164,200
$180,200$180,200$180,200$180,200$180,200$180,200$180,200$180,200$180,200$180,200$180,200$180,200$180,200$180,200$180,200$180,200$180,200$180,200$180,200$180,200$180,200$180,200$180,200$180,200$180,200$180,200$180,200$180,200$180,200$180,200$180,200$180,200$180,200$180,200$180,200$180,200$180,200$180,200$180,200$180,200$180,200$180,200$180,200$180,200$180,200$180,200$180,200$180,200$180,200$180,200$180,200$180,200$180,200$180,200$180,200$180,200$180,200$180,200$180,200$180,200$180,200$180,200$180,200$180,200$180,200$180,200$180,200$180,200$180,200$180,200$180,200$180,200$180,200$180,200$180,200$180,200$180,200$180,200$180,200$180,200$180,200$180,200$180,200$180,200$180,200$180,200$180,200$180,200$180,200$180,200$180,200$180,200$180,200$180,200$180,200$180,200$180,200$180,200$180,200$180,200$180,200$180,200$180,200$180,200$180,200$180,200$180,200$180,200$180,200$180,200$180,200$180,200$180,200$180,200$180,200$180,200$180,200$180,200$180,200$180,200$180,200$180,200$180,200
14.4%14.4%14.4%14.4%14.4%14.4%14.4%14.4%14.4%14.4%14.4%14.4%14.4%14.4%14.4%14.4%14.4%14.4%14.4%14.4%14.4%14.4%14.4%14.4%14.4%14.4%14.4%14.4%14.4%14.4%14.4%14.4%14.4%14.4%14.4%14.4%14.4%14.4%14.4%14.4%14.4%14.4%14.4%14.4%14.4%14.4%14.4%14.4%14.4%14.4%14.4%14.4%14.4%14.4%14.4%14.4%14.4%14.4%14.4%14.4%14.4%14.4%14.4%14.4%14.4%14.4%14.4%14.4%14.4%14.4%14.4%14.4%14.4%14.4%14.4%14.4%14.4%14.4%14.4%14.4%14.4%14.4%14.4%14.4%14.4%14.4%14.4%14.4%14.4%14.4%14.4%14.4%14.4%14.4%14.4%14.4%14.4%14.4%14.4%14.4%14.4%14.4%14.4%14.4%14.4%14.4%14.4%14.4%14.4%14.4%14.4%14.4%14.4%14.4%14.4%14.4%14.4%14.4%14.4%14.4%14.4%14.4%
$494,000$494,000$494,000$494,000$494,000$494,000$494,000$494,000$494,000$494,000$494,000$494,000$494,000$494,000$494,000$494,000$494,000$494,000$494,000$494,000$494,000$494,000$494,000$494,000$494,000$494,000$494,000$494,000$494,000$494,000$494,000$494,000$494,000$494,000$494,000$494,000$494,000$494,000$494,000$494,000$494,000$494,000$494,000$494,000$494,000$494,000$494,000$494,000$494,000$494,000$494,000$494,000$494,000$494,000$494,000$494,000$494,000$494,000$494,000$494,000$494,000$494,000$494,000$494,000$494,000$494,000$494,000$494,000$494,000$494,000$494,000$494,000$494,000$494,000$494,000$494,000$494,000$494,000$494,000$494,000$494,000$494,000$494,000$494,000$494,000$494,000$494,000$494,000$494,000$494,000$494,000$494,000$494,000$494,000$494,000$494,000$494,000$494,000$494,000$494,000$494,000$494,000$494,000$494,000$494,000$494,000$494,000$494,000$494,000$494,000$494,000$494,000$494,000$494,000$494,000$494,000$494,000$494,000$494,000$494,000$494,000$494,000$494,000
Results across all firms*
Highlights
Average revenue growth for accounting firms in Australia
in the 12 months to December 2017*
Average advisory service revenue**
Average revenue per employee including contractors
* 497 Australian Xero accounting firms in December 2017
** Average for accounting firms that provide advisory services to customers

5
$137,200$137,200$137,200$137,200$137,200$137,200$137,200$137,200$137,200$137,200$137,200$137,200$137,200$137,200$137,200$137,200$137,200$137,200$137,200$137,200$137,200$137,200$137,200$137,200$137,200$137,200$137,200$137,200$137,200$137,200$137,200$137,200$137,200$137,200$137,200$137,200$137,200$137,200$137,200$137,200$137,200$137,200$137,200$137,200$137,200$137,200$137,200$137,200$137,200$137,200$137,200$137,200$137,200$137,200$137,200$137,200$137,200$137,200$137,200$137,200$137,200$137,200$137,200$137,200$137,200$137,200$137,200$137,200$137,200$137,200$137,200$137,200$137,200$137,200$137,200$137,200$137,200$137,200$137,200$137,200$137,200$137,200$137,200$137,200$137,200$137,200$137,200$137,200$137,200$137,200$137,200$137,200$137,200$137,200$137,200$137,200$137,200$137,200$137,200$137,200$137,200$137,200$137,200$137,200$137,200$137,200$137,200$137,200$137,200$137,200$137,200$137,200$137,200$137,200$137,200$137,200$137,200$137,200$137,200$137,200$137,200$137,200$137,200
11.2%11.2%11.2%11.2%11.2%11.2%11.2%11.2%11.2%11.2%11.2%11.2%11.2%11.2%11.2%11.2%11.2%11.2%11.2%11.2%11.2%11.2%11.2%11.2%11.2%11.2%11.2%11.2%11.2%11.2%11.2%11.2%11.2%11.2%11.2%11.2%11.2%11.2%11.2%11.2%11.2%11.2%11.2%11.2%11.2%11.2%11.2%11.2%11.2%11.2%11.2%11.2%11.2%11.2%11.2%11.2%11.2%11.2%11.2%11.2%11.2%11.2%11.2%11.2%11.2%11.2%11.2%11.2%11.2%11.2%11.2%11.2%11.2%11.2%11.2%11.2%11.2%11.2%11.2%11.2%11.2%11.2%11.2%11.2%11.2%11.2%11.2%11.2%11.2%11.2%11.2%11.2%11.2%11.2%11.2%11.2%11.2%11.2%11.2%11.2%11.2%11.2%11.2%11.2%11.2%11.2%11.2%11.2%11.2%11.2%11.2%11.2%11.2%11.2%11.2%11.2%11.2%11.2%11.2%11.2%11.2%11.2%
$164,200$164,200$164,200$164,200$164,200$164,200$164,200$164,200$164,200$164,200$164,200$164,200$164,200$164,200$164,200$164,200$164,200$164,200$164,200$164,200$164,200$164,200$164,200$164,200$164,200$164,200$164,200$164,200$164,200$164,200$164,200$164,200$164,200$164,200$164,200$164,200$164,200$164,200$164,200$164,200$164,200$164,200$164,200$164,200$164,200$164,200$164,200$164,200$164,200$164,200$164,200$164,200$164,200$164,200$164,200$164,200$164,200$164,200$164,200$164,200$164,200$164,200$164,200$164,200$164,200$164,200$164,200$164,200$164,200$164,200$164,200$164,200$164,200$164,200$164,200$164,200$164,200$164,200$164,200$164,200$164,200$164,200$164,200$164,200$164,200$164,200$164,200$164,200$164,200$164,200$164,200$164,200$164,200$164,200$164,200$164,200$164,200$164,200$164,200$164,200$164,200$164,200$164,200$164,200$164,200$164,200$164,200$164,200$164,200$164,200$164,200$164,200$164,200$164,200$164,200$164,200$164,200$164,200$164,200$164,200$164,200$164,200$164,200
$180,200$180,200$180,200$180,200$180,200$180,200$180,200$180,200$180,200$180,200$180,200$180,200$180,200$180,200$180,200$180,200$180,200$180,200$180,200$180,200$180,200$180,200$180,200$180,200$180,200$180,200$180,200$180,200$180,200$180,200$180,200$180,200$180,200$180,200$180,200$180,200$180,200$180,200$180,200$180,200$180,200$180,200$180,200$180,200$180,200$180,200$180,200$180,200$180,200$180,200$180,200$180,200$180,200$180,200$180,200$180,200$180,200$180,200$180,200$180,200$180,200$180,200$180,200$180,200$180,200$180,200$180,200$180,200$180,200$180,200$180,200$180,200$180,200$180,200$180,200$180,200$180,200$180,200$180,200$180,200$180,200$180,200$180,200$180,200$180,200$180,200$180,200$180,200$180,200$180,200$180,200$180,200$180,200$180,200$180,200$180,200$180,200$180,200$180,200$180,200$180,200$180,200$180,200$180,200$180,200$180,200$180,200$180,200$180,200$180,200$180,200$180,200$180,200$180,200$180,200$180,200$180,200$180,200$180,200$180,200$180,200$180,200$180,200
14.4%14.4%14.4%14.4%14.4%14.4%14.4%14.4%14.4%14.4%14.4%14.4%14.4%14.4%14.4%14.4%14.4%14.4%14.4%14.4%14.4%14.4%14.4%14.4%14.4%14.4%14.4%14.4%14.4%14.4%14.4%14.4%14.4%14.4%14.4%14.4%14.4%14.4%14.4%14.4%14.4%14.4%14.4%14.4%14.4%14.4%14.4%14.4%14.4%14.4%14.4%14.4%14.4%14.4%14.4%14.4%14.4%14.4%14.4%14.4%14.4%14.4%14.4%14.4%14.4%14.4%14.4%14.4%14.4%14.4%14.4%14.4%14.4%14.4%14.4%14.4%14.4%14.4%14.4%14.4%14.4%14.4%14.4%14.4%14.4%14.4%14.4%14.4%14.4%14.4%14.4%14.4%14.4%14.4%14.4%14.4%14.4%14.4%14.4%14.4%14.4%14.4%14.4%14.4%14.4%14.4%14.4%14.4%14.4%14.4%14.4%14.4%14.4%14.4%14.4%14.4%14.4%14.4%14.4%14.4%14.4%14.4%
$494,000$494,000$494,000$494,000$494,000$494,000$494,000$494,000$494,000$494,000$494,000$494,000$494,000$494,000$494,000$494,000$494,000$494,000$494,000$494,000$494,000$494,000$494,000$494,000$494,000$494,000$494,000$494,000$494,000$494,000$494,000$494,000$494,000$494,000$494,000$494,000$494,000$494,000$494,000$494,000$494,000$494,000$494,000$494,000$494,000$494,000$494,000$494,000$494,000$494,000$494,000$494,000$494,000$494,000$494,000$494,000$494,000$494,000$494,000$494,000$494,000$494,000$494,000$494,000$494,000$494,000$494,000$494,000$494,000$494,000$494,000$494,000$494,000$494,000$494,000$494,000$494,000$494,000$494,000$494,000$494,000$494,000$494,000$494,000$494,000$494,000$494,000$494,000$494,000$494,000$494,000$494,000$494,000$494,000$494,000$494,000$494,000$494,000$494,000$494,000$494,000$494,000$494,000$494,000$494,000$494,000$494,000$494,000$494,000$494,000$494,000$494,000$494,000$494,000$494,000$494,000$494,000$494,000$494,000$494,000$494,000$494,000$494,000
Results for pacesetting firms*
Average revenue growth for accounting firms in Australia
in the 12 months to December 2017**
Average advisory service revenue***
Average revenue per employee including contractors
* Pacesetting firms are those with the largest number of clients (300+) using online
accounting software. These firms grew more rapidly and more than doubled the advisory
revenue of average firms.
** 497 Australian Xero accounting firms in December 2017
*** Average for accounting firms that provide advisory services to customers

6
Jason Robinson, RBK Advisory, Melbourne | Xero partner

7
“ Our whole thing is Xero. Just over 12
months from launch, our extended team
and partners have grown to 18 and we
operate out of five different locations
across Melbourne with a newly opened
Geelong office. A Sydney office is on
our 2017/18 financial year roadmap.
Down the track we also have ambitions
to set up RBK New Zealand.
How do a couple of accountants with a
big idea and some fancy software grow
so much in one year?
We focused on relationships.”
• Jason Robinson, RBK Advisory
8
Firm sizeNumber of
participantsOwner/Managing
partner/Partner/CEOPractice manager /
team leader Accountant Total
Sole practitioners 73 99% 1% 0% 100%
Small firms 216 92% 4% 4% 100%
Midsize firms 42 81% 13% 6% 100%
Large firms 30 75% 23% 2% 100%
Very large firms 5 46% 45% 9% 100%
Average 93% 5% 2% 100%
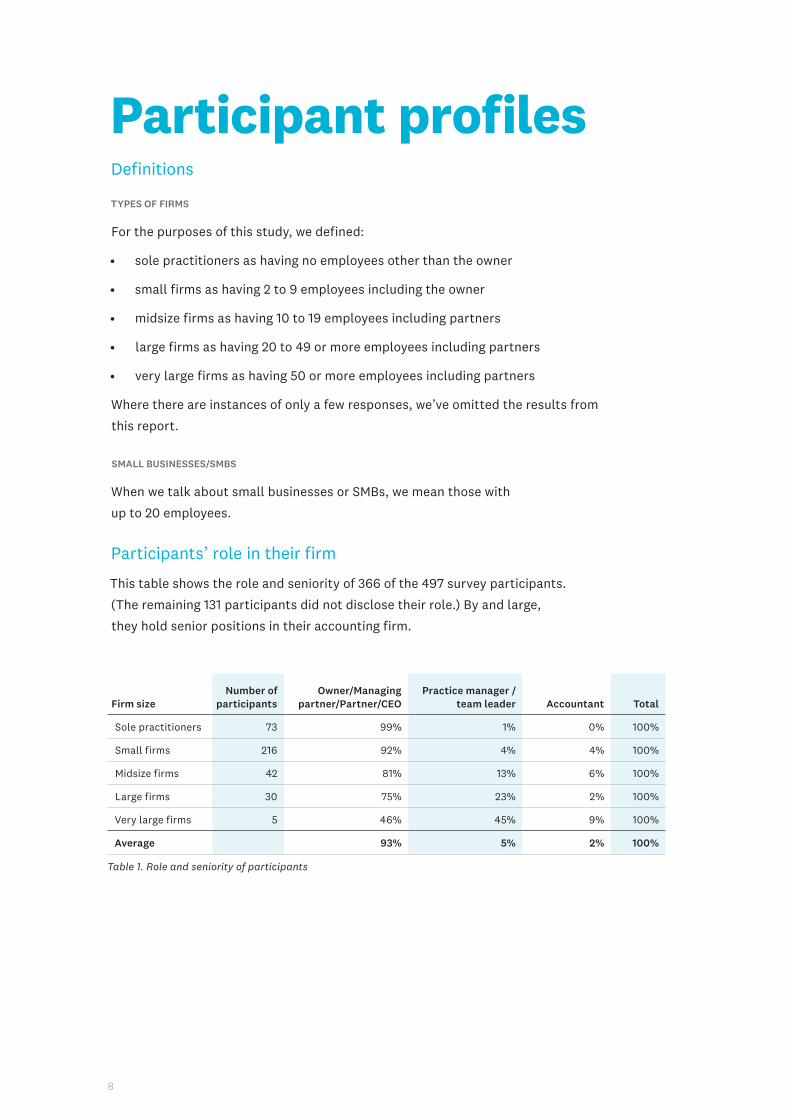
Table 1. Role and seniority of participants
Participant profilesDefinitions
TYPES OF FIRMS
For the purposes of this study, we defined:
• sole practitioners as having no employees other than the owner
• small firms as having 2 to 9 employees including the owner
• midsize firms as having 10 to 19 employees including partners
• large firms as having 20 to 49 or more employees including partners
• very large firms as having 50 or more employees including partners
Where there are instances of only a few responses, we’ve omitted the results from
this report.
SMALL BUSINESSES/SMBS
When we talk about small businesses or SMBs, we mean those with
up to 20 employees.
Participants’ role in their firm
This table shows the role and seniority of 366 of the 497 survey participants.
(The remaining 131 participants did not disclose their role.) By and large,
they hold senior positions in their accounting firm.

9
Insights to help your 2018 planning
Wendy Davies, Moore Stephens, Perth | Xero partner

10
Other
3%
55%
16%
26%
Switched from another firm
Were doing it on their own
New business startups
Marketing, performance and growthThis page shows the sources of new clients for firms in 2017. The high percentage of clients
switching accountants reflects the migration we’re seeing as SMBs move to firms with
larger cloud practices – which are also the ones that have much higher client retention
rates. We were surprised by the sheer number of businesses (estimated to be 190,000 in
Australia in 2017) switching to accountants with sizable online practices. This is a large
market for Xero partners, who can show small businesses that moving to cloud services
provides them with far better value by boosting collaboration and increasing ease of use,
while removing the cost, hassle and complexity of older methods of doing accounting.
Sources of new clients
Small businesses seeking to hire new advisors were the largest source of new clients.
This was followed by new business startups – who are often confused by the compliance
terms and regulations they face during their first year as a business.
Figure 1. Sources of new clients

11
Ave
rage
mar
keti
ng in
vest
men
t in
last
12
mon
ths
0
$20,000
$40,000
$60,000
$80,000
Largefirms
Very largefirms
Smallfirms
Midsizefirms
Solepractitioner
2017
2016
2015
2014
2013
2010
-12
200
5-0
9
200
0-0
4
1990
-99
1950
-69
1970
-89
Bef
ore
1950
1000
750
500
250
0
Ave
rage
num
ber
of c
lient
s
Year the firm was formed
All firms Best group: top 15% in each age cohort
Investment in marketing
Most firms – except for the larger ones, which generally have staff dedicated to marketing
and client development activities – are reluctant to invest in marketing.
Figure 2. Average investment in marketing in the last 12 months
Growth in client numbers by age of firm
This graph compares the average number of small business clients of all respondents
with that of the best group – the top 15% in each age cohort. So, in effect, it shows the
growth curve for average and for top practices in Australia over time.
Figure 3. Growth in small business client numbers by age of firm

12
All respondents Best group*
Year the firm was formed
No. of firms
No. of business clients
New clients in last 12 months
Revenue in the last 12 months
Average no. of employees
% of regretted staff departures
No. of business clients
Revenue in the last 12 months
No. of employees
2017 17 64 19 $306,000 2.5 3.9% 273 $859,000 3.7
2016 26 47 18 $448,000 3.8 0.0% 181 $536,000 5.5
2015 37 87 21 $438,000 4.6 7.2% 350 $874,000 5.5
2014 26 92 19 $637,000 4.3 5.6% 400 $2,442,000 14.0
2013 20 124 25 $497,000 5.9 8.3% 350 $1,324,000 16.0
2010-2012 50 121 19 $807,000 5.8 6.9% 375 $1,926,000 10.0
2005-2009 68 157 18 $817,000 6.8 4.1% 628 $1,402,000 11.3
2000-2004 38 126 15 $924,000 9.5 15.9% 450 $2,912,000 30.0
1990-1999 59 243 20 $2,014,000 17.6 10.3% 850 $5,177,000 43.3
1970-1989 43 350 29 $2,247,000 20.8 5.1% 1,000 $5,708,000 57.0
1950-1969 12 456 41 $3,050,000 31.7 2.4% 1,000 $5,500,000 61.7
Before 1950 15 393 32 $4,391,000 27.0 8.5% 750 $7,125,000 55.7
Average 177 21 $1,237,000 10.6 6.9% 567 $2,968,000 25.5
* Top 15% in each age cohort
Table 2. Average growth in size and revenue over time
Growth in firm size and revenue over time
These figures can help you set revenue, staff and client goals for 2018 by knowing what the
top and average firms have achieved.

13
Approach Options from which participants chose
WeWork shared community, talent, team
Our firm provides services as if we are employees or members of
their team with all the experience and benefits (and without the
high costs and effort) of hiring full-time employees.
Specialised surgeonOur firm provides the highest level of expertise in a select number
of important areas. We deliver exceptional service in a few areas.
Business mentor/counsellor
Our firm provides the wise, experienced advice and counselling
that helps businesses navigate the best path forward for their
business – both now and far into the future.
Tech-loving accountantsOur firm is filled with qualified accountants who are also tech
geeks or front-runners.
All-inclusive ‘Amazon’ shopping centreOur firm provides a full set of services that cover virtually every
business need.
Holistic health centreOur firm provides a regime that helps businesses and business
owners excel at work and in life.
Personal fitness trainer/coachOur firm provides great value and service to businesses that want
to get the job done quickly and economically.
Fast and effective service centreOur firm provides great value and service to businesses that want
to get the job done quickly and economically.
Urgent care centreOur firm provides high quality service when businesses get stuck,
are in too deep and need fast, smart resolution of their issues.
Table 3. Practice approaches
Practice performance based on approach
PRACTICE APPROACHES
We asked participants to select the best fit for their firm from the options below, then looked
at the performance of firms taking each approach.
BILLING OPTIONS
We also asked participants about the different ways they billed small business clients and
what proportion of clients they billed by each method. The options were:
Billing option Description
Service planClients are on a fixed-fee monthly or quarterly service plan and the agreed rate is automatically
collected.
Service plan
plus projectsClients are on both a monthly service plan and they expect to pay for additional project work.
Bill by projectClients are quoted a fixed amount for the service (eg, tax return, general ledger setup) and
billed when the work is complete.
Bill for time Clients are billed for the number of hours (and partial hours) of service provided.
Table 4. Billing options

14
% of clients on each billing option*
Best fit for the
firm
Annual revenue
per client
Revenue growth
in the last 12
months
Popularity of the
approach
No. of small
business clients
Service plan
Service plan plus
projectsBill by
projectBill for
time
% of employees required to
complete timesheets
WeWork shared
community, talent,
team
$5,260 8.8% 9% 140 26% 8% 16% 47% 59%
Specialised
surgeon$4,900 14.0% 11% 113 20% 15% 28% 37% 67%
Business mentor/
counsellor$4,870 10.6% 29% 189 14% 11% 30% 42% 66%
Tech-loving
accountants$4,580 16.3% 3% 250 26% 4% 27% 44% 24%
All-inclusive
‘Amazon’ shopping
centre
$4,560 9.0% 23% 220 13% 7% 24% 54% 75%
Holistic health
centre$4,460 11.7% 9% 255 19% 10% 27% 41% 66%
Personal fitness
trainer/coach$3,900 11.7% 3% 104 40% 7% 34% 19% 55%
Fast and effective
service centre$3,640 13.0% 12% 175 11% 8% 45% 36% 48%
Urgent care
centre $2,080 15.7% 1% 60 2% 34% 37% 27% 33%
Average $4,600 11.1% 185 17% 10% 29% 43% 63%
RESULTS FOR FIRMS TAKING DIFFERENT APPROACHES
See how firms taking different approaches performed and the billing options used to support
each strategy.
* Some respondents use billing methods other than the four shown, which is why the billing option percentages
(reading across) don’t add up to the full 100%
Table 5. Results for firms taking different approaches
Partners often ask us what small businesses are seeking in an advisor when they search
for an accountant. These results show that firms that take a ‘WeWork’ team approach are
realising the highest revenue per client ($4,870) but the slowest revenue growth. In contrast,
the next three approaches – specialised surgeon (14%), business mentor (10.6%) and tech-
loving accountants (16.3%) – are growing much faster and realising solid revenue per client.
It’s clear that firms can achieve success pursuing different approaches. We encourage firms
to align their pricing and employee time keeping strategies to support the approach they
determine is best for them.

15
Client metrics for online firmsNew business clients in the last 12 months
Firms with larger numbers of online accounting clients are adding more new clients.
The factors that contribute to their success are the lower rates at which they’re able to
offer their services, and being more tech savvy. Several findings, including regretted
client departures (figure 9) and practice approaches (table 5), suggest businesses
are placing a priority on technological know-how when choosing a new accountant or
bookkeeper.
Figure 4. Average number of new clients in the last 12 months
“ Xero has transformed my business over
the last five years. There’s no way I
could manage the number of clients
that I do on another platform. As a
business we can continue to grow at
this level because of Xero. As a company,
Xero is always looking that step ahead
and the conversation is way ahead of
the competition. ”
• Katrina Spinazzola, KRS Consulting Group
0 10 20 30 40 50
Average number of new clients in the last 12 months
Num
ber
of o
nlin
e cl
ient
s
100–299
300+
36–99
6–35
0–5

16
$0 $1,000 $2,000 $3,000 $4,000 $5,000
Num
ber
of o
nlin
e cl
ient
s
Average revenue per small business client
300+
100–299
36–99
6–35
0-5
$50,000 $100,000 $150,000$0
Average revenue contribution per employee
Num
ber
of o
nlin
e cl
ient
s
300+
100–299
36–99
6–35
0-5
Average annual revenue per small business client
Except for firms with very large numbers of online clients, the rates that advisors charge
are quite similar across segments. This finding, combined with other results in this section,
suggests that firms are using the efficiencies they gain from online accounting to boost
revenue per employee and value to clients while holding prices steady so as to win more
new clients.
Figure 5. Average annual revenue per small business client
Revenue contribution per employee
This chart shows the substantial increase in revenue per employee that's achieved as the
number of online business clients increases as a consequence of greater employee efficiency
and higher advisory service revenue.
Figure 6. Average revenue contribution per employee

17
Number of business clients per employee
This chart shows the substantial increase in the ability of accountants to serve clients
efficiently as the number of online clients increases.
Figure 7. Average number of clients per employee
Increases in employee compensation
This chart shows the increase in employee compensation as the number of online clients
increases, illustrating how the benefits of greater revenue per employee flow on to staff.
It also shows the risks to employee compensation in firms that are slow to move their
clients online.
Figure 8. Average employee compensation (excluding partners) increase in latest review cycle in 2017
0%
2%
1%
4%
3%
5%
Number of online clients
Ave
rage
incr
ease
in e
mpl
oyee
com
pen
sati
on
100–299 300+36–996–350–5
0 2010 30 40
Average number of clients per employee
Num
ber
of o
nlin
e cl
ient
s
100–299
36–99
6–35
0-5

18
Regretted client departures
Firms with fewer numbers of online accounting clients have high rates of regretted client
departures. Their ability to retain desirable clients is much weaker than for firms with larger
numbers of online clients. This is one of several indicators that we see of clients moving
to firms adept at using technology and away from firms who are less tech savvy. Another
indicator is the number of new clients who switched from another firm (see figure 1).
Figure 9. Regretted client departures in the last 12 months as a percent total clients
Advisory service revenue
This chart shows that as advisors get closer to their clients due to the use of online
accounting, numerous opportunities for advisory services become apparent, easier to
sell, and simpler to deliver. The jump shown for partners with 300 or more clients is very
noticeable and suggests that the scale of the online practice facilitates the uptake and
delivery of advisory services.
Figure 10. Average advisory service revenue in the last 12 months
Figure 9. Average number of regretted client departures in the last 12 months
0% 2% 4% 6% 8% 10%
Percentage of regretted client departure on average
Num
ber
of o
nlin
e cl
ient
s
300+
100–299
36–99
6–35
0-5
Figure 9. Average number of regretted client departures in the last 12 months
$0 $100,000 $200,000 $300,000 $400,000
Average advisory service revenue
Num
ber
of o
nlin
e cl
ient
s
100–299
300+
6–35
36–99
0–5

19
“The impact of technology in particular, has meant
compliance can be done more efficiently with less
need for human interaction (fewer hours to bill) and
a resultant drop in fees. With compliance being a
grudge buy and perceived by many as not providing
them with anything of value, clients now shop
around for the lowest fee. In other words, it’s a
race to the bottom.
So, what services do clients value and what,
therefore, are they prepared to spend money on?
The answer, in a nutshell, is advisory services.”
•Wendy Davies, Moore Stephens WA

20

21
Advisory services opportunitiesThis section explores the 2017 revenue of partners to provide clarity on the often debated
notion of what advisory services include, and to assist with your 2018 planning.
Comparison of firms with and without advisory revenue
Practices that offer advisory services reported higher overall revenue per client but lower
compliance revenue. When we asked partners about it, they explained that there’s a shift
towards charging clients separately for advisory services instead of just simply giving away
these services to justify higher compliance billing.
Figure 11. Comparison of average revenue per client for firms with and without advisory services
Advisor services revenue Compliance revenue
$0
$2,000
$4,000
$6,000
$8,000
$10,000
Ave
rage
rev
enue
per
clie
nt
Compliance-only practices
Compliance + advisory practices
$4,200 $3,440
$3,550

22
Contribution of advisory services to revenue
This table shows the reported contribution of nine different advisory services to 2017 revenue
and how this would look for a firm with 250 clients by extrapolating the revenues reported by
participants.
Advisory service
Share of advisory revenue
What revenue would look like for a firm
with 250 clients
Advisory services, eg budgeting, cash flow forecasting, business planning 35% $312,000
Startup mentoring, advice, and networking or assistance with business
development12% $110,000
Virtual or outsourced CFO services 12% $107,000
Succession planning services 10% $92,000
Business performance benchmarking 9% $79,000
App/software (other than accounting) setup, configuration and support
services7% $62,000
Capital-raising or assistance moving to better interest, terms or financing
options6% $56,000
For-fee implementations of accounting software for businesses that are
unlikely to become long-term clients 5% $44,000
HR advisory services, eg, assistance setting employee compensation,
planning to add/reduce employees4% $38,000
Total $900,000
Table 6. Contribution of advisory services to revenue
23
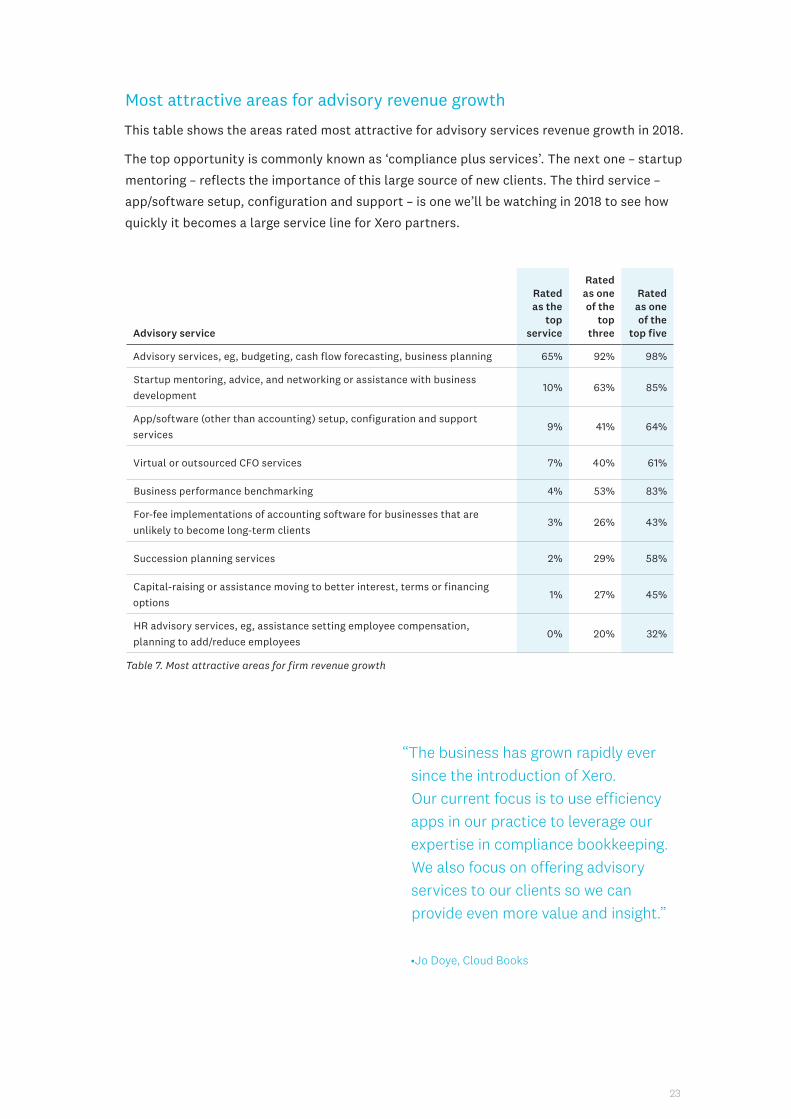
Most attractive areas for advisory revenue growth
This table shows the areas rated most attractive for advisory services revenue growth in 2018.
The top opportunity is commonly known as ‘compliance plus services’. The next one – startup
mentoring – reflects the importance of this large source of new clients. The third service –
app/software setup, configuration and support – is one we’ll be watching in 2018 to see how
quickly it becomes a large service line for Xero partners.
Advisory service
Rated as the
top service
Rated as one of the
top three
Rated as one of the
top five
Advisory services, eg, budgeting, cash flow forecasting, business planning 65% 92% 98%
Startup mentoring, advice, and networking or assistance with business
development10% 63% 85%
App/software (other than accounting) setup, configuration and support
services9% 41% 64%
Virtual or outsourced CFO services 7% 40% 61%
Business performance benchmarking 4% 53% 83%
For-fee implementations of accounting software for businesses that are
unlikely to become long-term clients 3% 26% 43%
Succession planning services 2% 29% 58%
Capital-raising or assistance moving to better interest, terms or financing
options1% 27% 45%
HR advisory services, eg, assistance setting employee compensation,
planning to add/reduce employees0% 20% 32%
Table 7. Most attractive areas for firm revenue growth
“The business has grown rapidly ever
since the introduction of Xero.
Our current focus is to use efficiency
apps in our practice to leverage our
expertise in compliance bookkeeping.
We also focus on offering advisory
services to our clients so we can
provide even more value and insight.”
•Jo Doye, Cloud Books

24
Ingredients for successThe survey results suggest four factors that
lead to positive outcomes and higher growth
for accounting firms.
Firms that have larger numbers of online accounting clients have an easier time signing on new clients and are better at retaining their clients.
“By choosing to specialise in online
bookkeeping and collaborate
with local tax accountants on
the single ledger, we have the
ability to go anywhere, because
the bookkeeping required for
management is very similar in
every country. Clients get a full
service, and businesses from
around the world come to us
because they want our Xero
expertise.”
• Meryl Johnston, Bean Ninjas
Firms that provide advisory services earn considerably more revenue per client than firms that offer only compliance.
“For me, it’s all about the
interconnectivity and the single-ledger
approach. I couldn’t imagine looking
after a client’s data today and providing
compliance and advisory services if
the customer used a different platform
to run their business. Xero eliminates
unnecessary errors and saves me so
much time in giving sound advice.”
• Andrew Van De Beek, illumin8 Partners
25
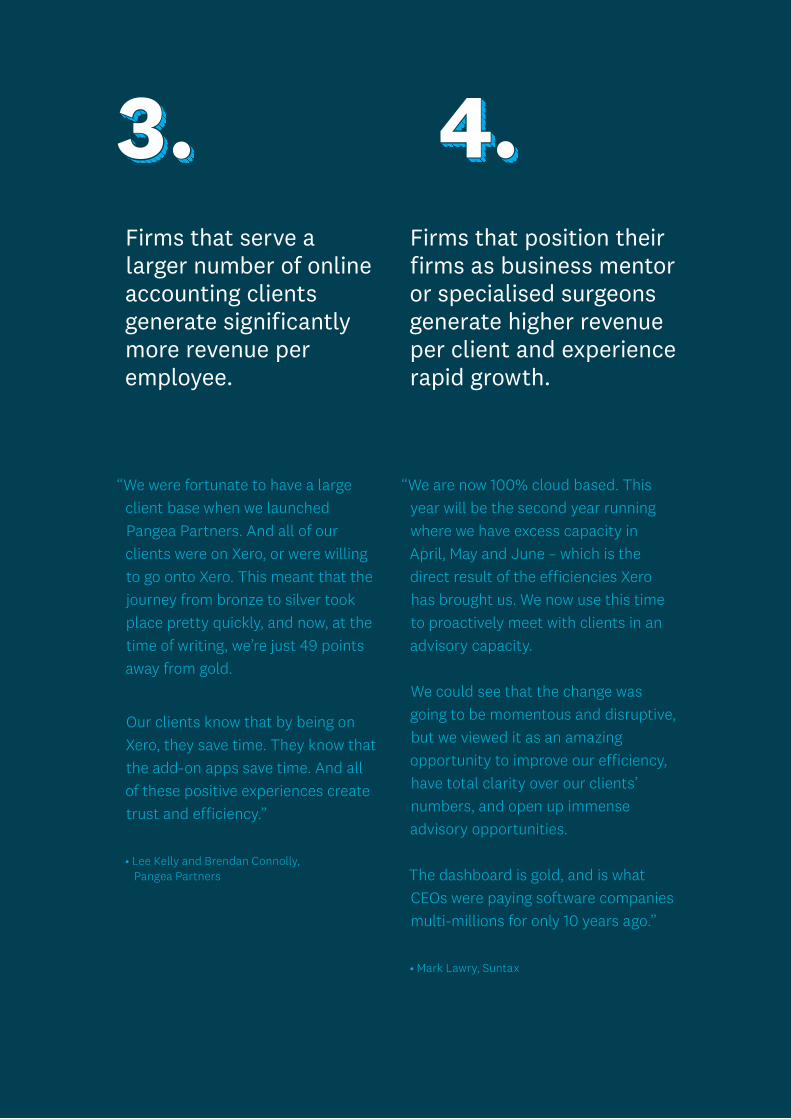
Firms that serve a larger number of online accounting clients generate significantly more revenue per employee.
“We were fortunate to have a large
client base when we launched
Pangea Partners. And all of our
clients were on Xero, or were willing
to go onto Xero. This meant that the
journey from bronze to silver took
place pretty quickly, and now, at the
time of writing, we’re just 49 points
away from gold.
Our clients know that by being on
Xero, they save time. They know that
the add-on apps save time. And all
of these positive experiences create
trust and efficiency.”
• Lee Kelly and Brendan Connolly, Pangea Partners
Firms that position their firms as business mentor or specialised surgeons generate higher revenue per client and experience rapid growth.
“We are now 100% cloud based. This
year will be the second year running
where we have excess capacity in
April, May and June – which is the
direct result of the efficiencies Xero
has brought us. We now use this time
to proactively meet with clients in an
advisory capacity.
We could see that the change was
going to be momentous and disruptive,
but we viewed it as an amazing
opportunity to improve our efficiency,
have total clarity over our clients’
numbers, and open up immense
advisory opportunities.
The dashboard is gold, and is what
CEOs were paying software companies
multi-millions for only 10 years ago.”
• Mark Lawry, Suntax

26

27
Different size firms: a close-up lookIn this section, we profile different size firms, from sole practitioners to very large firms,
as measured by the number of employees and contractors they employ.
Comparison of different size firms
This table compares firms of different sizes, allowing you to see things like how your
firm’s operations, marketing and performance stack up against those of your peers.
Firm sizeNo. of
respondents
Revenue growth in
the last 12 months
No. of smaller businesses*
served in the last 12 months
% of clients already
using online accounting
No. of new clients in
the last 12 months
Firm revenue in the last 12
months
Sole
practitioners74 12.6% 29 78% 7 $200,000
Small firms 236 12.8% 124 68% 18 $592,000
Midsize firms 52 6.5% 273 60% 28 $1,778,000
Large firms 40 9.4% 431 58% 45 $4,055,000
Very large firms 11 7.9% 895 46% 56 $9,216,000
Average 11.5% 176 67% 21 $1,236,000
* Businesses with up to 20 employees
Table 8. Comparison of different size accounting firms
28
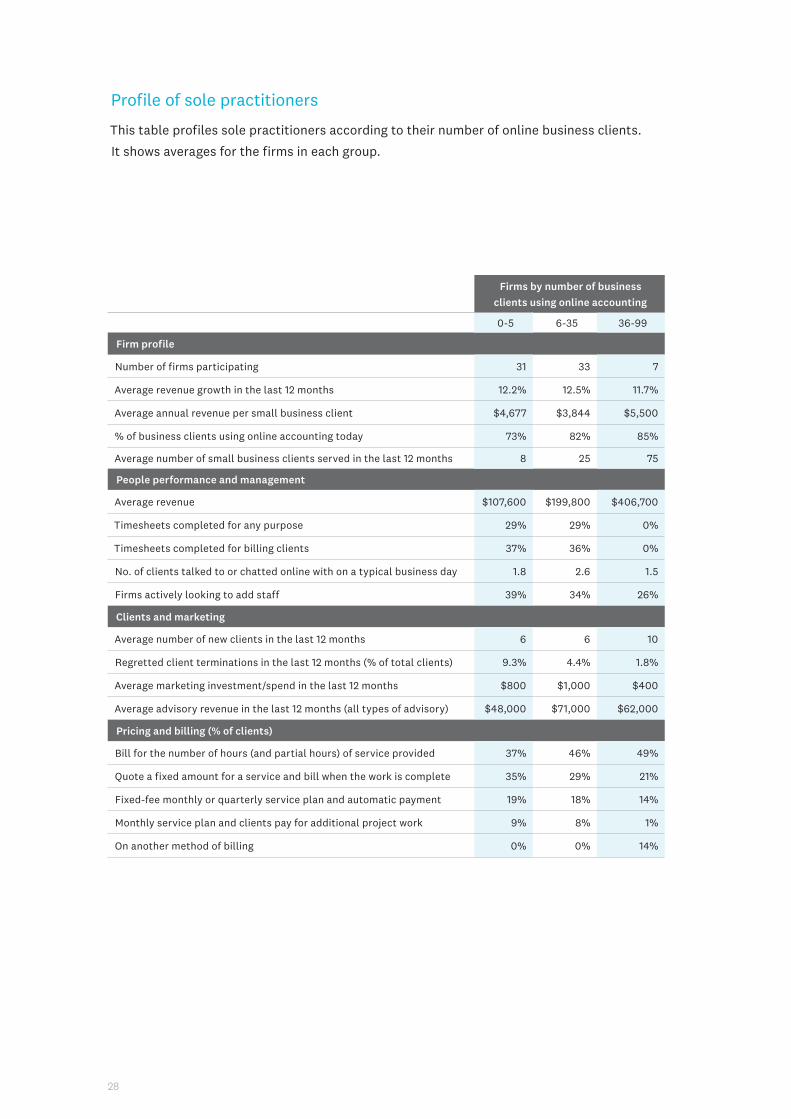
Profile of sole practitioners
This table profiles sole practitioners according to their number of online business clients.
It shows averages for the firms in each group.
Firms by number of business
clients using online accounting
0-5 6-35 36-99
Firm profile
Number of firms participating 31 33 7
Average revenue growth in the last 12 months 12.2% 12.5% 11.7%
Average annual revenue per small business client $4,677 $3,844 $5,500
% of business clients using online accounting today 73% 82% 85%
Average number of small business clients served in the last 12 months 8 25 75
People performance and management
Average revenue $107,600 $199,800 $406,700
Timesheets completed for any purpose 29% 29% 0%
Timesheets completed for billing clients 37% 36% 0%
No. of clients talked to or chatted online with on a typical business day 1.8 2.6 1.5
Firms actively looking to add staff 39% 34% 26%
Clients and marketing
Average number of new clients in the last 12 months 6 6 10
Regretted client terminations in the last 12 months (% of total clients) 9.3% 4.4% 1.8%
Average marketing investment/spend in the last 12 months $800 $1,000 $400
Average advisory revenue in the last 12 months (all types of advisory) $48,000 $71,000 $62,000
Pricing and billing (% of clients)
Bill for the number of hours (and partial hours) of service provided 37% 46% 49%
Quote a fixed amount for a service and bill when the work is complete 35% 29% 21%
Fixed-fee monthly or quarterly service plan and automatic payment 19% 18% 14%
Monthly service plan and clients pay for additional project work 9% 8% 1%
On another method of billing 0% 0% 14%

29
Firms by number of business
clients using online accounting
0-5 6-35 36-99
Marketing and client communications
Number of methods used, not including word of mouth 0.9 0.8 0.6
Word of mouth 77% 73% 57%
Social media: Facebook 30% 27% 29%
Website and/or blog using search engine optimisation (SEO) 23% 21% 0%
Online advertising / Google search engine marketing (SEM) 7% 15% 0%
Other social media: Twitter, LinkedIn, Instagram, etc 7% 9% 0%
Print advertising 13% 0% 0%
Newsletters 0% 0% 0%
Industry event/award sponsorship 0% 0% 0%
TV or radio advertising 0% 0% 0%
Podcasts 0% 0% 0%
Other 0% 3% 0%
None of the above 10% 0% 29%
Sources of new clients
Switched from another firm 55% 47% 52%
New business startups 30% 22% 29%
Were doing it on their own 15% 26% 4%
Other 0% 5% 14%
Biggest issues in the year ahead
Finding new clients 71% 45% 43%
Staying up to date with new technology 32% 55% 71%
Upskilling myself and my staff 39% 36% 43%
Tough competition in the area 16% 6% 14%
Hiring and retaining staff 13% 6% 0%
Other 3% 9% 0%
Table 9. Profile of sole practitioners

30
Profile of small firms
This table profiles small firms (those with 2 to 9 employees including the owner) according
to their number of online business clients. It shows averages for the firms in each group.
Firms by number of business clients
using online accounting
0-5 6-35 36-99 100-299 300+
Firm profile
Number of firms participating 15 84 76 53 8
Number of employees including contractors 3.3 3.8 4.8 5.6 6
Revenue growth in the last 12 months 13.1% 12.8% 11.6% 15.0% 8.4%
Annual revenue per small business client $2,767 $4,661 $4,013 $3,566 $2,625
% of business clients using online accounting today 54% 65% 70% 71% 76%
Average number of small business clients served in the
last 12 months12 48 100 248 550
People performance and management
Revenue per employee including contractors $69,800 $97,100 $124,800 $176,900 $247,300
Number of small business clients per employee 4 13 22.5 48.5 95.2
Increase in employee compensation in most recent
cycle, excluding partners1.5% 2.5% 4.5% 5.0% 1.9%
Regretted staff departures in the last 12 months
(as a % of total employees)13.3% 5.2% 8.9% 7.5% 16.7%
Employees required to complete timesheets for any
purpose55% 62% 60% 69% 97%
Employees required to complete timesheets for billing
clients49% 62% 57% 64% 90%
No. of clients employees talk to or chat online with on a
typical business day2.3 3.2 3.9 4.6 3.9
Firms actively looking to add staff 41% 57% 63% 58% 43%
Clients and marketing
Number of new clients in the last 12 months 5 11 20 27 46.0
New clients per employee 1.7 3.3 4.7 5.8 8.3
Regretted client departures in the last 12 months
(as a % of total clients)12.7% 5.9% 4.1% 1.5% 0.7%
Marketing investment or spend in the last 12 months $1,100 $2,400 $5,700 $4,200 $2,400
Advisory revenue in the last 12 months
(all types of advisory)$80,000 $105,000 $141,000 $176,000 $135,000

31
Firms by number of business clients
using online accounting
0-5 6-35 36-99 100-299 300+
Pricing and billing (% of clients)
Bill for the number of hours (and partial hours) of
service provided34% 36% 37% 43% 57%
Quote a fixed amount for a service and bill when the
work is complete46% 28% 30% 34% 26%
Fixed-fee monthly or quarterly service plan and
automatic payment13% 21% 19% 11% 12%
Monthly service plan and clients pay for additional
project work0% 14% 12% 11% 6%
Another method of billing 7% 1% 1% 2% 0%
Marketing and client communications
Number of methods used, not including word of mouth 1.1 1.3 1.3 1.5 0.6
Word of mouth 53% 69% 63% 55% 88%
Website and/or blog using search engine optimisation
(SEO)13% 31% 29% 32% 38%
Social media: Facebook 40% 29% 29% 42% 0%
Other social media: Twitter, LinkedIn, Instagram, etc 13% 14% 20% 15% 0%
Newsletters 7% 13% 8% 15% 13%
Print advertising 20% 8% 12% 11% 0%
Online advertising / Google search engine marketing
(SEM)7% 13% 14% 15% 0%
TV or radio advertising 0% 4% 1% 4% 13%
Industry event/award sponsorship 0% 10% 5% 6% 0%
Podcasts 0% 1% 1% 0% 0%
Other 0% 5% 7% 13% 0%
None of the above 7% 2% 4% 2% 0%
Sources of new clients
Switched from another firm 42% 53% 54% 57% 61%
New business startups 45% 22% 28% 30% 34%
Were doing it on their own 11% 21% 15% 12% 6%
Other 2% 3% 2% 0% 0%
Biggest issues in the year ahead
Finding new clients 80% 48% 43% 26% 38%
Staying up to date with new technology 40% 43% 46% 47% 38%
Upskilling myself and my staff 40% 30% 42% 43% 13%
Hiring and retaining staff 27% 27% 34% 34% 25%
Tough competition in the area 33% 15% 13% 8% 13%
Other 0% 8% 9% 17% 0%
Table 10. Profile of small firms

32
Profile of midsize firms
This table profiles midsize firms (those with 10 to 19 employees including the partners)
according to their number of online business clients. It shows averages for the firms in
each group.
Firms by number of business clients
using online accounting
6-35 36-99 100-299 300+
Firm profile
Number of firms participating 8 10 22 11
Average number of employees including contractors 15 15 15 15
Average revenue growth in the last 12 months 3.6% 5.2% 6.1% 10.3%
Average annual revenue per small business client $7,000 $5,150 $4,667 $4,455
% of business clients using online accounting today 37% 53% 61% 85%
Average number of small business clients served in the
last 12 months113 127 304 459
People performance and management
Revenue per employee including contractors $95,800 $106,700 $118,700 $147,000
Number of small business clients per employee 7.5 8.5 20.3 30.6
Increase in employee compensation in most recent
cycle, excluding partners2% 4.1% 3.7% 3.3%
Regretted staff departures in the last 12 months
(% of total employees)4.2% 18.3% 5.3% 4.5%
Employees required to complete timesheets for any
purpose90% 76% 89% 70%
Employees required to complete timesheets for billing
clients68% 74% 82% 69%
Number of clients talked to or chatted with online with
on a typical day2.3 3.3 3.6 4.4
Firms actively looking to add staff 48% 72% 71% 58%
Clients and marketing
Number of new clients in the last 12 months 12 23 34 36.0
New clients per employee 0.8 1.5 2.3 2.4
Regretted client departures in the last 12 months
(as a % of total clients)8.4% 6% 2.3% 0.8%
Marketing investment or spend in the last 12 months $11,200 $10,500 $18,400 $5,000
Advisory revenue in the last 12 months
all types of advisory)$391,000 $241,000 $274,000 $264,000

33
Firms by number of business clients
using online accounting
6-35 36-99 100-299 300+
Pricing and billing (% of clients)
Bill for the number of hours (and partial hours) of
service provided49% 46% 43% 41%
Quote a fixed amount for the service and bill when the
work is complete23% 25% 34% 30%
Fixed-fee monthly or quarterly service plan and
automatic payment23% 9% 13% 24%
Monthly service plan and clients pay for additional
project work5% 18% 10% 5%
Another method of billing 0% 3% 0% 0%
Marketing and client communications
Number of methods used, excluding word of mouth 1.1 1.8 1.4 0.8
Word of mouth 75% 40% 50% 64%
Website and/or blog using search engine optimisation
(SEO)50% 40% 41% 18%
Social media: Facebook 13% 40% 32% 9%
Newsletters 13% 40% 18% 9%
Other social media: Twitter, LinkedIn, Instagram, etc 13% 30% 9% 18%
Industry event/award sponsorship 13% 10% 0% 18%
Online advertising / Google search engine marketing
(SEM)13% 10% 5% 0%
Print advertising 0% 10% 9% 0%
TV or radio advertising 0% 0% 0% 0%
Podcasts 0% 0% 0% 0%
Other 0% 0% 23% 9%
None of the above 0% 0% 0% 0%
Sources of new clients
Switched from another firm 47% 58% 68% 67%
New business startups 33% 28% 24% 22%
Were doing it on their own 20% 4% 7% 11%
Other 0% 10% 1% 0%
Biggest issues in the year ahead
Upskilling myself and my staff 75% 60% 43% 55%
Staying up to date with new technology 50% 90% 33% 27%
Hiring and retaining staff 38% 50% 29% 27%
Finding new clients 50% 40% 24% 18%
Other 0% 0% 24% 27%
Tough competition in the area 25% 0% 10% 0%
Table 11. Profile of midsize firms

34
Profile of large firms
This table profiles large firms (those with 20 to 49 employees including the partners)
according to their number of online business clients. It shows averages for the firms
in each group.
Firms by number of business clients
using online accounting
6-35 36-99 100-299 300+
Firm profile
Number of firms participating 4 5 18 13
Number of employees including contractors 35 35 35 35
Revenue growth in the last 12 months 20.3% 11.4% 5.6% 10.7%
Annual revenue per small business client $13,250 $6,200 $4,597 $5,846
% of business clients using online accounting today 50% 50% 48% 77%
Number of small business clients served in the
last 12 months123 120 425 654
People performance and management
Revenue per employee including contractors $72,700 $94,300 $101,400 $157,500
Number of small business clients per employee 3.5 3.4 12.1 18.7
Increase in employee compensation in most recent
cycle, excluding partners6.9% 4.8% 3.4% 5.2%
Regretted staff departures in the last 12 months
(% of total employees)0% 14.3% 6.0% 8.8%
Employees required to complete timesheets for any
purpose99% 75% 89% 88%
Employees required to complete timesheets for billing
clients99% 95% 87% 87%
Number of clients talked to or chatted with online with
on a typical day5.3 3.1 3.8 5.0
Firms actively looking to add staff 100% 95% 78% 75%
Clients and marketing
Number of new clients in the last 12 months 30 35 43 55.0
New clients per employee 0.9 1.0 1.2 1.6
Regretted client departures in the last 12 months
(as a % of total clients)3.9% 5.7% 3.1% 1.7%
Marketing investment or spend in the last 12 months $28,600 $16,100 $21,300 $41,500
Advisory revenue in the last 12 months
(all types of advisory)$234,000 $460,000 $368,000 $547,000

35
Firms by number of business clients
using online accounting
6-35 36-99 100-299 300+
Pricing and billing (% of clients)
Bill for the number of hours (and partial hours) of
service provided60% 50% 61% 48%
Quote a fixed amount for the service and bill when the
work is complete31% 16% 13% 25%
Fixed-fee monthly or quarterly service plan and
automatic payment7% 23% 19% 9%
Monthly service plan and clients pay for additional
project work3% 11% 7% 11%
Another method of billing 0% 0% 0% 8%
Marketing and client communications
Number of methods used, excluding word of mouth 3.0 1.6 2.4 1.6
Word of mouth 50% 40% 67% 15%
Website and/or blog using search engine optimisation
(SEO)75% 20% 61% 38%
Newsletters 75% 40% 44% 15%
Social media: Facebook 25% 40% 56% 38%
Other social media: Twitter, LinkedIn, Instagram, etc 50% 40% 33% 15%
Industry event/award sponsorship 25% 20% 17% 8%
Online advertising / Google search engine marketing
(SEM)25% 0% 11% 8%
Print advertising 25% 0% 11% 0%
TV or radio advertising 0% 0% 11% 15%
Podcasts 0% 0% 0% 0%
Other 0% 0% 0% 23%
None of the above 0% 0% 0% 0%
Sources of new clients
Switched from another business 60% 55% 60% 68%
New business startups 23% 24% 25% 26%
Were doing it on their own 17% 13% 11% 5%
Other 0% 8% 4% 2%
Biggest issues in the year ahead
Hiring and retaining staff 75% 80% 33% 38%
Upskilling myself and my staff 50% 40% 44% 46%
Staying up to date with new technology 50% 20% 39% 31%
Finding new clients 0% 40% 33% 31%
Tough competition in the area 0% 0% 0% 0%
Other 25% 20% 11% 8%
Table 12. Profile of large firms

36
Profile of very large firms
This table profiles very large firms (those with 50 or more employees including the
partners) according to their number of online business clients. It shows averages for the
firms in each group
As there were only a few responses from very large firms with between 36 and 99 online
clients, we’ve omitted the results from this table.
Firms by number of business
clients using online accounting
300+
Firm profile
Number of firms participating 7
Number of employees including contractors 96.4
Revenue growth in the last 12 months 7.3%
Annual revenue per small business client $8,214
% of business clients using online accounting today 58%
Number of small business clients served in the last 12 months 1121
People performance and management
Revenue per employee including contractors $99,000
Number of small business clients per employee 12.1
Increase in employee compensation in most recent cycle,
excluding partners2.6%
Regretted staff departures in the last 12 months (% of total employees) 6.3%
Employees required to complete timesheets for any purpose 93%
Employees required to complete timesheets for billing clients 95%
Number of clients talked to or chatted with online with on a typical day 6.9
Firms actively looking to add staff 77%
Clients and marketing
Number of new clients in the last 12 months 52.0
New clients per employee 0.6
Regretted client departures in the last 12 months (as a % of total clients) 2.1%
Marketing investment or spend in the last 12 months $56,600
Advisory revenue in the last 12 months (all types of advisory) $994,000
Pricing and billing (% of clients)
Bill for the number of hours (and partial hours) of service provided 57%
Quote a fixed amount for the service and bill when the work is complete 26%
Fixed-fee monthly or quarterly service plan and automatic payment 4%
Monthly service plan and clients pay for additional project work 11%
Another method of billing 1%

37
Firms by number of business
clients using online accounting
300+
Marketing and client communications
Number of methods used, excluding word of mouth 2.6
Word of mouth 43%
Print advertising 29%
Website and/or blog using search engine optimisation (SEO) 43%
Social media: Twitter, LinkedIn, Instagram, etc (excl. Facebook) 43%
Social media: Facebook 29%
Newsletters 29%
Industry event/award sponsorship 29%
Online advertising / Google search engine marketing (SEM) 14%
TV or radio advertising 14%
Podcasts 0%
Other 29%
None of the above 0%
Sources of new clients
Switched from another business 76%
New business startups 15%
Were doing it on their own 9%
Other 1%
Biggest issues in the year ahead
Upskilling myself and my staff 43%
Finding new clients 43%
Hiring and retaining staff 43%
Staying up to date with new technology 29%
Tough competition in the area 14%
Other 14%
Table 13. Profile of very large firms
38
How we can helpOnce you’ve decided that Xero is the way forward for your firm, a Xero account
manager is the perfect person to help you get going. It’s their job to help you with
every aspect of the transition to Xero, and be there for you every step of the way.
If you’re not already a Xero partner, sign up to the Xero partner program at
xero.com/partners or get in touch by emailing [email protected]
Once you’ve become a Xero partner, getting yourself and your team certified is key
to ensuring your firm understands Xero and how it can help your clients. Our most
successful partners are the ones whose teams are certified and where everyone is
singing from the same sheet. Many firms adopt a model where staff can dedicate a
percentage of their work hours (say 10%) for getting certified and staying up to date
on Xero and connected apps. This quickly becomes productive, as certified staff
are much more effective when helping clients or working on Xero-related tasks in
the business.
We understand that making a significant change within your firm isn’t easy, which is
why we’ve launched migration certification. Migration certification is perfect for
the person at your business responsible for converting a large number of your
client accounts to Xero, and is filled with guidance, resources and tools to
support the switch.
Of course, you need to keep your books current when you’re changing software,
and we have several really good options to help you including our partnership
with Jet Convert.
Talk to a Xero account manager today
We’re here to help, with Xero account managers and partner consultants standing
by ready to help you create a business plan for moving your firm forward in 2018
and beyond.

39

40
© 2018 Xero Limited | All rights reserved.
Xero and the Xero logo are registered trademarks of Xero Limited and its affiliates.