Austin Residential Sales Report | September 2011
12
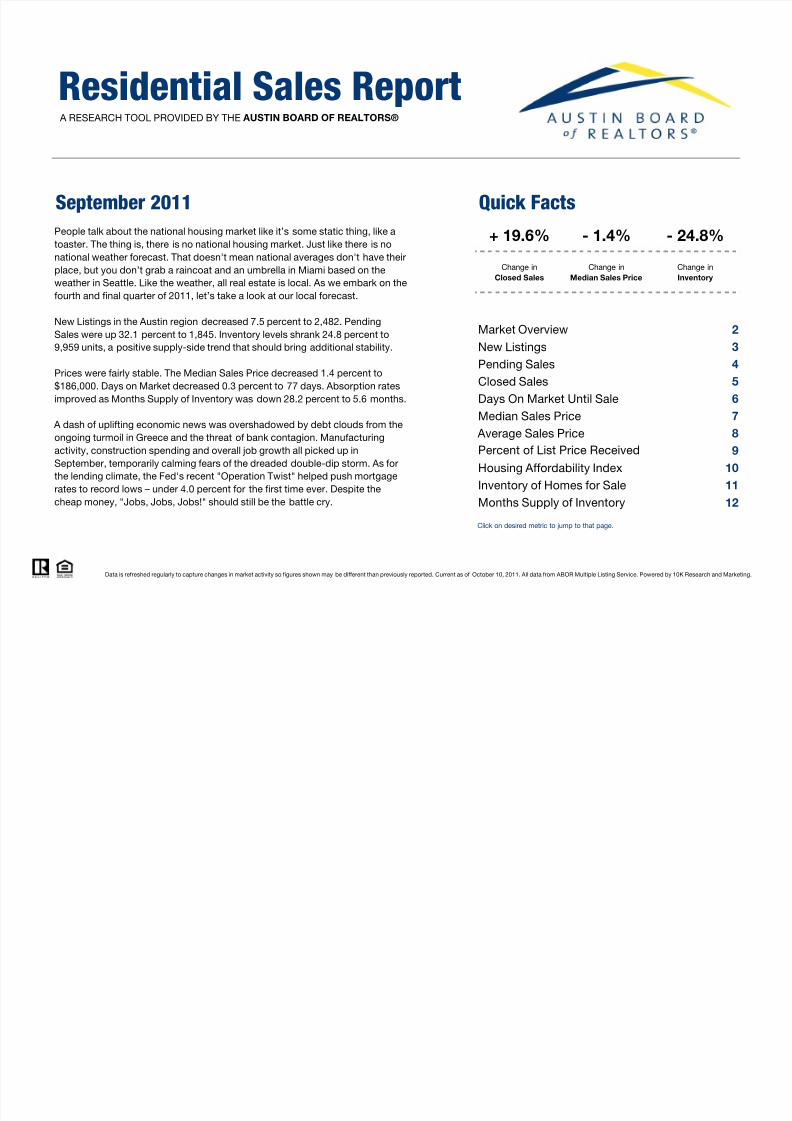
Residential Sales Report A RESEARCH TOOL PROVIDED BY THE AUSTIN BOARD OF REALTORS® September 2011 Quick Facts Market Overview 2 New Listings 3 Pending Sales 4 Closed Sales 5 Days On Market Until Sale 6 Median Sales Price 7 Average Sales Price 8 9 Housing Affordability Index 10 Inventory of Homes for Sale 11 Months Supply of Inventory 12 Data is refreshed regularly to capture changes in market activity so figures shown may be different than previously reported.Current as of October 10, 2011. All data from ABOR Multiple Listing Service. Powered by 10K Research and Marketing. - 1.4% Change in Median Sales Price Click on desired metric to jump to that page. People talk about the national housing market like it’s some static thing, like a toaster. The thing is, there is no national housing market. Just like there is no national weather forecast. That doesn't mean national averages don't have their place, but you don’t grab a raincoat and an umbrella in Miami based on the weather in Seattle. Like the weather, all real estate is local. As we embark on the fourth and final quarter of 2011, let’s take a look at our local forecast. New Listings in the Austin region decreased 7.5 percent to 2,482. Pending Sales were up 32.1 percent to 1,845. Inventory levels shrank 24.8 percent to 9,959 units, a positive supply-side trend that should bring additional stability. Prices were fairly stable. The Median Sales Price decreased 1.4 percent to $186,000. Days on Market decreased 0.3 percent to 77 days. Absorption rates improved as Months Supply of Inventory was down 28.2 percent to 5.6 months. A dash of uplifting economic news was overshadowed by debt clouds from the ongoing turmoil in Greece and the threat of bank contagion. Manufacturing activity, construction spending and overall job growth all picked up in September, temporarily calming fears of the dreaded double-dip storm. As for the lending climate, the Fed's recent "Operation Twist" helped push mortgage rates to record lows – under 4.0 percent for the first time ever. Despite the cheap money, "Jobs, Jobs, Jobs!" should still be the battle cry. - 24.8% Change in Inventory + 19.6% Change in Closed Sales Percent of List Price Received
-
Upload
bryce-cathcart -
Category
Documents
-
view
221 -
download
0
Transcript of Austin Residential Sales Report | September 2011
8/3/2019 Austin Residential Sales Report | September 2011
http://slidepdf.com/reader/full/austin-residential-sales-report-september-2011 1/12
Residential Sales ReportA RESEARCH TOOL PROVIDED BY THE AUSTIN BOARD OF REALTORS®
September 2011 Quick Facts
Market Overview 2
New Listings 3
Pending Sales 4
Closed Sales 5
Days On Market Until Sale 6
Median Sales Price 7 Average Sales Price 8
9
Housing Affordability Index 10
Inventory of Homes for Sale 11
Months Supply of Inventory 12
Data is refreshed regularly to capture changes in market activity so figures shown may be different than previously reported.Current as of October 10, 2011. All data from ABOR Multiple Listing Service. Powered by 10K Research and Marketing.
- 1.4%
Change in
Median Sales Price
Click on desired metric to jump to that page.
People talk about the national housing market like it’s some static thing, like a
toaster. The thing is, there is no national housing market. Just like there is no
national weather forecast. That doesn't mean national averages don't have their
place, but you don’t grab a raincoat and an umbrella in Miami based on the
weather in Seattle. Like the weather, all real estate is local. As we embark on the
fourth and final quarter of 2011, let’s take a look at our local forecast.
New Listings in the Austin region decreased 7.5 percent to 2,482. Pending
Sales were up 32.1 percent to 1,845. Inventory levels shrank 24.8 percent to
9,959 units, a positive supply-side trend that should bring additional stability.
Prices were fairly stable. The Median Sales Price decreased 1.4 percent to
$186,000. Days on Market decreased 0.3 percent to 77 days. Absorption rates
improved as Months Supply of Inventory was down 28.2 percent to 5.6 months.
A dash of uplifting economic news was overshadowed by debt clouds from the
ongoing turmoil in Greece and the threat of bank contagion. Manufacturing
activity, construction spending and overall job growth all picked up in
September, temporarily calming fears of the dreaded double-dip storm. As for
the lending climate, the Fed's recent "Operation Twist" helped push mortgage
rates to record lows – under 4.0 percent for the first time ever. Despite the
cheap money, "Jobs, Jobs, Jobs!" should still be the battle cry.
- 24.8%
Change in
Inventory
+ 19.6%
Change in
Closed Sales
Percent of List Price Received

8/3/2019 Austin Residential Sales Report | September 2011
http://slidepdf.com/reader/full/austin-residential-sales-report-september-2011 2/12
Market OverviewKey market metrics for the current month and year-to-date.
Key Metrics Historical Sparklines 9-2010 9-2011 + / – YTD 2010 YTD 2011 + / –
All data comes from the ABOR Multiple Listing Service. Provided by the Austin Board of REALTORS®. Powered by 10K Research and Marketing. | Click for Cover Page | 2
7.8
180 + 12.1%
- 24.8%
- 28.2%
9,959
5.6
161
--
-- --
--
--Months Supply
of Homes for Sale
Inventory of Homes for Sale
- 1.4% $188,900 $190,000
- 0.7%
- 0.3% 69 80 + 14.9%
+ 0.6%
+ 1.2% 93.7% 93.1%
- 13.4%
1,397 1,845 + 32.1% 16,243 17,549 + 8.0%
28,6102,683 2,482 - 7.5% 33,045
1,425 1,705 + 19.6% 15,803
New Listings
Pending Sales
Closed Sales
91.9% 92.9%
Housing Affordability Index
Days on Market Until Sale
Median Sales Price
Average Sales Price
Percent of Original
List Price Received
$241,609
16,400 + 3.8%
161
13,237
77 77
177 + 10.2%
--
$244,950 $252,268 + 3.0%
$188,731 $186,000
$246,668 + 2.1%
9-2008 9-2009 9-2010 9-2011
9-2008 9-2009 9-2010 9-2011
9-2008 9-2009 9-2010 9-2011
9-2008 9-2009 9-2010 9-2011
9-2008 9-2009 9-2010 9-2011
9-2008 9-2009 9-2010 9-2011
9-2008 9-2009 9-2010 9-2011
9-2008 9-2009 9-2010 9-2011
9-2008 9-2009 9-2010 9-2011
9-2008 9-2009 9-2010 9-2011
8/3/2019 Austin Residential Sales Report | September 2011
http://slidepdf.com/reader/full/austin-residential-sales-report-september-2011 3/12
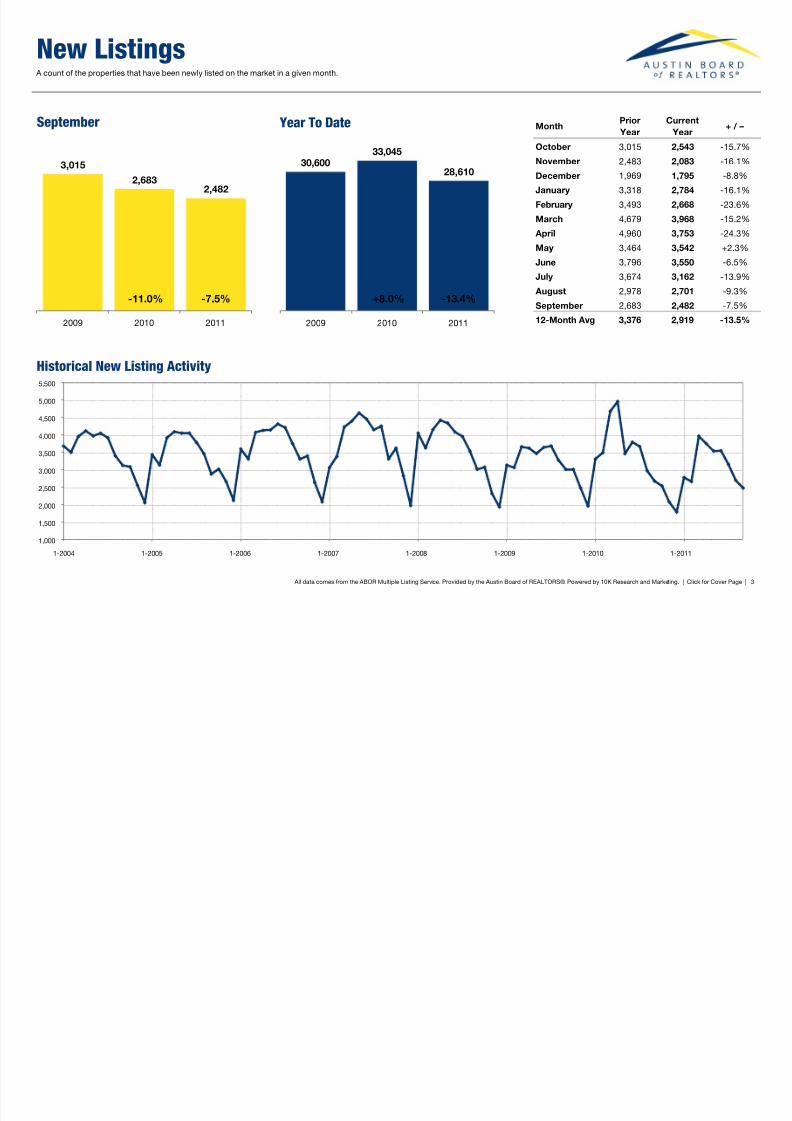
New ListingsA count of the properties that have been newly listed on the market in a given month.
Month
Prior
Year
Current
Year+ / –
October 3,015 2,543 -15.7%
November 2,483 2,083 -16.1%
December 1,969 1,795 -8.8%
January 3,318 2,784 -16.1%
February 3,493 2,668 -23.6%
March 4,679 3,968 -15.2%
April 4,960 3,753 -24.3%
May 3,464 3,542 +2.3%
June 3,796 3,550 -6.5%
July 3,674 3,162 -13.9% August 2,978 2,701 -9.3%
September 2,683 2,482 -7.5%
12-Month Avg 3,376 2,919 -13.5%
All data comes from the ABOR Multiple Listing Service. Provided by the Austin Board of REALTORS®. Powered by 10K Research and Marketing. | Click for Cover Page | 3
3,015
2,6832,482
2009 2010 2011
September
1,000
1,500
2,000
2,500
3,000
3,500
4,000
4,500
5,000
5,500
1-2004 1-2005 1-2006 1-2007 1-2008 1-2009 1-2010 1-2011
Historical New Listing Activity
30,60033,045
28,610
2009 2010 2011
Year To Date
-13.4%-11.0% -7.5% +8.0%
8/3/2019 Austin Residential Sales Report | September 2011
http://slidepdf.com/reader/full/austin-residential-sales-report-september-2011 4/12
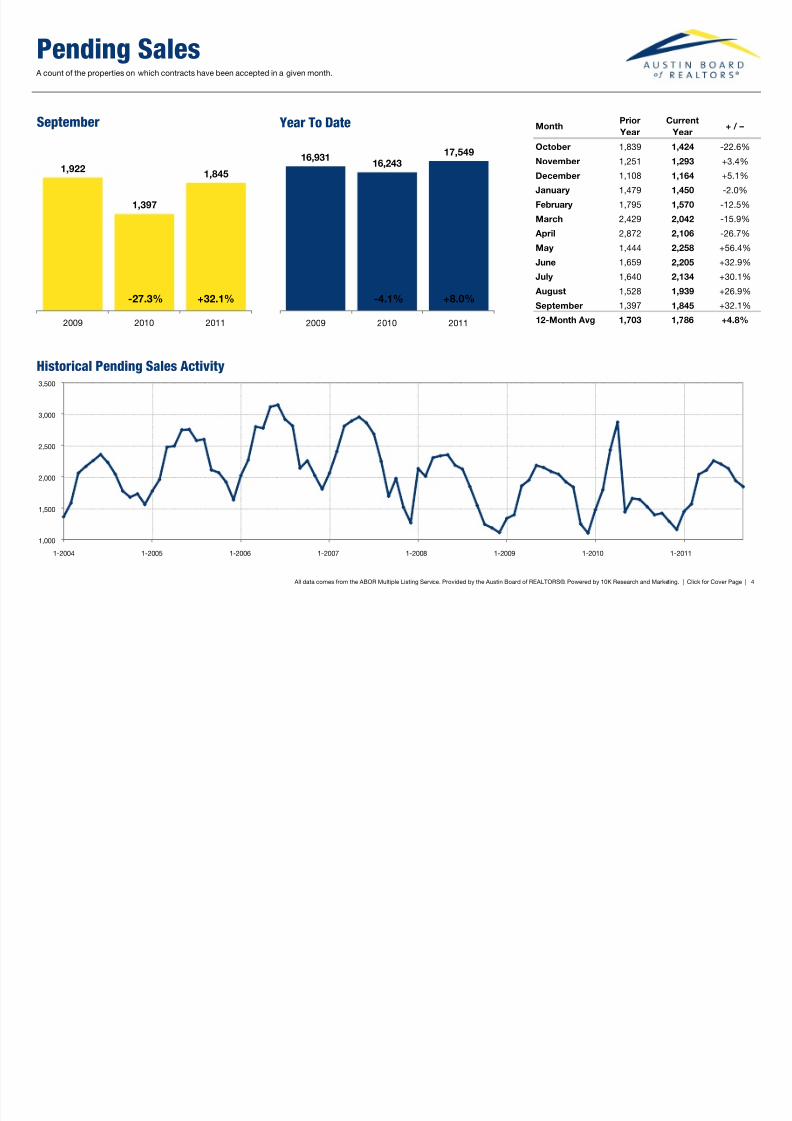
Pending SalesA count of the properties on which contracts have been accepted in a given month.
Month
Prior
Year
Current
Year+ / –
October 1,839 1,424 -22.6%
November 1,251 1,293 +3.4%
December 1,108 1,164 +5.1%
January 1,479 1,450 -2.0%
February 1,795 1,570 -12.5%
March 2,429 2,042 -15.9%
April 2,872 2,106 -26.7%
May 1,444 2,258 +56.4%
June 1,659 2,205 +32.9%
July 1,640 2,134 +30.1% August 1,528 1,939 +26.9%
September 1,397 1,845 +32.1%
12-Month Avg 1,703 1,786 +4.8%
All data comes from the ABOR Multiple Listing Service. Provided by the Austin Board of REALTORS®. Powered by 10K Research and Marketing. | Click for Cover Page | 4
1,922
1,397
1,845
2009 2010 2011
September
1,000
1,500
2,000
2,500
3,000
3,500
1-2004 1-2005 1-2006 1-2007 1-2008 1-2009 1-2010 1-2011
Historical Pending Sales Activity
16,93116,243
17,549
2009 2010 2011
Year To Date
+8.0%-27.3% +32.1% -4.1%

8/3/2019 Austin Residential Sales Report | September 2011
http://slidepdf.com/reader/full/austin-residential-sales-report-september-2011 5/12
Closed SalesA count of the actual sales that have closed in a given month.
Month
Prior
Year
Current
Year+ / –
October 1,969 1,346 -31.6%
November 1,745 1,340 -23.2%
December 1,519 1,573 +3.6%
January 993 1,059 +6.6%
February 1,264 1,225 -3.1%
March 2,011 1,781 -11.4%
April 2,252 1,857 -17.5%
May 2,307 2,082 -9.8%
June 2,211 2,354 +6.5%
July 1,654 2,167 +31.0% August 1,686 2,170 +28.7%
September 1,425 1,705 +19.6%
12-Month Avg 1,753 1,722 -0.1%
All data comes from the ABOR Multiple Listing Service. Provided by the Austin Board of REALTORS®. Powered by 10K Research and Marketing. | Click for Cover Page | 5
1,959
1,425
1,705
2009 2010 2011
September
500
1,000
1,500
2,000
2,500
3,000
3,500
1-2004 1-2005 1-2006 1-2007 1-2008 1-2009 1-2010 1-2011
Historical Closed Sales Activity
15,678 15,80316,400
2009 2010 2011
Year To Date
+3.8%-27.3% +19.6% +0.8%
8/3/2019 Austin Residential Sales Report | September 2011
http://slidepdf.com/reader/full/austin-residential-sales-report-september-2011 6/12
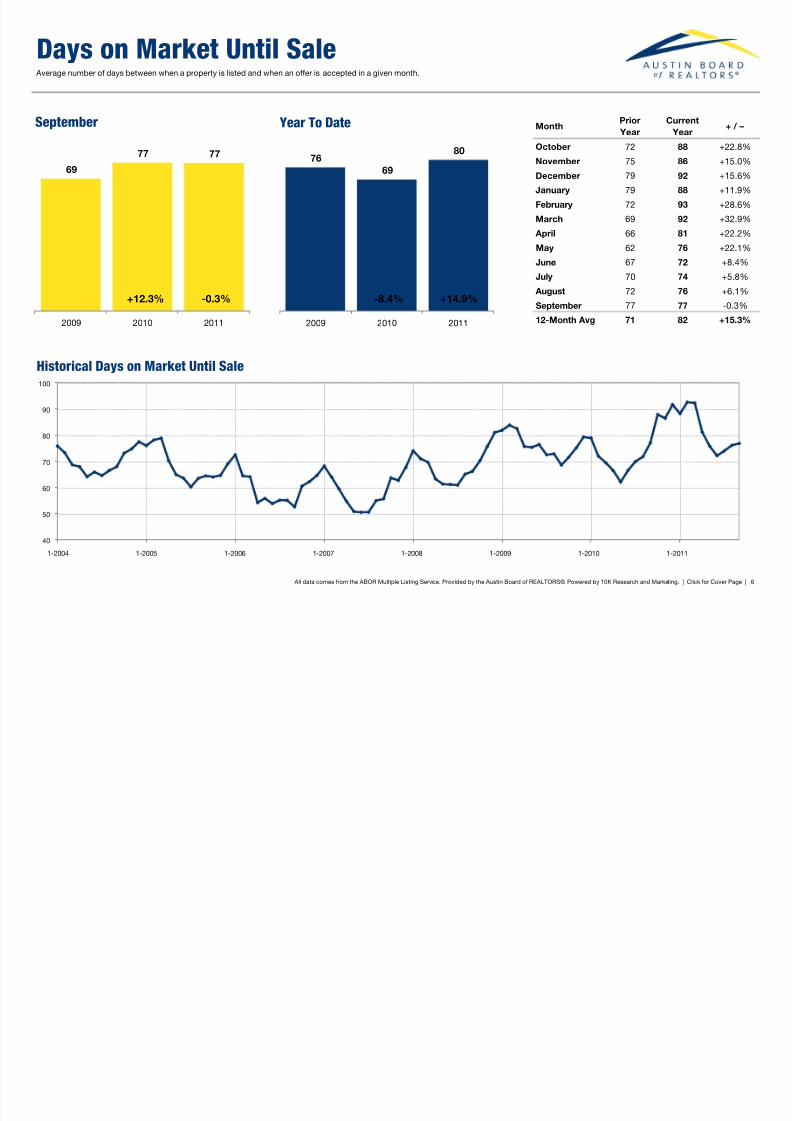
Days on Market Until SaleAverage number of days between when a property is listed and when an offer is accepted in a given month.
Month
Prior
Year
Current
Year+ / –
October 72 88 +22.8%
November 75 86 +15.0%
December 79 92 +15.6%
January 79 88 +11.9%
February 72 93 +28.6%
March 69 92 +32.9%
April 66 81 +22.2%
May 62 76 +22.1%
June 67 72 +8.4%
July 70 74 +5.8% August 72 76 +6.1%
September 77 77 -0.3%
12-Month Avg 71 82 +15.3%
All data comes from the ABOR Multiple Listing Service. Provided by the Austin Board of REALTORS®. Powered by 10K Research and Marketing. | Click for Cover Page | 6
69
77 77
2009 2010 2011
September
40
50
60
70
80
90
100
1-2004 1-2005 1-2006 1-2007 1-2008 1-2009 1-2010 1-2011
Historical Days on Market Until Sale
7669
80
2009 2010 2011
Year To Date
+14.9%+12.3% -0.3% -8.4%
8/3/2019 Austin Residential Sales Report | September 2011
http://slidepdf.com/reader/full/austin-residential-sales-report-september-2011 7/12
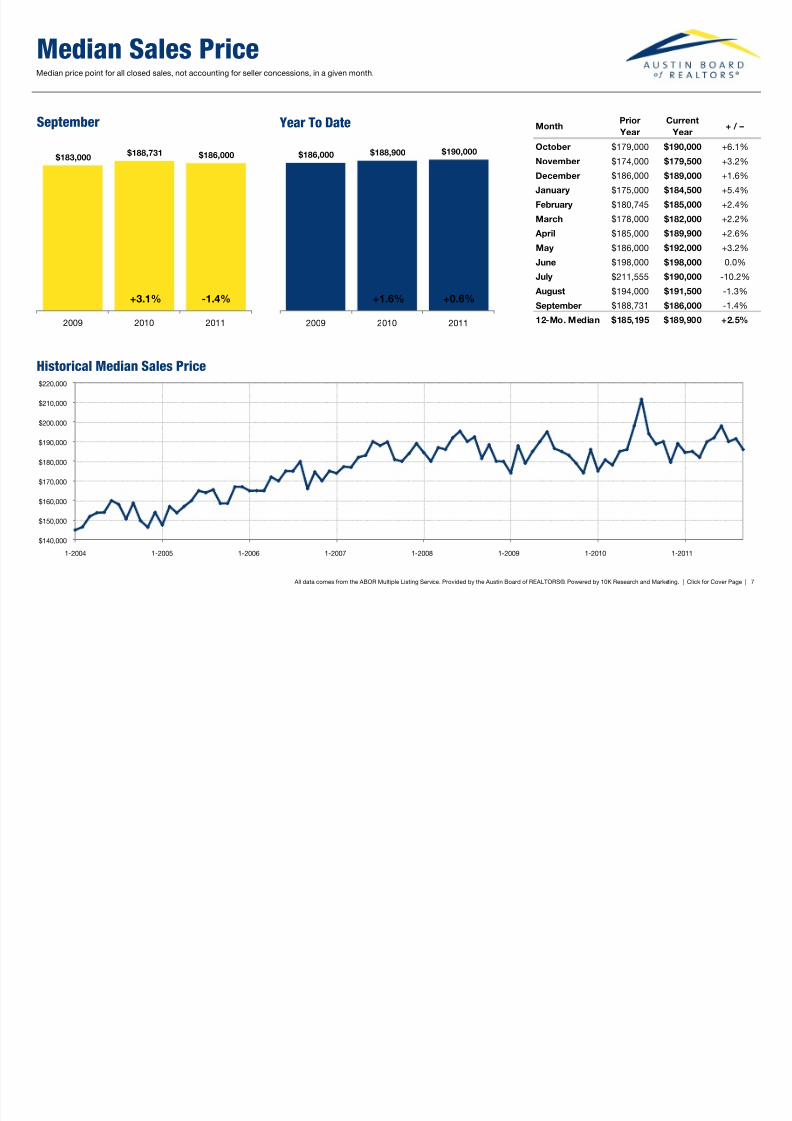
Median Sales PriceMedian price point for all closed sales, not accounting for seller concessions, in a given month.
Month
Prior
Year
Current
Year+ / –
October $179,000 $190,000 +6.1%
November $174,000 $179,500 +3.2%
December $186,000 $189,000 +1.6%
January $175,000 $184,500 +5.4%
February $180,745 $185,000 +2.4%
March $178,000 $182,000 +2.2%
April $185,000 $189,900 +2.6%
May $186,000 $192,000 +3.2%
June $198,000 $198,000 0.0%
July $211,555 $190,000 -10.2% August $194,000 $191,500 -1.3%
September $188,731 $186,000 -1.4%
12-Mo. Median $185,195 $189,900 +2.5%
All data comes from the ABOR Multiple Listing Service. Provided by the Austin Board of REALTORS®. Powered by 10K Research and Marketing. | Click for Cover Page | 7
$183,000$188,731 $186,000
2009 2010 2011
September
$140,000
$150,000
$160,000
$170,000
$180,000
$190,000
$200,000
$210,000
$220,000
1-2004 1-2005 1-2006 1-2007 1-2008 1-2009 1-2010 1-2011
Historical Median Sales Price
$186,000 $188,900 $190,000
2009 2010 2011
Year To Date
+0.6%+3.1% -1.4% +1.6%

8/3/2019 Austin Residential Sales Report | September 2011
http://slidepdf.com/reader/full/austin-residential-sales-report-september-2011 8/12
Average Sales PriceAverage sales price for all closed sales, not accounting for seller concessions, in a given month.
Month
Prior
Year
Current
Year+ / –
October $232,209 $255,409 +10.0%
November $231,094 $243,559 +5.4%
December $248,772 $245,024 -1.5%
January $233,052 $241,053 +3.4%
February $233,103 $237,568 +1.9%
March $230,812 $241,053 +4.4%
April $228,668 $260,093 +13.7%
May $236,487 $260,126 +10.0%
June $265,235 $262,811 -0.9%
July $275,446 $254,955 -7.4% August $257,321 $251,288 -2.3%
September $241,609 $246,668 +2.1%
12-Month Avg $242,885 $251,356 +3.5%
All data comes from the ABOR Multiple Listing Service. Provided by the Austin Board of REALTORS®. Powered by 10K Research and Marketing. | Click for Cover Page | 8
$234,565 $241,609 $246,668
2009 2010 2011
September
$180,000
$190,000
$200,000
$210,000
$220,000
$230,000
$240,000
$250,000
$260,000
$270,000
$280,000
1-2004 1-2005 1-2006 1-2007 1-2008 1-2009 1-2010 1-2011
Historical Average Sales Price
$236,315$244,950 $252,268
2009 2010 2011
Year To Date
+ 3.0%+ 3.0% + 2.1% + 3.7%
8/3/2019 Austin Residential Sales Report | September 2011
http://slidepdf.com/reader/full/austin-residential-sales-report-september-2011 9/12
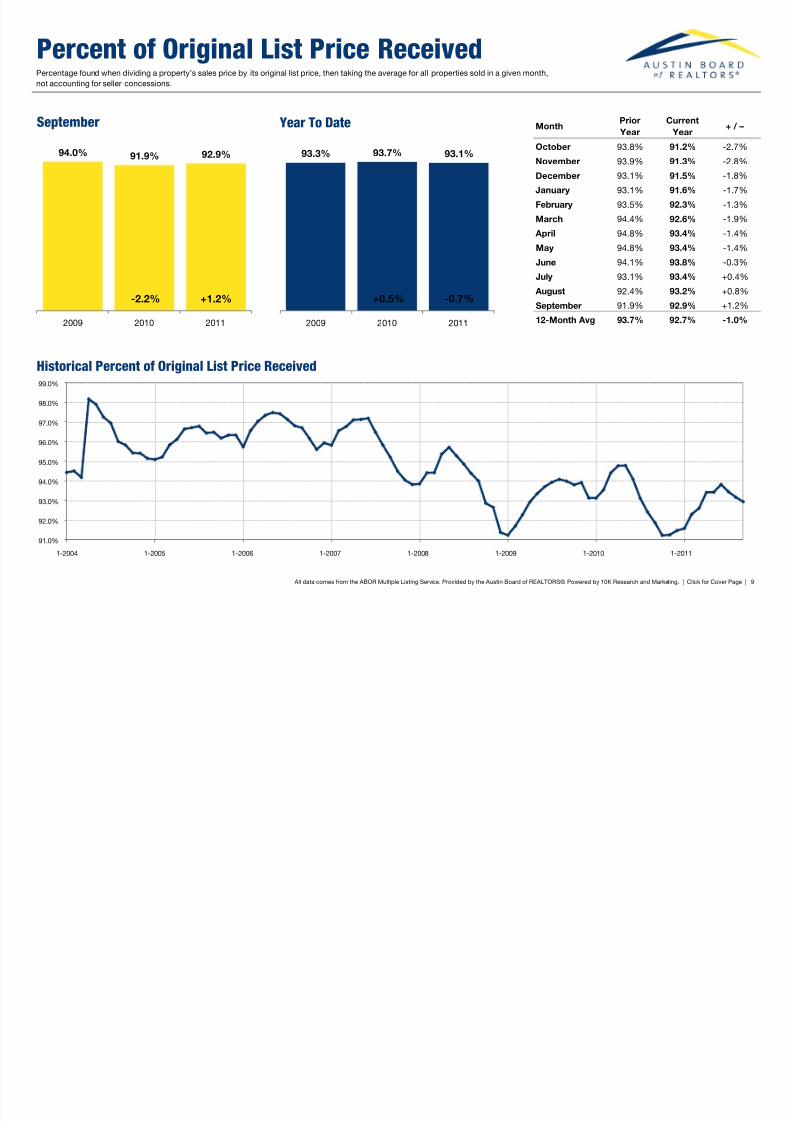
Percent of Original List Price Received
Month
Prior
Year
Current
Year+ / –
October 93.8% 91.2% -2.7%
November 93.9% 91.3% -2.8%
December 93.1% 91.5% -1.8%
January 93.1% 91.6% -1.7%
February 93.5% 92.3% -1.3%
March 94.4% 92.6% -1.9%
April 94.8% 93.4% -1.4%
May 94.8% 93.4% -1.4%
June 94.1% 93.8% -0.3%
July 93.1% 93.4% +0.4% August 92.4% 93.2% +0.8%
September 91.9% 92.9% +1.2%
12-Month Avg 93.7% 92.7% -1.0%
All data comes from the ABOR Multiple Listing Service. Provided by the Austin Board of REALTORS®. Powered by 10K Research and Marketing. | Click for Cover Page | 9
Percentage found when dividing a property’s sales price by its original list price, then taking the average for all properties sold in a given month,
not accounting for seller concessions.
94.0% 91.9% 92.9%
2009 2010 2011
September
91.0%
92.0%
93.0%
94.0%
95.0%
96.0%
97.0%
98.0%
99.0%
1-2004 1-2005 1-2006 1-2007 1-2008 1-2009 1-2010 1-2011
Historical Percent of Original List Price Received
93.3% 93.7% 93.1%
2009 2010 2011
Year To Date
-0.7%-2.2% +1.2% +0.5%

8/3/2019 Austin Residential Sales Report | September 2011
http://slidepdf.com/reader/full/austin-residential-sales-report-september-2011 10/12
Housing Affordability Index
MonthPrior
Year
Current
Year + / –
October 159 161 +1.3%
November 165 170 +2.7%
December 151 160 +6.2%
January 162 168 +4.1%
February 157 167 +6.3%
March 160 171 +7.1%
April 154 166 +7.7%
May 154 168 +8.9%
June 149 165 +10.4%July 144 170 +18.2%
August 157 174 +10.7%
September 161 180 +12.1%
12-Month Avg 156 168 +8.0%
This index measures housing affordability for the region. An index of 120 means the median household income was 120% of what is necessary
to qualify for the median-priced home under prevailing interest rates. A higher number means greater affordability.
All data comes from the ABOR Multiple Listing Service. Provided by the Austin Board of REALTORS®. Powered by 10K Research and Marketing. | Click for Cover Page | 10
156 161
180
2009 2010 2011
September
120
130
140
150
160
170
180
1-2004 1-2005 1-2006 1-2007 1-2008 1-2009 1-2010 1-2011
Historical Housing Affordability Index
154161
177
2009 2010 2011
Year To Date
+10.2%+3.2% +12.1% +4.6%

8/3/2019 Austin Residential Sales Report | September 2011
http://slidepdf.com/reader/full/austin-residential-sales-report-september-2011 11/12
Inventory of Homes for SaleThe number of properties available for sale in active status at the end of a given month.
Month
Prior
Year
Current
Year+ / –
October 11,162 12,402 +11.1%
November 10,869 11,333 +4.3%
December 9,870 10,001 +1.3%
January 10,509 10,082 -4.1%
February 11,170 10,267 -8.1%
March 12,198 11,159 -8.5%
April 13,096 11,830 -9.7%
May 13,775 12,036 -12.6%
June 14,340 12,086 -15.7%
July 14,637 11,779 -19.5% August 13,956 10,970 -21.4%
September 13,237 9,959 -24.8%
12-Month Avg 12,402 11,159 -9.0%
All data comes from the ABOR Multiple Listing Service. Provided by the Austin Board of REALTORS®. Powered by 10K Research and Marketing. | Click for Cover Page | 11
11,526
13,237
9,959
2009 2010 2011
September
8,000
9,000
10,000
11,000
12,000
13,000
14,000
15,000
1-2004 1-2005 1-2006 1-2007 1-2008 1-2009 1-2010 1-2011
Historical Inventory of Homes for Sale
-24.8%+3.2%
8/3/2019 Austin Residential Sales Report | September 2011
http://slidepdf.com/reader/full/austin-residential-sales-report-september-2011 12/12
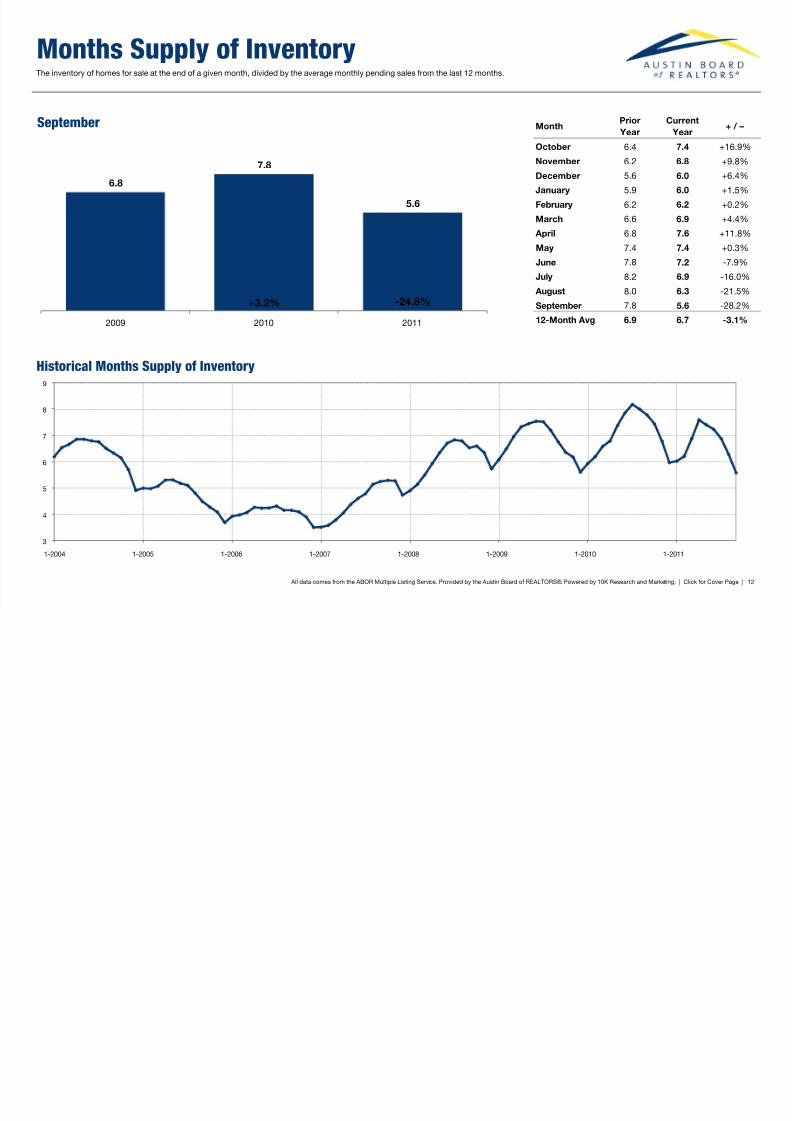
Months Supply of InventoryThe inventory of homes for sale at the end of a given month, divided by the average monthly pending sales from the last 12 months.
Month
Prior
Year
Current
Year+ / –
October 6.4 7.4 +16.9%
November 6.2 6.8 +9.8%
December 5.6 6.0 +6.4%
January 5.9 6.0 +1.5%
February 6.2 6.2 +0.2%
March 6.6 6.9 +4.4%
April 6.8 7.6 +11.8%
May 7.4 7.4 +0.3%
June 7.8 7.2 -7.9%
July 8.2 6.9 -16.0% August 8.0 6.3 -21.5%
September 7.8 5.6 -28.2%
12-Month Avg 6.9 6.7 -3.1%
All data comes from the ABOR Multiple Listing Service. Provided by the Austin Board of REALTORS®. Powered by 10K Research and Marketing. | Click for Cover Page | 12
6.8
7.8
5.6
2009 2010 2011
September
3
4
5
6
7
8
9
1-2004 1-2005 1-2006 1-2007 1-2008 1-2009 1-2010 1-2011
Historical Months Supply of Inventory
-24.8%+3.2%