AUSDRILL LIMITED
36
1 AUSDRILL LIMITED Investor Update November 2008
Transcript of AUSDRILL LIMITED

1
AUSDRILL LIMITEDInvestor Update
November 2008

2
FY2008 Performance
Record revenue $391.0 million
Record profit after tax $35.3 million
Record earnings per share 22.7 cents
Record dividends per share 11.0 cents
Record Order Book $1.4 billion
3
FY2008 Highlights• Life of Mine mining contract with Gold Fields at Damang to 2014
• Letter of Intent and Authority for $300+ million contract expansion with
Fortescue Metals Group to 2013
• Development of the 50/50 JV with Barminco including the award of
US$132 million contract with Red Back Mining
• Successful capital raising of $95.7m net of costs
• Acquisition of the remaining 50% of Remet Engineers Pty Ltd
• Successful defence of Macmahon’s hostile takeover bid

4
Operating Divisions - Mining
* Discipline charts based on operating revenues for the year to 30 June 2008 and is pre consolidation and eliminations
FY08
Mining25%
2008 Revenue

5
Operating Divisions – Exploration Drilling
2008 Revenue
Exploration22%
* Discipline charts based on operating revenues for the year to 30 June 2008 and is pre consolidation and eliminations

6
Operating Divisions – Drill and Blast
2008 Revenue
Drill and Blast24%
* Discipline charts based on operating revenues for the year to 30 June 2008 and is pre consolidation and eliminations

7
Operating Divisions - Services
Diamond Communications
Construction services for the utility sector, majority of services to the telecommunications and power industries.
Provides network rollout, upgrade, and maintenance services.
Drilling Tools Australia
Manufacturing business based in Canning Vale, WA producing product predominantly for internal consumption.
Product lines include drilling consumables and spare parts.
Supply DirectProcurement and logistic services worldwide with offices in Australia, the UK, South Africa, and in Ghana with Logistics Direct.
2008 Revenue
Manufacturing6%
Other23%
* Discipline charts based on operating revenues for the year to 30 June 2008 and is pre consolidation and eliminations

8
2008 Revenue
Manufacturing6%
Other23%
Mining25%
Exploration22%
Drill and Blast24%
* Discipline charts based on operating revenues for the year to 30 June 2008 and for the first 4 months of FY 2009 and is pre consolidation and eliminations
Revenue Comparisonby Division
The balance of our business is changing with the continued growth of our mining business
2009 Revenue (first four months)
Drill and Blast20%
Exploration21%
Mining35%
Manufacturing6%
Other18%

9
Revenue Comparisonby Commodity
* Commodity charts based on operating revenues for the year to 30 June 2008 and for the first 4 months of FY 2009 and is pre consolidation and eliminations
2008 Revenue by Commodity
Gold70%
Nickel9%
Iron Ore16%
Civil5%
2009 Revenue by Commodity (first four months)
Gold70%
Nickel6%
Iron Ore22%
Civil2%

10
Revenue Distribution by Region
The balance of our business is changing with the continued growth of our African business
* Region charts based on operating revenues for the year to 30 June 2008 and for the first 4 months of FY 2009 and is pre consolidation and eliminations
2008 Revenue by Region
Australia65%
Africa34%
UK1%
2009 Revenue by Region (first four months)
Australia56%
Africa43%
UK1%

11
• Established by Ron Sayers in 1987 as a Drill and Blast contractor
• Purchased the assets of the Drilling Division of Seltrust Mining / BP Minerals International in 1989
• Commenced operations in Ghana in 1991
• Initial Public Offering – 1994
• Purchased the assets of the Drilling Department of the WMC Kambalda based nickel and gold operations in 1996
• Formed African Mining Services with Eltin Limited in 1996
• Purchased 50% of Diamond Communications in 1999
• Formed Ausdrill Northwest Pty Ltd and purchased the assets of drilling contractor Drillex in 2003
• Purchased 50% of Remet Engineers in 2003
• Commenced operations of Drilling Tools Australia manufacturing company in 2005
• Acquired remaining 50% of African Mining Services (Ghana) in 2005
• Acquired remaining 50% of Remet Engineers in 2008
History and Key Milestones
12
$0.00
$0.50
$1.00
$1.50
$2.00
$2.50
$3.00
94 95 96 97 98 99 00 01 02 03 04 05 06 07 08
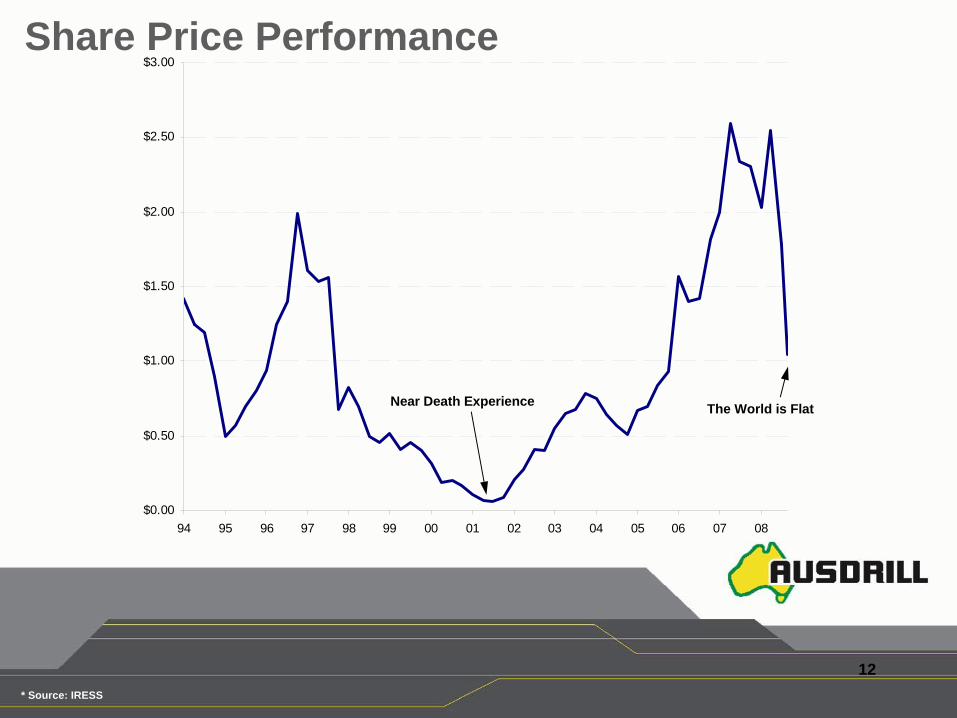
Share Price Performance
Near Death Experience The World is Flat
* Source: IRESS

13
Track Record of Delivering Outstanding Growth
NPAT (000's)(Includes discontinued operations)
$
$5
$10
$15
$20
$25
$30
$35
$40
FY02 FY03 FY04 FY05 FY06 FY07 FY08
EPS
0.00 cps
5.00 cps
10.00 cps
15.00 cps
20.00 cps
25.00 cps
FY02 FY03 FY04 FY05 FY06 FY07 FY08
Dividends per Share
0.00 cps
2.00 cps
4.00 cps
6.00 cps
8.00 cps
10.00 cps
12.00 cps
FY02 FY03 FY04 FY05 FY06 FY07 FY08
Sales Revenue
$.0 m
$.1 m
$.1 m
$.2 m
$.2 m
$.3 m
$.3 m
$.4 m
$.4 m
$.5 m
FY02 FY03 FY04 FY05 FY06 FY07 FY08
1
1 Note FY08 EPS impacted by issue of 38.5m shares pursuant to Placement and SPP

14
Incremental Half-Yearly Margin Growth
EBITDA
EBIT10.5%
12.1%14.8%
17.1% 17.4%19.2% 19.4%
22.2% 23.1%
15.6%
11.9%10.7%
Dec
-05
Jun-
06
Dec
-06
Jun-
07
Dec
-07
Jun-
08

15
• Ron SayersManaging DirectorFounding owner of the business in 1987, over 40 years experience in the Mining Industry
• Alex McCullochGeneral Manager – Australian Operations5 years with Ausdrill, 25 years experience in the Mining Industry
• Andrew BroadGeneral Manager – Strategic Development15 years with Ausdrill, 20 years experience in the Mining Industry
• John KavanaghGeneral Manager African Mining ServicesAssociated with Ausdrill for over 15 years, 15 years experience in the Mining Industry in Ghana
• Mark HughesChief Financial Officer13 years with Ausdrill, 11 Years with Coopers & Lybrand
• Brian MannGeneral Manager Kalgoorlie Operations19 years with Ausdrill, 40 years experience in the Exploration Drilling Industry
Senior Management

16
• Ausdrill Group Employs over 2,700 people
– Australia – 1,030 personnel
– Africa – 1,670 personnel (Including 58 Expats)
• 200 Salaried Staff with an average tenure of 4.7 years
• No union involvement in Australia, Unionised workforce in Ghana
Personnel

17
A “Blue Chip” Client List

18
Outlook

19
Order Book
Surface Mining
Drill & Blast
ExplorationUnderground Mining
• At 2008 run rates – 3 years work in hand
• At 2009 run rates – 2 years work in hand
Order Book does not include Christmas Creek Expansion works under a Letter of Intent
Gold Fields – 45%
Redback – 13%
Other – 14%
FMG – 13%KCGM – 9%BHPB – 6%
Millions Millions
Total $1,375m • Total $1,375mTotal $1,375m
637
365
244
129
616
181
180
12379
195

20
Revenue Comparison - Group 2008 v 2009
Revenue run rate up 50%
* Charts based on operating revenues for the year to 30 June 2008 and for the first 4 months of FY 2009 and is pre consolidation and eliminations
Group Comparison
0
10,000
20,000
30,000
40,000
50,000
60,000
July Aug Sep Oct Nov Dec Jan Feb Mar April May June
20082009
,000

21
Revenue Comparison - Exploration 2008 v 2009
Long-term contracts with Blue Chip clients at good margins
* Charts based on operating revenues for the year to 30 June 2008 and for the first 4 months of FY 2009 and is pre consolidation and eliminations
Exploration
0
2,000
4,000
6,000
8,000
10,000
12,000
July Aug Sep Oct Nov Dec Jan Feb Mar April May June
20082009
,000

22
Growth in Exploration Revenue2000 to 2008
0
10
20
30
40
50
60
70
80
90
100
2000 2001 2002 2003 2004 2005 2006 2007 2008
Mill
ions
Expl
orat
ion
Rev
enue
23
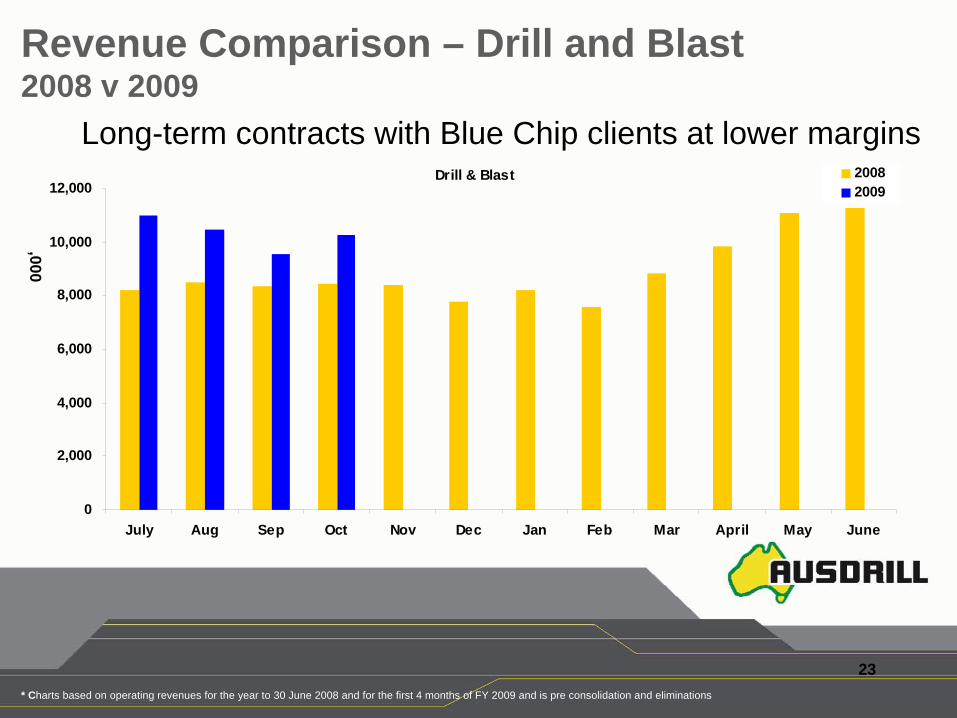
Revenue Comparison – Drill and Blast 2008 v 2009
Long-term contracts with Blue Chip clients at lower margins
* Charts based on operating revenues for the year to 30 June 2008 and for the first 4 months of FY 2009 and is pre consolidation and eliminations
Drill & Blast
0
2,000
4,000
6,000
8,000
10,000
12,000
July Aug Sep Oct Nov Dec Jan Feb Mar April May June
20082009
,000

24
Revenue Comparison – Mining Africa 2008 v 2009
Long-term contracts with Blue Chip clients at lower margins with positive USD exposure in current FX environment
* Charts based on operating revenues for the year to 30 June 2008 and for the first 4 months of FY 2009 and is pre consolidation and eliminations
Mining Africa
0
5,000
10,000
15,000
20,000
25,000
July Aug Sep Oct Nov Dec Jan Feb Mar April May June
20082009
,000

25
Revenue Comparison – Mining Australia 2008 v 2009
Establishing a new business from scratch
* Charts based on operating revenues for the year to 30 June 2008 and for the first 4 months of FY 2009 and is pre consolidation and eliminations
Mining Australia
0
200
400
600
800
1,000
1,200
Feb-08 Mar-08 Apr-08 May-08 Jun-08 Jul-08 Aug-08 Sep-08 Oct-08
,000

26
Revenue Comparison - Manufacturing 2008 v 2009
Most potential in the Group
* Charts based on operating revenues for the year to 30 June 2008 and for the first 4 months of FY 2009 and is pre consolidation and eliminations
Manufacturing
0
500
1,000
1,500
2,000
2,500
3,000
3,500
July Aug Sep Oct Nov Dec Jan Feb Mar April May June
20082009
,000

27
Revenue Growth
Strong first quarterStill targeting annual NPAT growth of at least 20%
• Revenue up 50%• Blue chip client base• Secured long term work• Record order book• 70% reliant on gold• Impact of USD v AUD • Low Net Gearing• New Drill & Blast clients• Quality of People will improve• We are still Ausdrill
• 3 new jobs with low margins on start up• 1 new job only to Christmas - Iduapriem• 6 exploration drills out of a fleet of 54 parked up• Pressure will be on margins for new work• Project financing constraints for our clients• Equipment financing constraints• Volatility in commodity prices• China slowdown
Current 2009 FY - The PositivesCurrent 2009 FY The Negatives
* Charts based on operating revenues for the year to 30 June 2008 and for the first 4 months of FY 2009 and is pre consolidation and eliminations
Group Comparison
0
10,000
20,000
30,000
40,000
50,000
60,000
July Aug Sep Oct Nov Dec Jan Feb Mar April May June
20082009

28
$0
$20,000
$40,000
$60,000
$80,000
$100,000
$120,000
$140,000
$160,000
FY00 FY01 FY02 FY03 FY04 FY05 FY06 FY07 FY08 FY09
Plant Property Revenue
Revenue Growth v’s CAPEX Budgeted CAPEX FY09 - $100 million (under review)

29
Peer Comparison

30
0cps
5cps
10cps
15cps
20cps
25cps
30cps
DOW ASL NWH AJL MAH IMD BYL BDL SWK$0m
$250m
$500m
$750m
$1,000m
$1,250m
DOW MAH NWH AJL ASL BYL BDL IMD SWK
-5cps
5cps
15cps
25cps
35cps
45cps
55cps
DOW AJL ASL NWH IMD MAH SWK BDL BYL
Revenue, EPS & DPS Comparison
* Source: IRESS, Company Reports
Revenue (FY08) EPS (FY08)
DPS (FY08)
$5,445m

31
YieldYield (FY08) Yield (19/11/2008)
0%
4%
8%
12%
16%
20%
24%
NWH MAH BYL ASL IMD DOW AJL BDL SWK0.0%
1.5%
3.0%
4.5%
6.0%
BYL ASL NWH DOW MAH IMD AJL BDL SWK
* Source: IRESS, Company Reports

32
NTA Comparison (Total $ & NTA $/Share)NTA (FY08) NTA / share (FY08)
$0m
$100m
$200m
$300m
$400m
$500m
$600m
$700m
DOW ASL MAH NWH SWK AJL BDL BYL IMD$0.00
$0.25
$0.50
$0.75
$1.00
$1.25
$1.50
$1.75
$2.00
DOW ASL AJL SWK MAH NWH BYL IMD BDL
* Source: IRESS, Company Reports

33
Ausdrill’s NTA is Real – as at 30/06/2008
• Cash $88 million Underwrites strong growth
• Property $41 million Associated debt of $6 million
• Stock $55 million Stringent obsolescence policy
• Plant and Equipment $235 million Aggressive depreciation policy

34
0%
200%
400%
600%
800%
1000%
1200%
1400%
BYL ASL BDL SWK DOW MAH NWH AJL IMD0%
100%
200%
300%
400%
500%
600%
700%
800%
ASL BYL BDL SWK MAH NWH DOW IMD AJL
Share Price Premium / NTA per Share BackingShare Price / NTA per share (FY08) Share Price / NTA per share (19/11/08)
* Source: IRESS, Company Reports

35
Summary• Extremely robust operational and financial position
• Well capitalised balance sheet with a large cash balance, low gearing
and strong interest cover
• Continues to perform strongly against peers
• Prudent CAPEX management and favourable FX movements to
underpin short term performance
• Well positioned for growth in a challenging market environment
• Current guidance maintained

Ausdrill Limited Investor Presentation
36
Important Notice and DisclaimerThis Presentation has been prepared by Ausdrill Limited (ABN 95 009 211 474) (“Ausdrill”) as a summary of Ausdrill’s results and for general information purposes only. This Presentation is not intended to be an offer, invitation, solicitation or recommendation with respect to Ausdrill securities and does not purport to cover all relevant information about any potential investment in Ausdrill. Neither the provision of this Presentation nor any information contained in this Presentation or subsequently communicated to any person in connection with this Presentation is, or should be taken as, constituting the giving of legal, tax, accounting, investment or financial product advice to any person. This Presentation must not be relied on to make an investment or other financial decision and recipients should seek appropriate advice or conduct their own investigations, enquiries and analysis and should place no reliance on this Presentation in evaluating any potential investment decision regarding Ausdrill securities.
This Presentation, including opinions set out in it, is based on information compiled or prepared by Ausdrill from sources believed to be reliable, although no attempt has been made to verify such information. No representation or warranty, express or implied, is made as to the accuracy, currency, reliability, legality or completeness of the information in this Presentation. Ausdrill has no obligation to tell recipients if it becomes aware of any inaccuracy in or omission from the information in this Presentation. Ausdrill, its related bodies corporate and the officers, directors, employees, advisers and agents of Ausdrill and its related bodies corporate do not accept any responsibility or liability (including in negligence) for this Presentation or its contents. This does not apply to the extent that liability by law cannot be excluded.
This Presentation contains forward-looking statements. Ausdrill undertakes no obligation to update any forward-looking statements for events or circumstances that occur subsequent to such statements or to keep current any of the information provided. Any estimates or projections as to events that may occur in the future (including projections of revenue, expense, net income and performance) are based upon assumptions (which may differ from the actual circumstances which may arise) and the best judgement of Ausdrill and there is no guarantee that any of these estimates or projections will be achieved. Forecasts and projections are by their nature subject to significant uncertainties and contingencies. Actual results will vary from any projections and such variations may be material. Past performance is no guarantee of future performance.
By accepting this Presentation, you acknowledge and agree to be bound by each of the foregoing statements.