AUSABLE BAYFIELD ASSESSMENT REPORT: CHAPTER 4 · Table 4.25 Harbour Lights WHPA: Issues and...
76
AUSABLE BAYFIELD ASSESSMENT REPORT: CHAPTER 4 VULNERABILITY, THREATS AND RISKS Draft for Consultation
Transcript of AUSABLE BAYFIELD ASSESSMENT REPORT: CHAPTER 4 · Table 4.25 Harbour Lights WHPA: Issues and...

AUSABLE BAYFIELD ASSESSMENT REPORT: CHAPTER 4
VULNERABILITY, THREATS AND RISKS
Draft for Consultation

Draft for Consultation

Ausable Bayfield Source Protection Area Updated Assessment Report December 10th
, 2014
ABMV Source Protection Region 4 - i
Table of Contents Part 1 4.1 Regulatory Context .................................................................................. 1 4.2 Methods for Delineating Vulnerable Areas ............................................ 3 4.3 Overview and Description of Vulnerable Areas ................................... 13 4.4 Threats, Conditions, Issues and Risk................................................... 14 Part 2 4.5 Municipal Profiles .................................................................................. 28
4.5.1 Adelaide Metcalfe ............................................................................. 28 4.5.1.1 Adelaide Metcalfe – HVAs and SGRAs ....................................... 28
4.5.2 Bluewater .......................................................................................... 29
4.5.2.1 Bluewater HVAs and SGRAs .................................................... 29 4.5.2.2 LHPWSS Intake Protection Zone ................................................. 30 4.5.2.3 Wellhead Protection Areas........................................................... 31
4.5.2.3.1 Brucefield ............................................................................... 32 4.5.2.3.2 Carriage Lane ........................................................................ 34 4.5.2.3.3 Harbour Lights .................................................................... 3735 4.5.2.3.4 Zurich ................................................................................. 3937
4.5.3 Central Huron ................................................................................ 4139 4.5.3.1 Central Huron – HVAs and SGRAs .......................................... 4140 4.5.3.2 Wellhead Protection Areas....................................................... 4240
4.5.3.2.1 Carriage Lane ..................................................................... 4341 4.5.3.2.2 Clinton ................................................................................. 4443
4.5.3.2.3 Harbour Lights .................................................................... 4745
4.5.3.2.4 SAM .................................................................................... 4847
4.5.3.2.5 Vandewetering .................................................................... 5049 4.5.4 Huron East .................................................................................... 5250
4.5.4.1 Huron East – HVAs and SGRAs .............................................. 5250 4.5.4.2 Wellhead Protection Areas (WHPAs) ....................................... 5351
4.5.4.2.1 Brucefield ............................................................................ 5351
4.5.4.2.2 Seaforth .............................................................................. 5553 4.5.5 Lambton Shores ........................................................................... 5856
4.5.5.1 Lambton Shores – HVAs and SGRAs ...................................... 5856
4.5.5.2 Intake Protection Zone ............................................................. 5856 4.5.6 Lucan Biddulph ............................................................................ 6058
4.5.6.1 Lucan Biddulph – HVAs and SGRAs ....................................... 6058
4.5.7 Middlesex Centre .......................................................................... 6159 4.5.7.1 Middlesex Centre – HVAs and SGRAs .................................... 6159
4.5.8 North Middlesex ............................................................................ 6260 4.5.8.1 North Middlesex – HVAs and SGRAs ...................................... 6260
4.5.9 Perth South ................................................................................... 6361 4.5.9.1 Perth South – HVAs and SGRAs ............................................. 6361
4.5.10 South Huron .............................................................................. 6462 4.5.10.1 South Huron – HVAs and SGRAs ......................................... 6462 4.5.10.2 Intake Protection Zone .......................................................... 6463
Draft for Consultation
Ausable Bayfield Source Protection Area Updated Assessment Report December 10th
, 2014
ABMV Source Protection Region 4 - ii
4.5.11 Warwick ...................................................................................... 6765 4.5.11.1 Warwick – HVAs and SGRAs ............................................... 6765
4.5.12 West Perth ................................................................................. 6866 4.5.12.1 West Perth – HVAs and SGRAs ........................................... 6866
Summary ....................................................................................................... 6967
References .................................................................................................... 7068
List of Tables Table 4.1 List of Threats in Ontario Regulation 287/07, Section 1.1 ............... 14 Table 4.2 Sample from Drinking Water Threats Table .................................... 18 Table 4.3 Areas within Highly Vulnerable Aquifers Where Activities and
Conditions are or would be Significant, Moderate and Low Drinking Water Threats ................................................................................. 19
Table 4.4 Areas within Significant Groundwater Recharge Areas Where Activities and Conditions are or would be Significant, Moderate and Low Drinking Water Threats ............................................................ 19
Table 4.5 Areas within Intake Protection Zones Where Activities and Conditions are or would be Significant, Moderate and Low Drinking Water Threats ................................................................................. 19
Table 4.6 Areas within Well Head Protection Areas Where Activities and Conditions are or would be Significant, Moderate and Low Drinking Water Threats ................................................................................. 21
Table 4.7 Adelaide Metcalfe Risks to Drinking Water Summary ..................... 28 Table 4.8 Adelaide Metcalfe Issues and Conditions ........................................ 29
Table 4.9 LHPWSS IPZ: Vulnerability Score Summary .................................. 30 Table 4.10 LHPWSS IPZ: Enumeration of Potential Significant Threats ........... 31 Table 4.11 LHPWSS IPZ: Issues and Conditions ............................................. 31 Table 4.12 Brucefield WHPA: Enumeration of Potential Significant Threats . 3433 Table 4.13 Brucefield WHPA: Issues and Conditions ....................................... 34 Table 4.14 Carriage Lane WHPA: Enumeration of Potential Significant Threats ..
................................................................................................. 3635 Table 4.15 Carriage Lane WHPA: Issues and Conditions ............................. 3735 Table 4.16 Harbour Lights WHPA: Enumeration of Potential Significant Threats .
................................................................................................. 3837 Table 4.17 Harbour Lights WHPA: Issues and Conditions ............................ 3937 Table 4.18 Zurich WHPA: Enumeration of Potential Significant Threats ....... 4139
Table 4.19 Zurich WHPA: Issues and Conditions ......................................... 4139 Table 4.20 Carriage Lane WHPA: Enumeration of Potential Significant Threats ..
................................................................................................. 4442 Table 4.21 Carriage Lane WHPA: Issues and Conditions ............................. 4443
Table 4.22 Clinton WHPA: Enumeration of Potential Significant Threats ...... 4645 Table 4.23 Clinton WHPA: Issues and Conditions ........................................ 4745 Table 4.24 Harbour Lights WHPA: Enumeration of Potential Significant Threats .
................................................................................................. 4847 Table 4.25 Harbour Lights WHPA: Issues and Conditions ............................ 4847
Draft for Consultation

Ausable Bayfield Source Protection Area Updated Assessment Report December 10th
, 2014
ABMV Source Protection Region 4 - iii
Table 4.26 SAM WHPA: Enumeration of Potential Significant Threats ......... 5048 Table 4.27 SAM WHPA: Issues and Conditions ........................................... 5048 Table 4.28 Vandewetering WHPA: Enumeration of Potential Significant Threats .
................................................................................................. 5150 Table 4.29 Vandewetering WHPA: Issues and Conditions ........................... 5250
Table 4.30 Brucefield WHPA: Enumeration of Potential Significant Threats . 5453 Table 4.31 Brucefield WHPA: Issues and Conditions ................................... 5553 Table 4.32 Seaforth WHPA: Enumeration of Potential Significant Threats ... 5755 Table 4.33 Seaforth WHPA: Issues and Conditions ...................................... 5755 Table 4.34 LHPWSS IPZ: Vulnerability Score Summary .............................. 5957
Table 4.35 Lambton Shores Risks to Drinking Water Summary ................... 5957 Table 4.36 Lambton Shores Issues and Conditions ...................................... 5957
Table 4.37 Lucan Biddulph Risks to Drinking Water Summary ..................... 6058 Table 4.38 Lucan Biddulph Issues and Conditions ....................................... 6058 Table 4.39 Middlesex Centre Risks to Drinking Water Summary .................. 6159 Table 4.40 Middlesex Centre Issues and Conditions .................................... 6159 Table 4.41 North Middlesex Risks to Drinking Water Summary .................... 6260
Table 4.42 North Middlesex Issues and Conditions ...................................... 6361 Table 4.43 South Perth Risks to Drinking Water Summary ........................... 6362
Table 4.44 South Perth Issues and Conditions ............................................. 6462 Table 4.45 Vulnerability Score Summary ...................................................... 6563 Table 4.46 South Huron Risks to Drinking Water Summary ......................... 6564
Table 4.47 South Huron Issues and Conditions ............................................ 6664 Table 4.48 Warwick Risks to Drinking Water Summary ................................ 6765
Table 4.49 Warwick Issues and Conditions .................................................. 6765
Table 4.50 West Perth Risks to Drinking Water Summary ............................ 6866
Table 4.51 West Perth Issues and Conditions .............................................. 6866 Table 4.52 All* WHPAs: Enumeration of Potential Significant Threats .......... 6967
Draft for Consultation

Draft for Consultation

Ausable Bayfield Source Protection Area Updated Assessment Report December 10th
, 2014
ABMV Source Protection Region 4-1
Part 1 4.1 Regulatory Context The Assessment Report gives specific attention to those municipal residential drinking water sources identified in the Terms of Reference. The purpose of this section is to identify where the sources of drinking water are susceptible to contamination given the natural environment and human activity around the source of water. This is determined by using scientific models which evaluate the vulnerability of the area around a drinking water source (what exists in nature). Then within these areas, what activities or conditions exist that use chemicals or contain pathogens that could, in the right circumstance, contaminate drinking water (what humans do or have done). By identifying areas where the potential for such contamination is greatest, protection measures can be directed to the most vulnerable areas through the source protection plan. Vulnerable Areas The Clean Water Act, 2006, identifies four types of vulnerable areas which are defined by regulation in the following way: "Highly vulnerable aquifer" means an aquifer on which external sources have or are likely to have a significant adverse effect, and includes the land above the aquifer; "Significant groundwater recharge area" means an area within which it is desirable to regulate or monitor drinking water threats that may affect the recharge of an aquifer, "Surface water intake protection zone” means an area that is related to a surface water intake and within which it is desirable to regulate or monitor drinking water threats, “Wellhead protection area" means an area that is related to a wellhead and within which it is desirable to regulate or monitor drinking water threats. The Technical Rules (MOE, 2009) indicate how to delineate each type of vulnerable area and how to assess the degree of vulnerability within each. These methodologies will be expanded upon below. The degree of vulnerability is represented by a score where a score of 8 – 10 is considered high vulnerability, 6 – 8 is moderate vulnerability and 4 – 6 is low vulnerability.
Draft for Consultation
Ausable Bayfield Source Protection Area Updated Assessment Report December 10th
, 2014
ABMV Source Protection Region 4-2
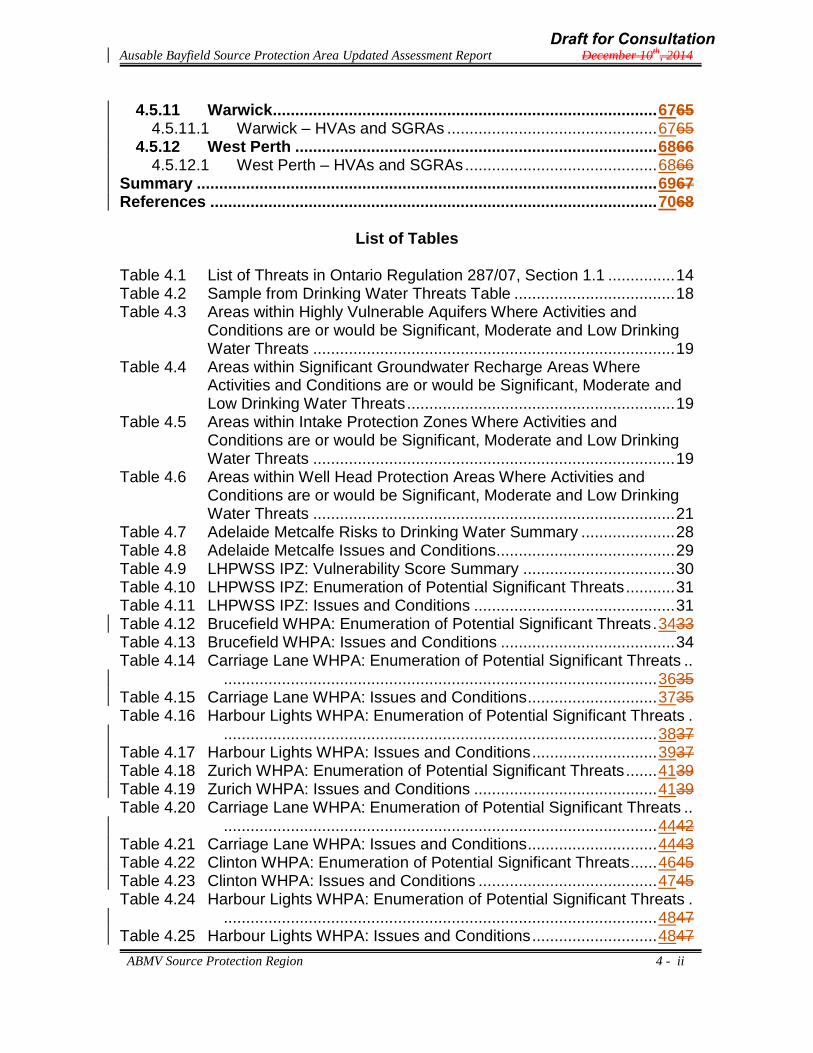
A highly vulnerable aquifer is an area of soil or rock where underground cracks or spaces allow water (and possibly contaminants) through more quickly from the surface to the aquifer.
An intake protection zone is the area of water and land around a surface water intake defined by the distance water can travel from upstream or shore to the intake.
Groundwater Vulnerability Score is shown as a score where 2 is low vulnerability and 10 is high vulnerability. This score combines two ideas: The closer the wellhead, the higher the vulnerability score and the more vulnerable the aquifer, the higher the vulnerability score. Thus the score accounts for both horizontal and vertical movement of water into the aquifer that the well draws from.
A significant groundwater recharge area is land where rain or snow seeps under-ground into an aquifer at a higher rate than typical.
A wellhead protection area is the area of land around a well that has an outer boundary from which it takes up to 25 years for water to travel to the well head.
Draft for Consultation

Ausable Bayfield Source Protection Area Updated Assessment Report December 10th
, 2014
ABMV Source Protection Region 4-3
4.2 Methods for Delineating Vulnerable Areas
Data was gathered for each of the four types of vulnerable areas in keeping with the Technical Rules. The methodology, limitations, and uncertainty associated with this methodology, are outlined below.
Highly Vulnerable Aquifers (HVAs):
The Intrinsic Susceptibility Index (ISI), a measure of overburden porosity, was used to delineate HVAs in all areas. While the rules allow for several different approaches, the ISI method was chosen because data was readily available for the entire SPR. ISI for the region was available through county groundwater studies (Grey Bruce Groundwater Study, 2003; Perth County Groundwater Study, 2003; Lambton and Middlesex County Groundwater Study, 2003, Huron County Groundwater Study, 2003).
ISI is a regional aquifer assessment tool designed to identify areas where those aquifer systems are sensitive to contamination via surface activities. Data used in the calculation for the index is derived from water well records housed in the Ministry of the Environment’s Water Well Information System (WWIS). Wells used in the calculation were screened based on location reliability codes in the WWIS, and only those deemed sufficiently accurate were included in the final ISI calculation. Details on the screening of data can be found in the corresponding reports (Grey Bruce Groundwater Study, 2003; Perth County Groundwater Study, 2003; Lambton and Middlesex County Groundwater Study, 2003, Huron County Groundwater Study, 2003). The screening process leads to the exclusion of some data sources which may have an impact on the certainty associated with the ISI.
ISI is calculated for individual wells, and employs statistical methods for estimating values between wells. This process does not take into account discrete boundaries of local geological features which may be the source of the different index values. Exclusion of data points has a higher impact on the local scale calculations of ISI, as the exclusion of a single data point could have profound implications on the ISI locally, whereas at a regional scale the impact of a single data point has less significant ramifications.
Uncertainty associated with ISI is highly dependent on the scale at which they are viewed. From a regional scale perspective, ISI can be considered a good indicator of areas where aquifers are highly vulnerable, and as such, can be considered to have low uncertainty at that scale. However, when applied at a local scale, the uncertainty increases. The data relied on in this study is intended for broad scale use. It is recommended that additional study take place for any property where specific ISI information is required.
Some areas within the SPA which have surficial sands are not mapped as being Highly Vulnerable with the ISI process. The primary reason for this is the lack of wells or well records for these shallow aquifers from which the ISI was developed.
Draft for Consultation

Ausable Bayfield Source Protection Area Updated Assessment Report December 10th
, 2014
ABMV Source Protection Region 4-4
According to the Technical Rules, all HVAs have vulnerability scores of 6.
Significant Groundwater Recharge Areas (SGRAs):
Significant groundwater recharge areas (SGRAs) were calculated using a Hydrologic Response Unit (HRU) approach for the source protection area. HRUs were developed on a 15 m X 15 m grid for the entire SPA based on surficial geology and land cover, and were corrected at a subwatershed scale using Tier 1 water budget models. Individual recharge values for each type of HRU were developed on a subwatershed basis, and mean annual recharge values for the SPA were calculated.
Those HRUs with recharge values that exceed 115% of the mean recharge value for the SPA were identified as being High Volume Groundwater Recharge Areas in accordance with Rule 44 (2) of the Technical Rules. In order to be considered, the high volume recharge area must have a hydraulic connection with a drinking water system (e.g. a well). Due to uncertainties related to the location and distribution of well records, the SPC requested that all high volume recharge areas be included as significant recharge areas. This was considered appropriate given the lack of information on shallow wells and surficial aquifers in the region. Sinkholes, and areas that drain into sinkholes, were included as SGRAs based on Rule 44 (1), as all water which is not lost to evapotranspiration is recharged, either by infiltration or via runoff into surface water bodies which are outlet directly into sinkholes. SGRAs were further refined within those areas included in the Tier 2 water budget.
The data used for the development of the SGRAs is based on existing climate data, Tier I surface water modeling outputs and existing geological and land cover data. These data sets were not developed for the explicit purposes of delineating SGRAs, and have certain limitations which can be attributed to them, specifically:
1. Climate data has been filled and corrected to try and account for missing data for discrete time intervals and locations where no monitoring stations exist
2. Surface water modeling has been completed for the entire source protection area, yet has not been calibrated in certain regions due to a lack of monitoring data. In such cases models were calibrated to similar subwatersheds
3. Land cover data is valid only at the time it was collected, and has not been altered or corrected for changes in land use since the time of collection
4. The SGRAs have not been evaluated with respect to their hydrologic connection to specific aquifers themselves. Rather they have been calculated to the nearest surficial aquifer. Recharge areas for confined
Draft for Consultation
Ausable Bayfield Source Protection Area Updated Assessment Report December 10th
, 2014
ABMV Source Protection Region 4-5
regional aquifers may lie outside areas. Future use of this delineation, specifically at local scales, should consider the aquifer of interest before employing this methodology
Uncertainty for SGRAs is a measure of the reliability of the delineations with respect to providing protection to the overall groundwater system, rather than specific aquifers. In this light, the methodology for calculating SGRAs is highly reliant on the surficial geology of the area and can be considered reliable for the overall groundwater system. The uncertainty for the SGRAs is therefore considered low for the source protection area.
According to the Technical Rules, SGRAs can have vulnerability scores of 6, 4 or 2.
Intake Protection Zones (IPZs):
The Ausable Bayfield Source Protection Area has one intake, the Lake Huron Primary Water Supply System (LHPWSS). It is classified as a Type A intake, an intake located in a Great Lake. This intake is in Lake Huron approximately 2.5 kilometres off shore just north of Grand Bend at a depth of approximately nine metres.
Consultants with coastal modeling expertise were selected to undertake the delineation of IPZs (Stantec). Their work was peer reviewed by recognized and qualified experts who concurred with the outcomes and recommended potential improvements (Baird & Associates).
The in-water portion of an IPZ-1 is prescribed as a 1 km circle around the intake except where it intersects land. Where the IPZ reaches land, its inland extent is limited to the greater of 120 metres or the regulatory limit. The LHPWSS intake is located such that its 1 km circle does not reach land. The IPZ-2 is delineated as the two hour time-of-travel to the intake under a series of wind and wave conditions considered typical for a 10-year period. The IPZ-2 was delineated using both two dimensional and three dimensional hydro-dynamic models for (POM and ADCIRC 2-d Vertical). These models were well suited, given the intake’s distance from shore, natural environment, and treatment plant capacity.
The vulnerability scores for the intake are based on the attributes of the intake (length and depth), type of water body, the physical characteristics of the environment it is situated in, and the influences affecting intake water. It is essentially qualitative, based upon scores assigned to the contributing factors through the professional judgment of coastal modeling consultants. The vulnerability score is derived by multiplying the Area Vulnerability Factor by the Source Vulnerability Factor (as defined in the Technical Rules). The Area Vulnerability Factor for IPZ-1 is 10 as prescribed by the Technical Rules.
The area vulnerability factor for IPZ-2 must be assigned a whole number ranging from 7 to 9 based upon consideration of the following sub factors:
a. Percentage of area that is land within the IPZ-2;
Draft for Consultation

Ausable Bayfield Source Protection Area Updated Assessment Report December 10th
, 2014
ABMV Source Protection Region 4-6
b. Land cover, soil type and permeability; and c. Transport pathways within the IPZ-2 upland environment.
To assist with the development of the area vulnerability score for the intake, a decision matrix was developed using ranges of characteristics for each of the three sub factors. The evaluation of each of these factors was completed for the LHPWSS intake such that the percentage of land was scored at 8, the land cover soil type was scored at 7.8 and the transport pathways at 8.3.
Area Vulnerability Factor = (land area + land cover soil type + tpt pathways) 3
Thus, the area vulnerability factor for IPZ-2 was determined to be 8 (see the Phase 1: Surface Water Vulnerability Assessment Addendum for the Lake Huron Water Treatment Plant Phase 1 Addendum , Stantec, 2009, pgs 3.2 – 3.8). Storm sewer outfalls, networks or drainage areas were not provided and have been listed as a data gap. For the purposes of the upland delineation, the consultant assumed that the urban area of Grand Bend was storm drained, and therefore, was included within the IPZ-2 upland delineation. However, upon discussion with the municipality, the village does not have a fully developed systematic storm drainage network. Upland areas north of the village represent tile drainage of farm fields. Where tile drained lands existed next to a watercourse/drain, and the watercourse/drain was included in the IPZ-2, the IPZ-2 was extended to include the adjacent tile drained land, as well as all other tile drain lands that were assumed to contribute water to that drain, based on topography. The tile drain area composes approximately 71% of the upland IPZ-2. Areas without watercourses, nor transport pathways, were extended inland from the Lake Huron shore 120 m as, in this case, it extended further inland than the Regulatory Limit. According to the Technical Rules, the Source Vulnerability Factor must be assigned a value of 0.5 to 0.7 based on the following factors;
A. The depth of the intake,
B. The distance of the intake from land, and
C. The number of recorded drinking water issues related to the intake.
To quantify these factors, a decision matrix was developed using ranges of characteristics for each of the three sub factors. The sub factors are assumed to have equal importance, and thus, were weighted equally. Given the distance from shore of the intake, the depth of the intake and the minimal number of water quality concerns each of these factors was given a value of 0.5 and applied to the following formula.
Draft for Consultation

Ausable Bayfield Source Protection Area Updated Assessment Report December 10th
, 2014
ABMV Source Protection Region 4-7
Source Vulnerability Factor = (offshore length + depth + water quality)
3 Thus, the Source Vulnerability Factor was determined to be 0.5, to reflect the intake’s relative security from contamination (see the Phase 1: Surface Water Vulnerability Assessment Addendum for the Lake Huron Water Treatment Plant Phase 1 Addendum, Stantec, 2009, pgs 3.8 – 3.11).
The Vulnerability Factor was multiplied by the area vulnerability score for a final vulnerability score for the IPZ-1 is 5 and the score for IPZ-2 is 4.
Like any methodology, this approach to vulnerability has limitations. Uncertainty is the confidence in the accuracy of IPZ delineations and vulnerability scores based on factors such as; data quality, quantity, and distribution, ability of models and formulas to accurately delineate the zones, and accuracy and relevance of the vulnerability scores for the zones to represent the situation. The uncertainty levels for the LHPWSS IPZ-1 and IPZ-2 have been based upon the above listed components such that for the vulnerability score the uncertainty is “low” and for the IPZ delineations the uncertainty is “low” because of the offshore location and excellent raw water quality. Under the Technical Rules, an IPZ-3 can be created to include threats which have the potential to interrupt the safe operation of a water supply. An IPZ-3 can be developed for a Great Lakes intake where the Source Protection Committee has identified land use activities that are of sufficient concern to warrant further investigation. These land use activities are then evaluated to determine if, under extreme conditions, they can cause an interruption of water supply. In order to be included, it must be shown that there is a hydrodynamic connection between the land use activity and the intake, and that a sufficient quantity of an identified contaminant could be released resulting in an interruption in the water supply. In the Ausable Bayfield SPA, a screening procedure was implemented to identify potential land use activities that require a detailed analysis. This screening procedure began first by identifying all properties located within 120 m of Lake Huron or any stream identified in the provincial stream network layer. These properties were further screened to eliminate land uses that are unlikely to have any sources of contaminants, such as natural environment and conservation lands. Finally, the properties were screened in order to identify only those properties which have a structure located within the 120 m buffer surrounding the water courses or Lake Huron. Under extreme events, any property located within the 120 m buffer of a watercourse has the potential to have a hydrodynamic connection with the intake located in Lake Huron (everything is upstream of Lake Huron). Properties with a structure located within the 120 m buffer were evaluated using aerial photography to identify any major storage tanks which could be of concern. Those included based on the aerial photography were then evaluated based on
Draft for Consultation

Ausable Bayfield Source Protection Area Updated Assessment Report December 10th
, 2014
ABMV Source Protection Region 4-8
the volume, concentration, fate and toxicity of any contaminants stored on site. Land use activities were also evaluated based on the likely pathway of any spill to the watercourse. Land use activities that include partially of fully below grade storage were eliminated from the process as they are unlikely to result in rapid spill into surface water systems. Remaining threats were then assessed for inclusion into an IPZ-3 by developing a realistic spill scenario and using a simple dilution calculation. This scenario considers the potential size and duration of any spill, the concentration of any contaminants, the location and hydrologic situation of the storage facility and the fate of the contaminant. In cases where multiple contaminants have been identified, the contaminant with the most conservative fate was considered for the dilution scenario. Land use activities which were included for the IPZ-3 assessment were then evaluated to determine if a sufficient hydrodynamic connection exists. Once that hydrodynamic connection has been demonstrated through modeling or analysis, a spill scenario was undertaken to determine if a spill has the potential to sufficiently impact the source of municipal drinking water such that it would cause an interruption in water supply. If the spill scenario calculations determine that a spill could cause deterioration to the quality of the drinking water, and result in an interruption in supply, an IPZ-3 could be extended to include the evaluated land-use activities. It should be noted that none of the assessed activities in the Ausable Bayfield Source Protection Area resulted in the delineation of an IPZ-3. Wellhead Protection Areas (WHPAs):
The wellhead protection areas were modeled using three dimensional groundwater flow models by identifying certain areas which correspond to times-of-travel to the well. For each well head the following times of travel have been modeled:
100 m WHPA – A
Two year time-of-travel WHPA – B
Five year time-of-travel WHPA - C
Twenty-five year time-of-travel WHPA – D
If there is a GUDI well, two hour time-of-travel WHPA – E
(There are no GUDI wells in the Ausable Bayfield Source Protection Area)
WHPA-A is not a time-of-travel model, rather is a prescribed 100 m buffer surrounding all municipal wells.
The groundwater modeling and time-of-travel calculations were all completed in keeping with the Technical Rules. The three-dimensional groundwater modeling
Draft for Consultation

Ausable Bayfield Source Protection Area Updated Assessment Report December 10th
, 2014
ABMV Source Protection Region 4-9
code MODFLOW-SURFACT, developed by Waterloo Hydrogeologic Inc. (Now Schlumberger Water Services), was used for delineating the wellhead protection areas in the ABMV Source Protection Region. MODFLOW-SURFACT is a commercially available software package that simulates the groundwater flow using a finite difference formulation, incorporating the USGS-developed MODFLOW code. MODFLOW SURFACT is an advance groundwater modeling package that couples unsaturated and saturated subsurface conditions which allows it to take into account preferential pathways. For each municipal well, the known individual wells are included in the model. The updated models were constructed using the hydrogeologic units from ground surface down to the lower extents of the aquifers from which municipal wells are taking their groundwater. Surface water boundaries interacting with the groundwater system were included in the groundwater models. The groundwater models were calibrated to provide good representation of the aquifer systems supplying the groundwater to the municipal wells. Once calibrated, the models were used to run multiple reverse-particle tracking scenarios in order to develop the times of travel for the well head protection area.
Recognized and qualified consultants (WESA) undertook a peer review of this methodology and concurred with the outcomes and recommended potential improvements. These will be addressed in an updated Assessment Report. Similar methods by each consultant provided seamless delineation between source protection regions.
This method was chosen because it utilizes the analytical complexity required by the rules while building on existing data. Uncertainty analyses are a conservative approach which is used to account for the intrinsic variations that exist in natural hydrogeologic environments.
The limitations of the modeling tasks are driven by the uncertainty of the data itself, primarily the recharge, hydraulic conductivity and variations in the temporal water level data. In developing the groundwater models for the ABMV Source Protection Region uncertainty was incorporated into the wellhead protection areas. The WHPAs presented within the report include an uncertainty analysis and represent conservative but reasonable zones based on the information available. A sensitivity analysis was conducted, in which those model parameters for which the WHPA delineations were sensitive to, were varied in a range, above and below the calibrated value, but remained within reasonable limits of that parameter. The most sensitive parameters were found to be recharge and hydraulic conductivity as is usually found with most groundwater modeling simulations. For hydraulic conductivity parameters the uncertainty range was typically assumed to be between a half or a full order of magnitude above and below the calibrated value. For recharge parameters the uncertainty range was assumed to range from twice to half of the calibrated value. The water level data used for calibrating the groundwater models was primarily the static water levels at the time of drilling from the MOE Water Well Information System. Since these water levels have been collected over many decades and at various times
Draft for Consultation

Ausable Bayfield Source Protection Area Updated Assessment Report December 10th
, 2014
ABMV Source Protection Region 4-10
throughout the year the static water level at the time of drilling may be quite different from the water level under current conditions. Lastly, the WHPA Zone B and Zone C will generally have less uncertainty than the WHPA Zone D. The size of the WHPA Zone B is smaller and centered closer to the wellhead where the presence of more wells allows for the geology to be better understood than farther away from the wellhead. The projected pumping rates for 25 years were used for generating the WHPAs and unlikely to change drastically over the next two years, but may change drastically over the next 25 years for a variety of unforeseen reasons. For these reasons listed above, the WHPA Zone B and Zone C have low uncertainty and the WHPA Zone D has high uncertainty. (see Ausable Bayfield Maitland Valley Wellhead Protection Area Delineation Project, WNMI, 2009) Vulnerability scores in WHPAs can be 2, 4, 6, 8, or 10 and are based on the time-of-travel and the ISI rating. The chart below shows how scores are determined in a WHPA.
Intrinsic Vulnerability
Travel Time Zones
100m 2 year 5 year 25 year
HIGH 10 10 8 6
MEDIUM 10 8 6 4
LOW 10 6 4 2
Details on data information sources for delineations and scoring are available in the consultant’s reports. These reports are noted in the Reference section at the end of this chapter.
Transport Pathways Within wellhead protection areas, vulnerability scores were developed by intersecting Aquifer Vulnerability scores, typically derived from the Intrinsic Susceptibility Index (ISI) or Aquifer Vulnerability Index (AVI), with the time-of-travel capture zones associated with the WHPA. Where anthropogenic transport pathways exist that circumvent the natural vulnerability of the aquifer, the Aquifer Vulnerability score can be increased according to the following technical rules 39, 40 and 41, listed below:
39. Where the vulnerability of an area identified as low in accordance with rule 38 is increased because of the presence of a transport pathway that is anthropogenic in origin, the area shall be identified as an area of medium or high vulnerability, high corresponding to greater vulnerability.
Draft for Consultation
Ausable Bayfield Source Protection Area Updated Assessment Report December 10th
, 2014
ABMV Source Protection Region 4-11
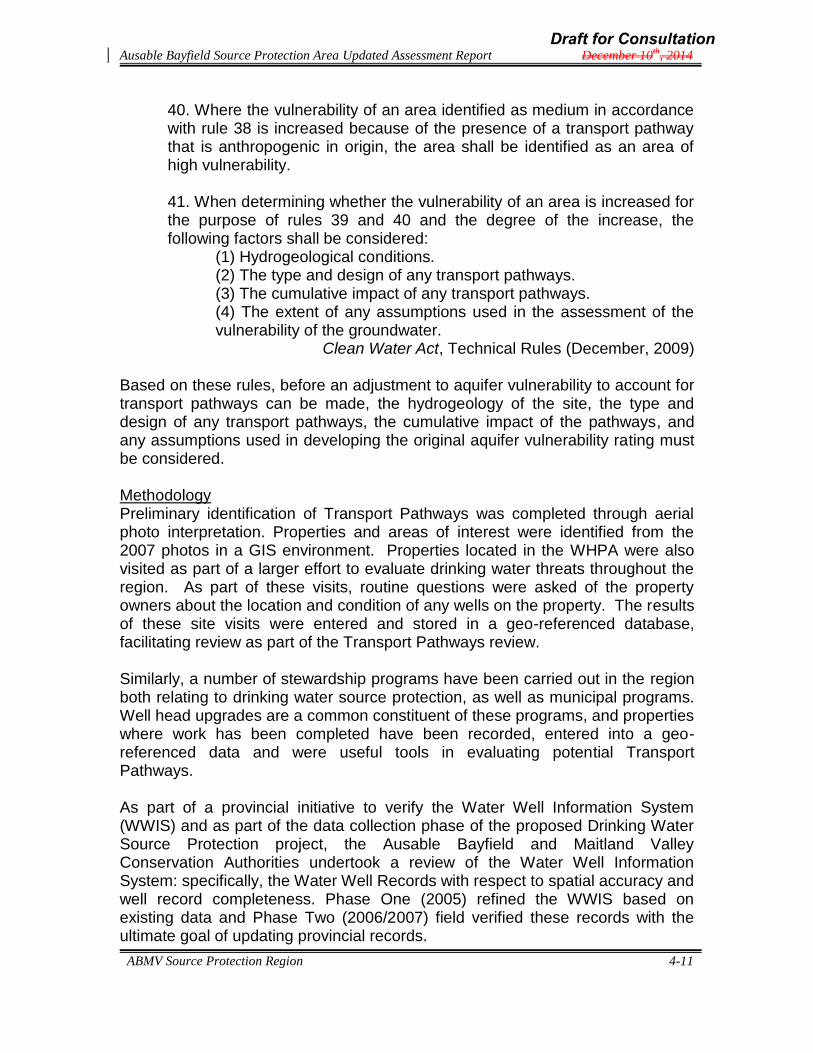
40. Where the vulnerability of an area identified as medium in accordance with rule 38 is increased because of the presence of a transport pathway that is anthropogenic in origin, the area shall be identified as an area of high vulnerability. 41. When determining whether the vulnerability of an area is increased for the purpose of rules 39 and 40 and the degree of the increase, the following factors shall be considered:
(1) Hydrogeological conditions. (2) The type and design of any transport pathways. (3) The cumulative impact of any transport pathways. (4) The extent of any assumptions used in the assessment of the vulnerability of the groundwater.
Clean Water Act, Technical Rules (December, 2009)
Based on these rules, before an adjustment to aquifer vulnerability to account for transport pathways can be made, the hydrogeology of the site, the type and design of any transport pathways, the cumulative impact of the pathways, and any assumptions used in developing the original aquifer vulnerability rating must be considered.
Methodology Preliminary identification of Transport Pathways was completed through aerial photo interpretation. Properties and areas of interest were identified from the 2007 photos in a GIS environment. Properties located in the WHPA were also visited as part of a larger effort to evaluate drinking water threats throughout the region. As part of these visits, routine questions were asked of the property owners about the location and condition of any wells on the property. The results of these site visits were entered and stored in a geo-referenced database, facilitating review as part of the Transport Pathways review. Similarly, a number of stewardship programs have been carried out in the region both relating to drinking water source protection, as well as municipal programs. Well head upgrades are a common constituent of these programs, and properties where work has been completed have been recorded, entered into a geo-referenced data and were useful tools in evaluating potential Transport Pathways. As part of a provincial initiative to verify the Water Well Information System (WWIS) and as part of the data collection phase of the proposed Drinking Water Source Protection project, the Ausable Bayfield and Maitland Valley Conservation Authorities undertook a review of the Water Well Information System: specifically, the Water Well Records with respect to spatial accuracy and well record completeness. Phase One (2005) refined the WWIS based on existing data and Phase Two (2006/2007) field verified these records with the ultimate goal of updating provincial records.
Draft for Consultation

Ausable Bayfield Source Protection Area Updated Assessment Report December 10th
, 2014
ABMV Source Protection Region 4-12
Field verification using Global Positioning System (GPS) technology was implemented to capture the position of the well. This location was compared against WWIS Records in order to verify their accuracy. To capture the well location, a team of two individuals visited properties within the 25-year time-of-travel wellhead protection area (WHPA) for municipal wells within the Ausable Bayfield Maitland Valley (ABMV) region. Upon completion of the GPS coordinate reading, a photograph was taken of the well in context to surrounding buildings, and the condition of the well was noted. This data was available for review of the Transport Pathways in the Region. In the Ausable Bayfield Maitland Valley Source Protection Region (SPR) transport pathways can be grouped into several categories, namely: pits and quarries; private wells; and urban areas and private well clusters. Detailed methodology and consideration of these areas are outlined below. In assigning transport pathway adjustments, the hydrogeology of the site and the condition of the pathway were considered, as well as the cumulative impact of transport pathways. Pits and Quarries Pits and quarries were primarily identified through aerial photography. Where prudent, these operations were examined by a roadside or windshield survey in order to ascertain the type of operations. There are relatively few pits and quarries in the region. Where they exist, and dependent on their depth with respect to the water table, aquifer vulnerability was adjusted from low to moderate or high, or from moderate to high. Details of any such adjustments are provided in Part 2 for individual WHPAs. Private Wells Private wells were first identified using the WWIS. Information made available from the well record improvement project undertaken by the Maitland Valley and Ausable Bayfield Conservation Authorities was used to evaluate the condition of the wells, which was current for the WHPAs for the year 2006. Additional information was gathered from site visits carried out as part of the Source Protection Committee consultation, and stewardship programs to determine if any upgrades had occurred since 2006. Wells that were not in compliance with existing regulations were identified as being potential conduits for water that increase the vulnerability of the aquifer locally. Vulnerability scores were adjusted for 30 m surrounding the well, and were adjusted a maximum of one level (i.e., low to moderate; or moderate to high).
Draft for Consultation
Ausable Bayfield Source Protection Area Updated Assessment Report December 10th
, 2014
ABMV Source Protection Region 4-13
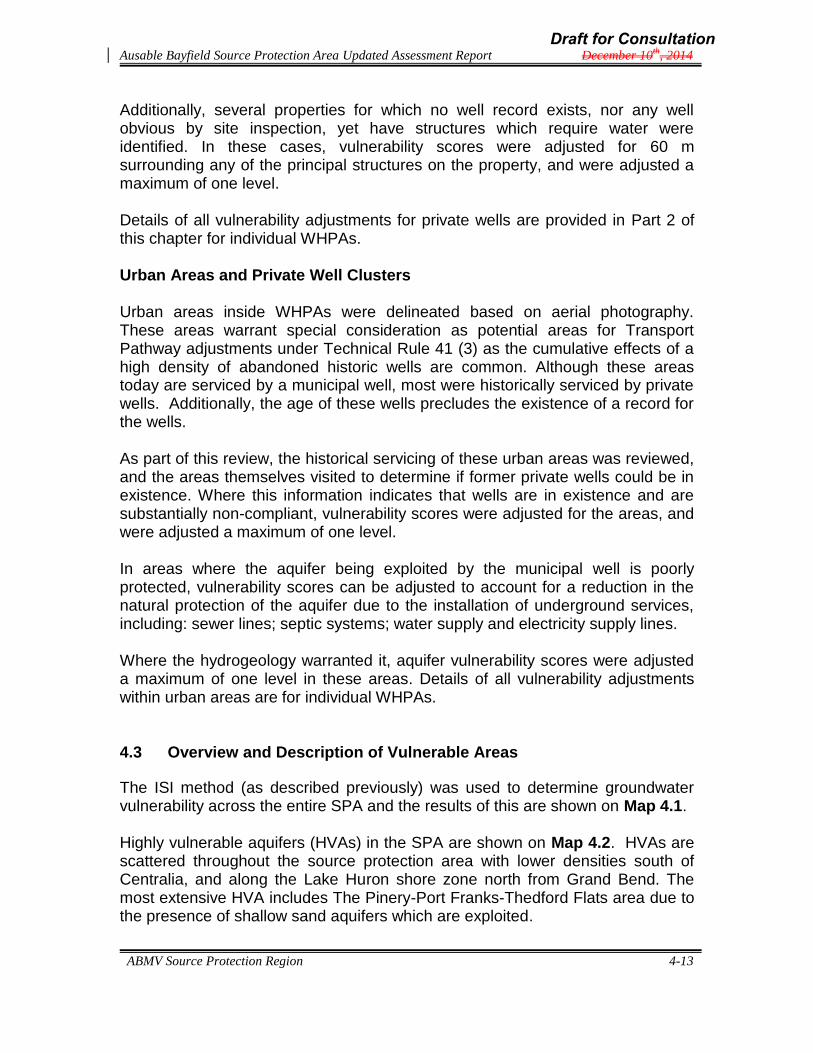
Additionally, several properties for which no well record exists, nor any well obvious by site inspection, yet have structures which require water were identified. In these cases, vulnerability scores were adjusted for 60 m surrounding any of the principal structures on the property, and were adjusted a maximum of one level. Details of all vulnerability adjustments for private wells are provided in Part 2 of this chapter for individual WHPAs. Urban Areas and Private Well Clusters Urban areas inside WHPAs were delineated based on aerial photography. These areas warrant special consideration as potential areas for Transport Pathway adjustments under Technical Rule 41 (3) as the cumulative effects of a high density of abandoned historic wells are common. Although these areas today are serviced by a municipal well, most were historically serviced by private wells. Additionally, the age of these wells precludes the existence of a record for the wells. As part of this review, the historical servicing of these urban areas was reviewed, and the areas themselves visited to determine if former private wells could be in existence. Where this information indicates that wells are in existence and are substantially non-compliant, vulnerability scores were adjusted for the areas, and were adjusted a maximum of one level. In areas where the aquifer being exploited by the municipal well is poorly protected, vulnerability scores can be adjusted to account for a reduction in the natural protection of the aquifer due to the installation of underground services, including: sewer lines; septic systems; water supply and electricity supply lines. Where the hydrogeology warranted it, aquifer vulnerability scores were adjusted a maximum of one level in these areas. Details of all vulnerability adjustments within urban areas are for individual WHPAs. 4.3 Overview and Description of Vulnerable Areas
The ISI method (as described previously) was used to determine groundwater vulnerability across the entire SPA and the results of this are shown on Map 4.1. Highly vulnerable aquifers (HVAs) in the SPA are shown on Map 4.2. HVAs are scattered throughout the source protection area with lower densities south of Centralia, and along the Lake Huron shore zone north from Grand Bend. The most extensive HVA includes The Pinery-Port Franks-Thedford Flats area due to the presence of shallow sand aquifers which are exploited.
Draft for Consultation

Ausable Bayfield Source Protection Area Updated Assessment Report December 10th
, 2014
ABMV Source Protection Region 4-14
significant groundwater recharge areas in the SPA are associated with permeable hydrologic response units and are presented on Map 4.3. SGRAs correspond to sand plains that parallel the shoreline for the full length of the Source Protection Region. Although the Ausable Bayfield watershed has less SGRA extent, strips occur on narrow sand plains and spillways. There is one surface water intake from Lake Huron: the Lake Huron Primary Water Supply System (LHPWSS). The LHPWSS intake is approximately two kilometres offshore just north of Grand Bend and supplies the City of London as well as residents in the south end of the Ausable Bayfield Maitland Valley Source Protection Region. The Ausable Bayfield Source Protection Area has three municipalities with municipal residential well systems: Bluewater, Central Huron and Huron East. 4.4 Threats, Conditions, Issues and Risk The threats to drinking water are identified in Ontario Regulation 287/07 as follows: Table 4.1 List of Threats in Ontario Regulation 287/07, Section 1.1
1. The establishment, operation or maintenance of a waste disposal site within the meaning of Part V of the Environmental Protection Act.
2. The establishment, operation or maintenance of a system that collects, stores, transmits, treats or disposes of sewage.
3. The application of agricultural source material to land.
4. The storage of agricultural source material.
5. The management of agricultural source material.
6. The application of non-agricultural source material to land.
7. The handling and storage of non-agricultural source material.
8. The application of commercial fertilizer to land.
9. The handling and storage of commercial fertilizer.
10. The application of pesticide to land.
11. The handling and storage of pesticide.
12. The application of road salt.
13. The handling and storage of road salt.
14. The storage of snow.
15. The handling and storage of fuel.
16. The handling and storage of a dense non-aqueous phase liquid.
17. The handling and storage of an organic solvent.
18. The management of runoff that contains chemicals used in the de-icing of aircraft.
Draft for Consultation
Ausable Bayfield Source Protection Area Updated Assessment Report December 10th
, 2014
ABMV Source Protection Region 4-15
19. An activity that takes water from an aquifer or a surface water body without returning the water taken to the same aquifer or surface water body.
20. An activity that reduces the recharge of an aquifer.
21. The use of land as livestock grazing or pasturing land, an outdoor confinement area or a farm-animal yard.
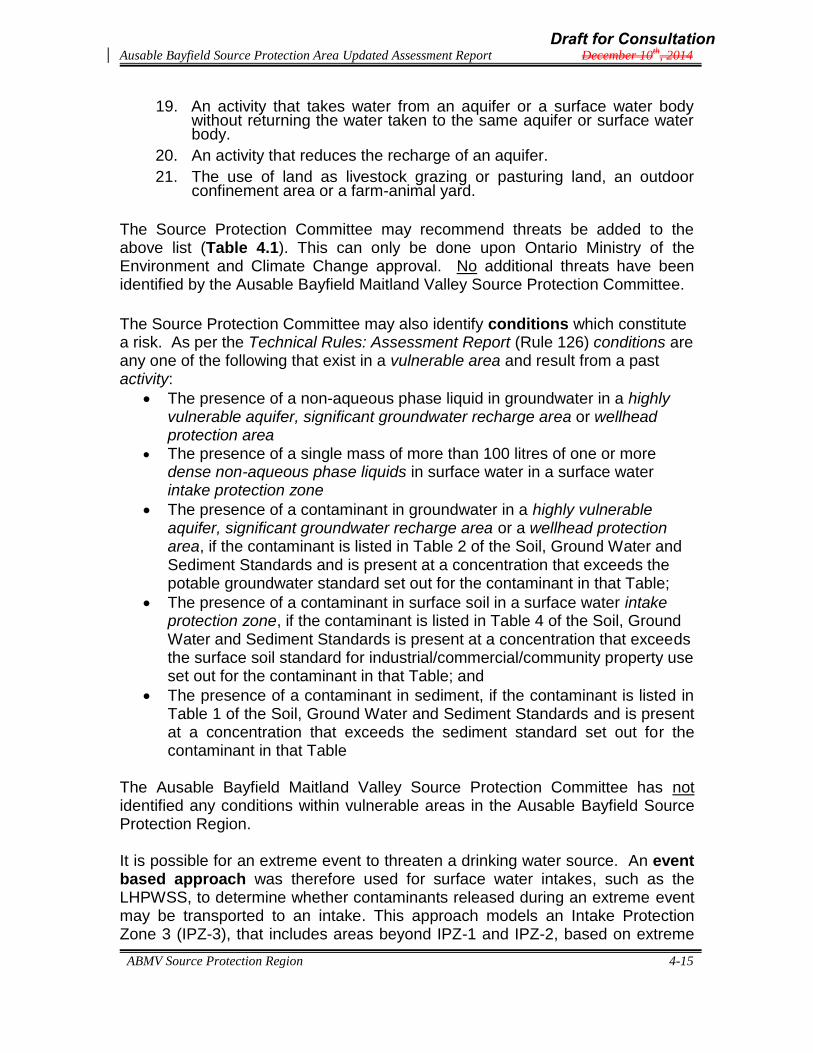
The Source Protection Committee may recommend threats be added to the above list (Table 4.1). This can only be done upon Ontario Ministry of the Environment and Climate Change approval. No additional threats have been identified by the Ausable Bayfield Maitland Valley Source Protection Committee.
The Source Protection Committee may also identify conditions which constitute a risk. As per the Technical Rules: Assessment Report (Rule 126) conditions are any one of the following that exist in a vulnerable area and result from a past activity:
The presence of a non-aqueous phase liquid in groundwater in a highly vulnerable aquifer, significant groundwater recharge area or wellhead protection area
The presence of a single mass of more than 100 litres of one or more dense non-aqueous phase liquids in surface water in a surface water intake protection zone
The presence of a contaminant in groundwater in a highly vulnerable aquifer, significant groundwater recharge area or a wellhead protection area, if the contaminant is listed in Table 2 of the Soil, Ground Water and Sediment Standards and is present at a concentration that exceeds the potable groundwater standard set out for the contaminant in that Table;
The presence of a contaminant in surface soil in a surface water intake protection zone, if the contaminant is listed in Table 4 of the Soil, Ground Water and Sediment Standards is present at a concentration that exceeds the surface soil standard for industrial/commercial/community property use set out for the contaminant in that Table; and
The presence of a contaminant in sediment, if the contaminant is listed in Table 1 of the Soil, Ground Water and Sediment Standards and is present at a concentration that exceeds the sediment standard set out for the contaminant in that Table
The Ausable Bayfield Maitland Valley Source Protection Committee has not identified any conditions within vulnerable areas in the Ausable Bayfield Source Protection Region. It is possible for an extreme event to threaten a drinking water source. An event based approach was therefore used for surface water intakes, such as the LHPWSS, to determine whether contaminants released during an extreme event may be transported to an intake. This approach models an Intake Protection Zone 3 (IPZ-3), that includes areas beyond IPZ-1 and IPZ-2, based on extreme
Draft for Consultation

Ausable Bayfield Source Protection Area Updated Assessment Report December 10th
, 2014
ABMV Source Protection Region 4-16
event conditions, (such as a 100-year storm), and an understanding of contaminant transport to the intake. Activities occurring within an IPZ-3 can then be identified as significant drinking water threats if it can be shown through modeling that a release of a specific contaminant would result in an issue at the intake. The modelling conducted in the Ausable Bayfield SPA did not demonstrate any deterioration of the source of drinking water as a result of contaminants being transported to the LHPWSS during an extreme event. Therefore, no IPZ-3 was delineated. Finally, there may be a documented water quality issue at a drinking water source. An example would be water contamination that threatens to exceed drinking water standards and treatment is beyond the capacity of the water treatment plant. The Source Protection Committee has identified that if a contaminant of concern reaches half the maximum acceptable concentration, then it is an issue. Currently, no issues are known for the Source Protection Region’s municipal drinking water sources. However, there is evidence of nitrates trending toward this threshold in individual and test wells in Huron East in proximity to the sink holes. Also in Huron East, there was a history of radionuclides in the municipal wells in Seaforth. These wells have recently been replaced. However, there is concern that road salt use may contribute to the release of radionuclides. Further research is required for both these issues. A risk to drinking water sources exists where the land is sufficiently vulnerable and the threat is great enough. The amount of risk is identified for a location given the degree of vulnerability where there is or may be a prescribed threat under certain circumstances (as identified in the Table of Drinking Water Threats). The degrees of risk are significant, moderate or low. Identifying Threats The Assessment Report provides an inventory of possible threats. In simple terms, the present land use is identified for each parcel in wellhead protection areas or intake protection zones. Then a range of threats (as noted above) that are normally associated with that type of land use are assigned to the parcel. Finally, the risk associated with that threat activity is determined. This method takes into account intrinsic risk and does not consider risk management activities. In other words, it uses the precautionary principle. Source Protection Plan policies will be based on the potential or intrinsic risk. However, as part of the Assessment Report, an attempt is made to identify the number and type of significant risks that actually exist in each wellhead protection area. The only locations where significant threats based on activities could exist are in the wellhead protection areas throughout the ABMV Source Protection Region.
Draft for Consultation

Ausable Bayfield Source Protection Area Updated Assessment Report December 10th
, 2014
ABMV Source Protection Region 4-17
Ontario Regulation 287/07 prescribes drinking water threats. This list was established after extensive research on the part of the Ministry of the Environment. There are twenty-one threats listed and they pertain to both water quality and water quantity threats. Water quantity threats are considered in the Water Budget process (see Chapter 3). For water quality, the threats are activities which could result in the release of chemicals of concern and/or pathogens.Chemicals are man-made substances of distinct molecular composition. Pathogens are agents that cause infection or disease and can be microorganisms, such as bacteria or protozoa, or viruses. To understand if an area has the potential for significant, moderate or low threats, the reader should first determine which type of vulnerable area the property is located in. WHPA A – 100 metres around the wellhead WHPA B – Two year time-of-travel around the wellhead WHPA C – Five year time-of-travel around the wellhead WHPA D – Twenty-five year time-of-travel around the wellhead WHPA E – Two hour time-of-travel at a GUDI well* IPZ 1 – 1 km radius from lake intake or 120 m inland – See p. 4-5 IPZ 2 – Two hour time-of-travel from the intake SGRA – significant groundwater recharge area HVA – highly vulnerable aquifer *GUDI means the well is groundwater under direct influence of surface water. The vulnerability score should then be ascertained for the location. WHPAs range from 2 – 10 where 10 is the most vulnerable. The IPZ scores range from 4 – 6 and SGRAs and HVAs score 6 or less. The score is indicated by the colour on the map and map legend (see example below). Once these two factors are known, the reader can then look up the circumstances in which an activity might be of significant, moderate or low risk. This is done using the Table of Drinking Water Threats in Appendix A. For example, where the area is located in a WHPA A, the vulnerability score is 10 (signified by the red circle). By using the Table of Drinking Water Threats, one can determine the number and type of possible chemical, DNAPL or pathogen threats that may occur on the property. It does not mean that these threats exist rather that they might exist given the land uses on the property.
Draft for Consultation

Ausable Bayfield Source Protection Area Updated Assessment Report December 10th
, 2014
ABMV Source Protection Region 4-18
Below is a sample from the Table of Drinking Water Threats (MOE, 2009) which describes specific circumstances in which the threat activity would present a risk. Often the circumstance relates to the quantity of the chemical of concern (it is more risky to have 2,500 litres of fuel stored than 25 litres). Further, this Table provides the corresponding degrees of risk (significant, moderate, or low) depending on the groundwater vulnerability score (it is more risky to have 2,500 litres of fuel stored where the score is 10 than where the score is 6). Table 4.2 Sample from Drinking Water Threats Table
DRINKING WATER THREATS: Under the following
CIRCUMSTANCES:
Areas Within
Vulnerable Area
Threat is
Significant in
Areas with a
Vulnerability
Score of:
Threat is
Moderate in
Areas with a
Vulnerability
Score of:
Threat is Low in
Areas with a
Vulnerability
Score of:
Column 1 Column 2 Column 3 Column 4 Column 5 Column 6
IPZ-1, IPZ-2, IPZ-
3, and WHPA-E9 - 10 6 - 8.1
WHPA-A, WHPA-
B, WHPA-C,
WHPA-C1, WHPA-
D
10 8
HVA
SGRA
The management of
runoff that contains
chemicals used in the
de-icing of aircraft.
1. Runoff containing de-icing
materials may discharge to
land or water.
2. The runoff originates at a
remote airport.
3. The discharge may result
in the presence of Dioxane-
1,4 in groundwater or surface
water.
TABLE 1 – DRINKING WATER THREATS - CHEMICALS
The tables below summarize where in the vulnerable areas chemical, dense non-aqueous phase liquids (DNAPL) and pathogen threats, are or would be significant, moderate and low drinking water threats. The level of threat that an activity poses to a drinking water supply depends on the vulnerability scores within a vulnerable area. This table can be used in combination with the vulnerability maps that show vulnerability scores to determine where significant,
Draft for Consultation

Ausable Bayfield Source Protection Area Updated Assessment Report December 10th
, 2014
ABMV Source Protection Region 4-19
moderate and low threats can be found. In addition, this table and the vulnerability maps can be used in combination with Appendix A to determine the types of activities that would be deemed a significant, moderate and low drinking water threat in each area.
Table 4.3 Areas within Highly Vulnerable Aquifers Where Activities and Conditions are or would be Significant, Moderate and Low Drinking Water Threats
Threat Vulnerability
Score Threat Level Possible
Significant Moderate Low Chemical (including DNAPLs)
6
Pathogen 6 Table 4.4 Areas within Significant Groundwater Recharge Areas Where Activities and Conditions are or would be Significant, Moderate and Low Drinking Water Threats
Threat Vulnerability
Score Threat Level Possible
Significant Moderate Low Chemical (including DNAPLs)
6
Pathogen 6
Sources of Water Considered The Ausable Bayfield Source Protection Area has a surface water intake and wells serving municipal drinking water systems specified by the Clean Water Act, 2006 and identified in the Terms of Reference. These sources are the Great Lakes intake, which is the Lake Huron Primary Water Supply System (LHPWSS), and the nine wellheads identified as “Type 1 Wells” in the Technical Rules. Type 1 Wells are: existing and planned municipal drinking water systems that serve or are planned to serve major residential developments. This list was identified through the Terms of Reference.
Other sources of drinking water are not under consideration at this point. As MOECC guidance becomes available, municipalities may choose to elevate other systems into the source protection planning process.
Table 4.5 Areas within Intake Protection Zones Where Activities and Conditions are or would be Significant, Moderate and Low Drinking Water Threats
Threat IPZ Vulnerability
Score Threat Level Possible
Significant Moderate Low
Chemical (including DNAPLs)
IPZ-1
8 – 10
6 – 7
5
Draft for Consultation

Ausable Bayfield Source Protection Area Updated Assessment Report December 10th
, 2014
ABMV Source Protection Region 4-20
IPZ-2
8 – 9 6.3 – 7.9
4.2 – 5.9
<4.2
IPZ-3
8 – 9 6 – 7.9
4.5 – 5.9
< 4.5
Pathogen
IPZ-1
8 – 10
6 – 7
5
IPZ-2
8 – 9 6.3 – 7.9
4.2 – 5.9
<4.2 IPZ-3 0.8 – 9
Draft for Consultation
Ausable Bayfield Source Protection Area Updated Assessment Report December 10th
, 2014
ABMV Source Protection Region 4-21
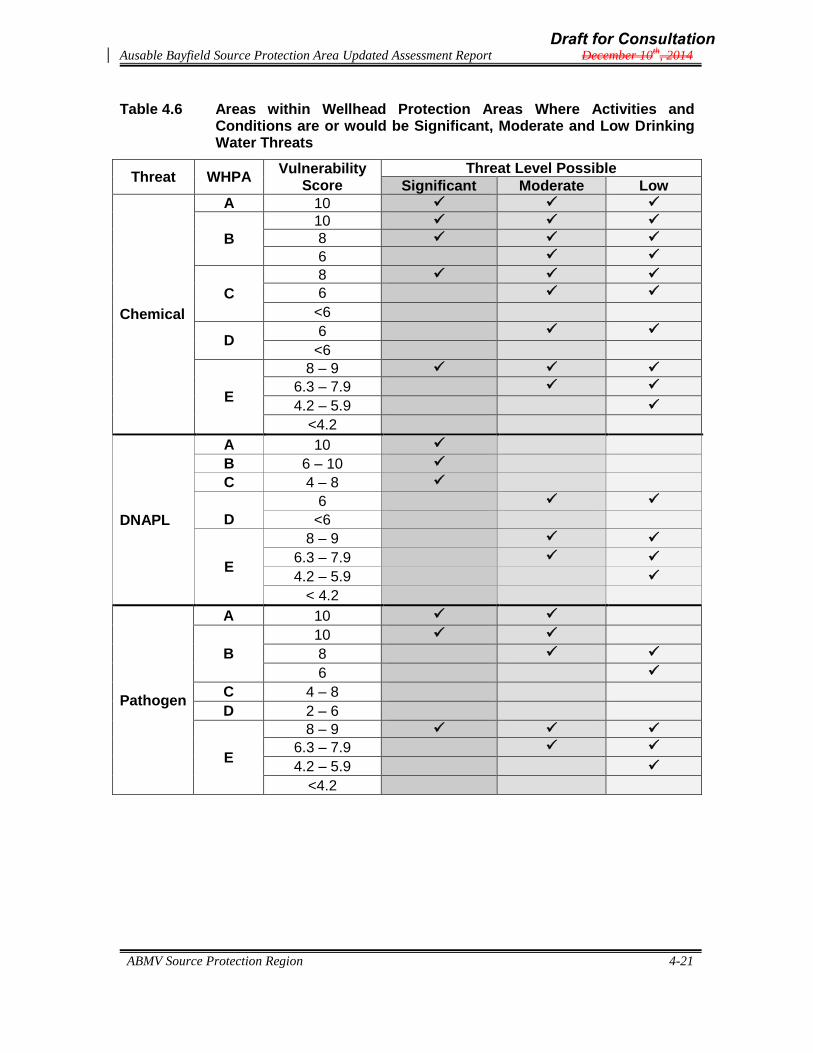
Table 4.6 Areas within Wellhead Protection Areas Where Activities and Conditions are or would be Significant, Moderate and Low Drinking Water Threats
Threat WHPA Vulnerability
Score Threat Level Possible
Significant Moderate Low
Chemical
A 10
B 10 8
6
C
8 6
<6
D 6
<6
E
8 – 9 6.3 – 7.9
4.2 – 5.9
<4.2
DNAPL
A 10 B 6 – 10 C 4 – 8
D
6
<6
E
8 – 9
6.3 – 7.9
4.2 – 5.9
< 4.2
Pathogen
A 10
B
10 8
6
C 4 – 8 D 2 – 6
E
8 – 9 6.3 – 7.9
4.2 – 5.9
<4.2
Draft for Consultation

Ausable Bayfield Source Protection Area Updated Assessment Report December 10th
, 2014
ABMV Source Protection Region 4-22
Methodology Notes
* The storage, handling and application of pesticides, fertilizers and agricultural source material associated with agricultural activities can result in surface water runoff and potential pathogen and chemical contamination. This report utilizes information on managed lands and livestock density as an indicator of areas in a watershed where intensive agricultural and other land management activities are conducted.
** Methodology for impervious surfaces is described on page 4-25.
Managed Lands Methodology
The purpose of the managed lands layer was to develop a portrayal of how much land was subject to human management. The management of land meant that the land was probably receiving nutrients or fertilizer. The managed land was created from all lands which were classed agricultural, large sports fields/golf courses, as well as a percentage of the residential area of all towns. A constraint was placed on the areas where land was managed to limit the area of interest to those areas where the vulnerability was ≥ 6 for areas reliant on groundwater and ≥ 4.4 for areas reliant on surface water. The methodology for the analysis was completed in two separate steps. While the steps were distinct from each other, the methodology was the same. First, using the wellhead protection and intake protection zones with vulnerability ≥ 6 for areas reliant on groundwater and ≥ 4.4 for areas reliant on surface water the datasets were united together and then exploded into distinct polygons. These polygons denoted areas that were physically separated from any other polygon. The Terranet parcel fabric was united with the areas of interest resulting in roadways being created via the closing of empty space between parcels. By using the MPAC property codes and farm operation codes those areas which were “managed” could be identified. The area was calculated for all areas with the designation of agricultural managed land vs. non-agricultural managed land being noted. In addition, the footprint of the towns and cities was merged into the dataset. Those areas of the town which were not agricultural were further adjusted to account for the potential for fertilizers to be applied to the grassed areas of the towns. For those non-agricultural areas the land base was considered to be .35 the area or 35% managed land. Given that unique polygons were created from the vulnerability polygons ≥ 6, the total areas for the polygons was created. The managed land was calculated and
Draft for Consultation

Ausable Bayfield Source Protection Area Updated Assessment Report December 10th
, 2014
ABMV Source Protection Region 4-23
then further adjusted for the urban footprints. It is possible to calculate the percentage managed through the following formula:
Managed Land Percentage = Agricultural managed land + ((town footprint parcels exclusive agricultural land and roads x 0.45) + non-agricultural managed land / total area for those areas of vulnerability ≥ 6 for areas reliant on groundwater and ≥ 4.4 for areas reliant on surface water in the source water region summarized by distinct polygon.
Second, the managed land for the HVA/SGRA was completed in the same manner as above except the areas were handled distinctly from the WHPA/IPZ analysis. This may result in percentage managed land edge match differences at the transition zone between WHPA areas and HVA areas which are portrayed by different colours where they meet. As well, where the score is less than 6 for areas reliant on groundwater and less than 4.4 for areas reliant on surface water, it is not included, thus it appears as the air photo on the maps. Nutrient Unit/Acre Methodology The purpose of the livestock density map was to develop a layer which showed the nutrient amounts per acre that were being generated. The livestock farms under consideration were limited to those in areas where the vulnerability was ≥ 6 for areas reliant on groundwater and ≥ 4.4 for areas reliant on surface water. There were two distinct methodologies used in the creation of the nutrient unit/acre maps and datasets. The first method was internal to the wellhead protection areas and intake protection zones and involved field verified animal numbers and nutrient calculations for estimating the nutrient units for any given property in the significant areas. The second method was completed in SGRA/HVA areas and involved the use of the agricultural census (2006) data for census consolidated subdivisions (CCS).
The areas internal to the WHPA and IPZ had the nutrient units (NU) calculated by estimating the nutrient units via field visits and air photo interpretation. To assist in the field visits a set of maps was created for those properties designated with MPAC farm operation codes indicating livestock was present for those properties with vulnerability scores ≥ 6 for areas reliant on groundwater and ≥ 4.4 for areas reliant on surface water. The property level maps were taken to the field by staff to record visit information such as the presence or absence of farm animals and the facilities to house the animals. These observations were completed via windshield survey. Information was written on the orthophoto based property level maps designating which barns housed animals. The barn footprints were digitized and a square footage for any given barn could be established. By combining the observed
Draft for Consultation

Ausable Bayfield Source Protection Area Updated Assessment Report December 10th
, 2014
ABMV Source Protection Region 4-24
animal species, provincial guide tables indicating NU/square foot for any given animal species, and the square footage of a barn, the overall nutrient units for any given farm could be estimated. All barns housing animals were calculated on any given farm property and then summarized by property. This created the total nutrients on any given property. The woodlots were removed from the property thereby creating the managed land of the property. Since some of the land for a given farm may lie outside the wellhead protection zone the NU were pro-rated to account for only the land internal to the wellhead protection zone. Two calculations are then completed. The first provides the NU/acre calculation for any give farm by summing the nutrient units/dividing by the hectares and then converting to NU/acre via a factor of 2.45. This provides the NU/acre for a given farm. The second calculation takes all the nutrient units calculated in a given wellhead protection area and sums them. The total agricultural managed land on the contributory farms is summed and an overall NU/acre is derived from these two summations. The maps portray the nutrient units per acre where the vulnerability is equal to or greater than 6 for areas reliant on groundwater and ≥ 4.4 for areas reliant on surface water and the lands are managed (e.g. Excluding the urban footprint or forested areas). Nutrient units in the HVA/SGRA areas were calculated from the agricultural census (2006) data using total agricultural managed land, animal numbers and finally NU/animal tables for generating NU/acre estimates for each census consolidated subdivision. The NU/acre was calculated for the entire CCS however when mapping only those HVA/SGRA areas with vulnerability ≥ 6 were symbolized (there are no HVA or SGRA in areas reliant on surface water in this region). This methodology required the Directors approval. It was determined that for areas outside wellheads, the vulnerability scores were low enough to preclude significant risks and the results of this methodology would be equivalent to those of the methodology used within the wellhead areas. ** Impervious Surface Methodology Impervious surfaces are mainly constructed surfaces such as sidewalks, roads and parking lots that are covered by impenetrable materials such as asphalt, concrete, brick, and stone. These materials seal surfaces, repel water and prevent precipitation and melt water from infiltrating soils. Impervious surfaces can generate large amounts of runoff during storm events. Road salt used during winter road maintenance is regarded as a threat, and the percentage of impervious surfaces is an indicator of the potential for impacts due to road salt. A map showing the percentage of impervious surface in defined vulnerable areas is provided at the municipal and wellhead level in this report.
Draft for Consultation

Ausable Bayfield Source Protection Area Updated Assessment Report December 10th
, 2014
ABMV Source Protection Region 4-25
The following is an explanation of the creation of the impervious surface layer. The first section is a list and explanation of the input datasets while the second section is an explanation of the methodology used in modifying the input datasets to create the resultant impervious surface layer. Input layers:
Significant groundwater recharge areas created previously during the water budget process. The areas with vulnerability scores ≥ 6 in this layer coincide with the highly vulnerable areas.
Wellhead protection areas delineating the municipal well capture zone areas for groundwater.
Intake protection zones delineating the capture areas for the surface water intakes.
The Terranet assessment parcel dataset. The dataset contains the boundaries of the land use parcels. Areas between the parcels represent roads.
Footprints layer. This layer represents a delineation of the built up or urban area for cities and towns. This layer is used to adjust the impervious surface in urban areas to account for buildings, parking lots and driveways.
Source Protection Region boundary. This layer is used to limit the data set to those areas inside the ABMV Source Protection Region.
This dataset was used to create 1 km square areas to reduce the analysis area for the study to 1 km. This allows the local features for any 1 km area to be captured and not lost in a large area averaging technique.
Methodology:
The SGRA/HVA, IPZ and WHPA all contained a vulnerability score created previously. Those areas which have a vulnerability score of ≥ 6 represent those areas where impervious surface threats can exist. These areas were merged together to create the area of interest to analyze.
The parcel fabric was united with the areas of interest. All areas which were not a parcel were assigned the classification of road as these contribute to the impervious surface. In addition, after merging the footprints of the town, any areas which were in a parcel in the town footprints were assigned an impervious percentage to account for the driveways and buildings. A factor of .45 was used representing 45% of a parcel being impervious in towns.
Draft for Consultation

Ausable Bayfield Source Protection Area Updated Assessment Report December 10th
, 2014
ABMV Source Protection Region 4-26
Additional datasets were united to limit the analysis to both the source water region as well as to provide the 1km grid area scope. The 1km grid, via a unique grid identifier for any given 1km square, was used to summarize the data. The final dataset represents the percentage of roads and 45 % of the town footprints (exclusive of the roads) in any area of vulnerability ≥ 6 divided by those areas of vulnerability ≥ 6 in any 1km square:
Percent Impervious = Road area + (town footprint exclusive of roads * .45) / area of interest for those areas of vulnerability ≥ 6 in the source water region based on a 1km grid summary.
The mapping of the impervious surface was completed using the standard symbology classes as required in the Mapping Symbology for the Clean Water Act, 2006 (MNR, 2009). The coloured areas on these maps represent only those areas with vulnerability ≥ 6. Therefore, some of the grid may contain impervious surface and some part of the grid cell may not. The inclusion of the 1km grid linework facilitates the understanding of how the impervious surface change occurs at the limits of any grid cell.
Draft for Consultation

Ausable Bayfield Source Protection Area Updated Assessment Report December 10th
, 2014
ABMV Source Protection Region 4-27
Approach to Significant Threat Enumeration
It should be noted that the identification of threats is based on a blend of field research and a “desktop” approach. The desktop approach relied on Municipal Parcel Assessment Corporation (MPAC) data. This data indicates the type of land use taking place and can be associated with certain types of activities and presence of related chemicals or pathogens. The North American Industry Classification System code (NAICS) data was helpful in associating chemicals typically used at various types of land uses. During the course of the preparation of this document, there was consultation with property owners in vulnerable areas where significant risks would exist. Information was provided by many land owners which helped to refine the data base used to enumerate significant threats. However, not all property owners responded to requests for such information. In these cases, the desktop approach was the best source of information. This approach made the assumptions that:
1. Home heating is oil, in a basement tank
2. Houses use septic tanks
3. Businesses (including home occupations), industries and agricultural uses the five-year year time-of-travel could store DNAPLs.
Due to these assumptions, the threat enumeration provided in the 2011 Assessment Report was conservative (assessing threats where there was no information to confirm absence of that threat). For the 2014 Updated Assessment Report, additional information was collected through site visits, landowner contact and drive-by assessments. For this approach, it was assumed properties that had a gas meter did not use heating oil and would not pose a significant threat for fuel. It was also assumed properties with access to municipal sewer did not have a septic system. Where there was insufficient information available to determine the presence or absence of a threat, a conservative approach was taken, and it was assumed the activity was a potential significant threat. As a result of this verification, the number of potential significant threats dropped significantly.
Threats are assigned to parcels, and represent the best information available at the time of writing. Numbers are expected to vary over time, according to changes in land use and activities, and as additional information becomes available.
Draft for Consultation

Ausable Bayfield Source Protection Area Updated Assessment Report December 10th
, 2014
ABMV Source Protection Region 4-28
Part 2 4.5 Municipal Profiles 4.5.1 Adelaide Metcalfe This township is located in the south western part of the source protection area. The portion of the municipality within the study area represents approximately one third of the land mass and one third of the population, approximately 860 people. There are no municipal residential drinking water sources in this area. There is limited access to the Lake Huron Primary Water Supply pipeline as this area has a dispersed population which is rural in character. Therefore, the majority of the population relies on individual wells. 4.5.1.1 Adelaide Metcalfe – HVAs and SGRAs Maps 4.4 and 4.5 show the locations of HVAs and SGRAs respectively in Adelaide Metcalfe. The vulnerability score for all HVAs is 6, while SGRAs can have a vulnerability score of 6, 4 or 2. There are no significant risks within these areas. Map 4.6 shows the percentage of impervious surface area; Map 4.7 shows the location and percentage of managed lands, and Map 4.8 shows the livestock density within HVAs and SGRAs (where the vulnerability score is 6) for Adelaide Metcalfe. Threats & Risk As there are no municipal residential drinking water sources and the vulnerability scores for the SGRAs and HVAs are 6 or less, there are no significant drinking water threats in this area (Table 4.7). Table 4.3 and 4.4 can be used in combination with Maps 4.4 and 4.5 to determine where chemical, pathogen, and DNAPL threats can be moderate and low risks in HVAs and SGRAs. In addition, Appendix A (Tables 17 and 18) can be used to determine the types of activities that would be deemed drinking water threats in HVAs and SGRAs. There are no known conditions or issues in the portion of the municipality within the AB SPA (Table 4.8). Table 4.7 Adelaide Metcalfe Risks to Drinking Water Summary
Threat Circumstance Number of Locations
None None None
Draft for Consultation

Ausable Bayfield Source Protection Area Updated Assessment Report December 10th
, 2014
ABMV Source Protection Region 4-29
Table 4.8 Adelaide Metcalfe Issues and Conditions
Drinking Water Issue Parameter
None None
Drinking Water Condition Threat
None None
4.5.2 Bluewater The Municipality of Bluewater is on the Lake Huron shore, extending from just north of Grand Bend and Exeter in the south to the Bayfield River in the north. It is entirely in the jurisdiction of Ausable Bayfield SPA. In 2006, the population was 7,120, an increase of 2.9% from 2001. Seasonal residents add approximately 2,500. Bluewater has attracted extensive shoreline development and pressure mounts to convert seasonal occupation to year-round. The main towns are Bayfield (population 900) and Hensall (population 1,081); smaller villages include Zurich, Dashwood and Varna. Cropland covers 88.5% of Bluewater. The main crops are soybeans, corn, winter wheat and dry white beans. Livestock density (cattle: 18/sq.km.; pigs: 257.2/sq.km.) is high for pigs, exceeding the Huron County density of 209.6/sq.km (Statistics Canada 2007). 4.5.2.1 Bluewater HVAs and SGRAs Maps 4.9 and 4.10 show the locations of HVAs and SGRAs respectively in the Municipality of Bluewater. HVAs occur in irregular patterns at the eastern boundary of the municipality. The largest area lies roughly between Zurich and Hensall. SGRAs run in linear bands of sand plain and spillways parallel to the Lake Huron shoreline. The vulnerability score for all HVAs is 6, while SGRAs can have a vulnerability score of 6, 4 or 2. There are no significant risks within these areas. Map 4.11 shows the percentage of impervious surface area; Map 4.12 shows the location and percentage of managed lands, and Map 4.13 shows the livestock density within HVAs and SGRAs (where the vulnerability score is 6) for Bluewater. Threats and Risks Since the vulnerability scores for the SGRAs and HVAs are 6 or less, only moderate and low drinking water threats may exist in this area. Tables 4.3 and 4.4 can be used in combination with Maps 4.9 and 4.10 to determine where chemical/pathogen/DNAPL threats can be moderate and low threats in HVAs and SGRAs in Bluewater. In addition, Appendix A (Tables 17 and 18) can be used to determine the types of activities that would be deemed drinking water
Draft for Consultation

Ausable Bayfield Source Protection Area Updated Assessment Report December 10th
, 2014
ABMV Source Protection Region 4-30
threats in HVAs and SGRAs. There are no known conditions or issues in the municipality. 4.5.2.2 LHPWSS Intake Protection Zone The Lake Huron Primary Water Supply System (LHPWSS) intake serves a population of about 350,000, approximately 4,000 of which are in Bluewater. The largest user is the City of London. Ontario Drinking Water Quality Standards were met in 100% of the tests in the latest available reporting period, April 1, 2007 to March 31, 2008. Bluewater uses 415,000 cubic metres per year. Current international agreements on water taking from the Great Lakes have no effect on this intake. Vulnerability Since the LHPWSS intake is more than one kilometre offshore, Intake Protection Zone-1 (IPZ-1) does not reach land (Map 4.14). Intake Protection Zone-2 (IPZ-2) extends 120 metres inland, up five gullies and drains; and approximately five kilometres from the municipal boundary, northward along the shoreline. IPZ-1 has a vulnerability score of 5, and IPZ-2 has a vulnerability score of 4 (Map 4.15 and Table 4.9). Table 4.9 indicates the vulnerability scores determined by the consultants and verified through peer review. Please see section 4.2 for more information about the Area Vulnerability Factor and Source Vulnerability Factor. Table 4.9 LHPWSS IPZ: Vulnerability Score Summary
Location Area
Vulnerability Factor
Source Vulnerability Factor
Vulnerability Score
IPZ 1 IPZ 2 IPZ 1 IPZ 2
Lake Huron
10
8 Medium
0.5 Low
5
4
Threats and Risks Table 4.10 indicates that no significant risks from chemicals, pathogens or DNAPLs would be present based on activities. Table 4.5 can be used in combination with Map 4.15 to determine where chemical and pathogen threats can be low risks in the intake protection zones for the LHPWSS. In addition, Appendix A, Table 74 can be used to determine the types of activities that would be deemed a low chemical threat in IPZ-1. Appendix A, Table 69 can be used to determine the types of activities that would be deemed a low pathogen threat in IPZ-1.
Draft for Consultation

Ausable Bayfield Source Protection Area Updated Assessment Report December 10th
, 2014
ABMV Source Protection Region 4-31
Table 4.10 LHPWSS IPZ: Enumeration of Potential Significant Threats
Significant Instances
Threat (numbered according to Ontario Reg. 287/07) Chemicals Pathogens DNAPL
Total: 0 0 0
Drinking Water Issues and Conditions Table 4.11 indicates that no issues with the intake or conditions resulting from past activities were identified within the IPZ. Using the events based approach, modelling was conducted to determine whether contaminants from the Grand Bend Sewage Treatment System, or a harbour marina could be transported to the intake during an extreme event. The modelling concluded that no contaminants transported to the intake during an extreme event would result in a deterioration of the water as a drinking water source. Thus no IPZ-3 was delineated. Table 4.11 LHPWSS IPZ: Issues and Conditions
Drinking Water Issue Parameter
None None
Drinking Water Condition Threat
None None
4.5.2.3 Wellhead Protection Areas Most of the population relies on the Lake Huron Primary Water Supply System (LHPWSS). Municipal residential groundwater systems serve the village of Zurich, and the community of Varna. small residential areas of Harbour Lights and Carriage Lane, both north of Bayfield. However, it should be noted that pursuant to section 14 of Ontario Regulation 287/07 under the Clean Water Act, 2006, the Municipality of Bluewater has passed a resolution to discontinue the use of the Carriage Lane and Harbour Lights well systems which are now included in this assessment report. Now that the resolution has passed, the municipality has five years to discontinue the use of the well systems in order to have them exempted from the requirements of the Clean Water Act and the policies of the source protection plan. When the municipality sends a notice to the source protection committee and source protection authority that the well systems have been taken out of service (and it must be taken out of service within five years of passing the resolution to qualify for this exemption), the source protection authority may then amend the source protection plan pursuant to section 34 of the Act to remove the well systems and any policies that were designed to protect them. Section 51 of the regulation provides the source protection authority the ability to make minor amendments to the plan, such as correcting errors, without having to go through formal consultation and seek Minister’s approval.
Draft for Consultation

Ausable Bayfield Source Protection Area Updated Assessment Report December 10th
, 2014
ABMV Source Protection Region 4-32
Prior to 2015, the Carriage Lane and Harbour Lights wells served two subdivisions north of Bayfield. The Municipally of Bluewater discontinued the use of the Carriage Lane and Harbour Lights well systems and these wells have been decommissioned. The communities are now served by the LHPWSS. The well systems were removed from the Assessment Report and Source Protection Plan. In 2017, the Municipally of Bluewater took over the ownership of the Varna well system. The Source Protection Plan was amended pursuant to section 34 of the Act to include the Varna well system. A very small part of Brucefield’s WHPA also extends into Bluewater. No new drinking water systems are planned. Map 4.14 shows the WHPAs for each of these systems. 4.5.2.3.1 Brucefield The following is a description of the Brucefield well system:
Location: The corner of Highway 4 and County Road 3
SPA: Both the well and WHPA are in the AB SPA
Year constructed: 1972
Depth: 88.4 m
Users Served: 175
Design Capacity: 458 m3/day (5.3 litres/second)
Permitted Rate: 270 m3/day (3.1 litres/second)
Average Usage: never exceeded 80 m3/day (0.9 litres/second)
Treatment: Chlorination and ultraviolet radiation
ODWS: Met in 100% of tests from April 1, 2011 to March 31, 2012 Groundwater Vulnerability Map 4.14 shows that the wellhead protection area extends about 5.7 km to the north east from the wellhead. Zone A of the WHPA also reaches less than 100 m into the Bluewater portion of the hamlet. Map 4.16 shows groundwater vulnerability for the WHPA. A vulnerability score of 10 applies to the WHPA-A, the 100 m radius around the well. All other WHPAs fall outside of Bluewater. Note that Map 4.16 was revised in 2014 to reflect updated transport pathway information. A review of transport pathways was conducted with the following results. Aquifer vulnerability within the Brucefield WHPA was adjusted for several undocumented wells that were inspected and georeferenced as part of the Well Location Update completed by the Ausable Bayfield Maitland Valley Source Protection Region (2007). These wells were located as part of the project, and were found to have wells that are out of compliance with provincial requirements for well
Draft for Consultation

Ausable Bayfield Source Protection Area Updated Assessment Report December 10th
, 2014
ABMV Source Protection Region 4-33
construction. Vulnerability was adjusted one level for a 30 m area surrounding the wells, based on the updated coordinates. Additional adjustments were completed for undocumented wells which were not visited as part of the Well Location Update. In these cases, wells were assumed to be within 30 m of the principal structure on the property, and vulnerability was therefore adjusted for 60 m surrounding the principal structure to account for the uncertainty with both the location of the well and the condition of the well. No adjustments to the urban area were incorporated into the WHPA as all residences are on municipal water, there were not sufficient records of wells which pre-date the system, and the depth to the services (placed at typical depths) are insignificant in comparison to the depth to the municipal supply aquifer. Threats and Risks Table 4.12 Column 1 lists the drinking water threats in Brucefield’s WHPA. They are all prescribed drinking water threats listed in Subsection 1.1(1) of Ontario Regulation 287/07. No other type of local threat was identified. Table 4.12 also indicates the number of significant threat instances for each threat type. Appendix A provides details on circumstances pertaining to these threats. No other local circumstances were identified. Map 4.17 shows the percentage of impervious surface area; Map 4.18 shows the location and percentage of managed lands, and Map 4.19 shows the livestock density located within the Brucefield WHPA. Maps 4.20, 4.21, and 4.22 show the areas where chemicals, pathogens, and DNAPLs can be a significant, moderate, or low drinking water threat within the Brucefield WHPA. The tables embedded on these maps refer to the provincial tables found in Appendix A, which list the specific circumstances in which an activity may be a significant, moderate or low drinking water threat. The provincial tables are separated based on the vulnerable area, and vulnerability score.
Draft for Consultation
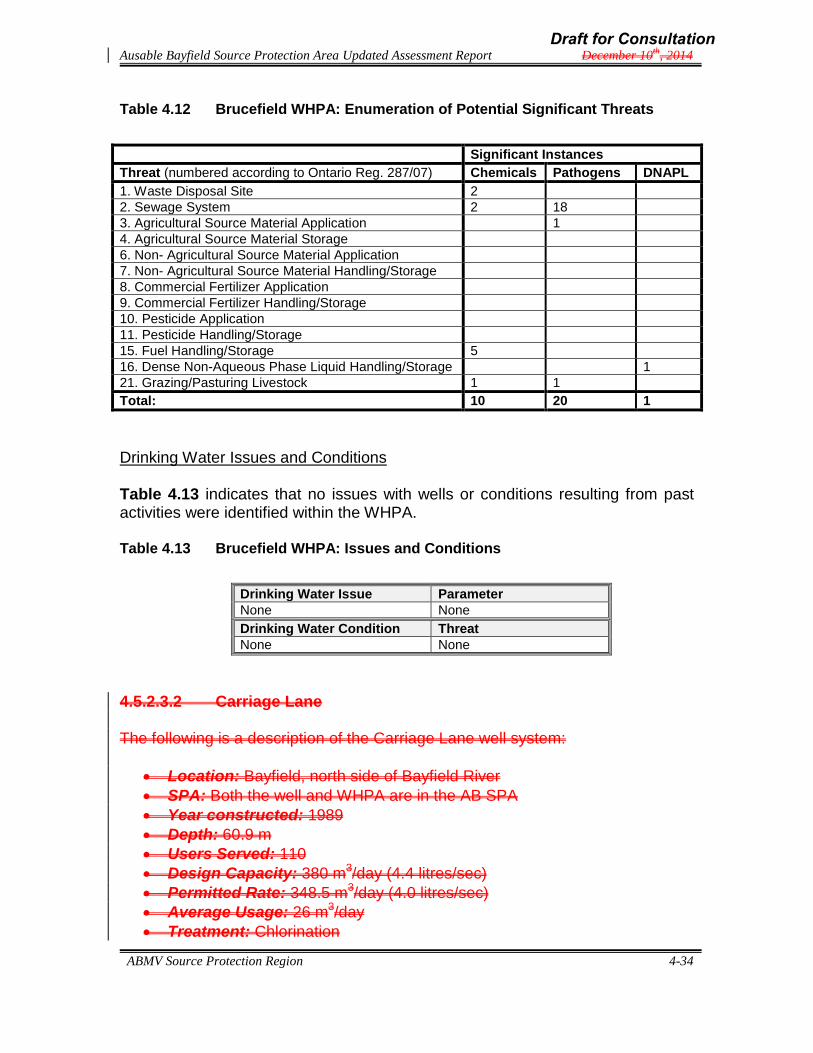
Ausable Bayfield Source Protection Area Updated Assessment Report December 10th
, 2014
ABMV Source Protection Region 4-34
Table 4.12 Brucefield WHPA: Enumeration of Potential Significant Threats
Significant Instances
Threat (numbered according to Ontario Reg. 287/07) Chemicals Pathogens DNAPL
1. Waste Disposal Site 2
2. Sewage System 2 18
3. Agricultural Source Material Application 1
4. Agricultural Source Material Storage
6. Non- Agricultural Source Material Application
7. Non- Agricultural Source Material Handling/Storage
8. Commercial Fertilizer Application
9. Commercial Fertilizer Handling/Storage
10. Pesticide Application
11. Pesticide Handling/Storage
15. Fuel Handling/Storage 5
16. Dense Non-Aqueous Phase Liquid Handling/Storage 1
21. Grazing/Pasturing Livestock 1 1
Total: 10 20 1
Drinking Water Issues and Conditions Table 4.13 indicates that no issues with wells or conditions resulting from past activities were identified within the WHPA. Table 4.13 Brucefield WHPA: Issues and Conditions
Drinking Water Issue Parameter
None None
Drinking Water Condition Threat
None None
4.5.2.3.2 Carriage Lane The following is a description of the Carriage Lane well system:
Location: Bayfield, north side of Bayfield River
SPA: Both the well and WHPA are in the AB SPA
Year constructed: 1989
Depth: 60.9 m
Users Served: 110
Design Capacity: 380 m3/day (4.4 litres/sec)
Permitted Rate: 348.5 m3/day (4.0 litres/sec)
Average Usage: 26 m3/day
Treatment: Chlorination
Draft for Consultation
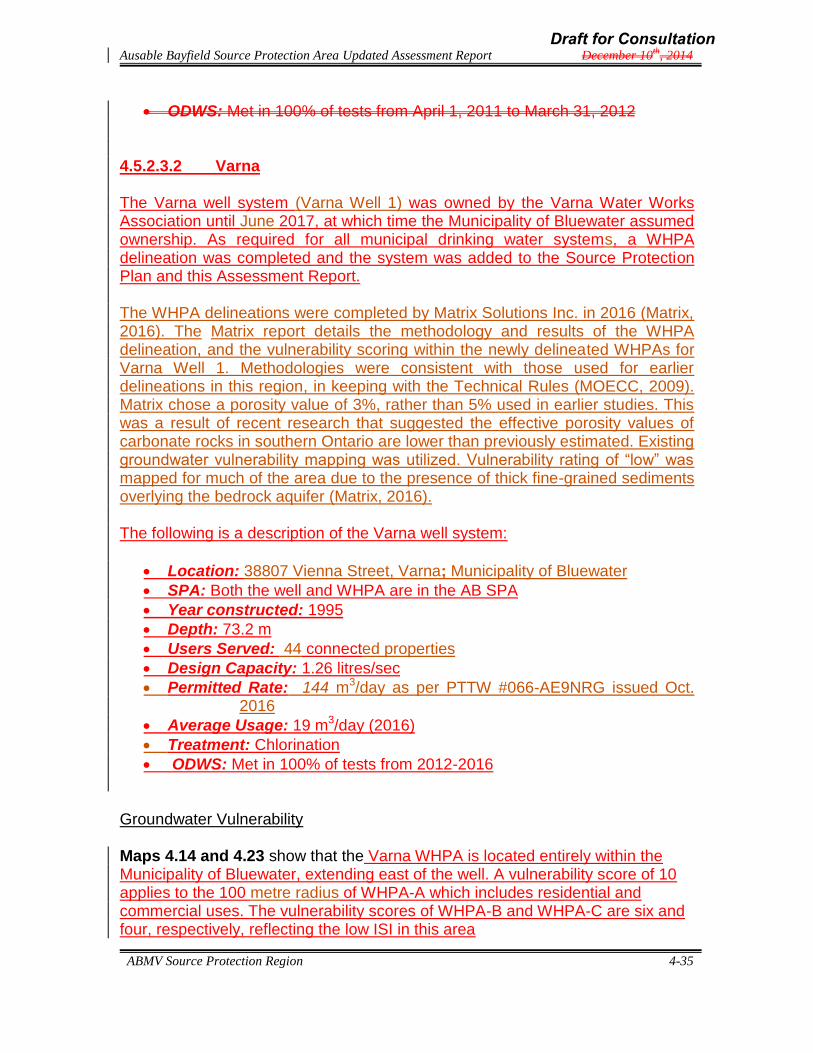
Ausable Bayfield Source Protection Area Updated Assessment Report December 10th
, 2014
ABMV Source Protection Region 4-35
ODWS: Met in 100% of tests from April 1, 2011 to March 31, 2012 4.5.2.3.2 Varna The Varna well system (Varna Well 1) was owned by the Varna Water Works Association until June 2017, at which time the Municipality of Bluewater assumed ownership. As required for all municipal drinking water systems, a WHPA delineation was completed and the system was added to the Source Protection Plan and this Assessment Report. The WHPA delineations were completed by Matrix Solutions Inc. in 2016 (Matrix, 2016). The Matrix report details the methodology and results of the WHPA delineation, and the vulnerability scoring within the newly delineated WHPAs for Varna Well 1. Methodologies were consistent with those used for earlier delineations in this region, in keeping with the Technical Rules (MOECC, 2009). Matrix chose a porosity value of 3%, rather than 5% used in earlier studies. This was a result of recent research that suggested the effective porosity values of carbonate rocks in southern Ontario are lower than previously estimated. Existing groundwater vulnerability mapping was utilized. Vulnerability rating of “low” was mapped for much of the area due to the presence of thick fine-grained sediments overlying the bedrock aquifer (Matrix, 2016). The following is a description of the Varna well system:
Location: 38807 Vienna Street, Varna; Municipality of Bluewater
SPA: Both the well and WHPA are in the AB SPA
Year constructed: 1995
Depth: 73.2 m
Users Served: 44 connected properties
Design Capacity: 1.26 litres/sec
Permitted Rate: 144 m3/day as per PTTW #066-AE9NRG issued Oct. 2016
Average Usage: 19 m3/day (2016)
Treatment: Chlorination
ODWS: Met in 100% of tests from 2012-2016 Groundwater Vulnerability Maps 4.14 and 4.23 show that the Varna WHPA is located entirely within the Municipality of Bluewater, extending east of the well. A vulnerability score of 10 applies to the 100 metre radius of WHPA-A which includes residential and commercial uses. The vulnerability scores of WHPA-B and WHPA-C are six and four, respectively, reflecting the low ISI in this area
Draft for Consultation
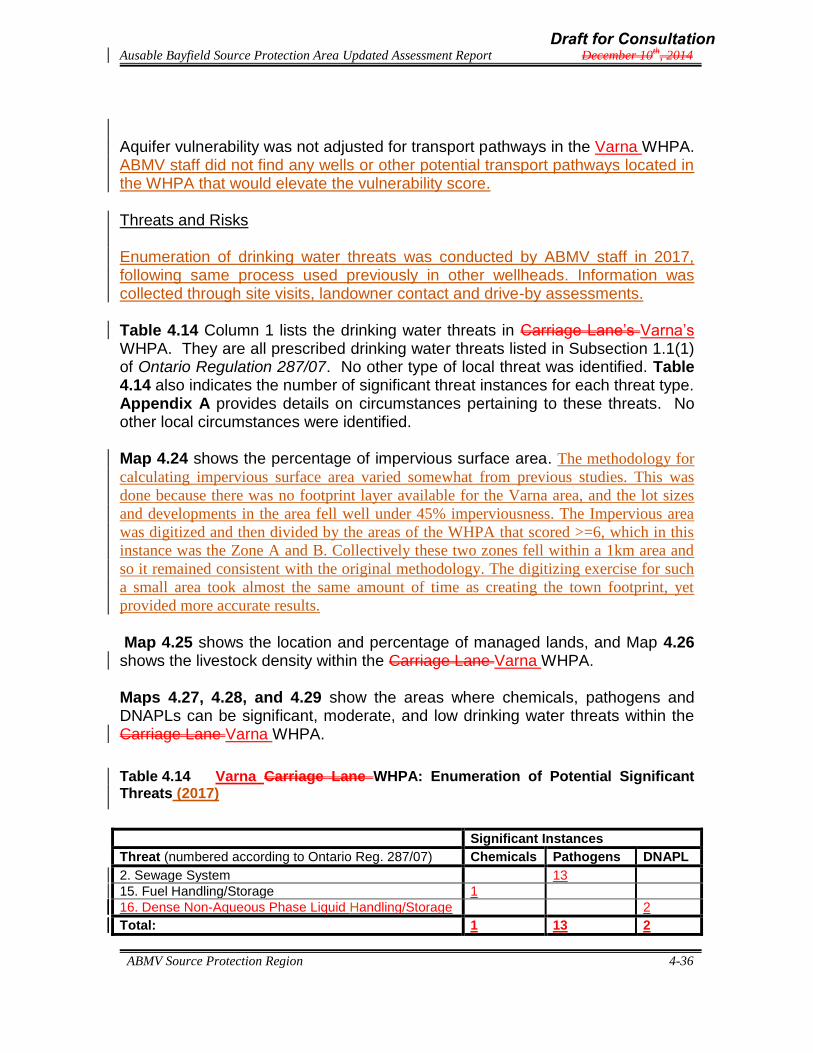
Ausable Bayfield Source Protection Area Updated Assessment Report December 10th
, 2014
ABMV Source Protection Region 4-36
Aquifer vulnerability was not adjusted for transport pathways in the Varna WHPA. ABMV staff did not find any wells or other potential transport pathways located in the WHPA that would elevate the vulnerability score. Threats and Risks Enumeration of drinking water threats was conducted by ABMV staff in 2017, following same process used previously in other wellheads. Information was collected through site visits, landowner contact and drive-by assessments. Table 4.14 Column 1 lists the drinking water threats in Carriage Lane’s Varna’s WHPA. They are all prescribed drinking water threats listed in Subsection 1.1(1) of Ontario Regulation 287/07. No other type of local threat was identified. Table 4.14 also indicates the number of significant threat instances for each threat type. Appendix A provides details on circumstances pertaining to these threats. No other local circumstances were identified. Map 4.24 shows the percentage of impervious surface area. The methodology for
calculating impervious surface area varied somewhat from previous studies. This was
done because there was no footprint layer available for the Varna area, and the lot sizes
and developments in the area fell well under 45% imperviousness. The Impervious area
was digitized and then divided by the areas of the WHPA that scored >=6, which in this
instance was the Zone A and B. Collectively these two zones fell within a 1km area and
so it remained consistent with the original methodology. The digitizing exercise for such
a small area took almost the same amount of time as creating the town footprint, yet
provided more accurate results.
Map 4.25 shows the location and percentage of managed lands, and Map 4.26 shows the livestock density within the Carriage Lane Varna WHPA. Maps 4.27, 4.28, and 4.29 show the areas where chemicals, pathogens and DNAPLs can be significant, moderate, and low drinking water threats within the Carriage Lane Varna WHPA.
Table 4.14 Varna Carriage Lane WHPA: Enumeration of Potential Significant Threats (2017)
Significant Instances
Threat (numbered according to Ontario Reg. 287/07) Chemicals Pathogens DNAPL
2. Sewage System 13
15. Fuel Handling/Storage 1
16. Dense Non-Aqueous Phase Liquid Handling/Storage 2
Total: 1 13 2
Draft for Consultation

Ausable Bayfield Source Protection Area Updated Assessment Report December 10th
, 2014
ABMV Source Protection Region 4-37
Drinking Water Issues and Conditions Table 4.15 indicates that no issues with wells or conditions resulting from past activities were identified within the WHPA. Table 4.15 Carriage Lane Varna WHPA: Issues and Conditions
Drinking Water Issue Parameter
None None
Drinking Water Condition Threat
None None
4.5.2.3.3 Harbour LightsDeleted The following is a description of the Harbour Lights well system:
Location: 15 Harbour Ct. Bayfield
SPA: Both the well and WHPA are in the AB SPA
Year constructed: 1992
Depth: 32.9 m
Users Served: 125
Design Capacity: 320 m3/day (3.7 litres/second)
Permitted Rate: 111.6 m3/day (1.3 litres/second)
Average Usage: less than 31 m3/day (0.4 litres/second)
Treatment: Chlorination
ODWS: Met in 100% of tests from April 1, 2011 to March 31, 2012 Groundwater Vulnerability Map 4.14 and 4.30 show the Bluewater portion of the WHPA includes WHPA-A, the only area with a vulnerability score of 10, which is a residential area. The remainder of the WHPA in Bluewater is part of WHPA-B, which is also residential lots and has a vulnerability score of 6. The reader should note that the Harbour Lights system is planned for decommissioning as described in Section 4.5.2.3 above. A review of transport pathways was conducted with the following results. Aquifer vulnerability within the Harbour Lights WHPA was adjusted for several undocumented wells which were not visited as part of the Well Location Update. In this case, the wells were assumed to be within 30 m of the principal structure on the property, and vulnerability was therefore adjusted for 60 m surrounding the principal structure to account for the uncertainty with both the location of the well and the condition of the well.
Draft for Consultation

Ausable Bayfield Source Protection Area Updated Assessment Report December 10th
, 2014
ABMV Source Protection Region 4-38
No adjustments to the urban area were incorporated into the WHPA as all residences are on municipal water, there were not sufficient records of wells which pre-date the system, and the depth to the services (placed at typical depths) are insignificant in comparison to the depth to the municipal supply aquifer. Threats and Risks Table 4.16 Column 1 lists the drinking water threats in Harbour Lights’ WHPA. They are all prescribed drinking water threats listed in Subsection 1.1(1) of Ontario Regulation 287/07. No other type of local threat was identified. Table 4.16 also indicates the number of significant threat instances for each threat type. Appendix A provides details on circumstances pertaining to these threats. No other local circumstances were identified. Map 4.31 shows the percentage of impervious surface area; Map 4.32 shows the location and percentage of managed lands, and Map 4.33 shows the livestock density within the Harbour Lights WHPA. Maps 4.34, 4.35, and 4.36 show the areas where chemicals, pathogens and DNAPLs can be significant moderate or low drinking water threats within the Harbour Lights WHPA. The tables embedded on these maps refer to the provincial tables found in Appendix A, which list the specific circumstances in which an activity may be a significant, moderate or low drinking water threat. The provincial tables are separated based on the vulnerable area, and vulnerability score.
Table 4.16 Harbour Lights WHPA: Enumeration of Potential Significant Threats
Significant Instances
Threat (numbered according to Ontario Reg. 287/07) Chemicals Pathogens DNAPL
2. Sewage System 8
15. Fuel Handling/Storage 8
Total: 8 8 0
Drinking Water Issues and Conditions Table 4.17 indicates that no issues with wells or conditions resulting from past activities were identified within the WHPA.
Draft for Consultation
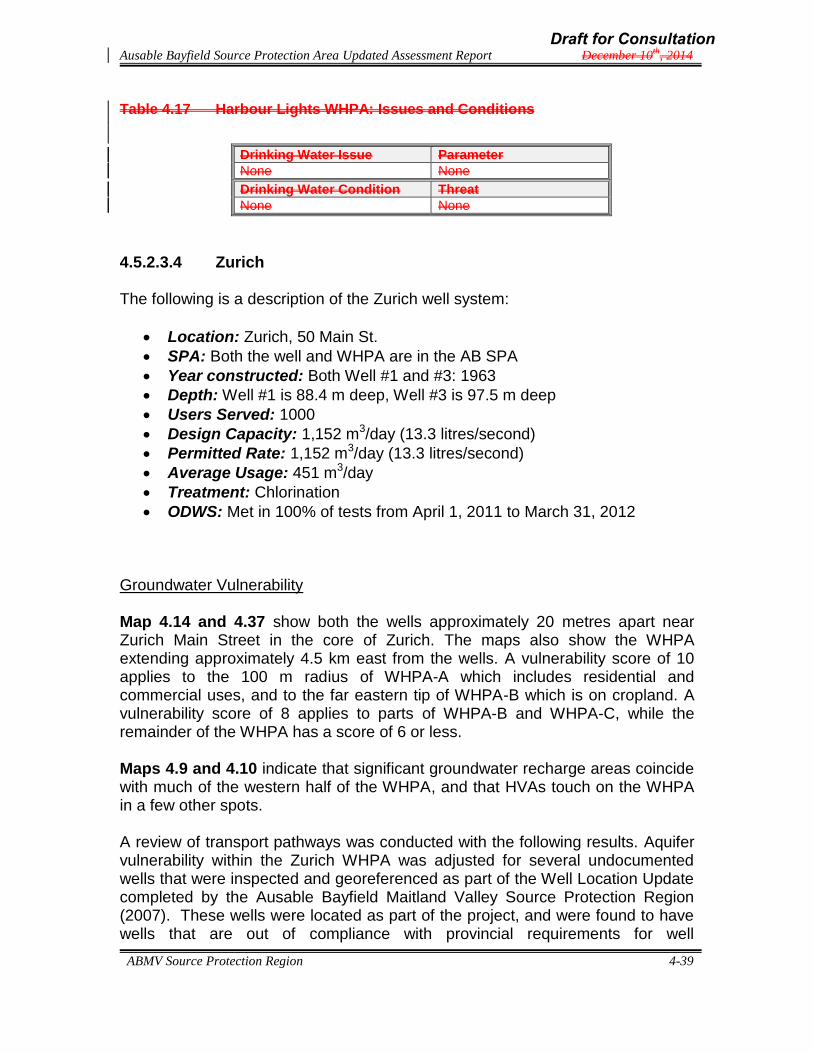
Ausable Bayfield Source Protection Area Updated Assessment Report December 10th
, 2014
ABMV Source Protection Region 4-39
Table 4.17 Harbour Lights WHPA: Issues and Conditions
Drinking Water Issue Parameter
None None
Drinking Water Condition Threat
None None
4.5.2.3.4 Zurich The following is a description of the Zurich well system:
Location: Zurich, 50 Main St.
SPA: Both the well and WHPA are in the AB SPA
Year constructed: Both Well #1 and #3: 1963
Depth: Well #1 is 88.4 m deep, Well #3 is 97.5 m deep
Users Served: 1000
Design Capacity: 1,152 m3/day (13.3 litres/second)
Permitted Rate: 1,152 m3/day (13.3 litres/second)
Average Usage: 451 m3/day
Treatment: Chlorination
ODWS: Met in 100% of tests from April 1, 2011 to March 31, 2012 Groundwater Vulnerability Map 4.14 and 4.37 show both the wells approximately 20 metres apart near Zurich Main Street in the core of Zurich. The maps also show the WHPA extending approximately 4.5 km east from the wells. A vulnerability score of 10 applies to the 100 m radius of WHPA-A which includes residential and commercial uses, and to the far eastern tip of WHPA-B which is on cropland. A vulnerability score of 8 applies to parts of WHPA-B and WHPA-C, while the remainder of the WHPA has a score of 6 or less. Maps 4.9 and 4.10 indicate that significant groundwater recharge areas coincide with much of the western half of the WHPA, and that HVAs touch on the WHPA in a few other spots. A review of transport pathways was conducted with the following results. Aquifer vulnerability within the Zurich WHPA was adjusted for several undocumented wells that were inspected and georeferenced as part of the Well Location Update completed by the Ausable Bayfield Maitland Valley Source Protection Region (2007). These wells were located as part of the project, and were found to have wells that are out of compliance with provincial requirements for well
Draft for Consultation

Ausable Bayfield Source Protection Area Updated Assessment Report December 10th
, 2014
ABMV Source Protection Region 4-40
construction. Vulnerability was adjusted one level for a 30 m area surrounding the wells, based on the updated coordinates. Additional adjustments were completed for undocumented wells which were not visited as part of the Well Location Update. In these cases, wells were assumed to be within 30 m of the principal structure on the property, and vulnerability was therefore adjusted for 60 m surrounding the principal structure to account for the uncertainty with both the location of the well and the condition of the well. No adjustments to the urban area were incorporated into the WHPA as all residences are on municipal water, there were not sufficient records of wells which pre-date the system, and the depth to the services (placed at typical depths) are insignificant in comparison to the depth to the municipal supply aquifer. Threats and Risks Table 4.18 Column 1 lists the drinking water threats in Zurich’s WHPA. They are all prescribed drinking water threats listed in Subsection 1.1(1) of Ontario Regulation 287/07. No other type of local threat was identified. Table 4.18 also indicates the number of significant threat instances for each threat type. Appendix A provides details on circumstances pertaining to these threats, see MOE (2009). No other local circumstances were identified. Map 4.38 shows the percentage of impervious surface area; Map 4.39 shows the location and percentage of managed lands; and Map 4.40 shows the livestock density within the Zurich WHPA. Maps 4.41, 4.42, and 4.43 show the areas where chemical, pathogen and DNAPL threats can be significant moderate or low. The tables embedded on these maps refer to the provincial tables found in Appendix A, which list the specific circumstances in which an activity may be a significant, moderate or low drinking water threat. The provincial tables are separated based on the vulnerable area, and vulnerability score.
Draft for Consultation

Ausable Bayfield Source Protection Area Updated Assessment Report December 10th
, 2014
ABMV Source Protection Region 4-41
Table 4.18 Zurich WHPA: Enumeration of Potential Significant Threats
Significant Instances
Threat (numbered according to Ontario Reg. 287/07) Chemicals Pathogens DNAPL
1. Waste Disposal Site 3
2. Sewage System 0
10. Pesticide Application 1
15. Fuel Handling/Storage 5
16. Dense Non-Aqueous Phase Liquid handling/Storage 6
Total: 9 0 6
Drinking Water Issues and Conditions Table 4.19 indicates that no issues with wells or conditions resulting from past activities were identified within the WHPA. Table 4.19 Zurich WHPA: Issues and Conditions
Drinking Water Issue Parameter
None None
Drinking Water Condition Threat
None None
4.5.3 Central Huron The Municipality of Central Huron is located on Lake Huron and falls entirely within the Source Protection Region, extending from the Maitland River in the north to the Bayfield River in the south. By Conservation Authority jurisdiction, Central Huron is 76% in Maitland Valley and 24% in Ausable Bayfield. The 2006 permanent population was 7,641, a decrease of 2.1% since 2001. There are also seasonal residents. The main town is Clinton (2006 population 3,082), upstream on the Bayfield River. Central Huron has attracted extensive shoreline development and pressure mounts to convert from seasonal occupation to year round. Two-thirds of the municipality is in crops – mainly soybeans, corn and winter wheat. Livestock density (cattle: 24.7/km2.; pigs: 126.2/km2.), while low compared to the rest of Huron County, substantially exceeds Western Ontario’s average pig density of 78.7/km2 (Statistics Canada 2007). 4.5.3.1 Central Huron – HVAs and SGRAs Maps 4.44 and 4.45 show the locations of highly vulnerable aquifers and significant groundwater recharge areas respectively in Central Huron. Most HVAs are scattered east from Holmesville. Two small HVAs fall in the west
Draft for Consultation
Ausable Bayfield Source Protection Area Updated Assessment Report December 10th
, 2014
ABMV Source Protection Region 4-42
portion: one just beyond the south east corner of Goderich and the other immediately across the Maitland River from Benmiller. SGRAs correspond to coarse-textured physiographic units which generally run north/south across the municipality: a sand plain in a broad band near the Lake Huron shore, and spillways and kame moraines covering much of the east half of Central Huron. The vulnerability score for all HVAs is 6, while SGRAs can have a vulnerability score of 6, 4 or 2. Map 4.46 shows the percentage of impervious surface area; Map 4.47 shows the location and percentage of managed lands; and Map 4.48 shows the livestock density within HVAs and SGRAs for Central Huron. Threats and Risks Since the vulnerability scores for the SGRAs and HVAs are 6 or less, only moderate and low drinking water threats may exist in this area. Tables 4.3 and 4.4 can be used in combination with Maps 4.44 and 4.45 to determine where chemical/pathogen/DNAPL threats can be moderate and low threats in HVAs and SGRAs in Central Huron. In addition, Appendix A (Tables 17 and 18) can be used to determine the types of activities that would be deemed drinking water threats in HVAs and SGRAs. There are no known conditions or issues in the municipality. 4.5.3.2 Wellhead Protection Areas Central Huron’s major well field is at Clinton. Smaller well systems are associated with shoreline development and include: McClinchey, Kelly, Vandewetering and SAM. Auburn is also in Central Huron, though most of its WHPA extends into North Huron. Other well systems are outside Central Huron but have WHPAs that reach into the municipality. These include Harbour Lights and Carriage Lane wells which are in Bluewater, and Benmiller which is in Ashfield-Colborne-Wawanosh. The Benmiller well is located in Ashfield-Colborne-Wawanosh but its WHPA extends into Central Huron. The SAM WHPA extends in an eastern direction, consistent with the overall regional potentiometric gradient. The deep valley of the nearby Bayfield River causes a local depression in the regional potentiometric surface, the resultant WHPAs for the Harbour Lights and Carriage Lane wells located just north of this valley have north-easterly orientation. However, it should be noted that pursuant to section 14 of Ontario Regulation 287/07 under the Clean Water Act, 2006, the Municipality of Bluewater has passed a resolution to discontinue the use of the Carriage Lane and Harbour Lights well systems which are now included in this assessment report. Now that the resolution has passed, the municipality has five years to discontinue the use of the well systems in order to have it exempted from the requirements of the Clean Water Act, 2006 and the policies of the source protection plan. When the municipality sends a notice to the source
Draft for Consultation

Ausable Bayfield Source Protection Area Updated Assessment Report December 10th
, 2014
ABMV Source Protection Region 4-43
protection committee and source protection authority that the well systems have been taken out of service (and it must be taken out of service within five years of passing the resolution to qualify for this exemption), the source protection authority may then amend the source protection plan pursuant to section 34 of the Act to remove the well systems and any policies that were designed to protect them. Section 51 of the regulation provides the source protection authority the ability to make minor amendments to the plan, such as correcting errors, without having to go through formal consultation and seek Minister’s approval. Map 4.49 shows the locations of each of the WHPAs in the municipality. Only wells or WHPAs that fall within the Ausable Bayfield SPA will be discussed in this section. 4.5.3.2.1 Deleted Carriage Lane
The following is a description of the Carriage Lane well system:
Location: Bayfield, north side of Bayfield River
SPA: Both the well and WHPA are in the AB SPA
Year constructed: 1989
Depth: 60.9 m
Users Served: 110
Design Capacity: 380 m3/day (4.4 litres/sec)
Permitted Rate: 348.5 m3/day (4.0 litres/sec)
Average Usage: 26 m3/day
Treatment: Chlorination
ODWS: Met in 100% of tests from April 1, 2011 to March 31, 2012 Groundwater Vulnerability Maps 4.23 and 4.49 show the WHPA extends 1.25 km north-east from the well with about 1 km in Central Huron. The Central Huron portion of the WHPA includes WHPA-C, WHPA-D, and part of WHPA-B. All of these areas have a vulnerability score of 6 or less. The reader should note that the Carriage Lane system is planned for decommissioning as described in Section 4.5.3.2 above. Aquifer vulnerability was not adjusted for transport pathways in the Carriage Lane WHPA. Threats and Risks Table 4.20 Column 1 lists the drinking water threats in Carriage Lane’s WHPA. They are all prescribed drinking water threats listed in Subsection 1.1(1) of Ontario Regulation 287/07. No other type of local threat was identified. Table
Draft for Consultation

Ausable Bayfield Source Protection Area Updated Assessment Report December 10th
, 2014
ABMV Source Protection Region 4-44
4.20 also indicates the number of significant threat instances for each threat type. Appendix A provides details on circumstances pertaining to these threats. No other local circumstances were identified. Map 4.24 shows the percentage of impervious surface area; Map 4.25 shows the location and percentage of managed lands, and Map 4.26 shows the livestock density within the Carriage Lane WHPA. Maps 4.27, 4.28, and 4.29 show the areas where chemical, pathogen and DNAPL threats can be significant, moderate, or low. The tables embedded on these maps refer to the provincial tables found in Appendix A, which list the specific circumstances in which an activity may be a significant, moderate or low drinking water threat. The provincial tables are separated based on vulnerable area, and vulnerability score.
Table 4.20 Deleted Carriage Lane WHPA: Enumeration of Potential Significant
Threats
Significant Instances
Threat (numbered according to Ontario Reg. 287/07) Chemicals Pathogens DNAPL
2. Sewage System 8
15. Fuel Handling/Storage 6
Total: 6 8 0
Drinking Water Issues and Conditions Table 4.21 indicates that no issues with wells or conditions resulting from past activities were identified within the WHPA. Table 4.21 DeletedCarriage Lane WHPA: Issues and Conditions
Drinking Water Issue Parameter
None None
Drinking Water Condition Threat
None None
4.5.3.2.2 Clinton The following is a description of the Clinton well system:
Location: The three wells are all located in the vicinity of Park Lane and Princess Street in Clinton, one of which is located at 17 Park Lane
Draft for Consultation

Ausable Bayfield Source Protection Area Updated Assessment Report December 10th
, 2014
ABMV Source Protection Region 4-45
SPA: All three wells are in AB SPA, WHPA extends into MV SPA
Year constructed: Well #3 – Established early 1900’s, no record for other 2 wells.
Depth: Well #1 – 99 m, Well #2 – 108 m, Well #3 – 110 m
Users Served: 4500
Design Capacity: 4838 m3/day (56 litres/second)
Permitted Rate: No known rate
Average Usage: Has been less than 2065 m3/day (23.7 litres/second) or 43% capacity
Treatment: Gas Chlorination
ODWS: Met in 100% of tests from April 1, 2011 to March 31, 2012 Groundwater Vulnerability Map 4.49 shows the wellhead protection area (WHPA) extending almost 15 km north-eastward into the agricultural land in the Maitland Valley SPA. Map 4.50 shows the vulnerability scores for the WHPA. WHPA-A, the immediate 100 m radius of the wells has a score of 10, while all other areas that fall within the AB SPA have a score of 6 or less. Parts of WHPA-B and WHPA-C have a vulnerability score of 8, but these are located in the Maitland Valley SPA. Note that Map 4.50 was revised in 2014 to reflect updated transport pathway information. A review of transport pathways was conducted with the following results. Aquifer vulnerability within the Clinton WHPA was adjusted for several undocumented wells that were inspected and georeferenced as part of the Well Location Update completed by the Ausable Bayfield Maitland Valley Source Protection Region (2007). These wells were located as part of the project, and were found to have wells that are out of compliance with provincial requirements for well construction. Vulnerability was adjusted one level for a 30 m area surrounding the wells, based on the updated coordinates. Additional adjustments were completed for undocumented wells which were not visited as part of the Well Location Update. In these cases, wells were assumed to be within 30 m of the principal structure on the property, and vulnerability was therefore adjusted for 60 m surrounding the principal structure to account for the uncertainty with both the location of the well and the condition of the well. No adjustments to the urban area were incorporated into the WHPA as all residences are on municipal water, there were not sufficient records of wells which pre-date the system, and the depth to the services (placed at typical depths) are insignificant in comparison to the depth to the municipal supply aquifer.
Draft for Consultation

Ausable Bayfield Source Protection Area Updated Assessment Report December 10th
, 2014
ABMV Source Protection Region 4-46
Threats and Risks Table 4.22 Column 1 lists the drinking water threats in Clinton’s WHPA. They are all prescribed drinking water threats listed in Subsection 1.1(1) of Ontario Regulation 287/07. No other type of local threat was identified. Table 4.22 also indicates the number of significant threat instances for each threat type. Appendix A provides details on circumstances pertaining to these threats. No other local circumstances were identified. Map 4.51 shows the percentage of impervious surface area; Map 4.52 shows the location and percentage of managed lands, and Map 4.53 shows the livestock density within the Clinton WHPA. Maps 4.54, 4.55, and 4.56 show the areas where chemical, pathogen and DNAPL threats can be significant moderate or low. The tables embedded on these maps refer to the provincial tables found in Appendix A, which list the specific circumstances in which an activity may be a significant, moderate or low drinking water threat. The provincial tables are separated based on vulnerable area, and vulnerability score. Table 4.22 Clinton WHPA: Enumeration of Potential Significant Threats
Significant Instances
Threat (numbered according to Ontario Reg. 287/07) Chemicals Pathogens DNAPL
1. Waste Disposal Site 1
2. Sewage System
3. Agricultural Source Material Application
4. Agricultural Source Material Storage
6. Non- Agricultural Source Material Application
10. Pesticide Application
15. Fuel Handling/Storage 3
16. Dense Non-Aqueous Phase Liquid Handling/Storage 13
21. Grazing/Pasturing Livestock
Total: 4 0 13
Drinking Water Issues and Conditions Table 4.23 indicates that no issues with wells or conditions resulting from past activities were identified within the WHPA.
Draft for Consultation

Ausable Bayfield Source Protection Area Updated Assessment Report December 10th
, 2014
ABMV Source Protection Region 4-47
Table 4.23 Clinton WHPA: Issues and Conditions
Drinking Water Issue Parameter
None None
Drinking Water Condition Threat
None None
4.5.3.2.3 Deleted Harbour Lights The following is a description of the Harbour Lights well system: Location: 15 Harbour Ct. Bayfield SPA: Both the well and WHPA are in the AB SPA Year constructed: 1992 Depth: 32.9 m Users Served: 125 Design Capacity: 320 m3/day (3.7 litres/second) Permitted Rate: 111.6 m3/day (1.3 litres/second) Average Usage: less than 31 m3/day (0.4 litres/second) Treatment: Chlorination ODWS: Met in 100% of tests from April 1, 2011 to March 31, 2012 Groundwater Vulnerability Map 4.30 and 4.49 shows that the WHPA in Central Huron extends over both cropland and forest. Map 4.30 shows that a small portion of WHPA-A extends into Central Huron, which has a vulnerability score of 10. Central Huron also contains parts of WHPA-B, WHPA-C, and WHPA-D. These all have a vulnerability score of 6 or less. The reader should note that the Harbour Lights system is planned for decommissioning as described in Section 4.5.3.2 above. A review of transport pathways was conducted with the following results. Aquifer vulnerability within the Harbour Lights WHPA were adjusted for several undocumented wells which were not visited as part of the Well Location Update. In this case, the wells were assumed to be within 30 m of the principal structure on the property, and vulnerability was therefore adjusted for 60 m surrounding the principal structure to account for the uncertainty with both the location of the well and the condition of the well. No adjustments to the urban area were incorporated into the WHPA as all residences are on municipal water, there were not sufficient records of wells which pre-date the system, and the depth to the services (placed at typical depths) are insignificant in comparison to the depth to the municipal supply aquifer.
Draft for Consultation

Ausable Bayfield Source Protection Area Updated Assessment Report December 10th
, 2014
ABMV Source Protection Region 4-48
Threats and Risks Table 4.24 Column 1 lists the drinking water threats in Harbour Lights WHPA. They are all prescribed drinking water threats listed in Subsection 1.1(1) of Ontario Regulation 287/07. No other type of local threat was identified. Table 4.24 also indicates the number of significant threat instances for each threat type. Appendix A provides details on circumstances pertaining to these threats. No other local circumstances were identified. Map 4.31 shows the percentage of impervious surface area; Map 4.32 shows the location and percentage of managed lands, and Map 4.33 shows the livestock density within the Harbour Lights WHPA. Maps 4.34, 4.35, and 4.36 show the areas where chemical, pathogen and DNAPL threats can be significant moderate or low. The tables embedded on these maps refer to the provincial tables found in Appendix A, which list the specific circumstances in which an activity may be a significant, moderate or low drinking water threat. The provincial tables are separated based on vulnerable area, and vulnerability score.
Table 4.24 Deleted Harbour Lights WHPA: Enumeration of Potential Significant Threats
Significant Instances
Threat (numbered according to Ontario Reg. 287/07) Chemicals Pathogens DNAPL
2. Sewage System 8
15. Fuel Handling/Storage 8
Total: 8 8 0
Drinking Water Issues and Conditions Table 4.25 indicates that no issues with wells or conditions resulting from past activities were identified within the WHPA.
Table 4.25 Deleted Harbour Lights WHPA: Issues and Conditions
Drinking Water Issue Parameter
None None
Drinking Water Condition Threat
None None
4.5.3.2.4 SAM
Draft for Consultation

Ausable Bayfield Source Protection Area Updated Assessment Report December 10th
, 2014
ABMV Source Protection Region 4-49
The following is a description of the SAM well system:
Location: 77301 Forest Ridge Rd., 1.8 km north of the Bayfield River
SPA: Well and WHPA are in AB SPA
Year constructed: 1979
Depth: 59.4 m
Users Served: 12
Design Capacity: 164 m3/day (1.9 litres/second)
Permitted Rate: 164 m3/day (1.9 litres/second)
Average Usage: Less than 10% of capacity
Treatment: Chlorination and iron sequestering
ODWS: Met in 100% of tests from April 1, 2011 to March 31, 2012 Groundwater Vulnerability Maps 4.49 and 4.57 show that the wellhead protection area (WHPA) extends in a narrow strip 1.3 km eastward from the well, largely across forested land. WHPA-A, the 100 m radius around the well is the only area with a vulnerability score of 10. All other WHPAs (WHPA-B, WHPA-C, and WHPA-D) have a vulnerability score of 6 or less. Aquifer vulnerability was not adjusted for transport pathways in the SAM WHPA. Threats and Risks Table 4.26 Column 1 lists the drinking water threats in SAM’s WHPA. They are all prescribed drinking water threats listed in Subsection 1.1(1) of Ontario Regulation 287/07. No other type of local threat was identified. Table 4.26 also indicates the number of significant threat instances for each threat type. Appendix A provides details on circumstances pertaining to these threats. No other local circumstances were identified. Map 4.58 shows the percentage of impervious surface area; Map 4.59 shows the location and percentage of managed lands, and Map 4.60 shows the livestock density within the SAM WHPA. Maps 4.61, 4.62, and 4.63 show the areas where chemical, pathogen and DNAPL threats can be significant moderate or low. The tables embedded on these maps refer to the provincial tables found in Appendix A, which list the specific circumstances in which an activity may be a significant, moderate or low drinking water threat. The provincial tables are separated based on vulnerable area, and vulnerability score.
Draft for Consultation
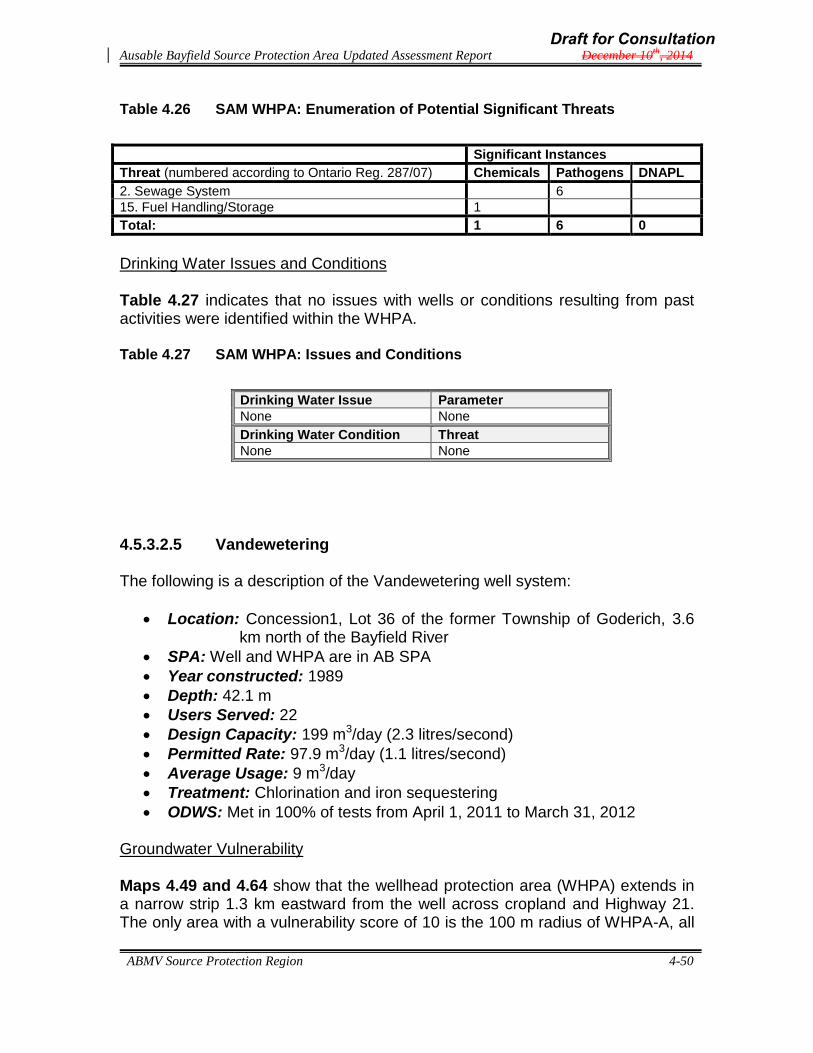
Ausable Bayfield Source Protection Area Updated Assessment Report December 10th
, 2014
ABMV Source Protection Region 4-50
Table 4.26 SAM WHPA: Enumeration of Potential Significant Threats
Significant Instances
Threat (numbered according to Ontario Reg. 287/07) Chemicals Pathogens DNAPL
2. Sewage System 6
15. Fuel Handling/Storage 1
Total: 1 6 0
Drinking Water Issues and Conditions Table 4.27 indicates that no issues with wells or conditions resulting from past activities were identified within the WHPA. Table 4.27 SAM WHPA: Issues and Conditions
Drinking Water Issue Parameter
None None
Drinking Water Condition Threat
None None
4.5.3.2.5 Vandewetering The following is a description of the Vandewetering well system:
Location: Concession1, Lot 36 of the former Township of Goderich, 3.6 km north of the Bayfield River
SPA: Well and WHPA are in AB SPA
Year constructed: 1989
Depth: 42.1 m
Users Served: 22
Design Capacity: 199 m3/day (2.3 litres/second)
Permitted Rate: 97.9 m3/day (1.1 litres/second)
Average Usage: 9 m3/day
Treatment: Chlorination and iron sequestering
ODWS: Met in 100% of tests from April 1, 2011 to March 31, 2012 Groundwater Vulnerability Maps 4.49 and 4.64 show that the wellhead protection area (WHPA) extends in a narrow strip 1.3 km eastward from the well across cropland and Highway 21. The only area with a vulnerability score of 10 is the 100 m radius of WHPA-A, all
Draft for Consultation

Ausable Bayfield Source Protection Area Updated Assessment Report December 10th
, 2014
ABMV Source Protection Region 4-51
in residential lots. WHPA-B, WHPA-C, and WHPA-D all have a vulnerability score of 6 or less. A review of transport pathways was conducted with the following results. Aquifer vulnerability within the Vandewetering WHPA was adjusted for an undocumented well which was not visited as part of the Well Location Update. In this case, the well were assumed to be within 30 m of the principal structure on the property, and vulnerability was therefore adjusted for 60 m surrounding the principal structure to account for the uncertainty with both the location of the well and the condition of the well. No adjustments to the urban area as it is located entirely outside of all but the WHPA-A, which already has a maximum vulnerability score of 10. Threats and Risks Table 4.28 Column 1 lists the drinking water threats in Vandewetering’s WHPA. They are all prescribed drinking water threats listed in Subsection 1.1(1) of Ontario Regulation 287/07. No other type of local threat was identified. Table 4.28 also indicates the number of significant threat instances for each threat type. Appendix A provides details on circumstances pertaining to these threats. No other local circumstances were identified. Map 4.65 shows the percentage of impervious surface area; Map 4.66 shows the location and percentage of managed lands, and Map 4.67 shows the livestock density within the Vandewetering WHPA. Maps 4.68, 4.69, and 4.70 show the areas where chemical, pathogen and DNAPL threats can be significant moderate or low. The tables embedded on these maps refer to the provincial tables found in Appendix A, which list the specific circumstances in which an activity may be a significant, moderate or low drinking water threat. The provincial tables are separated based on vulnerable area, and vulnerability score. Table 4.28 Vandewetering WHPA: Enumeration of Potential Significant Threats
Significant Instances
Threat (numbered according to Ontario Reg. 287/07) Chemicals Pathogens DNAPL
2. Sewage System 4 17
15. Fuel Handling/Storage 1
Total: 5 17 0
Drinking Water Issues and Conditions
Draft for Consultation
Ausable Bayfield Source Protection Area Updated Assessment Report December 10th
, 2014
ABMV Source Protection Region 4-52
Table 4.29 indicates that no issues with wells or conditions resulting from past activities were identified within the WHPA. Table 4.29 Vandewetering WHPA: Issues and Conditions
Drinking Water Issue Parameter
None None
Drinking Water Condition Threat
None None
4.5.4 Huron East The Municipality of Huron East is inland from Lake Huron and adjacent to Perth County. By Conservation Authority jurisdiction, Huron East is 72% in Maitland Valley and 28% is in Ausable Bayfield. In 2006, the municipality had a population of 9,310, a decline of 3.8% since 2001. The main town within the AB SPA portion of the municipality is Seaforth (2001 population 2,300). Cropland is 78% of the land area, dominated by corn, soybeans and winter wheat. Livestock density (cattle: 47.9/ km2.; pigs: 298.6/ km2.) is high (Statistics Canada 2007). 4.5.4.1 Huron East – HVAs and SGRAs Maps 4.71 and 4.72 show the locations of highly vulnerable aquifers and significant groundwater recharge areas respectively in Huron East. The highly vulnerable aquifers are scattered throughout the municipality, while there are relatively few SGRAs. Most areas are narrow eskers or spillways; a larger area in the north-east corner corresponds with a kame. The vulnerability score for all HVAs is 6, while SGRAs can have a vulnerability score of 6, 4 or 2. Map 4.73 shows the percentage of impervious surface area; Map 4.74 shows the location and percentage of managed lands; and Map 4.75 shows the livestock density within HVAs and SGRAs for Huron East. Threats and Risks Since the vulnerability scores for the SGRAs and HVAs are 6 or less, only moderate and low drinking water threats may exist in this area. Tables 4.3 and 4.4 can be used in combination with Maps 4.71 and 4.72 to determine where chemical/pathogen/DNAPL threats can be moderate and low threats in HVAs and SGRAs in Huron East. In addition, Appendix A (Tables 17 and 18) can be used to determine the types of activities that would be deemed drinking water threats in HVAs and SGRAs. There are no known conditions or issues in the municipality.
Draft for Consultation

Ausable Bayfield Source Protection Area Updated Assessment Report December 10th
, 2014
ABMV Source Protection Region 4-53
4.5.4.2 Wellhead Protection Areas (WHPAs)
Huron East’s main well system within the AB SPA portion of the municipality is in Seaforth. Brucefield has a smaller system. Map 4.76 shows the locations of all WHPA in Huron East. 4.5.4.2.1 Brucefield The following is a description of the Brucefield well system:
Location: The corner of Highway 4 and County Road 3
SPA: Both the well and WHPA are in the AB SPA
Year constructed: 1972
Depth: 88.4 m
Users Served: 175
Design Capacity: 458 m3/day (5.3 litres/second)
Permitted Rate: 270 m3/day (3.1 litres/second)
Average Usage: never exceeded 80 m3/day (0.9 litres/second)
Treatment: Chlorination and ultraviolet radiation
ODWS: Met in 100% of tests from April 1, 2011 to March 31, 2012 Groundwater Vulnerability Maps 4.16 and 4.76 show that the wellhead protection area (WHPA) extends about 5.7 km to the north east from the wellhead. WHPA-A, the 100 m radius around the well has a vulnerability score of 10. Half of WHPA-B has a vulnerability score of 8 while the other half has a score of 6. WHPA-C and WHPA-D have vulnerability scores of 6 or less. Note that Map 4.16 was revised in 2014 to reflect updated transport pathway information. A review of transport pathways was conducted with the following results. Aquifer vulnerability within the Brucefield WHPA was adjusted for several undocumented wells that were inspected and georeferenced as part of the Well Location Update completed by the Ausable Bayfield Maitland Valley Source Protection Region (2007). These wells were located as part of the project, and were found to have wells that are out of compliance with provincial requirements for well construction. Vulnerability was adjusted one level for a 30 m area surrounding the wells, based on the updated coordinates. Additional adjustments were completed for undocumented wells which were not visited as part of the Well Location Update. In these cases, wells were assumed to be within 30 m of the principal structure on the property, and vulnerability was therefore adjusted for 60 m surrounding the principal structure to account for the uncertainty with both the location of the well and the condition of the well.
Draft for Consultation

Ausable Bayfield Source Protection Area Updated Assessment Report December 10th
, 2014
ABMV Source Protection Region 4-54
No adjustments to the urban area were incorporated into the WHPA as all residences are on municipal water, there were not sufficient records of wells which pre-date the system, and the depth to the services (placed at typical depths) are insignificant in comparison to the depth to the municipal supply aquifer. Threats and Risks Table 4.30 Column 1 lists the drinking water threats in Brucefield’s WHPA. They are all prescribed drinking water threats listed in Subsection 1.1(1) of Ontario Regulation 287/07. No other type of local threat was identified. Table 4.30 also indicates the number of significant threat instances for each threat type. Appendix A provides details on circumstances pertaining to these threats. No other local circumstances were identified. Map 4.17 shows the percentage of impervious surface area; Map 4.18 shows the location and percentage of managed lands, and Map 4.19 shows the livestock density within the Brucefield WHPA. Maps 4.20, 4.21, and 4.22 show the areas where chemical, pathogen and DNAPL threats can be significant moderate or low. The tables embedded on these maps refer to the provincial tables found in Appendix A, which list the specific circumstances in which an activity may be a significant, moderate or low drinking water threat. The provincial tables are separated based on vulnerable area, and vulnerability score. Table 4.30 Brucefield WHPA: Enumeration of Potential Significant Threats
Significant Instances
Threat (numbered according to Ontario Reg. 287/07) Chemicals Pathogens DNAPL
1. Waste Disposal Site 2 0
2. Sewage System 2 18
3. Agricultural Source Material Application 1
4. Agricultural Source Material Storage
6. Non- Agricultural Source Material Application
7. Non- Agricultural Source Material Handling/Storage
8. Commercial Fertilizer Application
9. Commercial Fertilizer Handling/Storage
10. Pesticide Application
11. Pesticide Handling/Storage
15. Fuel Handling/Storage 5
16. Dense Non-Aqueous Phase Liquid Handling/Storage 1
21. Grazing/Pasturing Livestock 1 1
Total: 10 20 1
Drinking Water Issues and Conditions
Draft for Consultation

Ausable Bayfield Source Protection Area Updated Assessment Report December 10th
, 2014
ABMV Source Protection Region 4-55
Table 4.31 indicates that no issues with wells or conditions resulting from past activities were identified within the WHPA. Table 4.31 Brucefield WHPA: Issues and Conditions
Drinking Water Issue Parameter
None None
Drinking Water Condition Threat
None None
4.5.4.2.2 Seaforth The following is a description of the Seaforth well system:
Location: 40 Welsh St.
SPA: Wells located in MV SPA but WHPAs extend into AB SPA
Year constructed: Well TW1: 2005, Well PW1: 2006, Well PW2: 2007
Depth: Well TW1: 42.9 m, Well PW1: 105 m, Well PW2: 105 m
Users Served: 2900
Design Capacity: All 3 wells: 3456 m3/day (40 litres/second)
Permitted Rate: TW1: 518.4 m3/day, PW1: 3024 m3/day, PW2: 3456 m3/day
Average Usage: 1260 m3/day
Treatment: Sodium Hypochlorinate and Sodium Silicate
ODWS: Met in 100% of tests from April 1, 2011 to March 31, 2012 Groundwater Vulnerability Maps 4.76 and 4.77 show that the wellhead protection area (WHPA) is approximately 3 km long and 2.3 km wide. A vulnerability score of 10 applies to the WHPA-A 100 m radius and a portion of WHPA-B. The remainder of WHPA-B and part of WHPA-C has a vulnerability score of 8. All other areas of the WHPA have a vulnerability score of 6 or less. Note that Map 4.77 was revised in 2014 to reflect updated transport pathway information. A review of transport pathways was conducted with the following results. Aquifer vulnerability within the Seaforth WHPA was adjusted for several undocumented wells that were inspected and georeferenced as part of the Well Location Update completed by the Ausable Bayfield Maitland Valley Source Protection Region (2007). These wells were located as part of the project, and were found to have wells that are out of compliance with provincial requirements for well construction. Vulnerability was adjusted one level for a 30 m area surrounding the wells, based on the updated coordinates.
Draft for Consultation

Ausable Bayfield Source Protection Area Updated Assessment Report December 10th
, 2014
ABMV Source Protection Region 4-56
Additional adjustments were completed for undocumented wells which were not visited as part of the Well Location Update. In these cases, wells were assumed to be within 30 m of the principal structure on the property, and vulnerability was therefore adjusted for 60 m surrounding the principal structure to account for the uncertainty with both the location of the well and the condition of the well. No adjustments to the urban area were incorporated into the WHPA as all residences are on municipal water, there were not sufficient records of wells which pre-date the system, and the depth to the services (placed at typical depths) are insignificant in comparison to the depth to the municipal supply aquifer. Threats and Risks Table 4.32 Column 1 lists the drinking water threats in the Seaforth WHPA. They are all prescribed drinking water threats listed in Subsection 1.1(1) of Ontario Regulation 287/07. No other type of local threat was identified. Table 4.32 also indicates the number of significant threat instances for each threat type. Appendix A provides details on circumstances pertaining to these threats. No other local circumstances were identified. Map 4.78 shows the percentage of impervious surface area; Map 4.79 shows the location and percentage of managed lands, and Map 4.80 shows the livestock density within the Seaforth WHPA. Maps 4.81, 4.82, and 4.83 show the areas where chemical, pathogen and DNAPL threats can be significant moderate or low. The tables embedded on these maps refer to the provincial tables found in Appendix A, which list the specific circumstances in which an activity may be a significant, moderate or low drinking water threat. The provincial tables are separated based on vulnerable area, and vulnerability score.
Draft for Consultation

Ausable Bayfield Source Protection Area Updated Assessment Report December 10th
, 2014
ABMV Source Protection Region 4-57
Table 4.32 Seaforth WHPA: Enumeration of Potential Significant Threats
Significant Instances
Threat (numbered according to Ontario Reg. 287/07) Chemicals Pathogens DNAPL
1. Waste Disposal Site 3
2. Sewage System 7
3. Agricultural Source Material Application 2 2
4. Agricultural Source Material Storage
6. Non- Agricultural Source Material Application
7. Non- Agricultural Source Material Handling/Storage
8. Commercial Fertilizer Application
10. Pesticide Application 2
15. Fuel Handling/Storage 2
16. Dense Non-Aqueous Phase Liquid Handling/Storage 3
21. Grazing/Pasturing Livestock
Total: 9 9 3
Drinking Water Issues and Conditions Table 4.33 indicates that no issues with wells or conditions resulting from past activities were identified within the WHPA. Table 4.33 Seaforth WHPA: Issues and Conditions
Drinking Water Issue Parameter
None None
Drinking Water Condition Threat
None None
Draft for Consultation

Ausable Bayfield Source Protection Area Updated Assessment Report December 10th
, 2014
ABMV Source Protection Region 4-58
4.5.5 Lambton Shores The Municipality is located in the south western part of the Source Protection Area. The portion of the municipality within the study area is a mix of seasonal residential on the shoreline, and agriculture in-land. The area represents approximately 55% of the land mass with a population of approximately 5,900 people (approximately 750 live in the community of Thedford and 460 live in Arkona). There is access to the Lake Huron Primary Water Supply pipeline throughout the municipality and no municipal wells. The municipality uses approximately 3,490 cubic metres per day, or 20% of the design capacity. However, some of the population continues to use individual wells. 4.5.5.1 Lambton Shores – HVAs and SGRAs Maps 4.84 and 4.85 delineate the locations of highly vulnerable aquifers and significant groundwater recharge areas respectively in Lambton Shores. A relatively large HVA dominates the shoreline, while SGRAs are scattered in bands throughout the municipality. The vulnerability score for all HVAs is 6, while SGRAs can have a vulnerability score of 6, 4 or 2. Map 4.86 shows the percentage of impervious surface area; Map 4.87 shows the location and percentage of managed lands; and Map 4.88 shows the livestock density within HVAs and SGRAs for Lambton Shores. Threats and Risks Since the vulnerability scores for the SGRAs and HVAs are 6 or less, only moderate and low drinking water threats may exist in this area. Tables 4.3 and 4.4 can be used in combination with Maps 4.84 and 4.85 to determine where chemical, pathogen, and DNAPL threats can be moderate and low risks in HVAs and SGRAs in Lambton Shores. In addition, Appendix A (Tables 17 and 18) can be used to determine the types of activities that would be deemed drinking water threats in HVAs and SGRAs. There are no known conditions or issues in the municipality.
4.5.5.2 Intake Protection Zone The Lake Huron Primary Water Supply System is north of Lambton Shores and over one kilometre off shore, thus the IPZ-1 does not intersect with the land (Map 4.89). A small portion of the LHPWSS IPZ-2 lies within Lambton Shores. This area encompasses an area just south of the core area of Grand Bend up the Ausable River. Map 4.15 and Table 4.34 indicate the vulnerability scores for the intake, determined by the consultants and verified through peer review. Please see section 4.2 for more information about the Area Vulnerability Factor and
Draft for Consultation

Ausable Bayfield Source Protection Area Updated Assessment Report December 10th
, 2014
ABMV Source Protection Region 4-59
Source Vulnerability Factor. The vulnerability score is 4 in this area; therefore no significant risks are identified. Table 4.34 LHPWSS IPZ: Vulnerability Score Summary
Location Vulnerability
Factor Source
Modifying Factor
Vulnerability Score
IPZ 1 IPZ 2 IPZ 1 IPZ 2
Lake Huron
10
8 Moderate
0.5 Low
5
4
Threats & Risk Since the vulnerability scores for the IPZ are low, there is only the potential for low drinking water threats in this area. Table 4.5 can be used in combination with Map 4.15 to determine where chemical, pathogen, and DNAPL threats can be low risks in the intake protection zones for the LHPWSS. In addition, Appendix A, Table 74 can be used to determine the types of activities that would be deemed a low chemical threat in IPZ-1. Appendix A, Table 69 can be used to determine the types of activities that would be deemed a low pathogen threat in IPZ-1. Table 4.35 shows that there are no significant drinking water threats within vulnerable areas in Lambton Shores. Table 4.36 shows that there are also no known conditions or issues in the portion of the municipality within the AB SPA. Using the events based approach, modelling was conducted to determine whether contaminants from the Grand Bend Sewage Treatment System, or a harbour marina could be transported to the intake during an extreme event. The modelling concluded that no contaminants transported to the intake during an extreme event would result in a deterioration of the water as a drinking water source. Thus no IPZ-3 was identified. Table 4.35 Lambton Shores Risks to Drinking Water Summary
Threat Circumstance Number of Locations
None None None
Table 4.36 Lambton Shores Issues and Conditions
Drinking Water Issue Parameter
None None
Drinking Water Condition Threat
None None
Draft for Consultation

Ausable Bayfield Source Protection Area Updated Assessment Report December 10th
, 2014
ABMV Source Protection Region 4-60
4.5.6 Lucan Biddulph This Township is located in the central eastern part of the Source Protection Area and is mostly agricultural. The portion of the municipality within the study area represents approximately 68% of the land mass and 68% of the population, approximately 4,200 people (approximately 2,000 live in the community of Lucan). There are no municipal residential drinking water sources in this area. There is access to the Lake Huron Primary Water Supply pipeline in Lucan and limited access in other hamlets within the municipality. Approximately 65% of the Lucan Biddulph population within the AB SPA is on the pipeline. The township uses approximately 643 cubic metres of water per day and the system was designed to provide 3,085 cu m/d. 4.5.6.1 Lucan Biddulph – HVAs and SGRAs Map 4.90 shows the locations of SGRAs in the municipality of Lucan Biddulph. SGRAs can have a vulnerability score of 6, 4, or 2. However, there are no SGRAs in Lucan Biddulph with a vulnerability score of 6. There are no HVA areas identified in the municipality. Since impervious surface, managed lands and livestock density are only mapped in vulnerable areas that have vulnerability scores of 6 or higher, none of these maps were required for Lucan Biddulph. Threats & Risk As there are no municipal residential drinking water sources, no HVAs, and the vulnerability score for the SGRA is less than 6, there are no drinking water threats in this area (Table 4.37). There are no known conditions or issues in the portion of the municipality within the AB SPA (Table 4.38). Table 4.37 Lucan Biddulph Risks to Drinking Water Summary
Threat Circumstance Number of Locations
None None None
Table 4.38 Lucan Biddulph Issues and Conditions
Drinking Water Issue Parameter
None None
Drinking Water Condition Threat
None None
Draft for Consultation

Ausable Bayfield Source Protection Area Updated Assessment Report December 10th
, 2014
ABMV Source Protection Region 4-61
4.5.7 Middlesex Centre This municipality is located in the south eastern part of the Source Protection Area. The portion of the municipality within the study area represents approximately twenty-one percent of the land mass and 21% of the population, approximately 3,000 people. There are no municipal residential drinking water sources in this area. There is very limited access to the Lake Huron Primary Water Supply System pipeline as this area has a dispersed population which is rural in character. Therefore, the majority of the population relies on individual wells. 4.5.7.1 Middlesex Centre – HVAs and SGRAs Maps 4.91 and 4.92 delineate the locations of HVAs and SGRAs respectively in the Middlesex Centre. The vulnerability score for all HVAs is 6, while SGRAs can have a vulnerability score of 6, 4 or 2. Map 4.93 shows the percentage of impervious surface area; Map 4.94 shows the location and percentage of managed lands; and Map 4.95 shows the livestock density within HVAs and SGRAS for Middlesex Centre. Threats & Risk As there are no municipal residential drinking water sources and the vulnerability scores for SGRAs and HVAs are less than 8, there are no significant risks in this area (Table 4.39). Tables 4.3 and 4.4 can be used in combination with Maps 4.91 and 4.92 to determine where chemical, pathogen, and DNAPL threats can be moderate and low threats in HVAs and SGRAs in Middlesex Centre. In addition, Appendix A (Tables 17 and 18) can be used to determine the types of activities that would be deemed drinking water threats in HVAs and SGRAs. There are no known conditions or issues in the portion of the municipality within the AB SPA (Table 4.40). Table 4.39 Middlesex Centre Risks to Drinking Water Summary
Threat Circumstance Number of Locations
None None None
Table 4.40 Middlesex Centre Issues and Conditions
Drinking Water Issue Parameter
None None
Drinking Water Condition Threat
None None
Draft for Consultation

Ausable Bayfield Source Protection Area Updated Assessment Report December 10th
, 2014
ABMV Source Protection Region 4-62
4.5.8 North Middlesex This municipality is located in the southern part of the Source Protection Area. The entire municipality is within the study area having a population of approximately 6,900 people. There are no residential municipal drinking water sources in this area. Eighty-five percent of the residents in North Middlesex are connected to the Lake Huron Primary Water Supply pipeline. This includes the largest community, Parkhill (pop 1,750), and the community of Ailsa Craig (pop 1,100). North Middlesex uses approximately 3,535 cubic metres of water per day. The remaining population relies on individual wells. 4.5.8.1 North Middlesex – HVAs and SGRAs Maps 4.96 and 4.97 delineate the locations of HVAs and SGRAs respectively in the municipality. The vulnerability score for all HVAs is 6, while SGRAs can have a vulnerability score of 6, 4 or 2. Map 4.98 shows the percentage of impervious surface area; Map 4.99 shows the location and percentage of managed lands; and Map 4.100 shows the livestock density within HVAs and SGRAs for North Middlesex. Threats & Risk As there are no municipal residential drinking water sources and the vulnerability scores for the SGRA and HVA are less than 8, there are no significant drinking water threats in North Middlesex (Table 4.41). Tables 4.3 and 4.4 can be used in combination with Maps 4.96 and 4.97 to determine where chemical, pathogen, and DNAPL threats can be moderate and low threats in HVAs and SGRAs in North Middlesex. In addition, Appendix A (Tables 17 and 18) can be used to determine the types of activities that would be deemed drinking water threats in HVAs and SGRAs. There are no known conditions or issues in the municipality (Table 4.42). Table 4.41 North Middlesex Risks to Drinking Water Summary
Threat Circumstance Number of Locations
None None None
Draft for Consultation

Ausable Bayfield Source Protection Area Updated Assessment Report December 10th
, 2014
ABMV Source Protection Region 4-63
Table 4.42 North Middlesex Issues and Conditions
Drinking Water Issue Parameter
None None
Drinking Water Condition Threat
None None
4.5.9 Perth South This township is located in the central eastern part of the Source Protection Area. Only 2% of the land area is within the study area. The population in this area is approximately 80 people. There are no municipal residential drinking water sources in this area. The population relies on individual wells. 4.5.9.1 Perth South – HVAs and SGRAs No HVA exist in the portion of the township within the study area. Map 4.101 delineates the location of SGRAs SGRAs can have a vulnerability score of 6, 4 or 2. However, all of the SGRAs located in Perth South have a vulnerability score of 2. Therefore, no significant, moderate, or low drinking water threats exist in these areas. Since impervious surface, managed lands and livestock density are only mapped in vulnerable areas that have vulnerability scores of 6 or higher, none of these maps were required for Perth South. Threats & Risk As there are no municipal residential drinking water sources and the vulnerability scores for SGRAs is less than 4, there are no drinking water threats in this area (Table 4.43). There are no known conditions or issues in the portion of the municipality within the AB SPA (Table 4.44). Table 4.43 South Perth Risks to Drinking Water Summary
Threat Circumstance Number of Locations
None None None
Draft for Consultation

Ausable Bayfield Source Protection Area Updated Assessment Report December 10th
, 2014
ABMV Source Protection Region 4-64
Table 4.44 South Perth Issues and Conditions
Drinking Water Issue Parameter
None None
Drinking Water Condition Threat
None None
4.5.10 South Huron The Municipality is located in the south western part of the Source Protection Area. The portion of the municipality within the study area is a mix of seasonal residential on the shoreline and agriculture inland. Approximately 92% of the municipality falls within the SPA and has a population of approximately 9,982 people (4,657 live in the community of Exeter). There is access to the Lake Huron Primary Water Supply pipeline throughout the municipality where there are population nodes and no municipal wells. Approximately 3,331 cubic metres of water per day is used in this municipality. However, some of the population continues to use individual wells. 4.5.10.1 South Huron – HVAs and SGRAs Maps 4.102 and 4.103 delineate the locations of HVAs and SGRAs respectively in South Huron. The HVA areas are scattered throughout the municipality but are more abundant on the eastern portion. Bands of SGRAs run parallel to the shoreline. The vulnerability score for all HVAs is 6, while SGRAs can have a vulnerability score of 6, 4 or 2. Map 4.104 shows the percentage of impervious surface area; Map 4.105 shows the location and percentage of managed lands; and Map 4.106 shows the livestock density within HVAs and SGRAs for South Huron. Threats and Risks Since the vulnerability scores for the SGRAs and HVAs are 6 or less, only moderate and low drinking water threats may exist in this area. Tables 4.3 and 4.4 can be used in combination with Maps 4.102 and 4.103 to determine where chemical, pathogen, and DNAPL threats can be moderate and low risks in HVAs and SGRAs in South Huron. In addition, Appendix A (Tables 17 and 18) can be used to determine the types of activities that would be deemed drinking water threats in HVAs and SGRAs. 4.5.10.2 Intake Protection Zone
Draft for Consultation

Ausable Bayfield Source Protection Area Updated Assessment Report December 10th
, 2014
ABMV Source Protection Region 4-65
The Lake Huron Primary Water Supply System (LHPWSS) is over one kilometre off shore thus the IPZ-1 does not intersect with the land (Map 4.107). A small portion of the LHPWSS IPZ-2 runs along the shoreline in South Huron. As there are no issues at the intake, no IPZ-3 was modelled at this time. Map 4.15 and Table 4.45 indicate the vulnerability scores for the intake, determined by the consultants and verified through peer review. Please see section 4.2 for more information about the Area Vulnerability Factor and Source Vulnerability Factor. The vulnerability score is 4 in this area; therefore no significant risks are identified. Table 4.45 Vulnerability Score Summary
Location Vulnerability
Factor Source
Modifying Factor
Vulnerability Score
IPZ 1 IPZ 2 IPZ 1 IPZ 2
Lake Huron
10
8
Moderate
0.5 Low
5
4
Threats & Risk Since the vulnerability scores for the IPZ are low, the potential is for low drinking water threats in this area. Table 4.5 can be used in combination with Map 4.15 to determine where chemical, pathogen, and DNAPL threats can be low threats in the intake protection zones for the LHPWSS. In addition, Appendix A, Table 74 can be used to determine the types of activities that would be deemed a moderate or low chemical threat in IPZ-1. Appendix A, Table 69 can be used to determine the types of activities that would be deemed a low pathogen threat in IPZ-1. Table 4.46 shows that there are no significant drinking water threats within vulnerable areas in South Huron. Table 4.47 shows that there are also no known conditions or issues. Using the events based approach, modelling was conducted to determine whether contaminants from the Grand Bend Sewage Treatment System, or a harbour marina could be transported to the intake during an extreme event. The modelling concluded that no contaminants transported to the intake during an extreme event would result in a deterioration of the water as a drinking water source. Thus no IPZ-3 was identified.
Table 4.46 South Huron Risks to Drinking Water Summary
Threat Circumstance Number of Locations
None None None
Draft for Consultation
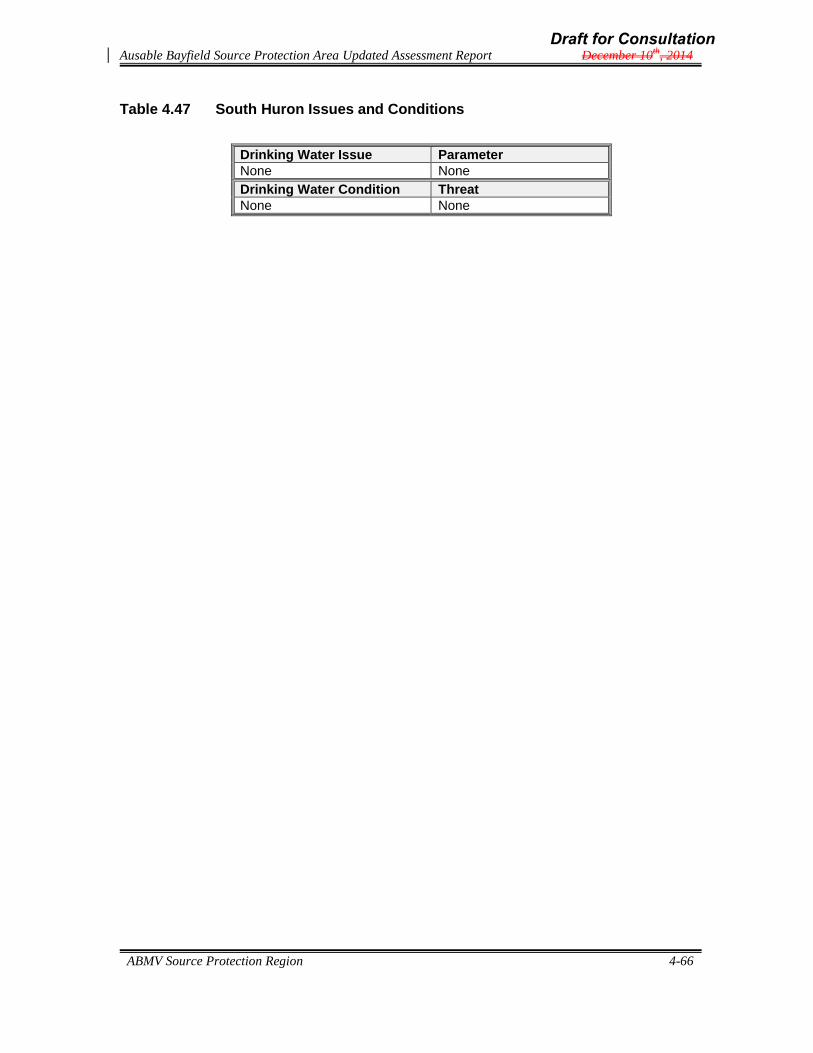
Ausable Bayfield Source Protection Area Updated Assessment Report December 10th
, 2014
ABMV Source Protection Region 4-66
Table 4.47 South Huron Issues and Conditions
Drinking Water Issue Parameter
None None
Drinking Water Condition Threat
None None
Draft for Consultation

Ausable Bayfield Source Protection Area Updated Assessment Report December 10th
, 2014
ABMV Source Protection Region 4-67
4.5.11 Warwick This Township is located in the south western part of the Source Protection Area and only two percent of the municipality is in the study area, having a population of about 260. There are no municipal residential drinking water sources in this area. This area has a dispersed population which is rural in character and the majority of the population relies on individual wells. 4.5.11.1 Warwick – HVAs and SGRAs Despite the small area, Maps 4.108 and 4.109 delineate the locations of HVAs and SGRAs respectively in the municipality. The vulnerability score for all HVAs is 6, while SGRAs can have a vulnerability score of 6, 4 or 2. Map 4.110 shows the percentage of impervious surface area; Map 4.111 shows the location and percentage of managed lands; and Map 4.112 shows the livestock density within HVAs and SGRAs for Warwick. Threats & Risk As there are no municipal residential drinking water sources and the vulnerability scores for SGRAs and HVAs are less than 8, there are no significant drinking water threats in Warwick (Table 4.48). Tables 4.3 and 4.4 can be used in combination with Maps 4.108 and 4.109 to determine where chemical, pathogen, and DNAPL threats can be moderate and low risks in HVAs and SGRAs in Warwick. In addition, Appendix A (Tables 17 and 18) can be used to determine the types of activities that would be deemed drinking water threats in HVAs and SGRAs. There are no known conditions or issues in the municipality (Table 4.49). Table 4.48 Warwick Risks to Drinking Water Summary
Threat Circumstance Number of Locations
None None None
Table 4.49 Warwick Issues and Conditions
Drinking Water Issue Parameter
None None
Drinking Water Condition Threat
None None
Draft for Consultation
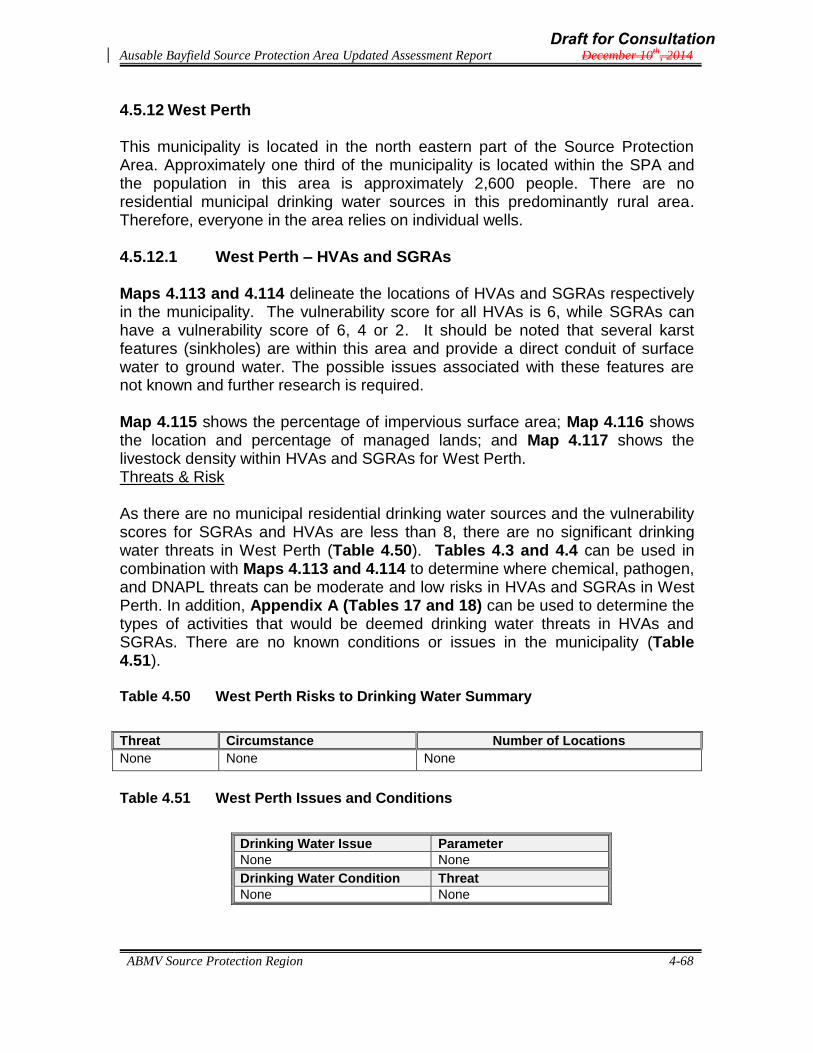
Ausable Bayfield Source Protection Area Updated Assessment Report December 10th
, 2014
ABMV Source Protection Region 4-68
4.5.12 West Perth This municipality is located in the north eastern part of the Source Protection Area. Approximately one third of the municipality is located within the SPA and the population in this area is approximately 2,600 people. There are no residential municipal drinking water sources in this predominantly rural area. Therefore, everyone in the area relies on individual wells. 4.5.12.1 West Perth – HVAs and SGRAs Maps 4.113 and 4.114 delineate the locations of HVAs and SGRAs respectively in the municipality. The vulnerability score for all HVAs is 6, while SGRAs can have a vulnerability score of 6, 4 or 2. It should be noted that several karst features (sinkholes) are within this area and provide a direct conduit of surface water to ground water. The possible issues associated with these features are not known and further research is required. Map 4.115 shows the percentage of impervious surface area; Map 4.116 shows the location and percentage of managed lands; and Map 4.117 shows the livestock density within HVAs and SGRAs for West Perth. Threats & Risk As there are no municipal residential drinking water sources and the vulnerability scores for SGRAs and HVAs are less than 8, there are no significant drinking water threats in West Perth (Table 4.50). Tables 4.3 and 4.4 can be used in combination with Maps 4.113 and 4.114 to determine where chemical, pathogen, and DNAPL threats can be moderate and low risks in HVAs and SGRAs in West Perth. In addition, Appendix A (Tables 17 and 18) can be used to determine the types of activities that would be deemed drinking water threats in HVAs and SGRAs. There are no known conditions or issues in the municipality (Table 4.51). Table 4.50 West Perth Risks to Drinking Water Summary
Threat Circumstance Number of Locations
None None None
Table 4.51 West Perth Issues and Conditions
Drinking Water Issue Parameter
None None
Drinking Water Condition Threat
None None
Draft for Consultation
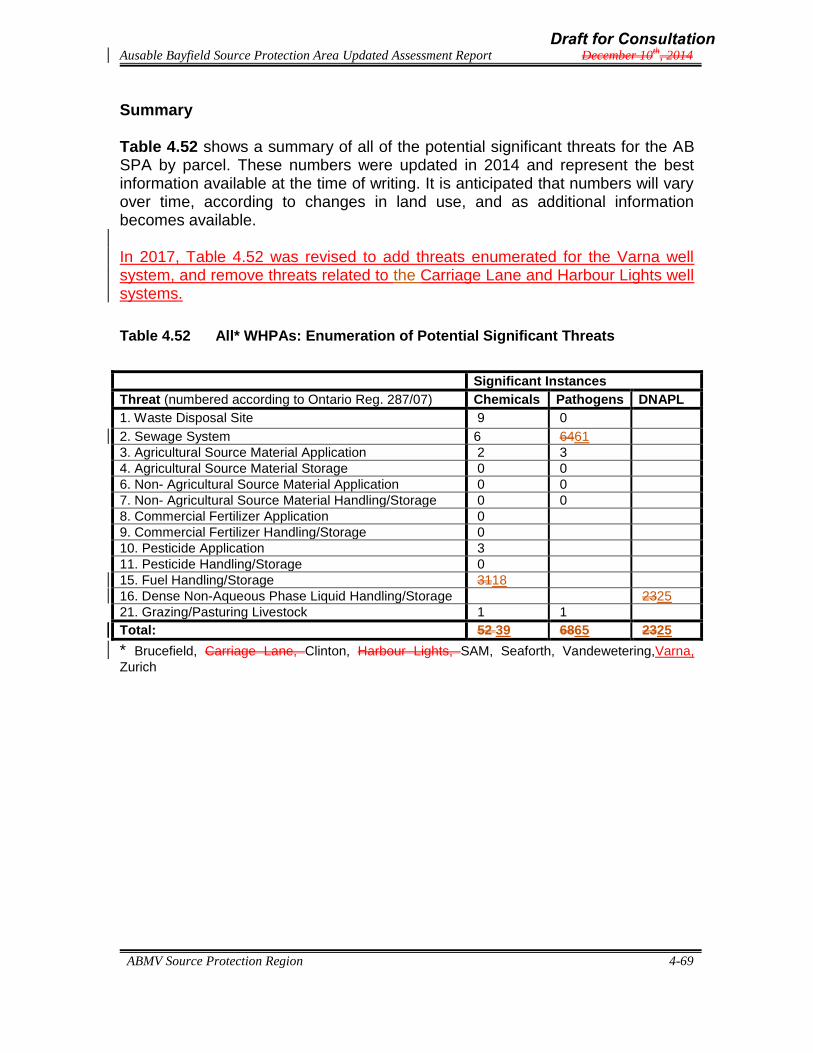
Ausable Bayfield Source Protection Area Updated Assessment Report December 10th
, 2014
ABMV Source Protection Region 4-69
Summary Table 4.52 shows a summary of all of the potential significant threats for the AB SPA by parcel. These numbers were updated in 2014 and represent the best information available at the time of writing. It is anticipated that numbers will vary over time, according to changes in land use, and as additional information becomes available. In 2017, Table 4.52 was revised to add threats enumerated for the Varna well system, and remove threats related to the Carriage Lane and Harbour Lights well systems.
Table 4.52 All* WHPAs: Enumeration of Potential Significant Threats
Significant Instances
Threat (numbered according to Ontario Reg. 287/07) Chemicals Pathogens DNAPL
1. Waste Disposal Site 9 0
2. Sewage System 6 6461
3. Agricultural Source Material Application 2 3
4. Agricultural Source Material Storage 0 0
6. Non- Agricultural Source Material Application 0 0
7. Non- Agricultural Source Material Handling/Storage 0 0
8. Commercial Fertilizer Application 0
9. Commercial Fertilizer Handling/Storage 0
10. Pesticide Application 3
11. Pesticide Handling/Storage 0
15. Fuel Handling/Storage 3118
16. Dense Non-Aqueous Phase Liquid Handling/Storage 2325
21. Grazing/Pasturing Livestock 1 1
Total: 52 39 6865 2325
* Brucefield, Carriage Lane, Clinton, Harbour Lights, SAM, Seaforth, Vandewetering,Varna,
Zurich
Draft for Consultation

Ausable Bayfield Source Protection Area Updated Assessment Report December 10th
, 2014
ABMV Source Protection Region 4-70
References
Author & Publisher
Title Date Purpose
WNM Corp, BM Ross, IWS
Report for Well Head Protection Area Delineation Project
October, 2010
To provide not only the actual delineation of WHPA’s in the area but to provide details on methodologies, limitations and general characterization of the well systems
BM Ross Consulting
Source Protection Technical Study: Drinking Water Quality Threats Assessment
October, 2009
To provide an explanation of the methodology, limitations and an inventory of possible threats to water quality in keeping with MOE Technical Rules
Huron Geosciences
Transport Pathway Adjustments: Ausable Bayfield Maitland Valley Source Protection Region
April 2011 To provide the methodology and results of how transport pathways were located and how vulnerability and threats were affected.
WESA Groundwater Vulnerability Assessment: Municipality of Huron East (Seaforth)
October, 2009
To provide not only the actual delineation of Seaforth WHPA but to provide details on methodologies, limitations and general characterization of the well systems
Stantec Phase 1 & 2 Reports, Lake Huron Primary Water Supply System Source Protection Technical Study
February 2009
To delineate the LHPWSS Intake Protection Zones and identify potential threats within these zones
Statistics Canada
Population Counts, 2006. http://www12.statcan.ca/english/census0 6/data/popdwell/Table.cfm?T=302&PR=35&S=1&O=A&RPP=25
2007 Provincial census data
MOE Technical Rules, 2008 2008 Director’s technical rules for assessing risks to drinking water sources
Matrix Solutions Inc.
Community of Varna, Municipality of Bluewater Wellhead Protection Areas Delineation, Varna Well 1
December 2016
To complete the WHPA delineation and vulnerability assessment for the Varna well
Draft for Consultation