Aurizon Holdings Limited ABN 14 146 335 622 For personal ... · › Enterprise strategy re-set in...
115
Aurizon Holdings Limited ABN 14 146 335 622 T +61 7 3019 9000 | F +61 7 3019 0720 | [email protected] Level 8, 900 Ann Street, Fortitude Valley QLD 4006 Australia | GPO Box 456 Brisbane QLD 4001 Australia ASX Market Announcements ASX Limited 20 Bridge Street Sydney NSW 2000 BY ELECTRONIC LODGEMENT 13 August 2018 2018 Annual Report Please find attached a copy of the Company’s 2018 Annual Report. In accordance with the relief from dual lodgment of financial statements under ASIC Class Order 98/104, the Annual Report will not be lodged separately with ASIC. Copies of the Annual Report are expected to be dispatched in September 2018 to all shareholders who have elected to receive a copy of the Annual Report. Aurizon’s Annual General Meeting will be held at 2.00pm (Brisbane time) on Thursday 18 October 2018. A copy of the Notice of Annual General Meeting is expected to be sent to all shareholders in September 2018. Kind regards Dominic D Smith Company Secretary For personal use only
Transcript of Aurizon Holdings Limited ABN 14 146 335 622 For personal ... · › Enterprise strategy re-set in...
Aurizon Holdings Limited
ABN 14 146 335 622
T +61 7 3019 9000 | F +61 7 3019 0720 | [email protected]
Level 8, 900 Ann Street, Fortitude Valley QLD 4006 Australia | GPO Box 456 Brisbane QLD 4001 Australia
ASX Market Announcements
ASX Limited
20 Bridge Street
Sydney NSW 2000
BY ELECTRONIC LODGEMENT
13 August 2018
2018 Annual Report
Please find attached a copy of the Company’s 2018 Annual Report. In accordance with the relief from dual lodgment of financial statements under ASIC Class Order 98/104, the Annual Report will not be lodged separately with ASIC. Copies of the Annual Report are expected to be dispatched in September 2018 to all shareholders who have elected to receive a copy of the Annual Report. Aurizon’s Annual General Meeting will be held at 2.00pm (Brisbane time) on Thursday 18 October 2018. A copy of the Notice of Annual General Meeting is expected to be sent to all shareholders in September 2018.
Kind regards
Dominic D Smith
Company Secretary
For
per
sona
l use
onl
y
R867233
1. Dominic Smith

17|18ANNUAL
REPORT
For
per
sona
l use
onl
y

Purpose Growing regional Australia by delivering bulk commodities to the world.
VisionThe first choice for bulk commodity transport
solutions.
Values Safety: We have a relentless focus towards ZEROHarm.
People: We seek diverse perspectives.
Integrity: We have the courage to do the right thing.
Customer: We strive to be the first choice for customers.
Excellence: We set and achieve ambitious goals.
Contents
FY2018 in Review ................................................... 1
Chairman’s Report ................................................ 2
Managing Director & CEO’s Report ..............3
Directors’ Report ...................................................4
– Operating and Financial Review ............... 10
– Remuneration Report ....................................25
Auditors’ Independence Declaration ........ 39
Corporate Governance Statement .............40
Financial Report ..................................................46
Shareholder Information ...............................107
Glossary ................................................................ 109
Corporate Information ..................................... 111
For
per
sona
l use
onl
y
FY2018 IN REVIEW 1
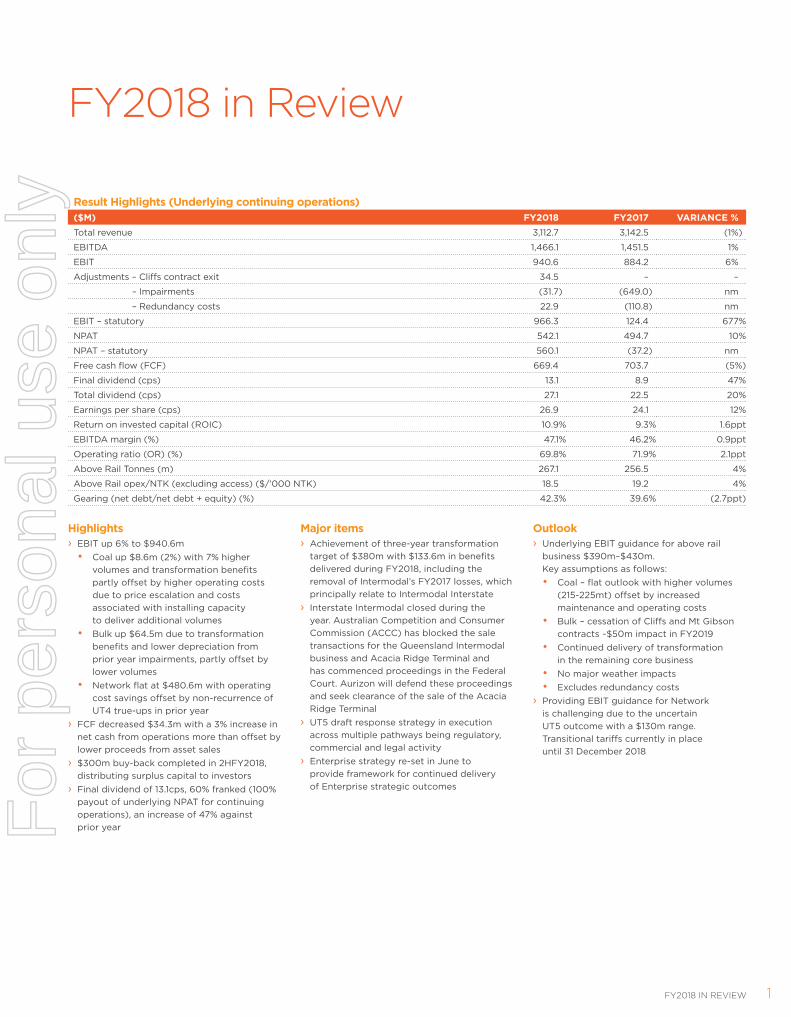
Result Highlights (Underlying continuing operations)($M) FY2018 FY2017 VARIANCE %Total revenue 3,112.7 3,142.5 (1%)
EBITDA 1,466.1 1,451.5 1%
EBIT 940.6 884.2 6%
Adjustments – Cliffs contract exit 34.5 – –
– Impairments (31.7) (649.0) nm
– Redundancy costs 22.9 (110.8) nm
EBIT – statutory 966.3 124.4 677%
NPAT 542.1 494.7 10%
NPAT – statutory 560.1 (37.2) nm
Free cash flow (FCF) 669.4 703.7 (5%)
Final dividend (cps) 13.1 8.9 47%
Total dividend (cps) 27.1 22.5 20%
Earnings per share (cps) 26.9 24.1 12%
Return on invested capital (ROIC) 10.9% 9.3% 1.6ppt
EBITDA margin (%) 47.1% 46.2% 0.9ppt
Operating ratio (OR) (%) 69.8% 71.9% 2.1ppt
Above Rail Tonnes (m) 267.1 256.5 4%
Above Rail opex/NTK (excluding access) ($/’000 NTK) 18.5 19.2 4%
Gearing (net debt/net debt + equity) (%) 42.3% 39.6% (2.7ppt)
Highlights › EBIT up 6% to $940.6m • Coal up $8.6m (2%) with 7% higher
volumes and transformation benefits partly offset by higher operating costs due to price escalation and costs associated with installing capacity to deliver additional volumes
• Bulk up $64.5m due to transformation benefits and lower depreciation from prior year impairments, partly offset by lower volumes
• Network flat at $480.6m with operating cost savings offset by non-recurrence of UT4 true-ups in prior year
› FCF decreased $34.3m with a 3% increase in net cash from operations more than offset by lower proceeds from asset sales
› $300m buy-back completed in 2HFY2018, distributing surplus capital to investors
› Final dividend of 13.1cps, 60% franked (100% payout of underlying NPAT for continuing operations), an increase of 47% against prior year
Major items › Achievement of three-year transformation
target of $380m with $133.6m in benefits delivered during FY2018, including the removal of Intermodal’s FY2017 losses, which principally relate to Intermodal Interstate
› Interstate Intermodal closed during the year. Australian Competition and Consumer Commission (ACCC) has blocked the sale transactions for the Queensland Intermodal business and Acacia Ridge Terminal and has commenced proceedings in the Federal Court. Aurizon will defend these proceedings and seek clearance of the sale of the Acacia Ridge Terminal
› UT5 draft response strategy in execution across multiple pathways being regulatory, commercial and legal activity
› Enterprise strategy re-set in June to provide framework for continued delivery of Enterprise strategic outcomes
Outlook › Underlying EBIT guidance for above rail
business $390m–$430m. Key assumptions as follows:• Coal – flat outlook with higher volumes
(215-225mt) offset by increased maintenance and operating costs
• Bulk – cessation of Cliffs and Mt Gibson contracts ~$50m impact in FY2019
• Continued delivery of transformation in the remaining core business
• No major weather impacts• Excludes redundancy costs
› Providing EBIT guidance for Network is challenging due to the uncertain UT5 outcome with a $130m range. Transitional tariffs currently in place until 31 December 2018
FY2018 in Review
For
per
sona
l use
onl
y

AURIZON ANNUAL REPORT 2017–182
Chairman’s Report
A message from the Chairman
Dear fellow shareholders
Against the backdrop of regulatory uncertainty, I am pleased to report Aurizon’s solid financial performance for the 2018 financial year. Underlying Earnings Before Interest and Tax (EBIT) were $941 million, which was an increase of 6% from FY2017, and within the guidance communicated to shareholders in August 2017.
The growth in Underlying EBIT stems from transformation initiatives and improved earnings in the Coal and Bulk businesses. The Board commends our team for exceeding the $380 million three-year transformation target, with $134 million of benefits delivered this financial year. The Board supports management’s commitment to the ongoing delivery of transformation benefits through building a culture of continuous improvement.
Returning capital to shareholders remains a priority for the Board. Since March 2017, we have distributed more than $1 billion to shareholders through dividend payments and share buybacks. This year, the Board declared a final dividend of 13.1 cents per share 60% franked, giving a full-year dividend of 27.1 cents per share. The total dividend has increased by 20% when compared with the prior year. The final dividend is paying out 100% of the Company’s underlying continuing NPAT, and will be paid to shareholders on 24 September 2018.
As I reflect on my message from last year’s Annual Report, I had identified four key priorities for Aurizon for the 2018 financial year. The first was to receive an acceptable draft decision from the Queensland Competition Authority in relation to the access undertaking of our regulated Network business. The second was to focus on resolving the future of our Intermodal business and the final two priorities were to improve the performance of our Bulk business and to achieve our transformation targets.
While we have delivered on priorities three and four, regulatory decisions have continued to be significant challenges for Aurizon and a source of uncertainty for customers, shareholders and those employees in Network and Intermodal. As we enter FY2019, we remain committed to pursuing commercially sustainable outcomes for both the Network access undertaking and the exit of the Queensland Intermodal business.
At the time of writing, these issues were subject to regulatory and legal review but nonetheless remain key priorities for the Board and our senior team. With respect to the Central Queensland Coal Network, in the longer term, we will continue to advocate for a regulatory framework that is simpler, commercially-oriented to provide certainty and stability that will support continued investment in and growth of, the Queensland coal sector.
In June 2018, we released Strategy in Action, a strategic framework that focuses on Aurizon’s core strengths in delivering transport solutions for customers with bulk commodities. This represents a re-setting of our strategy that has been shaped by major initiatives undertaken during the past year, such as implementing outcomes from a review of our freight operations and the Business Unit restructure.
By concentrating our efforts on what we do well, and in growing markets where we can leverage the capability and talents of our employees, we know we can deliver strong customer and shareholder outcomes. The strategy embodies a commitment to continuous improvement in all parts of the Aurizon business, with the aim of being more efficient, responsive and agile in the markets we choose to compete in. Our Managing Director & CEO Andrew Harding and his leadership team are now driving the implementation of Strategy in Action, engaging with employees across the organisation. Integral to this is creating a values-driven safety and performance culture, where the safety of our people and our operations remains the highest priority. The Board will take a close and active interest in a new program of work that is being implemented to renew the Company‘s focus on safety.
In re-setting Company strategy, extensive analysis was undertaken on bulk commodity markets to understand future demand scenarios. For example, we track construction activity for thermal coal-fired power generation in Asia and steel capacity growth. These are long-life assets with strong demand profiles for high quality Australian coal.
More than 95% of Australian thermal coal exports are delivered to Asia. In key South East Asian nations, there is 17 gigawatts of coal-fired capacity considered under construction, in 22 locations. India is expected to be the single largest driver of seaborne demand for metallurgical coal over coming decades, and with Australia supplying around 90% of its imports this is positive for our customers and for the supply chain.
The Bulk business serves customers with industrial, mining, agricultural and fertiliser products that are in high demand. This includes commodities that are fuelled by growth in the demand for batteries, electric vehicles, computers, telecommunications and improving living standards overseas.
At Board level we are committed to providing oversight and strategic direction to the Company’s social, environmental and economic risks and to ensuring appropriate disclosure of these risks through our annual Sustainability Report. In June 2018, the Australian Council of Superannuation Investors recognised Aurizon as one of 35 companies in the ASX200 that has consistently outperformed in sustainability disclosure over the past four years.
To support the best outcomes for the Company, our Board members have diverse skills and experience, with each member making significant contributions during a challenging year. In November last year, Marcelo Bastos joined Aurizon’s Board as an Independent Non-Executive Director. Marcelo has more than 30 years’ experience in the global mining industry and an excellent understanding of our business, our customers and our future opportunities.
On behalf of the Board, I would like to thank our dedicated group of employees for their hard work and for constantly looking at better and more innovative ways to do their jobs and to deliver for customers. The Board also acknowledges the efforts and contribution of our senior team under Andrew’s leadership, during a year of major change and regulatory challenge. The momentum achieved in continuously improving business outcomes is reflected in the solid FY2018 financial results. Finally, thank you to our customers and shareholders for your ongoing support as we re-shape our Company and our strategy to deliver better outcomes for all our stakeholders.
Tim PooleChairman 12 August 2018
For
per
sona
l use
onl
y
3MANAGING DIRECTOR & CEO’S REPORT
Managing Director & CEO’s Report
A message from the Managing Director & CEO
Dear fellow shareholders
Navigating Aurizon to reach its full potential for customers and for shareholders is an exciting prospect for me. These are the words I shared in the Annual Report last year and, despite some challenges, I remain just as enthusiastic about the opportunities for us to deliver improved value for shareholders, customers and within the communities in which we operate.
To lead the Company to the next phase of performance improvement and growth, there were significant changes to make. We need to work smarter and be more responsive to customers in highly-competitive markets.
Changing the operating model was one change that I moved quickly on. Under the previous structure, accountability for the commercial outcomes of the business was not clearly defined. A new organisational structure was implemented in July 2017, designed along the core customer-facing businesses – Bulk, Coal and Network – with streamlined central support and planning functions. Concurrently, the leadership teams were renewed to ensure we had the management experience and capability to deliver performance improvements.
I am pleased we are starting to see some good results.
The Coal business has secured 10% growth in contracted haulage volumes since 2017, with a number of major wins with customers in Queensland and New South Wales.
The Bulk business is well on track with its turnaround plan, returning to profitability in FY2018 through a disciplined program to lift efficiency, reduce costs and prioritise customer service.
While the turnaround plan is expected to take a number of years to fully implement, the improvements to date demonstrate our underlying capability in bulk commodity markets.
Another outcome from a review of our freight operations was the decision to exit our under-performing Intermodal business through a combination of closure and sale. In December 2017, we ran the final services of our interstate (outside of Queensland) operations before business closure. This had a major benefit by negating the losses we had been incurring in this part of our business.
We also announced in August 2017 the sale of the Queensland Intermodal business to a consortium of Linfox and Pacific National, and the sale of the Acacia Ridge Terminal to Pacific National, subject to regulatory approval. In July 2018, the Australian Competition and Consumer Commission (ACCC) decided to oppose both transactions and commenced proceedings against Pacific National and Aurizon in the Federal Court of Australia. We refute the allegations in the ACCC decision, and while the matter is currently before the courts, we acknowledge this provides uncertainty for our employees, customers and shareholders. We remain committed to the exit of Intermodal to ensure greater focus on our core strengths in bulk commodities.
In the Network business, we are also faced with regulatory challenges as we seek a better outcome with the UT5 Access Undertaking from the Queensland Competition Authority. Without this, we will be constrained in investing in the Central Queensland Coal Network and delivering the level of performance our customers expect on one of Australia’s most important supply chains.
Again, it is important we stay the course in achieving a better outcome with UT5, and in pressing for long-term regulatory reform.
With the business operating model now established, we are focused on delivering on our Strategy in Action, which was launched in June 2018. Much of the work that has been done over the past year laid the foundation for the strategy, which articulates our role in growing regional Australia by delivering bulk commodities to the world.
As part of this strategy we are committed to locating more employees closer to our operations and the customers we serve. Building on the 75% of our workforce already living and working in regional Australia, during the year our Coal and Bulk Group Executives relocated to Mackay and Perth respectively to ensure key decision makers have stronger day-to-day connection with their businesses. Over the coming years, we will move more metropolitan-based roles to regional areas to support our business in regional Australia.
While markets we operate in offer attractive growth opportunities, we are conscious of the changing landscape in the rail haulage industry with existing and emerging competitors vying for business, haulage contracts regularly changing hands and margins constantly under pressure. Our future success depends on us being smarter, more efficient and agile. This includes investment in technology to increase safety, reliability and productivity and to reduce our costs.
In the three years to June 2018, we delivered more than $380 million of transformation benefits through reduced costs and improved productivity. We are now focused on achieving further transformation benefits by seeking opportunities to continuously improve business outcomes.
While our business strategy has been refined, safety remains our core value and we remain committed to achieving ZEROHarm. We have been operating under revised injury metrics for one year now and changing injury definitions was the first step in a broader program of work in safety. This coming financial year, we will be introducing a new program of work to enhance our safety systems and procedures and improve our safety leadership and culture.
While the year has not been without significant challenges, the changes we have made within the business have been important to support delivery of our strategy. We have a great team of people with diverse skills and expertise, and I continue to be energised and focused on the exciting opportunities ahead.
Andrew HardingManaging Director & CEO 12 August 2018
For
per
sona
l use
onl
y
AURIZON ANNUAL REPORT 2017–184
Aurizon Holdings Limited For the year ended 30 June 2018The Directors of Aurizon Holdings Limited present their Directors’ Report together with the Financial Report of the Company and its controlled entities (collectively the Consolidated Entity or the Group) for the financial year ended 30 June 2018 and the Independent Auditor’s Report thereon. This Directors’ Report has been prepared in accordance with the requirements of Division 1 of Part 2M.3 of the Corporations Act.
Board of DirectorsThe following people are Directors of the Company, or were Directors during the reporting period:
T Poole(Appointed 1 July 2015) (Chairman, Independent Non-Executive Director)
A Harding(Appointed 1 December 2016) (Managing Director & Chief Executive Officer)
M Bastos(Appointed 15 November 2017) (Independent Non-Executive Director)
R Caplan(Appointed 14 September 2010) (Independent Non-Executive Director)
J Cooper(Appointed 19 April 2012) (Independent Non-Executive Director)
K Field(Appointed 19 April 2012) (Independent Non-Executive Director)
M Fraser(Appointed 15 February 2016) (Independent Non-Executive Director)
S Lewis(Appointed 17 February 2015) (Independent Non-Executive Director)
K Vidgen(Appointed 25 July 2016) (Independent Non-Executive Director)
Details of the experience, qualifications, special responsibilities and other Directorships of listed companies in respect to each of the Directors as at the date of this Directors’ Report are set out in the pages following.
T PooleExperience: Mr Poole began his career in 1990 at PricewaterhouseCoopers before a long and successful period (1995 to 2007) helping to build Hastings Fund Management, where he became Managing Director in 2005. Hastings was a global investor in unlisted assets, predominantly equity and debt issued by infrastructure companies
Qualifications: BCom.
Special Responsibilities: Chairman of Nomination & Succession Committee. Member of Audit, Governance & Risk Management Committee. Member of Safety, Health & Environment Committee.
Australian Listed Company Directorships held in the past three years: Chairman of Lifestyle Communities Limited (19 November 2007 – ongoing) and McMillan Shakespeare Limited (17 December 2013 – ongoing). Non-Executive Director of Reece Limited (28 July 2016 – ongoing). Formerly Non-Executive Director of Newcrest Mining Limited (14 August 2007 – 30 July 2015) and Japara Healthcare Limited (19 March 2014 – 1 September 2015).
Directors’ Report
For
per
sona
l use
onl
y

5DIRECTORS’ REPORT
A HardingExperience: Mr Harding has extensive operational experience in the resource industry and in managing supply chains for the world’s largest integrated portfolio of iron ore assets.
Mr Harding’s 24-year executive career has been spent with Rio Tinto and in its subsidiary companies, with his most recent role before joining Aurizon being the global Chief Executive Iron Ore.
Mr Harding was also the Global Practice Leader, Asset Management, Technology and Innovation group of Rio Tinto from 2005 to 2009.
Mr Harding has championed a number of workplace initiatives including improvements in safety, a commitment to diversity, and the strengthening of indigenous and community relationships.
Mr Harding is a member of the 2012 class of Henry Crown Fellows at the Aspen Institute.
Qualifications: B.Eng. (Mining Engineering), MBA.
Special Responsibilities: Managing Director & CEO of Aurizon, Director of Aurizon subsidiary companies including Aurizon Network Pty Ltd. Member of Safety, Health & Environment Committee.
Australian Listed Company Directorships held in the past three years: None other than Aurizon Holdings Limited.
M BastosExperience: Mr Bastos has more than 30 years’ of experience globally in the mining industry. He has extensive experience in major project development, operations, logistics and senior leadership in most of the major sectors of the mining industry including iron ore, gold, copper, nickel, zinc and coal.
Previously Marcelo was the Chief Operating Officer of MMG Limited with responsibility for the business in four continents and a member of many of the company Boards. Before MMG he spent seven years with BHP Billiton where he served as President Nickel Americas, President Nickel West (based in Perth), and Chief Executive Officer and President of BHP Billiton Mitsubishi Alliance (based in Brisbane).
Marcelo also had a 19-year career with Vale in a range of senior management and operational positions in Brazil, including General Manager of Iron Ore and also Director of Non Ferrous – Copper business.
Marcelo is currently a Non-Executive Director of Iluka Resources Limited and an External Director (Non-Executive Independent) of Golder Associates.
Qualifications: B.Eng. Mechanical (Hons), MBA (FDC-MG), MAICD
Special Responsibilities: Non-Executive Director of Aurizon Network Pty Ltd. Member of Safety, Health & Environment Committee.
Australian Listed Company Directorships held in the past three years: Iluka Resources Limited – Non-Executive Director (February 2014 – current)
R CaplanExperience: Mr Caplan has extensive international experience in the oil and gas industry. In a 42-year career with Shell, he held senior roles in the upstream and downstream operations, and corporate functions in Australia and overseas. From 1997 to 2006, he had senior international postings in the UK, Europe and the USA. From 2006 to July 2010, he was Chairman of the Shell Group of Companies in Australia.
Mr Caplan is Chairman of the Melbourne and Olympic Parks Trust. He is a former Non-Executive Director of Woodside Petroleum Limited and former Chairman of Orica Limited and the Australian Institute of Petroleum.
Qualifications: LLB, FAICD, FAIM.
Special Responsibilities: Chairman of Remuneration & Human Resources Committee. Member of Audit, Governance & Risk Management Committee.
Australian Listed Company Directorships held in the past three years: Orica Limited – Non-Executive Director (1 October 2007 – 31 December 2015).
For
per
sona
l use
onl
y
AURIZON ANNUAL REPORT 2017–186
Directors’ Report (continued)
J CooperExperience: Mr Cooper has over 35 years’ experience in the construction and engineering sector in Australia and overseas. Mr Cooper is currently Chairman of Sydney Motorway Corporation and a Non-Executive Director of Aurizon Holdings. Mr Cooper’s previous positions include CEO and Managing Director of CMPS&F, a design engineering and project management organisation, and a management role with the Sydney Olympic Organising Committee. Mr Cooper has served on the International Board of Murray and Roberts Pty Ltd, the Board of NRW Holdings Limited, as Deputy Chairman of Clough Engineering Limited and Chairman of Southern Cross Electrical Engineering Pty Ltd.
Qualifications: BSc (Building) (Hons), FIE Aust, FAICD, FIML.
Special Responsibilities: Non-Executive Director of Aurizon Network Pty Ltd. Member of Remuneration & Human Resources Committee. Member of Safety, Health & Environment Committee. Member of Nomination & Succession Committee.
Australian Listed Company Directorships held in the past three years: Southern Cross Electrical Engineering Limited – Chairman and Non-Executive Director (30 October 2007 – 5 May 2015), NRW Holdings Limited – Non-Executive Director (29 March 2011 – 23 November 2015), UGL Limited – Non-Executive Director (15 April 2015 – 28 October 2016) and Windlab Limited – Non-Executive Director (28 July 2017 – ongoing).
K FieldExperience: Mrs Field has more than three decades of experience in the mining industry in Australia and overseas, and has a strong background in human resources and project management.
Mrs Field is a Non-Executive Director of Sipa Resources and has held Non-Executive Directorships with the Water Corporation (Deputy Chairman), Centre of Sustainable Resource Processing, Electricity Networks Corporation (Western Power), MACA Limited and Perilya Limited. In addition, Mrs Field is a Director of a number of community-based organisations including the University of Western Australia’s Centenary Trust for Women and Perth College Anglican School for Girls (Chair of Foundation).
Qualifications: B Econ, FAICD.
Special Responsibilities: Chairman of Safety, Health & Environment Committee. Member of Audit, Governance & Risk Management Committee. Member of Nomination & Succession Committee.
Australian Listed Company Directorships held in the past three years: Sipa Resources Limited – Non-Executive Director (16 September 2004 – ongoing).
M FraserExperience: Mr Fraser has more than 30 years’ experience in the Australian energy industry. He has held various executive positions at AGL Energy culminating in his role as Managing Director and Chief Executive Officer for a period of seven years until February 2015.
Mr Fraser is currently Chairman and Non-Executive Director of the ASX listed APA Group. Mr Fraser is former Chairman of the Clean Energy Council, Elgas Limited, ActewAGL and the NEMMCo Participants Advisory Committee, as well as a former Director of Queensland Gas Company Limited, the Australian Gas Association and the Energy Retailers Association of Australia.
Qualifications: BComm, FCPA, FTIA, MAICD.
Special Responsibilities: Chairman of Aurizon Network Pty Ltd. Member of Remuneration & Human Resources Committee.
Australian Listed Company Directorships held in the past three years: APA Group – Chairman and Non-Executive Director (1 September 2015 – ongoing).
S LewisExperience: Ms Lewis has extensive financial experience, including as a lead auditor of a number of major Australian listed entities. Ms Lewis has significant experience working with clients in the manufacturing, consumer business and energy sectors, and in addition to external audits, has provided accounting and transactional advisory services to other major organisations in Australia. Ms Lewis’ expertise includes accounting, finance, auditing, risk management, corporate governance, capital markets and due diligence. Ms Lewis is currently a Non-Executive Director and Chairman of the Audit & Compliance Committee of Orora Limited, Chairman of APRA’s Audit Committee and member of APRA’s Risk Committee, and a Non-Executive Director and Chairman of the Audit & Risk Committee of Nine Entertainment Co. Holdings Limited. Previously, Ms Lewis was an Assurance & Advisory partner from 2000 to 2014 with Deloitte Australia.
Qualifications: BA (Hons) EC, CA, ACA, GAICD.
Special Responsibilities: Chairman of Audit, Governance & Risk Management Committee. Member of Remuneration & Human Resources Committee. Member of Nomination & Succession Committee.
Australian Listed Company Directorships held in the past three years: Orora – Non-Executive Director (1 March 2014 – ongoing), Nine Entertainment Co. Holdings Limited (20 March 2017 – ongoing).
For
per
sona
l use
onl
y
7DIRECTORS’ REPORT
K VidgenExperience: Ms Vidgen began her career as a banking, finance and energy lawyer at Malleson Stephen Jacques and in 1998 started in the Infrastructure advisory team within the Macquarie Group. During her time at Macquarie, Ms Vidgen has traversed a number of sectors with a focus on infrastructure, energy and resources. Ms Vidgen has also held a number of roles including heading up Macquarie Capital’s coal advisory team in Australia and being Global Co-Head of Resources Infrastructure. Ms Vidgen remains an Executive Director at Macquarie Capital and is currently the Global Head of Principal in Oil and Gas. Ms Vidgen is also the Founding Chair of Quadrant Energy, a privately held oil and gas producer and explorer which is the single largest domestic gas supplier in the Western Australian market.
Qualifications: LLB (Hons), BA, GAICD.
Special Responsibilities: Non-Executive Director of Aurizon Network Pty Ltd. Member of Remuneration & Human Resources Committee.
Australian Listed Company Directorships held in the past three years: Nil.
Company SecretaryMr Dominic Smith was appointed Company Secretary of the QR Limited Group in May 2010 and to Aurizon Holdings Limited upon its incorporation on 14 September 2010.
Mr Smith has over 20 years’ ASX listed company secretariat, governance, corporate legal and senior management experience across a range of industries.
Mr Smith holds a Masters of Laws degree from the University of Sydney and is a Fellow of both the Governance Institute of Australia and the Australian Institute of Company Directors.
Qualifications: BA, LLB, LLM, DipLegS, FGIA, FCSA, FCIS, FAICD.
Principal activitiesThe principal activities of entities within the Group during the year were:
› Integrated heavy haul freight railway operator
› Rail transporter of coal from mine to port for export markets
› Bulk, general and containerised freight businesses
› Large-scale rail services activities
CoalTransport of coal from mines in Queensland and New South Wales to end customers and ports.
FreightTransport of bulk mineral commodities (including iron ore), agricultural products, mining and industrial inputs, and general freight throughout Queensland and Western Australia, and containerised freight throughout Australia.
NetworkProvision of access to, and operation and management of, the Queensland coal network. Provision of design, construction, overhaul, maintenance and management services to the Group, as well as external customers.
Review of operationsA review of the Group’s operations for the financial year and the results of those operations, are contained in the Operating and Financial Review as set out on pages 10 to 24 of this report.
DividendsA final dividend of 8.9 cents per fully paid ordinary share (50% franked) was paid on 25 September 2017 and an interim dividend of 14.0 cents per fully paid ordinary share (50% franked) was paid on 26 March 2018.
Further details of dividends provided for or paid are set out in note 15 to the consolidated financial statements.
Since the end of the financial year, the Directors have declared to pay a final dividend of 13.1 cents per fully paid ordinary share.
The dividend will be 60% franked and is payable on 24 September 2018.
State of affairsIn the opinion of the Directors, other than the intention to exit its Intermodal business announced during the year and as set out in note 24 of the Financial Report, there were no significant changes in the state of affairs of the Company that occurred during the financial year under review.
Events since the end of the financial yearThe Directors are not aware of any events or developments which are not set out in this report or note 34 of the Financial Report that have, or would have, a significant effect on the Group’s state of affairs, its operations or its expected results in future years.
Likely developmentsInformation about likely developments in the operations of the Group and the expected results of those operations are covered in the Chairman’s Report set out on page 2 of this report.
In the opinion of the Directors, disclosure of any further information would be likely to result in unreasonable prejudice to the Group.
Environmental regulation and performanceAurizon is committed to managing its operational activities and services in an environmentally responsible manner to meet legal, social and moral obligations. In order to deliver on this commitment, Aurizon seeks to comply with all applicable environmental laws and regulations.
Aurizon acknowledges the strong scientific consensus that climate change is occurring and supports the objectives of the Paris Agreement, to find a pathway to limiting global warming to below two degrees Celsius. Notably, since 2017, the Company has adopted the Financial Stability Board’s (FSB) Final Report: Recommendations of the Task Force on Climate-Related Financial Disclosures (TCFD).
As part of Aurizon’s climate change strategy the Company has set and is tracking progress toward its 2020 greenhouse gas (GHG) emissions intensity target, it analyses climate change policy implications for Australia’s thermal coal and has processes for preparing and adapting to severe weather events. In relation to the company’s GHG emissions intensity target, FY2018 performance demonstrated an overall reduction in emissions intensity, with a 7% reduction achieved against our 2015 baseline. The Company is continuing to focus on improving the emissions intensity performance of its locomotive fleet.
The National Greenhouse and Energy Reporting Act 2007 (NGER) (Cth) requires the Group to report its annual greenhouse gas emissions and energy use. The Group has implemented systems and processes for the collection and calculation of the data required and is registered under the NGER Act.
At the close of the first Emissions Reduction Fund Safeguard Mechanism (Safeguard) compliance period (ending June 30, 2017), three of Aurizon’s NGER facilities were captured. Through effective management of the Company’s emissions, it achieved full compliance with the Safeguard and as such, was not required to purchase or generate Australian Carbon Credit Units for the reporting period.
Further details of the Company’s environmental performance are set out in the Sustainability Report on the Aurizon website aurizon.com.au/sustainability.
Environmental prosecutionsThere have been no environmental prosecutions during this financial year.
For
per
sona
l use
onl
y

AURIZON ANNUAL REPORT 2017–188
Directors’ Report (continued)
Risk managementThe Company is committed to managing its risks in an integrated, systematic and practical manner. The overall objective of risk management is to assist the Company to achieve its objectives by appropriately considering both threats and opportunities, and making informed decisions.
The Audit, Governance & Risk Management Committee oversees the process for identifying and managing risk in the Company (see page 44 of this Annual Report). The Company’s Risk and Assurance Function is responsible for providing oversight of the risk management function and assurance on the management of significant risks to the Managing Director & CEO and the Board.
The Company’s risk management framework, responsibilities and accountabilities are aligned with the Company’s business model where the individual businesses are accountable for demonstrating they are managing their risks effectively, and in accordance with the Board-approved risk management policy and framework.
The risk management framework has a strong focus on key organisational controls. A focus on the key organisational controls helps to shape the strategies, capabilities and culture of the organisation, identify and address vulnerabilities, strengthen the system of internal controls and build a more resilient organisation.
The Company also has a series of risk registers, with risk profiles and mitigations populated at the various layers of the organisation. Processes exist for the prevention, detection and management of fraud within the Company, and for fair dealing in matters pertaining to fraud.
TABLE 1 – DIRECTORS’ MEETINGS AS AT 30 JUNE 2018
DIRECTORAURIZON HOLDINGS
BOARD
AUDIT, GOVERNANCE & RISK MANAGEMENT
COMMITTEE
REMUNERATION & HUMAN RESOURCES
COMMITTEE
SAFETY, HEALTH & ENVIRONMENT
COMMITTEE
NOMINATION & SUCCESSION
COMMITTEEA B A B A B A B A B
T Poole1 18 18 6 6 4 4 5 5 1 1
A Harding 18 18 – – – – 5 5 – –
M Bastos2 9 9 – – – – 3 3 – –
R Caplan 18 18 9 9 10 10 – – – –
J Cooper3 18 16 – – 6 3 5 5 1 1
K Field 18 18 9 9 – – 5 5 1 1
M Fraser 18 18 – – – – – – – –
S Lewis 18 18 9 9 6 6 – – 0 0
K Vidgen 18 18 – – 10 10 – – – –
A Number of meetings held while appointed as a Director or Member of a Committee.B Number of meetings attended by the Director while appointed as a Director or Member of a Committee.1 In addition to the meetings above, a Committee of the Board comprising of T Poole and A Harding met respectively on two occasions.2 M Bastos was appointed a Non-Executive Director on 15 November 2017 and attended all meetings as a Non-Executive Director.3 J Cooper was granted a Leave of Absence for two Aurizon Holdings Board meetings and was granted a Leave of Absence for two Remuneration & Human Resources
Meeting and was an apology for one Remuneration & Human Resources Committee Meeting since being appointed to the Committee on 24 November 2017.
Directors’ meetingsThe number of Board meetings (including Board Committee meetings) and number of meetings attended by each of the Directors of the Company during the financial year are listed above.
During the year, the Aurizon Network Pty Ltd Board met on 11 occasions.
Directors’ interestsDirectors’ interests are as at 30 June 2018.
TABLE 2 – DIRECTORS’ INTERESTS AS AT 30 JUNE 2018
DIRECTORNUMBER OF ORDINARY
SHAREST Poole 90,500
A Harding 10,000
M Bastos 11,400
R Caplan 82,132
J Cooper 95,000
K Field 40,458
M Fraser 40,000
S Lewis 33,025
K Vidgen 40,000Only Mr Harding, Managing Director & CEO receives performance rights, details set out in the Remuneration Report
For
per
sona
l use
onl
y

9DIRECTORS’ REPORT
Non-audit servicesDuring the year the Company’s auditor PricewaterhouseCoopers (PwC), performed other services in addition to its audit responsibilities.
The Directors are satisfied that the provision of non-audit services by PwC during the reporting period did not compromise the auditor independence requirements set out in the Corporations Act.
All non-audit services were subject to the Company’s Non-Audit Services Policy and do not undermine the general principles relating to auditor independence set out in APES 110 Code of Ethics for Professional Accountants as they did not involve reviewing or auditing the auditor’s own work, acting in a management or decision-making capacity for the Company, or jointly sharing risks and rewards.
No officer of the Company was a former Partner or Director of PwC and a copy of the auditor’s independence declaration as required under the Corporations Act 2001 is set out in, and forms part of, this Directors’ Report.
Details of the amounts paid to the auditor of the Company and its related practices for non-audit services provided throughout the year are as set out below:
2018 $’000
OTHER ASSURANCE SERVICESTotal remuneration for other assurance services 122
OTHER SERVICESTotal remuneration for other services 282
CEO and CFO declarationThe Managing Director & CEO and Chief Financial Officer (CFO) have provided a written statement to the Board in accordance with Section 295A of the Corporations Act.
With regard to the financial records and systems of risk management and internal compliance in this written statement, the Board received assurance from the Managing Director & CEO and CFO that the declaration was founded on a sound system of risk management and internal control and that the system was operating effectively, in all material respects in relation to the reporting of financial risks.
Indemnification and insurance of officersThe Company’s Constitution provides that the Company may indemnify any person who is, or has been, an officer of the Group, including the Directors and Company Secretary, against liabilities incurred whilst acting as such officers to the maximum extent permitted by law.
The Company has entered into a Deed of Access, Indemnity and Insurance with each of the Company’s Directors. No Director or officer of the Company has received benefits under an indemnity from the Company during or since the end of the year.
The Company has paid a premium for insurance for officers of the Group. This insurance is against a liability for costs and expenses incurred by officers in defending civil or criminal proceedings involving them as such officers, with some exceptions. The contract of insurance prohibits disclosure of the nature of the liability insured against and the amount of the premium paid.
Proceedings against the CompanyThe Directors are not aware of any current civil litigation proceedings, arbitration proceedings, administration appeals, or criminal or governmental prosecutions of a material nature which are not set out in this report or note 24 of the Financial Report in which Aurizon Holdings is directly or indirectly concerned which are likely to have a material adverse effect on the business or financial position of the Company.
Remuneration ReportThe Remuneration Report is set out on pages 25 to 38 and forms part of the Directors’ Report for the financial year ended 30 June 2018.
Rounding of amountsThe amounts contained in this report and in the financial statements have been rounded to the nearest hundred thousand dollars unless otherwise stated (where rounding is applicable) under the option available to the Company under ASIC Corporations (Rounding in Financial/Directors’ Reports) Instrument 2016/191. The Company is an entity to which the instrument applies.
Auditor’s Independence DeclarationA copy of the Auditor’s Independence Declaration, as required under section 307C of the Corporations Act, is set out on page 39. The Directors’ Report is made in accordance with a resolution of the Directors of the Company.
Tim PooleChairman 12 August 2018
For
per
sona
l use
onl
y

AURIZON ANNUAL REPORT 2017–1810
CONSOLIDATED RESULTS (Underlying continuing operations unless stated) The Group’s financial performance is explained using measures that are not defined under IFRS and are therefore termed non-IFRS measured. The non-IFRS financial information contained within this Directors’ Report and Notes to the Financial Statements has not been audited in accordance with Australian Auditing Standards. The non-IFRS measures used to monitor Group performance are EBIT (Statutory and Underlying), EBITDA (Statutory and Underlying), EBITDA margin (Statutory and Underlying), NPAT Underlying, Operating Ratio (Underlying), Return on Invested Capital (ROIC), Net debt and Net gearing ratios. Each of these measures is discussed in more detail on page 105. Unless otherwise noted, the Operating and Financial Review information excludes discontinued operations being Intermodal.
1. Annual comparison FINANCIAL SUMMARY
($M) FY2018 FY2017 VARIANCE %Total revenue 3,112.7 3,142.5 (1%)Operating costs
Employee benefits (774.6) (781.8) 1%Energy and fuel (252.4) (236.5) (7%)Track access (191.4) (204.2) 6%Consumables (348.4) (392.9) 11%Other (79.8) (75.6) (6%)
EBITDA 1,466.1 1,451.5 1%- statutory 1,491.8 691.7 116%
Depreciation and amortisation (525.5) (567.3) 7%EBIT 940.6 884.2 6%
- statutory 966.3 124.4 677%Net finance costs (165.0) (178.6) 8%Income tax (expense)/benefit (233.5) (210.9) (11%)
- statutory (241.2) 17.0 nm NPAT 542.1 494.7 10%
- statutory 560.1 (37.2) nmLoss after tax from discontinued operations - statutory (77.1) (150.7) 49%NPAT (group) - statutory 483.0 (187.9) nmEarnings per share1 26.9 24.1 12%
- statutory 27.8 (1.8) nm Earnings per share1 (group) 25.7 22.5 14%
- statutory 24.0 (9.2) nmReturn on invested capital (ROIC)2 10.9% 9.3% 1.6pptReturn on invested capital (ROIC)2 (group) 10.4% 8.7% 1.7pptOperating ratio 69.8% 71.9% 2.1pptNet cashflow from operating activities 1,307.7 1,273.2 3%Final dividend per share (cps) 13.1 8.9 47%Gearing (net debt/net debt + equity) (%) (group) 42.3% 39.6% (2.7ppt)Net tangible assets per share ($) (group) 2.3 2.4 (4%)People (FTE) 4,835 5,024 4%
OPERATING METRICS
FY2018 FY2017 VARIANCE %Above Rail3 Revenue/NTK ($/’000 NTK) 38.1 38.7 (2%)Labour costs4/Revenue 24.4% 24.7% 0.3ppt
NTK/FTE (MNTK) 13.2 12.5 6%Above Rail opex/NTK (excluding access) ($/’000 NTK) 18.5 19.2 4%Above Rail NTK (bn) 63.8 63.0 1%Above Rail Tonnes (m) 267.1 256.5 4%
1 Calculated on weighted average number of shares on issue – 2,013.4m FY2018 and 2,051.7m FY20172 ROIC is defined as underlying rolling twelve-month EBIT divided by the average invested capital. The average invested capital is calculated by taking the rolling twelve-
month average of net property, plant and equipment including assets under construction plus investments accounted for using the equity method plus current assets less cash, less current liabilities plus net intangibles
3 Above Rail includes both Coal above rail revenue and Bulk freight transport revenue4 FY2018 excludes $16.5m redundancy costs (FY2017 excludes $5.1m redundancy costs)
Directors’ Report (continued)OPERATING AND FINANCIAL REVIEW
For
per
sona
l use
onl
y

11OPERATING AND FINANCIAL REVIEW
EBIT BY SEGMENT
($M) FY2018 FY2017 VARIANCE %Coal 428.6 420.0 2%Bulk 50.1 (14.4) nmNetwork 480.6 480.9 –Other (18.7) (2.3) (713%)
Group (Continuing operations) 940.6 884.2 6%
Group Performance OverviewEBIT increased $56.4m or 6% due to increased earnings in Bulk resulting from transformation benefits and lower net depreciation. Earnings in Coal increased due to higher volumes and transformation benefits, while Network was flat due to the non-recurrence of UT4 true-ups received in FY2017. Both Coal and Network delivered record tonnages in the year at 212.4mt (7% increase) and 229.6mt (9% increase) respectively. The deterioration in Other EBIT was principally due to the non-recurrence of the UT4 corporate cost true-up from the prior year.
Aurizon has achieved its three-year transformation target of $380m with total Group transformation benefits of $133.6m being delivered in the year, including the removal of Intermodal’s FY2017 losses, which principally relate to Intermodal Interstate.
Group revenue decreased $29.8m or 1% largely because of the prior period UT4 adjustments more than offsetting a 4% improvement in above rail volumes to 267.1mt.
Operating costs decreased $44.4m or 3% with transformation benefits and lower operating costs in Network and Bulk partly offset by higher costs in Coal relating to increased volumes and cost escalation. Depreciation has decreased $41.8m or 7% largely due to the impact of impairments in FY2017 in Bulk.
ROIC has improved 1.6ppt to 10.9% reflecting both the improvement in EBIT and the full year impact of the impairments taken in FY2017.
Statutory EBIT improved $841.9m to $966.3m reflecting the significant items recognised during the year totalling $25.7m namely, asset impairments of $31.7m offset by the net benefit of the Cliffs contract termination of $34.5m and the release of $22.9m of redundancy provision against total significant items of $759.8m recognised in the prior period.
Reconciliation to Statutory EarningsUnderlying earnings is a non-statutory measure, and is the primary reporting measure used by management and the Group’s chief operating decision making bodies for the purpose of managing and assessing the financial performance of the business. Underlying earnings is derived by adjusting statutory earnings for significant items as noted in the following table:
($M) FY2018 FY2017Underlying EBIT (Continuing operations) 940.6 884.2Significant items (Continuing operations) 25.7 (759.8)
Bulk contract exit — termination payment 66.3 –
Bulk contract exit — costs (31.8) –
Asset impairments (31.7) (649.0)
Freight Management Transformation project – (64.0)
Impairment of assets in exit of contracts – (10.2)
Transformation — assets – (48.9)
Bulk (31.7) (525.9)
Redundancy costs 22.9 (110.8)
Statutory EBIT (Continuing operations) 966.3 124.4Net finance costs (165.0) (178.6)
Statutory PBT (Continuing operations) 801.3 (54.2)Taxation (expense)/benefit (241.2) 17.0
Statutory NPAT (Continuing operations) 560.1 (37.2)Underlying EBIT (Discontinued operations) (24.0) (48.2)
Significant items (Discontinued operations) (74.7) (167.2)Intermodal (74.7) (167.2)
Net finance cost (Discontinued operation) – 0.1
Income Tax Benefit (Discontinued operation) 21.6 64.6
Statutory NPAT 483.0 (187.9)
For
per
sona
l use
onl
y
AURIZON ANNUAL REPORT 2017–1812
Reconciliation to Statutory Earnings (continued)
Significant items for the continuing operations of $25.7m were recognised in FY2018 including:
› Cliffs contract termination $34.5m — On 29 June 2018 Cliffs issued a contract termination notice to Aurizon effective 30 June 2018. An early termination payment of $66.3m (ex GST) was payable and recognised as other income. As a consequence of the contract termination, asset impairments of $27.9m have been recognised. In addition, a closure provision of $3.9m has been recognised which includes a redundancy provision of $3.5m for 63 FTEs
› Asset impairment $31.7m — As a result of the Cliffs contract early termination an impairment review of the Western Australia CGU was undertaken and a write down of $31.7m has been recognised in FY2018. Following the impairment, the residual carrying value of the Western Australia CGU is $170.7m
› Redundancy costs $22.9m — A provision for train crew redundancy, recorded as a significant item in FY2017, has been released in FY2018 with the planned transition to a flexible workforce not being implemented at this time due to operational requirements and stronger coal demand
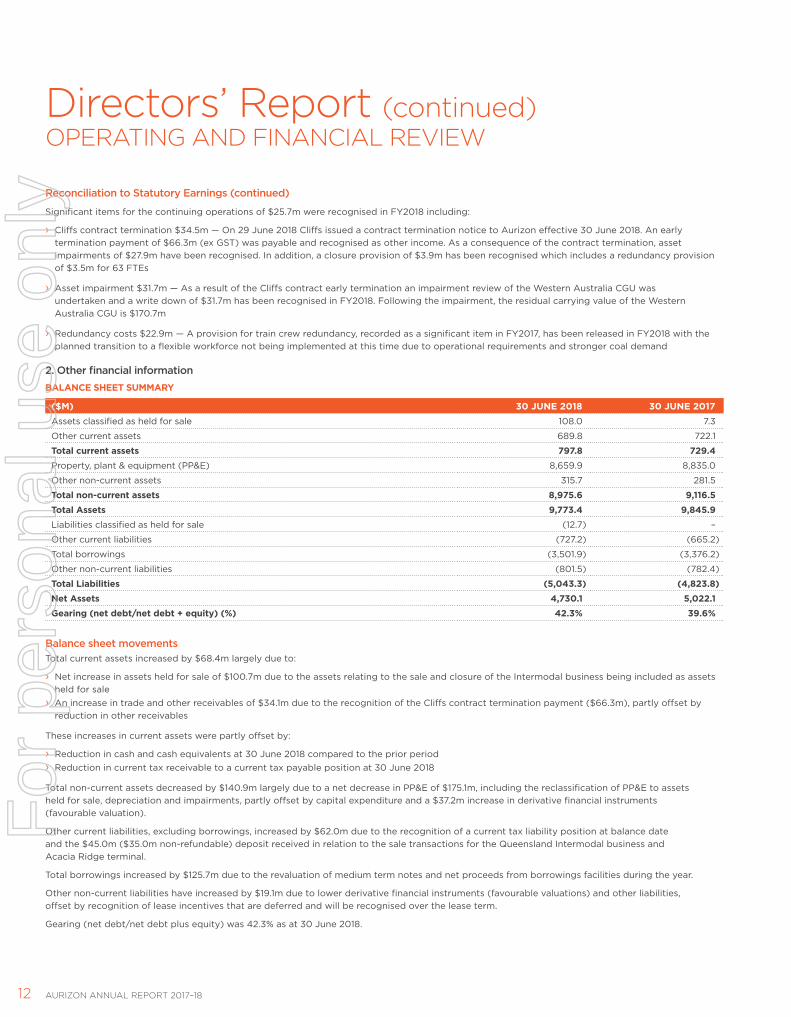
2. Other financial informationBALANCE SHEET SUMMARY
($M) 30 JUNE 2018 30 JUNE 2017Assets classified as held for sale 108.0 7.3
Other current assets 689.8 722.1
Total current assets 797.8 729.4Property, plant & equipment (PP&E) 8,659.9 8,835.0
Other non-current assets 315.7 281.5
Total non-current assets 8,975.6 9,116.5Total Assets 9,773.4 9,845.9Liabilities classified as held for sale (12.7) –
Other current liabilities (727.2) (665.2)
Total borrowings (3,501.9) (3,376.2)
Other non-current liabilities (801.5) (782.4)
Total Liabilities (5,043.3) (4,823.8)Net Assets 4,730.1 5,022.1Gearing (net debt/net debt + equity) (%) 42.3% 39.6%
Balance sheet movements Total current assets increased by $68.4m largely due to:
› Net increase in assets held for sale of $100.7m due to the assets relating to the sale and closure of the Intermodal business being included as assets held for sale
› An increase in trade and other receivables of $34.1m due to the recognition of the Cliffs contract termination payment ($66.3m), partly offset by reduction in other receivables
These increases in current assets were partly offset by:
› Reduction in cash and cash equivalents at 30 June 2018 compared to the prior period › Reduction in current tax receivable to a current tax payable position at 30 June 2018
Total non-current assets decreased by $140.9m largely due to a net decrease in PP&E of $175.1m, including the reclassification of PP&E to assets held for sale, depreciation and impairments, partly offset by capital expenditure and a $37.2m increase in derivative financial instruments (favourable valuation).
Other current liabilities, excluding borrowings, increased by $62.0m due to the recognition of a current tax liability position at balance date and the $45.0m ($35.0m non-refundable) deposit received in relation to the sale transactions for the Queensland Intermodal business and Acacia Ridge terminal.
Total borrowings increased by $125.7m due to the revaluation of medium term notes and net proceeds from borrowings facilities during the year.
Other non-current liabilities have increased by $19.1m due to lower derivative financial instruments (favourable valuations) and other liabilities, offset by recognition of lease incentives that are deferred and will be recognised over the lease term.
Gearing (net debt/net debt plus equity) was 42.3% as at 30 June 2018.
Directors’ Report (continued)OPERATING AND FINANCIAL REVIEW
For
per
sona
l use
onl
y

13OPERATING AND FINANCIAL REVIEW
CASH FLOW SUMMARY
($M) FY2018 FY2017Statutory EBITDA (Continuing operations) 1,491.8 691.7Working capital and other movements (146.9) 75.2
Non-cash adjustments – asset impairments5 70.0 678.3
Cash flows from Continuing operations 1,414.9 1,445.2Interest received 2.9 2.8
Income taxes paid (110.1) (174.8)
Net cash inflow from operating activities from Continuing operations 1,307.7 1,273.2Net operating cashflows from Discontinued operations (25.1) (34.8)
Net operating cash flows 1,282.6 1,238.4Cash flows from investing activitiesProceeds from sale of property, plant and equipment (PP&E) and associate 19.0 111.4
Payments for PP&E and intangibles (501.5) (507.9)
Net cash (outflow) from investing activities from Continuing operations (482.5) (396.5)Net investing cashflows from Discontinued operations 54.6 (34.7)
Net investing cashflows (427.9) (431.2)Cash flows from financing activitiesNet proceeds/(repayments) from borrowings 12.2 (55.3)
Payment for share buy-back and share based payments (302.9) (7.5)
Interest paid (155.8) (173.0)
Dividends paid to Company shareholders (462.1) (551.9)
Net cash (outflow) from financing activities from Continuing operations (908.6) (787.7)Net financing cashflows from Discontinued operations – –
Net financing cashflows (908.6) (787.7)Net increase/(decrease) in cash from Continuing operations (83.4) 89.0Net increase/(decrease) in cash from Discontinued operations 29.5 (69.5)Free Cash Flow (FCF)6 from Continuing operations 669.4 703.7Free Cash Flow (FCF)6 from Discontinued operations 29.5 (69.5)
Cash flow movements Net cash inflow from operating activities for continuing operations increased by $34.5m (3%) to $1,307.7m largely due to a $64.7m reduction in income taxes paid as FY2017 included a significant final tax payment relating to the tax liability for FY2016. This is partly offset by a net increase in working capital due to lower trade and other payables and an increase in trade and other receivables with the recognition of the Cliffs termination payment ($66.3m) at 30 June 2018.
Net cash outflow from investing activities for continuing operations increased by $86.0m (22%) largely due to $98.3m proceeds from the sale of the Moorebank investment in the prior year.
Net cash flow from investing activities for discontinued operations increased by $89.3m due to FY2018 including the deposit received for the sale transactions for the Queensland Intermodal business and Acacia Ridge terminal and proceeds from the sale of plant and equipment as part of the closure of Intermodal Interstate.
Net cash outflow from financing activities for continuing operations increased by $120.9m (15%) to $908.6m due to the on-market share buy-back of $300.0m, partly offset by a reduction in dividends paid and net proceeds from borrowings in FY2018.
5 Total asset impairments of $10.4 million included in underlying EBIT in FY20186 FCF — Defined as net cash flow from operating activities less net cash outflow from investing activities less interest paid
For
per
sona
l use
onl
y

AURIZON ANNUAL REPORT 2017–1814
Funding Aurizon has a target gearing level of ~40%.
The Group continues to be committed to diversifying its debt investor base and increasing average debt tenor. Network repriced and extended an existing $525m bank facility in November 2017, with maturity extended to FY2023 and tranche size decreased to $500m. In respect of FY2018: › Weighted average debt maturity tenor
was 4.7 years. This was lower than FY2017 (5.0 years) due to the majority of the debt portfolio’s duration reducing by 12 months which offset the extension of the facility noted above
› Group interest cost on drawn debt decreased to 4.5% (FY2017 5.0%) due to the rolling off of interest rate hedges in June 2017
› Available liquidity (undrawn facilities plus cash) at 30 June 2018 was $0.9bn
› Group gearing (net debt/(net debt + equity)) as at 30 June 2018 was 42.3% (FY2017 39.6%)
› Network gearing (net debt/RAB (excl AFDs)) as at 30 June 2018 was 62.4% (FY2017 54.1%)
› Network gearing (net debt/RAB (incl AFDs)) as at 30 June 2018 was 57.9% (FY2017 50.2%)
› Credit rating remains unchanged for Network and Aurizon Holdings at BBB+/Baa1
Share Buy-Back As part of its commitment to return surplus capital to shareholders, on 14 August 2017 Aurizon announced the intention to undertake an on-market buy-back of $300 million. The buy-back was completed on 1 March 2018, with 61.6 million shares bought back and subsequently cancelled.
DividendThe Board has declared a final dividend for FY2018 of 13.1cps (60% franked) based on a payout ratio of 100% in respect of underlying NPAT for continuing operations.
The relevant final dividend dates are: › 27 August 2018 — ex-dividend date › 28 August 2018 — record date › 24 September 2018 — payment date
Tax Income tax expense for continuing operations for FY2018 was $241.2m and for the continuing and discontinued operations was $219.6m. The Group effective tax rate7 for FY2018 was 30.1% which is greater than 30% due to permanent differences in the fixed asset adjustments and a decrease in expenditure eligible for the research and development tax incentive. The cash tax rate8 for FY2018 was 23.9%, which is less than 30% primarily due to accelerated fixed asset related adjustments.
The effective tax rate for FY2019 is expected to be in the range of 30% to 32% and the cash tax rate is expected to be less than 25% for the short to medium-term.
Aurizon publishes additional tax information in accordance with the voluntary Tax Transparency Code in its sustainability report. Please refer to www.aurizon.com.au/sustainability/overview for a copy of Aurizon’s sustainability report (including tax transparency disclosures).
Discontinued Operations On 14 August 2017 Aurizon announced the intention to exit the Intermodal business through a combination of closure and sale.
Aurizon’s Interstate Intermodal business has been closed with the last operational service occurring on 23 December 2017.
Aurizon signed a binding agreement with Pacific National (PN) to sell its Acacia Ridge terminal. Aurizon signed a separate binding agreement to sell its Queensland Intermodal business to a consortium of Linfox and PN. The transactions have been subject to regulatory approval.
The ACCC decision was announced on 19 July 2018. The ACCC decided to oppose both transactions and commenced proceedings against PN and Aurizon in the Federal Court of Australia. The ACCC has sought declarations, pecuniary penalties, orders restraining the existing sale transactions from proceeding and costs. The ACCC has also sought an injunction to prevent Aurizon from closing its Queensland Intermodal business while proceedings are on foot.
Aurizon refutes the ACCC’s allegations and will defend the proceedings, including seeking clearance of the Acacia Ridge transaction.
On 12 August 2018 Aurizon provided PN with a notice to terminate the Business Sale Agreement for the Queensland Intermodal business, with effect from 13 August 2018. It is Aurizon’s intention to not contest clearance of the transaction through the Federal Court and to exit the business. As clearance has not been obtained for the sale of the Queensland Intermodal business, $10m of the consideration received for the transactions to date (recognised as a liability at 30 June 2018) will be refunded to PN. The Business Sale Agreement for the Acacia Ridge Terminal remains in place while Aurizon seeks clearance of that transaction, and the remainder of the consideration received for the transactions to date ($35m) is not refundable.
On 10 August 2018 the Federal Court of Australia heard an application from the ACCC for an interlocutory injunction to require Aurizon to continue to operate the Queensland Intermodal business in the ordinary and usual course. The Court reserved judgement on the matter, and judgement is currently expected to be handed down on 13 August 2018.
For the year ended 30 June 2018 the Intermodal business is disclosed as discontinued with Acacia Ridge and Queensland Intermodal assets classified as assets held for sale. Financial information relating to discontinued operations is set out on page 21.
BUSINESS UNIT REVIEWCOAL Aurizon’s Coal business provides a critical link in Australia’s major coal chain systems for the majority of Australia’s coal producers. The coal transport operation links mines in the Newlands, Goonyella, Blackwater, Moura and West Moreton systems in Queensland and the Hunter Valley, including Ulan and Gunnedah coal systems, in New South Wales to domestic customers and coal export terminals.
Directors’ Report (continued)OPERATING AND FINANCIAL REVIEW
7 Underlying effective tax rate = income tax expense excluding the impact of significant items/underlying consolidated profit before tax8 Underlying cash tax rate = cash tax payable excluding the impact of significant items/underlying consolidated profit before tax
For
per
sona
l use
onl
y

15OPERATING AND FINANCIAL REVIEW
($M) FY2018 FY2017 VARIANCE %Revenue
Above Rail 1,207.8 1,156.8 4%
Track Access 598.1 630.3 (5%)
Other 7.3 7.9 (8%)
Total revenue 1,813.2 1,795.0 1%Operating costs (1,202.0) (1,191.3) (1%)
EBITDA 611.2 603.7 1%Depreciation and amortisation (182.6) (183.7) 1%
EBIT 428.6 420.0 2%
METRICS
FY2018 FY2017 VARIANCE %Total tonnes hauled (m) 212.4 198.2 7%
CQCN 152.5 143.5 6%
NSW & SEQ 59.9 54.7 10%
Contract utilisation 93% 89% 4ppt
Total NTK (bn) 50.4 47.6 6%
CQCN 38.3 36.8 4%
NSW & SEQ 12.1 10.8 12%
Average haul length (km) 237 240 (1%)
Total revenue/NTK ($/’000 NTK) 36.0 37.7 (5%)
Above Rail Revenue/NTK ($/’000 NTK) 24.0 24.3 (1%)
Operating Ratio (%) 76.4% 76.6% 0.2ppt
Opex/NTK ($/’000 NTK) 27.5 28.9 5%
Opex/NTK (excluding access costs) ($/’000 NTK) 15.4 15.3 (1%)
FTE (monthly average) 1,729 1,698 (2%)
Labour productivity (NTK/FTE) 29.1 28.0 4%
Locomotive productivity (‘000 NTK/Active locomotive day) 462.8 468.0 (1%)
Active locomotives (as at 30 June) 308 288 7%
Wagon productivity (‘000 NTK/Active wagon day) 16.4 16.3 1%
Active wagons (as at 30 June) 8,568 8,251 4%
Payload (tonnes) 7,447 7,430 –
Velocity (km/hr) 23.2 23.6 (2%)
Fuel Consumption (l/d GTK) 2.91 2.90 –
Coal Performance OverviewUnderlying EBIT increased $8.6m (2%) to $428.6m, with increased volumes and ongoing benefits delivered from the transformation program more than offsetting an increase in operating costs due to price escalation and costs associated with installing capacity to deliver additional volumes.
Volumes increased by 14.2mt (7%) to 212.4mt reflecting the FY2017 volume impact of Cyclone Debbie, the commencement of new contracts and the continued strength in coal prices resulting in high levels of customer demand, partly offset by lower network availability in the Central Queensland Coal Network (CQCN) in 2HFY2018. In NSW and South-East Queensland (SEQ), volumes increased by 5.2mt (10%) to 59.9mt driven largely by the commencement of the AGL Macquarie contract in July. Across CQCN, volumes increased by 9.0mt (6%) to 152.5mt, reflecting the FY2017 volume impact of Cyclone Debbie and the commencement of new contracts in late FY2017 and FY2018.
Coal revenue increased $18.2m (1%) to $1,813.2m driven by the growth in volumes offset by lower access revenue. › Above rail revenue increased $51.0m (4%) compared to FY2017 reflecting the 7% increase in volumes as outlined above › Coal track access revenue decreased $32.2m (5%). This decrease is largely driven by customers on the Blackwater and West Moreton corridor
converting to an End User Access Agreement (where access charges are paid direct to Network or Queensland Rail). As access charges are generally passed through to customers, there is a decrease in track access costs as noted below. This reduction was partly offset by a $29.8m credit from Queensland Rail received in 1HFY2017 following the approval of the access undertaking for the West Moreton system (SEQ) which lowered track access revenue in the prior year. Excluding the impact of this credit, coal track access in CQCN decreased by $62.0m
For
per
sona
l use
onl
y

AURIZON ANNUAL REPORT 2017–1816
Coal Performance Overview (continued)Total operating costs (including depreciation) increased $9.6m (1%) to $1,384.6m. The transformation program continues to deliver savings, with $46.5m realised in FY2018 across labour, maintenance and overheads. This was offset by an increase in other operating costs with the major drivers noted below: › Higher labour, fuel and maintenance costs totalling $78.6m including costs to meet additional volumes, wages and consumables escalation, fuel price
increase, higher maintenance relating to reinstated fleet capacity in the CQCN, redundancies and other costs › Track access costs reduced by $35.6m (6%), largely due the impacts discussed above, including Blackwater and West Moreton Corridor
customers moving to End User Agreements and one off impacts of higher take or pay expenses offset by the impact of the 1HFY2017 credit from Queensland Rail
› With the transfer of locomotives from Intermodal Interstate to Coal and the commissioning of new wagons in the Hunter Valley, depreciation modestly increased in 2HFY2018
Key operating metrics remain broadly in line with prior year: › During the period, labour productivity increased 4% with the additional volumes being delivered with a 2% increase in average FTEs › Average payloads remained broadly flat from 7,430t to 7,447t › Average velocity reduced slightly from 23.6km/hr to 23.2km/hr due to increased supply chain constraints and higher NSW volumes › Average NTK per locomotive fell 1% due to the additional consists installed in both NSW and CQCN in order to meet growth volumes
Market update The average hard coking coal price in FY2018 was US$204/t (+7% on the previous year), driven by continued growth in steel production in China and India. In the 12 months to June 2018, China crude steel production achieved a record 870mt, increasing by +6%. India recorded its 29th consecutive month in June 2018 of year-on-year growth in steel production. Given a structural deficiency of high quality coking coal, growth in Indian steel production flows directly to seaborne markets. Australia supplies around 90% of India’s imported metallurgical coal and was the number one destination of Australian metallurgical coal exports in FY2018. India is expected to be the single largest driver of seaborne demand for metallurgical coal over the next decades. The Newcastle benchmark thermal coal price in FY2018 was US$99/t (+24% on the previous year), primarily driven by increased import demand from China, the largest importing nation of thermal coal. China’s imports of thermal and lignite coal lifted +9%yr as domestic coal production remained flat (+1%yr) in conjunction with increased domestic thermal power generation (+6%yr).
From a supply perspective, Australian metallurgical and thermal coal exports reached 179mt (+1%yr) and 202mt (+1%yr) in FY2018 respectively. Given upward pressure on coal prices, opportunistic supply from the United States and Indonesia continued to be incentivised to the market. In the 12 months to May 2018, metallurgical coal exports from the United States lifted +33% and total coal export volume from Indonesia (almost entirely thermal coal) increased by +7% against the same period of the prior year.
Contract update › Baralaba Coal Company entered an agreement for coal haulage from the Baralaba North Mine to the RG Tanna Coal Terminal for 2mtpa. Haulage is
expected to commence 1HFY2019 for a term of up to 10 years › Aurizon’s 2.6mtpa haulage agreement with Yancoal’s Duralie mine ended on 31 August 2017 › Aurizon entered into an agreement with MACH Energy for coal haulage of 8mtpa from the Mount Pleasant Mine to Newcastle ports as well as
domestic power stations. The haul is expected to commence late 1HFY2019, for a contract term of 10 years › Aurizon extended its relationship with the QCoal Group to include coal haulage of up to 10mtpa (5.0mtpa initially) from the greenfield Byerwen Mine
to Abbott Point Coal Terminal, for a period of 10 years, which commenced January 2018 › Bounty Mining commenced railings in March 2018 under a new agreement with Aurizon, following its acquisition of the Cook Colliery which was
completed during 3QFY2018.
BULKAurizon’s Bulk business supports a range of customers nationally for bulk materials and commodities (including iron ore), agricultural products and mining and industrial inputs.
($M) FY2018 FY2017 VARIANCE %Revenue
Freight Transport 592.1 622.3 (5%)
Other 26.0 22.9 14%
Total revenue 618.1 645.2 (4%)Operating costs (542.9) (586.1) 7%
EBITDA 75.2 59.1 27%Depreciation and amortisation (25.1) (73.5) 66%
EBIT 50.1 (14.4) nm
Directors’ Report (continued)OPERATING AND FINANCIAL REVIEW
For
per
sona
l use
onl
y

17OPERATING AND FINANCIAL REVIEW
METRICSFY2018 FY2017 VARIANCE %
Total tonnes hauled (m) 54.7 58.3 (6%)
Total NTK (bn) 13.4 15.4 (13%)
Average haul length (km) 245 264 (7%)
Total revenue/NTK ($/’000 NTK) 46.1 41.9 10%
Operating Ratio (%) 91.9% 102.2% 10.3ppt
Opex/NTK ($/’000 NTK) 42.4 42.8 1%
Opex/NTK (excluding access) ($/’000 NTK) 30.3 31.1 3%
FTE (monthly average) 904 1,066 15%
Labour productivity (NTK/FTE) 14.8 14.4 3%
Order Fulfilment (%) 98.0% 98.2% (0.2ppt)
Fuel Consumption (l/d GTK) 3.01 3.06 2%
Bulk Financial Performance Overview
EBIT increased $64.5m to $50.1m, due to benefits from the transformation program and lower net depreciation from the impairments in FY2017 partly offset by lower volumes.
Revenue decreased $27.1m (4%) to $618.1m with a 6% reduction in volumes (13% in NTK terms): › Iron Ore revenue decreased $3.9m (1%)
predominately due to lower Cliffs volumes › Bulk revenue decreased $23.2m (6%) due
to the cessation of the Mt Isa Freighter in January 2017 and lower QLD/NSW grain volumes due to dry conditions and supply being directed to the domestic market (all Aurizon volumes are export). This was offset marginally by growth in bauxite volumes and the commencement of the Minerals and Metals Group Limited (MMG) contract on the Mt Isa corridor
Bulk revenue per NTK increased 10% predominately due to lower contract utilisation and the commencement of new contracts in Bulk East.
Total costs (including depreciation) decreased $91.6m (14%) driven by transformation savings and lower depreciation expense. The transformation program continued to deliver savings with $31.6m realised in FY2018. Rail access costs reduced by $18.4m due to the lower volumes, principally the cessation of the Mt Isa Freighter and lower Cliffs volumes. The direct cost savings from the cessation of the Mt Isa Freighter service were $14.5m through a reduction in crewing maintenance and terminal services costs. Depreciation expense reduced by $48.4m due to the bulk impairment in FY2017, with $10.4m of capital expenditure written off in FY2018 and included in operating costs resulting in a net benefit of $38.0m. Partly offsetting this were other cost increases including labour and consumables escalation and redundancy costs ($10.9m).
Market updateIron Ore The average iron ore price in FY2018 was US$69.0/t, remaining relatively flat against the previous year’s average of US$69.4/t. China, the world’s largest steel producer (and importer of iron ore) continued to drive demand, with hot metal production growing +2% in the 12 months to June 2018, against a backdrop of supply ramping up from Vale’s S11D project in Brazil and Roy Hill in the Pilbara.
China’s demand shift towards higher grade iron ore continued during FY2018, with prices for lower grade iron ore products remaining at historically lower levels compared to the 62% Fe benchmark price. Supported by higher steel prices and a pursuit for productivity, Chinese steel mills have an incentive to use better quality iron ore (and hard coking coal) to maximise efficiencies in steel production. In addition, China’s increasing focus on reducing pollution and environmental regulation is favouring the use of higher grade ores.
Freight Aurizon’s Bulk business includes haulage of bulk commodities including base metals, minerals, grains and livestock in Queensland, New South Wales (East) and Western Australia (West). Despite stronger prices across the year for a number of commodities that Aurizon hauls, the ongoing challenge of market competitiveness remains.
Contract update › Executed a contract extension for IPL’s acid
and fertiliser hauls on the Mt Isa corridor, commencing January 2020
› Executed a 10-year contract extension for the Cement Australia East End to Fisherman’s Landing limestone haul which commenced January 2018
› Commenced a 7.4-year contract with MMG for the transport of zinc deposits on the Mt Isa corridor during November 2017
› Executed a 2+2 year contract extension for the Queensland Rail services contract, covering both infrastructure trains and supporting the Inlander passenger train
› Executed a short-term extension with Alcoa to rail additional bauxite export volumes into the Kwinana Bulk Terminal
› Contract variation for Mt Gibson Mining to rail additional volumes under the existing Rail Haulage Agreement. This contract will end in December 2018 in line with the end of mine life
› Cliffs Asia Pacific Iron Ore Pty Ltd (Cliffs) terminated its rail haulage agreement with Aurizon on 30 June 2018. This resulted in the closure of Aurizon’s Esperance operations and triggered an early termination payment of $66.3m, which was subsequently received in July 2018. As a consequence of the contract termination, asset impairments of $27.9m have been recognised. In addition, a closure provision of $3.9m has been recognised which includes a redundancy provision of $3.5m for 63 FTEs
› Aurizon was unsuccessful in recontracting the existing QLD Graincorp contract from December 2019
For
per
sona
l use
onl
y

AURIZON ANNUAL REPORT 2017–1818
NETWORK Network refers to the business of Aurizon Network Pty Ltd (Network) which operates the 2,670km CQCN. The open access network is the largest coal rail network in Australia and one of the country’s most complex, connecting multiple customers from more than 40 mines to five export terminals located at three ports. The CQCN includes four major coal systems (Moura, Blackwater, Goonyella and Newlands) and a connecting link (Goonyella to Abbot Point Expansion (GAPE)).
FINANCIAL SUMMARY($M) FY2018 FY2017 VARIANCE %Revenue
Track Access 1,167.1 1,199.9 (3%)
Services and other 51.6 62.2 (17%)
Total revenue 1,218.7 1,262.1 (3%)Operating costs (430.1) (481.7) 11%
EBITDA 788.6 780.4 1%Depreciation and amortisation (308.0) (299.5) (3%)
EBIT 480.6 480.9 –
METRICSFY2018 FY2017 VARIANCE %
Tonnes (m) 229.6 210.8 9%
NTK (bn) 56.9 53.2 7%
Operating Ratio (%) 60.6% 61.9% 1.3ppt
Maintenance/NTK ($/’000 NTK) (excluding rail renewals) 2.2 2.3 4%
Opex/NTK ($/’000 NTK) 13.0 14.7 12%
Cycle Velocity (km/hr) 23.5 23.5 –
System Availability (%) 82.0% 83.7% (1.7ppt)
Average haul length (km) 247.7 252.3 (2%)
Directors’ Report (continued)OPERATING AND FINANCIAL REVIEW
Network Financial Performance OverviewEBIT declined marginally to $480.6m in FY2018, with reductions in operating costs ($51.6m) offset by decreased revenue ($43.4m), mainly due to the non-recurrence of the UT4 true-up of regulatory revenue in FY2017 and increased depreciation ($8.5m).
Track access revenue decreased $32.8m (3%). Regulatory access revenue in FY2018 is based on transitional tariffs pending approval of the UT5 Access Undertaking. This is lower than the FY2017 Allowable Revenue which included approximately $90m of regulatory revenue pertaining to the UT4 true-up for FY2014 to FY2015 which was recognised in FY2017 following the UT4 final decision. In addition, FY2017 also included non-recurring true-ups in relation to GAPE (non-regulated revenue) and AFD rebates totalling $11.4m. Volumes in FY2018 were higher than Cyclone Debbie impacted FY2017 resulting in approximately $53m additional revenue.
FY2018 also included higher Electric Charge (EC) revenue of $30.1m (there is an increase in EC operating expenses) and flood cost recovery of $18.4m mainly relating to Cyclone Debbie. This was partially offset by a $21.6m negative Revenue Cap Adjustment Amount relating to FY2016 which was repaid to Access Holders via tariffs.
Services and other revenue decreased $10.6m (17%) mainly due to the recognition of the Bandanna Group’s $15.3m bank guarantee and a $6.0m insurance claim recovery in FY2017, partly offset by the recognition of $10.0m for the Caledon WIRP Deed bank guarantee held as security in FY2018.
Operating costs decreased $51.6m (11%) with a $45.6m reduction in consumables, mainly due to the non-recurrence of the FY2017 UT4 true-up for corporate costs ($26.4m), and reduced maintenance costs ($12.8m) which were impacted by Cyclone Debbie in the prior year.
This was partially offset by higher energy and fuel costs ($2.4m) from an increase in EC expense ($24.4m) from higher wholesale electricity prices and environmental rates, offset by lower electric connection expense ($20.2m) and increased fuel rebates ($1.8m).
Labour costs increased $8.8m (7%) primarily due to salary escalation and higher headcount. Other expenses decreased $17.3m (59%) due to the prior period impacts of inventory obsolescence, asset disposals and write offs. Depreciation increased $8.5m (3%) mainly from Ballast.
The Regulated Asset Base (RAB) roll-forward value is estimated to be $5.8bn (including all deferred capital but excluding AFDs of $0.4bn) at 1 July 2018.
For
per
sona
l use
onl
y

19OPERATING AND FINANCIAL REVIEW
Regulation Update › Transitional tariffs are in place for the whole
of FY2018 and the first half of FY2019 using the UT4 tariffs with appropriate one-off adjustments
› On 15 December 2017, the QCA released its Draft Decision on Network’s UT5 proposal
› The QCA’s Draft Decision proposes a MAR of $3.893bn over the four-year period with a proposed 5.41% Vanilla Nominal Post Tax WACC (2.97% Vanilla Real Post Tax WACC), using an averaging period of 20 days up to 30 June 2017. Primary drivers behind the reduction from Network’s MAR proposal are:• A risk free rate of 1.90% based on the 4
year government bond rate• An inflation rate of 2.37% applying an
inflation methodology using a geometric average of the RBA forecasting methodology
• Reduction in equity beta to 0.73 (with an asset beta of 0.42)
• Significantly higher Gamma with only a 0.01 reduction from UT4 to 0.46
• A reduction in maintenance and operating expenditure allowances of $104m and $112m respectively over the four-year regulatory period
› The UT5 Draft Decision issued by the QCA is extremely disappointing in its current form, causing damage to Network, customers and the Queensland economy. The QCA view of return and allowances for maintenance and operating costs has resulted in Network implementing changes to its business decisions and operating practices in order to align with the position advocated by the QCA and its consultants in the UT5 Draft Decision. Network has estimated that the net impact of the changes implemented to date could be a reduction of system throughput of approximately 20 million tonnes annually.
› Network submitted a detailed response to the QCA’s UT5 Draft Decision on 12 March 2018. This submission proposed an updated MAR of $4.75bn over the four-year regulatory period with a proposed 7.03% Vanilla Nominal Post Tax WACC (4.62% Vanilla Real Post Tax WACC). Primary drivers behind the revised MAR include:• Change in the risk free rate from 2.13%
at the time of the November 2016 submission, to 2.76% at the time of the submission in response to the Draft Decision. This change reflects a change in market rates at the time of submitting its response. Inflation however changed from 1.22% to 2.30%. This change reflects changes in market conditions and a revised methodology that better aligns the risk free rate and inflation calculations to derive a realistic real risk free return
• Change in gamma from 0.25 in the November 2016 submission to 0.31. This change reflects using the QCA methodology but updated to reflect the appropriate and latest ATO tax statistics at the time of the submission
• An increase from the QCA’s Draft Decision Maintenance Allowance of $111m to $928m, to reflect the change in the QCA’s base year to FY2017 whilst addressing anomalies omitted from the Draft Decision, providing a more appropriate mechanised plant allowance and removal of the QCA’s proposed efficiency factor applied to General Maintenance activities
• Inclusion of the WIRP deferred capital across the Moura system as well as all the deferred WIRP capital across the Blackwater system due to known forecast railings in the Moura system that will utilise that capital.
› On 29 May 2018, the QCA published a Consultation Paper on Network’s UT5 Maintenance Allowances and Practices. The Consultation Paper provided a preliminary view from the QCA that it was ‘favourably disposed’ to accepting Network’s Draft Decision response on maintenance costs. Recognition of the correctness of Network’s maintenance allowance is important, however Network has outlined concerns to the QCA that viewing the maintenance allowance independently of the other components of its operation (and the consequent build-up of the MAR) remains a flawed regulatory practice. There are inherent and interdependent linkages between the maintenance allowance, the WACC and operating costs. A lower WACC will generally drive lower investment likely resulting in greater reactive maintenance and hence even higher maintenance costs. Network’s revised maintenance allowance was part of an overall maximum allowable revenue submission. The maintenance regime underlying the allowance was based on the other components of its submission being approved as those components supported the maintenance regime as part of Network’s operating business model. Different outcomes in those components will necessarily require changes to the overall operations of the Network business and a subsequent impact on maintenance. Network has impressed on the QCA that it cannot consider critical components of business operations in isolation.
› The QCA is yet to confirm the timing for a final decision on UT5.
For
per
sona
l use
onl
y

AURIZON ANNUAL REPORT 2017–1820
Operational UpdatePerformanceDuring FY2018 the network operational performance remained strong and five monthly railing records were achieved. Highlights include:
› Tonnes delivered over the CQCN increased 18.8mt (9%) from the Cyclone Debbie affected FY2017 to a record 229.6mt. Five new monthly records were achieved during FY2018 with each new record being over 19.0mt while June 2018 achieved 20.6mt, the highest ever monthly volume
› Performance to plan improved 3.5ppt to 90.3% › Cancellations due to the Network increased marginally from 1.5%
to 1.7% › Cycle velocity averaged 23.5km/h and remains unchanged from the
prior year
Following the release of the QCA’s Draft Decision on Network’s UT5 Draft Access Undertaking in December 2017, and in order to reduce costs, Network changed some of its operating practices and business decisions to align with a) the position effectively advocated by the QCA through its adoption in the Draft Decision of the maintenance allowance proposed by its consultants based on applying different maintenance regimes and b) the maintenance and operating cost allowances and WACC proposed by the QCA in its Draft Decision. This is because when the QCA’s Final Decision on UT5 is released, it will apply retrospectively from 1 July 2017 (when the UT5 regulatory period commenced). At this time the Draft Decision is the best reflection of the Final Decision and therefore the appropriate basis for Network to modify its operating practices and business decisions to recognise the application of the Final Decision from 1 July 2017.
Key changes included: › Prioritised adherence to the initially formulated plan for planned
maintenance and capital works › Modified rail defect maintenance practices to reduce Network’s risk
on long-term track reliability and productivity › Major maintenance activities being provided over longer production
blocks
Transformation initiatives delivered: › Tranche 2 of the Network Asset Management System went live in
December 2017, delivering a core asset management system for the control systems, electrical assets and mechanised production activities
› Contractor management initiatives including the setting up of pre-approved panel members for wet hire and vegetation management activities. This has delivered improved safety performance and cost benefits
› A variety of initiatives in relation to electric traction which will deliver significant cost benefits through FY2019 and beyond
Wiggins Island Rail Project (WIRP) › The QCA in its UT4 Final Decision applied a revenue deferral for
WIRP customers who were not expected to rail during the UT4 period resulting in approximately $260m of WIRP capital expenditure being excluded for pricing purposes from the UT4 MAR, on an NPV neutral basis
› The UT5 Draft Decision issued by the QCA now includes approximately $235m of the WIRP capital expenditure deferred during UT4 in the UT5 RAB for pricing purposes
› Network has proposed in its response to the UT5 Draft Decision that the remaining deferred WIRP capital expenditure relating to Moura be included in the RAB for pricing purposes. This is subject to the QCA’s UT5 Final Decision
› The legal proceedings continue in relation to the notices received by Network from the WIRP customers purporting to exercise a right under their WIRP Deeds to reduce their financial exposure in respect of payment of the non-regulated component of the WIRP fee. Network maintains its position that the notices issued by the WIRP customers are invalid and the full non-regulated component of the WIRP fee is payable. Network issued proceedings in the Supreme Court of Queensland on 17 March 2016 to assert its rights in respect of the payment of the full non-regulated component of the WIRP fee. A trial is scheduled to commence in the Supreme Court of Queensland on 10 September 2018
› The Customers have initiated other disputes under their respective WIRP Deeds which will be the subject of an expert determination in November 2018. Those disputes go to various matters relating to the completion of the WIRP construction works and have the potential to impact recovery of the portion of WIRP non-regulated revenue payable. These disputes relate to the same component of WIRP revenue as the Supreme Court proceedings and should not impact recovery of the regulated access charge component of WIRP capital expenditure
› Due to the ongoing dispute, no WIRP fee revenue in respect of the non-regulated component of the WIRP fee has been recognised in FY2018
OTHEROther includes the provision of maintenance services (e.g. rail grinding) to internal and external customers and central costs not allocated such as the Board, Managing Director & CEO, Investor Relations, Strategy and Company Secretariat.
($M) FY2018 FY2017 VARIANCE %Total revenue 90.8 107.0 (15%)Operating costs (99.7) (98.7) (1%)
EBITDA (8.9) 8.3 nmDepreciation and amortisation (9.8) (10.6) 8%
EBIT (18.7) (2.3) (713%)
Performance OverviewEBIT decreased $16.4m mainly due to: › Non-recurrence of $26.4m benefit from the UT4 corporate cost
allocation true-up included in FY2017 › $16.2m reduction in other revenue predominantly due to external
construction work of $7.0m, and sale of workshop inventories of $9.0m that both took place in FY2017
This was partly offset by: › $20.9m of asset write offs and minor inventory impairments in FY2017
(nil in FY2018) › Reduction in central support costs including $7.5m of transformation
benefits
Directors’ Report (continued)OPERATING AND FINANCIAL REVIEW
For
per
sona
l use
onl
y

21OPERATING AND FINANCIAL REVIEW
INTERMODAL – DISCONTINUED OPERATIONS
($M) FY2018 FY2017 VARIANCE %Total revenue 225.4 309.8 (27%)Operating Costs (247.1) (340.7) 27%
EBITDA (21.7) (30.9) 30%Depreciation and amortisation (2.3) (17.3) 87%
EBIT (24.0) (48.2) 50%
Significant Items (74.7) (167.2) 55%
Net Finance Cost – 0.1 –
Income Tax Benefit 21.6 64.6 (67%)
NPAT (Discontinued operations)
(77.1) (150.7) 49%
Total TEUs (‘000s) 266.0 405.2 (34%)
Performance OverviewEBIT loss improved $24.2m mainly due to: › $9.2m reduction in operating losses with the closure of Intermodal
Interstate in December 2017 › $15.0m reduction in depreciation due to the Intermodal impairment
in FY2017
Significant items for the discontinued operation of ($74.7m) were recognised in FY2018 relating to the closure of Intermodal Interstate and includes: › Contract, lease and supplier exit costs › Redundancy costs for 168 employees
› Asset impairments
TRANSFORMATION UPDATE Aurizon achieved its three-year transformation target by delivering $133.6m in transformation benefits during FY2018, resulting in total transformation since July 2015 of $393.6m including Intermodal’s FY2017 losses, which principally relate to Intermodal Interstate, removed. The exit of the Intermodal business contributed to transformation by permanently removing the financial losses. The continuing operations generated $85.6m in benefits in FY2018. Further examples of transformation initiatives are detailed below:
Precision Railroading OperationsThis initiative is focused on driving precision planning and disciplined delivery with the objective to improve on time departure and arrival of above rail services across CQCN. Centred around three principles; plan with precision, disciplined delivery and continuous improvements, this initiative will be a multiyear journey that will target ways to improve on time running performance. This initiative is targeted to deliver at least $50m in financial benefits by FY2021.
Restructure of Support AreasAurizon continues its transformation agenda focusing on support areas by providing innovative, flexible and lower cost services. Commencing in 2HFY2018 and continuing into FY2019 is the restructure of the Technical Services and Planning business unit. This restructure will focus on reducing headcount, further footprint consolidation and the transfer of certain functions to the Coal and Bulk business units where appropriate. It is expected that this initiative will deliver around $20m in cost reductions by FY2021.
Rockhampton Rollingstock WorkshopThe Rockhampton Workshop closed for production on 29 June 2018 in line with the original announcement in June 2017 and reflects the staged closure of Locomotive, Brake, Wheel and Wagon Shops throughout FY2018. The successful transition of Aurizon’s heavy haul maintenance activities from in-source to outsource maintenance providers throughout Australia has been enabled through Aurizon’s investment in technologies such as condition monitoring equipment and Shopfloor II (rollingstock maintenance planning and scheduling tool) and process improvements to its in-bound supply chain and procurement processes. A small team will remain on site during the next six months to decommission the facility and site master planning is underway to determine its future use.
Asset MaintenanceA key dependency for the achievement of Aurizon’s strategy and an enabler for the Optimise and Excel strategic levers is continued investment in technology. Aurizon continues to advance its condition monitoring program. These advances allow Aurizon to automate routine maintenance inspections, predict when components will fail, thereby reducing cost and increase reliability to keep assets in productive use for longer. Developments in these key initiatives include: › Approval has now been received from ARTC for the installation of
a wayside condition monitoring (WCM) super site in the Hunter Valley. Construction has commenced and the site is expected to be operational by December 2018. The deployment will support the extension of maintenance inspection intervals for wagons in the Hunter Valley and is the foundation step in moving the NSW predictive maintenance capability in line with CQCN
› iTrigger technology – has been deployed across two terminals in the CQCN. This technology is part of the suite of predictive maintenance initiatives and identifies the lead indicator of door faults in wagons which contributes to around 14% of cancellations by wagons in the CQCN
› Treadview technology - this provides a full 3D model of a wheel profile and will be deployed across the WCM supersites in Blackwater and Goonyella during FY2019. This technology will fundamentally change the way Aurizon manages wheel health by examining the entire surface of the wheel rather than just its profile, and is an enabler for the extension of rollingstock reliability examinations from 42 to 84 days
› On train repair facilities are now in place across the CQCN and Hexham in the Hunter Valley. This allows key maintenance activities on wagons (e.g. wheel change outs) to be performed without breaking trains, requiring spare rollingstock or shunting of consists
For
per
sona
l use
onl
y

AURIZON ANNUAL REPORT 2017–1822
Asset Maintenance (continued) › The Locomotive and Operational Data
Acquisition and Management project (LODAM) is now being initiated across the coal locomotive fleet. LODAM will deliver a step change in both the quality and quantity of operational and sensor data, allowing Aurizon to better optimise and standardise how the fleet is operated and managed. LODAM will provide real time visibility of train handling and equipment performance, improved fleet performance, reliability and energy consumption and in cab monitoring. LODAM sensor data will allow locomotive failures to be predicted earlier and further improve our maintenance strategies
› Shopfloor II is now fully deployed across all rollingstock maintenance facilities. The project was completed ahead of time and under budget. The key benefits to be delivered as part of this project include increased maintenance planning capability and accuracy, supply chain integration, warranty management, serialisation and lifecycle management of major components and improved operational efficiency through standardising business processes and metrics
ADDITIONAL INFORMATION
Risk Aurizon promotes a risk-aware culture with an emphasis on frontline accountability for effective risk management. The consideration of risk features heavily in Aurizon’s thinking, from the framing of strategy through to informing decision making. Aurizon’s Enterprise Risk Management Framework is based on the international standard for risk management (AS/NZS ISO 31000:2009) and supports the identification, assessment and reporting of risk across the business, and includes both financial and non-financial risks.
Risks to the delivery of strategy have been categorised into the three strategic levers of Optimise (accelerate the competitiveness of Aurizon), Excel (achieve regulatory reform, secure contract wins, and gain competitive advantage through asset efficiency) and Extend (position Aurizon for growth, value creation and the next phase of Enterprise evolution).
Optimise Strategic LeverQueensland Intermodal and Acacia Ridge Terminal Sale TransactionsThe ACCC has opposed the sale of Aurizon’s Queensland Intermodal business to a consortium of Linfox and Pacific National, and the sale of its Acacia Ridge Terminal to Pacific National and commenced proceedings against Pacific National and Aurizon in the Federal Court of Australia. The ACCC has sought declarations, pecuniary penalties, orders restraining the existing sale transactions from proceeding and costs. The ACCC has also sought an injunction to prevent Aurizon from closing its Queensland Intermodal business while proceedings are on foot. While Aurizon refutes the ACCC’s allegations and will defend the proceedings, including seeking clearance of the Acacia Ridge transaction, there is a risk that the Acacia Ridge transaction will be prevented from completing and/or Aurizon incurs orders for pecuniary penalties and costs. There is also the risk that, in the interim whilst the matter is being determined by the Court, Aurizon is injuncted from closing the Queensland Intermodal business.
Delivery of Optimise Initiatives Aurizon maintains a pipeline of transformation initiatives that are expected to deliver a cost effective and customer aligned model. Continued focus is required on these initiatives to ensure benefits are delivered as planned and flow through to improved financial performance.
Operational AgilityA lack of operational agility would result in Aurizon’s inability to flex operations and support an alignment between costs and revenue. If operational agility is not achieved it may result in missed revenue during market upturns due to a lag in accessing the required resources, or static costs during downturns eroding financial performance.
Enterprise Agreement RenegotiationsEnterprise Agreement renegotiations are underway to support sustainable business transformation. There are risks that prolonged industrial action impacts Aurizon’s critical operations or final agreements do not support business objectives.
Business InterruptionAurizon may experience business interruption and consequential financial impact from a range of circumstances including but not limited to: › Road Vehicle Fatality - death or injuries to
our people from operating road vehicles › Process Safety Fatality - major process safety
event leading to fatality or loss of licence to operate
› Adverse weather events and climate change which could impact on Aurizon’s operations, assets, customers and employees
› Cyber security incidents in relation to Aurizon’s corporate and operational systems
Excel Strategic LeverRegulatory Risk of the Access Undertaking (UT5)Aurizon continues to work with the Queensland Competition Authority (QCA) and industry stakeholders to secure acceptable and sustainable regulatory outcomes for the CQCN in accordance with the processes set out in the Queensland Competition Authority Act 1997 (Qld). In particular, Network’s Maximum Allowable Revenue (MAR) and the nominal (vanilla) WACC used in deriving Network’s MAR is typically reset every four years as part of the access undertaking approval process with the QCA and the reference tariffs are reset annually based on projected system volumes and other variables. Not attaining appropriate pricing and policy regulatory settings will adversely impact revenue, and may have an adverse effect on operational flexibility, capital investment and recovery of operational and administrative costs. The WACC of 5.41% proposed by the QCA in its UT5 Draft Decision, together with the proposed UT5 maintenance and operational expenditure allowances, if reflected in its Final Decision, will not adequately compensate Network for its regulatory and commercial risks, which will lead to a material adverse impact on the Network business, operational performance and financial results.
Directors’ Report (continued)OPERATING AND FINANCIAL REVIEW
For
per
sona
l use
onl
y
OPERATING AND FINANCIAL REVIEW 23
Further risks arising from UT5 include:
› The network business’s immediate response to implementing the Draft UT5 determination may materially impact above rail volumes and EBIT plus damage relationships with key stakeholders which may impact future contracts, transformation and reform
› The network business credit rating may be downgraded due to insufficient cashflows based on the Draft UT5 determination
› The network business may be unable to achieve regulatory reform beyond UT5, impacting future company performance
› The network business unsuccessfully adopts a new operating model and the final ruling is unchanged from the draft
General Regulatory RiskAurizon’s operations and financial performance are subject to legislative and regulatory oversight. Unfavourable changes may be experienced with respect to access regimes, safety accreditation, taxation, carbon reduction, environmental and industrial (including occupational health and safety) regulation, government policy, and approval processes. These changes may have a material adverse impact on project investment, Aurizon’s profitability and business in general, as well as Aurizon’s customers.
Aurizon is also exposed to the risk of material regulatory breaches resulting in the loss of operating licences and financial penalties. In the event of a loss of licence, critical business operations may not be supplied to customers, impacting profitability and reputation.
Regulatory approval is a prerequisite to support the Extend strategy, including growth opportunities with adjacent assets. In the event regulatory approval is not forthcoming, Aurizon’s ability to deliver the strategy and associated value will be limited.
Competition in Current MarketsAurizon may face competition from parties willing to compete at reduced margins and/or accept lower returns and greater risk positions than Aurizon. This may potentially negatively impact Aurizon’s competitiveness. Aurizon’s most significant customer contracts are secured on long-dated terms, however failure to win or retain customer contracts at commercial rates will always be a risk to future financial performance. Increased competition may be experienced from new entrants to Aurizon’s core markets in both above and below rail, and includes existing customers in-sourcing Aurizon’s services.
Adverse Basin, Corridor Economics and General Economic ConditionsAurizon’s earnings are concentrated in commodity markets across a relatively small number of customers and may be impacted by deterioration in counterparty credit quality, mine sale to a lower tier party, mine profitability, contract renewals, supply chain disruptions and /or macro-industry issues.
Aurizon’s customers in core and adjacent markets are reliant on demand from large export markets such as China, India, Japan and South Korea. Increased volatility in coal and bulk commodity markets due to factors such as material change in government policies or economic slowdown or the increasing use of renewable energy may cause fluctuations in demand, which in turn impact commodity prices, product volume and investment in growth projects. Although Aurizon develops its own long-term outlook for seaborne coal demand, it also considers the best known and most widely used Sustainable Development Scenario produced by the International Energy Agency (IEA) through the annual release of the World Energy Outlook (WEO). Whilst long term demand is expected to increase, there may be variances in volumes, contract profitability and growth that impact on Aurizon’s financial results.
Extend Strategic LeverCompetition in New MarketsExtending expertise into adjacent activities including strategic partnerships with road operators, new target basins, and optimisation of the supply chain may not deliver the expected benefits. Competition from incumbents in these markets has the potential to reduce the expected returns as they respond to a new entrant. In addition, market dynamics may change and reduce the attractiveness of these activities prior or during the extension period.
WIRP Non-Regulated Revenue Dispute Aurizon has received notices from WIRP customers purporting to exercise a right under the WIRP Deed to reduce their financial exposure in respect of the non-regulated revenue component of the amounts payable by them to Network. Network maintains its position that the notices issued by WIRP customers in relation to the WIRP fee are not valid. Aurizon issued proceedings in the Supreme Court of Queensland to assert its contractual rights under the Project Deeds. The proceedings have been admitted to the Commercial List of the Supreme Court of Queensland and have been set down for a 10-day hearing commencing in FY2019. The Court has made orders to prepare the matter for trial. The risk is that the entire amount of the WIRP fee is deemed not payable by the WIRP customers.
Inability to Delivery AdjacenciesThe strategy of leveraging expertise to adjacent assets and activities may not be delivered as planned due to:
› The infrequency of investment opportunities — only a limited number of assets are adjacent to the existing Aurizon markets, and they may not be made available for sale
› Aurizon’s potential inability to construct a deal – many factors such as access to capital markets, agreement with consortium or joint venture partners, or other legal restrictions may prohibit the execution of an acceptable transaction
› Competitor valuations – available adjacencies are infrastructure assets which are currently in demand from institutional funds. These funds or other competitors may pay a higher price than Aurizon, resulting in limited opportunities for growth
For
per
sona
l use
onl
y

AURIZON ANNUAL REPORT 2017–1824
Climate Change Risk
The long term implications of climate change may impact Aurizon on several fronts. For example:
› Demand for thermal coal is subject to energy policy and regulation of Green House Gas (GHG) emissions (including carbon pricing)
› Investor concern over climate related risks may impact the ability to access capital for Aurizon and its customers for funding coal mining, transport and coal fired power projects
› Carbon liability under the Safeguard Mechanism Rule and potential penalties for inappropriate carbon reporting under the National Greenhouse and Energy Reporting (NGER) Act
› Current and future disruption arising from increased severity and/or frequency of extreme weather events (higher temperatures, strong winds, flooding and associated erosion, bushfires and others)
Climate change risks and opportunities are disclosed annually in our submission to the CDP and in Aurizon’s sustainability report.
Sustainability Aurizon’s Sustainability Report details how Aurizon takes account of social, environmental and economic considerations related to its operations. In October 2017, Aurizon released its fourth Sustainability Report. This report contributed to Aurizon maintaining a Leading rating by the Australian Council of Superannuation Investors (ACSI) in June 2018. This was the fourth consecutive year of recognition and resulted in Aurizon being one of 35 ASX200 companies being considered a Leader by ACSI.
This year will be the second reporting period in which we have incorporated recommendations from the Financial Stability Board’s (FSB) Final Report: Recommendation of the Task Force on Climate-related Financial Disclosures (TCFD), released in June 2017. Aurizon acknowledges that climate change is affecting a wide range of industries around the world, resulting in financial implications. Transition risks, related to energy policy, regulation, technology and market shifts (that are necessary to achieve the transition to a low-carbon economy) will affect the demand for the commodities that Aurizon hauls. Physical risks related to extreme weather events will also continue to affect Aurizon through supply chain disruptions.
Aurizon’s 2018 Sustainability Report will be published in October 2018.
A brief summary of Aurizon’s performance in connection with safety, environment and people is outlined below.
Safety As reported in 1HFY2018 results, Aurizon’s commitment to safety is continuing with the company introducing a revised set of injury definitions on 1 July 2017. The key changes were the inclusion of contractors in all injury metrics and widening the scope of total recordable injuries to include all restricted work injuries. Previously, Aurizon had used a set of metrics and injury definitions benchmarked against the rail industry. These new definitions have been benchmarked against a broader set of global transport and resource organisations, including many of Aurizon’s customers.
FY2018 saw a deterioration in performance in the early part of the financial year, which was disappointing but a focus on newly identified areas for improvement has seen positive changes towards the latter part of FY2018, resulting in a Total Recordable Injury Frequency Rate (TRIFR) for FY2018 of 10.02, a reduction of 3% against the 1HFY2018 result. However, the full year performance was still a deterioration against FY2017 which was 7.12.
Changing injury definitions is the first step in a broader program that is underway to create a learning safety culture. This journey will require an underlying shift in beliefs from a control orientated environment towards interdependence and self-sustaining behaviours. To make this shift a program of work is being developed that will focus on:
› development of leadership behaviours and capabilities for our frontline leaders
› updating systems, processes, governance and tools to better support frontline operations
› clarification of accountabilities for operational and support roles
Environment Aurizon delivers environmental value through effective management of material environmental risks and improved enterprise environmental performance. In recognition of our efforts, in November 2017 Aurizon received the results for its 2017 CDP (formally carbon disclosure project) submission which confirmed that Aurizon had retained a Management B score. This reflects Aurizon’s ongoing efforts to improve visibility and transparency on issues relating to climate change.
Aurizon has continued progress against its Board endorsed locomotive greenhouse gas (GHG) emissions intensity target, achieving in FY2018 a 7% emissions intensity reduction compared with FY2015. This represents a 1% improvement on performance when compared with FY2017 which was hampered by challenges associated with severe weather events and above average mean temperatures.
In November 2017, the Rail Safety and Standards Board approved and published a Code of Practice (COP) on the Management of Locomotive Exhaust Emissions. This COP was developed by Australian rail freight operators (including Aurizon) as an industry led approach to improving locomotive diesel emissions. This industry led approach prioritises both particulate matter and greenhouse gas emissions, while being careful not to decrease fuel efficiency in pursuit of nitrogen oxide reductions (which was highlighted as a potentially negative impact by a locomotive upgrade trial undertaken by the New South Wales Environmental Protection Authority in 2015). The COP will form part of Aurizon’s continuing efforts to improving air quality which also includes reducing diesel consumption, using cleaner diesel, operating electric locomotives and promoting rail over road freight.
In June 2018, Aurizon had two notifiable environmental incidents involving the spillage of hydrocarbons. The remediation of the two incidents is underway and is expected to be completed, with no long term environmental impact, during 1QFY2019.
People At Aurizon our values (Safety, People, Integrity, Customer and Excellence) guide our people’s work in delivering bulk commodities to the world. Our areas of focus to develop the capability of our people include:
› continuing to make Aurizon a more inclusive and diverse workplace, where everyone can work to their full potential
› improving our people, processes and systems (performance and succession) to achieve exceptional performance and build capability
› continuing to increase our employee presence through regional Australia
Directors’ Report (continued)OPERATING AND FINANCIAL REVIEW
For
per
sona
l use
onl
y

25REMUNERATION REPORT
Directors’ Report (continued)REMUNERATION REPORT
Dear Fellow Shareholders,
On behalf of the Board, we are pleased to present Aurizon’s Financial Year (FY) 2018 Remuneration Report.
Aurizon’s financial performance for FY2018 has been solid. Underlying Earnings Before Interest and Tax (EBIT) for continuing operations increased 6% to $941m, within the guidance range of $900-$960m. The transformation program continued to deliver benefits and the company achieved the three-year transformation target of $380 million (including the removal of Intermodal losses, which principally relate to Intermodal Interstate).
The Company reported safety outcomes, under the revised metrics, saw disappointing results in safety performance over the year. Changing injury definitions was the first step in a broader program of work in safety that is being implemented to renew the Company’s focus on safety. The Board will take an active interest in monitoring outcomes and were pleased to see improvements emerging in the second half.
Performance outcomes for the FY2018 Short Term Incentive have been mixed. Above Target performance was achieved for Underlying EBIT and Enterprise Transformation Program however Safety performance was below Threshold. The Board has determined that an overall outcome above Target will be awarded.
During FY2018, the 2015 Long Term Incentive (LTI) Award and unvested 2014 LTI Award were subject to testing however Aurizon’s performance resulted in no components of these Awards vesting. Under the terms of the 2015 Award, the Board may decide to extend the performance period for one year, with the retest being at higher hurdles. The Board will consider this matter in FY2019.
The Board considers that these remuneration outcomes strike an appropriate balance between reflecting shareholder outcomes and recognising the value-adding contribution of the new Leadership team.
The Board commends Andrew, the Executive Committee and all Aurizon employees on their achievements in the ongoing transformation of Aurizon. Reaching the three-year savings target is not the end of the transformation journey, rather, it is the foundation for Aurizon’s strategy of continuing to optimise, excel and extend the business.
The Board is committed to ensuring the remuneration framework supports the strategic objectives of the Company whilst rewarding and retaining Executives and delivering shareholder returns. In FY2018 the remuneration framework changes foreshadowed last year were implemented including a greater proportion of the LTIA weighted towards relative TSR and the performance period extended to four years. As disclosed last year, the Total Fixed Remuneration of new Executive KMP appointments was reduced compared to predecessors and more weighting was given to the Long Term Incentive component of their packages, as appropriate for a long asset life infrastructure business.
We will continue to review the Executive remuneration framework in FY2019 to ensure it remains effective in driving the required performance.
A market review of the Non-Executive Director remuneration framework resulted in changes to the reward structure – the first since 2012. The Chairman’s fee was increased marginally and the remaining Non-Executive Directors transitioned from an ‘all-in-one’ to a ‘base plus committee’ fee structure effective from 1 January 2018.
As always, we are grateful for your ongoing support and we value your feedback. We look forward to welcoming you to our 2018 Annual General Meeting.
Yours faithfully,
Tim Poole Russell Caplan Chairman Chairman, Remuneration and Human Resources Committee F
or p
erso
nal u
se o
nly
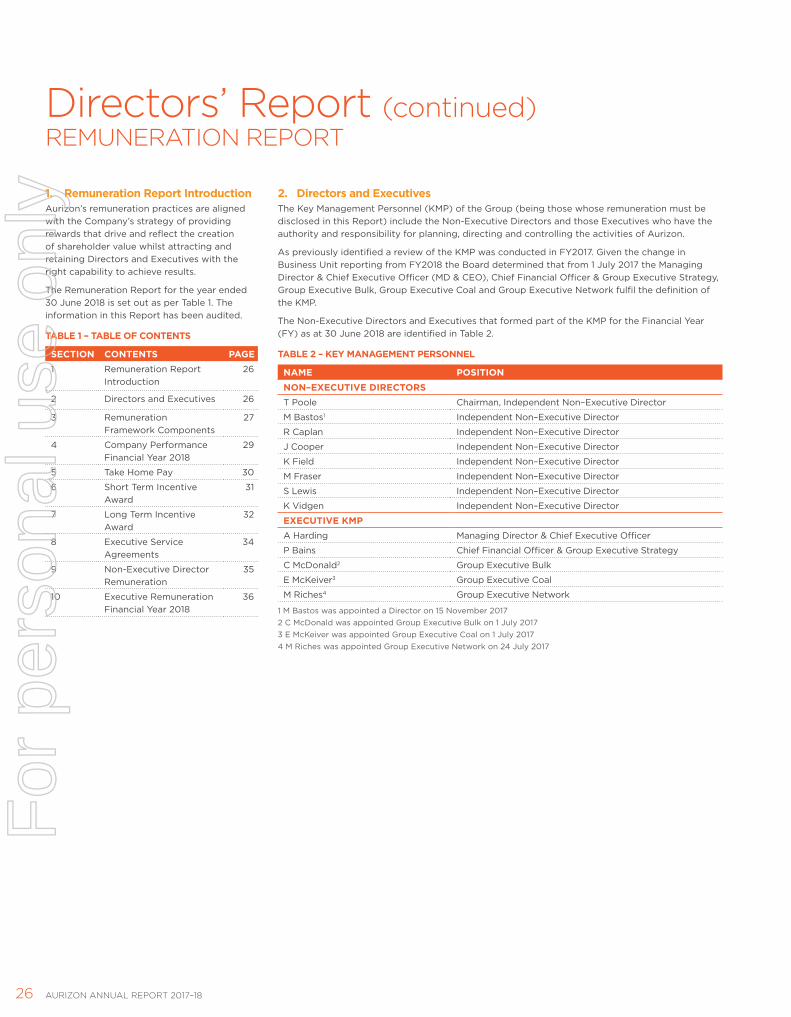
AURIZON ANNUAL REPORT 2017–1826
Directors’ Report (continued)REMUNERATION REPORT
1. Remuneration Report IntroductionAurizon’s remuneration practices are aligned with the Company’s strategy of providing rewards that drive and reflect the creation of shareholder value whilst attracting and retaining Directors and Executives with the right capability to achieve results.
The Remuneration Report for the year ended 30 June 2018 is set out as per Table 1. The information in this Report has been audited.
TABLE 1 – TABLE OF CONTENTS
SECTION CONTENTS PAGE1 Remuneration Report
Introduction26
2 Directors and Executives 26
3 Remuneration Framework Components
27
4 Company Performance Financial Year 2018
29
5 Take Home Pay 30
6 Short Term Incentive Award
31
7 Long Term Incentive Award
32
8 Executive Service Agreements
34
9 Non-Executive Director Remuneration
35
10 Executive Remuneration Financial Year 2018
36
2. Directors and ExecutivesThe Key Management Personnel (KMP) of the Group (being those whose remuneration must be disclosed in this Report) include the Non-Executive Directors and those Executives who have the authority and responsibility for planning, directing and controlling the activities of Aurizon.
As previously identified a review of the KMP was conducted in FY2017. Given the change in Business Unit reporting from FY2018 the Board determined that from 1 July 2017 the Managing Director & Chief Executive Officer (MD & CEO), Chief Financial Officer & Group Executive Strategy, Group Executive Bulk, Group Executive Coal and Group Executive Network fulfil the definition of the KMP.
The Non-Executive Directors and Executives that formed part of the KMP for the Financial Year (FY) as at 30 June 2018 are identified in Table 2.
TABLE 2 – KEY MANAGEMENT PERSONNEL
NAME POSITIONNON–EXECUTIVE DIRECTORST Poole Chairman, Independent Non–Executive Director
M Bastos1 Independent Non–Executive Director
R Caplan Independent Non–Executive Director
J Cooper Independent Non–Executive Director
K Field Independent Non–Executive Director
M Fraser Independent Non–Executive Director
S Lewis Independent Non–Executive Director
K Vidgen Independent Non–Executive Director
EXECUTIVE KMPA Harding Managing Director & Chief Executive Officer
P Bains Chief Financial Officer & Group Executive Strategy
C McDonald2 Group Executive Bulk
E McKeiver3 Group Executive Coal
M Riches4 Group Executive Network
1 M Bastos was appointed a Director on 15 November 20172 C McDonald was appointed Group Executive Bulk on 1 July 20173 E McKeiver was appointed Group Executive Coal on 1 July 20174 M Riches was appointed Group Executive Network on 24 July 2017
For
per
sona
l use
onl
y
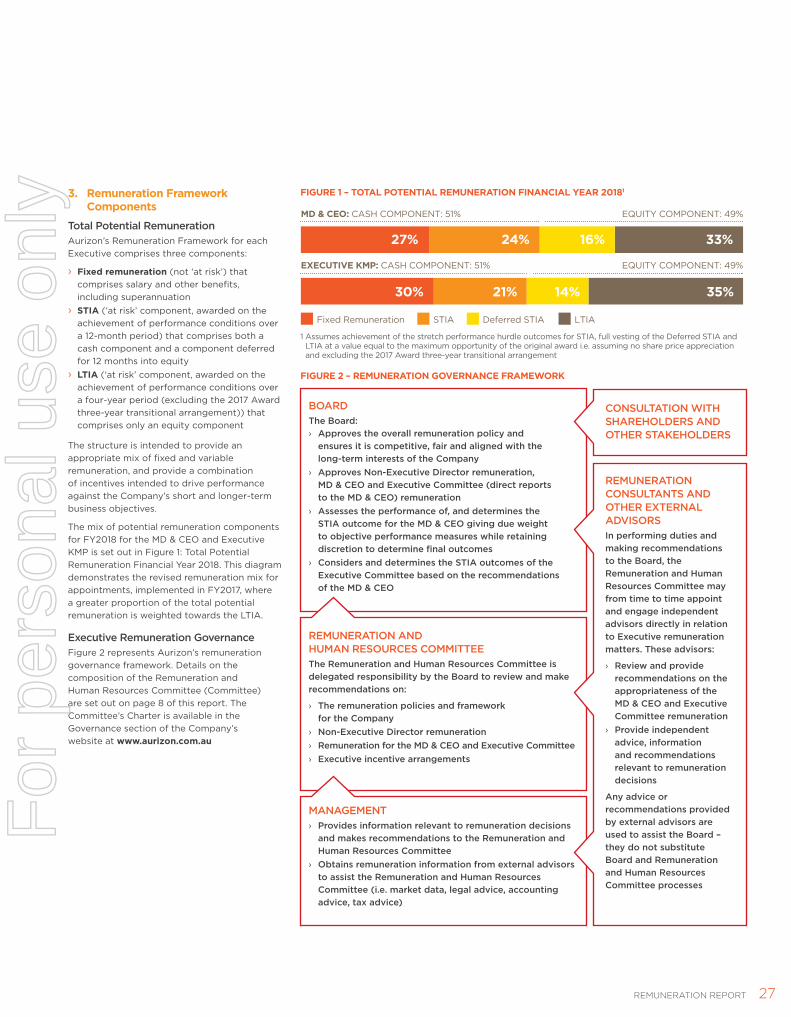
27REMUNERATION REPORT
3. Remuneration Framework Components
Total Potential Remuneration Aurizon’s Remuneration Framework for each Executive comprises three components:
› Fixed remuneration (not ‘at risk’) that comprises salary and other benefits, including superannuation
› STIA (‘at risk’ component, awarded on the achievement of performance conditions over a 12-month period) that comprises both a cash component and a component deferred for 12 months into equity
› LTIA (‘at risk’ component, awarded on the achievement of performance conditions over a four-year period (excluding the 2017 Award three-year transitional arrangement)) that comprises only an equity component
The structure is intended to provide an appropriate mix of fixed and variable remuneration, and provide a combination of incentives intended to drive performance against the Company’s short and longer-term business objectives.
The mix of potential remuneration components for FY2018 for the MD & CEO and Executive KMP is set out in Figure 1: Total Potential Remuneration Financial Year 2018. This diagram demonstrates the revised remuneration mix for appointments, implemented in FY2017, where a greater proportion of the total potential remuneration is weighted towards the LTIA.
Executive Remuneration GovernanceFigure 2 represents Aurizon’s remuneration governance framework. Details on the composition of the Remuneration and Human Resources Committee (Committee) are set out on page 8 of this report. The Committee’s Charter is available in the Governance section of the Company’s website at www.aurizon.com.au
BOARDThe Board: › Approves the overall remuneration policy and
ensures it is competitive, fair and aligned with the long-term interests of the Company
› Approves Non-Executive Director remuneration, MD & CEO and Executive Committee (direct reports to the MD & CEO) remuneration
› Assesses the performance of, and determines the STIA outcome for the MD & CEO giving due weight to objective performance measures while retaining discretion to determine final outcomes
› Considers and determines the STIA outcomes of the Executive Committee based on the recommendations of the MD & CEO
FIGURE 1 – TOTAL POTENTIAL REMUNERATION FINANCIAL YEAR 20181
MD & CEO: CASH COMPONENT: 51% EQUITY COMPONENT: 49%
EXECUTIVE KMP: CASH COMPONENT: 51% EQUITY COMPONENT: 49%
27% 24% 16% 33%
30% 21% 14% 35%
Fixed Remuneration STIA Deferred STIA LTIA
1 Assumes achievement of the stretch performance hurdle outcomes for STIA, full vesting of the Deferred STIA and LTIA at a value equal to the maximum opportunity of the original award i.e. assuming no share price appreciation and excluding the 2017 Award three-year transitional arrangement
FIGURE 2 – REMUNERATION GOVERNANCE FRAMEWORK
REMUNERATION AND HUMAN RESOURCES COMMITTEEThe Remuneration and Human Resources Committee is delegated responsibility by the Board to review and make recommendations on:
› The remuneration policies and framework for the Company
› Non-Executive Director remuneration › Remuneration for the MD & CEO and Executive Committee › Executive incentive arrangements
MANAGEMENT › Provides information relevant to remuneration decisions
and makes recommendations to the Remuneration and Human Resources Committee
› Obtains remuneration information from external advisors to assist the Remuneration and Human Resources Committee (i.e. market data, legal advice, accounting advice, tax advice)
REMUNERATION CONSULTANTS AND OTHER EXTERNAL ADVISORSIn performing duties and making recommendations to the Board, the Remuneration and Human Resources Committee may from time to time appoint and engage independent advisors directly in relation to Executive remuneration matters. These advisors:
› Review and provide recommendations on the appropriateness of the MD & CEO and Executive Committee remuneration
› Provide independent advice, information and recommendations relevant to remuneration decisions
Any advice or recommendations provided by external advisors are used to assist the Board – they do not substitute Board and Remuneration and Human Resources Committee processes
CONSULTATION WITH SHAREHOLDERS AND OTHER STAKEHOLDERS
For
per
sona
l use
onl
y
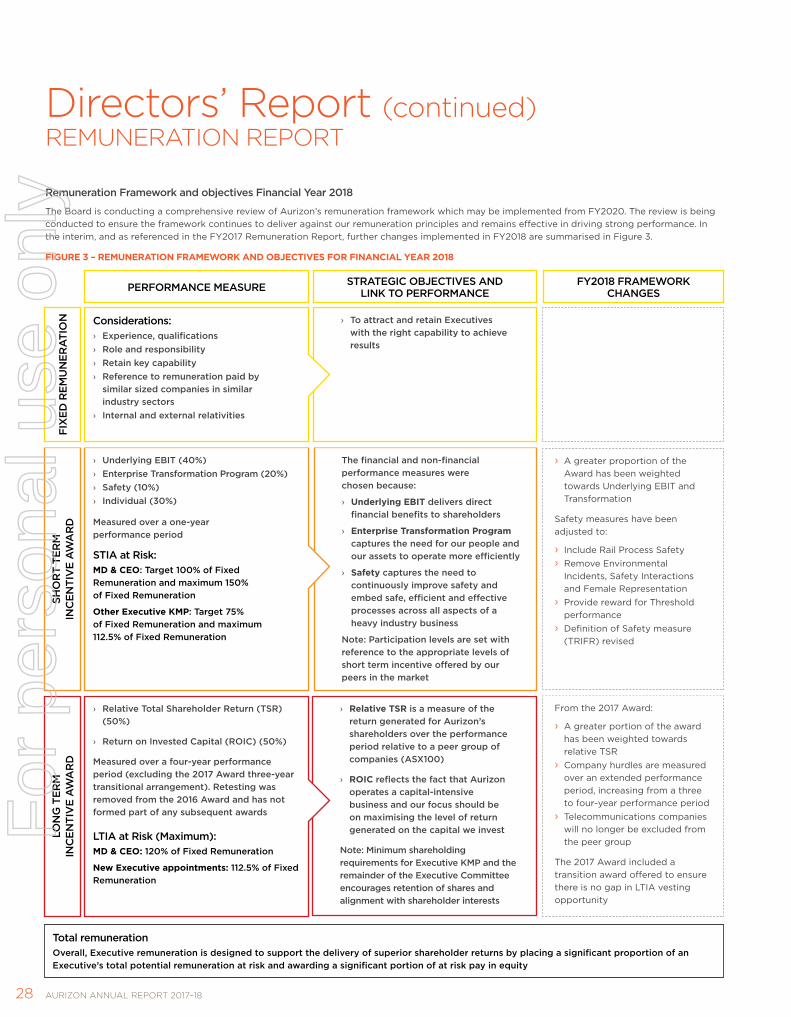
AURIZON ANNUAL REPORT 2017–1828
Remuneration Framework and objectives Financial Year 2018
The Board is conducting a comprehensive review of Aurizon’s remuneration framework which may be implemented from FY2020. The review is being conducted to ensure the framework continues to deliver against our remuneration principles and remains effective in driving strong performance. In the interim, and as referenced in the FY2017 Remuneration Report, further changes implemented in FY2018 are summarised in Figure 3.
FIGURE 3 – REMUNERATION FRAMEWORK AND OBJECTIVES FOR FINANCIAL YEAR 2018
Directors’ Report (continued)REMUNERATION REPORT
› To attract and retain Executives with the right capability to achieve results
The financial and non-financial performance measures were chosen because:
› Underlying EBIT delivers direct financial benefits to shareholders
› Enterprise Transformation Program captures the need for our people and our assets to operate more efficiently
› Safety captures the need to continuously improve safety and embed safe, efficient and effective processes across all aspects of a heavy industry business
Note: Participation levels are set with reference to the appropriate levels of short term incentive offered by our peers in the market
› Relative TSR is a measure of the return generated for Aurizon’s shareholders over the performance period relative to a peer group of companies (ASX100)
› ROIC reflects the fact that Aurizon operates a capital-intensive business and our focus should be on maximising the level of return generated on the capital we invest
Note: Minimum shareholding requirements for Executive KMP and the remainder of the Executive Committee encourages retention of shares and alignment with shareholder interests
› A greater proportion of the Award has been weighted towards Underlying EBIT and Transformation
Safety measures have been adjusted to:
› Include Rail Process Safety › Remove Environmental
Incidents, Safety Interactions and Female Representation
› Provide reward for Threshold performance
› Definition of Safety measure (TRIFR) revised
From the 2017 Award:
› A greater portion of the award has been weighted towards relative TSR
› Company hurdles are measured over an extended performance period, increasing from a three to four-year performance period
› Telecommunications companies will no longer be excluded from the peer group
The 2017 Award included a transition award offered to ensure there is no gap in LTIA vesting opportunity
STRATEGIC OBJECTIVES AND LINK TO PERFORMANCE
FY2018 FRAMEWORK CHANGES
LON
G T
ERM
IN
CEN
TIV
E A
WA
RD
Total remuneration Overall, Executive remuneration is designed to support the delivery of superior shareholder returns by placing a significant proportion of an Executive’s total potential remuneration at risk and awarding a significant portion of at risk pay in equity
PERFORMANCE MEASURE
Considerations: › Experience, qualifications › Role and responsibility › Retain key capability › Reference to remuneration paid by
similar sized companies in similar industry sectors
› Internal and external relativities
› Relative Total Shareholder Return (TSR) (50%)
› Return on Invested Capital (ROIC) (50%)
Measured over a four-year performance period (excluding the 2017 Award three-year transitional arrangement). Retesting was removed from the 2016 Award and has not formed part of any subsequent awards
LTIA at Risk (Maximum):MD & CEO: 120% of Fixed Remuneration
New Executive appointments: 112.5% of Fixed Remuneration
FIX
ED R
EMU
NER
ATI
ON
SHO
RT
TER
M
INC
ENTI
VE
AW
AR
D
› Underlying EBIT (40%) › Enterprise Transformation Program (20%) › Safety (10%) › Individual (30%)
Measured over a one-year performance period
STIA at Risk:MD & CEO: Target 100% of Fixed Remuneration and maximum 150% of Fixed Remuneration
Other Executive KMP: Target 75% of Fixed Remuneration and maximum 112.5% of Fixed Remuneration
For
per
sona
l use
onl
y
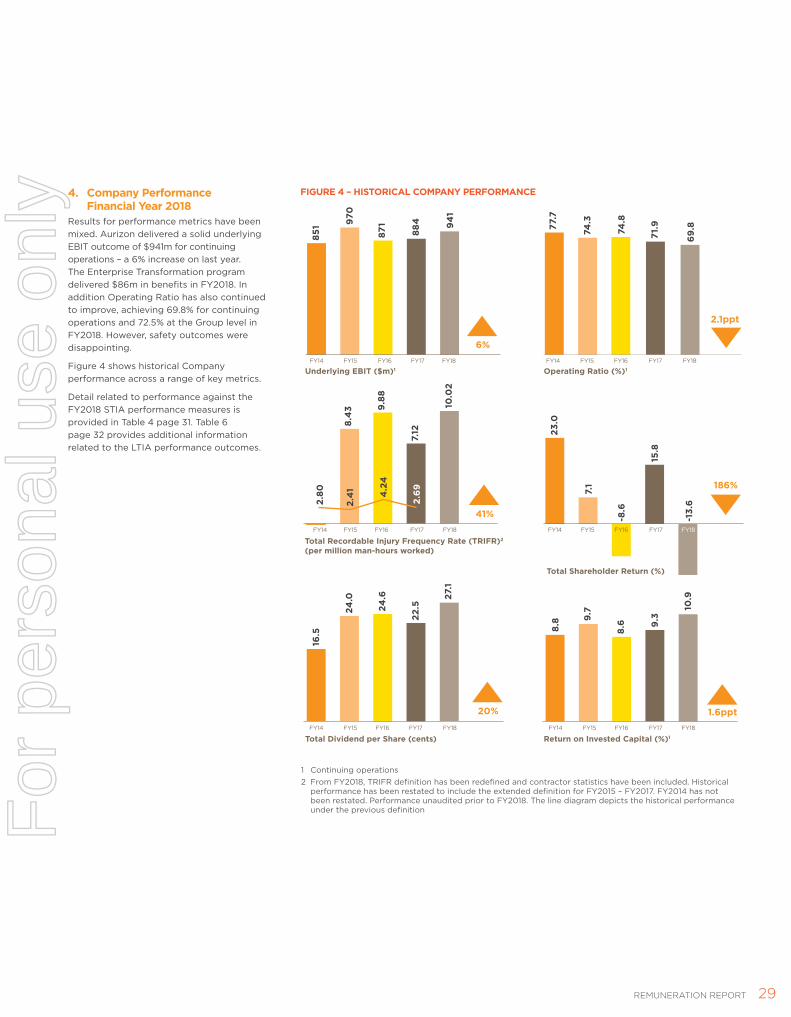
29REMUNERATION REPORT
FIGURE 4 – HISTORICAL COMPANY PERFORMANCE4. Company Performance Financial Year 2018
Results for performance metrics have been mixed. Aurizon delivered a solid underlying EBIT outcome of $941m for continuing operations – a 6% increase on last year. The Enterprise Transformation program delivered $86m in benefits in FY2018. In addition Operating Ratio has also continued to improve, achieving 69.8% for continuing operations and 72.5% at the Group level in FY2018. However, safety outcomes were disappointing.
Figure 4 shows historical Company performance across a range of key metrics.
Detail related to performance against the FY2018 STIA performance measures is provided in Table 4 page 31. Table 6 page 32 provides additional information related to the LTIA performance outcomes.
1 Continuing operations2 From FY2018, TRIFR definition has been redefined and contractor statistics have been included. Historical
performance has been restated to include the extended definition for FY2015 – FY2017. FY2014 has not been restated. Performance unaudited prior to FY2018. The line diagram depicts the historical performance under the previous definition
1.6ppt
Underlying EBIT ($m)1
FY14 FY16 FY17 FY18FY14 FY16 FY17 FY18 FY15FY15
Operating Ratio (%)1
8.8 9.
7
8.6 9.
3
10.9
Return on Invested Capital (%)1
16.5
24.6
22.5
27.1
24.0
Total Dividend per Share (cents)
20%
FY14 FY16 FY18FY17FY15
8.4
3
2.80
2.694.2
4
2.4
1
7.12
9.88
10.0
2
Total Recordable Injury Frequency Rate (TRIFR)2 (per million man-hours worked)
41%
FY14 FY16FY15 FY18FY17
77.7
74.3
74.8
71.9
69.8
2.1ppt
FY14 FY15FY17
23.0
-8.6
-13.
6
15.8
7.1
Total Shareholder Return (%)
186%
94
1
851 97
0
871
884
FY14 FY16 FY17 FY18FY15
6%
FY16 FY17 FY18
For
per
sona
l use
onl
y

AURIZON ANNUAL REPORT 2017–1830
Directors’ Report (continued)REMUNERATION REPORT
5. Take Home Pay Table 3 identifies the actual remuneration earned during FY2018 for Executive KMP.
The table has not been prepared in accordance with accounting standards but has been provided to ensure shareholders are able to clearly understand the remuneration outcomes for Executive KMP. Remuneration outcomes, which are prepared in accordance with the accounting standards, are provided in Section 10 page 36.
The remuneration outcomes identified in Table 3 are directly linked to the Company performance described in Section 6 page 31 and Section 7 page 32.
The actual STIA is dependent on Aurizon and individual performance as described in Section 6. Mixed performance across our key measures is also reflected directly in the payments for our Executive KMP, which range from 79% to 85% of their potential maximum.
The actual vesting of the LTIA is dependent on Aurizon’s performance and the outcomes are further described in Section 7.
During FY2018, the 2015 Award and unvested 2014 Award were subject to testing. However, Aurizon’s performance resulted in no components of these Awards vesting.
TABLE 3 – REMUNERATION EARNED IN FINANCIAL YEAR 2018
NAME
FIXED REMUNERATION
$’000
NON-MONETARY BENEFITS1
$’000
STIA CASH2 $’000
STIA DEFERRED FROM
PRIOR YEAR3 $’000
LTIA VESTING4
$’000
SHARE PRICE DEPRECIATION5
$’000
ACTUAL FY2018 REMUNERATION
OUTCOMES $’000EXECUTIVE KMPA Harding 1,700 109 1,257 211 – (29) 3,248
P Bains 700 2 389 102 – (14) 1,179
C McDonald 600 58 344 64 – (9) 1,057
E McKeiver 640 69 352 – – – 1,061
M Riches6 632 12 339 – – – 983
1 The amount relates to travel benefits and relocation assistance 2 The amount relates to the cash component (60%) of the FY2018 STIA which will be paid in September 20183 The amount relates to the deferred component (40%) of the FY2017 STIA which was awarded in performance rights and will become unrestricted in September 2018
(calculation assumes a share price of $5.01)4 The amount is the number of rights which would have vested in August 2018. As the performance hurdles were not met no rights vested5 The amount is the number of rights which vest in September 2018 multiplied by the decrease in the Aurizon share price over the period ended 30 June 2018
(calculation assumes share price depreciation of $0.68) 6 Pro-rata outcomes apply for Executives who were appointed after the performance year commenced (1 July 2017)
For
per
sona
l use
onl
y

31REMUNERATION REPORT
6. Short Term Incentive Award
What is the STIA and who participates? The STIA is ‘at risk’ remuneration subject to the achievement of pre-defined Company and individual performance hurdles which are set annually by the Board at the beginning of the performance period. For each component of the STIA, three performance levels are set:
› Threshold, below which no STIA is paid for that component
› Target, which typically aligns to relevant corporate plans and budgets, a business improvement targeted outcome or reflects an improvement on historical achievement
› Stretch, which is materially better than Target
The STIA applies in a similar manner to all non-enterprise agreement employees.
For the MD & CEO, Executive KMP and the remaining Executive Committee (direct reports to the MD & CEO) a portion (40%) will be deferred into equity for a period of 12 months, subject to the Board’s ability to claw-back.
What are the Company performance measures? The performance measures which apply to all participants are Underlying EBIT, Enterprise Transformation and Safety. The measures capture the need to continuously improve safety across all aspects of the business, strengthen and grow our current business whilst continuing to transform the Enterprise. This is achieved through a focus on people and asset efficiencies whilst at the same time, delivering benefits to shareholders. Individual performance hurdles relate to each specific role and measure an individual’s contribution.
What is the amount that participants can earn through an STIA? The employment agreements specify a target STIA, expressed as a percentage of Fixed Remuneration (100% for the MD & CEO and 75% for the remaining Executive KMP). Each participant can earn between 0% up to a maximum of 150% of this target percentage, depending on performance and subject to Board discretion. Depending on performance assessed at year end, participants may earn for each enterprise measure: 0% for performance below Threshold, 50% at Threshold (for measures other than Underlying EBIT, for which Threshold earnings are 30%) with a linear scale up to 100% at Target performance; and a further linear scale to 200% at Stretch performance.
What are the outcomes for FY2018?Table 4 identifies the performance measures, relevant weightings and outcomes for FY2018. The FY2018 actual outcomes for Executive KMP are identified within Table 5.
TABLE 4 – SHORT TERM INCENTIVE AWARD FINANCIAL YEAR 2018 OBJECTIVES1
DESCRIPTION WEIGHTING TARGET OUTCOMEEBIT: Underlying EBIT delivers financial benefits to shareholders through growth in underlying operating earnings
40% $931m $941m
Between Target and Stretch
Enterprise Transformation: Our priority to transform Aurizon continues to be a strategic imperative. For FY2018, this objective was aligned to the Enterprise Transformation Program, which identifies cost-outs and capital management savings targeted over three years (FY2016 - FY2018)
20% $80m $86m
Between Target and Stretch
Safety: The measures capture the need to continuously improve and maintain safety across all aspects of the Company measured through equally weighted parameters which included:
› Total reportable injury frequency rate (TRIFR) › Rail Process Safety (Total Accident Rate and Signals Passed at Danger)
10% › 15% reduction in TRIFR › 10% improvement in Rail
Process Safety
› 57% increase TRIFR › 75% increase in Rail
Safety Process
Below Threshold
Aggregate Enterprise Outcome (Sub-total) 70%
Individual: Performance hurdles for the Executive KMP are established on an annual basis by the MD & CEO. In the case of the MD & CEO the individual hurdles are established by the Chairman after consultation with the Board. For FY2018 the MD & CEO’s individual performance parameters included:
30% Individual performance targets vary for each specific role
Personal outcomes for MD & CEO and Executive KMP varied between Target and Stretch depending on performance against individual KPIs
› Redefine Enterprise strategic plan
› Regulatory process
› Implement strategic review outcomes relating to Intermodal, Bulk and support areas
1 Company performance hurdles relate to continuing operations
TABLE 5 – SHORT TERM INCENTIVE AWARDED IN FINANCIAL YEAR 2018
NAME
TARGET STIA
$’000
MAXIMUM POTENTIAL
STIA ($’000)
AWARDED FY2018 ($’000)% OF
TARGET STIA
% OF MAXIMUM
STIA2CASH
COMPONENT
DEFERRED SHARE
COMPONENT1TOTAL STIA
PAYMENTEXECUTIVE KMPA Harding 1,700 2,550 1,257 838 2,095 123 82
P Bains 525 788 389 260 649 124 82
C McDonald 450 675 344 229 573 127 85
E McKeiver 480 720 352 234 586 122 81
M Riches3 474 711 339 226 565 119 79
1 A portion (40%) awarded in the form of rights to shares, which vest on the first anniversary of payment of the cash component subject to Board’s ability to ‘claw-back’2 Executives have forfeited between 15% to 21% of their maximum potential outcome3 Pro-rata outcomes apply for Executives who were appointed after the performance year commenced (1 July 2017)
For
per
sona
l use
onl
y
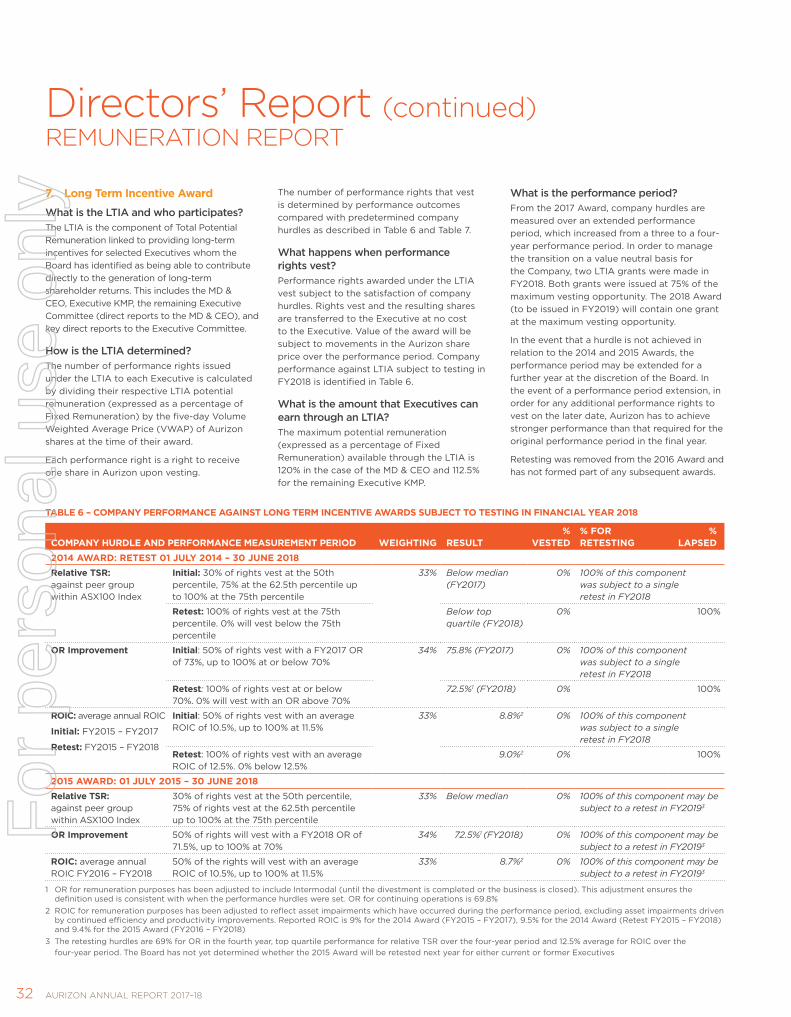
AURIZON ANNUAL REPORT 2017–1832
Directors’ Report (continued)REMUNERATION REPORT
7. Long Term Incentive Award
What is the LTIA and who participates? The LTIA is the component of Total Potential Remuneration linked to providing long-term incentives for selected Executives whom the Board has identified as being able to contribute directly to the generation of long-term shareholder returns. This includes the MD & CEO, Executive KMP, the remaining Executive Committee (direct reports to the MD & CEO), and key direct reports to the Executive Committee.
How is the LTIA determined? The number of performance rights issued under the LTIA to each Executive is calculated by dividing their respective LTIA potential remuneration (expressed as a percentage of Fixed Remuneration) by the five-day Volume Weighted Average Price (VWAP) of Aurizon shares at the time of their award.
Each performance right is a right to receive one share in Aurizon upon vesting.
The number of performance rights that vest is determined by performance outcomes compared with predetermined company hurdles as described in Table 6 and Table 7.
What happens when performance rights vest? Performance rights awarded under the LTIA vest subject to the satisfaction of company hurdles. Rights vest and the resulting shares are transferred to the Executive at no cost to the Executive. Value of the award will be subject to movements in the Aurizon share price over the performance period. Company performance against LTIA subject to testing in FY2018 is identified in Table 6.
What is the amount that Executives can earn through an LTIA? The maximum potential remuneration (expressed as a percentage of Fixed Remuneration) available through the LTIA is 120% in the case of the MD & CEO and 112.5% for the remaining Executive KMP.
What is the performance period? From the 2017 Award, company hurdles are measured over an extended performance period, which increased from a three to a four-year performance period. In order to manage the transition on a value neutral basis for the Company, two LTIA grants were made in FY2018. Both grants were issued at 75% of the maximum vesting opportunity. The 2018 Award (to be issued in FY2019) will contain one grant at the maximum vesting opportunity.
In the event that a hurdle is not achieved in relation to the 2014 and 2015 Awards, the performance period may be extended for a further year at the discretion of the Board. In the event of a performance period extension, in order for any additional performance rights to vest on the later date, Aurizon has to achieve stronger performance than that required for the original performance period in the final year.
Retesting was removed from the 2016 Award and has not formed part of any subsequent awards.
TABLE 6 – COMPANY PERFORMANCE AGAINST LONG TERM INCENTIVE AWARDS SUBJECT TO TESTING IN FINANCIAL YEAR 2018
COMPANY HURDLE AND PERFORMANCE MEASUREMENT PERIOD WEIGHTING RESULT%
VESTED% FOR RETESTING
% LAPSED
2014 AWARD: RETEST 01 JULY 2014 – 30 JUNE 2018Relative TSR: against peer group within ASX100 Index
Initial: 30% of rights vest at the 50th percentile, 75% at the 62.5th percentile up to 100% at the 75th percentile
33% Below median (FY2017)
0% 100% of this component was subject to a single retest in FY2018
Retest: 100% of rights vest at the 75th percentile. 0% will vest below the 75th percentile
Below top quartile (FY2018)
0% 100%
OR Improvement Initial: 50% of rights vest with a FY2017 OR of 73%, up to 100% at or below 70%
34% 75.8% (FY2017) 0% 100% of this component was subject to a single retest in FY2018
Retest: 100% of rights vest at or below 70%. 0% will vest with an OR above 70%
72.5%1 (FY2018) 0% 100%
ROIC: average annual ROIC
Initial: FY2015 – FY2017
Retest: FY2015 – FY2018
Initial: 50% of rights vest with an average ROIC of 10.5%, up to 100% at 11.5%
33% 8.8%2 0% 100% of this component was subject to a single retest in FY2018
Retest: 100% of rights vest with an average ROIC of 12.5%. 0% below 12.5%
9.0%2 0% 100%
2015 AWARD: 01 JULY 2015 – 30 JUNE 2018 Relative TSR: against peer group within ASX100 Index
30% of rights vest at the 50th percentile, 75% of rights vest at the 62.5th percentile up to 100% at the 75th percentile
33% Below median 0% 100% of this component may be subject to a retest in FY20193
OR Improvement 50% of rights will vest with a FY2018 OR of 71.5%, up to 100% at 70%
34% 72.5%1 (FY2018) 0% 100% of this component may be subject to a retest in FY20193
ROIC: average annual ROIC FY2016 – FY2018
50% of the rights will vest with an average ROIC of 10.5%, up to 100% at 11.5%
33% 8.7%2 0% 100% of this component may be subject to a retest in FY20193
1 OR for remuneration purposes has been adjusted to include Intermodal (until the divestment is completed or the business is closed). This adjustment ensures the definition used is consistent with when the performance hurdles were set. OR for continuing operations is 69.8%
2 ROIC for remuneration purposes has been adjusted to reflect asset impairments which have occurred during the performance period, excluding asset impairments driven by continued efficiency and productivity improvements. Reported ROIC is 9% for the 2014 Award (FY2015 – FY2017), 9.5% for the 2014 Award (Retest FY2015 – FY2018) and 9.4% for the 2015 Award (FY2016 – FY2018)
3 The retesting hurdles are 69% for OR in the fourth year, top quartile performance for relative TSR over the four-year period and 12.5% average for ROIC over the four-year period. The Board has not yet determined whether the 2015 Award will be retested next year for either current or former Executives
For
per
sona
l use
onl
y

33REMUNERATION REPORT
TABLE 7 – LONG TERM INCENTIVE AWARD PERFORMANCE OVERVIEW AND HURDLES
TSR The vesting of rights for relative TSR growth is conditional on Aurizon’s TSR performance relative to a peer group of companies in the ASX100 index (approximately 70) that are broadly comparable to Aurizon (i.e. with which Aurizon competes for capital and/or capability). Property trusts (from 2016 Award) and telecommunications companies (from 2017 Award) are no longer excluded from the comparator group. Financial, healthcare, biotechnology, casinos and gaming companies are excluded from the comparator group.
TSR measures the growth in the price of shares plus cash distributions notionally reinvested in shares. The TSR of Aurizon over the performance period will be compared to the TSR of all of the companies in the peer group which are still listed at the end of the performance period. The relevant share prices will be determined by reference to a VWAP over a period to smooth any short-term ‘peaks’ or ‘troughs’. Relative TSR performance is verified by an independent expert at the end of each Financial Year.
ROIC ROIC, for the purposes of the LTIA, will be calculated on the same basis as the published ROIC except to the extent of the differences explained in this section. Essentially, ROIC is Underlying EBIT divided by Invested Capital. For the purposes of LTIA, invested capital will not include major (infrastructure investments with an approved budgeted capital expenditure over $250m) assets under construction (AUC) until these investments are planned to generate income, subject to Board discretion (for example, in the case of a delay judged to be outside the control of management and not able to be foreseen or mitigated).
ROIC for remuneration purposes will be adjusted (add-back depreciation charge and invested capital) to reflect asset impairments which occur during the performance period, excluding asset impairments driven by continued efficiency and productivity improvements.
OR OR improvement essentially measures the operating cost as a percentage of revenue. Aurizon is committed to reducing OR through further implementation of transformation initiatives, growth initiatives and continued tight operational and financial discipline. The Board determined that OR will no longer form part of the LTIA from the 2017 Award. It was always intended that the use of OR had a finite life-span. Whilst OR will continue to be managed and improved it will no longer be used for remuneration purposes with the balance of future awards weighted towards TSR and ROIC which are better aligned to a long asset life infrastructure company.
In August 2017, Aurizon announced its intention to exit the Intermodal business. Accordingly, the entire Intermodal business has been treated as a discontinued item for reporting purposes. Shareholders have been unable to realise the benefit of fully exiting the Intermodal business in FY2018. As a result the Board have determined that OR for remuneration purposes will be adjusted to include Intermodal (until the divestment is completed or the business is closed). This adjustment ensures the definition used is consistent with when the performance hurdles were set.
2017 AWARD (3 YEAR) WEIGHTINGPERFORMANCE PERIOD (01/07/2017 – 30/06/2020)1,2
MINIMUM VESTING POINT MAXIMUM VESTING POINTRelative TSR: against peer group within ASX100 Index
50% 30% of the rights will vest at the 50th percentile
75% of the rights will vest at the 62.5th percentile
100% of the rights will vest at the 75th percentile
ROIC: average annual ROIC FY2018 – FY20203
50% 50% of the rights will vest with an average ROIC of 10.5%
100% of the rights will vest with an average ROIC of 11.5%
100% All rights will vest pro-rata on a straight-line basis between the minimum and maximum vesting points
2017 AWARD (4 YEAR) WEIGHTINGPERFORMANCE PERIOD (01/07/2017 – 30/06/2021)1,2
MINIMUM VESTING POINT MAXIMUM VESTING POINTRelative TSR: against peer group within ASX100 Index
50% 30% of the rights will vest at the 50th percentile
75% of the rights will vest at the 62.5th percentile
100% of the rights will vest at the 75th percentile
ROIC: average annual ROIC FY2018 – FY20213
50% 50% of the rights will vest with an average ROIC of 10.5%
100% of the rights will vest with an average ROIC of 11.5%
100% All rights will vest pro-rata on a straight-line basis between the minimum and maximum vesting points
2018 AWARD (4 YEAR) WEIGHTINGPERFORMANCE PERIOD (01/07/2018 – 30/06/2022)1
MINIMUM VESTING POINT MAXIMUM VESTING POINTRelative TSR: against peer group within ASX100 Index
50% 30% of the rights will vest at the 50th percentile
75% of the rights will vest at the 62.5th percentile
100% of the rights will vest at the 75th percentile
ROIC: average annual ROIC FY2019 – FY2022
50% 50% of the rights will vest with an average ROIC of 9%
100% of the rights will vest with an average ROIC of 10%
100% All rights will vest pro-rata on a straight-line basis between the minimum and maximum vesting points
1 In the event that performance is not achieved the performance period will not be extended, as retesting no longer forms part of the LTIA from the 2016 Award2 From the 2017 Award, company hurdles are measured over an extended performance period, which increased from a three-year performance period to a four-year
performance period. In order to facilitate this transition two awards were issued at 75% of the maximum vesting opportunity in FY2018 3 ROIC hurdles for the 2017 Awards have been set with reference to the QCA transitional tariff which extended UT4 to 31 December 2017. The transitional tariffs remain in
place until the approval of UT5. The Board may apply discretion should the UT5 outcome result in a material tariff difference
How does Aurizon utilise Retention awards? In some circumstances, as approved by the Board, Management may recommend issuing retention awards where the services of an individual are considered critical to Aurizon over the short-to-medium term and the existing remuneration arrangements are thought to be insufficient to retain those services. Retention awards may be time-based or project-based and are governed by stringent performance conditions and may be cash-based or equity-based.
During FY2018, no equity-based awards were issued however one equity-based award vested. This award pertained to the retention of the CFO & Group Executive Strategy as disclosed in FY2017. Further information is available in note 29 of the Financial Report (page 91). Additionally, 28 cash-based awards were issued. One award was linked to the retention of a critical employee leading a key strategic program and vested in FY2018. Two awards, which may vest in FY2019, were issued as a pre-emptive defence against the external targeting of Executives. The remaining awards were issued to key employees required to complete the Intermodal closure and sale process totalling approximately $660,000. Performance periods and conditions were tailored to the individual’s role and therefore resulted in varying outcomes. A majority of the awards pertaining to the Intermodal process vested in FY2018.
For
per
sona
l use
onl
y

AURIZON ANNUAL REPORT 2017–1834
Directors’ Report (continued)REMUNERATION REPORT
8. Executive Service Agreements
Executive Service Agreements Remuneration and other terms of employment for the MD & CEO and Executive KMP are formalised in a Service Agreement as summarised in Table 8.
Minimum shareholding policy for ExecutivesTo align KMP and the Executive Committee (direct reports to the MD & CEO) with shareholders, the Company requires:
› Non-Executive Directors to accumulate and maintain one year’s Total Directors’ fees (consisting of Directors’ fee plus applicable Committee fee/s) of shares in the Company
› the MD & CEO to accumulate and maintain one year’s Fixed Remuneration of shares in the Company
› the remaining Executive KMP and Executive Committee to accumulate and maintain 50% of one year’s Fixed Remuneration of shares in the Company
This is to be achieved within six years of the date of their appointment. This will be calculated with reference to the Total Directors’ fees and Executives’ Fixed Remuneration during the period divided by the number of years.
Details of KMP shareholdings as at 30 June 2018 are set out in Table 9.
Hedging and margin lending policiesAurizon has in place a policy that prohibits Executives from hedging economic exposure to unvested rights that have been issued pursuant to a Company employee share plan. The policy also prohibits margin loan arrangements for the purpose of purchasing Aurizon shares. Adherence to this policy is monitored regularly and involves each Executive signing an annual declaration of compliance with the policy.
TABLE 8 – SERVICE AGREEMENTS
NAMEDURATION OF SERVICE AGREEMENT
FIXED REMUNERATION AT END OF FINANCIAL YEAR
20181
NOTICE PERIOD2
BY EXECUTIVE BY COMPANY3
EXECUTIVE KMPA Harding Ongoing $1,700,000 6 months 12 months
P Bains Ongoing $700,000 3 months 6 months
C McDonald Ongoing $600,000 3 months 6 months
E McKeiver Ongoing $640,000 3 months 6 months
M Riches Ongoing $675,000 3 months 6 months
1 Fixed remuneration includes a superannuation component2 Post employment restraints in any competitor business in Australia is aligned to the notice period3 Any termination payment will be subject to compliance with the Corporations Act and will not exceed 12 months
TABLE 9 – KMP SHAREHOLDINGS AS AT 30 JUNE 2018
NAME
BALANCE AT THE START OF THE YEAR
RECEIVED DURING THE YEAR
ON VESTING
OTHER CHANGES DURING
THE YEAR
BALANCE AT THE END
OF THE YEAR% OF FIXED
REMUNERATION1
NON–EXECUTIVE DIRECTORST Poole 90,500 – – 90,500 80%
M Bastos – – 11,400 11,400 25%
R Caplan2 82,132 – – 82,132 171%
J Cooper2 85,000 – 10,000 95,000 198%
K Field2 40,458 – – 40,458 84%
M Fraser 40,000 – – 40,000 83%
S Lewis 33,025 – – 33,025 69%
K Vidgen 40,000 – – 40,000 87%
EXECUTIVE KMPA Harding – – 10,000 10,000 3%
P Bains 16,484 6,864 – 23,348 14%
C McDonald 57,972 47,722 – 105,694 76%
E McKeiver 48,6923 8,237 – 56,929 39%
M Riches – – – – 0%
1 Assumes Total Directors’ fees and Fixed Remuneration as at 30 June 2018 and the calculation assumes a share price of $4.332 KMP required to meet the minimum shareholding requirement due to length of service in a KMP role being longer than six years3 Restated from FY2017
For
per
sona
l use
onl
y
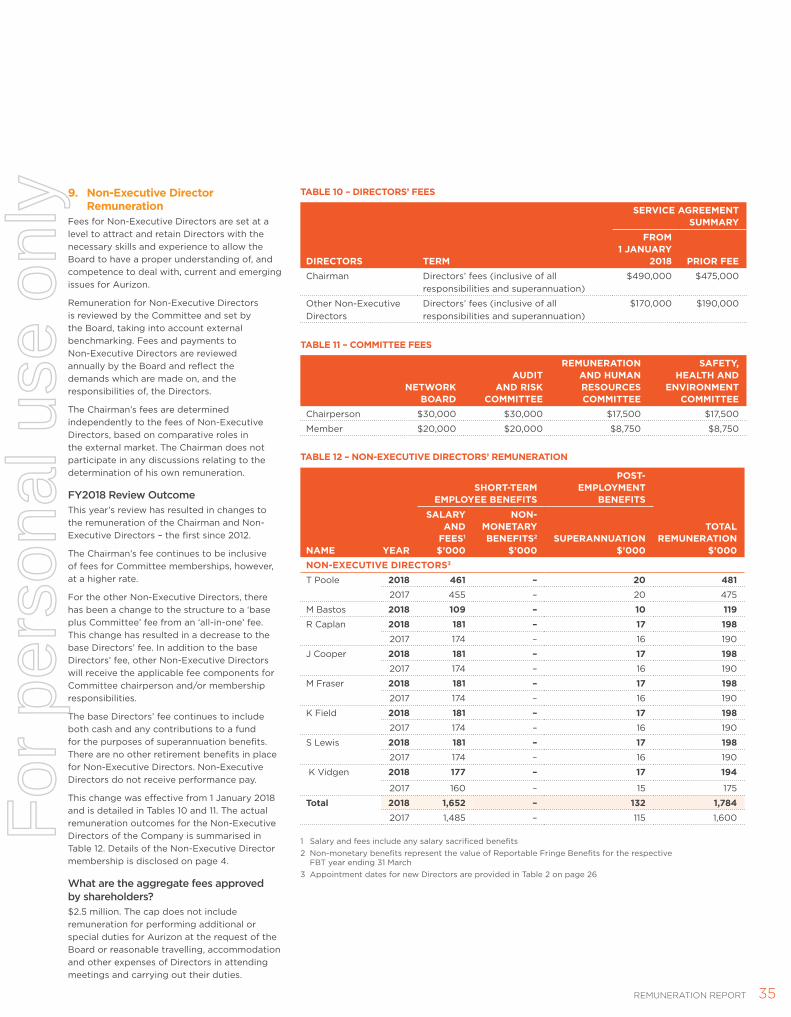
35REMUNERATION REPORT
9. Non-Executive Director Remuneration
Fees for Non-Executive Directors are set at a level to attract and retain Directors with the necessary skills and experience to allow the Board to have a proper understanding of, and competence to deal with, current and emerging issues for Aurizon.
Remuneration for Non-Executive Directors is reviewed by the Committee and set by the Board, taking into account external benchmarking. Fees and payments to Non-Executive Directors are reviewed annually by the Board and reflect the demands which are made on, and the responsibilities of, the Directors.
The Chairman’s fees are determined independently to the fees of Non-Executive Directors, based on comparative roles in the external market. The Chairman does not participate in any discussions relating to the determination of his own remuneration.
FY2018 Review OutcomeThis year’s review has resulted in changes to the remuneration of the Chairman and Non-Executive Directors – the first since 2012.
The Chairman’s fee continues to be inclusive of fees for Committee memberships, however, at a higher rate.
For the other Non-Executive Directors, there has been a change to the structure to a ‘base plus Committee’ fee from an ‘all-in-one’ fee. This change has resulted in a decrease to the base Directors’ fee. In addition to the base Directors’ fee, other Non-Executive Directors will receive the applicable fee components for Committee chairperson and/or membership responsibilities.
The base Directors’ fee continues to include both cash and any contributions to a fund for the purposes of superannuation benefits. There are no other retirement benefits in place for Non-Executive Directors. Non-Executive Directors do not receive performance pay.
This change was effective from 1 January 2018 and is detailed in Tables 10 and 11. The actual remuneration outcomes for the Non-Executive Directors of the Company is summarised in Table 12. Details of the Non-Executive Director membership is disclosed on page 4.
What are the aggregate fees approved by shareholders? $2.5 million. The cap does not include remuneration for performing additional or special duties for Aurizon at the request of the Board or reasonable travelling, accommodation and other expenses of Directors in attending meetings and carrying out their duties.
TABLE 10 – DIRECTORS’ FEES
SERVICE AGREEMENT SUMMARY
DIRECTORS TERM
FROM 1 JANUARY
2018 PRIOR FEEChairman Directors’ fees (inclusive of all
responsibilities and superannuation)$490,000 $475,000
Other Non-Executive Directors
Directors’ fees (inclusive of all responsibilities and superannuation)
$170,000 $190,000
TABLE 11 – COMMITTEE FEES
NETWORK BOARD
AUDIT AND RISK
COMMITTEE
REMUNERATION AND HUMAN RESOURCES COMMITTEE
SAFETY, HEALTH AND
ENVIRONMENT COMMITTEE
Chairperson $30,000 $30,000 $17,500 $17,500
Member $20,000 $20,000 $8,750 $8,750
TABLE 12 – NON-EXECUTIVE DIRECTORS’ REMUNERATION
NAME YEAR
SHORT-TERM EMPLOYEE BENEFITS
POST-EMPLOYMENT
BENEFITS
TOTAL REMUNERATION
$’000
SALARY AND
FEES1 $’000
NON-MONETARY BENEFITS2
$’000SUPERANNUATION
$’000NON-EXECUTIVE DIRECTORS3
T Poole 2018 461 – 20 4812017 455 – 20 475
M Bastos 2018 109 – 10 119R Caplan 2018 181 – 17 198
2017 174 – 16 190
J Cooper 2018 181 – 17 1982017 174 – 16 190
M Fraser 2018 181 – 17 1982017 174 – 16 190
K Field 2018 181 – 17 1982017 174 – 16 190
S Lewis 2018 181 – 17 1982017 174 – 16 190
K Vidgen 2018 177 – 17 194
2017 160 – 15 175
Total 2018 1,652 – 132 1,7842017 1,485 – 115 1,600
1 Salary and fees include any salary sacrificed benefits2 Non-monetary benefits represent the value of Reportable Fringe Benefits for the respective
FBT year ending 31 March 3 Appointment dates for new Directors are provided in Table 2 on page 26
For
per
sona
l use
onl
y

AURIZON ANNUAL REPORT 2017–183636
Directors’ Report (continued)REMUNERATION REPORT
10. Executive Remuneration Financial Year 2018The table below details the number and value of movements in equity awards during FY2018.
TABLE 13 – RIGHTS GRANTED AS COMPENSATION
NAMEINCENTIVE
PLAN
BALANCE AT BEGINNING
OF YEAR
RIGHTS AWARDED
DURING THE YEAR1
VALUE OF RIGHTS
GRANTED IN YEAR
VESTED IN YEAR
EXERCISED DURING THE
YEAR FORFEITED IN
YEARFORFEITED IN
YEARVALUE OF RIGHTS
FORFEITED IN YEARBALANCE AT END
OF YEAR
WEIGHTED FAIR VALUE PER RIGHT
AT GRANT DATEGRANT
DATE DATE ON WHICH
GRANT VESTS2EXPIRY
DATE
NO. NO. $’000 % NO. NO. % $’000 NO. $
EXECUTIVE KMPA Harding3 2016 463,636 – – – – – – – 463,636 3.49 18–Oct–17 7–Sept–19 31–Dec–19
2017 STIAD6 – 42,076 211 – – – – – 42,076 5.01 18–Sept–17 18–Sept–18 31–Dec–182017 (3 year) – 295,938 914 – – – – – 295,938 3.09 18–Oct–17 18–Oct–20 31–Dec–202017 (4 year) – 295,938 885 – – – – – 295,938 2.99 18–Oct–17 18–Oct–21 31–Dec–21
P Bains 2013 38,582 – – 18% (6,864) (31,718) 82% 121 – 3.62 16–Aug–13 16–Aug–17 31–Dec–1720143 49,382 – – – – – – – 49,382 3.57 18–Aug–14 18–Aug–17 31–Dec–1820153 46,066 – – – – – – – 46,066 4.00 17–Aug–15 17–Aug–18 31–Dec–19
2016 – Ret4 25,000 – – – – – – – 25,000 4.74 1–Jul–16 30–Jun–18 7–Jan–192016 60,776 – – – – – – – 60,776 3.45 7–Oct–16 7–Oct–19 31–Dec–19
2017 STIAD6 – 20,279 102 – – – – – 20,279 5.01 18–Sept–17 18–Sept–18 31–Dec–182017 (3 year) – 114,241 363 – – – – – 114,241 3.18 6–Oct–17 6–Oct–20 31–Dec–202017 (4 year) – 114,241 351 – – – – – 114,241 3.07 6–Oct–17 6–Oct–21 31–Dec–21
C McDonald 2013 43,403 – – 18% (7,722) (35,681) 82% 136 – 3.62 16–Aug–13 16–Aug–17 31–Dec–1720143 55,555 – – – – – – – 55,555 3.57 18–Aug–14 18–Aug–17 31–Dec–18
2015 – Ret5 40,000 – – 100% (40,000) – – – – 5.07 01–Oct–15 30–Jun–17 31–Dec–1720153 51,824 – – – – – – – 51,824 4.00 17–Aug–15 17–Aug–18 31–Dec–192016 60,776 – – – – – – – 60,776 3.45 7–Oct–16 7–Oct–19 31–Dec–19
2017 STIAD6 – 12,774 64 – – – – – 12,774 5.01 18–Sept–17 18–Sept–18 31–Dec–182017 (3 year) – 97,921 311 – – – – – 97,921 3.18 6–Oct–17 6–Oct–20 31–Dec–202017 (4 year) – 97,921 301 – – – – – 97,921 3.07 6–Oct–17 6–Oct–21 31–Dec–21
E McKeiver 2013 46,297 – – 18% (8,237) (38,060) 82% 145 – 3.62 16–Aug–13 16–Aug–17 31–Dec–1720143 59,260 – – – – – – – 59,260 3.57 18–Aug–14 18–Aug–17 31–Dec–1820153 55,279 – – – – – – – 55,279 4.00 17–Aug–15 17–Aug–18 31–Dec–192016 64,656 – – – – – – – 64,656 3.45 7–Oct–16 7–Oct–19 31–Dec–19
2017 (3 year) – 104,449 332 – – – – – 104,449 3.18 6–Oct–17 6–Oct–20 31–Dec–202017 (4 year) – 104,449 321 – – – – – 104,449 3.07 6–Oct–17 6–Oct–21 31–Dec–21
M Riches 2017 (3 year) – 110,161 350 – – – – – 110,161 3.18 6–Oct-17 6–Oct–20 31–Dec-202017 (4 year) – 110,161 339 – – – – – 110,161 3.07 6–Oct-17 6–Oct–21 31–Dec-21
1 The number of performance rights awarded, as described in Section 7, is a function of the market price (5-day VWAP) at the time of the award, that is, ‘face value’. For remuneration purposes, Aurizon does not use fair value to determine LTI Awards
2 Date on which grant vests will be adjusted for awards eligible for retest. Retesting has been removed from the 2016 Award onwards 3 Details of the vesting outcomes are described in Table 6. As described in Table 6, the Board has not yet determined whether the 2015
Award will be retested in FY2019 for either current or former Executives4 Retention Award as described in Section 75 Retention Award as described in Section 7 in the FY2017 Remuneration Report6 Deferred STIA component as described in Section 3 and Section 5 of this report and Table 6 in the FY2017 Remuneration Report
For
per
sona
l use
onl
y

37REMUNERATION REPORT
10. Executive Remuneration Financial Year 2018The table below details the number and value of movements in equity awards during FY2018.
TABLE 13 – RIGHTS GRANTED AS COMPENSATION
NAMEINCENTIVE
PLAN
BALANCE AT BEGINNING
OF YEAR
RIGHTS AWARDED
DURING THE YEAR1
VALUE OF RIGHTS
GRANTED IN YEAR
VESTED IN YEAR
EXERCISED DURING THE
YEAR FORFEITED IN
YEARFORFEITED IN
YEARVALUE OF RIGHTS
FORFEITED IN YEARBALANCE AT END
OF YEAR
WEIGHTED FAIR VALUE PER RIGHT
AT GRANT DATEGRANT
DATE DATE ON WHICH
GRANT VESTS2EXPIRY
DATE
NO. NO. $’000 % NO. NO. % $’000 NO. $
EXECUTIVE KMPA Harding3 2016 463,636 – – – – – – – 463,636 3.49 18–Oct–17 7–Sept–19 31–Dec–19
2017 STIAD6 – 42,076 211 – – – – – 42,076 5.01 18–Sept–17 18–Sept–18 31–Dec–182017 (3 year) – 295,938 914 – – – – – 295,938 3.09 18–Oct–17 18–Oct–20 31–Dec–202017 (4 year) – 295,938 885 – – – – – 295,938 2.99 18–Oct–17 18–Oct–21 31–Dec–21
P Bains 2013 38,582 – – 18% (6,864) (31,718) 82% 121 – 3.62 16–Aug–13 16–Aug–17 31–Dec–1720143 49,382 – – – – – – – 49,382 3.57 18–Aug–14 18–Aug–17 31–Dec–1820153 46,066 – – – – – – – 46,066 4.00 17–Aug–15 17–Aug–18 31–Dec–19
2016 – Ret4 25,000 – – – – – – – 25,000 4.74 1–Jul–16 30–Jun–18 7–Jan–192016 60,776 – – – – – – – 60,776 3.45 7–Oct–16 7–Oct–19 31–Dec–19
2017 STIAD6 – 20,279 102 – – – – – 20,279 5.01 18–Sept–17 18–Sept–18 31–Dec–182017 (3 year) – 114,241 363 – – – – – 114,241 3.18 6–Oct–17 6–Oct–20 31–Dec–202017 (4 year) – 114,241 351 – – – – – 114,241 3.07 6–Oct–17 6–Oct–21 31–Dec–21
C McDonald 2013 43,403 – – 18% (7,722) (35,681) 82% 136 – 3.62 16–Aug–13 16–Aug–17 31–Dec–1720143 55,555 – – – – – – – 55,555 3.57 18–Aug–14 18–Aug–17 31–Dec–18
2015 – Ret5 40,000 – – 100% (40,000) – – – – 5.07 01–Oct–15 30–Jun–17 31–Dec–1720153 51,824 – – – – – – – 51,824 4.00 17–Aug–15 17–Aug–18 31–Dec–192016 60,776 – – – – – – – 60,776 3.45 7–Oct–16 7–Oct–19 31–Dec–19
2017 STIAD6 – 12,774 64 – – – – – 12,774 5.01 18–Sept–17 18–Sept–18 31–Dec–182017 (3 year) – 97,921 311 – – – – – 97,921 3.18 6–Oct–17 6–Oct–20 31–Dec–202017 (4 year) – 97,921 301 – – – – – 97,921 3.07 6–Oct–17 6–Oct–21 31–Dec–21
E McKeiver 2013 46,297 – – 18% (8,237) (38,060) 82% 145 – 3.62 16–Aug–13 16–Aug–17 31–Dec–1720143 59,260 – – – – – – – 59,260 3.57 18–Aug–14 18–Aug–17 31–Dec–1820153 55,279 – – – – – – – 55,279 4.00 17–Aug–15 17–Aug–18 31–Dec–192016 64,656 – – – – – – – 64,656 3.45 7–Oct–16 7–Oct–19 31–Dec–19
2017 (3 year) – 104,449 332 – – – – – 104,449 3.18 6–Oct–17 6–Oct–20 31–Dec–202017 (4 year) – 104,449 321 – – – – – 104,449 3.07 6–Oct–17 6–Oct–21 31–Dec–21
M Riches 2017 (3 year) – 110,161 350 – – – – – 110,161 3.18 6–Oct-17 6–Oct–20 31–Dec-202017 (4 year) – 110,161 339 – – – – – 110,161 3.07 6–Oct-17 6–Oct–21 31–Dec-21
1 The number of performance rights awarded, as described in Section 7, is a function of the market price (5-day VWAP) at the time of the award, that is, ‘face value’. For remuneration purposes, Aurizon does not use fair value to determine LTI Awards
2 Date on which grant vests will be adjusted for awards eligible for retest. Retesting has been removed from the 2016 Award onwards 3 Details of the vesting outcomes are described in Table 6. As described in Table 6, the Board has not yet determined whether the 2015
Award will be retested in FY2019 for either current or former Executives4 Retention Award as described in Section 75 Retention Award as described in Section 7 in the FY2017 Remuneration Report6 Deferred STIA component as described in Section 3 and Section 5 of this report and Table 6 in the FY2017 Remuneration Report
For
per
sona
l use
onl
y

AURIZON ANNUAL REPORT 2017–1838
Directors’ Report (continued)REMUNERATION REPORT
Details of the remuneration paid to Executives are set out below and has been prepared in accordance with the accounting standards.
TABLE 14 – EXECUTIVE REMUNERATION
SHORT-TERM EMPLOYEE BENEFITS
POST- EMPLOYMENT
BENEFITS
LONG-TERM
BENEFITS
EQUITY- SETTLED
SHARE-BASED PAYMENTS
CONTRACTUAL TERMINATION
BENEFITS $’000
PROPORTION OF COMPENSATION PERFORMANCE
RELATED6 %
(B+G)/I
REMUNERATION CONSISTING
OF RIGHTS FOR THE YEAR
% (G/I)NAME YEAR
CASH SALARY
AND FEES
$’0001
CASH BONUS
$’000
ANNUAL LEAVE2
$’000
NON- MONETARY BENEFITS3
$’000
SUPER- ANNUATION4
$’000
LONG- SERVICE
LEAVE $’000
RIGHTS5 $’000
TOTAL $’000
EXECUTIVE KMP A B C D E F G H I J K
A Harding 2018 1,680 1,257 (4) 109 20 10 1,012 – 4,084 56 252017 947 316 19 25 11 7 387 – 1,712 41 23
P Bains 2018 621 389 24 2 79 15 399 – 1,529 52 2620177 321 98 9 – 42 7 137 – 614 38 22
C McDonald 20188 580 344 18 58 20 14 307 – 1,341 49 23E McKeiver 2018 620 352 24 69 20 53 293 – 1,431 45 20
20179 90 33 10 – 4 3 46 – 186 42 25
M Riches 201810 612 339 11 12 19 4 148 – 1,145 43 13Total Executive KMP compensation (group)
2018 4,113 2,681 73 250 158 96 2,159 – 9,530 51 232017 1,358 447 38 25 57 17 570 – 2,512 40 23
1 Cash salary and fees include any salary sacrifice benefits2 Annual leave amount represents annual leave accrued or utilised during the financial year. Negative amounts represent the utilisation of annual leave3 Non-monetary benefits includes travel benefits and relocation assistance4 Superannuation amounts represent employers’ contribution to superannuation5 The accounting expense recognised in relation to rights granted in the year is the fair value independently calculated at grant date using an expected outcome model.
This was consistent with the Monte-Carlo simulation conducted in the prior year and resulted in similar outcomes. This amount is progressively expensed over the vesting period. Refer to note 29 for further details regarding the fair value of Rights. These values may not represent the future value that the Executive will receive, as the vesting of the Rights is subject to the achievement of performance conditions. This includes the cost of deferred short-term incentives and long-term incentives.
6 The short-term incentives (cash bonus), deferred short-term incentives and long-term incentives (equity-settled share-based payments) represent the at-risk performance related remuneration
7 P Bains was appointed EVP & Chief Financial Officer from 19 December 2016. The cash salary and fees and cash bonus reflect the salary attributable to the EVP Chief Financial Officer role
8 C McDonald was appointed Group Executive Bulk on 1 July 20179 E McKeiver was appointed Acting EVP Customer & Strategy from 18 April 2017. The cash salary and fees and cash bonus reflect the salary attributable to the EVP
Customer & Strategy role10 M Riches was appointed Group Executive Network on 24 July 2017
For
per
sona
l use
onl
y
39AUDITOR’S INDEPENDENCE DECLARATION
PricewaterhouseCoopers, ABN 52 780 433 757 480 Queen Street, BRISBANE QLD 4000, GPO Box 150, BRISBANE QLD 4001 T: +61 7 3257 5000, F: +61 7 3257 5999, www.pwc.com.au
Liability limited by a scheme approved under Professional Standards Legislation.
Auditors’ Independence Declaration
As lead auditors for the audit of Aurizon Holdings Limited for the year ended 30 June 2018, we declare that to the best of our knowledge and belief, there have been:
(a) no contraventions of the auditor independence requirements of the Corporations Act 2001 in relation to the audit; and
(b) no contraventions of any applicable code of professional conduct in relation to the audit.
This declaration is in respect of Aurizon Holdings Limited and the entities it controlled during the period.
Nadia Carlin Tim Allman Partner PricewaterhouseCoopers Brisbane 12 August 2018
Partner PricewaterhouseCoopers
For
per
sona
l use
onl
y
AURIZON ANNUAL REPORT 2017–1840
Corporate Governance Statement
Aurizon Holdings Limited and the entities it controls (Aurizon Holdings or Company) believe corporate governance is a critical pillar on which business objectives and, in turn, shareholder value must be built.
The Board has adopted a suite of charters and key corporate governance documents which articulate the policies and procedures followed by Aurizon Holdings.
These documents are available in the Governance section of the Company’s website, aurizon.com.au. These documents are reviewed regularly to address any changes in governance practices and the law.
This Statement explains how Aurizon Holdings complies with the ASX Corporate Governance Council’s ‘Corporate Governance Principles and Recommendations – 3rd Edition’ (ASX Principles or Recommendations), and all the practices outlined in this Statement unless otherwise stated, have been in place for the full reporting period.
This Statement was adopted by the Board on 10 August 2018.
Principle 1: Lay solid foundations for management and oversightRECOMMENDATION AURIZON HOLDINGS’ COMPLIANCE WITH RECOMMENDATIONS1.1 Role of Board and management
The Board has established a clear distinction between the functions and responsibilities reserved for the Board and those delegated to management, which are set out in the Aurizon Holdings Limited Board Charter (Charter).
The Charter also provides an overview of the roles of the Chairman, individual Directors, the Managing Director & CEO and the Company Secretary.
A copy of the Charter is available in the Governance section of the Company’s website, aurizon.com.au.
P
1.2 Information regarding election and re-election of Director candidates
Aurizon carefully considers the character, experience, education, skill set as well as interests and associations of potential candidates for appointment to the Board and conducts appropriate checks to verify the suitability of the candidate prior to their appointment.
During the financial year the Board used a professional search firm to assist in appointing a Non-Executive Director (Mr Marcelo Bastos). As part of this search, the Board received assurance on the background of the Director who was subsequently appointed to the Board.
Aurizon has appropriate procedures in place to ensure material information relevant to a decision to elect or re-elect a Director is disclosed in the Notice of Meeting provided to shareholders.
P
1.3 Written contracts of appointment
In addition to being set out in the Charter, the roles and responsibilities of Directors are also formalised in the letter of appointment which each Director receives and commits to on their appointment. The letters of appointment specify the term of appointment, time commitment envisaged, expectations in relation to committee work or any other special duties attaching to the position, reporting lines, remuneration arrangements, disclosure obligations in relation to personal interests, confidentiality obligations, insurance and indemnity entitlements and details of the Company’s key governance policies, such as the Securities Dealing Policy.
A copy of the key governance policies can be found on the Company’s website aurizon.com.au.
Each Senior Executive enters into a service contract which sets out the material terms of employment, including a description of position and duties, reporting lines, remuneration arrangements, termination rights and entitlements.
Contract details of senior executives who are Key Management Personnel can be found on page 26 of the Annual Report.
P
1.4 Company Secretary The Company Secretary is directly accountable to the Board, through the Chairman, for facilitating and advising on the Company’s corporate governance processes and on all matters to do with the proper functioning of the Board. Each Director is entitled to access the advice and services of the Company Secretary. The Board Charter also sets out the responsibilities of the Company Secretary.
In accordance with the Company’s Constitution, the appointment or removal of the Company Secretary is a matter for the Board as a whole. Details of the Company Secretary’s experience and qualifications are set out on page 7 of the Annual Report.
P
For
per
sona
l use
onl
y
41CORPORATE GOVERNANCE STATEMENT
RECOMMENDATION AURIZON HOLDINGS’ COMPLIANCE WITH RECOMMENDATIONS1.5 Diversity & inclusion › Aurizon Holdings has had a Diversity Policy since 2011 which is reviewed annually and which sets out its
objectives and reporting practices with respect to inclusion and diversity and is available in the Governance section of the Company’s website, aurizon.com.au.
› The measurable objectives and outcomes for diversity, agreed by the Aurizon Holdings Board for FY2018, are set out below:
ENTERPRISE MEASURES FY18 TARGET FY18 ACTUALGender representation on Board Minimum 30% (each gender) 33% women/67% men
Representation of women in Aurizon
22.0% 21.0%
Representation of Aboriginal and Torres Strait Islander men and women in Aurizon
5.5% 5.0%
In addition, Aurizon’s representation of women in senior executive positions (Group Executives and their direct reports) has increased to 22% in FY18 up from 20% in FY17.
Further details on the Company’s inclusion and diversity performance and activities can be found on the Company website aurizon.com.au.
P
1.6 Board reviews A performance review is undertaken annually in relation to the Board and the Board Committees. Periodically the Board engages a professional independent consultant experienced in Board reviews to conduct a review of the Board and its Committees, and the effectiveness of the Board as a whole.
During the year a review and evaluation of the performance of the Board, the Chairman and each Board Committee was conducted in accordance with the internal assessment process described above.
P
1.7 Management reviews
Each year the Board sets financial, operational, management and individual targets for the Managing Director & CEO. The Managing Director & CEO (in consultation with the Board) in turn, sets targets for direct reports.
Performance against these targets is assessed periodically throughout the year, and a formal performance evaluation for senior management is completed for the year-end.
P
Principle 2: Structure the Board to add value RECOMMENDATION AURIZON HOLDINGS’ COMPLIANCE WITH RECOMMENDATIONS2.1 Nominations committee
The Nomination & Succession Committee comprises four members (including the Chairman), all of whom are Independent Non-Executive Directors. Details of the membership of the Nomination & Succession Committee, including the names and qualifications of the Committee members, are set out on pages 4 to 6 of the Annual Report.
The number of meetings held and attended by each member of the Nomination & Succession Committee during the financial year are set out on page 8 of the Directors’ Report within the Annual Report.
The Charter governing the conduct of the Nomination & Succession Committee is reviewed annually and is available in the Governance section of the Company’s website, aurizon.com.au.
P
RECOMMENDATION AURIZON HOLDINGS’ COMPLIANCE WITH RECOMMENDATIONS2.2 Board skills The skills listed below have been identified as the optimum skills Aurizon Holdings seeks to achieve across its Board
membership. The Aurizon Holdings Board possesses a good blend of these skills. During FY2015 and FY2016 the Aurizon Board underwent significant change, including a change in Chairman. During FY2018 one additional Director was appointed and since that time the Board has been consolidating the recent changes.
P
General
› Board experience
› Senior management experience
› ASX listed company governance
› Risk management
Industry
› Transport and logistics
› Mining and resources
› Government relations
› Safety, health and environment
Further details regarding the skills and experience of each Director are included on pages 4 to 7 of the Report.
Technical
› Finance and accounting
› Regulatory
› Corporate strategy
› Capital allocation including acquisitions and divestments
› Information and operational technology
› Capital markets
› Engineering and construction
› Human resources
P
For
per
sona
l use
onl
y

AURIZON ANNUAL REPORT 2017–1842
Corporate Governance Statement (continued)
RECOMMENDATION AURIZON HOLDINGS’ COMPLIANCE WITH RECOMMENDATIONS2.3 Disclose independence and length of service
Details regarding which Directors are considered independent and the length of their service are set out on page 4 of the Annual Report.
P
2.4 Majority of Directors independent
In accordance with the Board Charter, the majority of Directors are independent. Only the Managing Director & CEO is not considered independent, by virtue of the role being an Executive of the Company.
Details regarding which Directors are considered independent and the length of their service are set out on page 4 of the Annual Report.
P
2.5 Chair independent The Chairman, Tim Poole, is an Independent Non-Executive Director. The role of CEO is performed by another Director.
Further details regarding the Directors are set out on pages 4 to 7 of the Annual Report.P
2.6 Induction and professional development
An induction process including appointment letters and ongoing education exists to promote early, active and relevant involvement of new members of the Board.
In addition to peer review, interaction and networking with other Directors and industry leaders, Aurizon Holdings’ Directors participate, from time-to-time, in Aurizon Holdings’ leadership forums and actively engage with Aurizon Holdings’ employees by visiting operational sites to gain an understanding of the Company’s operating environment.
During the year Directors receive accounting policy updates, especially around the time the Board considers the half-year and full-year financial statements.
The Board also includes briefings from time-to-time on legal, accounting, regulation, developments in communication and human resource management and technology.
Directors are encouraged and given the opportunity to broaden their knowledge of the business by visiting offices and sites in different locations. During the financial year, Directors made visits to operational sites in Queensland and Western Australia.
P
Principle 3: Act ethically and responsibly RECOMMENDATION AURIZON HOLDINGS’ COMPLIANCE WITH RECOMMENDATIONS3.1 Code of Conduct The Board has established a Code of Conduct for its Directors, senior executives and employees, a copy of which is
available in the Governance section of the Company’s website, aurizon.com.au. The Company’s Code of Conduct, amongst other things, articulates and discloses the Company’s core values. Those core values are Safety, People, Integrity, Customer and Excellence. A description of those values is set out in the Company’s Code of Conduct.
The Company also has a Whistleblower Policy, a copy of which is available in the Governance section of the Company’s website, aurizon.com.au and the Board, through the Audit, Governance and Risk Management Committee reviews and reports on concerns raised under the Whistleblower Policy.
P
Principle 2: Structure the Board to add value (continued)
For
per
sona
l use
onl
y

43CORPORATE GOVERNANCE STATEMENT
Principle 4: Safeguard integrity in corporate reporting RECOMMENDATION AURIZON HOLDINGS’ COMPLIANCE WITH RECOMMENDATIONS4.1 Audit Committee The Audit, Governance & Risk Management Committee comprises four members, all of whom are Independent
Non-Executive Directors. Details of the membership of the Audit, Governance & Risk Management Committee, including the names and qualifications of the Committee members, are set out on pages 4 to 7 of the Annual Report.
In addition to the Audit, Governance & Risk Management Committee members, the Managing Director & CEO, CFO, Head of Risk & Assurance, external auditors and Company Secretary attend the Audit, Governance & Risk Management Committee meetings.
The number of meetings held and attended by each member of the Audit, Governance & Risk Management Committee during the financial year are set out on page 8 of the Annual Report.
The Audit, Governance & Risk Management Committee Charter is reviewed annually and is available on the Aurizon Holdings website, aurizon.com.au. Amongst other things, the Audit, Governance & Risk Management Committee reviews the processes that validate the Director’s Report and the Annual Report. The Board, as a whole, has oversight of other corporate reporting, such as investor presentations.
P
4.2 CEO and CFO certification of financial statements
The Board has obtained a written assurance from the Managing Director & CEO and CFO that the declaration provided under section 295A of the Corporations Act (and for the purposes of Recommendation 4.2) is founded on a sound system of risk management and internal control, and that the system is operating effectively in all material respects in relation to financial reporting and material business risks.
P
4.3 External auditor at AGM
Aurizon Holdings’ external audit function is performed by PricewaterhouseCoopers (PwC). Representatives of PwC will attend the Annual General Meeting (AGM) and be available to answer shareholder questions regarding the audit.
P
Principle 5: Make timely and balanced disclosure RECOMMENDATION AURIZON HOLDINGS’ COMPLIANCE WITH RECOMMENDATIONS5.1 Disclosure and Communications Policy
Aurizon Holdings has adopted a Disclosure and Communications Policy which sets out the processes and practices to ensure compliance with the continuous disclosure requirements under the ASX Listing Rules and the Corporations Act.
Aurizon Holdings has also established guidelines to assist officers and employees of the Company with complying with the Company’s Disclosure and Communications Policy. A copy of the policy and guidelines are available on the Aurizon Holdings’ website, aurizon.com.au. The Board, as a whole, receives a copy of all announcements under Listing Rule 3.1 immediately prior to those announcements being made to the ASX.
P
Principle 6: Respect the rights of security holders RECOMMENDATION AURIZON HOLDINGS’ COMPLIANCE WITH RECOMMENDATIONS6.1 Information on website
Aurizon Holdings keeps investors informed of its corporate governance, financial performance and prospects via announcements to the ASX and our website. Investors can access copies of all announcements to the ASX, notices of meetings, annual reports, investor presentations, webcasts and/or transcripts of those presentations and a key event calendar via the ‘Investors’ tab. Investors can access general information regarding the Company and the structure of its business under the ‘Company, ‘What we deliver’ and ‘Sustainability’ tabs.
P
6.2 Investor relations programs
Aurizon Holdings conducts regular market briefings including interim and full year results announcements, investor days, site visits, and attends regional and industry specific conferences in order to facilitate effective two-way communication with investors and other financial markets participants. Access to Executive and Operational Management is provided to investors and analysts at these events, with separate one-on-one or group meetings offered whenever possible.
The presentation material provided at these events is sent to the ASX prior to commencement and subsequently posted on Aurizon Holdings’ Investor Centre website, including the webcast and transcript if applicable.
P
6.3 Facilitate participation at meetings of security holders
Aurizon Holdings uses technology to facilitate the participation of security holders in meetings including webcasting of the AGM.
Shareholders are encouraged to participate and are given an opportunity to ask questions of the Company and its auditor at the AGM. All resolutions put to shareholders are determined by Poll.
P
6.4 Facilitate electronic communications
Aurizon provides its investors the option to receive communications from, and send communications to, the Company and the share registry electronically.
PFor
per
sona
l use
onl
y

AURIZON ANNUAL REPORT 2017–1844
Corporate Governance Statement (continued)
Principle 7: Recognise and manage risk RECOMMENDATION AURIZON HOLDINGS’ COMPLIANCE WITH RECOMMENDATIONS7.1 Risk committee Aurizon Holdings’ Audit, Governance & Risk Management Committee oversees the process for identifying and
managing material risks in the Company in accordance with the Aurizon Risk Management Policy (Risk Policy). A copy of the Risk Policy is available in the Governance section of the Company’s website, aurizon.com.au.
Further details regarding the Committee, its membership and the number of meetings held during the financial year are set out in response to Recommendation 4.1.
P
7.2 Annual risk review The Board has mandated the Company’s internal audit group to provide independent assurance on the effectiveness of the Company’s risk management practices and report periodically its findings to the Audit, Governance & Risk Management Committee. The purpose of the assurance is to confirm the Company’s governance processes and practices continue to be sound and that the Company manages risk within the Board-approved risk appetite.
Internal audit has considered the operation of the Company’s risk management framework through the delivery of its audit program and have concluded that it is adequate and effective.
P
7.3 Internal audit The Company has an internal audit function that operates under a Board-approved Internal Audit Charter. The internal audit function is independent of management and the external auditor and is overseen by the Audit, Governance & Risk Management Committee. In accordance with the Committee Charter, the appointment or removal of the Head of Risk & Assurance is a matter for this Committee.
The Head of Risk & Assurance provides ongoing internal audit reports to the Audit, Governance & Risk Management Committee, as well as an annual assessment of the adequacy and effectiveness of the Company’s control processes and risk management procedures.
P
7.4 Sustainability risks Aurizon Holdings identifies and manages material exposures to economic, environmental and social sustainability risks in accordance with its enterprise risk management framework incorporating the Board-approved risk appetite.
The Company’s sustainability aspiration is to deliver world-leading performance underpinned by three sustainability commitments:
› The Company is committed to building a long-term sustainable business that delivers lasting value for our shareholders, customers, employees and communities
› The Company aims to take the safest, most efficient and least resource-intensive approach to the services we provide
› The Company applies a balanced view when assessing risk and making decisions, encompassing social, environmental and economic considerations.
In our operations, we continue to make progress on a number of sustainability aspects, including our operational efficiency and environmental management. A key element of our approach is the ongoing reduction in resource use across all of our operations with a strong focus on longer trains, higher-density trains, increased reliability and improved average train velocity.
During FY2018, the Company published its third Sustainability Report for the period ended 30 June 2017. A copy of this report is available in the Sustainability section of the Company’s website, aurizon.com.au.
The Company’s previous Sustainability Report identified areas of focus and priority that relate to the Company’s ability to create or preserve value for shareholders over the short, medium and long-term, and outlined how the Company manages or intends to manage the material risks identified. The Company has set appropriate benchmarks against which we will measure and report FY2018 performance and material economic, environmental and social sustainability risks.
The Company’s FY2018 Sustainability Report is intended to be released in October 2018. Consistent with the previous reports, it will be based on the GRI G4 Sustainability Reporting Guidelines and will describe the impact of the Company’s operations against the core elements of economic, environmental, social and governance performance. It will also identify those issues that reflect the organisation’s significant economic, environmental and social impacts or that substantially influence assessments and decisions of stakeholders
P
For
per
sona
l use
onl
y

45CORPORATE GOVERNANCE STATEMENT
Principle 8: Remunerate fairly and responsibly RECOMMENDATION AURIZON HOLDINGS’ COMPLIANCE WITH RECOMMENDATIONS8.1 Remuneration Committee
Aurizon Holdings’ remuneration function is performed by the Remuneration & Human Resources Committee, comprising four members all of whom are Independent Non-Executive Directors. Details of the membership of the Remuneration Committee, including the names and qualifications of the Committee members, are set out on pages 4 to 6 of the Annual Report.
The number of meetings held and attended by each member of the Remuneration & Human Resources Committee during the financial year are set out on page 8 of the Annual Report.
The Charter governing the conduct of the Remuneration & Human Resources Committee is reviewed annually and is available in the Governance section of the Company’s website, aurizon.com.au.
P
8.2 Disclosure of Executive and Non-Executive Director remuneration policy
The Company seeks to attract and retain high performing Directors and Executives with appropriate skills, qualifications and experience to add value to the Company and fulfil the roles and responsibilities required.
It reviews requirements for additional capabilities at least annually.
Executive remuneration is to reflect performance and accordingly, remuneration is structured with a fixed component and a performance-based component.
Non-Executive Directors are paid fixed fees for their services in accordance with the Company’s Constitution. The fee structure was changed during FY18. Further detail is set out in the Remuneration Report on page 35.
The Company has in place a Share Holding and Retention Policy which applies to Non-Executive Directors, the Managing Director & CEO and the direct reports of the Managing Director & CEO.
Further details regarding remuneration and share retention policies and the remuneration of Executive and Non-Executive Directors, are set out on pages 25 to 38 of the Annual Report. The Company also has in place a Related Party Transaction Policy. The policy and disclosures under that policy is reviewed annually by the Board. During the year there were no agreements entered into for the provision of consulting or similar services by a Director or Senior Executive or by a related party or a Director or Senior Executive.
P
8.3 Policy on hedging equity incentive schemes
Aurizon Holdings’ Executives must not enter into any hedge arrangement in relation to any performance rights they may be granted or otherwise entitled to under an incentive scheme or plan, prior to exercising those rights or, once exercised, while the securities are subject to a transfer restriction.
For the purposes of this policy, hedging includes the entry into any transaction, arrangement or financial product which operates to limit the economic risk of a security holding in the Company and includes financial instruments such as equity swaps and contracts for differences. The term ‘Executive’ is broadly defined to include the Managing Director & CEO and his direct reports and any other person entitled to participate in an Aurizon Holdings performance rights plan.
Further details regarding the Company’s hedging policy are set out in the Company’s Securities Dealing Policy which is available on the Governance section of the website, aurizon.com.au.
P
For
per
sona
l use
onl
y

Financial Reportfor the year ended 30 June 2018
FINANCIAL STATEMENTSConsolidated income statement Page 47
Consolidated statement of comprehensive income Page 47
Consolidated balance sheet Page 48
Consolidated statement of changes in equity Page 49
Consolidated statement of cash flows Page 50
NOTES TO THE CONSOLIDATED FINANCIAL STATEMENTSAbout this report Page 51
— Significant judgements and estimates Page 51
Key events and transactions for reporting period Page 51
Results for the year
Operating assets and liabilities
Capital and financial risk management
Group structure
Other information
Unrecognised items
1. Segment information
2. Revenue and other income
3. Expenses
4. Impairment of non-financial assets
5. Income tax
6. Earnings per share
7. Trade and other receivables
8. Inventories
9. Property, plant and equipment
10. Intangible assets
11. Trade and other payables
12. Provisions
13. Other liabilities
14. Capital risk management
15. Dividends
16. Equity and reserves
17. Borrowings
18. Financial risk management
19. Derivative financial instruments
20. Associates and joint arrangements
21. Material subsidiaries
22. Parent disclosures
23. Deed of cross guarantee
24. Discontinued operation
25. Assets classified as held for sale
26. Notes to the consolidated statement of cash flows
27. Related party transactions
28. Key Management Personnel compensation
29. Share-based payments
30. Remuneration of auditors
31. Summary of other significant accounting policies
32. Contingencies
33. Commitments
34. Events occurring after the reporting period
SIGNED REPORTSDirectors’ declaration Page 98
Independent auditor’s report to the members of Aurizon Holdings Limited Page 99
ASX INFORMATIONNon-IFRS financial information Page 105
AURIZON ANNUAL REPORT 2017–1846
For
per
sona
l use
onl
y

Notes2018
$m2017
$m
Revenue from continuing operations 2 3,112.7 3,142.5
Other income 2 66.3 –
Total revenue and other income 3,179.0 3,142.5
Employee benefits expense 3 (755.2) (892.6)
Energy and fuel (252.4) (236.5)
Track access (191.4) (204.2)
Consumables 3 (348.4) (392.9)
Depreciation and amortisation 3 (525.5) (567.3)
Impairment losses 4 (70.0) (678.3)
Other expenses (70.6) (46.2)
Share of net profit/(loss) of associates and joint venture partnerships accounted for using the equity method 0.8 (0.1)
Operating profit 966.3 124.4
Finance income 3.3 2.7
Finance expenses 3 (168.3) (181.3)
Net finance costs (165.0) (178.6)
Profit/(loss) before income tax 801.3 (54.2)
Income tax (expense)/benefit 5 (241.2) 17.0
Profit/(loss) from continuing operations after tax 560.1 (37.2)
Loss from discontinued operation after tax 24 (77.1) (150.7)
Profit/(loss) for the year attributable to owners of Aurizon Holdings Limited 483.0 (187.9)
Cents Cents
Basic earnings/(loss) per share for profit attributable to the ordinary equity holders of the Company: 6
– continuing and discontinued operations 24.0 (9.2)
– continuing operations 27.8 (1.8)
Diluted earnings/(loss) per share for profit attributable to the ordinary equity holders of the Company: 6
– continuing and discontinued operations 24.0 (9.2)
– continuing operations 27.8 (1.8)
The above consolidated income statement should be read in conjunction with the accompanying notes.
Consolidated statement of comprehensive incomefor the year ended 30 June 2018
Notes2018
$m2017
$m
Profit/(loss) for the year 483.0 (187.9)
Other comprehensive income:
Items that may be reclassified to profit or loss
– changes in the fair value of cash flow hedges 16(b) (13.0) 45.5
– income tax relating to these items 5(d) 3.9 (13.5)
Other comprehensive (expense)/income for the year, net of tax (9.1) 32.0
Total comprehensive income/(expense) for the year attributable to owners of Aurizon Holdings Limited 473.9 (155.9)
The above consolidated statement of comprehensive income should be read in conjunction with the accompanying notes.
Consolidated income statementfor the year ended 30 June 2018
FINANCIAL REPORT 47
For
per
sona
l use
onl
y

Consolidated balance sheetas at 30 June 2018
Notes2018
$m2017
$m
ASSETS
Current assets
Cash and cash equivalents 34.8 88.7
Trade and other receivables 7 530.9 496.8
Inventories 8 118.1 111.8
Derivative financial instruments 19 1.3 0.1
Current tax receivables – 17.8
Prepayments 4.7 6.9
Assets classified as held for sale 25 108.0 7.3
Total current assets 797.8 729.4
Non-current assets
Inventories 8 29.1 35.5
Derivative financial instruments 19 110.8 73.6
Property, plant and equipment 9 8,659.9 8,835.0
Intangible assets 10 172.6 170.0
Investments accounted for using the equity method 20 3.2 2.4
Total non-current assets 8,975.6 9,116.5
Total assets 9,773.4 9,845.9
LIABILITIES
Current liabilities
Trade and other payables 11 275.8 309.7
Borrowings 17 100.0 79.0
Derivative financial instruments 19 – 0.3
Current tax liabilities 61.2 –
Provisions 12 312.2 314.5
Other liabilities 13 78.0 40.7
Liabilities directly associated with assets classified as held for sale 24 12.7 –
Total current liabilities 839.9 744.2
Non-current liabilities
Borrowings 17 3,401.9 3,297.2
Derivative financial instruments 19 21.3 70.9
Deferred tax liabilities 5(f) 479.5 426.8
Provisions 12 82.2 78.7
Other liabilities 13 218.5 206.0
Total non-current liabilities 4,203.4 4,079.6
Total liabilities 5,043.3 4,823.8
Net assets 4,730.1 5,022.1
EQUITY
Contributed equity 16(a) 906.6 1,206.6
Reserves 16(b) 3,460.1 3,473.0
Retained earnings 363.4 342.5
Total equity 4,730.1 5,022.1
The above consolidated balance sheet should be read in conjunction with the accompanying notes.
AURIZON ANNUAL REPORT 2017–1848
For
per
sona
l use
onl
y
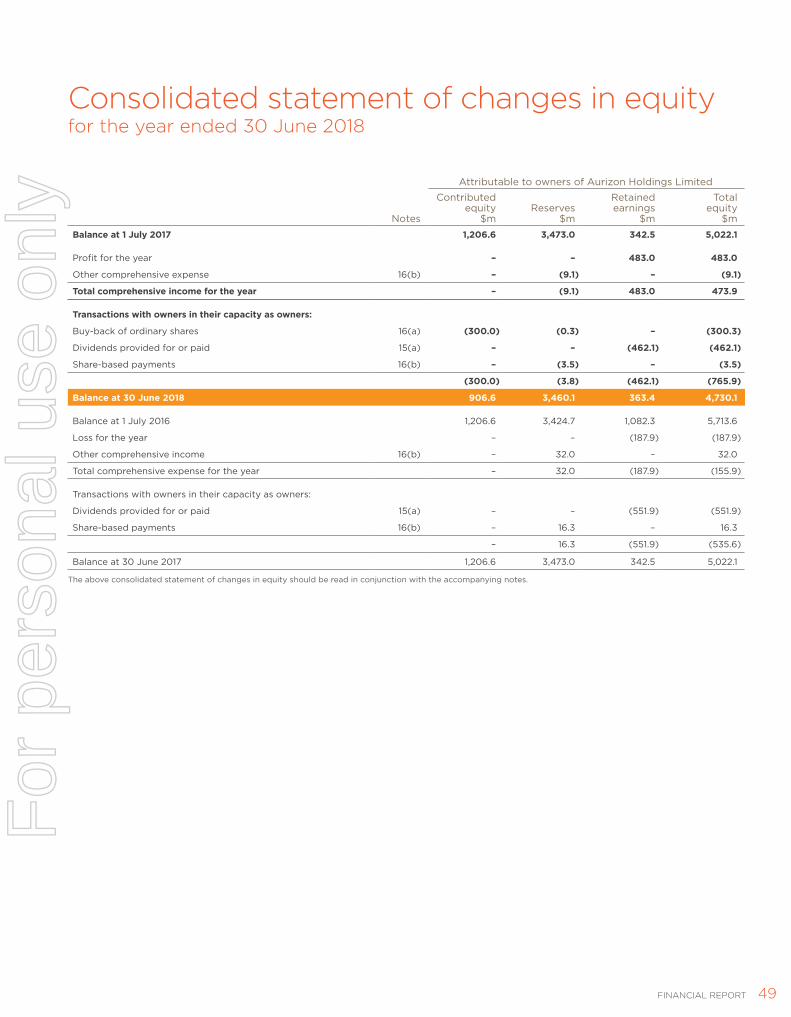
Consolidated statement of changes in equityfor the year ended 30 June 2018
Attributable to owners of Aurizon Holdings Limited
Notes
Contributed equity
$mReserves
$m
Retained earnings
$m
Total equity
$m
Balance at 1 July 2017 1,206.6 3,473.0 342.5 5,022.1
Profit for the year – – 483.0 483.0
Other comprehensive expense 16(b) – (9.1) – (9.1)
Total comprehensive income for the year – (9.1) 483.0 473.9
Transactions with owners in their capacity as owners:
Buy-back of ordinary shares 16(a) (300.0) (0.3) – (300.3)
Dividends provided for or paid 15(a) – – (462.1) (462.1)
Share-based payments 16(b) – (3.5) – (3.5)
(300.0) (3.8) (462.1) (765.9)
Balance at 30 June 2018 906.6 3,460.1 363.4 4,730.1
Balance at 1 July 2016 1,206.6 3,424.7 1,082.3 5,713.6
Loss for the year – – (187.9) (187.9)
Other comprehensive income 16(b) – 32.0 – 32.0
Total comprehensive expense for the year – 32.0 (187.9) (155.9)
Transactions with owners in their capacity as owners:
Dividends provided for or paid 15(a) – – (551.9) (551.9)
Share-based payments 16(b) – 16.3 – 16.3
– 16.3 (551.9) (535.6)
Balance at 30 June 2017 1,206.6 3,473.0 342.5 5,022.1
The above consolidated statement of changes in equity should be read in conjunction with the accompanying notes.
FINANCIAL REPORT 49
For
per
sona
l use
onl
y
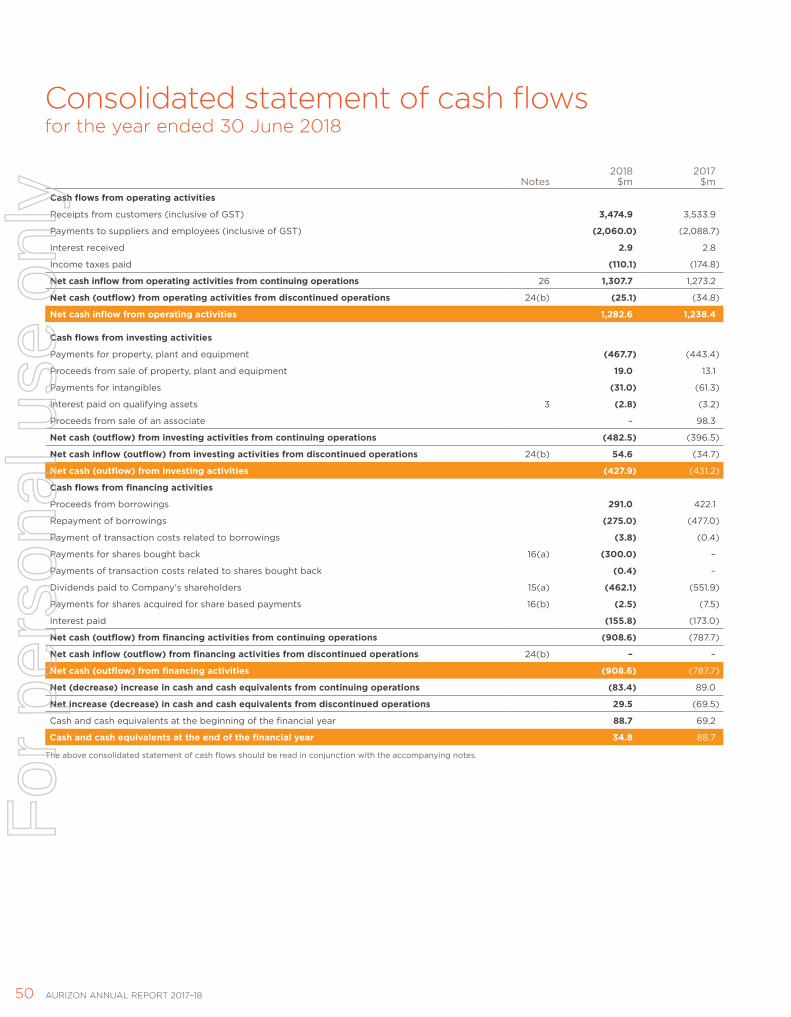
Consolidated statement of cash flowsfor the year ended 30 June 2018
Notes2018
$m2017
$m
Cash flows from operating activities
Receipts from customers (inclusive of GST) 3,474.9 3,533.9
Payments to suppliers and employees (inclusive of GST) (2,060.0) (2,088.7)
Interest received 2.9 2.8
Income taxes paid (110.1) (174.8)
Net cash inflow from operating activities from continuing operations 26 1,307.7 1,273.2
Net cash (outflow) from operating activities from discontinued operations 24(b) (25.1) (34.8)
Net cash inflow from operating activities 1,282.6 1,238.4
Cash flows from investing activities
Payments for property, plant and equipment (467.7) (443.4)
Proceeds from sale of property, plant and equipment 19.0 13.1
Payments for intangibles (31.0) (61.3)
Interest paid on qualifying assets 3 (2.8) (3.2)
Proceeds from sale of an associate – 98.3
Net cash (outflow) from investing activities from continuing operations (482.5) (3((((396.5))
Net cash inflow (outflow) from investing activities from discontinued operations 24(b) 54.6 (34.7)
Net cash (outflow) from investing activities (427.9) (431.2)
Cash flows from financing activities
Proceeds from borrowings 291.0 422.1
Repayment of borrowings (275.0) (477.0)
Payment of transaction costs related to borrowings (3.8) (0.4)
Payments for shares bought back 16(a) (300.0) –
Payments of transaction costs related to shares bought back (0.4) –
Dividends paid to Company's shareholders 15(a) (462.1) (551.9)
Payments for shares acquired for share based payments 16(b) (2.5) (7.5)
Interest paid (155.8) (173.0)
Net cash (outflow) from financing activities from continuing operations (908.6) (787.(787.7)
Net cash inflow (outflow) from financing activities from discontinued operations 24(b) – –
Net cash (outflow) from financing activities (908.6) (787.7)
Net (decrease) increase in cash and cash equivalents from continuing operations (83.4) 89.0
Net increase (decrease) in cash and cash equivalents from discontinued operations 29.5 (69.5)
Cash and cash equivalents at the beginning of the financial year 88.7 69.2
Cash and cash equivalents at the end of the financial year 34.8 88.7
The above consolidated statement of cash flows should be read in conjunction with the accompanying notes.
AURIZON ANNUAL REPORT 2017–1850
For
per
sona
l use
onl
y

Notes to the consolidated financial statements30 June 2018
About this reportAurizon Holdings Limited is a company limited by shares, incorporated and domiciled in Australia and is a for-profit entity for the purposes of preparing the financial statements. The financial statements are for the consolidated entity consisting of Aurizon Holdings Limited (the Company) and its subsidiaries and together are referred to as the Group or Aurizon.
The financial statements were approved for issue by the Directors on 12 August 2018. The Directors have the power to amend and reissue the financial statements.
The financial statements are general purpose financial statements which:
› Have been prepared in accordance with the requirements of the Corporations Act 2001, Australian Accounting Standards and Interpretations issued by the Australian Accounting Standards Board (AASB) and International Financial Reporting Standards (IFRS) issued by the International Accounting Standards Board (IASB)
› Have been prepared under the historical cost convention, as modified by the revaluation of financial assets and liabilities (including derivative instruments) at fair value
› Are presented in Australian dollars, with all amounts in the financial report being rounded off in accordance with ASIC Corporations (Rounding in Financial/Directors’ Reports) Instrument 2016/191 to the nearest hundred thousand dollars, unless otherwise indicated
› Where necessary, comparative information has been restated to conform with changes in presentation in the current year
› Adopt all new and amended Accounting Standards and Interpretations issued by the AASB that are relevant to the operations of the Group and effective for reporting periods beginning on or after 1 July 2017
› Equity account for associates listed at note 20
The notes to the financial statementsThe notes include information which is required to understand the financial statements and is material and relevant to the operations, financial position and performance of the Group. Information is considered material and relevant if, for example:
› The amount in question is significant because of its size or nature › It is important for understanding the results of the Group › It helps to explain the impact of significant changes in the Group’s
business – for example, acquisitions and impairment write downs › It relates to an aspect of the Group’s operations that is important
to its future performance
Significant and other accounting policies that summarise the measurement basis used and are relevant to an understanding of the financial statements are provided throughout the notes to the financial statements.
KEEPING IT SIMPLE The “Keeping it simple” explanations are designed to provide a high level overview of the accounting treatment of the more complex sections of the financial statements. Disclosures in the notes to the financial statements provide information required by the Accounting Standards or ASX Listing Rules. The notes provide explanations and additional disclosure to assist readers’ understanding and interpretation of the financial statements.
SIGNIFICANT JUDGEMENTS AND ESTIMATESIn the process of applying the Group’s accounting policies, management has made a number of judgements and applied estimates of future events. Details of the following judgements and estimates which are material to the financial statements can be found in the following notes:
NoteRevenue 2
Impairment 4
Income tax 5
Depreciation 9
Discontinued operation 24
Key events and transactions for reporting periodThe financial position and performance of the Group was particularly affected by the following events and transactions during the reporting period:
(a) Closure and sale of IntermodalOn 14 August 2017 the Group announced its intention to exit the Intermodal business through a combination of closure and sale.
Aurizon signed a binding agreement with Pacific National to sell its Acacia Ridge Intermodal Terminal. That transaction includes the transfer of approximately 30 employee positions, as well as assets, commercial and operational agreements.
Aurizon signed a separate binding agreement to sell its Queensland Intermodal business to a consortium of Linfox and Pacific National (QI BSA). The transaction includes the transfer of approximately 330 employee positions, as well as assets, commercial and operational arrangements to the Linfox and Pacific National consortium.
The transactions are subject to: › Approval by the Australian Competition & Consumer Commission
(ACCC); and › Approval by the Foreign Investment & Review Board (FIRB)
Total consideration for the two transactions is $225.0 million of which $45.0 million has been received to date.
The ACCC decision was announced on 19 July 2018. The ACCC decided to oppose both transactions and commenced proceedings against Pacific National and Aurizon in the Federal Court of Australia. The ACCC has sought declarations, pecuniary penalties, orders restraining the existing sale transactions from proceeding and costs. The ACCC has also sought an injunction to prevent Aurizon from closing its Queensland Intermodal business while proceedings are on foot. While Aurizon refutes the ACCC’s allegations and will defend the proceedings including seeking clearance of the Acacia Ridge transaction, there is a risk that the Acacia Ridge transaction will be prevented from completing and/or Aurizon incurs orders for pecuniary penalties and costs. There is also the risk that, in the interim whilst the matter is being determined by the Court, Aurizon is injuncted from closing the Queensland Intermodal business.
FINANCIAL REPORT 51
For
per
sona
l use
onl
y
Notes to the consolidated financial statements30 June 2018 (continued)
Key events and transactions for reporting period (continued)(a) Closure and sale of Intermodal (continued)On 12 August 2018 Aurizon provided Pacific National with a notice to terminate the Business Sale Agreement for the Queensland Intermodal business, with effect from 13 August 2018. It is Aurizon’s intention to not contest clearance of that transaction through the Federal Court and to exit the business. As clearance has not been obtained for the sale of the Queensland Intermodal business, $10 million of the consideration received for the transactions to date (recognised as a liability at 30 June 2018) will be refunded to Pacific National. The Business Sale Agreement for the Acacia Ridge Terminal remains in place while Aurizon seeks clearance of that transaction, and the remainder of the consideration received for the transactions to date ($35 million) is not refundable.
Notwithstanding this Aurizon remains committed to exiting the Intermodal business and on this basis has continued to classify the Acacia Ridge and Queensland Intermodal business assets as held for sale and discontinued operations at 30 June 2018.
On 10 August 2018 the Federal Court of Australia heard an application from the ACCC for an interlocutory injunction to require Aurizon to continue to operate the Queensland Intermodal business in the ordinary and usual course. The Court reserved judgement on the matter, and judgement is currently expected to be handed down on 13 August 2018.
Aurizon’s Interstate Intermodal business has been closed with the last operational service occurring on 23 December 2017. Approximately 160 employee positions were affected by the closure of the Interstate business.
The closure of Interstate Intermodal has resulted in $74.7 million of significant items being recognised in the year ended 30 June 2018. Significant Interstate Intermodal items include $61.0 million for contract, lease and supplier exit costs, $9.1 million in redundancy costs and asset write downs of $4.6 million.
(b) Access revenueOn 15 December 2017 the Queensland Competition Authority (QCA) issued a draft decision pertaining to Aurizon Network’s 2017 Draft Access Undertaking (UT5). The draft decision has proposed that Aurizon Network’s overall Maximum Allowable Revenue (MAR) for the regulatory period (FY18 to FY21) of the Undertaking is $3.893 billion, including a weighted average cost of capital of 5.41%.
In May 2018, the QCA approved transitional tariffs for the year ended 30 June 2018, set transitional tariffs for the period 1 July 2018 to 31 December 2018 and extended the 2016 Access Undertaking (UT4) to the earlier of 31 December 2018 or the date a replacement Undertaking takes effect.
Access revenue recognised in these financial statements is based on the transitional tariffs applying from 1 July 2017. Allowable revenue for the year ended 30 June 2018 on which the transitional tariffs were based may be different than the final approved UT5 revenue and will impact future year’s revenue. The true-up of revenues is expected to be dealt with as part of the final approval of UT5 and is dependent on future railings.
Revenue recognised for the year ended 30 June 2017 was based on the approved UT4 Undertaking tariffs, applied to actual volumes railed and included $89 million of prior years’ UT4 regulatory access true-ups (net of revenue cap of $31 million relating to the year ended 30 June 2015).
(c) Bulk contract exitThe Group had an iron ore Rail Haulage Agreement with Cliffs Asia Pacific Iron Ore Pty Ltd (Cliffs) that was due to expire 31 January 2022. The contract provided for haulage of up to 11mtpa and during the year ended 30 June 2018 the Group transported 7.8mt.
Cliffs formally advised the Group that it would be closing its Western Australia mining operations by 30 June 2018 including the ceasing of all rail services. On 29 June 2018, Cliffs issued a contract termination notice to the Group effective 30 June 2018. As a result, an early termination payment of $66.3 million (excluding GST) has been recognised as other income for the year ended 30 June 2018.
Aurizon has considered the financial impact of the contract termination and as a result an asset impairment of $27.9 million has been recognised for the year ended 30 June 2018. In addition, closure provisions of $3.9 million have been recognised which include a redundancy provision of $3.5 million in relation to 63 FTEs that serviced the Cliffs contract. The net contract exit benefit before cash generating unit (CGU) impairment is $34.5 million for the year ended 30 June 2018. Refer to (d) below.
(d) Impairment Western AustraliaAn impairment charge of $362.4 million under a value in use (VIU) methodology was recorded at 30 June 2017 for the Western Australia CGU as a result of the low long-term iron ore price, high cash operating costs for our customers, challenging and competitive bulk markets and deterioration in our operating performance. As a result of the loss of the Cliffs iron ore contract earlier than expected during the year, a further impairment charge of $31.7 million (in addition to (c) above) has been recognised for the Western Australia CGU at 30 June 2018.
Bulk EastAt 30 June 2017, an impairment charge of $163.5 million was recorded in respect of the Bulk East business using a fair value less costs of disposal (FVLCD) methodology. Additional sustaining capital has been incurred during the year ended 30 June 2018 which has resulted in a further impairment of $10.4 million.
(e) On-market share buy-back schemeOn 14 August 2017 the Company announced its intention to undertake an on-market buy-back of approximately $300.0 million, over a 12-month period. The on-market buy-back program was completed in March 2018 and the Company has acquired 61.6 million shares at a total consideration of $300.0 million.
(f) Debt refinancingIn November 2017 Aurizon Network Pty Ltd (a wholly owned subsidiary of the Group) replaced $525.0 million of its revolving bank debt facility with a 5 year $500.0 million revolving bank debt facility extending the maturity date to 20 October 2022.
(g) Business unit restructureFrom 1 July 2017 the organisational structure moved from a functional based model to a business unit model along the core areas of the business – Coal, Bulk (including Iron Ore), Network and Intermodal, as well as central support and planning functions. To reflect this reorganisation Aurizon changed its segment disclosure for financial year 2018 and the comparative period has also been restated.
AURIZON ANNUAL REPORT 2017–1852
For
per
sona
l use
onl
y

Results for the year
IN THIS SECTION
Results for the year provides segment information and a breakdown of individual line items in the consolidated income statement that the directors consider most relevant, including a summary of the accounting policies, judgements and estimates relevant to understanding these line items.
1 Segment information Page 54
2 Revenue and other income Page 57
3 Expenses Page 58
4 Impairment of non-financial assets Page 58
5 Income tax Page 60
6 Earnings per share Page 62
FINANCIAL REPORT FINANCIAL REPORT 53FINANCIAL REPORT
For
per
sona
l use
onl
y
Notes to the consolidated financial statements30 June 2018 (continued)
1 Segment information
KEEPING IT SIMPLE Segment reporting requires presentation of financial information based on the information that is internally provided to the Managing Director & CEO and the Executive Committee (chief operating decision makers).
As announced on 23 March 2017 Aurizon implemented the business unit structure on 1 July 2017. To reflect this reorganisation Aurizon changed its financial disclosure for financial year 2018 and the comparative period has also been restated. All future financial results will be disclosed under the new operating segments (Network, Coal, Bulk and Other) as it represents the operating structure of the Group. The Managing Director & CEO and the Executive Committee assess the performance of the Group based on the underlying EBIT.
Unless otherwise noted, the segment reporting information excludes discontinued operations, which represents the Intermodal business. Refer to note 24 for further details.
(a) Description of segmentsThe following summary describes the operations in each of the Group’s reportable segments:
NetworkProvision of access to, and operation of, the Central Queensland Coal Network (CQCN). Provision of maintenance and renewal of Network assets.
CoalTransport of coal from mines in Queensland and New South Wales to end customers and ports.
BulkTransport of bulk mineral commodities (including iron ore), agricultural products, mining and industrial inputs, and general freight throughout Queensland and Western Australia.
OtherIncludes provision of maintenance services to internal and external customers and central costs not allocated such as Board, Managing Director & CEO, company secretary and investor relations.
AURIZON ANNUAL REPORT 2017–1854
For
per
sona
l use
onl
y

Notes to the consolidated financial statements30 June 2018 (continued)
1 Segment information (continued)(b) Segment information
Network$m
Coal$m
Bulk$m
Other$m
Total continuing operations
$m
2018
External revenue
Revenue from external customers
Services revenue
Track access 581.5 598.1 – – 1,179.6
Freight transport – 1,207.8 590.5 – 1,798.3
Other services 7.3 0.2 24.9 36.9 69.3
Other revenue 37.7 0.6 0.4 26.8 65.5
Total revenue from external customers 626.5 1,806.7 615.8 63.7 3,112.7
Internal revenue
Services revenue
Track access 585.6 – – – 585.6
Freight transport – – 1.6 – 1.6
Other services 6.6 6.5 0.7 27.1 40.9
Total internal revenue 592.2 6.5 2.3 27.1 628.1
Total revenue 1,218.7 1,813.2 618.1 90.8 3,740.8
Other income – – – – –
Total revenue and other income 1,218.7 1,813.2 618.1 90.8 3,740.8
Internal elimination (628.1)
Consolidated revenue and other income 3,112.7
Continuing EBITDA (Underlying)* 788.6 611.2 75.2 (8.9) 1,466.1
Depreciation and amortisation (308.0) (182.6) (25.1) (9.8) (525.5)
Continuing EBIT (Underlying)* 480.6 428.6 50.1 (18.7) 940.6
Significant adjustments (note 1(c)) 25.7
EBIT* 966.3
Net finance costs (165.0)
Profit before income tax from continuing operations 801.3
* Refer to page 105 for Non-IFRS information
FINANCIAL REPORT 55
For
per
sona
l use
onl
y

Notes to the consolidated financial statements30 June 2018 (continued)
1 Segment information (continued)
Network$m
Coal$m
Bulk$m
Other$m
Total continuing operations
$m
2017
External revenue
Revenue from external customers
Services revenue
Track access 574.0 630.3 – – 1,204.3
Freight transport – 1,156.8 622.3 – 1,779.1
Other services 4.3 0.3 19.9 46.4 70.9
Other revenue 54.5 – 3.0 30.7 88.2
Total revenue from external customers 632.8 1,787.4 645.2 77.1 3,142.5
Internal revenue
Services revenue
Track access 625.9 – – – 625.9
Freight transport – 1.7 – 0.7 2.4
Other services 3.4 5.9 – 29.2 38.5
Total internal revenue 629.3 7.6 – 29.9 666.8
Total revenue 1,262.1 1,795.0 645.2 107.0 3,809.3
Other income – – – – –
Total revenue and other income 1,262.1 1,795.0 645.2 107.0 3,809.3
Internal elimination (666.8)
Consolidated revenue and other income 3,142.5
Continuing EBITDA (Underlying)* 780.4 603.7 59.1 8.3 1,451.5
Depreciation and amortisation (299.5) (183.7) (73.5) (10.6) (567.3)
Continuing EBIT (Underlying)* 480.9 420.0 (14.4) (2.3) 884.2
Significant adjustments (note 1(c)) (759.8)
EBIT* 124.4
Net finance costs (178.6)
Loss before income tax from continuing operations (54.2)
* Refer to page 105 for Non-IFRS information
AURIZON ANNUAL REPORT 2017–1856
For
per
sona
l use
onl
y
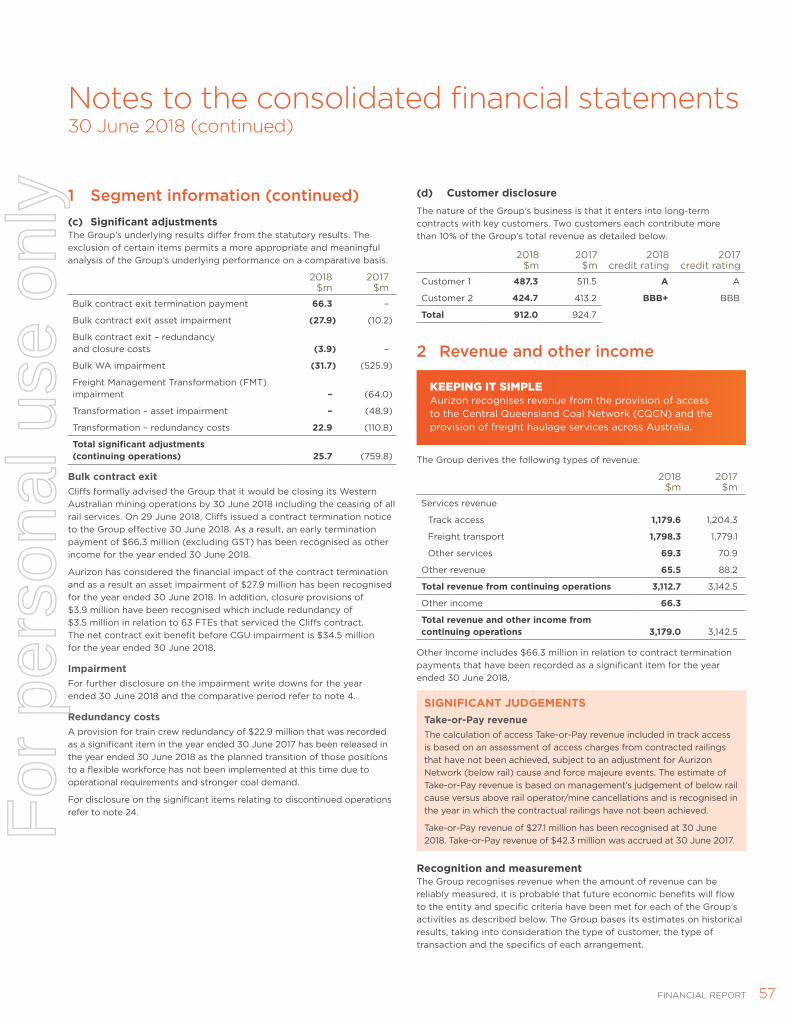
Notes to the consolidated financial statements30 June 2018 (continued)
1 Segment information (continued)(c) Significant adjustmentsThe Group’s underlying results differ from the statutory results. The exclusion of certain items permits a more appropriate and meaningful analysis of the Group’s underlying performance on a comparative basis.
2018 $m
2017 $m
Bulk contract exit termination payment 66.3 –
Bulk contract exit asset impairment (27.9) (10.2)
Bulk contract exit – redundancy and closure costs (3.9) –
Bulk WA impairment (31.7) (525.9)
Freight Management Transformation (FMT) impairment – (64.0)
Transformation – asset impairment – (48.9)
Transformation – redundancy costs 22.9 (110.8)
Total significant adjustments (continuing operations) 25.7 (759.8)
Bulk contract exitCliffs formally advised the Group that it would be closing its Western Australian mining operations by 30 June 2018 including the ceasing of all rail services. On 29 June 2018, Cliffs issued a contract termination notice to the Group effective 30 June 2018. As a result, an early termination payment of $66.3 million (excluding GST) has been recognised as other income for the year ended 30 June 2018.
Aurizon has considered the financial impact of the contract termination and as a result an asset impairment of $27.9 million has been recognised for the year ended 30 June 2018. In addition, closure provisions of $3.9 million have been recognised which include redundancy of $3.5 million in relation to 63 FTEs that serviced the Cliffs contract. The net contract exit benefit before CGU impairment is $34.5 million for the year ended 30 June 2018.
ImpairmentFor further disclosure on the impairment write downs for the year ended 30 June 2018 and the comparative period refer to note 4.
Redundancy costsA provision for train crew redundancy of $22.9 million that was recorded as a significant item in the year ended 30 June 2017 has been released in the year ended 30 June 2018 as the planned transition of those positions to a flexible workforce has not been implemented at this time due to operational requirements and stronger coal demand.
For disclosure on the significant items relating to discontinued operations refer to note 24.
(d) Customer disclosureThe nature of the Group’s business is that it enters into long-term contracts with key customers. Two customers each contribute more than 10% of the Group’s total revenue as detailed below.
2018 $m
2017 $m
2018 credit rating
2017 credit rating
Customer 1 487.3 511.5 A A
Customer 2 424.7 413.2 BBB+ BBB
Total 912.0 924.7
2 Revenue and other income
KEEPING IT SIMPLE Aurizon recognises revenue from the provision of access to the Central Queensland Coal Network (CQCN) and the provision of freight haulage services across Australia.
The Group derives the following types of revenue:
2018 $m
2017 $m
Services revenue
Track access 1,179.6 1,204.3
Freight transport 1,798.3 1,779.1
Other services 69.3 70.9
Other revenue 65.5 88.2
Total revenue from continuing operations 3,112.7 3,142.5
Other income 66.3
Total revenue and other income from continuing operations 3,179.0 3,142.5
Other income includes $66.3 million in relation to contract termination payments that have been recorded as a significant item for the year ended 30 June 2018.
SIGNIFICANT JUDGEMENTS Take-or-Pay revenue The calculation of access Take-or-Pay revenue included in track access is based on an assessment of access charges from contracted railings that have not been achieved, subject to an adjustment for Aurizon Network (below rail) cause and force majeure events. The estimate of Take-or-Pay revenue is based on management’s judgement of below rail cause versus above rail operator/mine cancellations and is recognised in the year in which the contractual railings have not been achieved.
Take-or-Pay revenue of $27.1 million has been recognised at 30 June 2018. Take-or-Pay revenue of $42.3 million was accrued at 30 June 2017.
Recognition and measurementThe Group recognises revenue when the amount of revenue can be reliably measured, it is probable that future economic benefits will flow to the entity and specific criteria have been met for each of the Group’s activities as described below. The Group bases its estimates on historical results, taking into consideration the type of customer, the type of transaction and the specifics of each arrangement.
FINANCIAL REPORT 57
For
per
sona
l use
onl
y
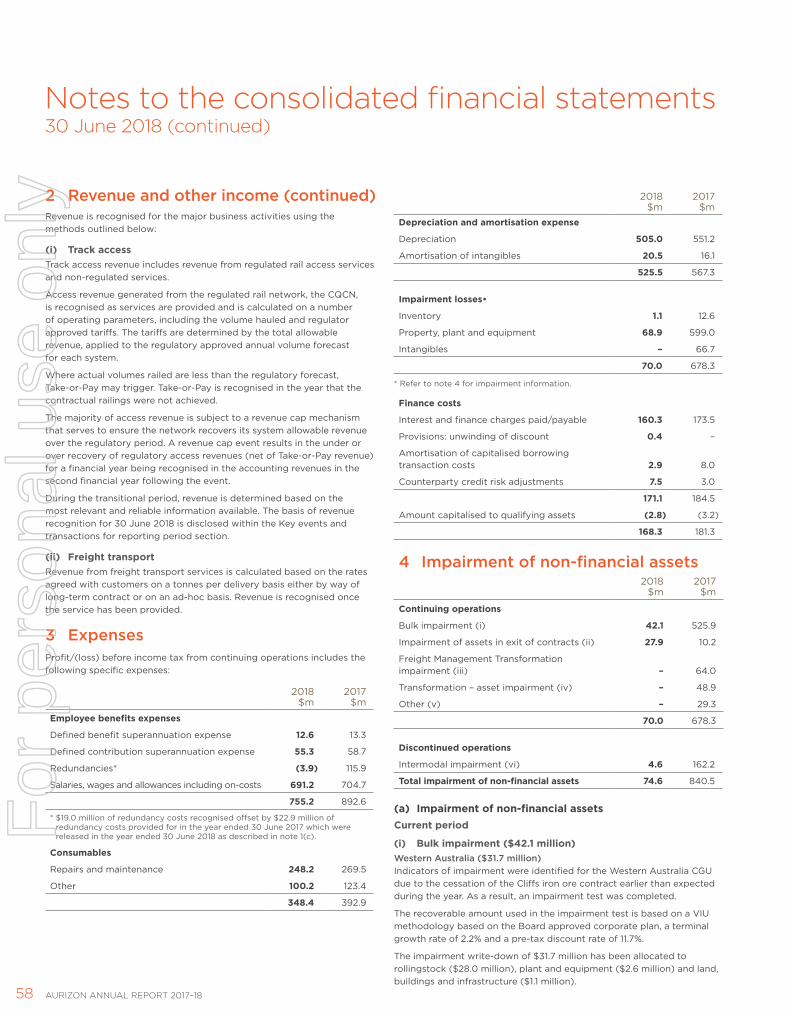
Notes to the consolidated financial statements30 June 2018 (continued)
Revenue is recognised for the major business activities using the methods outlined below:
(i) Track accessTrack access revenue includes revenue from regulated rail access services and non-regulated services.
Access revenue generated from the regulated rail network, the CQCN, is recognised as services are provided and is calculated on a number of operating parameters, including the volume hauled and regulator approved tariffs. The tariffs are determined by the total allowable revenue, applied to the regulatory approved annual volume forecast for each system.
Where actual volumes railed are less than the regulatory forecast, Take-or-Pay may trigger. Take-or-Pay is recognised in the year that the contractual railings were not achieved.
The majority of access revenue is subject to a revenue cap mechanism that serves to ensure the network recovers its system allowable revenue over the regulatory period. A revenue cap event results in the under or over recovery of regulatory access revenues (net of Take-or-Pay revenue) for a financial year being recognised in the accounting revenues in the second financial year following the event.
During the transitional period, revenue is determined based on the most relevant and reliable information available. The basis of revenue recognition for 30 June 2018 is disclosed within the Key events and transactions for reporting period section.
(ii) Freight transportRevenue from freight transport services is calculated based on the rates agreed with customers on a tonnes per delivery basis either by way of long-term contract or on an ad-hoc basis. Revenue is recognised once the service has been provided.
3 ExpensesProfit/(loss) before income tax from continuing operations includes the following specific expenses:
2018 $m
2017 $m
Employee benefits expenses
Defined benefit superannuation expense 12.6 13.3
Defined contribution superannuation expense 55.3 58.7
Redundancies* (3.9) 115.9
Salaries, wages and allowances including on-costs 691.2 704.7
755.2 892.6
* $19.0 million of redundancy costs recognised offset by $22.9 million of redundancy costs provided for in the year ended 30 June 2017 which were released in the year ended 30 June 2018 as described in note 1(c).
Consumables
Repairs and maintenance 248.2 269.5
Other 100.2 123.4
348.4 392.9
2018 $m
2017 $m
Depreciation and amortisation expense
Depreciation 505.0 551.2
Amortisation of intangibles 20.5 16.1
525.5 567.3
Impairment losses•
Inventory 1.1 12.6
Property, plant and equipment 68.9 599.0
Intangibles – 66.7
70.0 678.3
* Refer to note 4 for impairment information.
Finance costs
Interest and finance charges paid/payable 160.3 173.5
Provisions: unwinding of discount 0.4 –
Amortisation of capitalised borrowing transaction costs 2.9 8.0
Counterparty credit risk adjustments 7.5 3.0
171.1 184.5
Amount capitalised to qualifying assets (2.8) (3.2)
168.3 181.3
4 Impairment of non-financial assets2018
$m2017
$m
Continuing operations
Bulk impairment (i) 42.1 525.9
Impairment of assets in exit of contracts (ii) 27.9 10.2
Freight Management Transformation impairment (iii) – 64.0
Transformation – asset impairment (iv) – 48.9
Other (v) – 29.3
70.0 678.3
Discontinued operations
Intermodal impairment (vi) 4.6 162.2
Total impairment of non-financial assets 74.6 840.5
(a) Impairment of non-financial assets Current period
(i) Bulk impairment ($42.1 million) Western Australia ($31.7 million)Indicators of impairment were identified for the Western Australia CGU due to the cessation of the Cliffs iron ore contract earlier than expected during the year. As a result, an impairment test was completed.
The recoverable amount used in the impairment test is based on a VIU methodology based on the Board approved corporate plan, a terminal growth rate of 2.2% and a pre-tax discount rate of 11.7%.
The impairment write-down of $31.7 million has been allocated to rollingstock ($28.0 million), plant and equipment ($2.6 million) and land, buildings and infrastructure ($1.1 million).
2 Revenue and other income (continued)
AURIZON ANNUAL REPORT 2017–1858
For
per
sona
l use
onl
y

Notes to the consolidated financial statements30 June 2018 (continued)
4 Impairment of non-financial assets (continued)
Following the impairment, the residual carrying value of the assets of the Western Australia CGU as at 30 June 2018 is $170.7 million. The segment has a small number of customers and the VIU is sensitive to changes in customer contractual arrangements. Should any major contracts not be renewed or any remaining iron ore customers either cease to operate before the expected end of mine life or be unable to comply with current contractual arrangements then the CGU may become further impaired.
Bulk East ($10.4 million)At 30 June 2017, an impairment charge of $163.5 million was recorded in respect of the Bulk East business using a FVLCD methodology. Additional sustaining capital has been incurred during the year which has resulted in a further impairment of $10.4 million. This was not classified as a significant item.
(ii) Impairment of assets in exit of contracts ($27.9 million)As a result of Cliffs closing mining operations in Western Australia and the early termination of the rail haulage agreement with the Group in June 2018, $26.8 million of property, plant and equipment and $1.1 million of inventory was impaired at 30 June 2018.
(vi) Intermodal ($4.6 million)Due to the closure and sale of Intermodal, an asset write-down of $4.6 million has been allocated to software ($2.2 million), rollingstock ($1.1 million) and plant and equipment ($1.3 million).
Prior period(i) Bulk impairment ($525.9 million) Western Australia ($362.4 million)As a result of the low long-term iron ore price, high cash operating costs for our customers, challenging and competitive bulk markets, deterioration in operating performance and the changed business structure resulting in changes in cost allocations, a review of the operating cashflows of the Western Australia CGU was completed at 30 June 2017. A pre-tax impairment charge of $362.4 million was recorded. The residual carrying value of the assets at 30 June 2017 was $207.8 million.
Bulk East ($163.5 million)The Queensland CGU was separated into Bulk East and Coal Queensland. This change in CGU together with operational performance issues and loss of specific contracts experienced by the Bulk East CGU resulted in a pre-tax impairment charge of $163.5 million under a FVLCD methodology. The fair value was determined with reference to external and internal valuations for assets. The residual carrying value of the Bulk East CGU as at 30 June 2017 was $46.6 million.
(ii) Asset impairment as a result of contract exits ($10.2 million)As a result of a decision by Glencore to not renew its existing contract with Aurizon to haul mine inputs and outputs between Mt Isa and Townsville, a decision was made to cease operation of this daily multi-customer freight service from the contract expiry date of 31 January 2017. An impairment of $10.2 million relating to assets was recognised at 31 December 2016.
(iii) Freight Management Transformation (FMT) ($64.0 million)Following a review, it was decided to terminate the project and as a result an impairment charge of $64.0 million was recorded.
(iv) Transformation – asset impairment ($48.9 million)An impairment of $48.9 million was recorded as a result of a change in Queensland operations, the ongoing transformation program, various projects no longer proceeding and surplus assets.
(v) Impairment of other assets ($29.3 million)Other minor assets and projects totalling $29.3 million have also been impaired as a result of normal operations. These asset impairments were not classified as significant items.
(vi) Intermodal ($162.2 million)Due to the trading performance during the first half of financial year 2017 being lower than expectations, an impairment test was completed as at 31 December 2016 and updated at 30 June 2017. The recoverable amount used in the impairment test was based on a FVLCD methodology. The fair value was determined with reference to external and internal valuations for assets. The Intermodal CGU was impaired by $162.2 million with a residual value of $169.9 million as at 30 June 2017.
SIGNIFICANT JUDGEMENTS The Group considers annually whether there have been any indicators of impairment and then tests whether non-current assets have suffered any impairment, in accordance with the accounting policy stated in note 9.
Cash generating unitsThe recoverable amounts of CGUs for 30 June 2018 have been determined based on VIU calculations except for Bulk East, which is valued using FVLCD. The value in use is calculated based on a four-year Board approved corporate plan, a terminal growth rate of 2.2% per annum (2017: 1.5%) and a pre-tax discount rate ranging from 8.8% – 11.7% (2017: 9.1% – 11.8%). The value in use calculations indicate headroom to the carrying value of CGUs, with the exception of Western Australia. For the year ended 30 June 2018, the Western Australia CGU had indicators of impairment due to the cessation of services to a key iron ore customer during the year.
As a result, an impairment test was completed. The key assumptions used in the estimation of the recoverable amount of the Western Australia CGU are set out in note 4(a)(i-ii) above.
Following the impairment loss recognised in the Western Australia CGU for the year ended 30 June 2018, the recoverable amount is equal to the carrying amount. A change in assumption regarding the forecast cashflows may result in a change to the impairment recorded.
Individual non-current assetsEach period the Group is required to assess the recoverability of non-current assets. Each period the Enterprise Rollingstock Master Plan is reviewed. This is a ten-year plan and judgement has been applied to estimate forecast volumes and productivity, as well as the required level of contingent fleet, in determining the level of rollingstock required for the foreseeable future. Any changes to volumes and productivity, or a change in management’s view as to the level of contingent fleet required, could result in impairment or reversal of previous impairment in the future. The application of this judgement will continue to be assessed at each reporting date.
FINANCIAL REPORT 59
For
per
sona
l use
onl
y
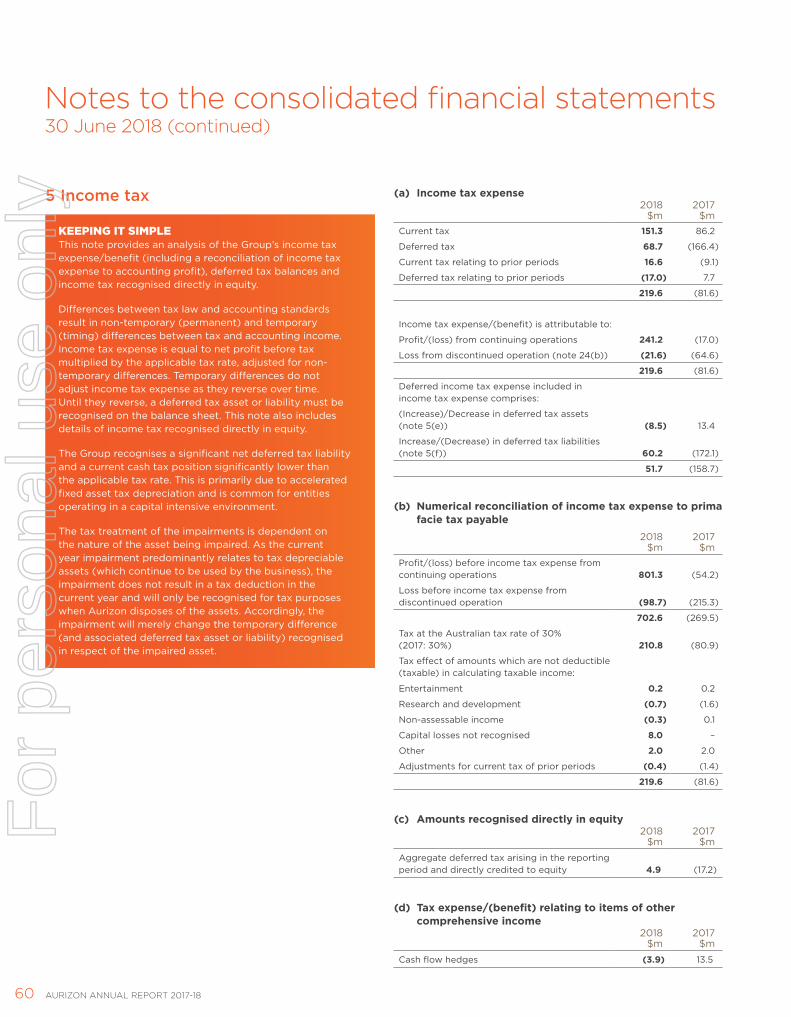
Notes to the consolidated financial statements30 June 2018 (continued)
5 Income tax
KEEPING IT SIMPLE This note provides an analysis of the Group’s income tax expense/benefit (including a reconciliation of income tax expense to accounting profit), deferred tax balances and income tax recognised directly in equity.
Differences between tax law and accounting standards result in non-temporary (permanent) and temporary (timing) differences between tax and accounting income. Income tax expense is equal to net profit before tax multiplied by the applicable tax rate, adjusted for non-temporary differences. Temporary differences do not adjust income tax expense as they reverse over time. Until they reverse, a deferred tax asset or liability must be recognised on the balance sheet. This note also includes details of income tax recognised directly in equity.
The Group recognises a significant net deferred tax liability and a current cash tax position significantly lower than the applicable tax rate. This is primarily due to accelerated fixed asset tax depreciation and is common for entities operating in a capital intensive environment.
The tax treatment of the impairments is dependent on the nature of the asset being impaired. As the current year impairment predominantly relates to tax depreciable assets (which continue to be used by the business), the impairment does not result in a tax deduction in the current year and will only be recognised for tax purposes when Aurizon disposes of the assets. Accordingly, the impairment will merely change the temporary difference (and associated deferred tax asset or liability) recognised in respect of the impaired asset.
(a) Income tax expense2018
$m2017
$mCurrent tax 151.3 86.2
Deferred tax 68.7 (166.4)
Current tax relating to prior periods 16.6 (9.1)
Deferred tax relating to prior periods (17.0) 7.7
219.6 (81.6)
Income tax expense/(benefit) is attributable to:
Profit/(loss) from continuing operations 241.2 (17.0)
Loss from discontinued operation (note 24(b)) (21.6) (64.6)
219.6 (81.6)
Deferred income tax expense included in income tax expense comprises:
(Increase)/Decrease in deferred tax assets (note 5(e)) (8.5) 13.4
Increase/(Decrease) in deferred tax liabilities (note 5(f)) 60.2 (172.1)
51.7 (158.7)
(b) Numerical reconciliation of income tax expense to prima facie tax payable
2018 $m
2017 $m
Profit/(loss) before income tax expense from continuing operations 801.3 (54.2)
Loss before income tax expense from discontinued operation (98.7) (215.3)
702.6 (269.5)
Tax at the Australian tax rate of 30% (2017: 30%) 210.8 (80.9)
Tax effect of amounts which are not deductible (taxable) in calculating taxable income:
Entertainment 0.2 0.2
Research and development (0.7) (1.6)
Non-assessable income (0.3) 0.1
Capital losses not recognised 8.0 –
Other 2.0 2.0
Adjustments for current tax of prior periods (0.4) (1.4)
219.6 (81.6)
(c) Amounts recognised directly in equity2018
$m2017
$m
Aggregate deferred tax arising in the reporting period and directly credited to equity 4.9 (17.2)
(d) Tax expense/(benefit) relating to items of other comprehensive income
2018 $m
2017 $m
Cash flow hedges (3.9) 13.5
60 AURIZON ANNUAL REPORT 2017-18
For
per
sona
l use
onl
y

Notes to the consolidated financial statements30 June 2018 (continued)
5 Income tax (continued)(e) Deferred tax assets
2018$m
2017$m
Total deferred tax assets 199.1 191.6
Set-off of deferred tax liabilities pursuant to set-off provisions (199.1) (191.6)
Net deferred tax assets – –
The table below outlines the temporary differences and movements in those temporary differences that comprise the deferred tax assets:
Movements
Provisions/ accruals
$m
Customer contracts
$m
Unearned revenue
$m
Financial instruments
$mOther
$mTotal
$m
At 1 July 2017 130.8 22.5 – 24.2 14.1 191.6
(Charged)/credited
- to profit or loss (9.5) (7.8) 11.9 13.8 0.1 8.5
- to other comprehensive income – – – 3.9 – 3.9
- directly to equity – – – – (4.9) (4.9)
At 30 June 2018 121.3 14.7 11.9 41.9 9.3 199.1
At 1 July 2016 125.7 32.8 0.3 38.3 4.2 201.3
(Charged)/credited
– to profit or loss 5.1 (10.3) (0.3) (0.6) (7.3) (13.4)
– to other comprehensive income – – – (13.5) – (13.5)
– directly to equity – – – – 17.2 17.2
At 30 June 2017 130.8 22.5 – 24.2 14.1 191.6
(f) Deferred tax liabilities
2018$m
2017$m
Total deferred tax liabilities 678.6 618.4
Set-off of deferred tax liabilities pursuant to set-off provisions (199.1) (191.6)
Net deferred tax liabilities 479.5 426.8
The table below outlines the temporary differences and movements in those temporary differences that comprise the deferred tax liabilities:
Movements
Non-current assets
$m
Consumables and spares
$m
Accrued income
$m
Financial instruments
$mOther
$mTotal
$m
At 1 July 2017 588.3 5.2 2.6 22.1 0.2 618.4
Charged/(credited)
– profit or loss 54.0 (4.0) (0.9) 11.5 (0.4) 60.2
At 30 June 2018 642.3 1.2 1.7 33.6 (0.2) 678.6
At 1 July 2016
Charged/(credited) 756.3 10.3 0.3 23.2 0.4 790.5
– profit or loss (168.0) (5.1) 2.3 (1.1) (0.2) (172.1)
At 30 June 2017 588.3 5.2 2.6 22.1 0.2 618.4
FINANCIAL REPORT 61
For
per
sona
l use
onl
y
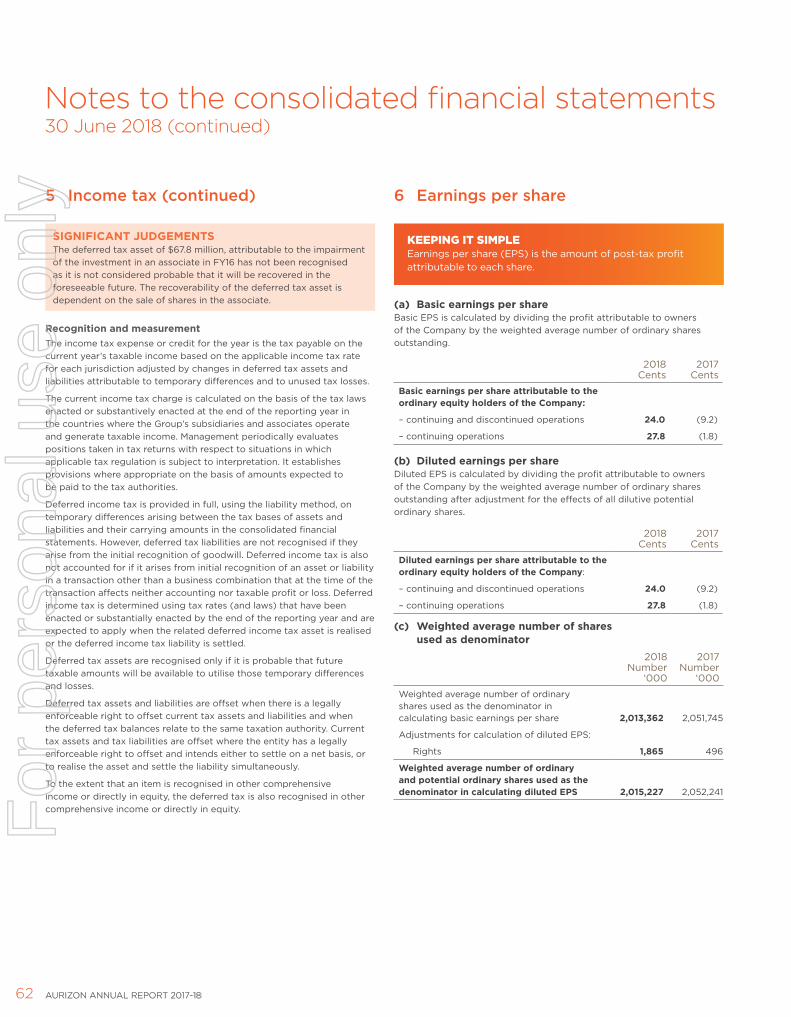
5 Income tax (continued)
SIGNIFICANT JUDGEMENTS The deferred tax asset of $67.8 million, attributable to the impairment of the investment in an associate in FY16 has not been recognised as it is not considered probable that it will be recovered in the foreseeable future. The recoverability of the deferred tax asset is dependent on the sale of shares in the associate.
Recognition and measurementThe income tax expense or credit for the year is the tax payable on the current year’s taxable income based on the applicable income tax rate for each jurisdiction adjusted by changes in deferred tax assets and liabilities attributable to temporary differences and to unused tax losses.
The current income tax charge is calculated on the basis of the tax laws enacted or substantively enacted at the end of the reporting year in the countries where the Group’s subsidiaries and associates operate and generate taxable income. Management periodically evaluates positions taken in tax returns with respect to situations in which applicable tax regulation is subject to interpretation. It establishes provisions where appropriate on the basis of amounts expected to be paid to the tax authorities.
Deferred income tax is provided in full, using the liability method, on temporary differences arising between the tax bases of assets and liabilities and their carrying amounts in the consolidated financial statements. However, deferred tax liabilities are not recognised if they arise from the initial recognition of goodwill. Deferred income tax is also not accounted for if it arises from initial recognition of an asset or liability in a transaction other than a business combination that at the time of the transaction affects neither accounting nor taxable profit or loss. Deferred income tax is determined using tax rates (and laws) that have been enacted or substantially enacted by the end of the reporting year and are expected to apply when the related deferred income tax asset is realised or the deferred income tax liability is settled.
Deferred tax assets are recognised only if it is probable that future taxable amounts will be available to utilise those temporary differences and losses.
Deferred tax assets and liabilities are offset when there is a legally enforceable right to offset current tax assets and liabilities and when the deferred tax balances relate to the same taxation authority. Current tax assets and tax liabilities are offset where the entity has a legally enforceable right to offset and intends either to settle on a net basis, or to realise the asset and settle the liability simultaneously.
To the extent that an item is recognised in other comprehensive income or directly in equity, the deferred tax is also recognised in other comprehensive income or directly in equity.
6 Earnings per share
KEEPING IT SIMPLE Earnings per share (EPS) is the amount of post-tax profit attributable to each share.
(a) Basic earnings per shareBasic EPS is calculated by dividing the profit attributable to owners of the Company by the weighted average number of ordinary shares outstanding.
2018 Cents
2017 Cents
Basic earnings per share attributable to the ordinary equity holders of the Company:
– continuing and discontinued operations 24.0 (9.2)
– continuing operations 27.8 (1.8)
(b) Diluted earnings per shareDiluted EPS is calculated by dividing the profit attributable to owners of the Company by the weighted average number of ordinary shares outstanding after adjustment for the effects of all dilutive potential ordinary shares.
2018 Cents
2017 Cents
Diluted earnings per share attributable to the ordinary equity holders of the Company:
– continuing and discontinued operations 24.0 (9.2)
– continuing operations 27.8 (1.8)
(c) Weighted average number of shares used as denominator
2018 Number
‘000
2017 Number
‘000
Weighted average number of ordinary shares used as the denominator in calculating basic earnings per share 2,013,362 2,051,745
Adjustments for calculation of diluted EPS:
Rights 1,865 496
Weighted average number of ordinary and potential ordinary shares used as the denominator in calculating diluted EPS 2,015,227 2,052,241
Notes to the consolidated financial statements30 June 2018 (continued)
AURIZON ANNUAL REPORT 2017–1862 AURIZON ANNUAL REPORT 2017–18AURIZON ANNUAL REPORT 2017-18
For
per
sona
l use
onl
y
Operating assets and liabilities
IN THIS SECTION
Operating assets and liabilities provides information about the working capital of the Group and major balance sheet items including the accounting policies, judgements and estimates relevant to understanding these items.
7 Trade and other receivables Page 64
8 Inventories Page 64
9 Property, plant and equipment Page 65
10 Intangible assets Page 67
11 Trade and other payables Page 68
12 Provisions Page 68
13 Other liabilities Page 69
63FINANCIAL REPORT
For
per
sona
l use
onl
y

Notes to the consolidated financial statements30 June 2018 (continued)
7 Trade and other receivables2018
$m2017
$m
Current
Trade receivables 435.1 350.7
Provision for impairment of receivables (27.7) (27.2)
Net trade receivables 407.4 323.5
Other receivables* 123.5 173.3
530.9 496.8* Other receivables predominantly relate to accrued revenue.
Past due but not impaired These trade receivables relate to a number of customers for whom there is no recent history of default and there is no expectation that they will default. The ageing of past due but not impaired trade receivables are as follows:
2018 $m
2017 $m
Up to three months 4.9 9.4
Three to six months – 0.5
Over six months 3.0 1.5
7.9 11.4
Recognition and measurementTrade receivables generally have credit terms ranging from seven to 31 days. They are presented as current assets unless collection is not expected for more than 12 months after the reporting date.
The Group applies the simplified approach to providing for expected credit losses prescribed by AASB 9, which requires the use of the lifetime expected loss provision for all trade receivables. Trade receivables have not had a significant increase in credit risk since they were originated.
8 Inventories2018
$m2017
$m
Current
Raw materials and stores – at cost 133.1 135.8
Work in progress – at cost 0.2 2.2
Provision for inventory obsolescence (15.2) (26.2)
118.1 111.8
Non-current
Raw materials and stores – at cost 44.8 47.4
Provision for inventory obsolescence (15.7) (11.9)
29.1 35.5
Recognition and measurement Inventories include infrastructure and rollingstock items held in centralised stores, workshops and depots. Inventories are measured at the lower of cost and net realisable value. Cost is determined predominantly on an average cost basis.
Items expected to be consumed after more than one year are classified as non-current.
The provision for inventory obsolescence is based on assessments by management of particular inventory classes and relates specifically to infrastructure and rollingstock maintenance items. The amount of the provision is based on a proportion of the value of damaged stock, slow moving stock and stock that has become obsolete during the reporting period.
64 AURIZON ANNUAL REPORT 2016–17AURIZON ANNUAL REPORT 2017-18
For
per
sona
l use
onl
y

Notes to the consolidated financial statements30 June 2018 (continued)
9 Property, plant and equipmentAssets under construction
$mLand
$mBuildings
$m
Plant and equipment
$mRollingstock
$mInfrastructure
$mTotal
$m
2018
Opening net book amount 184.8 159.7 273.5 377.0 2,329.2 5,510.8 8,835.0
Additions 502.4 – – – – – 502.4
Transfers between asset classes (406.4) (0.1) (2.3) 20.6 131.5 263.6 6.9
Disposals – (2.3) (7.7) (10.9) (4.9) (7.1) (32.9)
Impairment* (5.2) – (3.5) (3.9) (53.1) (5.6) (71.3)
Assets classified as held for sale (0.3) (30.8) (6.8) (10.3) (13.2) (11.8) (73.2)
Depreciation** – – (21.9) (44.9) (157.8) (282.4) (507.0)
Closing net book amount 275.3 126.5 231.3 327.6 2,231.7 5,467.5 8,659.9
At 30 June 2018
Cost or fair value 275.3 126.5 499.4 756.8 5,081.0 7,468.6 14,207.6
Accumulated depreciation and impairment – – (268.1) (429.2) (2,849.3) (2,001.1) (5,547.7)
Net book amount 275.3 126.5 231.3 327.6 2,231.7 5,467.5 8,659.9
Owned 275.3 102.7 223.2 327.6 2,231.7 975.8 4,136.3
Leased – 23.8 8.1 – – 4,491.7 4,523.6
275.3 126.5 231.3 327.6 2,231.7 5,467.5 8,659.9
2017
Opening net book amount 385.4 160.5 340.9 389.6 2,823.4 5,619.4 9,719.2
Additions 468.3 – – – – – 468.3
Transfers between asset classes (634.2) 1.9 32.8 117.5 193.9 288.1 –
Disposals – (1.8) (2.8) (6.1) (3.5) (8.8) (23.0)
Impairment* (34.7) (0.9) (75.1) (58.9) (483.5) (106.9) (760.0)
Assets classified as held for sale – – (1.4) – – (0.2) (1.6)
Depreciation** – – (20.9) (65.1) (201.1) (280.8) (567.9)
Closing net book amount 184.8 159.7 273.5 377.0 2,329.2 5,510.8 8,835.0
At 30 June 2017
Cost 184.8 159.7 526.2 793.4 5,140.2 7,266.3 14,070.6
Accumulated depreciation and impairment – – (252.7) (416.4) (2,811.0) (1,755.5) (5,235.6)
Net book amount 184.8 159.7 273.5 377.0 2,329.2 5,510.8 8,835.0
Owned 184.8 135.9 264.4 377.0 2,329.2 968.5 4,259.8
Leased – 23.8 9.1 – – 4,542.3 4,575.2
184.8 159.7 273.5 377.0 2,329.2 5,510.8 8,835.0
* Impairment of $71.3 million (2017: $760.0 million) includes impairment from continuing operations of $68.9 million (2017: $599.0 million) (note 3) and discontinued operations of $2.4 million (2017: $161.0 million) (note 24).
** Depreciation of $507.0 million (2017: $567.9 million) includes depreciation from continuing operations of $505.0 million (2017: $551.2 million) (note 3) and discontinued operations of $2.0 million (2017: $16.7 million) (note 24).
FINANCIAL REPORT 65
For
per
sona
l use
onl
y

Notes to the consolidated financial statements30 June 2018 (continued)
9 Property, plant and equipment (continued)
SIGNIFICANT JUDGEMENTS (i) DepreciationThe Group estimates the useful lives and residual values of property, plant and equipment based on the expected period of time over which economic benefits from use of the asset will be derived. The Group reviews useful life assumptions on an annual basis having given consideration to variables including historical and forecast usage rates, technological advancements and changes in legal and economic conditions. Any change in useful lives and residual values of property, plant and equipment is accounted for prospectively.
Recognition and measurement(i) Initial recognition and measurementLand, buildings, plant and equipment, rollingstock and assets under constructionBuildings, plant and equipment, and rollingstock are carried at cost less accumulated depreciation. Non-corridor land owned by the Group and assets under construction are carried at cost. Cost includes expenditure that is directly attributable to the acquisition of the asset or the fair value of the other consideration given to acquire an asset at the time of its acquisition or construction. Costs attributable to assets under construction are only capitalised when it is probable that future economic benefits associated with the asset will flow to the Group and the costs can be measured reliably. Cost may also include transfers from equity of any gains or losses on qualifying cash flow hedges of foreign currency purchases of property, plant and equipment, and capitalised interest.
Corridor land owned by the State is leased to Aurizon Network Pty Ltd at a rental of $1 per year if demanded. The leases expire on 30 June 2109.
Leased coal infrastructureCoal infrastructure assets are owned by (a) the State, with respect to the CQCN and (b) Queensland Rail, with respect to the North Coast Line (each referred to as the Infrastructure Lessor). Under each infrastructure lease the infrastructure is leased to Aurizon Network Pty Ltd, a wholly-owned subsidiary. The term of each lease is 99 years (at a rate of $1 per year), unless the Infrastructure Lessor exercises an option to extend its lease for a further 99 years. The notice period for the Infrastructure Lessor to renew or allow expiry of the lease is not less than 20 years prior to the end of the 99-year term. This has been accounted for as a finance lease.
(ii) Subsequent costsSubsequent costs are included in the asset’s carrying amount or recognised as a separate asset, as appropriate, only when it is probable that future economic benefits associated with the item will flow to the Group and the cost of the item can be measured reliably. The carrying amount of any component accounted for as a separate asset is derecognised when replaced. All other repairs and maintenance are charged to the income statement during the reporting period in which they are incurred.
(iii) Depreciation and amortisationAssets are depreciated or amortised from the date of acquisition, or, in respect of internally constructed or manufactured assets, from the time an asset is completed and held ready for use.
Buildings, infrastructure, rollingstock, plant and equipment are depreciated using the straight-line method to allocate their costs, net of their residual values, over their estimated useful lives. Motor vehicles are depreciated using the diminishing value method (percentages range from 13.6% to 35.0%). Land and assets under construction are not depreciated.
The Group builds mine-specific infrastructure for customers and provides access to those clients under access facilitation deeds. Infrastructure controlled by the Group under these deeds is depreciated over the term of the deed, except where economic benefits are expected to flow to the Group after the end of the term of the deed.
The depreciation and amortisation rates used during the year were based on the following range of useful lives:
- Owned and leased infrastructure 7–100 years
- Buildings 10–40 years
- Rollingstock 8–35 years
- Plant and equipment 3–20 years
- Leased property 3–40 years
The depreciation and amortisation rates are reviewed annually and adjusted if appropriate. An asset’s carrying amount is written down to its recoverable amount if the asset’s carrying amount is greater than its estimated recoverable amount.
(iv) DerecognitionAn item of property, plant and equipment is derecognised when it is disposed of or no future economic benefits are expected from its use or disposal. Gains and losses on disposals are determined by comparing proceeds with the carrying amount and are recognised in the income statement.
(v) Impairment of assetsAssets are tested for impairment whenever events or changes in circumstances indicate that the carrying amount may not be recoverable.
An impairment loss is recognised for the amount by which the asset’s carrying amount exceeds its recoverable amount. For the purposes of assessing impairment, assets are grouped at the lowest levels for which there are separately identifiable cashflows which are largely independent of the cashflows from other assets or groups of assets (CGUs).
The recoverable amount is the greater of an asset’s FVLCD and VIU. In assessing VIU, the estimated future cashflows are discounted to their present value using a pre-tax discount rate that reflects current market assessments of the time value of money and the risks specific to the asset.
Impairment losses are recognised in the income statement. After the recognition of an impairment loss, the depreciation (amortisation) charge for the asset is adjusted in future periods to allocate the asset’s revised carrying amount, less its residual value (if any), on a systematic basis over its remaining useful life. Impairment losses, if any, recognised in respect of CGUs are allocated first to reduce the carrying amount of any goodwill allocated to CGUs and then to reduce the carrying amount of other assets in the unit on a pro-rata basis.
Non-financial assets that suffered impairment are reviewed for possible reversal of impairment at each reporting period.
AURIZON ANNUAL REPORT 2017–1866
For
per
sona
l use
onl
y
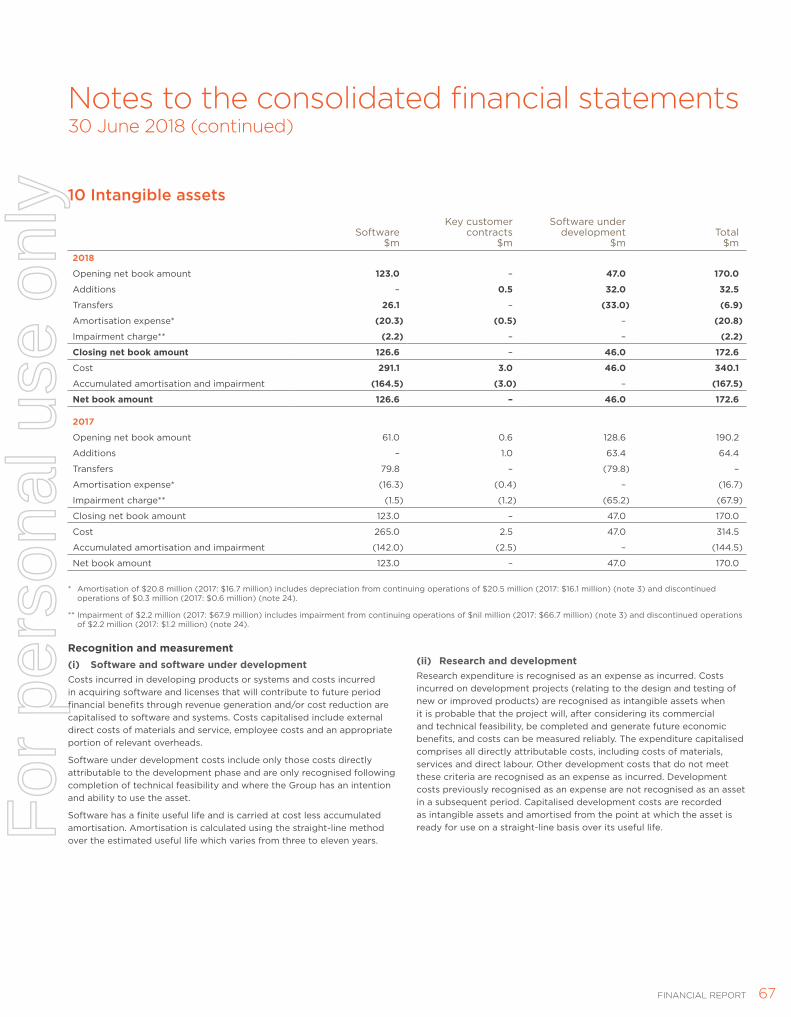
Notes to the consolidated financial statements30 June 2018 (continued)
10 Intangible assets
Software $m
Key customer contracts
$m
Software under development
$mTotal
$m2018
Opening net book amount 123.0 – 47.0 170.0
Additions – 0.5 32.0 32.5
Transfers 26.1 – (33.0) (6.9)
Amortisation expense* (20.3) (0.5) – (20.8)
Impairment charge** (2.2) – – (2.2)
Closing net book amount 126.6 – 46.0 172.6
Cost 291.1 3.0 46.0 340.1
Accumulated amortisation and impairment (164.5) (3.0) – (167.5)
Net book amount 126.6 – 46.0 172.6
2017
Opening net book amount 61.0 0.6 128.6 190.2
Additions – 1.0 63.4 64.4
Transfers 79.8 – (79.8) –
Amortisation expense* (16.3) (0.4) – (16.7)
Impairment charge** (1.5) (1.2) (65.2) (67.9)
Closing net book amount 123.0 – 47.0 170.0
Cost 265.0 2.5 47.0 314.5
Accumulated amortisation and impairment (142.0) (2.5) – (144.5)
Net book amount 123.0 – 47.0 170.0
* Amortisation of $20.8 million (2017: $16.7 million) includes depreciation from continuing operations of $20.5 million (2017: $16.1 million) (note 3) and discontinued operations of $0.3 million (2017: $0.6 million) (note 24).
** Impairment of $2.2 million (2017: $67.9 million) includes impairment from continuing operations of $nil million (2017: $66.7 million) (note 3) and discontinued operations of $2.2 million (2017: $1.2 million) (note 24).
Recognition and measurement (i) Software and software under developmentCosts incurred in developing products or systems and costs incurred in acquiring software and licenses that will contribute to future period financial benefits through revenue generation and/or cost reduction are capitalised to software and systems. Costs capitalised include external direct costs of materials and service, employee costs and an appropriate portion of relevant overheads.
Software under development costs include only those costs directly attributable to the development phase and are only recognised following completion of technical feasibility and where the Group has an intention and ability to use the asset.
Software has a finite useful life and is carried at cost less accumulated amortisation. Amortisation is calculated using the straight-line method over the estimated useful life which varies from three to eleven years.
(ii) Research and developmentResearch expenditure is recognised as an expense as incurred. Costs incurred on development projects (relating to the design and testing of new or improved products) are recognised as intangible assets when it is probable that the project will, after considering its commercial and technical feasibility, be completed and generate future economic benefits, and costs can be measured reliably. The expenditure capitalised comprises all directly attributable costs, including costs of materials, services and direct labour. Other development costs that do not meet these criteria are recognised as an expense as incurred. Development costs previously recognised as an expense are not recognised as an asset in a subsequent period. Capitalised development costs are recorded as intangible assets and amortised from the point at which the asset is ready for use on a straight-line basis over its useful life.
FINANCIAL REPORT 67
For
per
sona
l use
onl
y

Notes to the consolidated financial statements30 June 2018 (continued)
11 Trade and other payables2018
$m2017
$mCurrent liabilitiesTrade payables 247.7 273.8
Other payables 28.1 35.9
275.8 309.7
Recognition and measurementThese amounts represent liabilities for goods and services provided to the Group prior to the end of financial year which are unpaid. The amounts are unsecured and are usually paid within 45 days or within the terms agreed with the supplier.
12 Provisions2018
$m2017
$mCurrentEmployee benefits (a) 244.1 277.5
Provision for insurance claims 3.9 2.2
Litigation and workers compensation provision 24.9 24.6
Other provisions* 39.3 10.2
312.2 314.5
Non-currentEmployee benefits (a) 15.7 20.7
Litigation and workers compensation provision 11.2 11.5
Decommissioning/make good 3.0 1.0
Land rehabilitation 37.4 40.5
Other provisions* 14.9 5.0
82.2 78.7
Total provisions 394.4 393.2
(a) Employee benefits 2018
$m2017
$m
Annual leave 55.1 59.7
Long service leave 113.6 127.8
Other** 91.1 110.7
259.8 298.2
* Included in other provisions are provisions for closure costs** Included in other employee benefits are bonuses, retirement allowances,
termination benefits and payroll tax on leave
The current provision for employee benefits includes accrued annual leave, leave loading, retirement allowances, long service leave, bonuses and redundancy provision. Included in long service leave are all unconditional entitlements where employees have completed the required period of service and also a provision for the probability that employees will reach the required period of service. Based on past experience, the Group does not expect all employees to take the full amount of accrued leave or require payment within the next 12 months. The current provision for employee benefits includes an amount of $105.9 million (2017: $95.7 million) that is not expected to be taken or paid within the next 12 months.
Details of employee benefits(i) Short-term obligationsLiabilities for wages and salaries, including non-monetary benefits and accumulating annual leave and leave loading that are expected to be settled wholly within 12 months after the end of the period in which the employees render the related service, are recognised in respect of employees’ services up to the end of the reporting period and are measured at the amounts expected to be paid when the liabilities are settled. The short-term employee benefit obligations are recognised in the provision for employee benefits.
(ii) Other long-term employee benefit obligationsThe liabilities for retirement allowance and long service leave that are not expected to be settled wholly within 12 months after the end of the period in which the employees render the related service, are measured as the present value of expected future payments to be made in respect of services provided by employees up to the end of the reporting period using the projected unit credit method. Remeasurements as a result of experience adjustments and changes in actuarial assumptions are recognised in profit or loss.
The obligations are presented as current liabilities in the balance sheet if the entity does not have an unconditional right to defer settlement for at least 12 months after the reporting period, regardless of when the actual settlement is expected to occur. Benefits falling due more than 12 months after the end of the reporting period are discounted to present value.
(iii) Bonus plansThe Group recognises a liability for bonuses based on a formula that takes into consideration the Group and individual key performance indicators. The Group recognises a provision where contractually obliged or where there is a past practice that has created a constructive obligation.
(iv) Termination benefitsTermination benefits are payable when the Group decides to terminate the employment, or when an employee accepts voluntary redundancy in exchange for these benefits. The Group recognises termination benefits at the earlier of the following dates: (a) when the Group can no longer withdraw the offer of those benefits; and (b) when the Group recognises costs for a restructuring that is within the scope of AASB 137 and involves the payment of termination benefits. In the case of an offer made to encourage voluntary redundancy, the termination benefits are measured based on the number of employees expected to accept the offer. Benefits falling due more than 12 months after the end of the reporting period are discounted to present value.
(v) SuperannuationThe Group pays an employer subsidy to the Government Superannuation Office in respect of employees who are contributors to the Public Sector Superannuation (QSuper) scheme.
Employer contributions to the QSuper Defined Benefit Fund are determined by the State of Queensland Treasurer having regard to advice from the State Actuary. The primary obligation to fund the defined benefits obligations are that of the State. However, the Treasurer has the discretion to request contributions from employers that contribute to the defined benefit category of QSuper. No liability is recognised for accruing superannuation benefits as this liability is held on a whole of Government basis and reported in the whole of Government financial statements. The State Actuary performs a full actuarial valuation of the assets and liabilities of the fund at least every three years.
AURIZON ANNUAL REPORT 2017–1868
For
per
sona
l use
onl
y
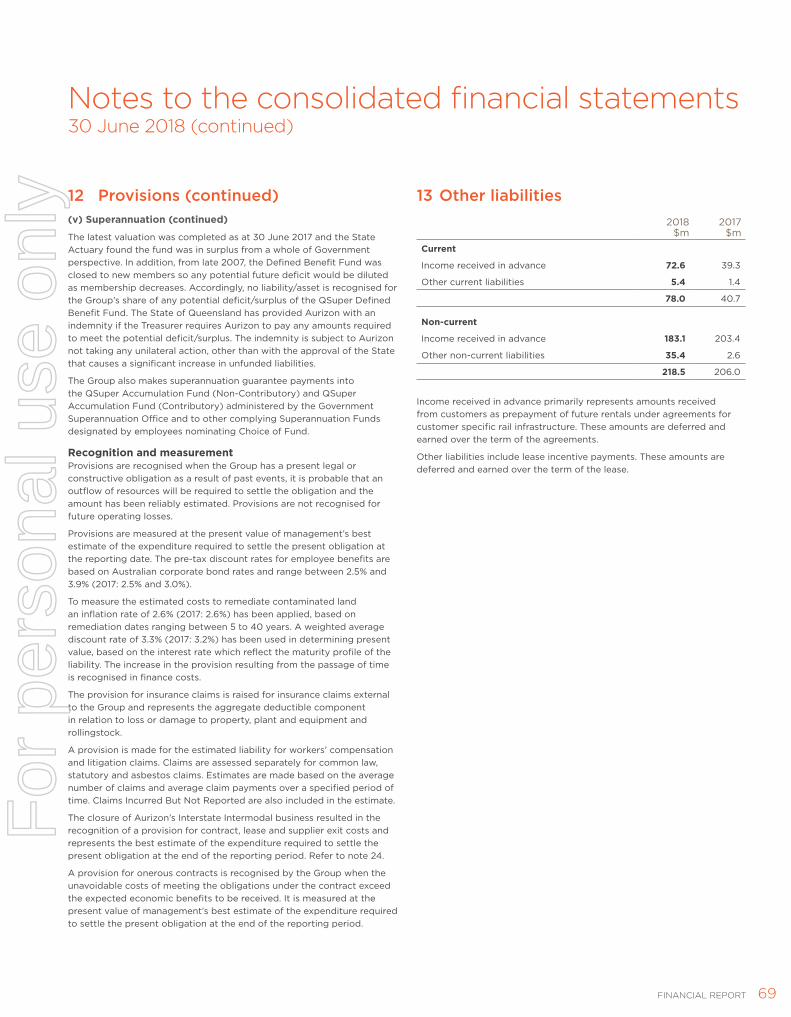
Notes to the consolidated financial statements30 June 2018 (continued)
12 Provisions (continued)(v) Superannuation (continued) The latest valuation was completed as at 30 June 2017 and the State Actuary found the fund was in surplus from a whole of Government perspective. In addition, from late 2007, the Defined Benefit Fund was closed to new members so any potential future deficit would be diluted as membership decreases. Accordingly, no liability/asset is recognised for the Group’s share of any potential deficit/surplus of the QSuper Defined Benefit Fund. The State of Queensland has provided Aurizon with an indemnity if the Treasurer requires Aurizon to pay any amounts required to meet the potential deficit/surplus. The indemnity is subject to Aurizon not taking any unilateral action, other than with the approval of the State that causes a significant increase in unfunded liabilities.
The Group also makes superannuation guarantee payments into the QSuper Accumulation Fund (Non-Contributory) and QSuper Accumulation Fund (Contributory) administered by the Government Superannuation Office and to other complying Superannuation Funds designated by employees nominating Choice of Fund.
Recognition and measurementProvisions are recognised when the Group has a present legal or constructive obligation as a result of past events, it is probable that an outflow of resources will be required to settle the obligation and the amount has been reliably estimated. Provisions are not recognised for future operating losses.
Provisions are measured at the present value of management’s best estimate of the expenditure required to settle the present obligation at the reporting date. The pre-tax discount rates for employee benefits are based on Australian corporate bond rates and range between 2.5% and 3.9% (2017: 2.5% and 3.0%).
To measure the estimated costs to remediate contaminated land an inflation rate of 2.6% (2017: 2.6%) has been applied, based on remediation dates ranging between 5 to 40 years. A weighted average discount rate of 3.3% (2017: 3.2%) has been used in determining present value, based on the interest rate which reflect the maturity profile of the liability. The increase in the provision resulting from the passage of time is recognised in finance costs.
The provision for insurance claims is raised for insurance claims external to the Group and represents the aggregate deductible component in relation to loss or damage to property, plant and equipment and rollingstock.
A provision is made for the estimated liability for workers’ compensation and litigation claims. Claims are assessed separately for common law, statutory and asbestos claims. Estimates are made based on the average number of claims and average claim payments over a specified period of time. Claims Incurred But Not Reported are also included in the estimate.
The closure of Aurizon’s Interstate Intermodal business resulted in the recognition of a provision for contract, lease and supplier exit costs and represents the best estimate of the expenditure required to settle the present obligation at the end of the reporting period. Refer to note 24.
A provision for onerous contracts is recognised by the Group when the unavoidable costs of meeting the obligations under the contract exceed the expected economic benefits to be received. It is measured at the present value of management’s best estimate of the expenditure required to settle the present obligation at the end of the reporting period.
13 Other liabilities2018
$m2017
$m
Current
Income received in advance 72.6 39.3
Other current liabilities 5.4 1.4
78.0 40.7
Non-current
Income received in advance 183.1 203.4
Other non-current liabilities 35.4 2.6
218.5 206.0
Income received in advance primarily represents amounts received from customers as prepayment of future rentals under agreements for customer specific rail infrastructure. These amounts are deferred and earned over the term of the agreements.
Other liabilities include lease incentive payments. These amounts are deferred and earned over the term of the lease.
69FINANCIAL REPORT
For
per
sona
l use
onl
y
Notes to the consolidated financial statements30 June 2018 (continued)
Capital and financial risk management
IN THIS SECTION
Capital and financial risk management provides information about the capital management practices of the Group and shareholder returns for the year, and discusses the Group’s exposure to various financial risks, explains how these affect the Group’s financial position and performance, and what the Group does to manage these risks.
14 Capital risk management Page 71
15 Dividends Page 71
16 Equity and reserves Page 71
17 Borrowings Page 73
18 Financial risk management Page 73
19 Derivative financial instruments Page 79
70 AURIZON ANNUAL REPORT 2017-18
For
per
sona
l use
onl
y
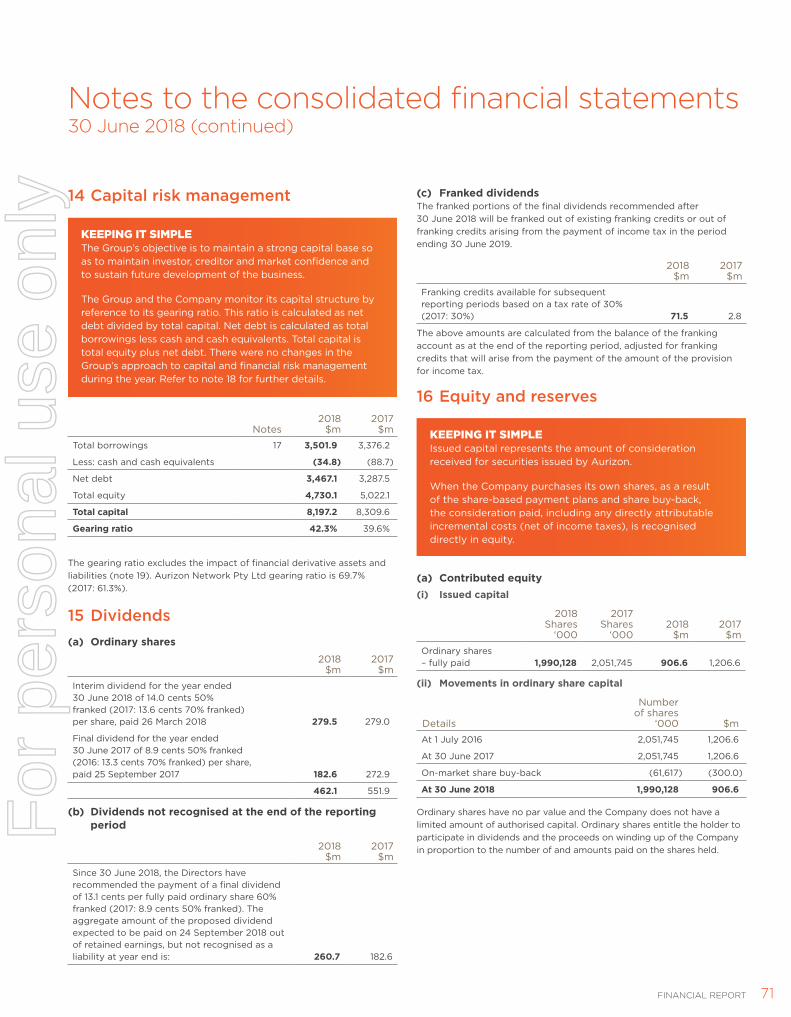
14 Capital risk management
KEEPING IT SIMPLE The Group’s objective is to maintain a strong capital base so as to maintain investor, creditor and market confidence and to sustain future development of the business.
The Group and the Company monitor its capital structure by reference to its gearing ratio. This ratio is calculated as net debt divided by total capital. Net debt is calculated as total borrowings less cash and cash equivalents. Total capital is total equity plus net debt. There were no changes in the Group’s approach to capital and financial risk management during the year. Refer to note 18 for further details.
Notes2018
$m2017
$m
Total borrowings 17 3,501.9 3,376.2
Less: cash and cash equivalents (34.8) (88.7)
Net debt 3,467.1 3,287.5
Total equity 4,730.1 5,022.1
Total capital 8,197.2 8,309.6
Gearing ratio 42.3% 39.6%
The gearing ratio excludes the impact of financial derivative assets and liabilities (note 19). Aurizon Network Pty Ltd gearing ratio is 69.7% (2017: 61.3%).
15 Dividends(a) Ordinary shares
2018 $m
2017 $m
Interim dividend for the year ended 30 June 2018 of 14.0 cents 50% franked (2017: 13.6 cents 70% franked) per share, paid 26 March 2018 279.5 279.0
Final dividend for the year ended 30 June 2017 of 8.9 cents 50% franked (2016: 13.3 cents 70% franked) per share, paid 25 September 2017 182.6 272.9
462.1 551.9
(b) Dividends not recognised at the end of the reporting period
2018 $m
2017 $m
Since 30 June 2018, the Directors have recommended the payment of a final dividend of 13.1 cents per fully paid ordinary share 60% franked (2017: 8.9 cents 50% franked). The aggregate amount of the proposed dividend expected to be paid on 24 September 2018 out of retained earnings, but not recognised as a liability at year end is: 260.7 182.6
(c) Franked dividendsThe franked portions of the final dividends recommended after 30 June 2018 will be franked out of existing franking credits or out of franking credits arising from the payment of income tax in the period ending 30 June 2019.
2018 $m
2017 $m
Franking credits available for subsequent reporting periods based on a tax rate of 30%(2017: 30%) 71.5 2.8
The above amounts are calculated from the balance of the franking account as at the end of the reporting period, adjusted for franking credits that will arise from the payment of the amount of the provision for income tax.
16 Equity and reserves
KEEPING IT SIMPLE Issued capital represents the amount of consideration received for securities issued by Aurizon.
When the Company purchases its own shares, as a result of the share-based payment plans and share buy-back, the consideration paid, including any directly attributable incremental costs (net of income taxes), is recognised directly in equity.
(a) Contributed equity(i) Issued capital
2018 Shares
‘000
2017 Shares
‘0002018
$m2017
$m
Ordinary shares– fully paid 1,990,128 2,051,745 906.6 1,206.6
(ii) Movements in ordinary share capital
Details
Number of shares
‘000 $m
At 1 July 2016 2,051,745 1,206.6
At 30 June 2017 2,051,745 1,206.6
On-market share buy-back (61,617) (300.0)
At 30 June 2018 1,990,128 906.6
Ordinary shares have no par value and the Company does not have a limited amount of authorised capital. Ordinary shares entitle the holder to participate in dividends and the proceeds on winding up of the Company in proportion to the number of and amounts paid on the shares held.
Notes to the consolidated financial statements30 June 2018 (continued)
71FINANCIAL REPORT FINANCIAL REPORT
For
per
sona
l use
onl
y

Notes to the consolidated financial statements30 June 2018 (continued)
16 Equity and reserves (continued)(b) Reserves
Notes
Share of an
associate’s OCI$m
Cash flow hedges
$m
Share- based
payments $m
Capital reserves
$mTotal
$m
Balance at 1 July 2017 (1.8) (2.1) 9.1 3,467.8 3,473.0
Fair value gains taken to equity – (13.1) – – (13.1)
Fair value losses transferred to property, plant and equipment – 0.1 – – 0.1
Deferred tax – 3.9 – – 3.9
Other comprehensive income – (9.1) – – (9.1)
Transactions with owners in their capacity as owners
Buy-back of ordinary shares – – – (0.3) (0.3)
Share-based payments expense 29(b) – – 3.9 – 3.9
Employee share trust to employees – – (2.5) – (2.5)
Deferred tax – – (4.9) – (4.9)
Balance at 30 June 2018 (1.8) (11.2) 5.6 3,467.5 3,460.1
Notes
Share of an
associate’s OCI$m
Cash flow hedges
$m
Share- based
payments $m
Capital reserves
$mTotal
$m
Balance at 1 July 2016 (1.8) (34.1) (7.2) 3,467.8 3,424.7
Fair value losses taken to equity – 45.7 – – 45.7
Fair value losses transferred to property, plant and equipment – (0.2) – – (0.2)
Deferred tax – (13.5) – – (13.5)
Other comprehensive income – 32.0 – – 32.0
Transactions with owners in their capacity as owners
Share-based payments expense 29(b) – – 6.6 – 6.6
Employee share trust to employees – – (7.5) – (7.5)
Deferred tax – – 17.2 – 17.2
Balance 30 June 2017 (1.8) (2.1) 9.1 3,467.8 3,473.0
Nature and purpose of reserves Cash flow hedges The hedging reserve is used to record gains or losses on hedging instruments that are designated cash flow hedges and are recognised in other comprehensive income. Amounts are recognised in the income statement when the associated hedged transaction affects the income statement.
Share-based paymentsShare-based payments represent the fair value of share-based remuneration provided to employees.
Capital reservesCapital reserves represents capital contributions from Queensland State Government pre-IPO less cumulative share buy-backs charged to this account.
AURIZON ANNUAL REPORT 2017–1872
For
per
sona
l use
onl
y
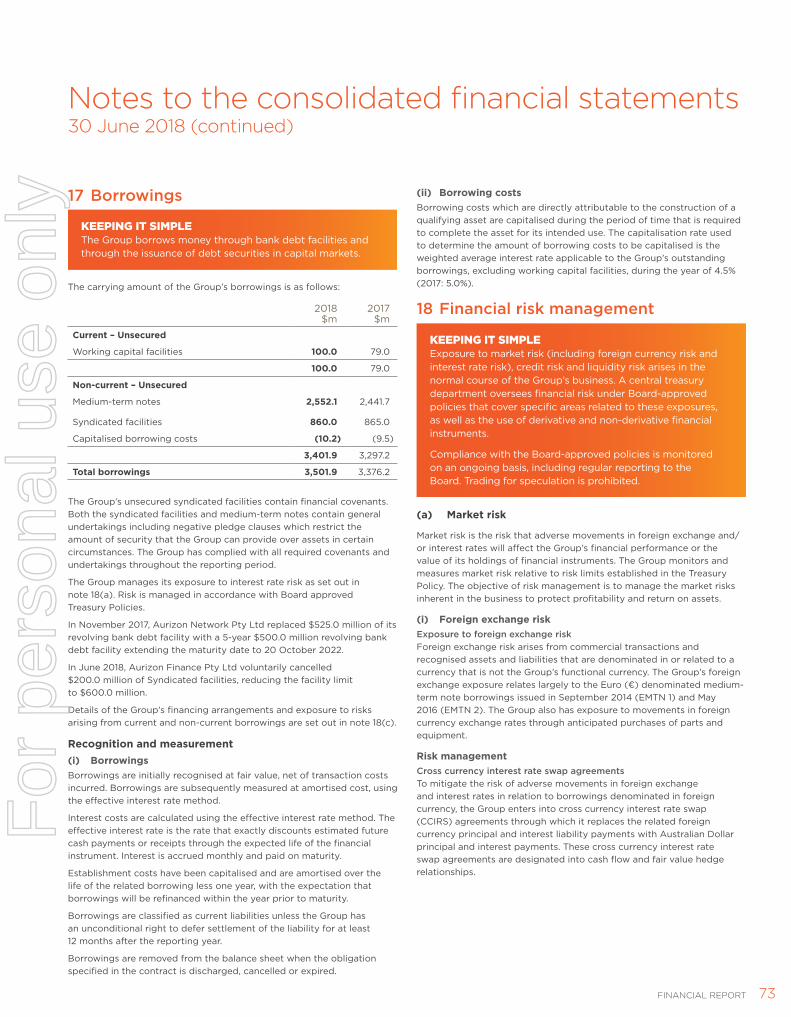
Notes to the consolidated financial statements30 June 2018 (continued)
17 Borrowings
KEEPING IT SIMPLE The Group borrows money through bank debt facilities and through the issuance of debt securities in capital markets.
The carrying amount of the Group’s borrowings is as follows:
2018 $m
2017 $m
Current – Unsecured
Working capital facilities 100.0 79.0
100.0 79.0
Non-current – Unsecured
Medium-term notes 2,552.1 2,441.7
Syndicated facilities 860.0 865.0
Capitalised borrowing costs (10.2) (9.5)
3,401.9 3,297.2
Total borrowings 3,501.9 3,376.2
The Group’s unsecured syndicated facilities contain financial covenants. Both the syndicated facilities and medium-term notes contain general undertakings including negative pledge clauses which restrict the amount of security that the Group can provide over assets in certain circumstances. The Group has complied with all required covenants and undertakings throughout the reporting period.
The Group manages its exposure to interest rate risk as set out in note 18(a). Risk is managed in accordance with Board approved Treasury Policies.
In November 2017, Aurizon Network Pty Ltd replaced $525.0 million of its revolving bank debt facility with a 5-year $500.0 million revolving bank debt facility extending the maturity date to 20 October 2022.
In June 2018, Aurizon Finance Pty Ltd voluntarily cancelled $200.0 million of Syndicated facilities, reducing the facility limit to $600.0 million.
Details of the Group’s financing arrangements and exposure to risks arising from current and non-current borrowings are set out in note 18(c).
Recognition and measurement (i) Borrowings Borrowings are initially recognised at fair value, net of transaction costs incurred. Borrowings are subsequently measured at amortised cost, using the effective interest rate method.
Interest costs are calculated using the effective interest rate method. The effective interest rate is the rate that exactly discounts estimated future cash payments or receipts through the expected life of the financial instrument. Interest is accrued monthly and paid on maturity.
Establishment costs have been capitalised and are amortised over the life of the related borrowing less one year, with the expectation that borrowings will be refinanced within the year prior to maturity.
Borrowings are classified as current liabilities unless the Group has an unconditional right to defer settlement of the liability for at least 12 months after the reporting year.
Borrowings are removed from the balance sheet when the obligation specified in the contract is discharged, cancelled or expired.
(ii) Borrowing costsBorrowing costs which are directly attributable to the construction of a qualifying asset are capitalised during the period of time that is required to complete the asset for its intended use. The capitalisation rate used to determine the amount of borrowing costs to be capitalised is the weighted average interest rate applicable to the Group’s outstanding borrowings, excluding working capital facilities, during the year of 4.5% (2017: 5.0%).
18 Financial risk management
KEEPING IT SIMPLE Exposure to market risk (including foreign currency risk and interest rate risk), credit risk and liquidity risk arises in the normal course of the Group’s business. A central treasury department oversees financial risk under Board-approved policies that cover specific areas related to these exposures, as well as the use of derivative and non-derivative financial instruments.
Compliance with the Board-approved policies is monitored on an ongoing basis, including regular reporting to the Board. Trading for speculation is prohibited.
(a) Market risk
Market risk is the risk that adverse movements in foreign exchange and/or interest rates will affect the Group’s financial performance or the value of its holdings of financial instruments. The Group monitors and measures market risk relative to risk limits established in the Treasury Policy. The objective of risk management is to manage the market risks inherent in the business to protect profitability and return on assets.
(i) Foreign exchange riskExposure to foreign exchange riskForeign exchange risk arises from commercial transactions and recognised assets and liabilities that are denominated in or related to a currency that is not the Group’s functional currency. The Group’s foreign exchange exposure relates largely to the Euro (€) denominated medium-term note borrowings issued in September 2014 (EMTN 1) and May 2016 (EMTN 2). The Group also has exposure to movements in foreign currency exchange rates through anticipated purchases of parts and equipment.
Risk managementCross currency interest rate swap agreementsTo mitigate the risk of adverse movements in foreign exchange and interest rates in relation to borrowings denominated in foreign currency, the Group enters into cross currency interest rate swap (CCIRS) agreements through which it replaces the related foreign currency principal and interest liability payments with Australian Dollar principal and interest payments. These cross currency interest rate swap agreements are designated into cash flow and fair value hedge relationships.
FINANCIAL REPORT 73
For
per
sona
l use
onl
y

Notes to the consolidated financial statements30 June 2018 (continued)
18 Financial risk management (continued)(a) Market risk (continued)(i) Foreign exchange risk (continued) Foreign exchange contractsThe Group uses forward contracts to manage its foreign exchange risk arising from anticipated purchases of parts and equipment. These contracts are hedging highly probable forecast foreign currency exposures and are denominated in the same currency as the highly probable future purchases. The forward contracts are designated as cash flow hedges and are timed to mature when foreign currency payments are scheduled to be made. Realised gains or losses on these contracts arise due to differences between the spot rates on settlement and the forward rates of the derivative contracts.
As at the reporting date, the Group’s exposure to foreign exchange risk after taking into consideration hedges of foreign currency borrowings and forecast foreign currency transactions is not considered material.
(ii) Interest rate riskExposure to interest rate riskThe Group holds both interest bearing assets and interest bearing liabilities, and therefore the Group’s income and operating cash flows are subject to changes in market interest rates.
The Group’s main interest rate risk arises from long-term borrowings which expose the Group to interest rate risk.
At the reporting date, the Group has exposure to the following variable rate borrowings and interest rate swaps:
30 June 2018 30 June 2017
Weighted average interest
rate %
Balance $m
Weighted average interest
rate %
Balance $m
Variable rate exposure 4.4 2,448.8 3.9 2,432.8
Interest rate swaps (notional principal amount) 4.2 (1,975.0) 4.9 (2,125.0)
Net exposure to interest rate risk 473.8 307.8
Risk managementThe Group manages cash flow interest rate risk by using interest rate swaps. CCIRS have been put in place to remove any exposure to Euro interest rates and associated foreign exchange from the EMTN issuances which in effect convert the debt to variable AUD.
Interest rate swaps currently in place cover approximately 81% (2017: 87%) of the variable rate exposure. The weighted average maturity of the outstanding swaps is approximately 3.0 years (2017: 3.8 years).
The International Swaps and Derivatives Association (ISDA) agreements held with counterparties allow for the netting of payments and receipts with respect to settlements for interest rate swap transactions.
During the year, the net realised loss arising from interest rate hedging activities for the Group was $4.9 million (2017: loss of $27.5 million) as a result of market interest rates closing lower than the average hedged rate. The total realised loss represents the effective portion of the hedges which have been recognised in interest expense.
(iii) Sensitivity on interest rate riskThe following table summarises the gain/(loss) impact of interest rate changes, relating to existing borrowings and financial instruments, on net profit and equity before tax. The effect on equity is based on the financial instruments notional principal. For the purpose of this disclosure, sensitivity analysis is isolated to a 100 basis points increase/decrease in interest rates, assuming hedge designations and effectiveness and all other variables remain constant.
Effect on profit (before tax)
Effect on equity (before tax)
2018 $m
2017 $m
2018 $m
2017 $m
100 bps movement in interest rates
100 bps decrease in interest rates 4.7 3.1 (46.7) (64.3)
100 bps increase in interest rates (4.7) (3.1) 45.2 61.3
AURIZON ANNUAL REPORT 2017–1874
For
per
sona
l use
onl
y

Notes to the consolidated financial statements30 June 2018 (continued)
18 Financial risk management (continued)(a) Market risk (continued)(iv) Effects of hedge accounting on the consolidated balance sheet and consolidated income statementThe impact of hedging instruments designated in hedging relationships on the consolidated balance sheet of the Group is as follows:
Notional amount
Carrying amount assets/(liability) refer to note 19
$m
Change in fair value used for measuring
ineffectiveness for the year$m
2018 2017 2018 2017 2018 2017
Cash flow hedges
Foreign exchange risk
Forward contracts US$26.0m US$7.4m 1.2 (0.2) 1.4 (0.2)
Forward contracts €14.0m €18.5m 0.5 (0.2) 0.7 (0.2)
Interest rate risk
Interest rate swaps A$1,975.0m A$2,125.0m 4.3 11.4 (7.1) 11.4
Foreign exchange and interest rate risks
CCIRS – EMTN 1 €500.0m €500.0m 1.2 (1.2) 2.4 (0.9)
CCIRS – EMTN 2 €500.0m €500.0m (3.8) (13.0) 9.2 (1.9)
Fair value hedges
Foreign exchange and interest rate risks
CCIRS – EMTN 1 €500.0m €500.0m 101.0 63.1 49.4 (25.9)
CCIRS – EMTN 2 €500.0m €500.0m (16.9) (57.4) 54.2 (26.4)
Interest rate risk
Interest rate swaps A$425.0m – 3.3 – 3.4 –
The impact of hedged items designated in hedging relationships on the consolidated balance sheet is as follows:
Cash flow hedge reserve* $m
Change in fair value used for measuring ineffectiveness
for the year $m
2018 2017 2018 2017
Cash flow hedges (before tax)
Foreign exchange risk
Firm commitments (1.6) 0.3 (2.1) 0.4
Interest rate risk
Forecast floating interest payments (4.3) (11.5) 7.1 (11.4)
Foreign exchange and interest rate risks
EMTN 1 6.5 (0.2) (2.4) 0.9
EMTN 2 15.6 14.4 (9.2) 1.9
* Cash flow hedge reserve includes the cumulative impact of cross currency basis relating to EMTN 1 and EMTN 2 of $23.5 million for the year ended 30 June 2018 (2017: $1.4 million).
FINANCIAL REPORT 75
For
per
sona
l use
onl
y

Notes to the consolidated financial statements30 June 2018 (continued)
18 Financial risk management (continued)(a) Market risk (continued)(iv) Effects of hedge accounting on the consolidated balance sheet and consolidated income statement (continued)
Carrying amount*$m
Accumulated fair value adjustment
$m
Change in fair value used for measuring
ineffectiveness for the year$m
2018 2017 2018 2017 2018 2017
Fair value hedges (before tax)
Interest rate risk
AMTN 2 (429.0) – (4.0) – (4.0) –
Foreign exchange and interest rate risks
EMTN 1 (826.6) (777.2) (116.0) (66.6) (49.4) 25.9
EMTN 2 (784.6) (730.4) (6.4) 47.8 (54.2) 26.4
* Carrying amount excludes the effect of discounts.
The above hedging relationships affected other comprehensive income as follows:
Hedging gain/(loss) recognised in
comprehensive income $m
2018 2017Cash flow hedges (before tax)Foreign exchange riskForward contracts 2.0 –Interest rate riskInterest rate swaps (7.1) 39.1Foreign exchange and interest rate riskCCIRS (7.9) 6.4
(13.0) 45.5
There was no material ineffectiveness related to cash flow hedges and fair value hedges recognised in the consolidated income statement during the year.
(b) Credit riskCredit risk is the risk of financial loss to the Group if a customer or counterparty to a financial instrument fails to meet its contractual obligations. Credit risk arises from cash and cash equivalents, derivative financial instruments, deposits with financial institutions and receivables from customers.
The maximum exposure to credit risk, excluding the value of any collateral or other security, at balance date to recognised financial assets, is the carrying amount, net of any provisions for impairment of those assets, as disclosed in the balance sheet and notes to the financial statements. Credit risk further arises in relation to financial guarantees received from certain parties.
Historically, there has been no significant change in customers’ credit risk. Other than the one-off event in relation to Queensland Nickel Pty Ltd in FY16, the lifetime expected loss assessment of the Group remains unchanged. The Group considers the probability of default upon initial recognition of asset and whether there has been a significant increase in credit risk on an ongoing basis throughout the reporting period. To assess whether there is a significant increase in credit risk, the Group compares the risk of a default occurring on the asset as at the reporting date with the risk of default as at the date of initial recognition. It considers available reasonable and supportive forward-looking information. The following indicators are considered:
› External credit rating (as far as available) › Actual or expected significant adverse changes in business, financial or
economic conditions that are expected to cause a significant change to the borrower’s ability to meet its obligations
› Significant changes in the value of the collateral supporting the obligation or in the quality of third-party guarantees or credit enhancements
› The financial position of customers, past experience and other factors (macroeconomic information)
The Group does not have any material credit risk exposure to any single receivable or group of receivables under financial instruments entered into by the Group. For some trade receivables, the Group may obtain security in the form of guarantees, deeds of undertaking or letters of credit which can be called upon if the counterparty is in default under the terms of the agreement. Refer to note 18(d) for further details.
The Group has policies in place to ensure that sales of services are only made to customers with an appropriate credit profile or where appropriate security is held. If customers are independently rated, these ratings are used. Otherwise, if there is no independent rating, the credit quality of the customer is assessed, taking into account its financial position, past experience and other factors.
Credit risk on cash transactions and derivative contracts is managed through the Board-approved Group Treasury Policies which restricts the Group’s exposure to financial institutions by credit rating band. The Policy limits the amount of credit exposure to any one financial institution. The Group’s net exposures and the credit ratings of its counterparties are regularly monitored.
AURIZON ANNUAL REPORT 2017–1876
For
per
sona
l use
onl
y

Notes to the consolidated financial statements30 June 2018 (continued)
18 Financial risk management (continued) (c) Liquidity riskLiquidity risk is the risk that the Group will encounter difficulties in meeting the obligations associated with its financial liabilities. The Group’s approach to managing liquidity is to ensure, as far as possible, sufficient liquidity is available to meet its liabilities when due, under both normal and stressed conditions, without incurring unacceptable losses or risking damage to the Group’s reputation.
Financing arrangements The Group has access to the following arrangements at the end of the reporting year:
Utilised* Facility limit
Security Maturity2018
$m2017
$m2018
$m2017
$mAurizon FinanceWorking capital facility Unsecured Jun-19 70.2 102.4 150.0 150.0Syndicated facility Unsecured Jul-19 100.0 300.0 300.0 300.0Syndicated facility Unsecured Jul-20 – 75.0 300.0 500.0
170.2 477.4 750.0 950.0Aurizon NetworkWorking capital facility Unsecured Jun-19 52.1 6.7 100.0 100.0Syndicated facility Unsecured Oct-22 270.0 - 500.0 525.0Syndicated facility Unsecured Jul-21 490.0 490.0 490.0 490.0AMTN 1 Unsecured Oct-20 525.0 525.0 525.0 525.0AMTN 2** Unsecured Jun-24 425.0 425.0 425.0 425.0
EMTN 1*** Unsecured Sept-24 710.6 710.6 710.6 710.6
EMTN 2*** Unsecured Jun-26 778.2 778.2 778.2 778.2 3,250.9 2,935.5 3,528.8 3,553.8
Total Group financing arrangements 3,421.1 3,412.9 4,278.8 4,503.8
* Amount utilised includes bank guarantees of $22.3 million (2017: $30.0 million) but excludes capitalised borrowing costs of $10.2 million (2017: $9.5 million) and discounts on medium-term notes of $13.1 million (2017: $16.0 million).
** Amount utilised excludes accumulated fair value adjustments of $4.0 million (2017: $nil) relating to changes in the interest rate due to the fair value hedging relationship.
*** Amount utilised also excludes accumulated fair value adjustments of $116.0 million (2017: $66.6 million) for EMTN 1 and $6.4 million (2017: ($47.8) million) for EMTN 2.
Within the working capital facilities, the Group has access to financial accommodation arrangements totalling $250.0 million (2017: $250.0 million) which may be utilised in the form of short-term working capital funding and the issuance of bank guarantees. At the end of the reporting period, the Group utilised $22.3 million (2017: $30.0 million) for financial bank guarantees.
The Group has complied with externally imposed debt covenants during the 2018 and 2017 reporting periods.
The following table summarises the contractual timing of undiscounted cash flows, including estimated interest payments, of financial liabilities and derivative instruments, expressed in AUD. The contractual amount assumes current interest rates and foreign exchange rates estimated using forward curves applicable at the end of the reporting period.
FINANCIAL REPORT 77
For
per
sona
l use
onl
y

Notes to the consolidated financial statements30 June 2018 (continued)
18 Financial risk management (continued) (c) Liquidity risk (continued)
Less than
1 year $m
Between 1 and 5
years$m
Over 5 years
$m
Total contractual cash flows
$m
Carrying amount
(assets)/liabilities*
$m
2018
Non-derivatives
Trade payables 275.8 – – 275.8 275.8
Borrowings* 251.0 1,883.7 2,135.3 4,270.0 3,420.4
Financial guarantees 22.3 – – 22.3 –
549.1 1,883.7 2,135.3 4,568.1 3,696.2
Derivatives
Interest rate swaps 1.3 (9.2) (0.6) (8.5) 7.6
Foreign exchange contracts – – – – (1.7)
- (inflow) (1.1) – – (1.1) –
- outflow – 0.2 – 0.2 –
0.2 (9.0) (0.6) (9.4) 5.9
2017
Non-derivatives
Trade payables 309.7 – – 309.7 309.7
Borrowings* 223.7 1,924.4 2,246.3 4,394.4 3,384.7
Financial guarantees 30.0 – – 30.0 –
563.4 1,924.4 2,246.3 4,734.1 3,694.4
Derivatives
Interest rate swaps 5.5 (17.8) – (12.3) (11.4)
Foreign exchange contracts – – – – 0.4
- (inflow) (17.0) (20.1) – (37.1) –
- outflow 17.2 21.5 – 38.7 –
5.7 (16.4) – (10.7) (11.0)
* Borrowings include the effect of CCIRS derivatives which have a carrying amount of $102.2 million (non-current asset) and $20.7 million (non-current liability) (2017: $61.9 million non-current asset and $70.4 million non-current liability).
(d) Fair value measurementsThe fair value of cash, cash equivalents and non-interest bearing financial assets and liabilities approximates their carrying value due to their short maturity. The fair value of financial instruments that are not traded in an active market (for example, over-the-counter derivatives) are determined using valuation techniques. These valuation techniques maximise the use of observable market data where available and rely as little as possible on entity specific estimates. If all significant inputs required to fair value an instrument are observable, the instrument is included in Level 2.
The Group measures and recognises the following assets and liabilities at fair value on a recurring basis:
› Forward foreign exchange contracts › Interest rate swaps › CCIRS
The fair value of forward foreign exchange contracts has been determined as the unrealised gain/(loss) at balance date by reference to market rates. The fair value of interest rate swaps has been determined as the net present value of contracted cashflows.
These values have been adjusted to reflect the credit risk of the Group and relevant counterparties, depending on whether the instrument is a financial asset or a financial liability. The existing exposure method, which discounts estimated future cash flows to present value using credit adjusted discount factors after counterparty netting arrangements, has been adopted for both forward foreign exchange contracts and interest rate swaps.
The fair value of CCIRS has been determined as the net present value of contracted cash flows. The future probable exposure method is applied to the estimated future cash flows to reflect the credit risk of the Group and relevant counterparties.
The fair value of non-current borrowings is estimated by discounting the future contractual cash flows at the current market interest rates that are available to Aurizon for similar financial instruments. For the period ended 30 June 2018, the borrowing rates were determined to be between 2.7% to 4.5%, depending on the type of borrowing (30 June 2017: 2.6% to 4.8%).
AURIZON ANNUAL REPORT 2017–1878
For
per
sona
l use
onl
y

Notes to the consolidated financial statements30 June 2018 (continued)
Carrying amount Fair value
Notes2018
$m2017
$m2018
$m2017
$mFinancial assets carried at fair valueForeign exchange contracts 19 1.7 0.1 1.7 0.1
CCIRS – EMTN 1 19 102.2 61.9 102.2 61.9
Interest rate swaps 19 8.2 11.7 8.2 11.7
112.1 73.7 112.1 73.7
Financial assets carried at amortised costCash and cash equivalents 34.8 88.7 34.8 88.7
Trade and other receivables 7 530.9 496.8 530.9 496.8
565.7 585.5 565.7 585.5
Financial liabilities carried at fair valueForeign exchange contracts 19 – (0.5) – (0.5)
Interest rate swaps 19 (0.6) (0.3) (0.6) (0.3)
CCIRS – EMTN 2 19 (20.7) (70.4) (20.7) (70.4)
(21.3) (71.2) (21.3) (71.2)
Financial liabilities carried at amortised costTrade and other payables 11 (275.8) (309.7) (275.8) (309.7)
Borrowings 17 (3,501.9) (3,376.2) (3,641.2) (3,556.5)
(3,777.7) (3,685.9) (3,917.0) (3,866.2)
Off-balance sheetUnrecognised financial assetsThird party guarantees – – 20.8 20.4
Bank guarantees – – 220.9 281.3
Insurance company guarantees – – 4.8 9.1
Unrecognised financial liabilities
Bank guarantees – – (22.3) (30.0)
– – 224.2 280.8
On 25 January 2017, as a residual obligation under the project documents with Moorebank Intermodal Company (MIC) Aurizon provided a Parent Company Guarantee (PCG) in favour of MIC in relation to 50% of the cost to complete construction of the Terminal Works and 25% of the contract sum for design and construction of the Rail Access. The estimated maximum exposure under the guarantee is $85.6 million (30 June 2017: $101.5 million), however Aurizon has obtained a 100% cross indemnity guarantee from Qube Holdings Ltd in respect of any call under the Aurizon PCG.
Fair value hierarchyThe table below analyses financial instruments carried at fair value, by valuation method. The different levels have been defined as follows:
› Level 1: Quoted prices (unadjusted) in active markets for identical assets or liabilities
› Level 2: Inputs other than quoted prices included within Level 1 that are observable for the asset or liability, either directly (i.e. as prices) or indirectly (i.e. derived from prices)
› Level 3: Inputs for the asset or liability that are not based on observable market data (unobservable inputs)
During the year, there were no transfers between Level 1, Level 2 and Level 3 fair value hierarchies.
30 June 2018 NotesLevel 1
$mLevel 2
$mLevel 3
$mTotal
$m
Derivative financial assets 19 – 112.1 – 112.1
Derivative financial liabilities 19 – (21.3) – (21.3)
Net financial instruments measured at fair value – 90.8 – 90.8
30 June 2017
Derivative financial assets 19 – 73.7 – 73.7
Derivative financial liabilities 19 – (71.2) – (71.2)
Net financial instruments measured at fair value – 2.5 – 2.5
19 Derivative financial instruments
KEEPING IT SIMPLE A derivative is a type of financial instrument typically used to manage risk. A derivative’s value changes over time in response to underlying variables such as exchange rates or interest rates and is entered into for a fixed period. The Group holds derivative financial instruments to economically hedge its foreign currency and interest rate exposures in accordance with the Group’s financial risk management policy (refer to note 18).
18 Financial risk management (continued) (d) Fair value measurements (continued)
79FINANCIAL REPORT
For
per
sona
l use
onl
y

Notes to the consolidated financial statements30 June 2018 (continued)
19 Derivative financial instruments (continued)2018
$m2017
$mCurrent assetsForeign exchange contracts 1.3 0.1
Non-current assetsInterest rate swaps 8.2 11.7
Foreign exchange contracts 0.4 –
CCIRS – EMTN 1 102.2 61.9
110.8 73.6
Total derivative financial instrument assets 112.1 73.7
Current liabilitiesForeign exchange forward contracts – (0.3)
Non-current liabilitiesInterest rate swaps (0.6) (0.3)
Foreign exchange forward contracts – (0.2)
CCIRS – EMTN 2 (20.7) (70.4)
(21.3) (70.9)
Total derivative financial instrument liabilities (21.3) (71.2)
(a) Offsetting derivative financial instrumentsThe following table presents the recognised financial instruments that are offset, or subject to enforceable master netting arrangements and other similar agreements but not offset, as at 30 June 2018 and 30 June 2017. The column ‘net amount’ shows the impact on the Group’s balance sheet if all set-off rights were exercised.
Effects of offsetting on the balance sheet Related amounts not offset
Gross amounts $m
Gross amounts set-off in the
balance sheet$m
Net amountspresented in the
balance sheet$m
Amounts subject to master netting
arrangements$m
Net amount*$m
2018
Financial assets
Derivative financial instruments 112.1 – 112.1 (4.5) 107.6
Financial liabilities
Derivative financial instruments (21.3) – (21.3) 4.5 (16.8)
2017
Financial assets
Derivative financial instruments 73.7 – 73.7 (14.5) 59.2
Financial liabilities
Derivative financial instruments (71.2) – (71.2) 14.5 (56.7)
* No financial instrument collateral.
AURIZON ANNUAL REPORT 2017–1880
For
per
sona
l use
onl
y

Notes to the consolidated financial statements30 June 2018 (continued)
19 Derivative financial instruments (continued)
Master netting arrangementDerivative transactions are administered under ISDA Master Agreements. Under the terms of these agreements, where certain credit events occur (such as default), the net position owing/receivable to a single counterparty in the same currency will be taken as owing and all the relevant arrangements terminated. As the Group does not presently have a legally enforceable right of set-off between different transaction types, these amounts have not been offset in the balance sheet, but have been presented separately in the previous page.
Recognition and measurementDerivatives are initially recognised at fair value on the date a derivative contract is entered into and are subsequently re-measured to their fair value at the end of each reporting period. The accounting for subsequent changes in fair value depends on whether the derivative is designated as a hedging instrument and, if so, the nature of the item being hedged.
The Group designates certain derivatives as hedges of the cashflows of recognised assets and liabilities, and highly probable forecast transactions (cashflow hedges). The Group has established a 100% hedge relationship against the identified exposure, therefore the hedge ratio is 1:1.
At inception, the Group documents the relationship between hedging instruments and hedged items, the risk management objective and the strategy for undertaking various hedge transactions. The Group, at inception and on an ongoing basis, documents its assessment of whether the derivatives used in hedging transactions have been, and will continue to be, highly effective in offsetting future cashflows of hedged items. Hedge effectiveness is determined at the inception of the hedge relationship, and through periodic prospective effectiveness assessments to ensure that an economic relationship exists between the hedged item and hedging instrument. The Group enters into hedge relationships where the critical terms of the hedging instrument match exactly with the terms of the hedged item, and so a qualitative assessment of effectiveness is performed. If changes in circumstances affect the terms of the hedged item such that the critical terms no longer match exactly with the critical terms of the hedging instrument, the Group uses the hypothetical derivative method to assess effectiveness.
The fair values of derivative financial instruments used for hedging purposes are disclosed in this section. The full fair value of a hedging derivative is classified as a non-current asset or liability when the remaining maturity of the hedged item is more than 12 months. It is classified as a current asset or liability when the remaining maturity of the hedged item is less than 12 months.
(i) Cash flow hedgeThe effective portion of changes in the fair value of derivatives that are designated and qualify as cash flow hedges is recognised in other comprehensive income, and accumulated in reserves in equity limited to the cumulative change in fair value of the hedged item on a present value basis from the inception of the hedge. Ineffectiveness is recognised on a cash flow hedge where the cumulative change in the designated component value of the hedging instrument exceeds on an absolute basis the change in value of the hedged item attributable to the hedged risk. Ineffectiveness may arise where the timing of the transaction changes from what was originally estimated or differences arise between credit risk inherent within the hedged item and the hedging instrument. The gain or loss relating to the ineffective portion is recognised immediately in profit or loss within other income or other expense.
Amounts accumulated in equity are reclassified to profit or loss in the periods when the hedged item affects profit or loss. However, when the forecast transaction that is hedged results in the recognition of a non-financial asset, the gains and losses previously deferred in equity are reclassified from equity and included in the initial measurement of the cost or carrying amount of the asset.
When a hedging instrument expires or is sold or terminated, or when a hedge no longer meets the criteria for hedge accounting, any cumulative gain or loss existing in equity at that time remains in equity and is recognised when the forecast transaction is ultimately recognised in profit or loss. When a forecast transaction is no longer expected to occur, the cumulative gain or loss that was reported in equity is immediately reclassified to profit or loss.
If the hedge ratio for risk management purposes is no longer optimal but the risk management objective remains unchanged and the hedge continues to qualify for hedge accounting, the hedge relationship will be rebalanced by adjusting either the volume of the hedging instrument or the volume of the hedged item so that the hedge ratio aligns with the ratio used for risk management purposes. Any hedge ineffectiveness is calculated and accounted for at the time of the hedge relationship rebalancing.
(ii) Fair value hedgeChanges in the fair value of derivatives that are designated and qualify as fair value hedges are recorded in the profit or loss, together with any changes in the fair value of the hedged asset or liability that are attributable to the hedged risk.
The gain or loss relating to the effective portion of interest rate swaps hedging fixed rate borrowings is recognised in profit or loss within finance costs, together with changes in the fair value of the hedged fixed rate borrowings attributable to interest rate risk. The gain or loss relating to the ineffective portion is recognised in the profit or loss within other income or other expenses. If the hedge no longer meets the criteria for hedge accounting, the adjustment to the carrying amount of a hedged item for which the effective interest method is used is amortised to the profit or loss over the period to maturity using a recalculated effective interest rate.
81FINANCIAL REPORT FINANCIAL REPORT 81
For
per
sona
l use
onl
y

Notes to the consolidated financial statements30 June 2018 (continued)
Group structure
IN THIS SECTION
Group structure provides information about particular subsidiaries and associates and how changes have affected the financial position and performance of the Group.
20 Associates and joint arrangements Page 83
21 Material subsidiaries Page 83
22 Parent disclosures Page 84
23 Deed of cross guarantee Page 85
24 Discontinued operation Page 87
25 Assets classified as held for sale Page 88
82 AURIZON ANNUAL REPORT 2017–18
For
per
sona
l use
onl
y

Notes to the consolidated financial statements30 June 2018 (continued)
20 Associates and joint arrangements
KEEPING IT SIMPLE Associates are all entities over which the Group has significant influence but not control or joint control. Investments in associates are accounted for using the equity method of accounting after initially being recognised at cost.
2018 $m
2017 $m
Non-current assets
Interest in joint ventures (b) 3.2 2.4
(a) Investments in associates
The Group has an interest in the following associates:
Ownership interest
NameCountry of operation
2018 %
2017 %
Principal activity
Aquila Resources Limited* Australia 15 15
Exploration and mining
* Aquila Resources Limited is accounted for as an associated company because the Group has significant influence primarily through representation on its Board of Directors.
(b) Investments in joint venturesThe Group has an interest in the following joint ventures, which are equity accounted, contributed $0.8 million to the Group results, have net assets of $3.2 million and are not considered material to the Group.
Ownership interest
NameCountry of operation
2018 %
2017 %
Principal activity
Chun Wo/CRGL China-Hong Kong 17 17 Construction
ARG Risk Management Limited Bermuda 50 50 Insurance
Integrated Logistics Company Pty Ltd Australia 14 14 Consulting
ACN 169 052 288 Australia 15 15 Dormant
Recognition and measurementUnder the equity method of accounting, the investments are initially recognised at cost and adjusted thereafter to recognise the Group’s share of the post-acquisition profits or losses of the investee in profit or loss, and the Group’s share of movements in other comprehensive income of the investee in other comprehensive income. The cumulative post-acquisition movements are adjusted against the carrying amount of the investment. Dividends received or receivable from associates and joint ventures are recognised as a reduction in the carrying amount of the investment.
When the Group’s share of losses in an associate equals or exceeds its interest in the associate, including any other unsecured long-term receivables, the Group does not recognise further losses, unless it has incurred obligations or made payments on behalf of the associate.
The carrying amount of equity accounted investments is tested for impairment in accordance with the policy described in note 9(v). The recoverable amount of the investment in Aquila is dependent on judgements made in relation to the long-term foreign exchange rates, metallurgical coal prices, iron ore prices and the timing of development of Aquila’s mining projects and is nil.
21 Material subsidiariesThe Group’s material subsidiaries that were controlled during the year and prior years are set out below.
Name of entityCountry of
incorporation
Equity holding
%
Aurizon Operations Limited Australia 100
Interail Australia Pty Ltd Australia 100
Australia Eastern Railroad Pty Ltd Australia 100
Australia Western Railroad Pty Ltd Australia 100
Aurizon Network Pty Ltd Australia 100
Aurizon Property Pty Ltd Australia 100
Aurizon Terminal Pty Ltd Australia 100
Aurizon Finance Pty Ltd Australia 100
Iron Horse Insurance Company Pte Ltd Singapore 100
Principles of consolidationThe consolidated financial statements incorporate the assets and liabilities of all subsidiaries of the Group as at reporting date and the results of all subsidiaries for the year.
Subsidiaries are all entities (including structured entities) over which the Group has control. The Group controls an entity when the Group is exposed to, or has rights to, variable returns from its involvement with the entity and has the ability to affect those returns through its power to direct the activities of the entity.
Subsidiaries are fully consolidated from the date on which control is transferred to the Group and de-consolidated from the date that control ceases. Transactions between continuing and discontinued operations are treated as external from the date that the operation was discontinued.
Intercompany transactions, balances and unrealised gains on transactions between Group companies are eliminated on consolidation.
FINANCIAL REPORT 83
For
per
sona
l use
onl
y

Notes to the consolidated financial statements30 June 2018 (continued)
21 Material subsidiaries (continued) Changes in ownership interestsWhen the Group ceases to have control, joint control or significant influence, any retained interest in the entity is remeasured to its fair value with the change in carrying amount recognised in the profit or loss. This fair value becomes the initial carrying amount for the purposes of subsequently accounting for the retained interest as an associate, joint venture or financial asset. In addition, any amounts previously recognised in other comprehensive income in respect of that entity are accounted for as if the Group had directly disposed of the related assets or liabilities. This may mean that amounts previously recognised in other comprehensive income are classified to profit or loss.
If the ownership interest in a joint venture or an associate is reduced but joint control or significant influence is retained, only a proportionate share of the amounts previously recognised in other comprehensive income are reclassified to profit or loss where appropriate.
22 Parent disclosuresThe parent and ultimate parent entity within the Group is Aurizon Holdings Limited.
(a) Summary financial informationThe individual financial statements for the parent entity show the following aggregate amounts:
2018 $m
2017 $m
Current assets 61.1 15.9
Non-current assets 6,093.9 6,092.6
Total assets 6,155.0 6,108.5
Current liabilities (61.1) (14.8)
Non-current liabilities (1,726.6) (1,428.2)
Total liabilities (1,787.7) (1,443.0)
Net assets 4,367.3 4,665.5
Shareholders’ equity
Contributed equity 906.6 1,206.6
Retained earnings 1.7 0.9
Reserves 3,459.0 3,458.0
Total equity 4,367.3 4,665.5
Profit for the year 462.9 550.1
Total comprehensive income 462.9 550.1
The parent entity has several employees. All costs associated with these employees are borne by a subsidiary of the parent entity and are not included in the above disclosures.
(b) Guarantees entered into by the parent entityThere are cross guarantees given by Aurizon Holdings Limited and its subsidiaries as listed in note 23.
(c) Contingent liabilities of the parent entityThe parent entity did not have any material contingent liabilities as at 30 June 2018 or 30 June 2017. For information about guarantees given by the parent entity, please see above.
(d) Contractual commitments for the acquisition of property, plant and equipment
As at 30 June 2018, the parent entity did not have any contractual commitments for the acquisition of property, plant and equipment (2017: nil).
Recognition and measurementThe financial information for the parent entity, Aurizon Holdings Limited, has been prepared on the same basis as the consolidated financial statements, except as set out below.
(i) Investments in subsidiaries, associates and joint venture entities
Investments in subsidiaries, associates and joint venture entities are accounted for at cost in the financial statements of Aurizon Holdings Limited. Dividends received from associates are recognised in the parent entity’s income statement, rather than being deducted from the carrying amount of these investments.
(ii) Tax consolidation legislationAurizon and its wholly-owned Australian entities elected to form a tax consolidation group with effect from 22 November 2010 and are therefore taxed as a single entity. The head entity of the tax consolidated group is Aurizon Holdings Limited.
The head entity, Aurizon Holdings Limited, and the controlled entities in the tax consolidated group account for their own current and deferred tax amounts. These tax amounts are measured as if each entity in the tax consolidated group continues to be a stand-alone taxpayer in its own right.
In addition to its own current and deferred tax amounts, Aurizon also recognises the current tax liabilities (or assets) and the deferred tax assets arising from unused tax losses and unused tax credits assumed from controlled entities in the tax consolidation group.
The entities have also entered into tax sharing and tax funding agreements. The tax funding agreement sets out the funding obligations of members of the tax consolidated group in respect of income tax amounts. The tax funding arrangements require payments to the head entity equal to the current tax liability assumed by the head entity. In addition, the head entity is required to make payments equal to the current tax asset or deferred tax asset arising from unused tax losses and tax credits assumed by the head entity from a subsidiary member.
These tax funding arrangements result in the head entity recognising a current inter-entity receivable/payable equal in amount to the tax liability/asset assumed.
AURIZON ANNUAL REPORT 2017–1884
For
per
sona
l use
onl
y

Notes to the consolidated financial statements30 June 2018 (continued)
22 Parent disclosures (continued) (ii) Tax consolidation legislation (continued)The tax sharing agreement limits the joint and several liability of the wholly-owned entities in the case of a default by the head entity.
(iii) Employee benefits – share-based paymentsThe grant by the Company of rights over its equity instruments to the employees of subsidiaries are treated as a capital contribution to that subsidiary. The fair value of employee services received, measured by reference to the grant date fair value, is recognised over the vesting period as an increase to investment in the corresponding subsidiaries.
23 Deed of cross guaranteeAurizon Holdings Limited, Aurizon Finance Pty Ltd, Aurizon Property Holding Pty Ltd, Aurizon Property Pty Ltd, Aurizon Terminal Pty Ltd, Aurizon Operations Limited, Aurizon Intermodal Pty Ltd, Logistics Australasia Pty Ltd, Aurizon Resource Logistics Pty Limited, Interail Australia Pty Ltd, Australian Rail Pty Ltd, Australia Eastern Railroad Pty Ltd, Australia Western Railroad Pty Ltd and Australian Railroad Group Employment Pty Ltd are parties to a Deed of Cross Guarantee, under which each company guarantees the debts of the others. By entering into the cross guarantee, the wholly-owned entities have been relieved from the requirement to prepare separate financial and directors’ reports under ASIC Corporations (Wholly owned Companies) Instrument 2016/785.
(a) Consolidated statement of profit or loss, statement of comprehensive income and summary of movements in consolidated retained earnings
The Aurizon Deed Parties represent the ‘closed group’ for the purposes of the Class Order, and as there are no other parties to the cross guarantee that are controlled by Aurizon Holdings Limited, they also represent the ‘extended closed group’.
2018 $m
2017 $m
Income statement
Revenue from continuing operations 2,781.9 2,984.1
Other income 592.5 216.5
Consumables (1,274.4) (1,536.8)
Employee benefits expense (694.2) (843.4)
Depreciation and amortisation expense (234.7) (298.2)
Impairment losses (74.6) (837.9)
Other expenses (112.5) (25.4)
Share of net profits/(losses) of associates and joint venture partnerships accounted for using the equity method 0.8 (0.1)
Finance costs (14.3) (21.1)
Finance income 2.8 1.6
Profit/(loss) before income tax 973.3 (360.7)
Income tax (expense)/benefit (117.0) 182.7
Profit/(loss) for the year 856.3 (178.0)
2018 $m
2017 $m
Statement of comprehensive income
Profit/(loss) for the year 856.3 (178.0)
Other comprehensive income
Items that may be reclassified to profit or loss
– Change in the foreign currency translation reserve (0.1) (0.1)
– Changes in the fair value of cash flow hedges 0.2 (3.7)
– Income tax relating to components of other comprehensive income (0.1) 1.1
Other comprehensive income/(expense) for the year, net of tax – (2.7)
Total comprehensive income/(expense) for the year 856.3 (180.7)
Summary of movements in consolidated retained earnings
Retained (losses)/earnings at the beginning of the financial year (283.6) 446.3
Profit/(loss) for the year 856.3 (178.0)
Dividends provided for or paid (462.1) (551.9)
Retained earnings/(losses) at the end of the financial year 110.6 (283.6)
FINANCIAL REPORT 85
For
per
sona
l use
onl
y
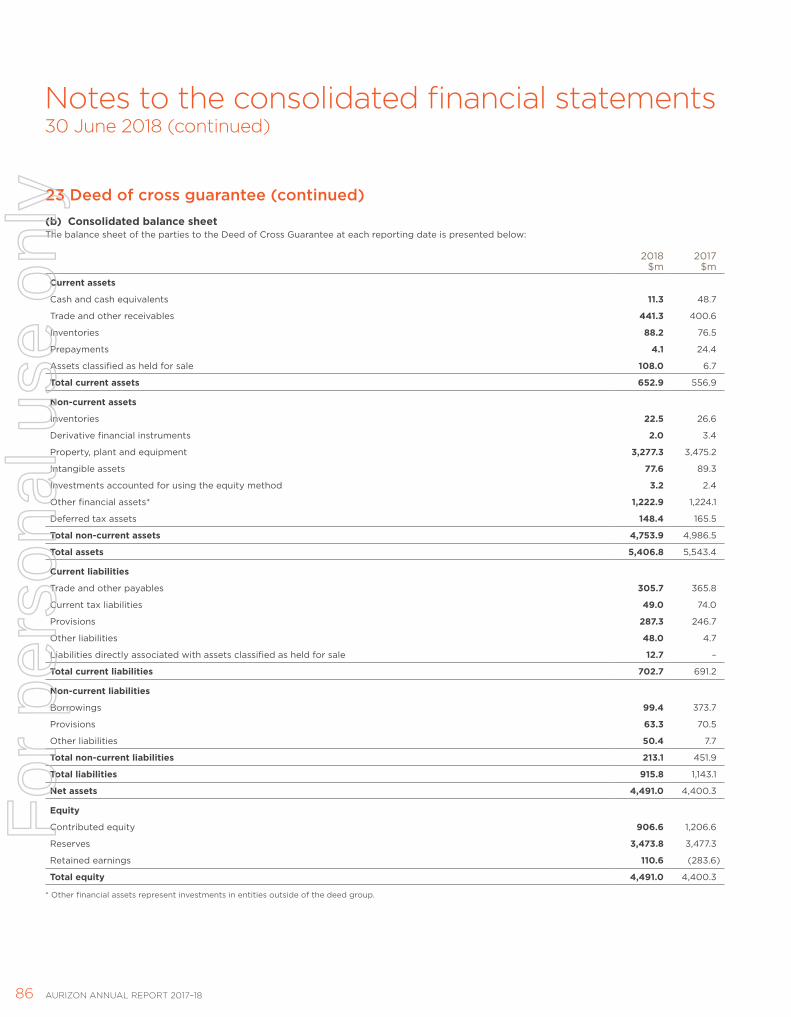
Notes to the consolidated financial statements30 June 2018 (continued)
23 Deed of cross guarantee (continued)(b) Consolidated balance sheetThe balance sheet of the parties to the Deed of Cross Guarantee at each reporting date is presented below:
2018 $m
2017 $m
Current assets
Cash and cash equivalents 11.3 48.7
Trade and other receivables 441.3 400.6
Inventories 88.2 76.5
Prepayments 4.1 24.4
Assets classified as held for sale 108.0 6.7
Total current assets 652.9 556.9
Non-current assets
Inventories 22.5 26.6
Derivative financial instruments 2.0 3.4
Property, plant and equipment 3,277.3 3,475.2
Intangible assets 77.6 89.3
Investments accounted for using the equity method 3.2 2.4
Other financial assets* 1,222.9 1,224.1
Deferred tax assets 148.4 165.5
Total non-current assets 4,753.9 4,986.5
Total assets 5,406.8 5,543.4
Current liabilities
Trade and other payables 305.7 365.8
Current tax liabilities 49.0 74.0
Provisions 287.3 246.7
Other liabilities 48.0 4.7
Liabilities directly associated with assets classified as held for sale 12.7 –
Total current liabilities 702.7 691.2
Non-current liabilities
Borrowings 99.4 373.7
Provisions 63.3 70.5
Other liabilities 50.4 7.7
Total non-current liabilities 213.1 451.9
Total liabilities 915.8 1,143.1
Net assets 4,491.0 4,400.3
Equity
Contributed equity 906.6 1,206.6
Reserves 3,473.8 3,477.3
Retained earnings 110.6 (283.6)
Total equity 4,491.0 4,400.3
* Other financial assets represent investments in entities outside of the deed group.
AURIZON ANNUAL REPORT 2017–1886
For
per
sona
l use
onl
y

Notes to the consolidated financial statements30 June 2018 (continued)
24 Discontinued operation(a) DescriptionOn 14 August 2017 the Group announced its intention to exit the Intermodal business through a combination of closure and sale.
Aurizon signed a binding agreement with Pacific National to sell its Acacia Ridge Intermodal Terminal. That transaction includes the transfer of approximately 30 employee positions, as well as assets, commercial and operational agreements.
Aurizon signed a separate binding agreement to sell its Queensland Intermodal business to a consortium of Linfox and Pacific National (QI BSA). The transaction includes the transfer of approximately 330 employee positions, as well as assets, commercial and operational arrangements to the Linfox and Pacific National consortium.
The transactions are subject to:
› Approval by the Australian Competition & Consumer Commission (ACCC); and
› Approval by the Foreign Investment & Review Board (FIRB)
Total consideration for the two transactions is $225.0 million of which $45.0 million has been received to date.
The ACCC decision was announced on 19 July 2018. The ACCC decided to oppose both transactions and commenced proceedings against Pacific National and Aurizon in the Federal Court of Australia. The ACCC has sought declarations, pecuniary penalties, orders restraining the existing sale transactions from proceeding and costs. The ACCC has also sought an injunction to prevent Aurizon from closing its Queensland Intermodal business while proceedings are on foot. While Aurizon refutes the ACCC’s allegations and will defend the proceedings including seeking clearance of the Acacia Ridge transaction, there is a risk that the Acacia Ridge transaction will be prevented from completing and/or Aurizon incurs orders for pecuniary penalties and costs. There is also the risk that, in the interim whilst the matter is being determined by the Court, Aurizon is injuncted from closing the Queensland Intermodal business.
On 12 August 2018 Aurizon provided Pacific National with a notice to terminate the Business Sale Agreement for the Queensland Intermodal business, with effect from 13 August 2018. It is Aurizon’s intention to not contest clearance of that transaction through the Federal Court and to exit the business. As clearance has not been obtained for the sale of the Queensland Intermodal business, $10 million of the consideration received for the transactions to date (recognised as a liability at 30 June 2018) will be refunded to Pacific National. The Business Sale Agreement for the Acacia Ridge Terminal remains in place while Aurizon seeks clearance of that transaction, and the remainder of the consideration received for the transactions to date ($35 million) is not refundable.
Notwithstanding this Aurizon remains committed to exiting the Intermodal business and on this basis has continued to classify the Acacia Ridge and Queensland Intermodal business assets as held for sale and discontinued operations at 30 June 2018.
On 10 August 2018 the Federal Court of Australian heard an application from the ACCC for an interlocutory injunction to require Aurizon to continue to operate the Queensland Intermodal business in the ordinary and usual course. The Court reserved judgement on the matter, and judgement is currently expected to be handed down on 13 August 2018.
Aurizon’s Interstate Intermodal business has been closed with the last operational service occurring on 23 December 2017. Approximately 160 employee positions were affected by the closure of the Interstate business.
The closure of Interstate Intermodal has resulted in $74.7 million of significant items being recognised in the year ended 30 June 2018. Significant Interstate Intermodal items include $61.0 million for contract, lease and supplier exit costs, $9.1 million in redundancy costs and asset write downs of $4.6 million.
SIGNIFICANT JUDGEMENTS Notwithstanding the ACCC decision Aurizon remains committed to exiting the Intermodal business and on this basis has continued to classify the Acacia Ridge and Queensland Intermodal business assets as held for sale and discontinued operations at 30 June 2018.
Financial information relating to the discontinued operation for the period is set out below.
(b) Financial performance and cash flow information
2018 $m
2017 $m
Revenue 225.4 309.8
Employee benefits expense (79.6) (72.8)
Energy and fuel (19.1) (31.9)
Track access (35.1) (58.8)
Consumables (134.5) (180.2)
Depreciation and amortisation* (2.3) (17.3)
Impairment losses** (4.6) (162.2)
Other expenses (48.9) (2.0)
Net finance costs – 0.1
Loss before income tax (98.7) (215.3)
Income tax benefit 21.6 64.6
Loss from discontinued operation after tax (77.1) (150.7)
Net cash (outflow) from operating activities (25.1) (34.8)
Net cash inflow/(outflow) from investing activities*** 54.6 (34.7)
Net cash inflow/(outflow) from financing activities – –
Net increase/(decrease) in cash generated by the discontinued operation 29.5 (69.5)
* Includes $2.0 million depreciation (2017: $16.7 million) and $3.0 million amortisation expense (2017: $0.6 million).
** Includes $2.4 million relating to property, plant and equipment (2017: $161.0 million) and $2.2 million relating to intangible assets (2017: $1.2 million).
*** Net cash inflow from investing activities includes $45.0 million deposit in relation to the transactions.
FINANCIAL REPORT 87
For
per
sona
l use
onl
y

Notes to the consolidated financial statements30 June 2018 (continued)
24 Discontinued operation (continued)(c) Significant itemsSignificant items are those items where their nature and amount is considered material to the financial statements. Items related to discontinued operations included within the Group’s profit are detailed below:
2018 $m
2017 $m
Significant items
Closure costs (61.0) –
Impairment expense (4.6) (162.2)
Redundancy costs (9.1) (5.0)
(74.7) (167.2)
$74.7 million of significant items comprises $61.0 million for contract, lease and supplier exit costs, $9.1 million in redundancy costs for 158 employees in the Interstate business and asset write downs of $4.6 million.
(d) Assets and liabilities of disposal group classified as held for saleThe following assets and liabilities relating to Intermodal and Acacia Ridge businesses were reclassified as held for sale in relation to discontinued operations as at 30 June 2018:
2018 $m
Assets classified as held for sale
Property, plant and equipment 78.6
Trade and other receivables 26.3
Inventories 1.2
Total assets of disposal group held for sale 106.1
Liabilities directly associated with assets classified as held for sale
Employee benefit obligations (12.7)
Net assets classified as held for sale 93.4
25 Assets classified as held for sale
2018 $m
2017 $m
Property, plant and equipment 80.5 7.3
Trade and other receivables 26.3 –
Inventories 1.2 –
Total assets held for sale 108.0 7.3
Assets held for sale includes $106.1 million related to discontinued operation. Refer to note 24.
Recognition and measurementNon-current assets (or disposal groups) are classified as held for sale if their carrying amount will be recovered principally through a sale transaction, rather than through continuing use and a sale is considered highly probable. They are measured at the lower of their carrying amount and FVLCD, except for assets such as deferred tax assets; assets arising from employee benefits; financial assets; and investment property that are carried at fair value and contractual rights under insurance contracts which are specifically exempt from this requirement.
Non-current assets (including those that are part of a disposal group) are not depreciated or amortised while they are classified as held for sale. Interest and other expenses attributable to the liabilities of a disposal group classified as held for sale continue to be recognised.
AURIZON ANNUAL REPORT 2017–1888
For
per
sona
l use
onl
y
Notes to the consolidated financial statements30 June 2018 (continued)
Other information
IN THIS SECTION
Other information provides information on other items which require disclosure to comply with Australian Accounting Standards and other regulatory pronouncements however are not considered critical in understanding the financial performance or position of the Group.
26 Notes to the consolidated statements of cash flows Page 90
27 Related party transactions Page 91
28 Key Management Personnel compensation Page 91
29 Share-based payments Page 91
30 Remuneration of auditors Page 92
31 Summary of other significant accounting policies Page 93
89FINANCIAL REPORT
For
per
sona
l use
onl
y

Notes to the consolidated financial statements30 June 2018 (continued)
26 Notes to the consolidated statement of cash flows(a) Reconciliation of net cash inflow from operating activities to profit from continuing operations
2018 $m
2017 $m
Profit/(loss) for the year from continuing operations 560.1 (37.2)
Depreciation and amortisation 525.5 567.3
Impairment of non-financial assets 70.0 678.3
Interest expense 168.3 181.3
Non-cash employee benefits expense — share-based payments 3.9 6.6
Net loss on sale of assets 4.7 6.0
Share of net (profit)/loss of associates and joint venture partnership (0.8) 0.1
Net exchange differences 0.3 –
Change in operating assets and liabilities:
(Increase)/Decrease in trade and other receivables (90.4) 16.8
(Increase)/Decrease in inventories (2.8) 28.9
Decrease in other operating assets 1.9 0.1
(Decrease)/Increase in trade and other payables (17.9) 22.0
Decrease in other liabilities (32.8) (33.0)
Increase/(Decrease) in current tax liabilities 40.3 (79.4)
Increase/(Decrease) in deferred tax liabilities 90.7 (112.4)
(Decrease)/Increase in provisions (13.3) 27.8
Net cash inflow from operating activities from continuing operations 1,307.7 1,273.2
(b) Reconciliation of liabilities arising from financing activities to financing cash flows
Currentborrowings
Non-currentborrowings
Liabilities held to hedge
borrowings*
Assets held to hedge
borrowings* Total
$m $m $m $m $m
Balance as at 1 July 2017 (79.0) (3,297.2) (70.7) 73.6 (3,373.3)
Financing cash flows** (21.0) 8.8 – – (12.2)
Changes in fair value
Effect of changes in exchange rates – (90.6) 45.3 45.3 –
Other changes in fair values – (20.0) 4.1 (8.5) (24.4)
Other non-cash movements – (2.9) – – (2.9)
Balance as at 30 June 2018 (100.0) (3,401.9) (21.3) 110.4 (3,412.8)* Assets and liabilities held to hedge borrowings exclude foreign exchange contracts included in note 19.
** Financing cash flows consists of the net amount of proceeds from borrowings, repayment of borrowings and payments of transaction costs related to borrowings in the consolidated statement of cash flows.
AURIZON ANNUAL REPORT 2017–1890
For
per
sona
l use
onl
y

Notes to the consolidated financial statements30 June 2018 (continued)
27 Related party transactions(a) Transactions with Directors and Key Management
PersonnelThere were no Key Management Personnel (KMP) related party transactions during the year (2017: nil).
(b) Transactions with other related partiesThere were no transactions with other related parties during the year (2017: nil).
(c) Terms and conditions of transactions with related parties other than Key Management Personnel or entities related to them and intra group transactions
All other transactions were made on normal commercial terms and conditions and at market rates, except that there are no fixed terms for the repayment of loans between the parent and its subsidiaries. All loans are non interest bearing. Outstanding balances are unsecured.
28 Key Management Personnel compensation
2018 $’000
2017 $’000
Short-term employee benefits 8,769 7,602
Post-employment benefits 290 326
Long-term benefits 96 (57)
Termination benefits – 3,110
Share-based payments 2,159 2,634
11,314 13,615
Short-term employee benefits include cash salary, at risk performance incentives and fees, non-monetary benefits and other short-term benefits. Non-monetary benefits represent the value of Reportable Fringe Benefits for the respective Fringe Benefits Tax year ending 31 March, the estimated value of car parking provided, motor vehicle lease payments and annual leave accrued or utilised during the financial year. Other short-term benefits include sign-on bonus and relocation assistance.
29 Share-based payments
KEEPING IT SIMPLE The share-based payments schemes described in this section were established by the Board of Directors to provide long-term incentives to the Group’s senior executives based on shareholder returns taking into account the Group’s financial and operational performance. Eligible executives may be granted rights on terms and conditions determined by the Board from time to time. The fair value of rights granted under the schemes is recognised as an employee benefits expense with a corresponding increase in equity.
(a) Performance rights planPerformance rights are granted by the Company for nil consideration. Participation in the plan is at the Board’s discretion so that no individual has a contractual right to be awarded rights under the plan or to receive any guaranteed benefits. Each right is a right to receive one fully-paid ordinary share in Aurizon Holdings Limited at no cost if the vesting conditions are satisfied. Rights granted under the plan carry no dividend or voting rights.
The Board will determine the exercise price payable on exercise of a vested right and the exercise period of a right. The Board may, in its discretion, determine that early vesting of a right will occur if there is a takeover bid, scheme of arrangement or some other change of control transaction of the Group. The Board may also accelerate the vesting of some or all of the rights held by an executive in specified circumstances. These include but are not limited to death, total and permanent disablement, or cessation of employment.
The share-based payment schemes are described as follows:
Short-term Incentive Award (STIA)
A portion of any STIA for the Managing Director & CEO as well as the executive management team will be awarded in rights to ordinary shares and 40% is deferred for a period of one year. The rights will vest after one year and become exercisable provided that the executive remains employed by the Group at the vesting date, unless otherwise determined by the Board.
Long-term Incentive Award (LTIA)Performance rights are granted to senior executives as part of the Group’s LTIA. The first grant of LTIA rights was in November 2010. The rights are subject to employment service conditions and satisfying market based performance hurdles of Total Shareholder Return (TSR), non-market based Operating Ratio (OR) and Return on Invested Capital (ROIC). In 2017, the OR hurdle was removed as a company hurdle. In the event that company hurdles are not achieved, in relation to the 2014 and 2015 awards, the performance period may be extended for a further year at the discretion of the Board. Retesting will no longer form part of the LTIA from the 2016 award.
RetentionsAt the Board’s discretion, eligible executives may be granted retention rights that may vest at the end of the specified retention period or project provided that the executive remains employed by the Group at the vesting date.
FINANCIAL REPORT 91
For
per
sona
l use
onl
y
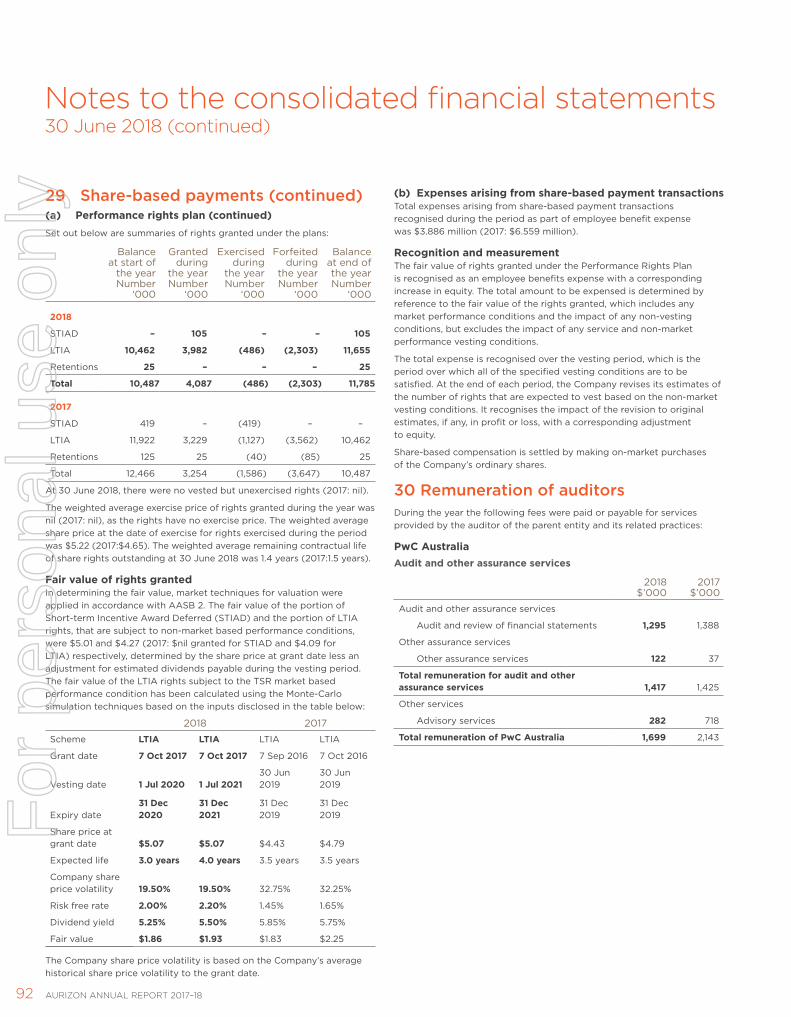
Notes to the consolidated financial statements30 June 2018 (continued)
29 Share-based payments (continued)(a) Performance rights plan (continued) Set out below are summaries of rights granted under the plans:
Balance at start of
the year Number
‘000
Granted during
the year Number
‘000
Exercised during
the year Number
‘000
Forfeited during
the year Number
‘000
Balance at end of the year Number
‘000
2018
STIAD – 105 – – 105
LTIA 10,462 3,982 (486) (2,303) 11,655
Retentions 25 – – – 25
Total 10,487 4,087 (486) (2,303) 11,785
2017
STIAD 419 – (419) – –
LTIA 11,922 3,229 (1,127) (3,562) 10,462
Retentions 125 25 (40) (85) 25
Total 12,466 3,254 (1,586) (3,647) 10,487
At 30 June 2018, there were no vested but unexercised rights (2017: nil).
The weighted average exercise price of rights granted during the year was nil (2017: nil), as the rights have no exercise price. The weighted average share price at the date of exercise for rights exercised during the period was $5.22 (2017:$4.65). The weighted average remaining contractual life of share rights outstanding at 30 June 2018 was 1.4 years (2017:1.5 years).
Fair value of rights grantedIn determining the fair value, market techniques for valuation were applied in accordance with AASB 2. The fair value of the portion of Short-term Incentive Award Deferred (STIAD) and the portion of LTIA rights, that are subject to non-market based performance conditions, were $5.01 and $4.27 (2017: $nil granted for STIAD and $4.09 for LTIA) respectively, determined by the share price at grant date less an adjustment for estimated dividends payable during the vesting period. The fair value of the LTIA rights subject to the TSR market based performance condition has been calculated using the Monte-Carlo simulation techniques based on the inputs disclosed in the table below:
2018 2017
Scheme LTIA LTIA LTIA LTIA
Grant date 7 Oct 2017 7 Oct 2017 7 Sep 2016 7 Oct 2016
Vesting date 1 Jul 2020 1 Jul 202130 Jun 2019
30 Jun 2019
Expiry date31 Dec 2020
31 Dec 2021
31 Dec 2019
31 Dec 2019
Share price at grant date $5.07 $5.07 $4.43 $4.79
Expected life 3.0 years 4.0 years 3.5 years 3.5 years
Company share price volatility 19.50% 19.50% 32.75% 32.25%
Risk free rate 2.00% 2.20% 1.45% 1.65%
Dividend yield 5.25% 5.50% 5.85% 5.75%
Fair value $1.86 $1.93 $1.83 $2.25
The Company share price volatility is based on the Company’s average historical share price volatility to the grant date.
(b) Expenses arising from share-based payment transactionsTotal expenses arising from share-based payment transactions recognised during the period as part of employee benefit expense was $3.886 million (2017: $6.559 million).
Recognition and measurementThe fair value of rights granted under the Performance Rights Plan is recognised as an employee benefits expense with a corresponding increase in equity. The total amount to be expensed is determined by reference to the fair value of the rights granted, which includes any market performance conditions and the impact of any non-vesting conditions, but excludes the impact of any service and non-market performance vesting conditions.
The total expense is recognised over the vesting period, which is the period over which all of the specified vesting conditions are to be satisfied. At the end of each period, the Company revises its estimates of the number of rights that are expected to vest based on the non-market vesting conditions. It recognises the impact of the revision to original estimates, if any, in profit or loss, with a corresponding adjustment to equity.
Share-based compensation is settled by making on-market purchases of the Company’s ordinary shares.
30 Remuneration of auditorsDuring the year the following fees were paid or payable for services provided by the auditor of the parent entity and its related practices:
PwC AustraliaAudit and other assurance services
2018 $’000
2017 $’000
Audit and other assurance services
Audit and review of financial statements 1,295 1,388
Other assurance services
Other assurance services 122 37
Total remuneration for audit and other assurance services 1,417 1,425
Other services
Advisory services 282 718
Total remuneration of PwC Australia 1,699 2,143
AURIZON ANNUAL REPORT 2017–1892
For
per
sona
l use
onl
y

Notes to the consolidated financial statements30 June 2018 (continued)Notes to the consolidated financial statements30 June 2018 (continued)
31 Summary of other significant accounting policies
Other significant accounting policies adopted in the preparation of these consolidated financial statements are set out below. These policies have been consistently applied to all the years presented, unless otherwise stated. Where necessary, comparative information has been restated to conform with changes in presentation in the current year.
(a) Basis of preparation(i) New and amended standards adopted by the GroupCertain new accounting standards and amendments to standards have been published that are mandatory for 30 June 2018 reporting periods. The Group has assessed these new standards and amendments and they do not materially impact the amounts recognised in the current period or any prior period and are not likely to affect any future periods. The Group has not early adopted any amendments, standards or interpretations that have been issued but are not yet effective in the current year except for AASB 9 Financial Instruments which was early adopted in the year ended 30 June 2015.
(ii) New standards and interpretations not yet adoptedCertain new accounting standards and interpretations have been published that are not mandatory for 30 June 2018 reporting periods and have not been early adopted by the Group, other than AASB 9 as outlined above. The Group’s assessment of the impact of these new standards and interpretations is set out below.
AASB 15 Revenue from Contracts with Customers (mandatory for financial year beginning 1 July 2018)Nature of change:
The AASB has issued a new standard for the recognition of revenue. This will replace AASB 118 which covers revenue arising from the sale of goods and the rendering of services, and AASB 111 which covers construction contracts. The new standard is based on the principle that revenue is recognised when control of a good or service transfers to a customer. The standard permits either a full retrospective or a modified retrospective approach for the adoption.
Impact:
The Group has reviewed sales contracts that together account for 99% of the Group’s sales revenue from continuing operations to identify the potential changes in: timing of revenue recognition, measurement of the amount of revenue and note disclosure between the current standard AASB 118 and AASB 15.
Revenue is currently derived from:
Freight Transport Services
› Transport of coal from mines in Queensland and New South Wales to end customers and ports
› Transport of bulk mineral commodities (including iron ore), agricultural products, mining and industrial inputs, and general freight throughout Queensland and Western Australia
Access
› Provision of access to, and operation of, the Central Queensland Coal Network; and
Other
› Other services including the provision of maintenance and rail grinding
Revenue for freight transport services is currently recognised under AASB 118 once the individual service has been provided and is calculated based on the rates agreed with customers on a tonnes per delivery basis. Access revenue is currently also recognised under AASB 118 once the individual service has been provided and is calculated based on a number of operating parameters, including the volume hauled and regulator approved tariffs.
On adoption of AASB 15, timing of recognition and measurement of revenue for freight services and access revenue will be consistent with the current treatment. Under AASB 15, individual services are considered separate performance obligations and freight transport and access revenue will continue to be recognised once the service has been provided.
Revenue from other services primarily includes rail grinding services and Transport Service Contract (TSC) payments received from the State Government for regional freight and livestock transport. Under AASB 118, revenue for other services is recognised once the service has been provided and is calculated in line with contractual arrangements. On adoption of AASB 15, there will be no change in the timing of recognition and measurement of revenue.
Other revenue earned by the Group includes payments in relation to Access Facilitation Deeds (AFD) for mine specific infrastructure which is currently recognised under AASB 118 over the term of the contract as services are provided and external maintenance which is recognised under AASB 118 once the service has been performed. Similarly as above, on adoption of AASB 15, there will be no change in the timing of recognition and measurement of other revenue.
Based on the completed assessment, there will be no impact on adoption of AASB 15.
The Group will adopt the modified transitional approach to implementation where any transitional adjustment is recognised in retained earnings at 1 July 2018 without adjustment of comparatives and the new standard will only be applied to contracts that remain in force at that date.
AASB 16 Leases (mandatory for financial year beginning 1 July 2019) Nature of change:
AASB 16 was issued in February 2016 and replaces AASB 117 Leases. It will result in almost all leases being recognised on the balance sheet as the distinction between operating and finance leases is removed. Under the new standard, an asset (the right to use the leased item) and a financial liability to pay rentals are recognised. The only exceptions are short-term and low-value leases. The accounting by lessors, however, will not significantly change.
Impact:
Management is currently assessing the effects of applying the new standard on the Group’s financial statements. AASB 16 will result in higher assets and liabilities on the balance sheet. Information on the undiscounted amount of the Group’s non-cancellable lease commitments defined under AASB 117 as at 30 June 2018 is disclosed in note 33. The present value of the Group’s operating lease payments as defined under the new standard will be recognised as lease liabilities on the balance sheet and included in net debt.
FINANCIAL REPORT 9393
For
per
sona
l use
onl
y

Notes to the consolidated financial statements30 June 2018 (continued)
31 Summary of other significant accounting policies (continued)
(a) Basis of preparation (continued)(ii) New standards and interpretations not yet adopted
(continued)To date, work has focused on the identification and understanding of the provisions of the standard which will most impact the Group, establishing the population of lease contracts which will extend beyond 1 July 2019, the provision of training, impact analysis, discount rate determination and the review of system requirements. In FY19, work on these issues and their resolution will continue. A significant proportion by value of the Group’s current operating lease commitments relate to property and effort to date has focussed on this area.
The recognition of depreciation and interest expense instead of operating lease payments in the Consolidated Income Statement, will result in an increase in EBITDA, depreciation and interest.
This standard must be implemented retrospectively, either with the restatement of comparatives or with the cumulative impact of application recognised as at 1 July 2019 under the modified retrospective approach. The Group currently expects to use the modified retrospective approach.
Under the modified retrospective approach, the right of use asset may be deemed to be equivalent to the liability at transition or calculated retrospectively as at inception of the lease, on a lease-by-lease basis.
(b) Cash and cash equivalentsCash and cash equivalents includes cash on hand; deposits held ‘at call’ with financial institutions; and other short-term, highly liquid investments with original maturities of three months or less that are readily convertible to known amounts of cash and which are subject to an insignificant risk of changes in value.
(c) Foreign currency and commodity transactions(i) Functional and presentation currencyItems included in the financial statements of each of the Group’s entities are measured using the currency of the primary economic environment in which the entity operates (the functional currency). The consolidated financial statements are presented in Australian dollars, which is the Company’s functional and presentation currency.
(ii) Transactions and balancesWhere the Group is exposed to the risk of fluctuations in foreign exchange rates and market interest rates, it enters into financial arrangements to reduce these exposures. While the value of these financial instruments is subject to risk that market rates/prices may change subsequent to acquisition, such changes will generally be offset by opposite effects on the items being hedged.
Foreign currency transactions are translated into the functional currency using the exchange rates at the dates of the transactions. Foreign exchange gains and losses resulting from the settlement of such transactions and from the translation of monetary assets and liabilities denominated in foreign currencies at year end exchange rates are generally recognised in profit or loss. They are deferred in equity if they relate to qualifying cash flow hedges and qualifying net investment hedges or are attributable to part of the net investment in a foreign operation.
Foreign exchange gains and losses that relate to borrowings are presented in the income statement, within finance costs. All other foreign exchange gains and losses are presented in the income statement on a net basis within other income or other expenses.
Non-monetary items that are measured at fair value in a foreign currency are translated using the exchange rates at the date when the fair value was determined. Translation differences on assets and liabilities carried at fair value are reported as part of the fair value gain or loss.
(d) LeasesOperating leases on property, plant and equipmentLeases in which a significant portion of the risks and rewards of ownership are not transferred to the Group, as lessee, are classified as operating leases. Payments made under operating leases (net of any incentives received from the lessor) are charged to the income statement on a straight-line basis over the period of the lease.
Rental revenue from operating leases where the Group is a lessor is recognised as income on a straight-line basis over the lease term. Where a sale and lease back transaction has occurred, the lease is classified as either a finance lease or operating lease based on whether risks and rewards of ownership are transferred or not.
AURIZON ANNUAL REPORT 2017–1894
For
per
sona
l use
onl
y

31 Summary of other significant accounting policies (continued)
(e) Financial instruments(i) Non-derivative financial assetsThe Group initially recognises financial assets on the trade date at which the Group becomes a party to the contractual provisions of the instrument. Financial assets are derecognised when the rights to receive cash flows from the financial assets have expired or have been transferred and the Group has transferred substantially all the risks and rewards of ownership.
Financial assets are initially measured at fair value. If the financial asset is not subsequently accounted for at fair value through profit or loss, then the initial measurement includes transaction costs that are directly attributable to the asset’s acquisition or origination. On initial recognition, the Group classifies its financial assets as subsequently measured at either amortised cost or fair value, depending on its business model for managing the financial assets and the contractual cash flow characteristics of the financial assets.
(ii) Financial assets measured at amortised costA financial asset is subsequently measured at amortised cost, using effective interest method and net of any impairment loss, if
› The asset is held within the business model whose objective is to hold assets in order to collect contractual cash flows; and
› The contractual terms of the financial asset give rise, on specified dates, to cash flows that are solely payments of principal and interest
The Group assesses at each reporting date whether there is objective evidence that a financial asset (or group of financial assets) is impaired. For trade receivables, the Group applies the simplified approach permitted by AASB 9, which requires expected lifetime losses to be recognised from initial recognition of the receivables.
(iii) Non-derivative liabilitiesThe Group initially recognises loans and debt securities issued on the date when they originate. Other financial liabilities are initially recognised on the trade date. The Group derecognises a financial liability when its contractual obligations are discharged or cancelled or expire.
Non-derivative financial liabilities are initially recognised at fair value less any directly attributable transaction costs. Subsequent to initial recognition, these liabilities are measured at amortised cost using the effective interest method.
(f) Goods and Services Tax (GST)Revenues, expenses and assets are recognised net of the amount of associated GST, unless the amount of GST incurred is not recoverable from the Australian Taxation Office (ATO). In this case, the GST is recognised as part of the cost of acquisition of the asset or as part of the expense.
Receivables and payables are stated inclusive of the amount of GST receivable or payable. The net amount of GST recoverable from, or payable to, the ATO is included with other receivables or payables in the balance sheet.
Cash flows are presented in the cash flow statement on a gross basis. The GST components of cash flows arising from investing or financing activities which are recoverable from, or payable to the ATO, are presented as operating cash flows.
The Company and its subsidiaries are grouped for GST purposes. Therefore, any inter-company transactions within the Group do not attract GST.
Notes to the consolidated financial statements30 June 2018 (continued)
95FINANCIAL REPORT FINANCIAL REPORT 95
For
per
sona
l use
onl
y

AURIZON ANNUAL REPORT 2017–18
Unrecognised items
IN THIS SECTION
Unrecognised items provide information about items that are not recognised in the financial statements but could potentially have a significant impact on the Group’s financial position and performance.
32 Contingencies Page 97
33 Commitments Page 97
34 Events occurring after the reporting period Page 97
96
For
per
sona
l use
onl
y

Notes to the consolidated financial statements30 June 2018 (continued)
32 Contingencies
KEEPING IT SIMPLE Contingencies relate to the outcome of future events and may result in an asset or liability, but due to current uncertainty, do not qualify for recognition.
(a) Contingent liabilitiesIssues relating to common law claims and product warranties are dealt with as they arise. There were no material contingent liabilities requiring disclosure in the financial statements, other than as set out below.
Guarantees and letters of creditFor information about guarantees, including the Moorebank parent company guarantee, and letters of credit given by the Group, refer to note 18(d).
(b) Contingent assetsGuarantees and letters of creditFor information about guarantees given to the Group, refer to note 18(d).
33 Commitments(a) Capital commitments
2018 $m
2017 $m
Property, plant and equipment
Within one year 91.4 131.7
(b) Lease commitments2018
$m2017
$m
Commitments for minimum lease payments in relation to non-cancellable operating leases are payable as follows:
Within one year 29.8 55.9
Later than one year but not later than five years 122.3 85.6
Later than five years 169.7 38.7
321.8 180.2
The above commitments flow primarily from operating leases of property and machinery. These leases, with terms mostly ranging from one to ten years, generally provide the Group with a right of renewal at which time the lease terms are renegotiated. The lease payments comprise a base amount, while the property leases also contain a contingent rental, which is based on either the movements in the Consumer Price Index or another fixed percentage as agreed between the parties.
34 Events occurring after the reporting period
On 14 August 2017, the Group announced the intention to exit the Intermodal business through a combination of closure and sale. Aurizon signed a binding agreement with Pacific National to sell its Acacia Ridge Intermodal Terminal. Aurizon signed a separate binding agreement to sell its Queensland Intermodal business to a consortium of Linfox and Pacific National (QI BSA). The transactions are subject to Approval by the Australian Competition & Consumer Commission (ACCC) and Foreign Investment & Review Board (FIRB). Refer to Key events and transactions for reporting period and note 24 for further information.
The ACCC decision was announced on 19 July 2018. The ACCC decided to oppose both transactions and commenced proceedings against Pacific National and Aurizon in the Federal Court of Australia. The ACCC has sought declarations, pecuniary penalties, orders restraining the existing sale transactions from proceeding and costs. The ACCC has also sought an injunction to prevent Aurizon from closing its Queensland Intermodal business while proceedings are on foot. While Aurizon refutes the ACCC’s allegations and will defend the proceedings including seeking clearance of the Acacia Ridge transaction, there is a risk that the Acacia Ridge transaction will be prevented from completing and/or Aurizon incurs orders for pecuniary penalties and costs. There is also the risk that, in the interim whilst the matter is being determined by the Court, Aurizon is injuncted from closing the Queensland Intermodal business.
On 12 August 2018 Aurizon provided Pacific National with a notice to terminate the Business Sale Agreement for the Queensland Intermodal business, with effect from 13 August 2018. It is Aurizon’s intention to not contest clearance of that transaction through the Federal Court and to exit the business. As clearance has not been obtained for the sale of the Queensland Intermodal business, $10 millon of the consideration received for the transactions to date (recognised as a liability at 30 June 2018) will be refunded to Pacific National. The Business Sale Agreement for the Acacia Ridge Terminal remains in place while Aurizon seeks clearance of that transaction, and the remainder of the consideration received for the transactions to date ($35 million) is not refundable.
On 10 August 2018 the Federal Court of Australian heard an application from the ACCC for an interlocutory injunction to require Aurizon to continue to operate the Queensland Intermodal business in the ordinary and usual course. The Court reserved judgement on the matter, and judgement is currently expected to be handed down on 13 August 2018.
97FINANCIAL REPORT
For
per
sona
l use
onl
y
Directors’ Declaration30 June 2018
In accordance with a resolution of the Directors of the Company, I state that:
In the opinion of the Directors of the Company:
(a) the financial statements and notes set out on pages 46 to 97 are in accordance with the Corporations Act 2001, including:
(i) complying with Accounting Standards and other mandatory professional reporting requirements as detailed above, and the Corporations Regulations 2001,
(ii) giving a true and fair view of the consolidated entity’s financial position as at 30 June 2018 and of its performance for the year ended on that date, and
(b) there are reasonable grounds to believe that the Company will be able to pay its debts as and when they become due and payable, and
(c) at the date of this declaration, there are reasonable grounds to believe that the members of the extended closed group identified in note 23 will be able to meet any obligations or liabilities to which they are, or may become, subject by virtue of the deed of cross guarantee described in note 23.
Page 51 confirms that the financial statements also comply with International Financial Reporting Standards as issued by the International Accounting Standards Board.
The Directors have been given the declarations by the Managing Director & Chief Executive Officer and Chief Financial Officer required by section 295A of the Corporations Act 2001.
T Poole Chairman Brisbane 12 August 2018
98 AURIZON ANNUAL REPORT 2017–18
For
per
sona
l use
onl
y

PricewaterhouseCoopers, ABN 52 780 433 757480 Queen Street, BRISBANE QLD 4000, GPO Box 150, BRISBANE QLD 4001 T: +61 7 3257 5000, F: +61 7 3257 5999, www.pwc.com.au
Liability limited by a scheme approved under Professional Standards Legislation.
Independent auditor’s report To the members of Aurizon Holdings Limited
Report on the audit of the financial report
Our opinion In our opinion:
The accompanying financial report of Aurizon Holdings Limited (the Company) and its controlled entities (together the Group) is in accordance with the Corporations Act 2001, including:
(a) giving a true and fair view of the Group's financial position as at 30 June 2018 and of its financial performance for the year then ended
(b) complying with Australian Accounting Standards and the Corporations Regulations 2001.
What we have audited The Group financial report comprises:
the consolidated income statement for the year ended 30 June 2018 the consolidated statement of comprehensive income for the year then ended the consolidated balance sheet as at 30 June 2018 the consolidated statement of changes in equity for the year then ended the consolidated statement of cash flows for the year then ended the notes to the consolidated financial statements, which include a summary of other significant
accounting policies the directors’ declaration.
Basis for opinion We conducted our audit in accordance with Australian Auditing Standards. Our responsibilities under those standards are further described in the Auditor’s responsibilities for the audit of the financial report section of our report.
We believe that the audit evidence we have obtained is sufficient and appropriate to provide a basis for our opinion.
Independence We are independent of the Group in accordance with the auditor independence requirements of the Corporations Act 2001 and the ethical requirements of the Accounting Professional and Ethical Standards Board’s APES 110 Code of Ethics for Professional Accountants (the Code) that are relevant to our audit of the financial report in Australia. We have also fulfilled our other ethical responsibilities in accordance with the Code.
99FINANCIAL REPORT
For
per
sona
l use
onl
y
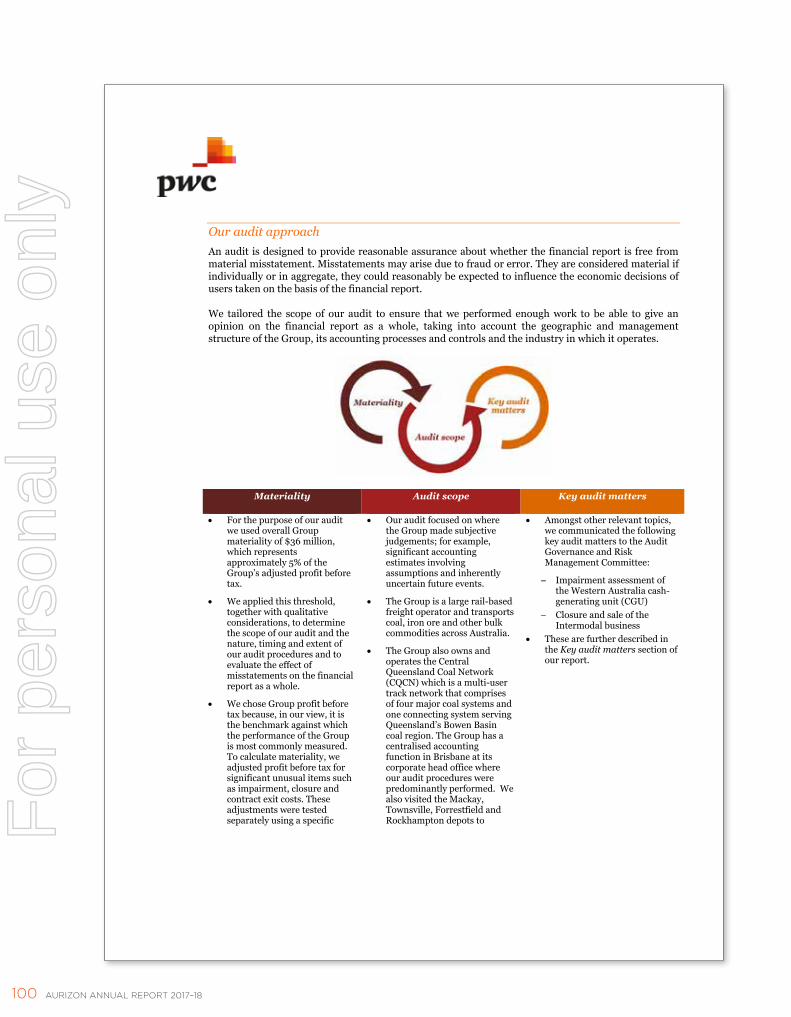
Our audit approach An audit is designed to provide reasonable assurance about whether the financial report is free from material misstatement. Misstatements may arise due to fraud or error. They are considered material if individually or in aggregate, they could reasonably be expected to influence the economic decisions of users taken on the basis of the financial report.
We tailored the scope of our audit to ensure that we performed enough work to be able to give an opinion on the financial report as a whole, taking into account the geographic and management structure of the Group, its accounting processes and controls and the industry in which it operates.
Materiality Audit scope Key audit matters
For the purpose of our audit we used overall Group materiality of $36 million, which represents approximately 5% of the Group’s adjusted profit before tax.
We applied this threshold, together with qualitative considerations, to determine the scope of our audit and the nature, timing and extent of our audit procedures and to evaluate the effect of misstatements on the financial report as a whole.
We chose Group profit before tax because, in our view, it is the benchmark against which the performance of the Group is most commonly measured. To calculate materiality, we adjusted profit before tax for significant unusual items such as impairment, closure and contract exit costs. These adjustments were tested separately using a specific
Our audit focused on where the Group made subjective judgements; for example, significant accounting estimates involving assumptions and inherently uncertain future events.
The Group is a large rail-based freight operator and transports coal, iron ore and other bulk commodities across Australia.
The Group also owns and operates the Central Queensland Coal Network (CQCN) which is a multi-user track network that comprises of four major coal systems and one connecting system serving Queensland’s Bowen Basin coal region. The Group has a centralised accounting function in Brisbane at its corporate head office where our audit procedures were predominantly performed. We also visited the Mackay, Townsville, Forrestfield and Rockhampton depots to
Amongst other relevant topics, we communicated the following key audit matters to the Audit Governance and Risk Management Committee:
Impairment assessment of the Western Australia cash-generating unit (CGU)
Closure and sale of the Intermodal business
These are further described in the Key audit matters section of our report.
100 AURIZON ANNUAL REPORT 2017–18
For
per
sona
l use
onl
y

materiality level.
We utilised a 5% threshold based on our professional judgement, noting it is within the range of commonly acceptable thresholds.
perform audit procedures on inventory.
Key audit matters Key audit matters are those matters that, in our professional judgement, were of most significance in our audit of the financial report for the current period. The key audit matters were addressed in the context of our audit of the financial report as a whole, and in forming our opinion thereon, and we do not provide a separate opinion on these matters. Further, any commentary on the outcomes of a particular audit procedure is made in that context.
Key audit matter How our audit addressed the key audit matter
Impairment assessment of the Western Australia cash-generating unit (WA CGU)
In the second half of FY2018, an iron ore customer, Cliffs Asia Pacific Iron Ore Pty Ltd (Cliffs) announced the planned closure of mining operations in Australia. The contract provided for haulage of up to 11mt of iron ore per annum and was due to expire on 31 January 2022. On 29 June 2018 Cliffs issued a contract termination notice, effective 30 June 2018.
This is an indicator of impairment for the WA CGU and the Group performed an impairment assessment of the carrying value of the WA CGU.
This resulted in a pre-tax impairment of $27.9 million in respect of contract specific assets and a further $31.7 million in relation to the WA CGU. The recoverable amount of the WA CGU ($170.7 million) was determined using a value in use (VIU) methodology utilising a discounted cashflow model (the model).
The recoverable amount used in the impairment test is based on the Board-approved corporate plan, a terminal growth rate of 2.2% and a pre-tax discount rate of 11.7%.
We considered this a key audit matter due to the judgements required by the Group in formulating the Board approved corporate plan and estimating the terminal growth rate and pre-tax discount rate.
Refer to Key events and transactions for the reporting period and Note 4 Impairment of non-financial assets in the Annual Report for further details.
To evaluate the Group’s assessment of the recoverable amount of the WA CGU, we performed the following procedures, amongst others:
Assessed whether the division of the Group’s property, plant and equipment assets into CGUs, which are the smallest identifiable groups of assets that can generate largely independent cash inflows, was consistent with our knowledge of the Group’s operations and internal Group reporting.
Assessed whether the carrying value of the WA CGU included all assets, liabilities and cashflows directly attributable to the CGU and a reasonable allocation of corporate overheads.
Evaluated if VIU was the highest basis upon which the CGU is recoverable as required by the Australian Accounting Standards.
Evaluated the Group’s historical ability to forecast future cashflows by comparing budgets with reported prior year actual results.
Tested that forecast cashflows used in the model were consistent with the most up-to-date corporate plan formally approved by the Board.
Evaluated the terminal value EBITDA and sustaining capital assumptions used in the model including consideration of the forecast value of sustaining capital expenditure against actual capital expenditure incurred over prior periods.
101FINANCIAL REPORT
For
per
sona
l use
onl
y
Key audit matter How our audit addressed the key audit matter
Assessed, with the assistance of PwC valuation experts:
o the forecast long term growth rate of 2.2% by comparing it to economic forecasts;
o that the discount rate of 11.7% (pre-tax nominal) appropriately reflects the risks of the CGU; and
o the mathematical accuracy of the model.
Evaluated the Group’s sensitivity analysis to assess if further impairment would occur and whether this was reasonably possible.
Evaluated the adequacy of the disclosures made in note 4, including the key assumptions and sensitivities to changes in such assumptions in light of the requirements of Australian Accounting Standards.
Closure and Sale of the Intermodal business
On 14 August 2017 the Group announced its intention to exit the Intermodal business through a combination of closure and sale.
The Group signed binding agreements to sell its Acacia Ridge Intermodal Terminal and Queensland Intermodal Business for total consideration of $225 million. The transactions have been subject to approval by the Australian Competition & Consumer Commission (ACCC) and the Foreign Investment & Review Board (FIRB).
Subsequent to the year-end, on 19 July 2018, the ACCC opposed both transactions and commenced proceedings against Pacific National and the Group in the Federal Court of Australia.
The ACCC has also sought an injunction to prevent the Group from closing its Queensland Intermodal Business while proceedings are on foot.
On 12 August 2018 the Group issued a termination notice to terminate the Queensland Intermodal Business sale agreement with effect from 13 August 2018.
The Group will defend the ACCC proceedings and remains committed to the exit of Intermodal. On this basis the Acacia Ridge and Queensland Intermodal Business assets remain classified as held for sale and discontinued operation at 30 June 2018.
We considered this a key audit matter given:
it was a significant transaction in the year; and
To assess the impact of the closure and sale of the Intermodal business, the following procedures were performed, amongst others:
We developed our understanding of the transaction through discussions with the Group, reading the binding sale agreements and other supporting documentation including the decision made by the ACCC.
We considered the Group’s decision to disclose the Intermodal Business as discontinued and we assessed the classification of the assets and liabilities as held for sale in light of the requirements of Australian Accounting Standards.
We evaluated the adequacy of the disclosures made in the Financial Report in light of the requirements of Australian Accounting Standards.
102 AURIZON ANNUAL REPORT 2017–18
For
per
sona
l use
onl
y

Key audit matter How our audit addressed the key audit matter
the judgement required by the Group regarding the continued classification of the Intermodal businesses as held for sale and discontinued operation due to the ACCC decision and proceedings in the Federal Court of Australia.
Refer to Key events and transactions for the reporting period and Note 24 Discontinued operation in the Annual Report for further details.
Other information The directors are responsible for the other information. The other information comprises the information included in the annual report for the year ended 30 June 2018, including the FY2018 in Review, Chairman’s Report, Managing Director & CEO’s Report, Directors' Report, Corporate Governance Statement, Non-IFRS financial information, Shareholder Information, Glossary and Corporate Information, but does not include the financial report and our auditor’s report thereon.
Our opinion on the financial report does not cover the other information and accordingly we do not express any form of assurance conclusion thereon.
In connection with our audit of the financial report, our responsibility is to read the other information identified above and, in doing so, consider whether the other information is materially inconsistent with the financial report or our knowledge obtained in the audit, or otherwise appears to be materially misstated.
If, based on the work we have performed, we conclude that there is a material misstatement of this other information, we are required to report that fact. We have nothing to report in this regard.
Responsibilities of the directors for the financial report The directors of the Company are responsible for the preparation of the financial report that gives a true and fair view in accordance with Australian Accounting Standards and the Corporations Act 2001and for such internal control as the directors determine is necessary to enable the preparation of the financial report that gives a true and fair view and is free from material misstatement, whether due to fraud or error.
In preparing the financial report, the directors are responsible for assessing the ability of the Group to continue as a going concern, disclosing, as applicable, matters related to going concern and using the going concern basis of accounting unless the directors either intend to liquidate the Group or to cease operations, or have no realistic alternative but to do so.
Auditor’s responsibilities for the audit of the financial report Our objectives are to obtain reasonable assurance about whether the financial report as a whole is free from material misstatement, whether due to fraud or error, and to issue an auditor’s report that includes our opinion. Reasonable assurance is a high level of assurance, but is not a guarantee that an
103FINANCIAL REPORT
For
per
sona
l use
onl
y
audit conducted in accordance with the Australian Auditing Standards will always detect a material misstatement when it exists. Misstatements can arise from fraud or error and are considered material if, individually or in the aggregate, they could reasonably be expected to influence the economic decisions of users taken on the basis of the financial report.
A further description of our responsibilities for the audit of the financial report is located at the Auditing and Assurance Standards Board website at:
http://www.auasb.gov.au/auditors_responsibilities/ar1.pdf.
This description forms part of our auditor's report.
Report on the remuneration report
Our opinion on the remuneration report We have audited the Remuneration Report included in pages 25 to 38 of the Directors’ Report for the year ended 30 June 2018.
In our opinion, the remuneration report of Aurizon Holdings Limited for the year ended 30 June 2018 complies with section 300A of the Corporations Act 2001.
Responsibilities The directors of the Company are responsible for the preparation and presentation of the remuneration report in accordance with section 300A of the Corporations Act 2001. Our responsibility is to express an opinion on the remuneration report, based on our audit conducted in accordance with Australian Auditing Standards.
PricewaterhouseCoopers
Nadia Carlin Tim Allman Partner
Brisbane12 August 2018
Partner
104 AURIZON ANNUAL REPORT 2017–18
For
per
sona
l use
onl
y
Non-IFRS Financial Information in 2017-18 Annual Report
In addition to using profit as a measure of the Group and its segments’ financial performance, Aurizon uses EBIT (Statutory and Underlying), EBITDA (Statutory and Underlying), EBITDA margin – Underlying, Operating Ratio – Underlying, NPAT Underlying, Return On Invested Capital (ROIC), Net debt and Net gearing ratio. These measurements are not defined under IFRS and are, therefore, termed ‘Non-IFRS’ measures.
EBIT – Statutory is defined as Group profit before net finance costs and tax, while EBITDA – Statutory is Group profit before net finance costs, tax, depreciation and amortisation. EBIT Underlying can differ from EBIT – Statutory due to exclusion of significant items that permits a more appropriate and meaningful analysis of the underlying performance on a comparative basis. EBITDA margin is calculated by dividing underlying EBITDA by the total revenue. These measures are considered to be useful measures of the Group’s operating performance because they approximate the underlying operating cash flow by eliminating depreciation and/or amortisation.
NPAT Underlying represents the underlying EBIT less finance costs less tax expense excluding tax impact of significant adjustments.
Operating Ratio – is defined as one less underlying EBIT divided by total revenue. The Operating Ratio is a performance measure of the operating cost of earning each dollar of revenue and it is used as one of the key performance measures of the Key Management Personnel.
ROIC is defined as underlying rolling twelve month EBIT divided by the average invested capital. The average invested capital is calculated by taking the rolling twelve month average of net property, plant and equipment including assets under construction plus investments accounted for using the equity method, plus net intangibles plus current assets less cash, less current liabilities. This measure is intended to ensure there is alignment between investment in infrastructure and superior returns for shareholders.
Net debt consists of borrowings (both current and non-current) less cash and cash equivalents. Net gearing ratio is defined as Net debt divided by Shareholders Equity plus Net debt. Net debt and Net gearing ratio are measures of the Group’s indebtedness and provides an indicator of the balance sheet strength.
These above mentioned measures are commonly used by management, investors and financial analysts to evaluate companies’ performance.
A reconciliation of the non-IFRS measures and specific items to the nearest measure prepared in accordance with IFRS is included in the table. The non-IFRS financial information contained within this Directors’ report and Notes to the Financial Statements has not been audited in accordance with Australian Auditing Standards.
105FINANCIAL REPORT
For
per
sona
l use
onl
y

2018 2017
Continuing operations
$m
Discontinued operation
$m
Continuing operations
$m
Discontinued operation
$m
Profit/(loss) before income tax 801.3 (98.7) (54.2) (215.3)
Finance costs (net) 165.0 – 178.6 0.1
EBIT – Statutory 966.3 (98.7) 124.4 (215.2)
Significant adjustments:
Bulk contract exit impairment 27.9 – 10.2 –
Bulk contract exit termination payment (66.3) – – –
Bulk contract exit costs – redundancy and closure costs 3.9 – – –
Bulk impairment 31.7 – 525.9 –
Freight Management Transformation (FMT) impairment – – 64.0 –
Transformation – asset impairment – – 48.9 –
Transformation – redundancy costs (22.9) – 110.8 5.0
Intermodal closure costs – 70.1 – –
Intermodal impairment – 4.6 – 162.2
EBIT – Underlying 940.6 (24.0) 884.2 (48.0)
Depreciation and amortisation 525.5 2.3 567.3 17.3
EBITDA – Underlying 1,466.1 (21.7) 1,451.5 (30.7)
Operating Ratio (continuing operations) 69.8% 71.9%
Average invested capital (continuing operations) 8,615 9,473
ROIC (continuing operations) 10.9% 9.3%
2018$m
2017$m
Total borrowings 3,501.9 3,376.2
Less: cash and cash equivalents (34.8) (88.7)
Net debt 3,467.1 3,287.5
Total equity 4,730.1 5,022.1
Total capital 8,197.2 8,309.6
Net Gearing Ratio 42.3% 39.6%
Non-IFRS Financial Information in 2017-18 Annual Report (continued)
106 AURIZON ANNUAL REPORT 2017–18
For
per
sona
l use
onl
y

RANGE OF FULLY PAID ORDINARY SHARES AS AT 6 AUGUST 2018
RANGE TOTAL HOLDERS UNITS % OF ISSUED CAPITAL1 – 1,000 18,523 11,792,971 0.59
1,001 – 5,000 22,966 50,366,979 2.53
5,001 – 10,000 2,855 20,632,650 1.04
10,001 – 100,000 1,924 38,008,586 1.91
100,001 Over 100 1,869,327,146 93.93
Total 46,368 1,990,128,332 100
UNMARKETABLE PARCELS AS AT 6 AUGUST 2018
MINIMUM PARCEL SIZE HOLDERS UNITSMinimum $500.00 parcel at $4.54 per unit 111 770 33,039
The number of shareholders holding less than the marketable parcel of shares is 770 (shares: 33,039).
SUBSTANTIAL HOLDERS OF 5% OR MORE OF FULLY PAID ORDINARY SHARES AS AT 6 AUGUST 2018*
NAME NOTICE DATE SHARESHSBC Holdings PLC 18 May 2016 151,013,818
BlackRock Group 28 Mar 2017 105,643,028
The Vanguard Group Inc 20 Dec 2017 108,337,155
JP Morgan Chase & Co and its affiliates 3 Jan 2018 153,470,787
BNP Paribas Nominees Pty Ltd 16 Jul 2018 149,457,188
* As disclosed in substantial shareholder notices received by the Company.
INVESTOR CALENDAR
2019 DATES DETAILS12 February 2019 Half Year results and interim dividend announcement
25 March 2019 Interim dividend payment date
12 August 2019 Full Year results and final dividend announcement
23 September 2019 Final dividend payment date
17 October 2019 Annual General Meeting
The payment of a dividend is subject to the Corporations Act and Board discretion. The timing of any event listed above may change. Please refer to the Company website, aurizon.com.au, for an up-to-date list of upcoming events.
Shareholder Information
ASX code: AZJContact detailsAurizon GPO Box 456 Brisbane QLD 4001
For general enquiries, please call 13 23 32 within Australia. If you are calling from outside Australia, please dial +61 7 3019 9000.
aurizon.com.au
Investor RelationsFor all information about your shareholding, including employee shareholdings, dividend statements and change of address, contact the share registry Computershare on 1800 776 476 or visit investorcentre.com.
To request information relating to Investor Relations please contact our Investor Relations team on +61 7 3019 1127 or email: [email protected].
107FINANCIAL REPORT
For
per
sona
l use
onl
y

TOP 20 HOLDERS OF FULLY PAID ORDINARY SHARES AS AT 6 AUGUST 2018
NAME UNITS % OF UNITSHSBC CUSTODY NOMINEES (AUSTRALIA) LIMITED 598,713,944 30.08
CITICORP NOMINEES PTY LIMITED 373,128,722 18.75
J P MORGAN NOMINEES AUSTRALIA LIMITED 361,437,751 18.16
BNP PARIBAS NOMINEES PTY LTD <AGENCY LENDING DRP A/C> 194,537,887 9.78
NATIONAL NOMINEES LIMITED 107,548,803 5.40
QUEENSLAND TREASURY HOLDINGS PTY LTD 54,926,186 2.76
NATIONAL NOMINEES LIMITED <N A/C> 39,095,203 1.96
BNP PARIBAS NOMS PTY LTD <DRP> 31,586,673 1.59
HSBC CUSTODY NOMINEES (AUSTRALIA) LIMITED <NT-COMNWLTH SUPER CORP A/C> 16,245,342 0.82
BNP PARIBAS NOMINEES PTY LTD <AGENCY LENDING COLLATERAL> 11,227,765 0.56
CITICORP NOMINEES PTY LIMITED <COLONIAL FIRST STATE INV A/C> 9,314,017 0.47
UBS NOMINEES PTY LTD 5,924,215 0.30
AMP LIFE LIMITED 5,823,071 0.29
CS THIRD NOMINEES PTY LIMITED <HSBC CUST NOM AU LTD 13 A/C> 3,515,119 0.18
AVANTEOS INVESTMENTS LIMITED <ENCIRCLE IMA A/C> 3,350,123 0.17
MERRILL LYNCH (AUSTRALIA) NOMINEES PTY LIMITED 3,282,283 0.16
WOODROSS NOMINEES PTY LTD 3,200,000 0.16
NAVIGATOR AUSTRALIA LTD <SMA ANTARES INV DV BUILD A/C> 3,051,683 0.15
HSBC CUSTODY NOMINEES (AUSTRALIA) LIMITED-GSCO ECA 2,526,600 0.13
AUSTRALIAN UNITED INVESTMENT COMPANY LIMITED 2,500,000 0.13
Totals: Top 20 holders of ORDINARY FULLY PAID SHARES (Total) 1,830,935,387 92.00Total Remaining Holders Balance 159,192,945 8.00
108 AURIZON ANNUAL REPORT 2017-18
For
per
sona
l use
onl
y
Some terms and abbreviations used in this document, together with industry specific terms, have defined meanings.
These terms and abbreviations are set out in this glossary and are used throughout this document.
A reference to dollars, $ or cents in this document is a reference to Australian currency unless otherwise stated. Any reference to a statute, ordinance, code or other law includes regulations and any other instruments under it and consolidations, amendments, re-enactments or replacements of any of them. Any reference to Annual Report is a reference to this document.
ABNAustralian Business Number
Above RailIncludes the business unit segments of Coal, Bulk and Other of Aurizon Holdings Limited
ACNAustralian Company Number
ASICAustralian Securities and Investments Commission
ASXAustralian Securities Exchange operated by ASX Limited (ABN 98 008 624 691)
ASX Listing RulesThe official listing rules of ASX
AurizonAurizon Holdings Limited (ACN 146 335 622) and where the context requires, includes any of its subsidiaries and controlled entities
Below RailThe business unit segment of Network — Aurizon Network Pty Ltd (ACN 132 181 116) a wholly owned subsidiary of Aurizon Holdings Limited
BoardThe Board of Directors of Aurizon Holdings Limited
BulkThe Above Rail Bulk freight haulage operating division of Aurizon Holdings Limited
CAGRCompound Annual Growth Rate, expressed as a percentage per year
CAPEXCapital Expenditure
CGTCapital Gains Tax
CoalThe Above Rail coal haulage operating division of Aurizon Holdings Limited
Company or Aurizon HoldingsAurizon Holdings Limited (ACN 146 335 622) and where the context requires, includes any of its subsidiaries and controlled entities
Company SecretaryThe Company Secretary of Aurizon Holdings Limited
ConstitutionThe constitution of Aurizon Holdings Limited
Corporations ActCorporations Act 2001 (Cth)
CPSCents Per Share
CQCNCentral Queensland Coal Network
EBITEarnings Before Interest and Tax
EBITDAEarnings Before Interest, Tax, Depreciation and Amortisation
EBIT MarginUnderlying Earnings Before Interest and Tax divided by total revenue and other income
EEOEnergy Efficiency Opportunity
EEO ActEnergy Efficiency Opportunity Act 2006 (Cth)
EPSEarnings Per Share
FYFinancial Year ended 30 June, as the context requires
GAPGoonyella to Abbot Point
Glossary
109GLOSSARY
For
per
sona
l use
onl
y

GAPEGoonyella to Abbot Point Expansion
GAAPGenerally Accepted Accounting Principles
IBNRIncurred But Not Reported
IFRSInternational Financial Reporting Standards
kmKilometre
LTIALong Term Incentive Awards
MMillion
MARMaximum Allowable Revenue that Aurizon Network Pty Ltd is entitled to earn from the provision of coal carrying train services in the CQCN across the term of an access undertaking
mtMillions of tonnes
mtpaMillions of tonnes per annum
NetworkAurizon Network Pty Ltd (ACN 132 181 116) a wholly-owned subsidiary of Aurizon Holdings
NGERNational Greenhouse Energy Reporting
NGER ActNational Greenhouse Energy Reporting Act 2007 (Cth)
ntkNet tonne kilometre, unit of measure representing the movement over a distance of one kilometre of one tonne of contents excluding the weight of the locomotive and wagons
OP – Operating Ratio1 – EBIT margin, expressed as a percentage
OPEXOperating Expense including depreciation and amortisation
OTHERA business unit segment of Aurizon Holdings Limited
PPTPercentage Point
QCAQueensland Competition Authority
Queensland RailQueensland Rail Limited (ACN 132 181 090) – this entity is owned by the State and operates the core public rail passenger business
RABRegulated Asset Base, the value of the asset base on which pricing is determined by the price regulator
Rail Process SafetyThe cumulative number of SPAD, derailment and rollingstock to rollingstock collision incidents, per million train kilometres, over a given recording period.
Note: Infrastructure Caused SPADs have been removed from the SPAD element of Aurizon’s Rail Process Safety metric.
ROICReturn on Invested Capital
ShareA fully paid ordinary share in Aurizon Holdings
STIAShort Term Incentive Award
tonneOne metric tonne, being 1,000 kilograms
tonne kilometresThe product of tonnes and distance
TRIFRThe cumulative number of Lost Time Injuries, Medical Treatment Injuries and Restricted Work Injuries sustained by employees and contractors, per million hours worked, over a given recording period
TSCTransport Services Contract entered into between the Queensland State Government and the Company for the provision of regional freight and livestock services
WACCWeighted Average Cost of Capital, expressed as a percentage
WICETWiggins Island Coal Export Terminal
WIRPWiggins Island Rail Project
110 AURIZON ANNUAL REPORT 2017-18
For
per
sona
l use
onl
y
Aurizon Holdings Limited ABN 14 146 335 622
DirectorsTim Poole Andrew Harding Marcelo Bastos Russell Caplan John Cooper Karen Field Michael Fraser Samantha Lewis Kate Vidgen
Company SecretaryDominic D Smith
Registered OfficeLevel 8, 900 Ann Street Fortitude Valley QLD 4006
AuditorsPricewaterhouseCoopers
Share Registry Computershare Investor Services Pty Limited
Level 1, 200 Mary Street Brisbane QLD 4001
Tel: 1800 776 476 (or +61 3 9938 4376)
Corporate Information
111CORPORATE INFORMATION
For
per
sona
l use
onl
y

Aurizon Holdings Limited ABN 14 146 335 622
For
per
sona
l use
onl
y