August 2016 HUG: Open Source Big Data Ingest with StreamSets Data Collector
Upload
otv-online-mediaCategory
view
214download
0description

If your property is currrently listed witha real estate broker, please disregard.It is not my intention to solicit the offerings ofother real estate brokers.
“I expect only the best for you” prin
ted
by O
TVon
lineM
edia
.com
For Further Details Contact:Heather JackmanColdwell Banker Hearthside215.493.9080 x119215.431.0884 cellRL#RS292094
Heather Jackman
Hearthside70 West Afton Ave Yardley PA 19067
215.493.9080 X119Call me to find out why now is a gret time to buy or sell a home.I’ll provide you with a complimentary market analysis of current sales listings in your neighborhood.I’ll also show you my state of the art marketing plan that will enableyou to receive top dollar for your home in today’s challengingmarket place.
I am ready to go to work for you and prove that knowledge,honesty, and integrity will result in a positive and successful transaction.
Visit Heather Jackman’s
Channel
Follow Heather Jackman
on Twitter
Lic in PA & NJ # 1006608

f
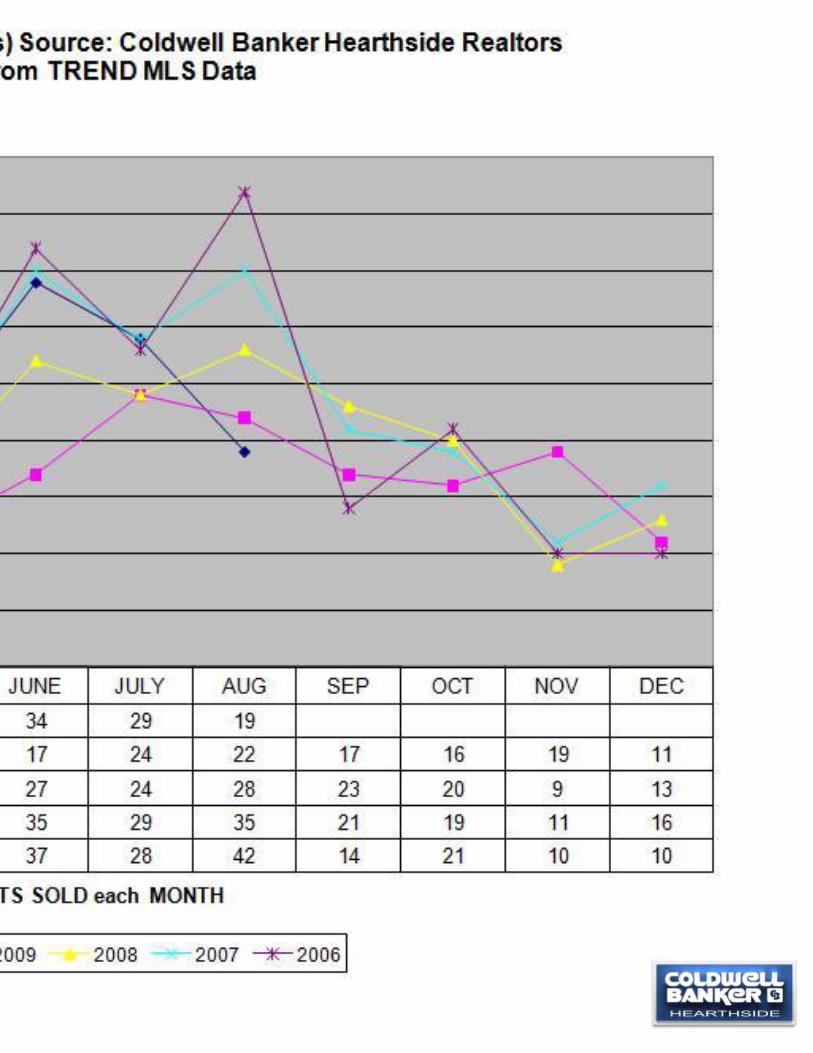
DOYLESTOWN TOWNSHIP SINGLE FAMILY HOMES
Market Facts as of AUGUST YTD 2010 ______________
Source: COLDWELL BA�KER HEARTHSIDE REALTORS MARKET RESEARCH from TRE�D MLS Data
Inventory of homes for sale in Aug 2010 was 132 Inventory of homes for sale in July 2010 was 128
Inventory of homes for sale in Aug 2009 was 115 Unit Inventory is up 14.8% year over year,
And up 4 homes (3%) sequentially from July 2010
Avg. price of a home for sale in Aug 2010 was $527k Avg. price of a home for sale in Aug 2009 was $554k List prices of homes in inventory are down 4.9%
80 homes sold as of Aug YTD 2009 at 91% of list price 95 homes sold as of Aug YTD 2010 at 91% of list price
Unit Sales volume is up 18.8% year over year, contrasted with Full Year 2009 Unit Sales which were up 18.4%
Buyers achieving approx 9% avg. discount from List Price
Summary: Inventory levels are up and YTD unit sales volume is moderately up. Average Sold Prices for the Full Year 2007 were down 5.9%, Full Year 2008 Average Sold Prices were near flat at a 0.2% decrease and 2009 reflected an 8.2% Price decrease, YTD 2010 trend indicates a modest 0.2% increase. Buyers continue to achieve “discount” leverage in negotiation, at a consistent spread versus last year. At current sales pace there is a 10.6 Month Supply of Homes in Inventory. Note that a Market is viewed as “Balanced” between Buyers/Sellers, with 6 Months of Homes in Inventory.
What does this mean to a Seller?
There is a 10+ Month Supply of homes on the market, generally for longer periods of time, so the competition remains challenging. Average Days on Market is 96 days versus 89 last year. It is more important now than ever to price your home right and market aggressively. Be realistic and remember the current market is what determines the price of your home.

f
BUCKINGHAM TOWNSHIP SINGLE FAMILY HOMES
Market Facts as of AUGUST YTD 2010 ______________
Source: COLDWELL BA�KER HEARTHSIDE REALTORS MARKET RESEARCH from TRE�D MLS Data
Inventory of homes for sale in Aug 2010 was 251 Inventory of homes for sale in July 2010 was 240
Inventory of homes for sale in Aug 2009 was 255 Unit Inventory is down 1.6% year over year,
And up 11 homes (5%) sequentially from July 2010
Avg. price of a home for sale in Aug 2010 was $752k Avg. price of a home for sale in Aug 2009 was $777k List prices of homes in inventory are down 3.1%, the avg. price stat
is impacted by # of unsold homes priced $1-2 million, ~$182k difference between Avg. Sold versus Avg. Inventory Price
111 homes sold as of Aug 2009 at 91% of list price 150 homes sold as of Aug 2010 at 92% of list price
Unit Sales volume is up 35.1% year over year, contrasted with Full Year 2009 Unit Sales which were down 14.7%
Buyers achieving approx 8% avg. discount from List Price Summary: Inventory levels are down and YTD sales volume is up noticeably. The Average Sold Price for the Full Year 2006 was up 5.2%, Full Year 2007 was a more modest 1.7% increase, Full Year 2008 Prices reflected a 2.9% decrease, Full Year 2009 reflected a 16.1% Price decrease, YTD 2010 trend indicates a 13.9% increase (likely driven by increased sales of higher priced homes). Buyers continue to achieve “discount” leverage in negotiation – though the spread is narrowing (1% point) versus last year. At current sales pace there is a 14.1 Month Supply of Homes in Inventory, a clear “Buyers Market”. Note that a Market is viewed as “Balanced” between Buyers & Sellers, with 6 Months of Homes in Inventory.
What does this mean to a Seller? There is a 14+ Month Supply of homes on the market, generally for longer periods of time, so the competition remains challenging. Average Days on Market is 107 versus 93 last year. During 2009, most (85%) of the homes sold closed at prices under $650k. Currently, 19% of the homes (47/251) on the market are priced above $1 million, this represents an 11.7 Year Supply at current sales pace (4/year). It is more important now than ever to price your home right and market aggressively. Be realistic and remember the current market is what determines the price of your home.

www.HeatherJackman.com

b
LOWER MAKEFIELD TOWNSHIP SINGLE FAMILY HOMES
Market Facts as of AUGUST YTD 2010 ______________
Source: COLDWELL BA�KER HEARTHSIDE REALTORS MARKET RESEARCH from TRE�D MLS Data
Inventory of homes for sale in Aug 2010 was 222 Inventory of homes for sale in July 2010 was 223
Inventory of homes for sale in Aug 2009 was 221 Unit Inventory is essentially flat year over year, And down 1 home sequentially from July 2010
Avg. price of a home for sale in Aug 2010 was $528k Avg. price of a home for sale in Aug 2009 was $513k
List prices of homes in inventory up 2.9%
167 homes sold as of Aug YTD 2009 at 91% of list price 226 homes sold as of Aug YTD 2010 at 93% of list price
Unit Sales volume is up 35.3% year over year, contrasted with Full Year 2009 Unit Sales which were up 1.6%
Buyers achieving approx 7% avg. discount from List Price
Summary: For trend-line reference, Full Year 07 Unit Growth was 6.5%, Full Year 08 Sales recorded a lower (-33.5%) result, Full Year 09 turned modestly positive at 1.6%, while YTD 2010 is +35.3%. Inventory is at an 8.5 Month supply of homes. The Average Sold Price for the Full Year 2006 was a modest 3.6% increase, Full Year 2007 reflected a 6.4% decrease, Full Year 2008 recorded a 3.1% increase and Full Year 09 reflected a 6.7% Price decrease, YTD 2010 trend indicates an 8.5% decrease. Buyers are achieving “discount” leverage in negotiation – though the spread is narrowing (2% points) versus last year. Market conditions are considered above “Balanced”, favoring the Buyer, with 8.5 Months of Homes in Inventory (Note: a Market is considered “balanced” with 6 Months Inventory).
What does this mean to a Seller? There is an 8+ Month Supply of homes on the market, generally, for noteworthy periods of time (Average Days on Market are now 76) so competition remains challenging. It is more important now than ever to price your home right and market aggressively. You may not have enjoyed the per year appreciation in 2006-2009 versus the ~10+% experienced during the prior 4-5 years. Be realistic and remember the current market is what determines the price of your home.

f
NEWTOWN TOWNSHIP SINGLE FAMILY HOMES
Market Facts as of AUGUST YTD 2010 ______________
Source: COLDWELL BA�KER HEARTHSIDE REALTORS MARKET RESEARCH from TRE�D MLS Data
Inventory of homes for sale in Aug 2010 was 137 Inventory of homes for sale in July 2010 was 146
Inventory of homes for sale in Aug 2009 was 127 Unit Inventory is up 7.9% year over year,
And down 9 homes (6%) sequentially from July 2010
Avg. price of a home for sale in Aug 2010 was $470k Avg. price of a home for sale in Aug 2009 was $466k
List prices of homes in inventory are near flat, up 0.9%
148 homes sold as of Aug YTD 2009 at 93% of list price 153 homes sold as of Aug YTD 2010 at 95% of list price
Unit Sales volume is up 3.4% year over year, contrasted with Full Year 2009 Unit Sales which were down 3%
Buyers achieving approx 5% avg. discount from List Price
Summary: Inventory levels are up and sales volume is positive. The Average Sold Price for the full year 2006 was a 10.9% increase, 2007 pricing was near flat at -0.1%, Full year 2008 Average Sold Prices reflected a 2.4% decrease and 2009 reflected a 3.7% Price decrease, YTD 2010 trend indicates a 2.9% decrease. Buyers still achieving “discount” leverage in negotiation – though the spread is narrowing (2% points) versus last year. Market conditions are near balanced with 7.2 Months of Homes in Inventory. Note that a Market is viewed as “Balanced” between Buyers & Sellers with ~6 Months Inventory.
What does this mean to a Seller? There is a 7+ Month Supply of homes on the market, generally taking about 51 Average Days on Market to sell, so the competitive conditions are relatively challenging. It is more important now than ever to price your home right and market aggressively. You may not have enjoyed the per year appreciation in 2007-2009 versus the ~10% experienced during most of the prior 3-4 years. Be realistic and remember the current market is what determines the price of your home.

www.HeatherJackman.com


www.HeatherJackman.com


MARKET STATISTICS for PRINCIPAL MARKETS($ in 1,000s)SINGLE FAMILY (ex Condos) YEAR-TO-DATE
2010 Source: COLDWELL BANKER HEARTHSIDE RPrior Full Yr YTD YTD 12 Mo
Sold Sold Price AvgAvg Price Avg Price Change % DOM Sold/List Sales
2009 2010LMT $462 $424 -8.5% 76 93% $Morrisville $186 $170 -5.5% 104 90%Newtown $386 $380 -2.9% 51 95% $UMT $762 $867 7.4% 120 90% $Solebury $788 $613 -28.0% 113 91% $Buckingham $501 $570 13.9% 107 92% $Northampton $389 $406 2.2% 66 94% $Doylestown $414 $420 0.2% 96 91% $Bucks Cty $329 $345 3.5% 86 92% $1,1
20092008 Full Yr 2009
LMT $495 $463 78 91% $Morrisville $209 $180 77 90% $Newtown $401 $391 62 93% $UMT $791 $807 116 87% $Solebury $763 $852 128 87% $Buckingham $597 $500 93 91% $Northampton $432 $397 80 92% $Doylestown $451 $419 89 91% $Bucks Cty $353 $334 84 92% $1,0
www.HeatherJackman.com
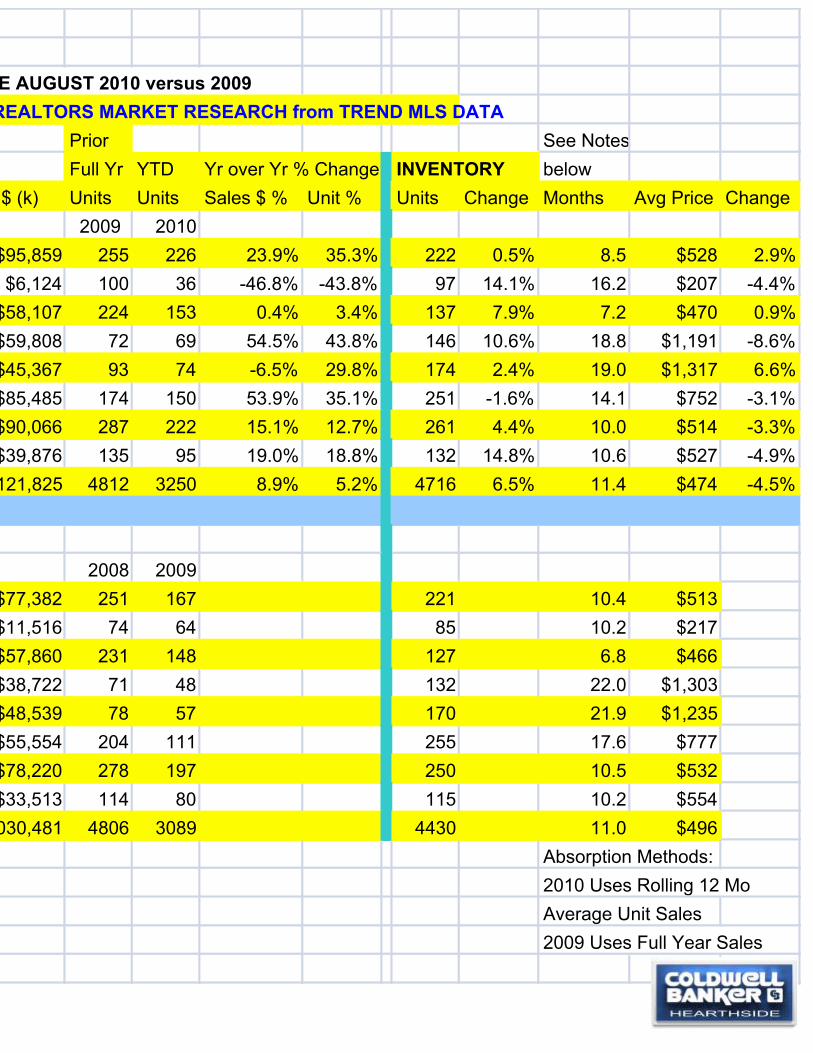
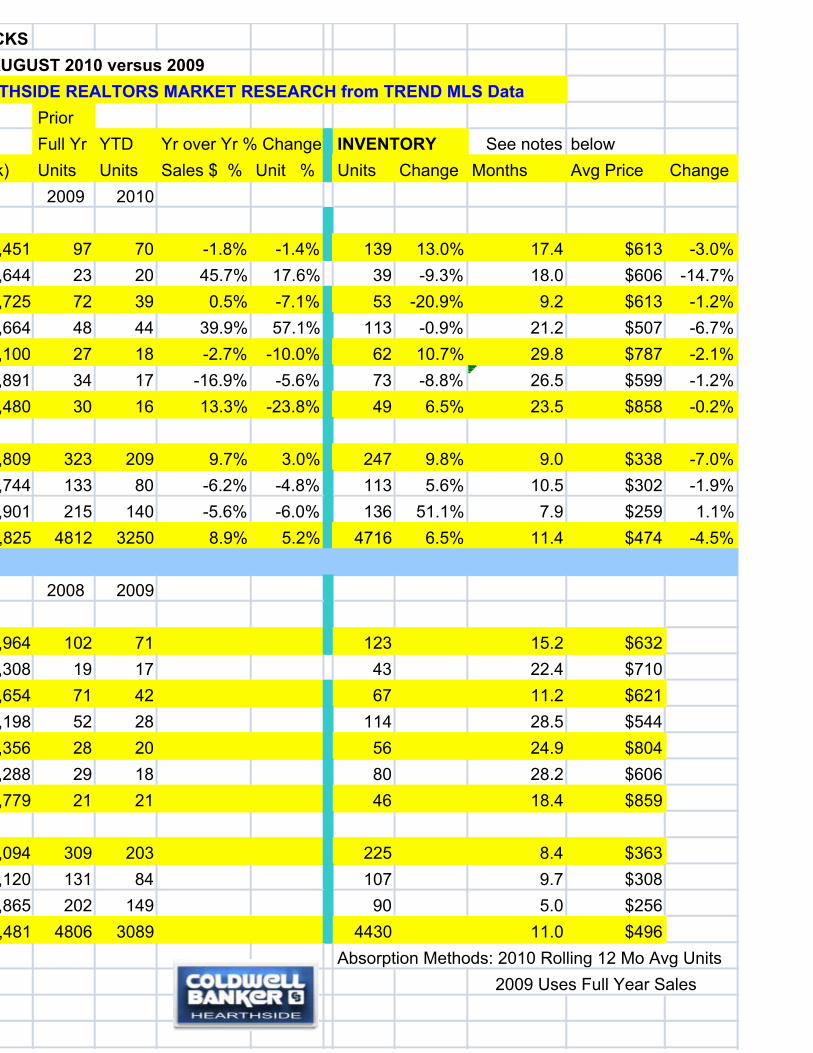
E AUGUST 2010 versus 2009REALTORS MARKET RESEARCH from TREND MLS DATA
Prior See NotesFull Yr YTD Yr over Yr % Change INVENTORY below
$ (k) Units Units Sales $ % Unit % Units Change Months Avg Price Change2009 2010
$95,859 255 226 23.9% 35.3% 222 0.5% 8.5 $528 2.9%$6,124 100 36 -46.8% -43.8% 97 14.1% 16.2 $207 -4.4%
$58,107 224 153 0.4% 3.4% 137 7.9% 7.2 $470 0.9%$59,808 72 69 54.5% 43.8% 146 10.6% 18.8 $1,191 -8.6%$45,367 93 74 -6.5% 29.8% 174 2.4% 19.0 $1,317 6.6%$85,485 174 150 53.9% 35.1% 251 -1.6% 14.1 $752 -3.1%$90,066 287 222 15.1% 12.7% 261 4.4% 10.0 $514 -3.3%$39,876 135 95 19.0% 18.8% 132 14.8% 10.6 $527 -4.9%121,825 4812 3250 8.9% 5.2% 4716 6.5% 11.4 $474 -4.5%
2008 2009$77,382 251 167 221 10.4 $513$11,516 74 64 85 10.2 $217$57,860 231 148 127 6.8 $466$38,722 71 48 132 22.0 $1,303$48,539 78 57 170 21.9 $1,235$55,554 204 111 255 17.6 $777$78,220 278 197 250 10.5 $532$33,513 114 80 115 10.2 $554030,481 4806 3089 4430 11.0 $496
Absorption Methods:2010 Uses Rolling 12 MoAverage Unit Sales2009 Uses Full Year Sales
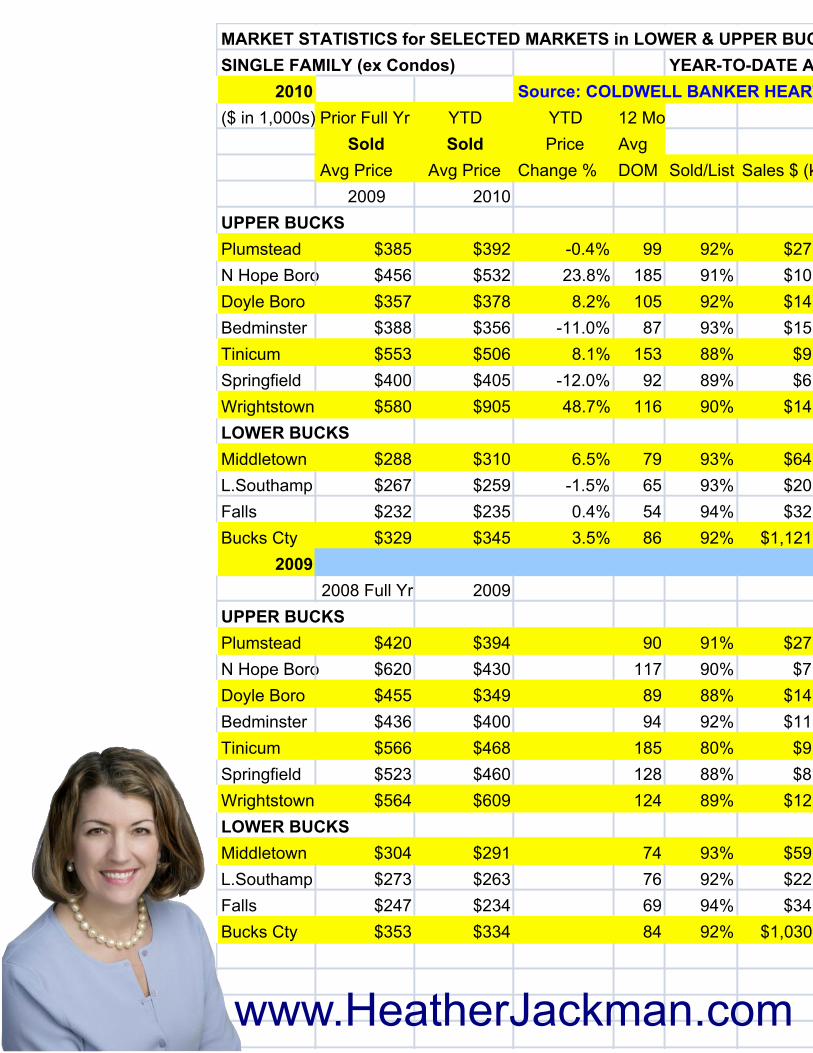
MARKET STATISTICS for SELECTED MARKETS in LOWER & UPPER BUCSINGLE FAMILY (ex Condos) YEAR-TO-DATE A
2010 Source: COLDWELL BANKER HEART($ in 1,000s) Prior Full Yr YTD YTD 12 Mo
Sold Sold Price AvgAvg Price Avg Price Change % DOM Sold/List Sales $ (k
2009 2010UPPER BUCKSPlumstead $385 $392 -0.4% 99 92% $27,N Hope Boro $456 $532 23.8% 185 91% $10,Doyle Boro $357 $378 8.2% 105 92% $14,Bedminster $388 $356 -11.0% 87 93% $15,Tinicum $553 $506 8.1% 153 88% $9,Springfield $400 $405 -12.0% 92 89% $6,Wrightstown $580 $905 48.7% 116 90% $14,LOWER BUCKSMiddletown $288 $310 6.5% 79 93% $64,L.Southamp $267 $259 -1.5% 65 93% $20,Falls $232 $235 0.4% 54 94% $32,Bucks Cty $329 $345 3.5% 86 92% $1,121,
20092008 Full Yr 2009
UPPER BUCKSPlumstead $420 $394 90 91% $27,N Hope Boro $620 $430 117 90% $7,Doyle Boro $455 $349 89 88% $14,Bedminster $436 $400 94 92% $11,Tinicum $566 $468 185 80% $9,Springfield $523 $460 128 88% $8,Wrightstown $564 $609 124 89% $12,LOWER BUCKSMiddletown $304 $291 74 93% $59,L.Southamp $273 $263 76 92% $22,Falls $247 $234 69 94% $34,Bucks Cty $353 $334 84 92% $1,030,
www.HeatherJackman.com
CKSAUGUST 2010 versus 2009
THSIDE REALTORS MARKET RESEARCH from TREND MLS DataPriorFull Yr YTD Yr over Yr % Change INVENTORY See notes below
k) Units Units Sales $ % Unit % Units Change Months Avg Price Change2009 2010
,451 97 70 -1.8% -1.4% 139 13.0% 17.4 $613 -3.0%,644 23 20 45.7% 17.6% 39 -9.3% 18.0 $606 -14.7%,725 72 39 0.5% -7.1% 53 -20.9% 9.2 $613 -1.2%,664 48 44 39.9% 57.1% 113 -0.9% 21.2 $507 -6.7%,100 27 18 -2.7% -10.0% 62 10.7% 29.8 $787 -2.1%,891 34 17 -16.9% -5.6% 73 -8.8% 26.5 $599 -1.2%,480 30 16 13.3% -23.8% 49 6.5% 23.5 $858 -0.2%
,809 323 209 9.7% 3.0% 247 9.8% 9.0 $338 -7.0%,744 133 80 -6.2% -4.8% 113 5.6% 10.5 $302 -1.9%,901 215 140 -5.6% -6.0% 136 51.1% 7.9 $259 1.1%,825 4812 3250 8.9% 5.2% 4716 6.5% 11.4 $474 -4.5%
2008 2009
,964 102 71 123 15.2 $632,308 19 17 43 22.4 $710,654 71 42 67 11.2 $621,198 52 28 114 28.5 $544,356 28 20 56 24.9 $804,288 29 18 80 28.2 $606,779 21 21 46 18.4 $859
,094 309 203 225 8.4 $363,120 131 84 107 9.7 $308,865 202 149 90 5.0 $256,481 4806 3089 4430 11.0 $496
Absorption Methods: 2010 Rolling 12 Mo Avg Units 2009 Uses Full Year Sales

b
UPPER MAKEFIELD TOWNSHIP SINGLE FAMILY HOMES
Market Facts as of AUGUST YTD 2010 Source: COLDWELL BA�KER HEARTHSIDE REALTORS MARKET RESEARCH from TRE�D MLS Data
Inventory of homes for sale in Aug 2010 was 146 Inventory of homes for sale in July 2010 was 141 Inventory of homes for sale in Aug 2009 was 132
Inventory is up 10.6% year over year, And up 5 homes sequentially from July 2010
Avg. price of a home for sale in Aug 2010 - $1.19 million Avg. price of a home for sale in Aug 2009 - $1.30 million List prices in inventory are down 8.6%, the avg. price stat is driven by # of homes priced in $1-3+ million, review specific property CMA for pricing direction & check Median/Average Prices
48 homes sold as of Aug YTD 2009 at 87% of list price 69 homes sold as of Aug YTD 2010 at 90% of list price
Unit Sales volume is up 43.8% year over year, contrasted with Full Year 2009 Unit Sales which were up 1.4%
Buyers achieving approx 10% discount from List Price
Summary: Inventory levels are up and Unit Sales are up noticeably YTD.
Notably, at current Sales pace there is an 18.8 Month Supply of Homes in Inventory, versus 22 Months last year. Buyers are still achieving “discount” leverage in negotiation – though the spread is narrowing (3% points) versus last year. Market is viewed as a clear “Buyers Market”. Note that a Market is viewed as “Balanced” with 6 Months of Inventory.
What does this mean to a seller? There is a substantial inventory of homes on the market (particularly in $1-3 million range), generally for longer periods of time, so the competition is challenging. Average Days on Market is 120 (all price levels). During 2009, most (82%) of the homes sold closed at prices under $999k. Currently, 47.2% of the homes (69 of 146) on the market are priced above $1 million, and this represents a 38 Month Supply at current sales pace (1.8 per month). It is more important now than ever to price your home right and market aggressively. You may not have enjoyed the positive per year appreciation in 2007/2008 that was experienced during the past few years. Be realistic and remember the current market is what determines the price of your home.
b
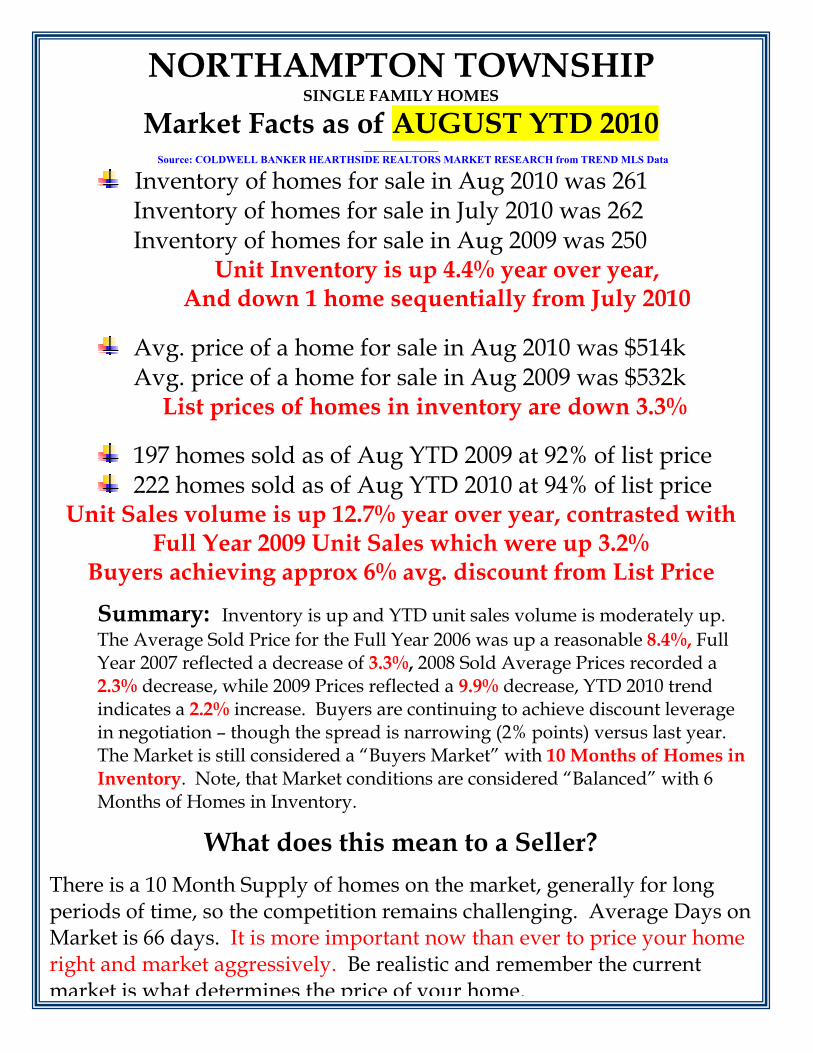
NORTHAMPTON TOWNSHIP SINGLE FAMILY HOMES
Market Facts as of AUGUST YTD 2010 ______________
Source: COLDWELL BA�KER HEARTHSIDE REALTORS MARKET RESEARCH from TRE�D MLS Data
Inventory of homes for sale in Aug 2010 was 261 Inventory of homes for sale in July 2010 was 262
Inventory of homes for sale in Aug 2009 was 250 Unit Inventory is up 4.4% year over year,
And down 1 home sequentially from July 2010
Avg. price of a home for sale in Aug 2010 was $514k Avg. price of a home for sale in Aug 2009 was $532k
List prices of homes in inventory are down 3.3%
197 homes sold as of Aug YTD 2009 at 92% of list price 222 homes sold as of Aug YTD 2010 at 94% of list price
Unit Sales volume is up 12.7% year over year, contrasted with Full Year 2009 Unit Sales which were up 3.2%
Buyers achieving approx 6% avg. discount from List Price
Summary: Inventory is up and YTD unit sales volume is moderately up.
The Average Sold Price for the Full Year 2006 was up a reasonable 8.4%, Full Year 2007 reflected a decrease of 3.3%, 2008 Sold Average Prices recorded a 2.3% decrease, while 2009 Prices reflected a 9.9% decrease, YTD 2010 trend indicates a 2.2% increase. Buyers are continuing to achieve discount leverage in negotiation – though the spread is narrowing (2% points) versus last year. The Market is still considered a “Buyers Market” with 10 Months of Homes in
Inventory. Note, that Market conditions are considered “Balanced” with 6 Months of Homes in Inventory.
What does this mean to a Seller?
There is a 10 Month Supply of homes on the market, generally for long periods of time, so the competition remains challenging. Average Days on Market is 66 days. It is more important now than ever to price your home right and market aggressively. Be realistic and remember the current market is what determines the price of your home.

www.HeatherJackman.com


SI�b
SOLEBURY TOWNSHIP SINGLE FAMILY HOMES
Market Facts as of AUGUST YTD 2010 __________________________________________________________________________________________________________________
Source: COLDWELL BA�KER HEARTHSIDE REALTORS MARKET RESEARCH from TRE�D MLS Data Inventory of homes for sale in Aug 2010 was 174 Inventory of homes for sale in July 2010 was 170 Inventory of homes for sale in Aug 2009 was 170
Inventory is up 2.4% year over year, And up 4 homes sequentially from July 2010
Avg. price of a home for sale in Aug 2010 - $1.32 million Avg. price of a home for sale in Aug 2009 - $1.24 million List prices in inventory are up 6.6%, the avg. price stat is impacted by # of homes priced in $1-5 million, review specific property
CMA for pricing direction & Median/Average Prices
57 homes sold as of Aug YTD 2009 at 87% of list price 74 homes sold as of Aug YTD 2010 at 91% of list price
Unit Sales volume up 29.8% year over year, contrasted with Full Year 2009 Unit Sales which were up 19.2%
Buyers achieving approx 9% discount from List Price
Summary: Inventory levels are up slightly and YTD Unit Sales are up
substantially. At current Sales pace, there is a 19 Month Supply of Homes in Inventory. Buyers continue to achieve significant discount leverage in negotiation – though the spread is narrowing (3% points) versus last year. Market is viewed as a clear “Buyers Market”. Note that a Market is viewed as “Balanced” with 6 Months of Homes in Inventory.
What does this mean to a seller? There is a substantial inventory of homes on the market (particularly in $1-3 million range), generally for longer periods of time, so the competition is challenging. Average Days on Market is 118 (all price levels) versus 114 last year. During 2009, most (83%) of the homes sold closed at prices under $999k. Currently, 36.8% of the homes (64 of 174) on the market are priced above $1 million, and this represents a 70 Month Supply at current sales pace (0.92 per month). It is more important now than ever to price your home right and market aggressively. You may not have enjoyed the positive per year appreciation in 2007, 2008, 2009 that was experienced during the past few years. Be realistic and remember the current market is what determines
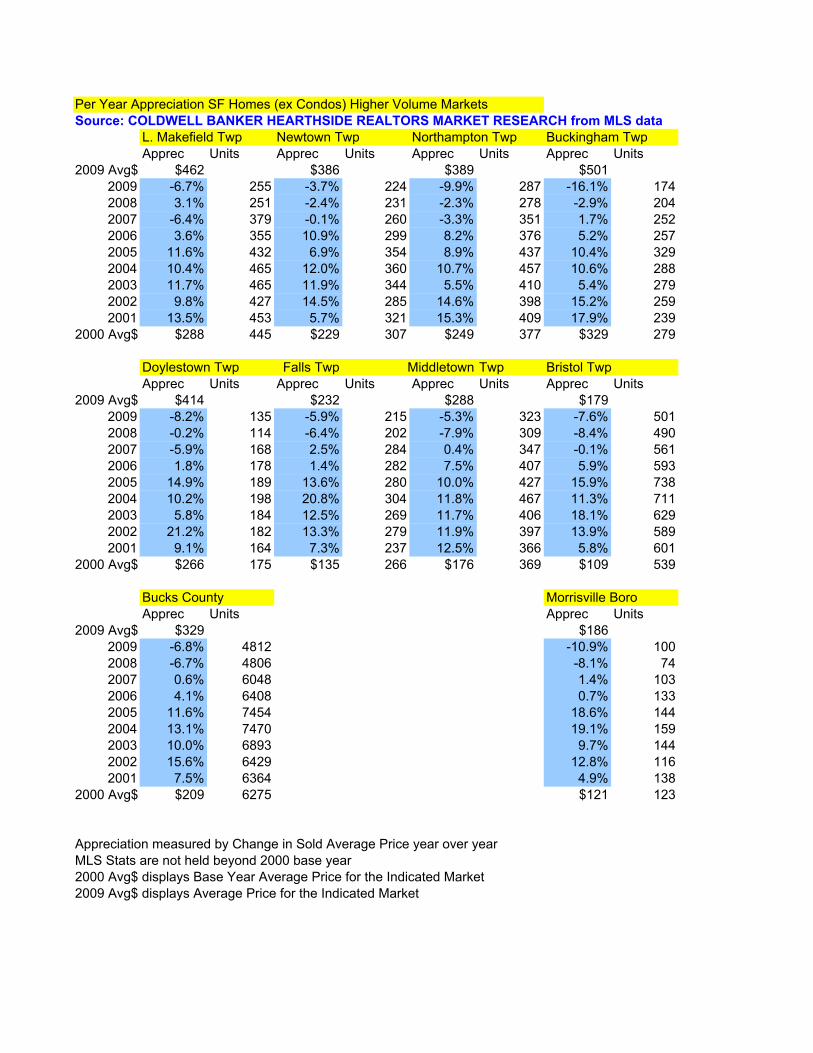
Per Year Appreciation SF Homes (ex Condos) Higher Volume Markets
Source: COLDWELL BANKER HEARTHSIDE REALTORS MARKET RESEARCH from MLS data
L. Makefield Twp Newtown Twp Northampton Twp Buckingham Twp
Apprec Units Apprec Units Apprec Units Apprec Units
2009 Avg$ $462 $386 $389 $501
2009 -6.7% 255 -3.7% 224 -9.9% 287 -16.1% 174
2008 3.1% 251 -2.4% 231 -2.3% 278 -2.9% 204
2007 -6.4% 379 -0.1% 260 -3.3% 351 1.7% 252
2006 3.6% 355 10.9% 299 8.2% 376 5.2% 257
2005 11.6% 432 6.9% 354 8.9% 437 10.4% 329
2004 10.4% 465 12.0% 360 10.7% 457 10.6% 288
2003 11.7% 465 11.9% 344 5.5% 410 5.4% 279
2002 9.8% 427 14.5% 285 14.6% 398 15.2% 259
2001 13.5% 453 5.7% 321 15.3% 409 17.9% 239
2000 Avg$ $288 445 $229 307 $249 377 $329 279
Doylestown Twp Falls Twp Middletown Twp Bristol Twp
Apprec Units Apprec Units Apprec Units Apprec Units
2009 Avg$ $414 $232 $288 $179
2009 -8.2% 135 -5.9% 215 -5.3% 323 -7.6% 501
2008 -0.2% 114 -6.4% 202 -7.9% 309 -8.4% 490
2007 -5.9% 168 2.5% 284 0.4% 347 -0.1% 561
2006 1.8% 178 1.4% 282 7.5% 407 5.9% 593
2005 14.9% 189 13.6% 280 10.0% 427 15.9% 738
2004 10.2% 198 20.8% 304 11.8% 467 11.3% 711
2003 5.8% 184 12.5% 269 11.7% 406 18.1% 629
2002 21.2% 182 13.3% 279 11.9% 397 13.9% 589
2001 9.1% 164 7.3% 237 12.5% 366 5.8% 601
2000 Avg$ $266 175 $135 266 $176 369 $109 539
Bucks County Morrisville Boro
Apprec Units Apprec Units
2009 Avg$ $329 $186
2009 -6.8% 4812 -10.9% 100
2008 -6.7% 4806 -8.1% 74
2007 0.6% 6048 1.4% 103
2006 4.1% 6408 0.7% 133
2005 11.6% 7454 18.6% 144
2004 13.1% 7470 19.1% 159
2003 10.0% 6893 9.7% 144
2002 15.6% 6429 12.8% 116
2001 7.5% 6364 4.9% 138
2000 Avg$ $209 6275 $121 123
Appreciation measured by Change in Sold Average Price year over year
MLS Stats are not held beyond 2000 base year
2000 Avg$ displays Base Year Average Price for the Indicated Market
2009 Avg$ displays Average Price for the Indicated Market
b
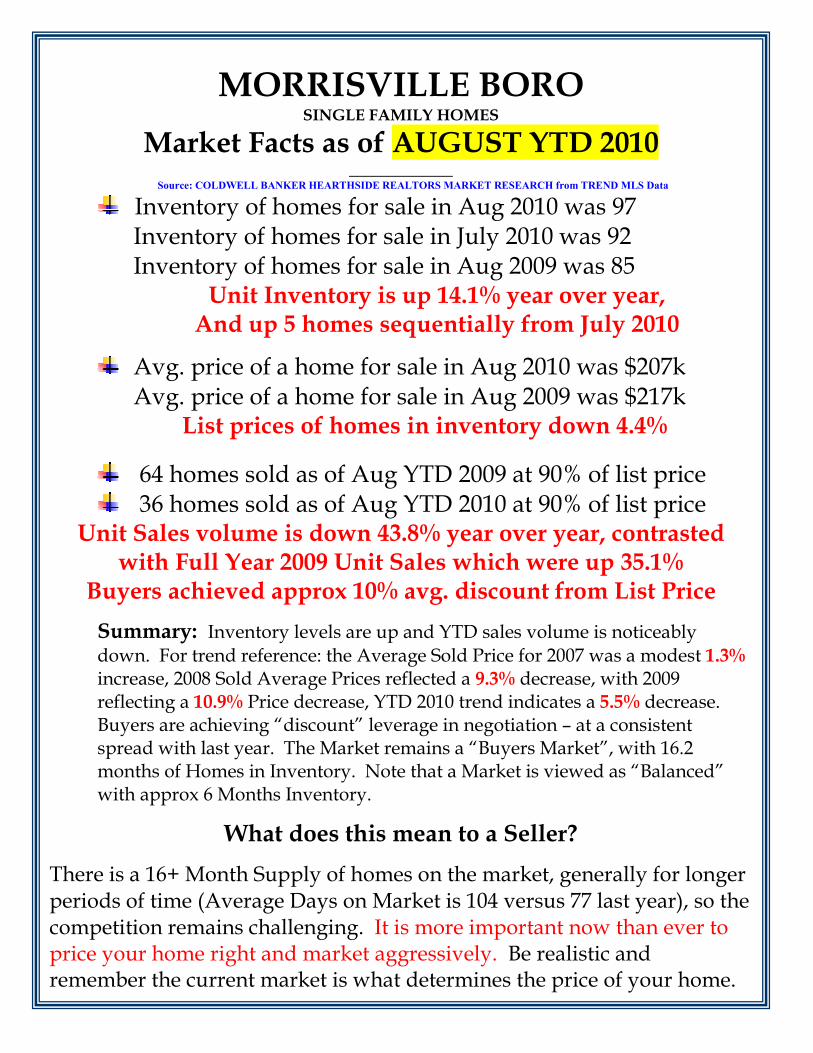
MORRISVILLE BORO SINGLE FAMILY HOMES
Market Facts as of AUGUST YTD 2010 _____________
Source: COLDWELL BA�KER HEARTHSIDE REALTORS MARKET RESEARCH from TRE�D MLS Data
Inventory of homes for sale in Aug 2010 was 97 Inventory of homes for sale in July 2010 was 92
Inventory of homes for sale in Aug 2009 was 85 Unit Inventory is up 14.1% year over year,
And up 5 homes sequentially from July 2010
Avg. price of a home for sale in Aug 2010 was $207k Avg. price of a home for sale in Aug 2009 was $217k
List prices of homes in inventory down 4.4%
64 homes sold as of Aug YTD 2009 at 90% of list price 36 homes sold as of Aug YTD 2010 at 90% of list price
Unit Sales volume is down 43.8% year over year, contrasted with Full Year 2009 Unit Sales which were up 35.1%
Buyers achieved approx 10% avg. discount from List Price
Summary: Inventory levels are up and YTD sales volume is noticeably down. For trend reference: the Average Sold Price for 2007 was a modest 1.3% increase, 2008 Sold Average Prices reflected a 9.3% decrease, with 2009 reflecting a 10.9% Price decrease, YTD 2010 trend indicates a 5.5% decrease. Buyers are achieving “discount” leverage in negotiation – at a consistent spread with last year. The Market remains a “Buyers Market”, with 16.2 months of Homes in Inventory. Note that a Market is viewed as “Balanced” with approx 6 Months Inventory.
What does this mean to a Seller?
There is a 16+ Month Supply of homes on the market, generally for longer periods of time (Average Days on Market is 104 versus 77 last year), so the competition remains challenging. It is more important now than ever to price your home right and market aggressively. Be realistic and remember the current market is what determines the price of your home.