August 7, 2015 Daehaeng Kim, IMF, Belgrade Office · 2015-17 (rightsizing via attrition and...
26
August 7, 2015 Daehaeng Kim, IMF, Belgrade Office
Transcript of August 7, 2015 Daehaeng Kim, IMF, Belgrade Office · 2015-17 (rightsizing via attrition and...

August 7, 2015
Daehaeng Kim, IMF, Belgrade Office

Context Fiscal imbalances have been piling up since 2008/9 Attempts to stop the growing public debt proved
ineffective: e.g., 2009 and 2011 SBA, and stopgap measures in 2013/14
3-year IMF precautionary SBA approved in February 2015, with three main objectives: Address macroeconomic imbalances and vulnerabilities, most
notably by placing public debt on a sustainable path Bolster resilience of the financial sector and improve its
intermediation function necessary to support growth Improve competitiveness and reduce key growth bottlenecks
through vigorous implementation of comprehensive structural and SOE reforms

What do we learn from Serbia’s fiscal reforms? Focusing fiscal issues in Serbia, the presentation offers
a real example to illustrate:
What caused the growing fiscal imbalances
How policy was designed to address the root causes of the imbalances
How the policy has been implemented
And what kind of risks and challenges the policy implementation faces

Outline Part 1. Fiscal Developments Since 2008/9
Part 2. Causes of Fiscal Imbalances
Part 3. Fiscal Program Objectives And Policy Design
Part 4. Progress So Far And Challenges Ahead
Part 1. Fiscal Developments Since 2008/9

High deficit and growing debt GG deficit increased
from 2½ percent of GDP in 2008 to over 7 percent in 2012, and remained high until 2014.
Public sector debt grew from 32½ percent of GDP in 2008 to 72½ percent in 2014.
30.0
35.0
40.0
45.0
50.0
55.0
60.0
65.0
70.0
75.0
-8.0
-7.0
-6.0
-5.0
-4.0
-3.0
-2.0
-1.0
0.0
2007 2008 2009 2010 2011 2012 2013 2014
(in percent of GDP)
Generalgovernment balance
Public debt, rhs
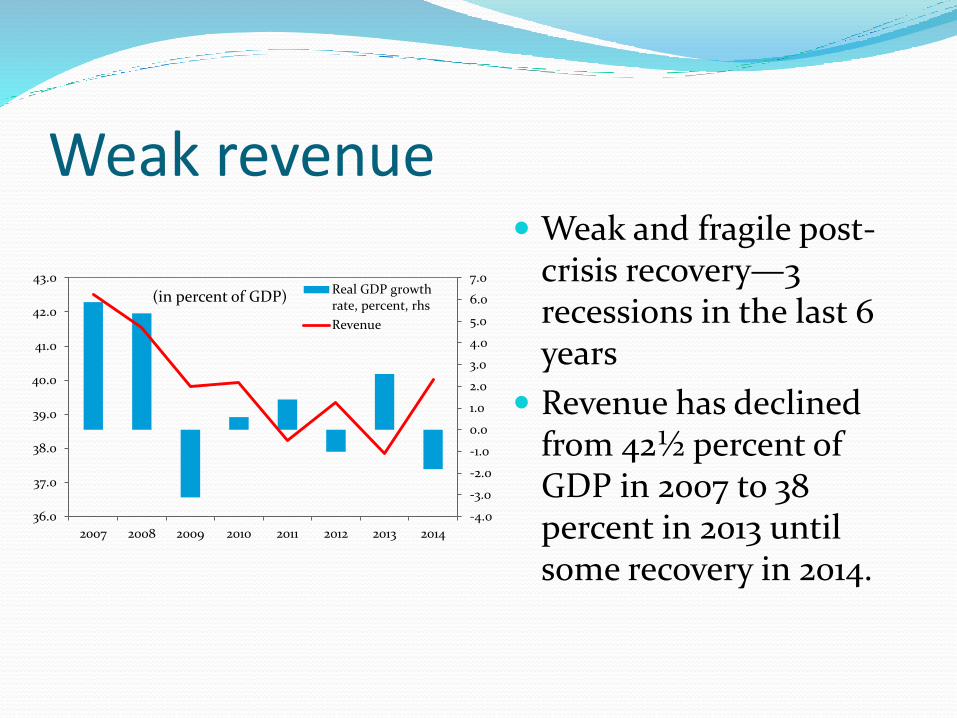
Weak revenue Weak and fragile post-
crisis recovery—3 recessions in the last 6 years
Revenue has declined from 42½ percent of GDP in 2007 to 38 percent in 2013 until some recovery in 2014.
-4.0
-3.0
-2.0
-1.0
0.0
1.0
2.0
3.0
4.0
5.0
6.0
7.0
36.0
37.0
38.0
39.0
40.0
41.0
42.0
43.0
2007 2008 2009 2010 2011 2012 2013 2014
(in percent of GDP)Real GDP growthrate, percent, rhs
Revenue

High entitlement spending Expenditure has
increased despite consolidation efforts in 2011 and 13.
Entitlement spending—GG wage bills, pension, and subsidies—has grown from 24 percent of GDP in 2007 to 27¼ percent in 2014.
21.0
22.0
23.0
24.0
25.0
26.0
27.0
28.0
29.0
42.0
42.5
43.0
43.5
44.0
44.5
45.0
45.5
46.0
46.5
47.0
2007 2008 2009 2010 2011 2012 2013 2014
(in percent of GDP)Wage, pension,subsidies
Expenditure

Decomposition of debt growth Growing guarantees and
materialization of contingent liabilities (i.e., amortization of called guarantees + bank bailout cost) account for 20 percent of debt increase in the last 4 years.
Exchange rate depreciation also increased debt burden significantly.
8.0
28.4
51.9
11.7
Contribution to the change in public debt: 2011-14
Guaranteed debt
Exchange ratedepreciation
Budget deficit net ofmaterializatin ofcontingent liabilities
Materialization ofcontingent liabilities

Part 2. Causes of Fiscal Imbalances

Stagnant growth and weak labor market performance
3 recessions in the last 6 years
Unemployment remains very high, while employment has been declining
Total population is 7.2 million, but formal employment is 1.7 million, equal to the number of pensioners
0 0.5 1 1.5 2 2.5 3
Total employment
Formal employment
Public sector employment
Pensioners(In millions)
60
70
80
90
100
110
120
10
12
14
16
18
20
22
24
26
28
30
2008 2009 2010 2011 2012 2013 2014
Total employment ('08=100, rhs)
Unemployment rate (in percent)
Formal employment ('08=100, rhs)

Weak revenue collection Share of indirect tax—VAT
and Excise—is relatively high (about 45 percent of tax revenues), reflecting the labor market situation
Growing grey economy and declining tax efficiency until 2014
VAT efficiency weakening: Effect of the rate hike in September 2012 (18 to 20%) was limited
65
70
75
80
85
90
9
9.5
10
10.5
11
11.5
2007 2008 2009 2010 2011 2012 2013 2014
VAT Efficiency, rhs
VAT in percent of GDP

Weak control over GG wage bill High GG wage bill
High inefficiency in some sectors
High wage rate compared to the private sector
Weak control and high wage drift until 2013
Number of workers
Overly complex and fragmented wage system
0
10,000
20,000
30,000
40,000
50,000
60,000
70,000
80,000
2007 2008 2009 2010 2011 2012 2013 2014
Average monthly gross wage (RSD)Public sector
Private sector
Public Sector Wage System
Job titles 2,200
Elements of pay 71
Base salaries 5
Job coefficients 900
Laws that regulate renumeration 19

Pension dilemma—neither considered enough nor affordable
Unfavorable population age profile Social expectations:
High replacement ratio: 70 percent, but about €200 per month on average
Generous early retirement: statutory vs. effective retirement age (Man: 63 vs. 60) before the reform
Internationally high pension spending
Growing share of the population stays outside the system—risk to future social protection spending
0
20
40
60
80
100
120
IRL
JPN
NZ
L
GB
R
US
A
HR
V
CA
N
SW
E
DE
U
ES
T
FR
A
NO
R
BE
L
CH
E
CZ
E
FIN
PR
T
SR
B
SV
K
ES
P
SV
N
DN
K
AU
T
TU
R
LU
X
NL
D
HU
N
GR
C
Net replacement rate of a standard pensioner, 2011
0
2
4
6
8
10
12
14
16
18
20
IRL
LV
A
GB
R
SV
K
NL
D
NO
R
BG
R
LU
X
RO
U
CZ
E
LT
U
DN
K
MK
D
CH
E
ES
P
ES
T
SW
E
BE
L
SV
N
HR
V
FIN
DE
U
HU
N
MN
E
PO
L
GR
C
PR
T
FR
A
AU
T
SR
B
ITA
UK
R
Public pension expenditure (in percent of GDP), 2010

Inefficient state aid and drain on the budget
Lack of transparency and weak governance
State aid for employment Railways: budget subsidies =
total wage bill Large loss-making
companies—direct or indirect support
Weak financial control and payment discipline State guarantees for liquidity
loans with little prospect for repayment
Arrears to utility companies
Bank bailout cost
0
100
200
300
400
500
600
700
800
Amortization of activatedguarantees
Bank recap and arrearsclearance
Millions of euros, cumulative during 2012-14
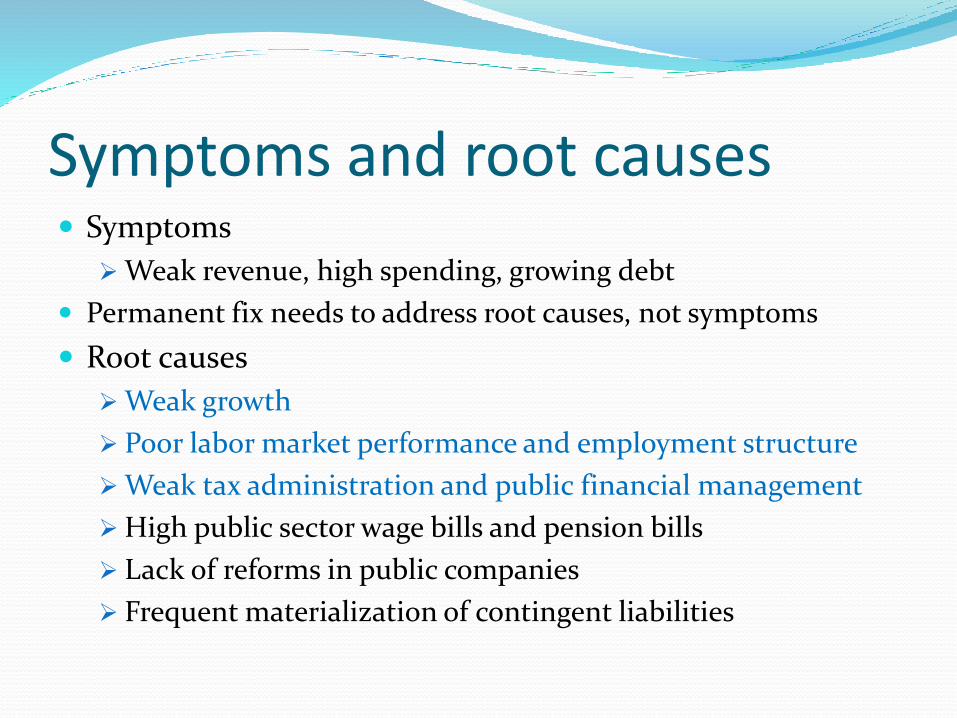
Symptoms and root causes Symptoms
Weak revenue, high spending, growing debt
Permanent fix needs to address root causes, not symptoms
Root causes
Weak growth
Poor labor market performance and employment structure
Weak tax administration and public financial management
High public sector wage bills and pension bills
Lack of reforms in public companies
Frequent materialization of contingent liabilities

Part 3. Fiscal Program Objectives and Policy Design

Fiscal objectives Reverse the rise in public debt by
2017 and put it on a downward path thereafter (chart)
3-year fiscal adjustment, amounting to 4¾ percent of GDP (3½ percent of GDP in structural terms) Productive spending should be
protected The savings from the
consolidation measures should be lasting
Strike balance between credibility and growth impact Slightly over 50 percent of the
adjustment takes place in 2015
40.0
50.0
60.0
70.0
80.0
90.0
100.0
-14.0
-12.0
-10.0
-8.0
-6.0
-4.0
-2.0
0.0
2012 2013 2014 2015 2016 2017 2018 2019 2020
Public debt, rhs
General government balance
projection

Policy measures: before program Key structural reforms and consolidation measure in the
summer 2014
Labor law amendments
Raise the threshold for automatic extension of collective agreement
Clarify the cases for dismissal
Rationalize severance compensation
Extend the maximum length of temporary contracts
Parametric pension reforms
Gradually raise the statutory retirement age for women
Introduce early retirement penalty
10 percent wage cut and 22/25 percent pension cut

Program measures Limited room for tax rate hikes
Focus on containing entitlement spending (2/3) and state aid (1/3) In addition to wage and pension cuts
Wage and pension indexation freeze—until their GDP shares reach 7 and 11 percent of GDP, respectively
Reduction of employment cost by 5 percent each in 2015-17 (rightsizing via attrition and targeted separation)
Reduction of state aid to public companies, underpinned by SOE reforms
No guarantee for liquidity loans

Structural fiscal reforms Structural reforms needed to support the fiscal consolidation
and/or mitigate fiscal risks Rightsizing to increase the efficiency of the general government,
while reducing the cost, via its organizational and functional restructuring
Wage system reform to bring the wage system under control Reforms to improve fiscal transparency, which is the first step for
better accountability; better monitoring and control of fiscal risks Introduction of 3-year expenditure ceiling Clarification of the coverage of the general government Improvement of the reliability and coverage of public sector
employment registry Strengthening of SOE financial monitoring function of MOF Enhancement of the payment discipline between public sector entities
Tax administration reform to improve collection without rate hike

SOE reforms Subsidies to large SOEs have been a drain to the budget,
and fiscal risks from them are significant
SOE reforms, via privatization and/or restructuring, agreed to improve the financial viability of large SOEs and thus contain fiscal risks from them
Railways—unbundling and financial restructuring
Electricity Producer (EPS) —recorporatization and financial restructuring, including electricity price increases
Srbijagas—financial restructuring
Large steel and chemical companies—seeking privatization, assurance of no state aid and no accumulation of arrears

Growth enhancing measures To mitigate the short-term impact of the fiscal
retrenchment, and establish foundation for sustained growth:Reforms to promote investment
Construction permit and land development law
Land ownership conversion law
Investment law
WB-supported privatization
EBRD Investment Climate and Governance Initiatives
Rebalancing policy mix toward monetary easing
NPL resolutions to support credit growth

Part 4. Progress So Far and Challenges Ahead

First Review The First Review was
completed on June 26
Performance Criteria met with good margins
Structural benchmarks were met with some delays
Sovereign Credit Default Swap is falling
Exchange rate stabilized
0
50
100
150
200
250
300
350
400
450
500
Jan-14 Jul-14 Jan-15
Sovereign CDS SpreadsBulgariaCroatiaRomaniaSerbia
114
115
116
117
118
119
120
121
122
123
124
125
RSD/EUR

Challenges ahead Structural reforms
Will reforms stick?
Or will this effort be another band aid?
Sustained consolidation is key for 2016-17
Wage and pension indexation freeze until their GDP shares reach 7 and 11 percent, respectively
General government rightsizing
Return of sustainable high growth and improved tax collection will be strong tail wind for debt reduction