August 5 – 7, 2008NASA Habitats Workshop Optical Properties and Quantitative Remote Sensing of...
23
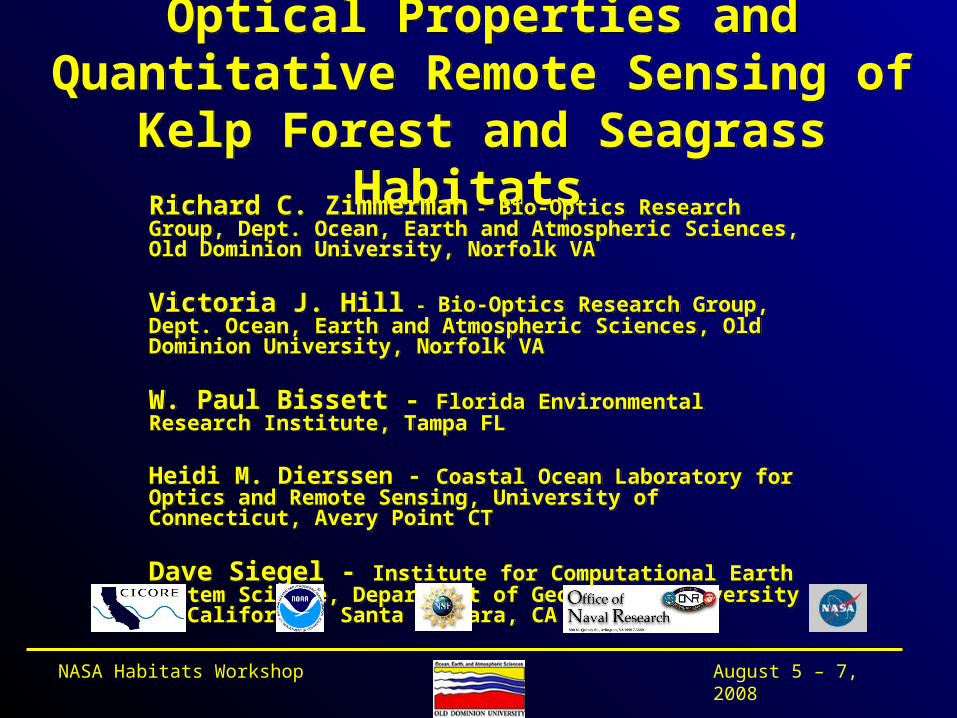
August 5 – 7, 2008 NASA Habitats Workshop Optical Properties and Quantitative Remote Sensing of Kelp Forest and Seagrass Habitats Richard C. Zimmerman - Bio-Optics Research Group, Dept. Ocean, Earth and Atmospheric Sciences, Old Dominion University, Norfolk VA Victoria J. Hill - Bio-Optics Research Group, Dept. Ocean, Earth and Atmospheric Sciences, Old Dominion University, Norfolk VA W. Paul Bissett - Florida Environmental Research Institute, Tampa FL Heidi M. Dierssen - Coastal Ocean Laboratory for Optics and Remote Sensing, University of Connecticut, Avery Point CT Dave Siegel - Institute for Computational Earth System Science, Department of Geography, University of California, Santa Barbara, CA
-
Upload
johnathan-rodgers -
Category
Documents
-
view
214 -
download
0
Transcript of August 5 – 7, 2008NASA Habitats Workshop Optical Properties and Quantitative Remote Sensing of...
August 5 – 7, 2008NASA Habitats Workshop
Optical Properties and Quantitative Remote Sensing of Kelp Forest and Seagrass
Habitats
Optical Properties and Quantitative Remote Sensing of Kelp Forest and Seagrass
Habitats Richard C. Zimmerman - Bio-Optics Research Group, Dept. Ocean, Earth and Atmospheric Sciences, Old Dominion University, Norfolk VA
Victoria J. Hill - Bio-Optics Research Group, Dept. Ocean, Earth and Atmospheric Sciences, Old Dominion University, Norfolk VA
W. Paul Bissett - Florida Environmental Research Institute, Tampa FL
Heidi M. Dierssen - Coastal Ocean Laboratory for Optics and Remote Sensing, University of Connecticut, Avery Point CT
Dave Siegel - Institute for Computational Earth System Science, Department of Geography, University of California, Santa Barbara, CA
Richard C. Zimmerman - Bio-Optics Research Group, Dept. Ocean, Earth and Atmospheric Sciences, Old Dominion University, Norfolk VA
Victoria J. Hill - Bio-Optics Research Group, Dept. Ocean, Earth and Atmospheric Sciences, Old Dominion University, Norfolk VA
W. Paul Bissett - Florida Environmental Research Institute, Tampa FL
Heidi M. Dierssen - Coastal Ocean Laboratory for Optics and Remote Sensing, University of Connecticut, Avery Point CT
Dave Siegel - Institute for Computational Earth System Science, Department of Geography, University of California, Santa Barbara, CA
August 5 – 7, 2008NASA Habitats Workshop
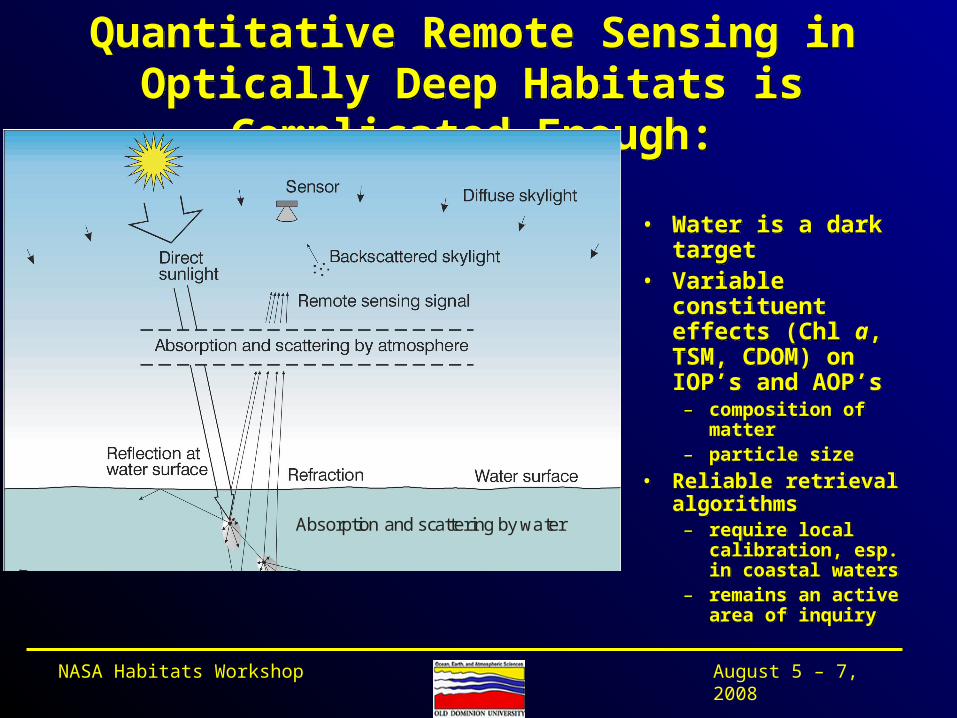
Quantitative Remote Sensing in Optically Deep Habitats is Complicated Enough:
Quantitative Remote Sensing in Optically Deep Habitats is Complicated Enough:
• Water is a dark target• Variable constituent
effects (Chl a, TSM, CDOM) on IOP’s and AOP’s
– composition of matter– particle size
• Reliable retrieval algorithms
– require local calibration, esp. in coastal waters
– remains an active area of inquiry
• Water is a dark target• Variable constituent
effects (Chl a, TSM, CDOM) on IOP’s and AOP’s
– composition of matter– particle size
• Reliable retrieval algorithms
– require local calibration, esp. in coastal waters
– remains an active area of inquiry
Absorption and scattering by water
August 5 – 7, 2008NASA Habitats Workshop
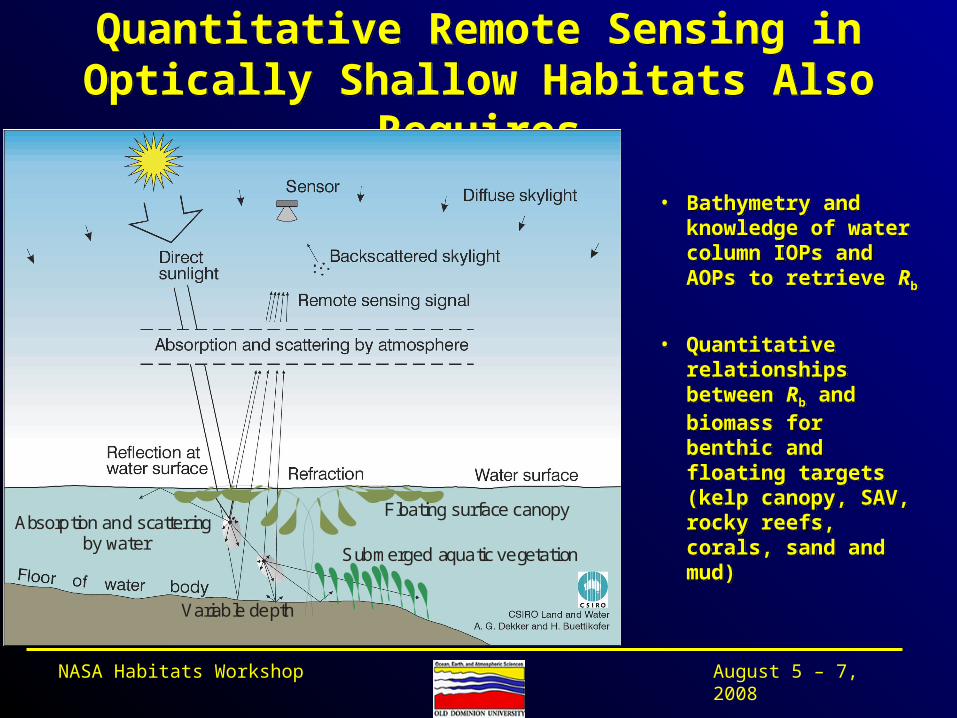
Quantitative Remote Sensing in Optically Shallow Habitats Also Requires
Quantitative Remote Sensing in Optically Shallow Habitats Also Requires
• Bathymetry and knowledge of water column IOPs and AOPs to retrieve Rb
• Quantitative relationships between Rb and biomass for benthic and floating targets (kelp canopy, SAV, rocky reefs, corals, sand and mud)
• Bathymetry and knowledge of water column IOPs and AOPs to retrieve Rb
• Quantitative relationships between Rb and biomass for benthic and floating targets (kelp canopy, SAV, rocky reefs, corals, sand and mud)Variable depth
Floating surface canopy
Submerged aquatic vegetation
Absorption and scatter ing by water
August 5 – 7, 2008NASA Habitats Workshop
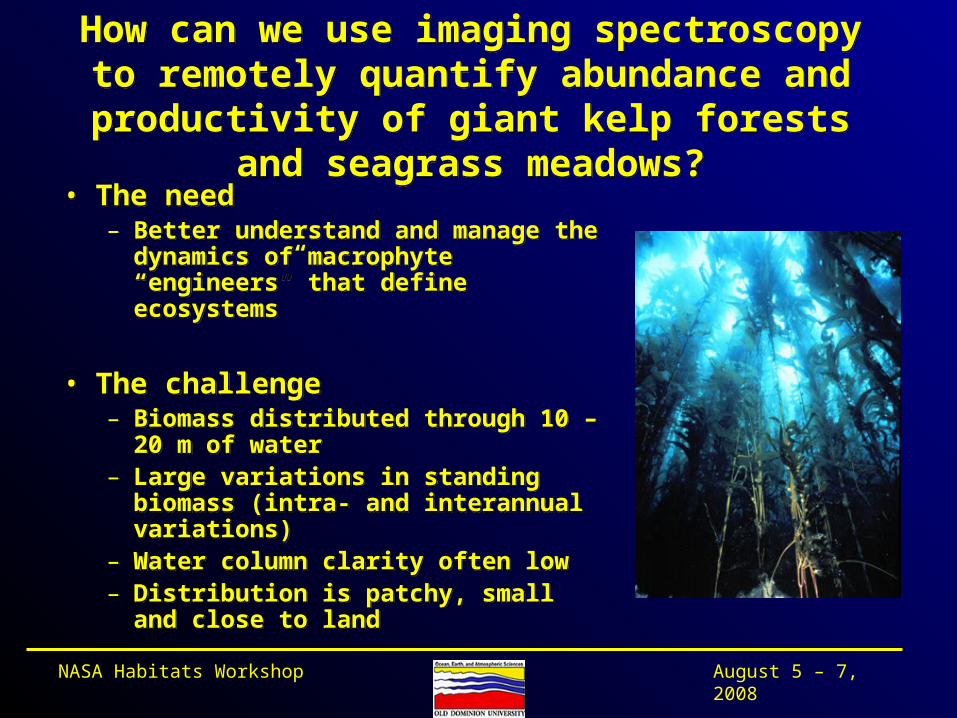
How can we use imaging spectroscopy to remotely quantify abundance and productivity of giant
kelp forests and seagrass meadows?
How can we use imaging spectroscopy to remotely quantify abundance and productivity of giant
kelp forests and seagrass meadows?
• The need– Better understand and manage the
dynamics of macrophyte “engineers” that define ecosystems
• The challenge– Biomass distributed through 10 – 20 m
of water– Large variations in standing biomass
(intra- and interannual variations)– Water column clarity often low– Distribution is patchy, small and close
to land
August 5 – 7, 2008NASA Habitats Workshop
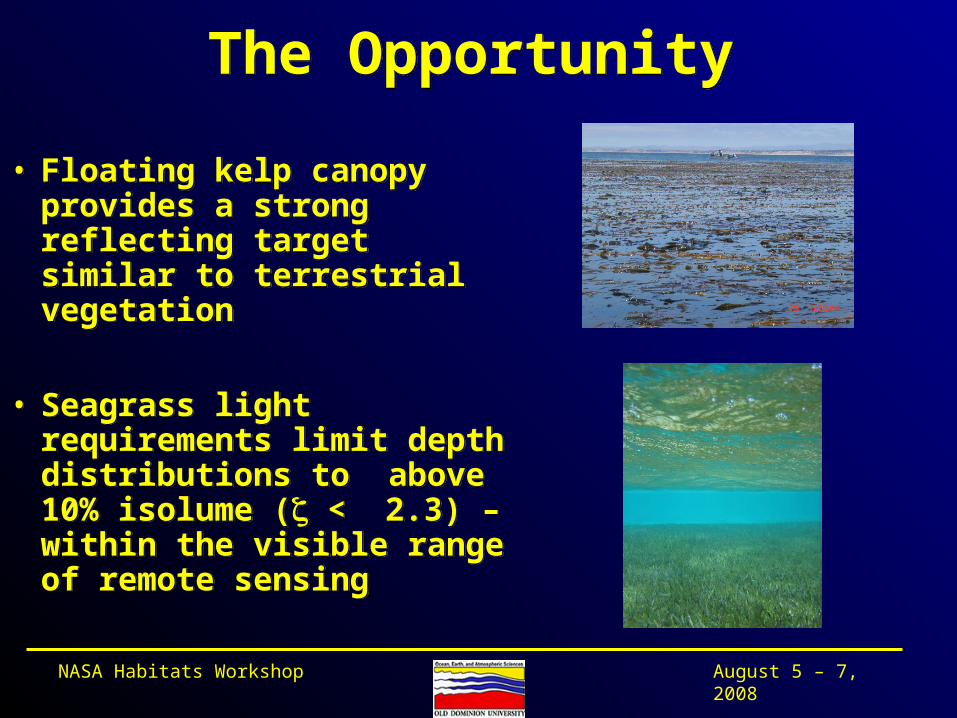
The OpportunityThe Opportunity
• Floating kelp canopy provides a strong reflecting target similar to terrestrial vegetation
• Seagrass light requirements limit depth distributions to above 10% isolume ( < 2.3) – within the visible range of remote sensing
• Floating kelp canopy provides a strong reflecting target similar to terrestrial vegetation
• Seagrass light requirements limit depth distributions to above 10% isolume ( < 2.3) – within the visible range of remote sensing
August 5 – 7, 2008NASA Habitats Workshop
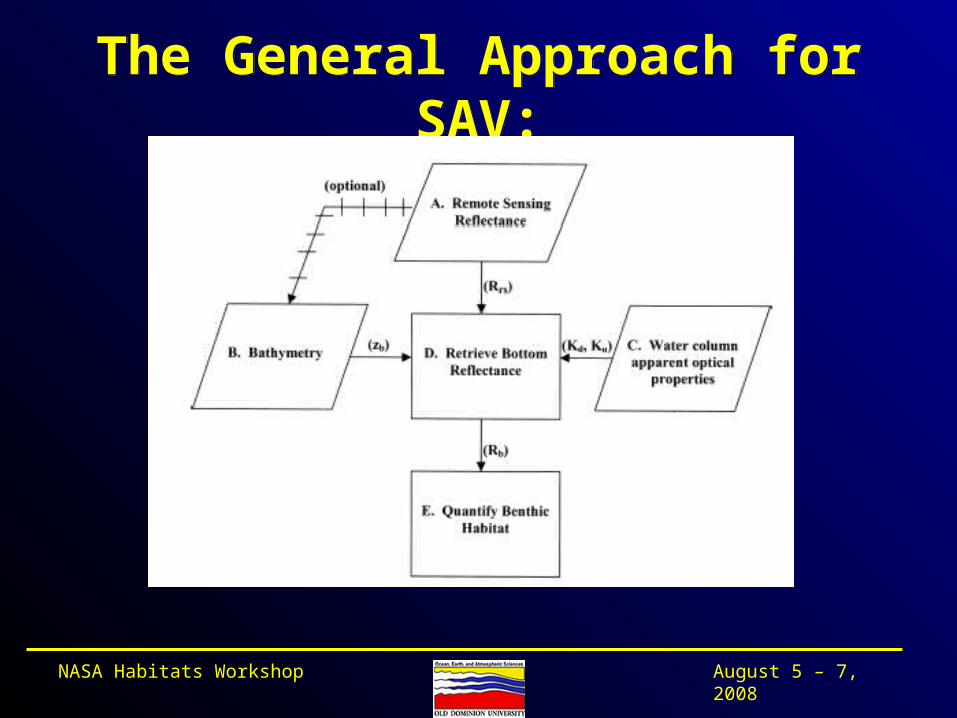
The General Approach for SAV:The General Approach for SAV:
August 5 – 7, 2008NASA Habitats Workshop
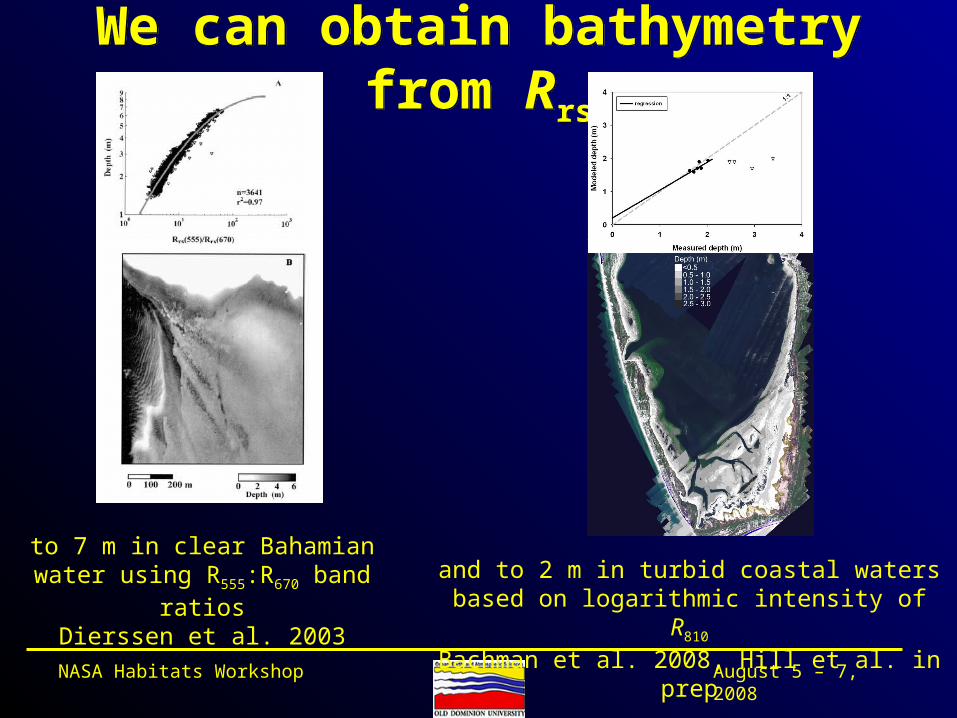
We can obtain bathymetry from Rrs
We can obtain bathymetry from Rrs
to 7 m in clear Bahamian water using R555:R670 band ratiosDierssen et al. 2003
and to 2 m in turbid coastal waters based on logarithmic intensity of R810
Bachman et al. 2008, Hill et al. in prep
August 5 – 7, 2008NASA Habitats Workshop
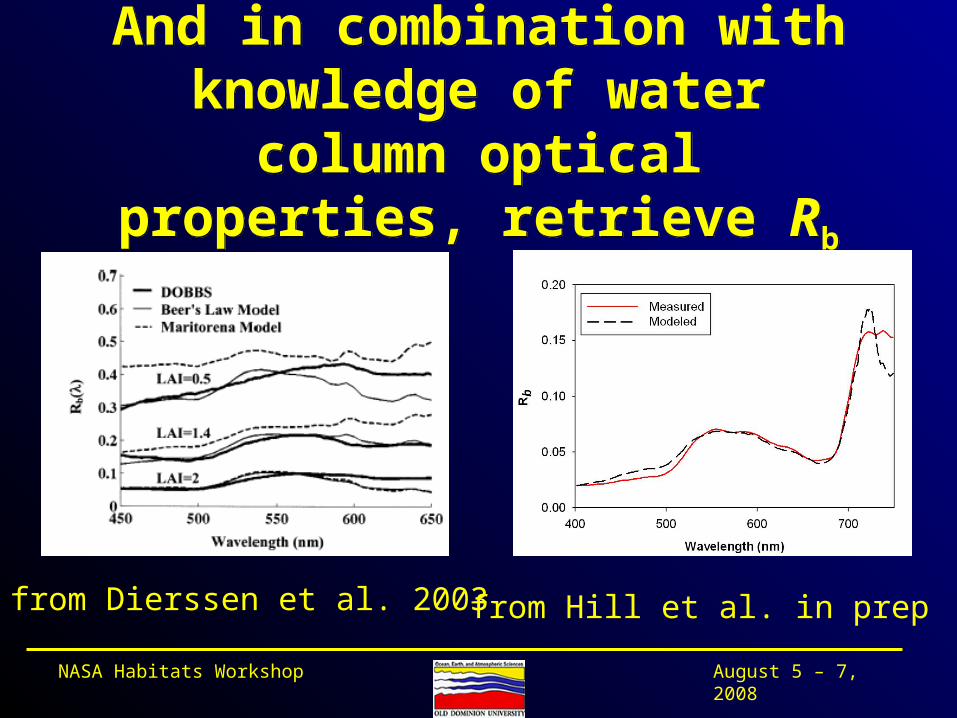
And in combination with knowledge of water column optical
properties, retrieve Rb
And in combination with knowledge of water column optical
properties, retrieve Rb
from Dierssen et al. 2003 from Hill et al. in prep
August 5 – 7, 2008NASA Habitats Workshop
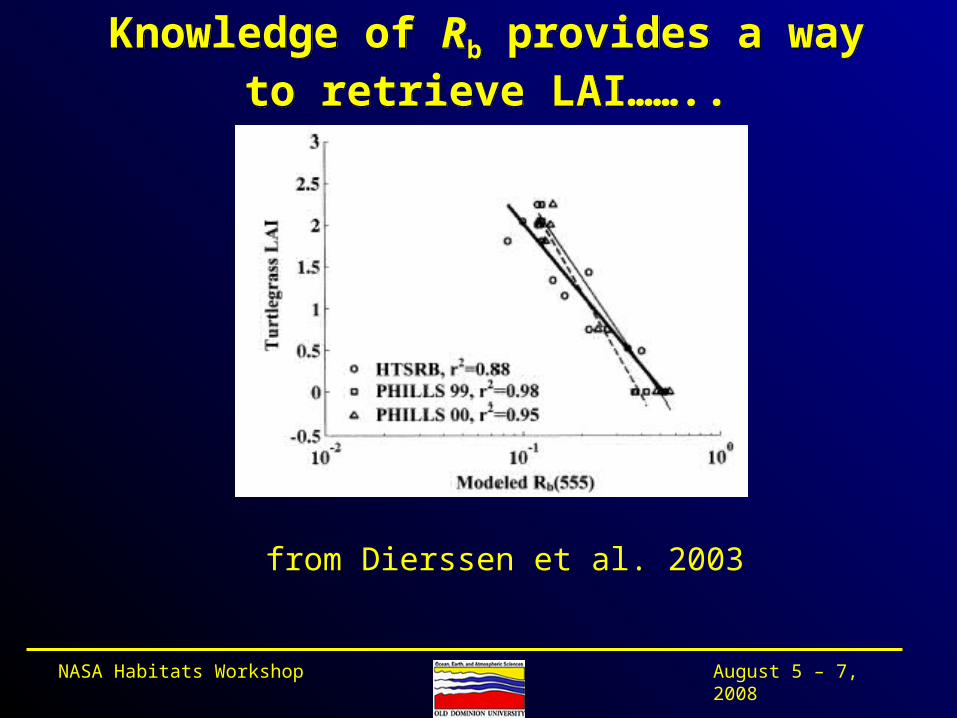
Knowledge of Rb provides a way to retrieve LAI……..
Knowledge of Rb provides a way to retrieve LAI……..
from Dierssen et al. 2003
August 5 – 7, 2008NASA Habitats Workshop
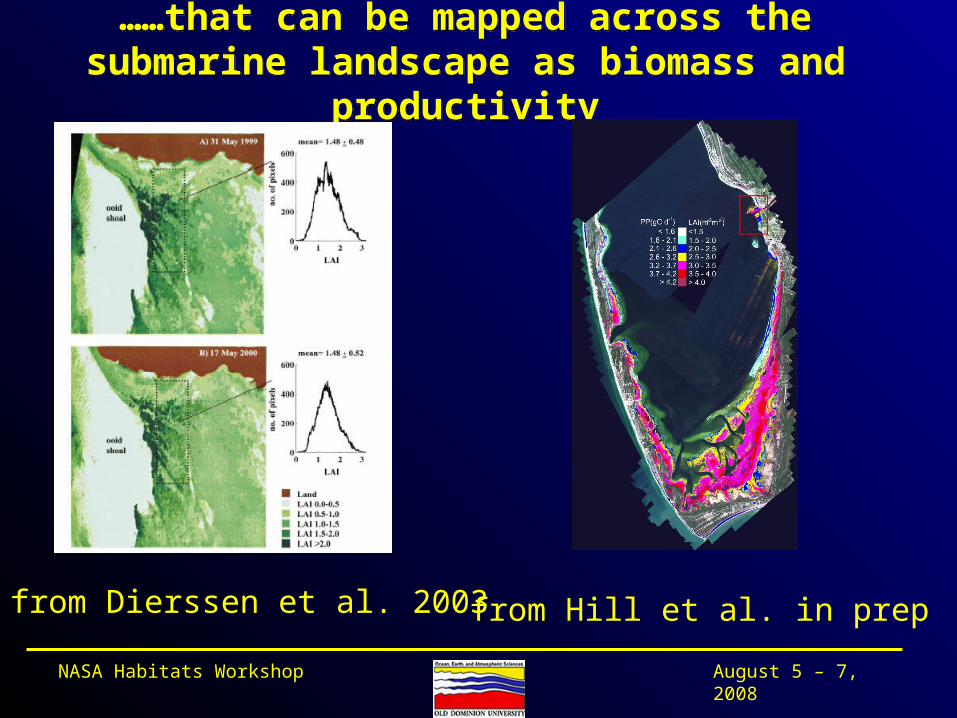
……that can be mapped across the submarine landscape as biomass and productivity
……that can be mapped across the submarine landscape as biomass and productivity
from Dierssen et al. 2003 from Hill et al. in prep
August 5 – 7, 2008NASA Habitats Workshop
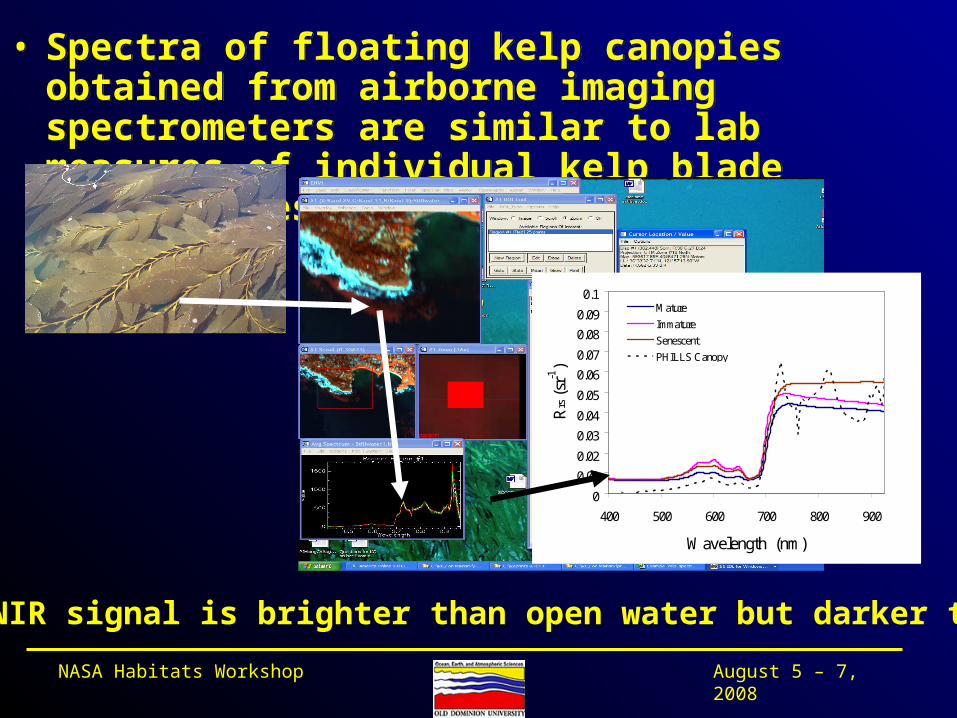
• Spectra of floating kelp canopies obtained from airborne imaging spectrometers are similar to lab measures of individual kelp blade reflectances:
• Spectra of floating kelp canopies obtained from airborne imaging spectrometers are similar to lab measures of individual kelp blade reflectances:
Strong NIR signal is brighter than open water but darker than land
0
0.01
0.02
0.03
0.04
0.05
0.06
0.07
0.08
0.09
0.1
400 500 600 700 800 900
Wavelength (nm)R
rs (
sr-1
)
Mature
Immature
Senescent
PHILLS Canopy
August 5 – 7, 2008NASA Habitats Workshop
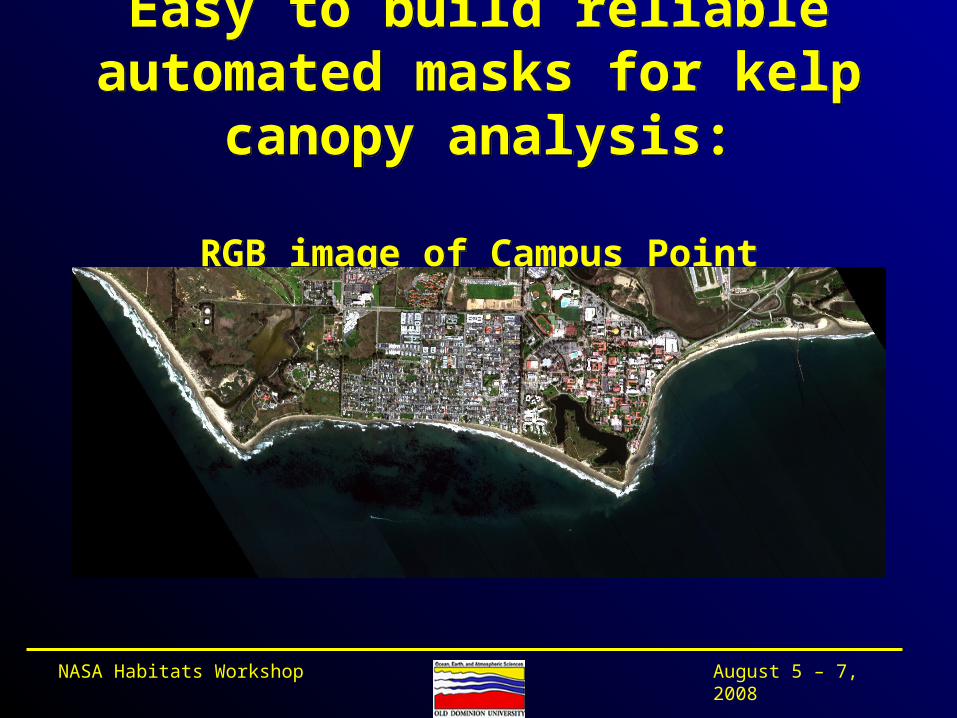
Easy to build reliable automated masks for kelp canopy analysis:
RGB image of Campus Point
Easy to build reliable automated masks for kelp canopy analysis:
RGB image of Campus Point
August 5 – 7, 2008NASA Habitats Workshop
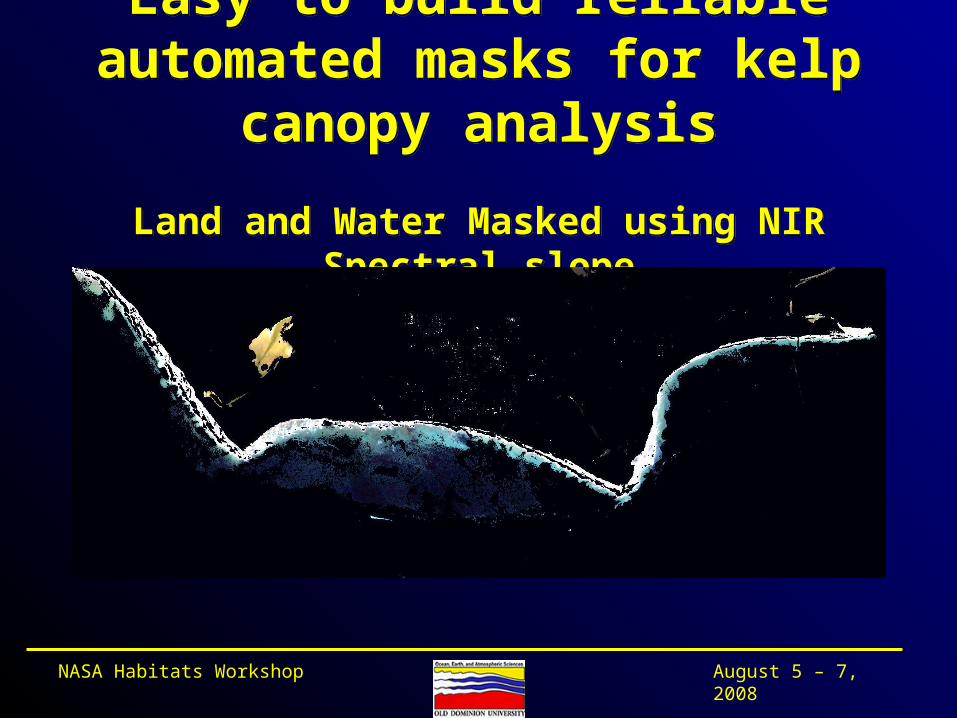
Easy to build reliable automated masks for kelp canopy analysis
Land and Water Masked using NIR Spectral slope
Easy to build reliable automated masks for kelp canopy analysis
Land and Water Masked using NIR Spectral slope
August 5 – 7, 2008NASA Habitats Workshop
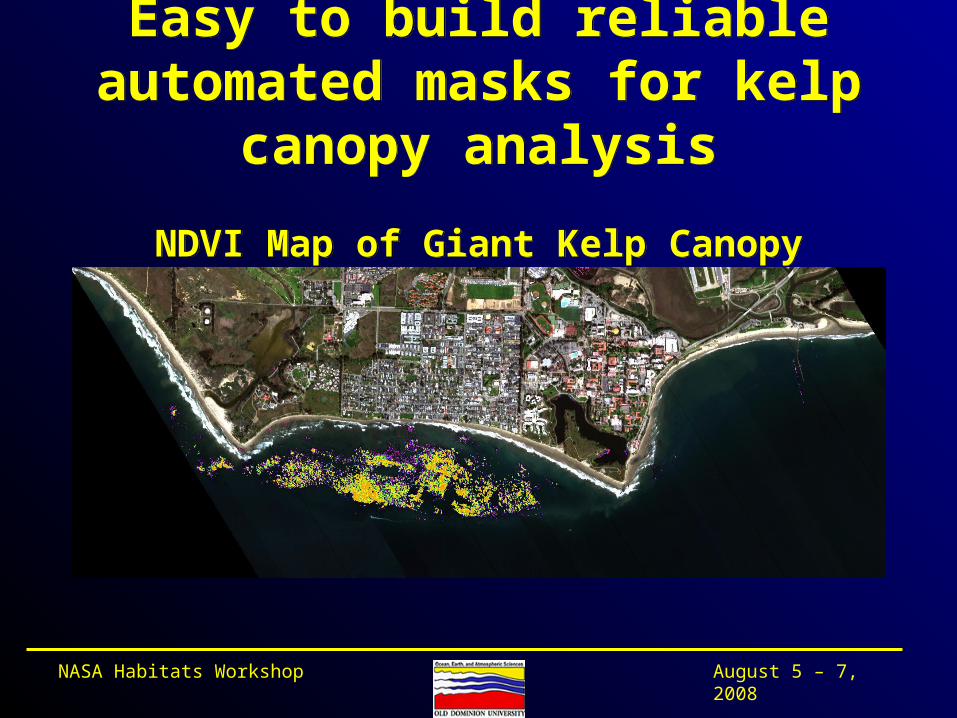
Easy to build reliable automated masks for kelp canopy analysis
NDVI Map of Giant Kelp Canopy
Easy to build reliable automated masks for kelp canopy analysis
NDVI Map of Giant Kelp Canopy
August 5 – 7, 2008NASA Habitats Workshop
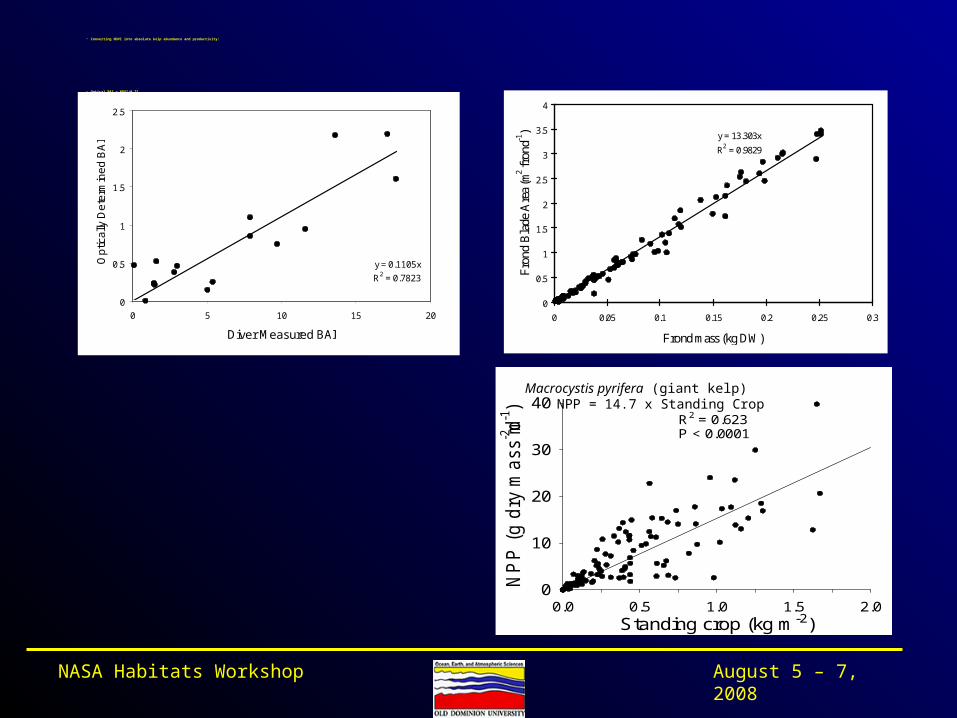
• Converting NDVI into absolute kelp abundance and productivity:
• Optical BAI = NDVI/0.71• True BAI = Optical BAI * 9.04• Biomass = True BAI/13.3• Productivity = Biomass * 14.7
y = 0.1105x
R2 = 0.7823
0
0.5
1
1.5
2
2.5
0 5 10 15 20
Diver Measured BAI
Op
tica
lly D
ete
rmin
ed
BA
I
y = 13.303x
R2 = 0.9829
0
0.5
1
1.5
2
2.5
3
3.5
4
0 0.05 0.1 0.15 0.2 0.25 0.3
Frond mass (kg DW)
Fro
nd B
lade
Are
a (m
2 fro
nd-1
)
Standing crop (kg m-2)0.0 0.5 1.0 1.5 2.0
NP
P (
g d
ry m
ass m-2d-1
)
0
10
20
30
40R2 = 0.623P < 0.0001
a.
Macrocystis pyrifera (giant kelp) NPP = 14.7 x Standing Crop
August 5 – 7, 2008NASA Habitats Workshop
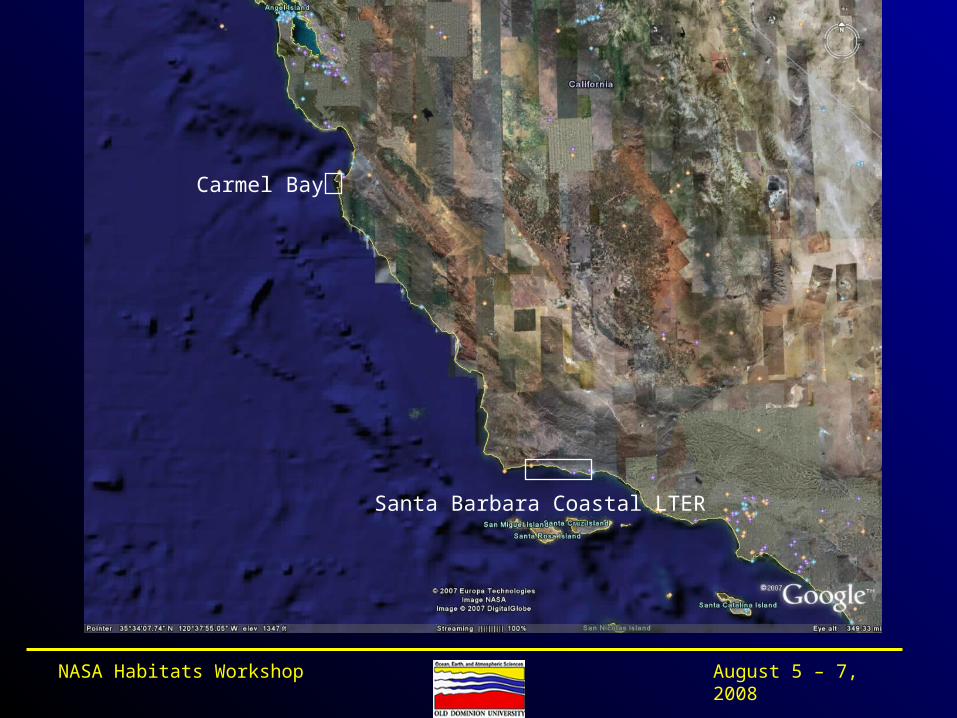
Carmel Bay
Santa Barbara Coastal LTER
August 5 – 7, 2008NASA Habitats Workshop
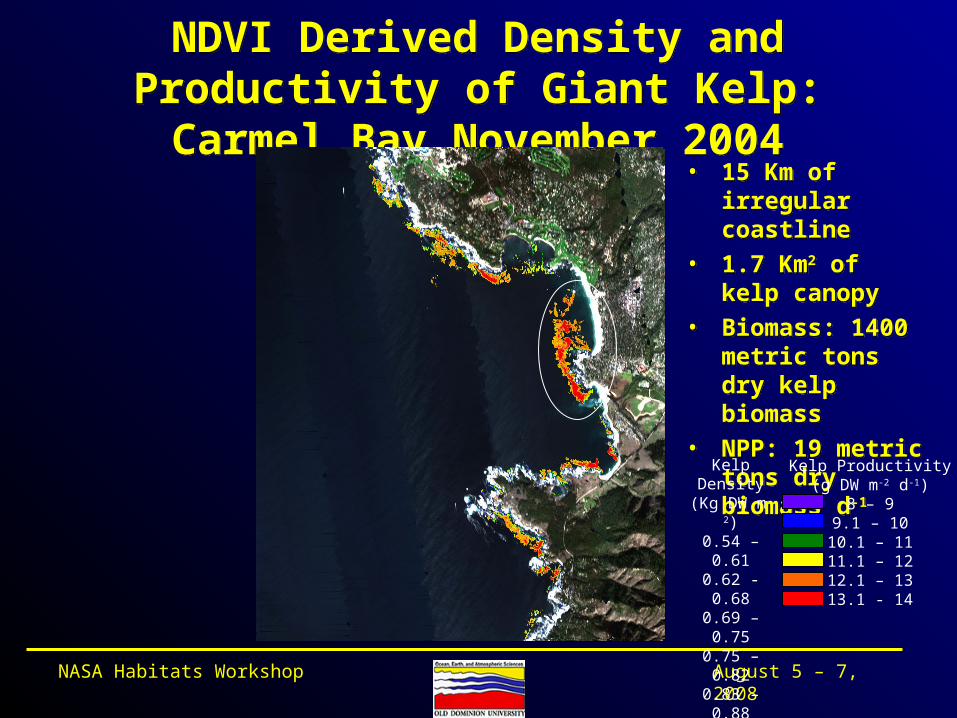
NDVI Derived Density and Productivity of Giant Kelp: Carmel Bay November 2004
NDVI Derived Density and Productivity of Giant Kelp: Carmel Bay November 2004
• 15 Km of irregular coastline
• 1.7 Km2 of kelp canopy
• Biomass: 1400 metric tons dry kelp biomass
• NPP: 19 metric tons dry biomass d-1
• 15 Km of irregular coastline
• 1.7 Km2 of kelp canopy
• Biomass: 1400 metric tons dry kelp biomass
• NPP: 19 metric tons dry biomass d-1
Kelp Density(Kg DW m-2)0.54 – 0.610.62 - 0.680.69 – 0.750.75 – 0.820.83 – 0.880.89 – 0.95
Kelp Productivity(g DW m-2 d-1)
8 – 99.1 – 10
10.1 – 1111.1 – 1212.1 – 1313.1 - 14
August 5 – 7, 2008NASA Habitats Workshop
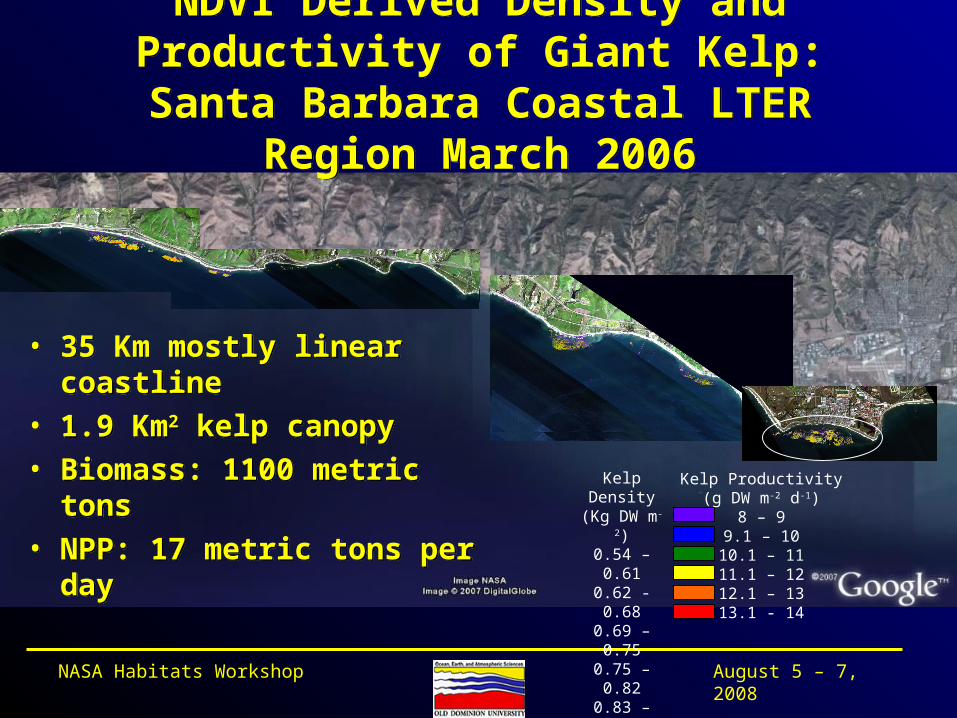
NDVI Derived Density and Productivity of Giant Kelp: Santa Barbara Coastal LTER
Region March 2006
NDVI Derived Density and Productivity of Giant Kelp: Santa Barbara Coastal LTER
Region March 2006
Kelp Density(Kg DW m-2)0.54 – 0.610.62 - 0.680.69 – 0.750.75 – 0.820.83 – 0.880.89 – 0.95
Kelp Productivity(g DW m-2 d-1)
8 – 99.1 – 10
10.1 – 1111.1 – 1212.1 – 1313.1 - 14
• 35 Km mostly linear coastline
• 1.9 Km2 kelp canopy
• Biomass: 1100 metric tons
• NPP: 17 metric tons per day
• 35 Km mostly linear coastline
• 1.9 Km2 kelp canopy
• Biomass: 1100 metric tons
• NPP: 17 metric tons per day
August 5 – 7, 2008NASA Habitats Workshop
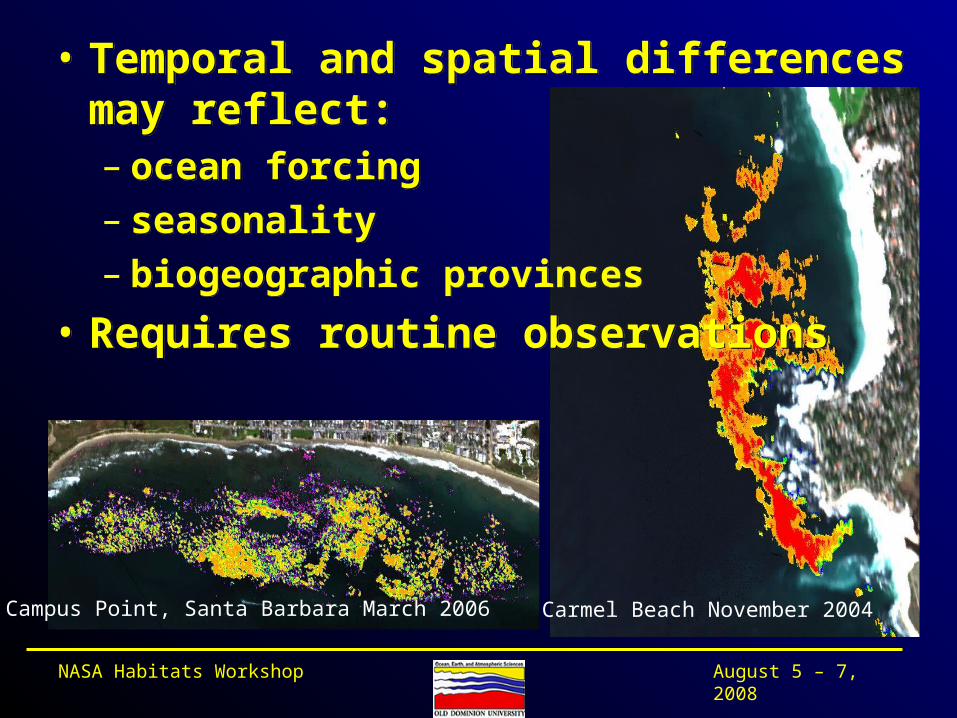
Carmel Beach November 2004Campus Point, Santa Barbara March 2006
• Temporal and spatial differences may reflect:– ocean forcing– seasonality– biogeographic provinces
• Requires routine observations
• Temporal and spatial differences may reflect:– ocean forcing– seasonality– biogeographic provinces
• Requires routine observations
August 5 – 7, 2008NASA Habitats Workshop
Challenges to Routine Use of High Resolution Imaging SpectroscopyChallenges to Routine Use of High Resolution Imaging Spectroscopy
• High spatial and spectral resolution currently available only from airborne sensors, not satellites
• Mobilization costs are considerable for airborne missions
• Weather is ALWAYS a factor
• High spatial and spectral resolution currently available only from airborne sensors, not satellites
• Mobilization costs are considerable for airborne missions
• Weather is ALWAYS a factor
August 5 – 7, 2008NASA Habitats Workshop
Can we employ coarser spectral and spatial resolution instruments
on orbit?
Can we employ coarser spectral and spatial resolution instruments
on orbit?• More reliable temporal coverage• Minimal mobilization costs• NDVI only requires 2 bands (vis & NIR)
– how narrow?
• Some orbiting multi-spectral imagers (e.g. SPOT) provide up to 10 m spatial resolution but optical bands are 70 – 80 nm wide– Is that good enough?
• More reliable temporal coverage• Minimal mobilization costs• NDVI only requires 2 bands (vis & NIR)
– how narrow?
• Some orbiting multi-spectral imagers (e.g. SPOT) provide up to 10 m spatial resolution but optical bands are 70 – 80 nm wide– Is that good enough?
August 5 – 7, 2008NASA Habitats Workshop
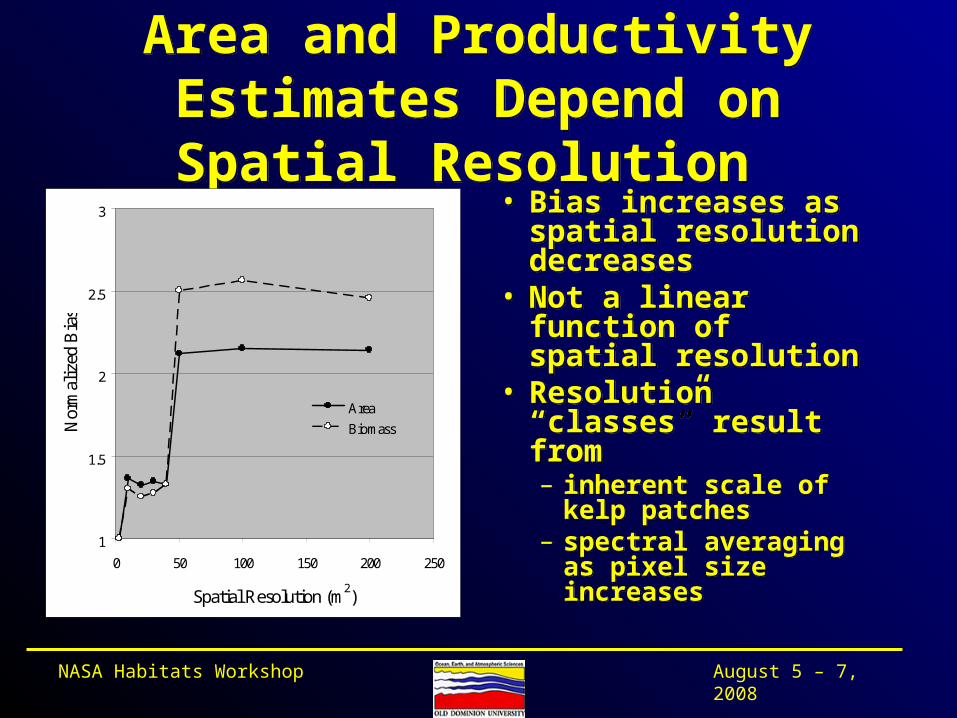
Area and Productivity Estimates Depend on Spatial Resolution
Area and Productivity Estimates Depend on Spatial Resolution
• Bias increases as spatial resolution decreases
• Not a linear function of spatial resolution
• Resolution “classes” result from– inherent scale of kelp
patches– spectral averaging as
pixel size increases
• Bias increases as spatial resolution decreases
• Not a linear function of spatial resolution
• Resolution “classes” result from– inherent scale of kelp
patches– spectral averaging as
pixel size increases
1
1.5
2
2.5
3
0 50 100 150 200 250
Spatial Resolution (m2)
Nor
mal
ized
Bia
s
Area
Biomass
August 5 – 7, 2008NASA Habitats Workshop
ConclusionsConclusions• Remote sensing reflectance of submerged and floating coastal
macrophytes can be used to estimate spatial and temporal patterns of biomass and system productivity
• Remote sensing may be the only way to provide accurate data at the ecosystem scale needed for research and management
• Quantitative results are biased by instrument resolution
• Airborne instruments can provide the required resolution but routine deployment is challenging
• Orbiting instruments may be useful if we can understand impacts of resolution on biomass and productivity estimates
• Remote sensing reflectance of submerged and floating coastal macrophytes can be used to estimate spatial and temporal patterns of biomass and system productivity
• Remote sensing may be the only way to provide accurate data at the ecosystem scale needed for research and management
• Quantitative results are biased by instrument resolution
• Airborne instruments can provide the required resolution but routine deployment is challenging
• Orbiting instruments may be useful if we can understand impacts of resolution on biomass and productivity estimates