AUGUST 4, 2020 - Activision Blizzard
14
SECOND QUARTER 2020 RESULTS AUGUST 4, 2020
Transcript of AUGUST 4, 2020 - Activision Blizzard

SECOND QUARTER 2020 RESULTSAUGUST 4, 2020

2
SAFE HARBOR DISCLOSURE
The statements contained herein that are not historical facts are forward-looking statements including, but not limited to statements about: (1) projections of revenues, expenses, income or loss, earnings or loss per share, cash flow, orother financial items; (2) statements of our plans and objectives, including those related to releases of products or services and restructuring activities; (3) statements of future financial or operating performance, including the impact oftax items thereon; and (4) statements of assumptions underlying such statements. Activision Blizzard, Inc. generally uses words such as “outlook,” “forecast,” “will,” “could,” “should,” “would,” “to be,” “plan,” “aims,” “believes,” “may,”“might,” “expects,” “intends,” “seeks,” “anticipates,” “estimate,” “future,” “positioned,” “potential,” “project,” “remain,” “scheduled,” “set to,” “subject to,” “upcoming,” and other similar words and expressions to help identify forward-looking statements. Forward-looking statements are subject to business and economic risks, reflect management’s current expectations, estimates, and projections about our business, and are inherently uncertain and difficult to predict.
We caution that a number of important factors, many of which are beyond our control, could cause our actual future results and other future circumstances to differ materially from those expressed in any forward-looking statements.Such factors include, but are not limited to: the ongoing global impact of a novel strain of coronavirus which emerged in December 2019 (“COVID-19”) (including, without limitation, the potential for significant short- and long-term globalunemployment and economic weakness and a resulting impact on global discretionary spending; potential strain on the retailers and distributors who sell our physical product to customers; effects on our ability to release our content ina timely manner; the impact of large-scale intervention by the Federal Reserve and other central banks around the world, including the impact on interest rates; and volatility in foreign exchange rates); our ability to consistently deliverpopular, high-quality titles in a timely manner, which has been made more difficult as a result of the COVID-19 pandemic; concentration of revenue among a small number of franchises; our ability to satisfy the expectations of consumerswith respect to our brands, games, services, and/or business practices; our ability to attract, retain and motivate skilled personnel; rapid changes in technology and industry standards; competition, including from other forms ofentertainment; increasing importance of revenues derived from digital distribution channels; risks associated with the retail sales business model; the continued growth in the scope and complexity of our business, including the diversionof management time and attention to issues relating to the operations of our newly acquired or started businesses and the potential impact of our expansion into new businesses on our existing businesses; substantial influence of third-party platform providers over our products and costs; risks associated with transitions to next-generation consoles; success and availability of video game consoles manufactured by third parties; risks associated with the free-to-playbusiness model, including dependence on a relatively small number of consumers for a significant portion of revenues and profits from any given game; our ability to realize the expected financial and operational benefits of, andeffectively implement and manage, our previously-announced restructuring actions; our ability to quickly adjust our cost structure in response to sudden changes in demand; risks and costs associated with legal proceedings; intellectualproperty claims; changes in tax rates or exposure to additional tax liabilities, as well as the outcome of current or future tax disputes; our ability to sell products at assumed pricing levels; reliance on external developers for developmentof some of our software products; the amount of our debt and the limitations imposed by the covenants in the agreements governing our debt; the seasonality in the sale of our products; counterparty risks relating to customers,licensees, licensors, and manufacturers, which have been magnified as a result of the COVID-19 pandemic; risks associated with our use of open source software; piracy and unauthorized copying of our products; insolvency or businessfailure of any of our partners, which has been magnified as a result of the COVID-19 pandemic; risks and uncertainties of conducting business outside the United States; increasing regulation of our business, products, and distribution inkey territories; compliance with continually evolving laws and regulations concerning data privacy; reliance on servers and networks to operate our games and our proprietary online gaming service; potential data breaches and othercybersecurity risks; and the other factors identified in “Risk Factors” included in Part I, Item 1A of our Annual Report on Form 10-K for the year ended December 31, 2019 and our Quarterly Report on Form 10-Q ended June 30, 2020.
The forward-looking statements contained herein are based on information available to Activision Blizzard, Inc. as of the date of this filing and we assume no obligation to update any such forward-looking statements. Although theseforward-looking statements are believed to be true when made, they may ultimately prove to be incorrect. These statements are not guarantees of our future performance and are subject to risks, uncertainties, and other factors, someof which are beyond our control and may cause actual results to differ materially from current expectations.
Please review our SEC filings on Form 10-K and Form 10-Q

3
As a supplement to our financial measures presented in accordance with U.S. Generally Accepted Accounting Principles (“GAAP”), Activision Blizzard presents certain non-GAAP measures of financial performance.These non-GAAP financial measures are not intended to be considered in isolation from, as a substitute for, or as more important than, the financial information prepared and presented in accordance with GAAP.In addition, these non-GAAP measures have limitations in that they do not reflect all of the items associated with the company’s results of operations as determined in accordance with GAAP.
Activision Blizzard provides net income (loss), earnings (loss) per share and operating margin data and guidance both including (in accordance with GAAP) and excluding (non-GAAP) certain items. When relevant,the company also provides constant FX information to provide a framework for assessing how our underlying businesses performed excluding the effect of foreign currency rate fluctuations. In addition, ActivisionBlizzard provides EBITDA (defined as GAAP net income (loss) before interest (income) expense, income taxes, depreciation and amortization) and adjusted EBITDA (defined as non-GAAP operating margin (see non-GAAP financial measure below) before depreciation). The non-GAAP financial measures exclude the following items, as applicable in any given reporting period and our outlook:
expenses related to share-based compensation; the amortization of intangibles from purchase price accounting; fees and other expenses related to acquisitions, including related debt financings, and refinancing of long-term debt, including penalties and the write off of unamortized discount and deferred financing
costs; restructuring and related charges; other non-cash charges from reclassification of certain cumulative translation adjustments into earnings as required by GAAP; the income tax adjustments associated with any of the above items (tax impact on non-GAAP pre-tax income is calculated under the same accounting principles applied to the GAAP pre-tax income under ASC
740, which employs an annual effective tax rate method to the results); and significant discrete tax-related items, including amounts related to changes in tax laws (including the Tax Cuts and Jobs Act enacted in December 2017), amounts related to the potential or final resolution of
tax positions, and other unusual or unique tax-related items and activities.
In the future, Activision Blizzard may also consider whether other items should also be excluded in calculating the non-GAAP financial measures used by the company. Management believes that the presentation ofthese non-GAAP financial measures provides investors with additional useful information to measure Activision Blizzard’s financial and operating performance. In particular, the measures facilitate comparison ofoperating performance between periods and help investors to better understand the operating results of Activision Blizzard by excluding certain items that may not be indicative of the company’s core business,operating results or future outlook. Additionally, we consider quantitative and qualitative factors in assessing whether to adjust for the impact of items that may be significant or that could affect an understandingof our ongoing financial and business performance or trends. Internally, management uses these non-GAAP financial measures, along with others, in assessing the company’s operating results, and measuringcompliance with the requirements of the company’s debt financing agreements, as well as in planning and forecasting.
Activision Blizzard’s non-GAAP financial measures are not based on a comprehensive set of accounting rules or principles, and the terms non-GAAP net income, non-GAAP earnings per share, non-GAAP operatingmargin, and non-GAAP or adjusted EBITDA do not have a standardized meaning. Therefore, other companies may use the same or similarly named measures, but exclude different items, which may not provideinvestors a comparable view of Activision Blizzard’s performance in relation to other companies.
Management compensates for the limitations resulting from the exclusion of these items by considering the impact of the items separately and by considering Activision Blizzard’s GAAP, as well as non-GAAP,results and outlook, and by presenting the most comparable GAAP measures directly ahead of non-GAAP measures, and by providing a reconciliation that indicates and describes the adjustments made.
USE OF NON-GAAP MEASURES
4
SECOND QUARTER 2020 RESULTS
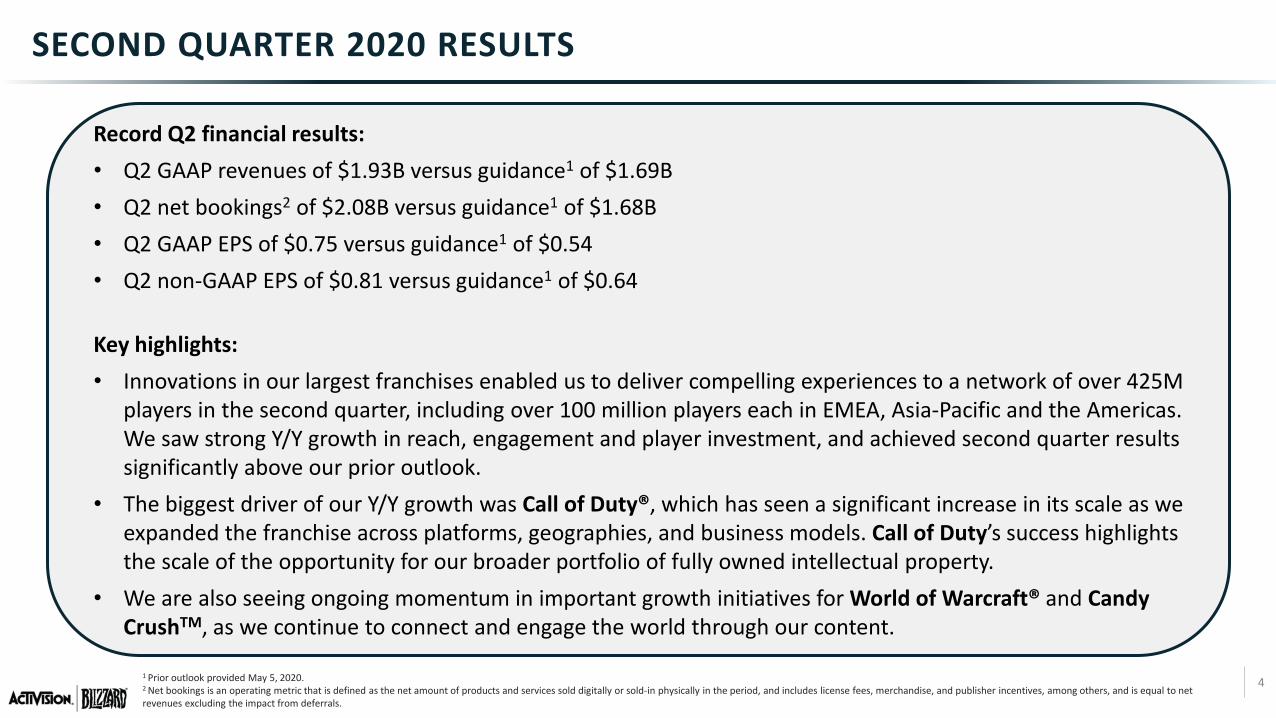
Record Q2 financial results:• Q2 GAAP revenues of $1.93B versus guidance1 of $1.69B• Q2 net bookings2 of $2.08B versus guidance1 of $1.68B• Q2 GAAP EPS of $0.75 versus guidance1 of $0.54• Q2 non-GAAP EPS of $0.81 versus guidance1 of $0.64
Key highlights:• Innovations in our largest franchises enabled us to deliver compelling experiences to a network of over 425M
players in the second quarter, including over 100 million players each in EMEA, Asia-Pacific and the Americas. We saw strong Y/Y growth in reach, engagement and player investment, and achieved second quarter results significantly above our prior outlook.
• The biggest driver of our Y/Y growth was Call of Duty®, which has seen a significant increase in its scale as we expanded the franchise across platforms, geographies, and business models. Call of Duty’s success highlights the scale of the opportunity for our broader portfolio of fully owned intellectual property.
• We are also seeing ongoing momentum in important growth initiatives for World of Warcraft® and Candy CrushTM, as we continue to connect and engage the world through our content.
1 Prior outlook provided May 5, 2020. 2 Net bookings is an operating metric that is defined as the net amount of products and services sold digitally or sold-in physically in the period, and includes license fees, merchandise, and publisher incentives, among others, and is equal to net revenues excluding the impact from deferrals.

5
EXECUTING AGAINST OUR THREE STRATEGIC GROWTH DRIVERS
Strong execution against our strategic growth drivers enabled us to serve compelling experiences to an expanded gaming audience, against a backdrop of demand tailwinds from shelter-at-home. We saw substantial growth in our biggest franchises.
The increased investment and successful initiatives that fueled strong Q2 results position us to continue growing and delighting our global communities, and to deliver sustained greater financial performance over the long term.
Expand audience reach
Deepen engagement
Increase player investment
Our strategic growth drivers:
Our second quarter results significantly exceeded our prior outlook:
6
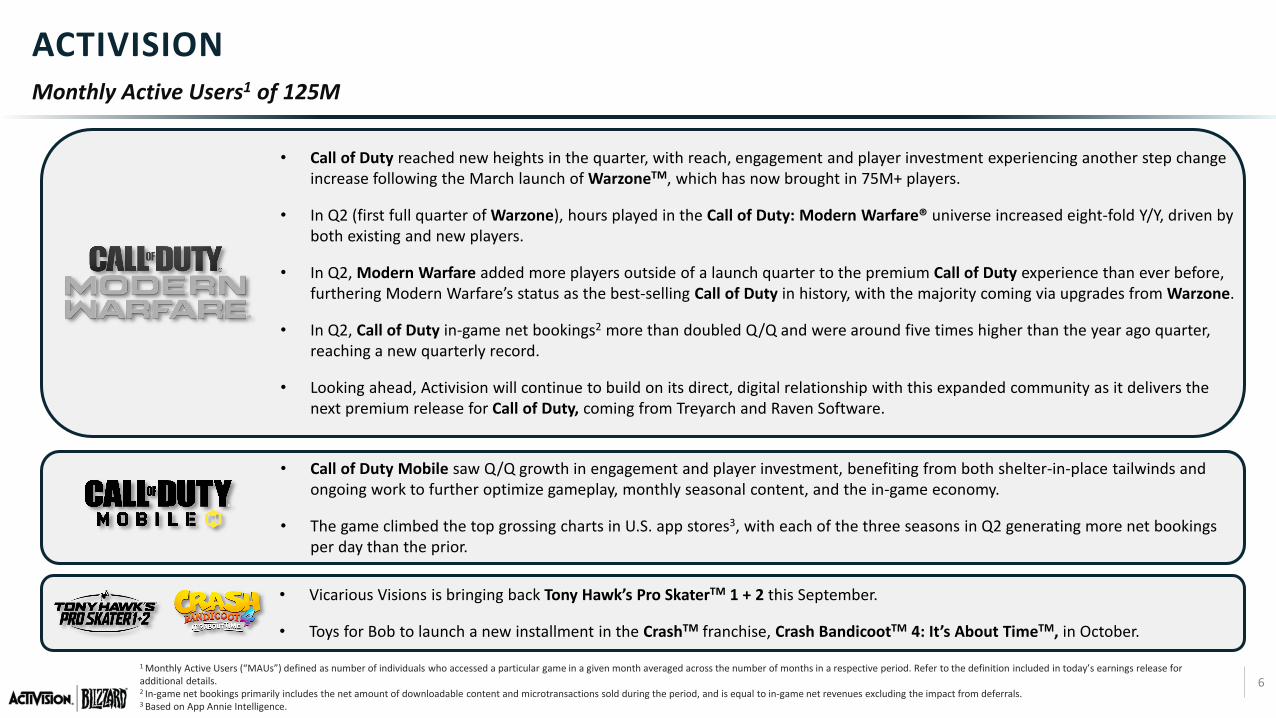
Monthly Active Users1 of 125M
1 Monthly Active Users (“MAUs”) defined as number of individuals who accessed a particular game in a given month averaged across the number of months in a respective period. Refer to the definition included in today’s earnings release for additional details.2 In-game net bookings primarily includes the net amount of downloadable content and microtransactions sold during the period, and is equal to in-game net revenues excluding the impact from deferrals.3 Based on App Annie Intelligence.
ACTIVISION
• Call of Duty reached new heights in the quarter, with reach, engagement and player investment experiencing another step change increase following the March launch of WarzoneTM, which has now brought in 75M+ players.
• In Q2 (first full quarter of Warzone), hours played in the Call of Duty: Modern Warfare® universe increased eight-fold Y/Y, driven by both existing and new players.
• In Q2, Modern Warfare added more players outside of a launch quarter to the premium Call of Duty experience than ever before, furthering Modern Warfare’s status as the best-selling Call of Duty in history, with the majority coming via upgrades from Warzone.
• In Q2, Call of Duty in-game net bookings2 more than doubled Q/Q and were around five times higher than the year ago quarter, reaching a new quarterly record.
• Looking ahead, Activision will continue to build on its direct, digital relationship with this expanded community as it delivers the next premium release for Call of Duty, coming from Treyarch and Raven Software.
• Call of Duty Mobile saw Q/Q growth in engagement and player investment, benefiting from both shelter-in-place tailwinds and ongoing work to further optimize gameplay, monthly seasonal content, and the in-game economy.
• The game climbed the top grossing charts in U.S. app stores3, with each of the three seasons in Q2 generating more net bookings per day than the prior.
• Vicarious Visions is bringing back Tony Hawk’s Pro SkaterTM 1 + 2 this September.
• Toys for Bob to launch a new installment in the CrashTM franchise, Crash BandicootTM 4: It’s About TimeTM, in October.

7
BLIZZARDMonthly Active Users1 of 32M
• World of Warcraft reach and engagement once again increased Q/Q, as shelter-at-home conditionsfurther boosted the franchise’s strong trajectory, following the launch of Classic last August.
• Anticipation continues to build for Shadowlands, the next expansion for modern World of Warcraft coming in Q4. Engagement in the franchise is the highest it has been at this point ahead of an expansion in a decade.
• Shadowlands saw an enthusiastic response from players in its public testing, with pre-sales accelerating even further in Q2.
1 Monthly Active Users (“MAUs”) defined as number of individuals who accessed a particular game in a given month averaged across the number of months in a respective period. Refer to the definition included in today’s earnings release for additional details.
• The Ashes of OutlandTM expansion for Hearthstone® launched alongside the first new hero class in Q2, as the expanded team continued to accelerate the pace of innovative content in the franchise.
• Building on the success of Battlegrounds and recent live operations, the Hearthstone pipeline includes expansions, new engagement features and a new game mode planned for the coming quarters.
• Overwatch® saw a significant number of returning players, contributing to strong Y/Y growth in engagement.
• Diablo® ImmortalTM, developed for mobile in partnership with NetEase, is due to expand internal testing with a company playtest in the coming weeks.

8
KINGMonthly Active Users1 of 271M
• King delivered strong increases in reach and engagement amidst shelter-at-home conditions at the start of Q2. While these tailwinds moderated in the second half of the quarter, MAUs1 remained higher year-over-year. Candy Crush saw double-digit MAU1 growth in the quarter.
• Payer conversion grew Y/Y, continuing the improving trend seen in recent quarters, and positioning the business for stronger results over the medium and long term.
• Along with higher performance for its in-app business, King’s advertising revenue grew strongly Y/Y and accelerated through the quarter.
1 Monthly Active Users (“MAUs”) defined as number of individuals who accessed a particular game in a given month averaged across the number of months in a respective period. Refer to the definition included in today’s earnings release for additional details.2 Based on App Annie Intelligence.
• Candy Crush was once again the top grossing franchise in the U.S. app stores.2
• King is bringing Activision’s beloved Crash franchise to the mobile platform with Crash Bandicoot: On the Run!TM, an ambitious new take on the runner category with deep social and resource management elements.


10
SECOND QUARTER 2020 SEGMENT RESULTS
Note: These segment results are consistent with how we report our U.S. GAAP segment results externally in the footnotes to our financial statements. The segment performance is exclusive of the impact of the change in deferred revenues and related cost of revenues with respect to certain of our online-enabled products, share-based compensation expense, amortization of intangible assets as a result of purchase price accounting, fees and other expenses related to financings and acquisitions, including integration activities, certain restructuring and related costs, and other non-cash charges. Reconciliation of our segment results to our consolidated results is included in the earnings release dated August 4, 2020, which is available on www.activisionblizzard.com.
Q2 Segment Net Revenues: $993M $461M $553M
Q2 Segment Operating Income:
$559M56% operating margin
$203M44% operating margin
$212M38% operating margin
Key Drivers: • Revenue grew 270% Y/Y to a Q2 record driven by Call of Duty: Modern Warfare and Warzonein-game revenues, strong sales of premium Modern Warfare, the addition of Call of Duty Mobile, and catalog sales.
• Operating income and margin reflected high incremental margins for both in-game and upfront sales on console and PC.
• Revenue grew 20% Y/Y, driven by another strong quarter for World of Warcraft.
• Operating income and margin both grew significantly Y/Y.
• Revenue grew 11% Y/Y to the highest level since the acquisition, with growth in both in-app purchases and advertising.
• Operating income was also the highest since the acquisition, with operating margin increasing 4 pp Y/Y.

11
SECOND QUARTER 2020 RESULTS
1 Prior outlook provided May 5, 2020. 2 For Q2 2019 and Q2 2020, GAAP results include restructuring and related charges of $22M and $6M, respectively.3 Non-GAAP reconciliations are in the earnings releases dated August 8, 2019, May 5, 2020, and August 4, 2020, which are available on www.activisionblizzard.com. 4 Free Cash Flow represents Operating Cash Flow minus Capital Expenditure. 5 Net bookings is an operating metric that is defined as the net amount of products and services sold digitally or sold-in physically in the period, and includes license fees, merchandise, and publisher incentives, among others, and is equal to net revenues excluding the impact from deferrals.6 In-game net bookings primarily includes the net amount of downloadable content and microtransactions sold during the period and is equal to in-game net revenues excluding the impact from deferrals.
Q2 2019 Actual Prior Q2 2020 Outlook1 Q2 2020 Actual
GAAP2 Non-GAAP3Impact of
GAAP deferrals
GAAP Non-GAAP3Impact of
GAAP deferrals
GAAP2 Non-GAAP3Impact of
GAAP deferrals
Net Revenues $1,396M $1,396M ($189M) $1,690M $1,690M ($15M) $1,932M $1,932M $146M
Digital Revenues % 78% 78% 82% 82%
Operating Income $336M $443M ($135M) $749M $811M $152M
Operating Margin 24% 32% (6 pp) 33% 38% - 39% 42% 4 pp
Interest and Other Expense (Income) ($34M) ($34M) $22M $21M $22M $22M
EPS $0.43 $0.53 ($0.15) $0.54 $0.64 $0.01 $0.75 $0.81 $0.16
Fully Diluted Weighted Avg. Shares 770M 770M 776M 776M 776M 776M
Operating Cash Flow $154M $768M
Free Cash Flow4 $127M $755M
Net Bookings (operating metric)5 $1,207M $1,675M $2,078M
In-Game Net Bookings (operating metric)6 $778M $1,374M

12
BALANCE SHEET AS OF JUNE 30, 2020Q2 adjusted EBITDA of $840M; dividend of $0.41 per share paid on May 6, 2020
1 As of June 30, 2020, includes notes with the maturity dates of 2021, 2022, 2026, 2027, and 2047.2 Net cash is defined as cash and cash equivalents, short-term investments and long-term investments minus gross debt.3 Adjusted TTM EBITDA, for any given date, is calculated as non-GAAP operating income plus depreciation for the trailing twelve months.
6/30/2019 3/31/2020 6/30/2020
Cash and investments $4.68B $5.98B $6.46B
Gross Debt1 $2.70B $2.70B $2.70B
Net Cash2 $1.98B $3.28B $3.76B
Adjusted TTM EBITDA3 $2,561M $2,218M $2,583M
Gross Debt / Adj. TTM EBITDA3 1.1x 1.2x 1.0x

13
FINANCIAL OUTLOOK AS OF AUGUST 4, 2020
1 Non-GAAP reconciliations are in the earnings release dated August 4, 2020, which is available on www.activisionblizzard.com. 2 Our GAAP outlook include approximately $20M and $50M of restructuring and related charges for Q3 and 2020, respectively, that we expect to incur as we continue to execute against our previously disclosed restructuring plan.3 Net effect of revenue deferral accounting treatment on certain of our online enabled products. 4 Includes expenses related to product development, sales & marketing, and general & administrative, as well as software amortization & IP licenses costs. 5 May not recalculate due to rounding.6 Including fully diluted shares based on average share price.7 Net bookings is an operating metric that is defined as the net amount of products and services sold digitally or sold-in physically in the period, and includes license fees, merchandise, and publisher incentives,among others and is equal to net revenues excluding the impact from deferrals.
Q3 2020 2020
GAAP1,2 Non-GAAP1 Impact of GAAP Deferrals3 GAAP1,2 Non-GAAP1 Impact of GAAP
Deferrals3
Net Revenues $1,800M $1,800M ($150M) $7,275M $7,275M $350M
Product Costs, Game Ops & Distribution 18% 18% 19% 19%
Operating Expenses, Incl. SW Amort4 46% 40% 47% 42%
Operating Margin5 36% 42% (6 pp) 34% 39% -
Interest and Other Expense (Income) $23M $23M $77M $75M
Tax Rate 20% 19% 20% 19%
EPS $0.64 $0.75 ($0.15) $2.46 $2.87 $0.18
Fully Diluted Weighted Avg. Shares6 780M 780M 780M 780M
Net Bookings (operating metric)7 $1,650M $7,625M

Q&AAUGUST 4, 2020