August 27th, 2012, Southbank sustainable-living.unilever
8
Mapping of Australian System against Unilever SAC Unilever Sustainable Sourcing – Australian Dairy Industry 1. August 27th, 2012, Southbank www.sustainable-living.unilever.com
-
Upload
leonard-meyer -
Category
Documents
-
view
52 -
download
2
description
1. Mapping of Australian System against Unilever SAC Unilever Sustainable Sourcing – Australian Dairy Industry. August 27th, 2012, Southbank www.sustainable-living.unilever.com. Why this benchmark?. To acknowledge the high standard of Australian dairy farming systems - PowerPoint PPT Presentation
Transcript of August 27th, 2012, Southbank sustainable-living.unilever

Mapping of Australian System against Unilever SACUnilever Sustainable Sourcing – Australian Dairy Industry
1.
August 27th, 2012, Southbank
www.sustainable-living.unilever.com

Why this benchmark?
• To acknowledge the high standard of Australian dairy farming systems
• To assure this high level for Unilever• To reduce future work for Unilever suppliers,
their farmers and Unilever• To get Australian dairy farming systems in Annex
I of the Unilever Scheme rules

How is this benchmark organised?• On-going work since autumn 2011• Dairy Australia (Helen, Rob, Robin and Catherine)
developed first version• First version discussed in May 2012 in Brussels (Helen &
Klaas Jan)• Included benchmark in Unilever Benchmark spread
sheet in July 2012• Further discussion on benchmark in August 2012• Workshop and farm visits will help to finalize the
benchmark• Final benchmark will be evaluated by SSDT team
Unilever
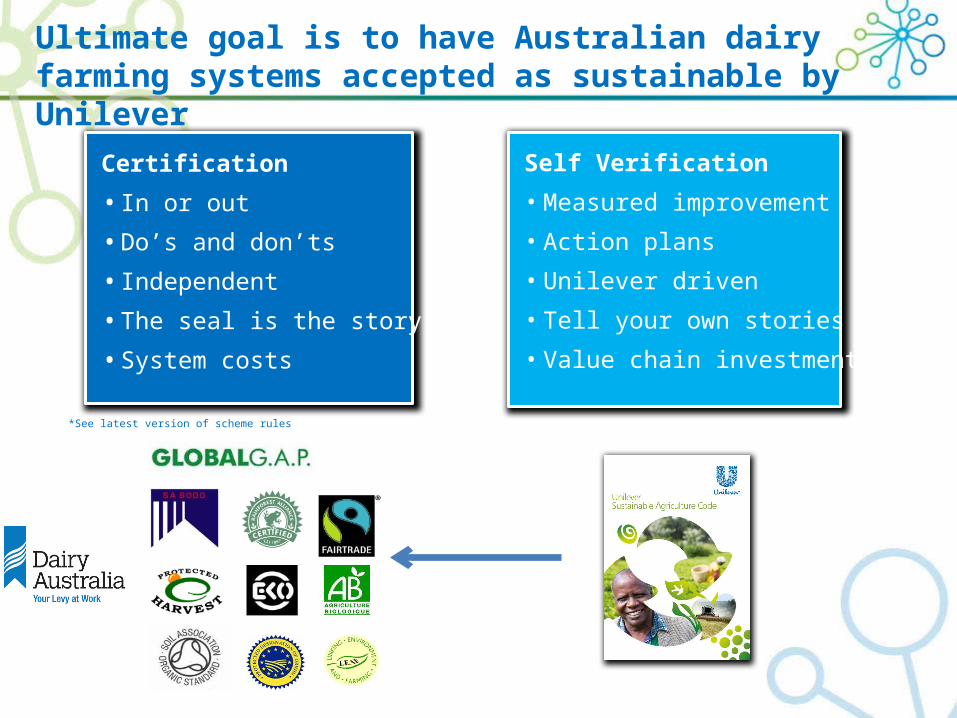
Ultimate goal is to have Australian dairy farming systems accepted as sustainable by Unilever
Certification
• In or out
• Do’s and don’ts
• Independent
• The seal is the story
• System costs
Self Verification
• Measured improvement
• Action plans
• Unilever driven
• Tell your own stories
• Value chain investment
*See latest version of scheme rules

Performance levels per question type
Mandatory : where 100% compliance is
required
Must: 80% of the total must and min. 80% of
each chapter is required
Should: recommended but not required
Metrics: Report on continues improvement
Minimum standard to become recognised as sustainable
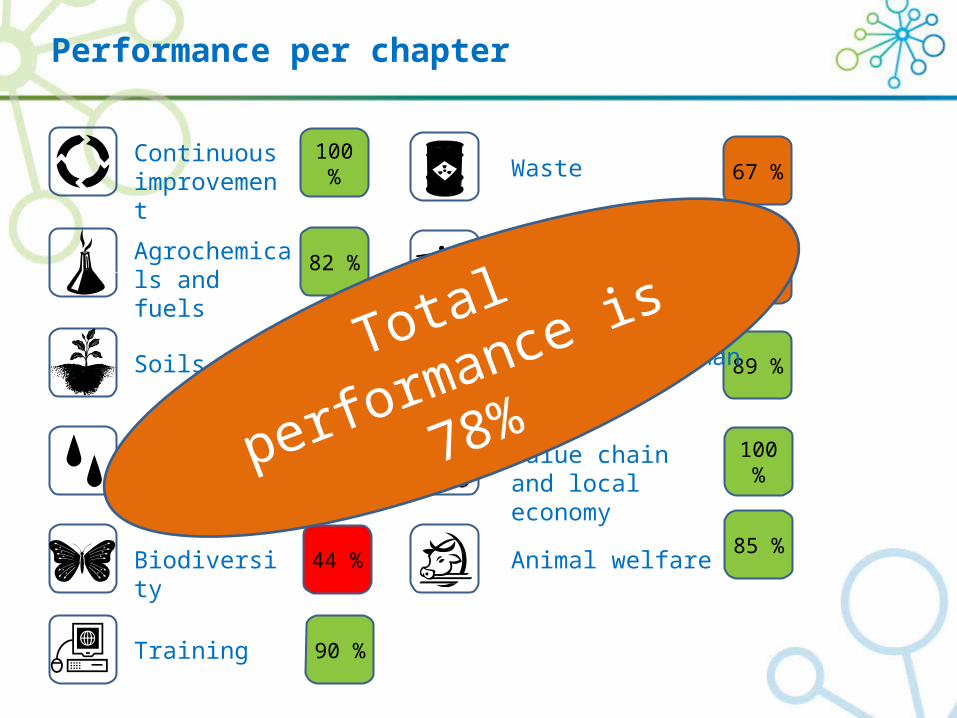
Performance per chapter
82 %
53 %
67 %
85 %44 %
100 %
100 %
70 %
89 %
100 %
90 %
Continuous improvement
Agrochemicals and fuels
Soils
Biodiversity
Waste
Energy and Greenhouse gases
Social and human capital
Value chain and local economy
Animal welfare
Click on links for more
Training
WaterTotal performance is
78%
Overall conclusions
• Best farms will be compliant with Sustainable Agricultural Code already
• Risks are the 20% dairy farms that do not participate in industry programs
• Chapters that need improvement:– Soils, Waste, Energy and Biodiversity– Comparable to European results
• First sustainable supply should be possible in 2012– Dependent on way forward (Industry Standard
or individual self-assessment process)

Next steps
• Visit dairy farms to verify and finalize benchmark
• External verification of the benchmark process by SSDT Unilever – Leading to partly or fully recognition of
Australian dairy farming systems• Develop improvement plan with focus on metrics
and non-compliant chapters • Analyse and manage sustainability risks not
covered by the SAC• Support Dairy Australia with developing the
Sustainability Plan