August, 2019 I Industry Research Indian Fertilizer ... · Overview The fertilizer industry is a key...
16
Overview The fertilizer industry is a key industry for the Indian economy in terms of assuring food security to the country. India is the 2 nd largest consumer of fertilizers (urea accounts for over 2/3 rd of the overall fertiliser consumption) and is also the 3 rd largest producer of nitrogenous fertilizers (China and the US rank before India). In terms of production of phosphatic fertilizers, India has production capacity spread across the private and co-operative sector, whereas the requirement of potash is completely met through imports. Types of Fertilizers Fertilizers are materials used to provide plant with nutrients which are deficient in soils. It is a chemical product which is either mined or manufactured. Most of the fertilizers are extracted and purified from natural deposits in the earth. Materials such as sulpomag, muriate of potash and triple super phosphate are all produced from naturally occurring minerals. Some materials, such as urea and ammonium nitrate are synthetic, but provide plants with the same nutrients that are found naturally in the soil. Chemicals fertilizers are classified on the basis of quantum required by the soil as Primary, Secondary and Micronutrients. Primary nutrients are further categorized on the type of nutrients they supply to the soil which are nitrogenous (responsible for strong stem and foliage growth), phosphatic (responsible for healthy growth and flower and seed production) and potassic (responsible for improving the crop’s overall health and disease resistance) fertilizers. Secondary nutrients include calcium, magnesium and sulphur while micronutrients, include iron, zinc, copper, boron and chlorine. India is dependent on imports for raw materials for production of Nitrogenous & Phosphatic fertilizers. Product wise chemical fertilizers are classified into Urea, Diammonium Phosphate (DAP), Single Super Phosphate (SSP), Muriate of Potash (MOP) and other Complex fertilizers like Calcium Ammonium Nitrate (CAN) and various grades of NPK Fertilizers (Fertilizers having different grades of Nitrogen (N), Phosphorus (P), and Potassium (K)). In India the most widely used fertilizer in the Nitrogenous category is Urea, DAP and MOP for Phosphorus and Potassium respectively. August, 2019 I Industry Research Indian Fertilizer Industry: Insights and Prospects Contact: Madan Sabnavis Chief Economist [email protected] +91-22- 6837 4433 Urvisha H Jagasheth Research Analyst [email protected] +91-22-6837 4410 Mradul Mishra (Media Contact) [email protected] +91-22-6837 4424 Disclaimer: This report is prepared by CARE Ratings Ltd. CARE Ratings has taken utmost care to ensure accuracy and objectivity while developing this report based on information available in public domain. However, neither the accuracy nor completeness of information contained in this report is guaranteed. CARE Ratings is not responsible for any errors or omissions in analysis/inferences/views or for results obtained from the use of information contained in this report and especially states that CARE Ratings has no financial liability whatsoever to the user of this report
Transcript of August, 2019 I Industry Research Indian Fertilizer ... · Overview The fertilizer industry is a key...
Overview
The fertilizer industry is a key industry for the Indian economy in terms
of assuring food security to the country.
India is the 2nd largest consumer of fertilizers (urea accounts for over
2/3rd of the overall fertiliser consumption) and is also the 3rd largest
producer of nitrogenous fertilizers (China and the US rank before India).
In terms of production of phosphatic fertilizers, India has production
capacity spread across the private and co-operative sector, whereas the
requirement of potash is completely met through imports.
Types of Fertilizers
Fertilizers are materials used to provide plant with nutrients which are
deficient in soils. It is a chemical product which is either mined or
manufactured.
Most of the fertilizers are extracted and purified from natural deposits
in the earth. Materials such as sulpomag, muriate of potash and triple
super phosphate are all produced from naturally occurring minerals.
Some materials, such as urea and ammonium nitrate are synthetic, but
provide plants with the same nutrients that are found naturally in the
soil.
Chemicals fertilizers are classified on the basis of quantum required by
the soil as Primary, Secondary and Micronutrients. Primary nutrients
are further categorized on the type of nutrients they supply to the soil
which are nitrogenous (responsible for strong stem and foliage growth),
phosphatic (responsible for healthy growth and flower and seed
production) and potassic (responsible for improving the crop’s overall
health and disease resistance) fertilizers. Secondary nutrients include
calcium, magnesium and sulphur while micronutrients, include iron,
zinc, copper, boron and chlorine. India is dependent on imports for raw
materials for production of Nitrogenous & Phosphatic fertilizers.
Product wise chemical fertilizers are classified into Urea, Diammonium
Phosphate (DAP), Single Super Phosphate (SSP), Muriate of Potash
(MOP) and other Complex fertilizers like Calcium Ammonium Nitrate
(CAN) and various grades of NPK Fertilizers (Fertilizers having different
grades of Nitrogen (N), Phosphorus (P), and Potassium (K)).
In India the most widely used fertilizer in the Nitrogenous category is
Urea, DAP and MOP for Phosphorus and Potassium respectively.
August, 2019 I Industry Research Indian Fertilizer Industry:
Insights and Prospects
Contact:
Madan Sabnavis Chief Economist [email protected] +91-22- 6837 4433
Urvisha H Jagasheth Research Analyst [email protected] +91-22-6837 4410
Mradul Mishra (Media Contact) [email protected] +91-22-6837 4424
Disclaimer: This report is prepared by CARE Ratings Ltd. CARE Ratings has taken utmost care to ensure accuracy and objectivity while developing this report based on information available in public domain. However, neither the accuracy nor completeness of information contained in this report is guaranteed. CARE Ratings is not responsible for any errors or omissions in analysis/inferences/views or for results obtained from the use of information contained in this report and especially states that CARE Ratings has no financial liability whatsoever to the user of this report

Industry Research I FERTILIZER INDUSTRY
2
Chart 1: Category- wise Production of Fertilizers
Source: Department of Fertilizer, CMIE, CARE Ratings
Note: Other Complex fertilizers include NPK fertilizers, Ammonium nitrate, and Ammonium sulphate
During the FY19 India has produced 415 LMT of fertilizers. Urea dominates the total fertilizer production in the country.
While India is the world’s second largest consumer of urea, the Government of India is working toward increasing the
production of urea so as to end imports by 2022 and achieve self-sufficiency in urea production. Out of the total fertilizer
production India produces only 9%-11% of DAP which is the second most widely used fertilizer after urea. The Government
is also encouraging SSP production as it is indigenous and is also considered as a substitute to diammonium phosphate
(DAP), which is largely import based and costlier.
Production Capacity Installed
Due to the support offered by the government towards the growth of the fertilizer industry there has been a rapid build-up
of manufacturing units of Urea, DAP and other complex fertilizers in the country with investments in the public,
cooperative and private sectors. At present there are:
31 Large sized urea manufacturing units,
21 DAP and complex fertilizers units and
2 units which manufacture ammonium sulphate as a by- product.
105 medium and small scale units in operation producing Single Super Phosphate (SSP).
Table 1: Installed Capacity of Various Fertilizer during the reporting year 2019-20 (figures in *LMT)
Product Total Installed Capacity
Urea 200.3**
DAP 73.0
Complex Fertilizers 52.3 Source: Department of Fertilizer
*LMT stands for Lakh Metric Tonnes **At present operational capacity is 200.3 LMT since FACT-Cochin and DIL Kanpur are under shut down. In the
absence of domestic natural resources, complete requirement of potash is imported
Under the New Urea Policy, the government has allowed the manufacturers of urea to produce additional quantity of urea
as part of its objective to boost indigenous urea production in the country. The ceiling imposed on production beyond Re-
58% 59% 58% 58% 58%
11% 10% 11% 9% 10%
9% 9% 10% 11% 9%
22% 21% 21% 22% 23%
0%
10%
20%
30%
40%
50%
60%
70%
80%
90%
100%
2014-15 2015-16 2016-17 2017-18 2018-19
Urea Superphosphate Diammonium Phosphate (DAP) Other Complex Fertilizers
Industry Research I FERTILIZER INDUSTRY
3
Assessed Capacity during 2016-17 has been raised so as to enable all urea units to produce additional production which
otherwise they were not able to do so due to low Import Parity Price
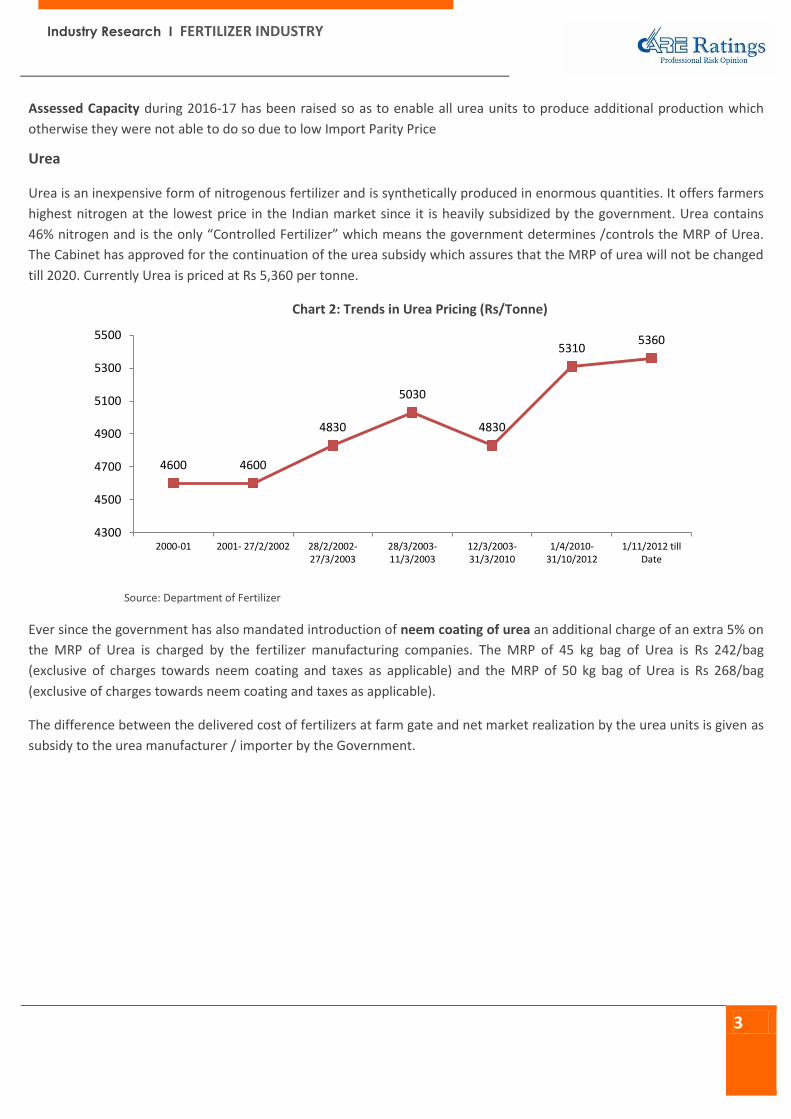
Urea
Urea is an inexpensive form of nitrogenous fertilizer and is synthetically produced in enormous quantities. It offers farmers
highest nitrogen at the lowest price in the Indian market since it is heavily subsidized by the government. Urea contains
46% nitrogen and is the only “Controlled Fertilizer” which means the government determines /controls the MRP of Urea.
The Cabinet has approved for the continuation of the urea subsidy which assures that the MRP of urea will not be changed
till 2020. Currently Urea is priced at Rs 5,360 per tonne.
Chart 2: Trends in Urea Pricing (Rs/Tonne)
Source: Department of Fertilizer
Ever since the government has also mandated introduction of neem coating of urea an additional charge of an extra 5% on
the MRP of Urea is charged by the fertilizer manufacturing companies. The MRP of 45 kg bag of Urea is Rs 242/bag
(exclusive of charges towards neem coating and taxes as applicable) and the MRP of 50 kg bag of Urea is Rs 268/bag
(exclusive of charges towards neem coating and taxes as applicable).
The difference between the delivered cost of fertilizers at farm gate and net market realization by the urea units is given as
subsidy to the urea manufacturer / importer by the Government.
4600 4600
4830
5030
4830
5310 5360
4300
4500
4700
4900
5100
5300
5500
2000-01 2001- 27/2/2002 28/2/2002-27/3/2003
28/3/2003-11/3/2003
12/3/2003-31/3/2010
1/4/2010-31/10/2012
1/11/2012 tillDate

Industry Research I FERTILIZER INDUSTRY
4
Chart 3: Production and Imports of Urea in India (in units of LMT)
Source: Department of Fertilizer
Chart 4: Trend in Urea Import Substitution*
Source: CARE Ratings
* The inner circle depicts the urea production- import mix during FY15 whereas the outer circle depicts the trend during FY19.
Domestic urea production has grown at a stable rate of 1.5% CAGR during FY 2015-19. Urea production was the highest
during FY16. Domestic production of urea has been increasing as the government is providing incentives to manufacturers
to produce beyond the re-accessed capacity under the covenants of the New Urea Policy.
India plans to eliminate urea imports by 2022. In chart 4 we have analysed import dependence of urea (imports as a
proportion of production plus imports). Import dependence has come down from it being 27.9% during FY15 import
dependence to 23.7% during FY19. Production has increased from 72.1% during FY15 to 76.3% during FY19. India imports
urea from China Oman and Iran.
Diammonium Phosphate (DAP)
Diammonium Phosphate (DAP) is a concentrated fertilizer with high phosphorus and nitrogen content. It can be applied
directly to all kinds of soil of a mixture with other fertilizers. The best effects are achieved when applied prior to sowing.
Around of 50%-60% of India’s DAP needs are usually imported. DAP and its blends are used on a range of broad-acre
226 245 242 240 240
87 85
55 60 75
0
50
100
150
200
250
2014-15 2015- 16 2016-17 2017-18 2018-19
Production Imports
72.1
27.9
76.3
23.7
% of Production % of Imports
FY15
FY19
Industry Research I FERTILIZER INDUSTRY
5
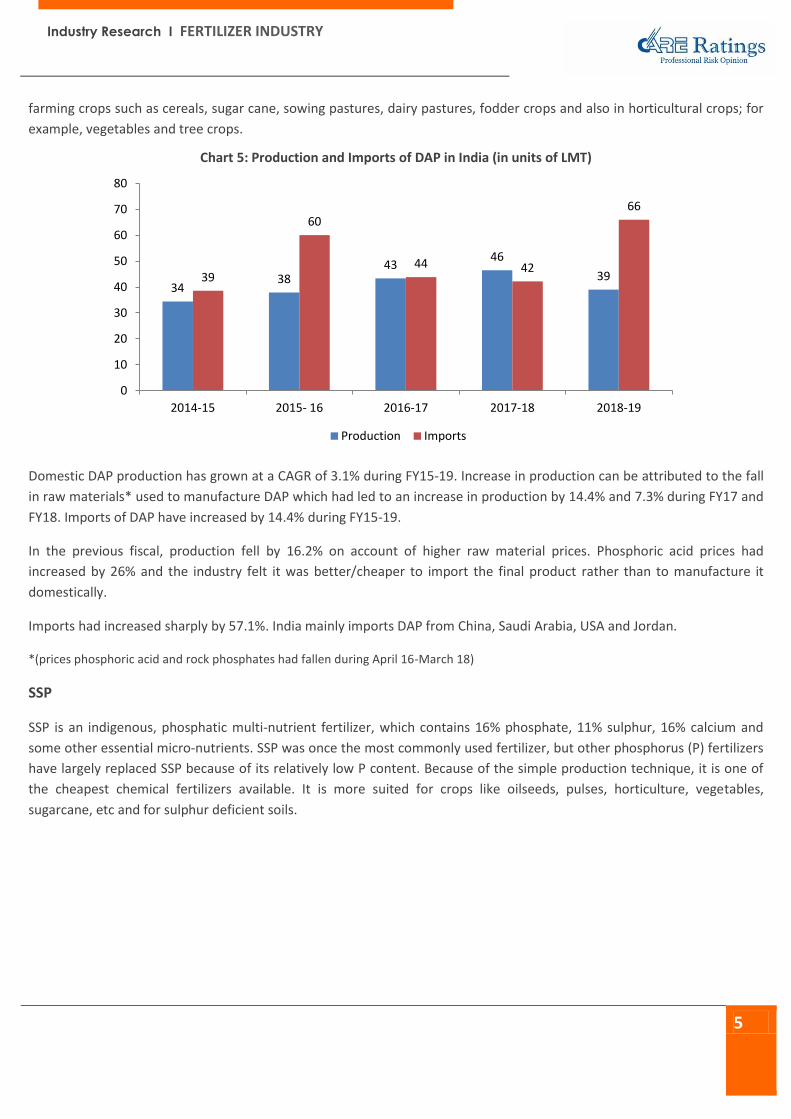
farming crops such as cereals, sugar cane, sowing pastures, dairy pastures, fodder crops and also in horticultural crops; for
example, vegetables and tree crops.
Chart 5: Production and Imports of DAP in India (in units of LMT)
Domestic DAP production has grown at a CAGR of 3.1% during FY15-19. Increase in production can be attributed to the fall
in raw materials* used to manufacture DAP which had led to an increase in production by 14.4% and 7.3% during FY17 and
FY18. Imports of DAP have increased by 14.4% during FY15-19.
In the previous fiscal, production fell by 16.2% on account of higher raw material prices. Phosphoric acid prices had
increased by 26% and the industry felt it was better/cheaper to import the final product rather than to manufacture it
domestically.
Imports had increased sharply by 57.1%. India mainly imports DAP from China, Saudi Arabia, USA and Jordan.
*(prices phosphoric acid and rock phosphates had fallen during April 16-March 18)
SSP
SSP is an indigenous, phosphatic multi-nutrient fertilizer, which contains 16% phosphate, 11% sulphur, 16% calcium and
some other essential micro-nutrients. SSP was once the most commonly used fertilizer, but other phosphorus (P) fertilizers
have largely replaced SSP because of its relatively low P content. Because of the simple production technique, it is one of
the cheapest chemical fertilizers available. It is more suited for crops like oilseeds, pulses, horticulture, vegetables,
sugarcane, etc and for sulphur deficient soils.
34 38
43 46
39 39
60
44 42
66
0
10
20
30
40
50
60
70
80
2014-15 2015- 16 2016-17 2017-18 2018-19
Production Imports

Industry Research I FERTILIZER INDUSTRY
6
Chart 6: Production of SSP in India (in units of LMT)
Source: CMIE, Department of Fertilizers
SSP production has growth at a rate of 10.8% during FY15-19. Initially it was mandatory for SSP manufacturers to utilize
minimum 50% of their recognized production capacity or produce 40 LMT, whichever is lower, per year to become eligible
for subsidy under the Nutrient Based Scheme (NBS). However this norm was lifted on March 10th, 2016. Hence there has
been an uptick in production from FY16 onwards.
SSP was a preferred fertilizer in the previous fiscal when prices of DAP had increased due to the increase in its cost of
production.
MOP
Potassium chloride (commonly referred to as Muriate of Potash or MOP) is the most common potassium source used in
agriculture, accounting for about 95% of all potash fertilizers used worldwide. Its nutrient composition is approximately:
Potassium: 50% Chloride: 46%. The demand of MOP in India is entirely met by imports.
Chart 7: MOP imports by India (in units of LMT)
Source: Department of Fertilizers
27
39
44
39 41
0
10
20
30
40
50
2014-15 2015- 16 2016-17 2017-18 2018-19
42
32
37
47
42
0
5
10
15
20
25
30
35
40
45
50
2014-15 2015- 16 2016-17 2017-18 2018-19
Industry Research I FERTILIZER INDUSTRY
7
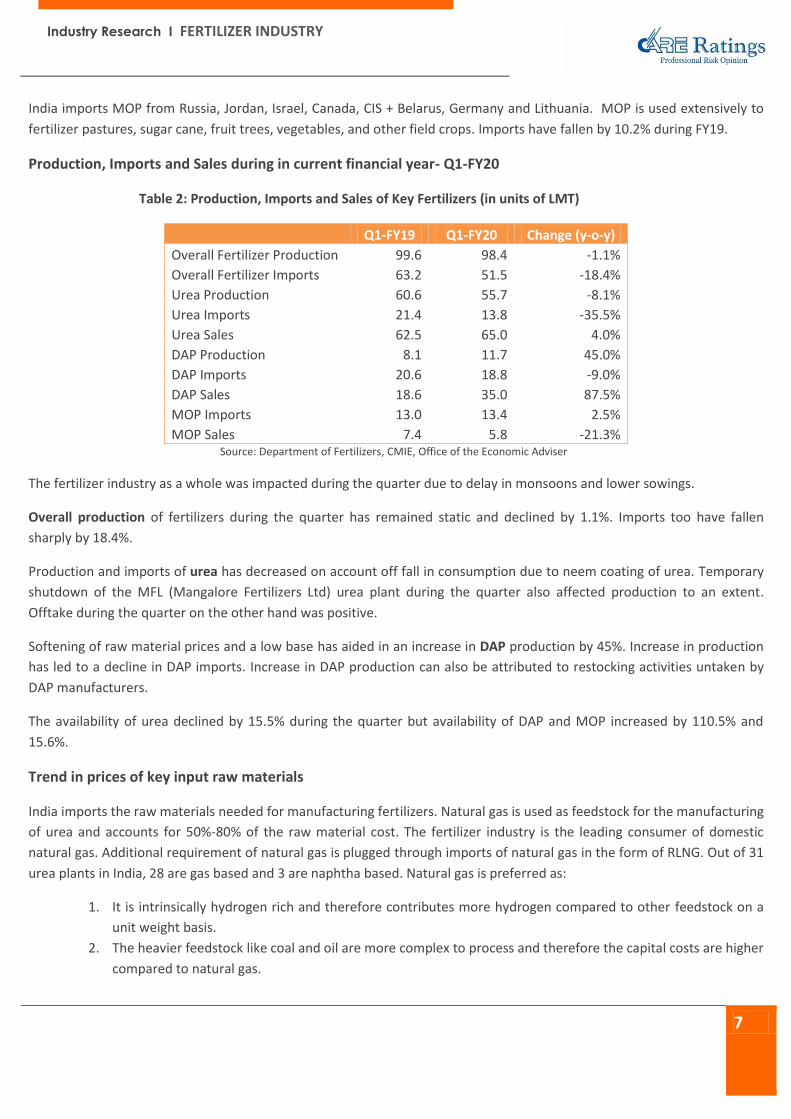
India imports MOP from Russia, Jordan, Israel, Canada, CIS + Belarus, Germany and Lithuania. MOP is used extensively to
fertilizer pastures, sugar cane, fruit trees, vegetables, and other field crops. Imports have fallen by 10.2% during FY19.
Production, Imports and Sales during in current financial year- Q1-FY20
Table 2: Production, Imports and Sales of Key Fertilizers (in units of LMT)
Q1-FY19 Q1-FY20 Change (y-o-y)
Overall Fertilizer Production 99.6 98.4 -1.1%
Overall Fertilizer Imports 63.2 51.5 -18.4%
Urea Production 60.6 55.7 -8.1%
Urea Imports 21.4 13.8 -35.5%
Urea Sales 62.5 65.0 4.0%
DAP Production 8.1 11.7 45.0%
DAP Imports 20.6 18.8 -9.0%
DAP Sales 18.6 35.0 87.5%
MOP Imports 13.0 13.4 2.5%
MOP Sales 7.4 5.8 -21.3% Source: Department of Fertilizers, CMIE, Office of the Economic Adviser
The fertilizer industry as a whole was impacted during the quarter due to delay in monsoons and lower sowings.
Overall production of fertilizers during the quarter has remained static and declined by 1.1%. Imports too have fallen
sharply by 18.4%.
Production and imports of urea has decreased on account off fall in consumption due to neem coating of urea. Temporary
shutdown of the MFL (Mangalore Fertilizers Ltd) urea plant during the quarter also affected production to an extent.
Offtake during the quarter on the other hand was positive.
Softening of raw material prices and a low base has aided in an increase in DAP production by 45%. Increase in production
has led to a decline in DAP imports. Increase in DAP production can also be attributed to restocking activities untaken by
DAP manufacturers.
The availability of urea declined by 15.5% during the quarter but availability of DAP and MOP increased by 110.5% and
15.6%.
Trend in prices of key input raw materials
India imports the raw materials needed for manufacturing fertilizers. Natural gas is used as feedstock for the manufacturing
of urea and accounts for 50%-80% of the raw material cost. The fertilizer industry is the leading consumer of domestic
natural gas. Additional requirement of natural gas is plugged through imports of natural gas in the form of RLNG. Out of 31
urea plants in India, 28 are gas based and 3 are naphtha based. Natural gas is preferred as:
1. It is intrinsically hydrogen rich and therefore contributes more hydrogen compared to other feedstock on a
unit weight basis.
2. The heavier feedstock like coal and oil are more complex to process and therefore the capital costs are higher
compared to natural gas.

Industry Research I FERTILIZER INDUSTRY
8
Chart 8: Trend in Domestic and International Natural Gas Prices (USD/mmBtu)
Source: PPAC and EIA
As per the New Domestic Gas Policy, the government revises the domestic natural gas price every six months i.e. April-
September and October-March. Currently (H1-FY20) the price for gas produced from local fields has been revised to USD
3.69/mmBtu which is 9.8% increase from USD 3.36/mmBtu.
Henry Hub prices rose sharply during November 2018 as natural gas inventories were at their lowest levels for October
since 2010 and the anticipation regarding a colder than expected winter caused an unexpected spike in the natural gas
price by 24.7% during November 2018 on an m-o-m basis in the US markets. Now in 2019, even with inventories being at
their all-time low, Henry hub prices have plunged. This is mainly because of increase in gas production on an on-going
basis. Prices of R-LNG are usually governed by market dynamics and are linked with the global crude oil prices.
Chart 9: Prices of other key Raw Materials used for Fertilizer Production (USD/MT)
Source: Department of Fertilizer
1
1.5
2
2.5
3
3.5
4
4.5
5
Ap
r-1
5
Jun
-15
Au
g-1
5
Oct
-15
De
c-1
5
Feb
-16
Ap
r-1
6
Jun
-16
Au
g-1
6
Oct
-16
De
c-1
6
Feb
-17
Ap
r-1
7
Jun
-17
Au
g-1
7
Oct
-17
De
c-1
7
Feb
-18
Ap
r-1
8
Jun
-18
Au
g-1
8
Oct
-18
De
c-1
8
Feb
-19
Ap
r-1
9
Jun
-19
Domestic Natural Gas Price International Natural Gas Price
0
100
200
300
400
500
600
700
800
900
De
c-1
5
Feb
-16
Ap
r-1
6
Jun
-16
Au
g-1
6
Oct
-16
De
c-1
6
Feb
-17
Ap
r-1
7
Jun
-17
Au
g-1
7
Oct
-17
De
c-1
7
Feb
-18
Ap
r-1
8
Jun
-18
Au
g-1
8
Oct
-18
De
c-1
8
Feb
-19
Ap
r-1
9
Jun
-19
Phos. Acid (CFR) Rock Phos. (CFR) Ammonia (CFR) Sulphur (CFR)
Industry Research I FERTILIZER INDUSTRY
9
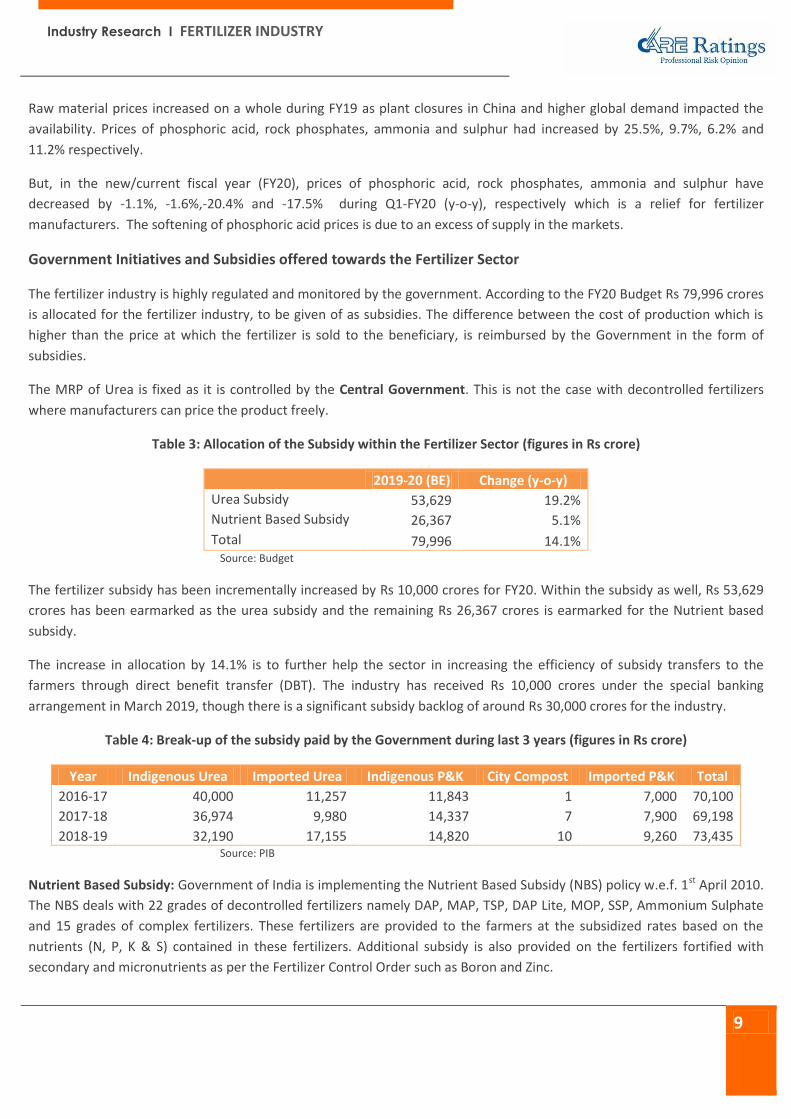
Raw material prices increased on a whole during FY19 as plant closures in China and higher global demand impacted the
availability. Prices of phosphoric acid, rock phosphates, ammonia and sulphur had increased by 25.5%, 9.7%, 6.2% and
11.2% respectively.
But, in the new/current fiscal year (FY20), prices of phosphoric acid, rock phosphates, ammonia and sulphur have
decreased by -1.1%, -1.6%,-20.4% and -17.5% during Q1-FY20 (y-o-y), respectively which is a relief for fertilizer
manufacturers. The softening of phosphoric acid prices is due to an excess of supply in the markets.
Government Initiatives and Subsidies offered towards the Fertilizer Sector
The fertilizer industry is highly regulated and monitored by the government. According to the FY20 Budget Rs 79,996 crores
is allocated for the fertilizer industry, to be given of as subsidies. The difference between the cost of production which is
higher than the price at which the fertilizer is sold to the beneficiary, is reimbursed by the Government in the form of
subsidies.
The MRP of Urea is fixed as it is controlled by the Central Government. This is not the case with decontrolled fertilizers
where manufacturers can price the product freely.
Table 3: Allocation of the Subsidy within the Fertilizer Sector (figures in Rs crore)
2019-20 (BE) Change (y-o-y)
Urea Subsidy 53,629 19.2%
Nutrient Based Subsidy 26,367 5.1%
Total 79,996 14.1% Source: Budget
The fertilizer subsidy has been incrementally increased by Rs 10,000 crores for FY20. Within the subsidy as well, Rs 53,629
crores has been earmarked as the urea subsidy and the remaining Rs 26,367 crores is earmarked for the Nutrient based
subsidy.
The increase in allocation by 14.1% is to further help the sector in increasing the efficiency of subsidy transfers to the
farmers through direct benefit transfer (DBT). The industry has received Rs 10,000 crores under the special banking
arrangement in March 2019, though there is a significant subsidy backlog of around Rs 30,000 crores for the industry.
Table 4: Break-up of the subsidy paid by the Government during last 3 years (figures in Rs crore)
Year Indigenous Urea Imported Urea Indigenous P&K City Compost Imported P&K Total
2016-17 40,000 11,257 11,843 1 7,000 70,100
2017-18 36,974 9,980 14,337 7 7,900 69,198
2018-19 32,190 17,155 14,820 10 9,260 73,435 Source: PIB
Nutrient Based Subsidy: Government of India is implementing the Nutrient Based Subsidy (NBS) policy w.e.f. 1st April 2010.
The NBS deals with 22 grades of decontrolled fertilizers namely DAP, MAP, TSP, DAP Lite, MOP, SSP, Ammonium Sulphate
and 15 grades of complex fertilizers. These fertilizers are provided to the farmers at the subsidized rates based on the
nutrients (N, P, K & S) contained in these fertilizers. Additional subsidy is also provided on the fertilizers fortified with
secondary and micronutrients as per the Fertilizer Control Order such as Boron and Zinc.
Industry Research I FERTILIZER INDUSTRY
10
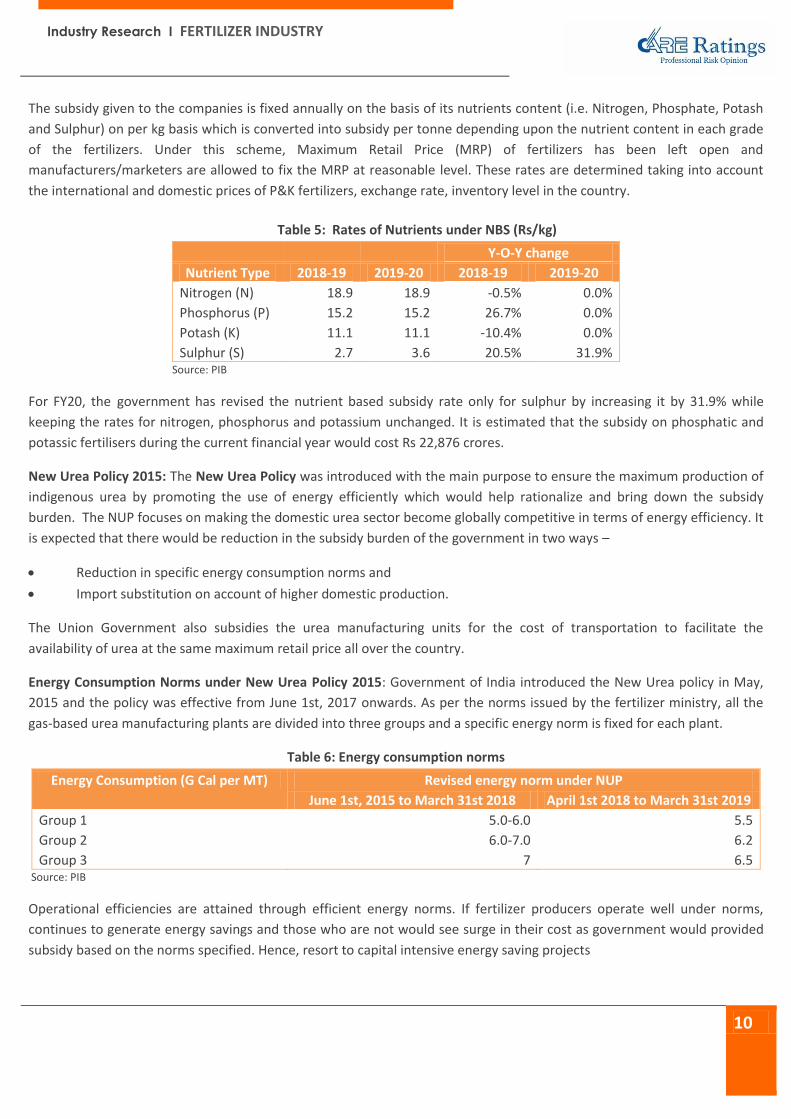
The subsidy given to the companies is fixed annually on the basis of its nutrients content (i.e. Nitrogen, Phosphate, Potash
and Sulphur) on per kg basis which is converted into subsidy per tonne depending upon the nutrient content in each grade
of the fertilizers. Under this scheme, Maximum Retail Price (MRP) of fertilizers has been left open and
manufacturers/marketers are allowed to fix the MRP at reasonable level. These rates are determined taking into account
the international and domestic prices of P&K fertilizers, exchange rate, inventory level in the country.
Table 5: Rates of Nutrients under NBS (Rs/kg)
Y-O-Y change
Nutrient Type 2018-19 2019-20 2018-19 2019-20
Nitrogen (N) 18.9 18.9 -0.5% 0.0%
Phosphorus (P) 15.2 15.2 26.7% 0.0%
Potash (K) 11.1 11.1 -10.4% 0.0%
Sulphur (S) 2.7 3.6 20.5% 31.9% Source: PIB
For FY20, the government has revised the nutrient based subsidy rate only for sulphur by increasing it by 31.9% while
keeping the rates for nitrogen, phosphorus and potassium unchanged. It is estimated that the subsidy on phosphatic and
potassic fertilisers during the current financial year would cost Rs 22,876 crores.
New Urea Policy 2015: The New Urea Policy was introduced with the main purpose to ensure the maximum production of
indigenous urea by promoting the use of energy efficiently which would help rationalize and bring down the subsidy
burden. The NUP focuses on making the domestic urea sector become globally competitive in terms of energy efficiency. It
is expected that there would be reduction in the subsidy burden of the government in two ways –
Reduction in specific energy consumption norms and
Import substitution on account of higher domestic production.
The Union Government also subsidies the urea manufacturing units for the cost of transportation to facilitate the
availability of urea at the same maximum retail price all over the country.
Energy Consumption Norms under New Urea Policy 2015: Government of India introduced the New Urea policy in May,
2015 and the policy was effective from June 1st, 2017 onwards. As per the norms issued by the fertilizer ministry, all the
gas-based urea manufacturing plants are divided into three groups and a specific energy norm is fixed for each plant.
Table 6: Energy consumption norms
Energy Consumption (G Cal per MT) Revised energy norm under NUP
June 1st, 2015 to March 31st 2018 April 1st 2018 to March 31st 2019
Group 1 5.0-6.0 5.5
Group 2 6.0-7.0 6.2
Group 3 7 6.5 Source: PIB
Operational efficiencies are attained through efficient energy norms. If fertilizer producers operate well under norms,
continues to generate energy savings and those who are not would see surge in their cost as government would provided
subsidy based on the norms specified. Hence, resort to capital intensive energy saving projects

Industry Research I FERTILIZER INDUSTRY
11
As per the notice issued in March 2018 the target energy norms as per NUP-2015 will be continued for 5 years w.e.f. 1st
April, 2020. The extension is expected to ensure easy availability of urea to farmers throughout the country and help
maximize the indigenous urea production.
Neem Coating of Urea: As per notification Vide Department of Fertilizers dated on 25.05.2015 all the urea producers in the
country had to mandatorily produce 100% of their total production of subsidized urea as neem coated urea (NUC). Neem
coating of urea is the most cost effective way to preserve the nitrogen component in the fertilizer. It is estimated that
spraying of neem oil slows the release of nitrogen by 10-15%, thus, in effect, reducing the urea requirement to that extent.
NUC was introduced so that it could save a substantial chunk of the fertilizer subsidy.
A study conducted by the Department of Agriculture, Cooperation & Farmers Welfare (DAC&FW) have found positive
effects of neem coating of urea such as
- Improvement in soil health.
- Reduction in costs with respect to plant protection chemicals.
- Reduction in pest and disease attack.
- An increase in yield of paddy to an extent of 5.8%.
- An increase in yield of sugarcane to extent of 17.5 %
- An increase in yield of maize to the extent of 7.1%.
- An increase in yield of Soybean to the extent of 7.4%.
- An increase in yield of Tur/Red Gram to the extent of 16.9%.
Neem coating also had an additional positive impact – plugging the diversion of the subsidized urea towards non-
agricultural purposes.
In light of the positive results realised due to neem coating of urea, the Government also decided to bag urea in 45kg bags
instead of the usual 50 kgs in order to reduce consumption.
Gas Pooling for the Fertilizer (Urea) Sector: Under this policy from July 1st 2015 onwards the Government of India has
been pooling the price of Domestic Gas with Re-Gasified LNG which is imported. The intent is to help provide natural gas at
uniform delivery price to all Natural gas grid connected Urea manufacturing plants. The cost of gas, which is the most
important component for production of urea, varies from plant to plant owing to differential rates at which imported LNG
is contracted as well as cost of transportation. Gas pooling of gas is to help bring down the cost of fuel for manufacturers.
As part of the plan, an Empowered Pool Management Committee was formed with representatives from the ministry of
petroleum & natural gas, department of fertilizer, department of expenditure, and GAIL (India). The committee approves
the plant-wise gas supplies to be made under the gas pool mechanism. The department of fertilizer will also determine the
total requirement of natural gas. The Ministry has proposed making GAIL the pool operator-, to arrange imports after
considering domestic availability and averaging both the prices.
Direct Benefit Transfer in the Fertilizer Industry: Under the DBT scheme the subsidy will be released to the fertilizer
companies instead of the beneficiaries, after the sale is made by the retailers to the beneficiaries. Prior to the introduction
of DBT in the fertilizer industry the subsidy was given on the dispatch of the materials from their respective factories. After
a few revisions on the disbursement of the fertilizers the subsidy was getting paid at a railhead point or any approved
godown of a district.

Industry Research I FERTILIZER INDUSTRY
12
Now under the proposed new system payment of subsidy is to be based on weekly settlement of claims from actual sales
data captured on POS machines after the sale is made by the retailers to the beneficiaries on submission of claims
generated in the web-based online Integrated Fertilizer Monitoring System (iFMS) by fertilizer companies. The DBT scheme
should help curb the issues relating to diversion and smuggling of urea.
DBT has now been rolled out on nationwide basis and fertilizer companies have started aligning their sales through the
mechanism as well. DBT in fertilizer is meant to transfer subsidies to manufacturers upon authentication of purchase by
farmers which can help restricting diversion, prevent leakages, and bring about greater transparency, accountability and
efficiency in the system.
In the current financial year (FY20), the government has just introduced the second phase of DBT. So far 5.4 crores soil
health cards (SHC) have been loaded which have recommendations on the type of balanced nutrition the crop needs. The
farmers' soil health cards have been linked so as to provide customized nutrient application suggestions. Under DBT 2.0
the government wants to utilize the data for real-time for balanced nutrition application and also explore the option of
directly transferring the subsidy to the farmer’s account.
Revision of Dealer Margins: The government had revised dealer margins to be paid to urea distributors by 97%. The
revised rate was effective from 1st April, 2018 onwards. The margin was increased to Rs 354/MT. Prior to the revision, the
government used to pay Rs 180/MT to the private agencies and co-operatives & Rs 200/MT to institutional agencies. The
increased margins were only to be paid if the sale was directed via the POS machine through the DBT mechanism. The
revision was likely to benefit approximately 23,000 dealers across the country by enhancing their financial viability post
DBT implementation of the fertilizer subsidy.
Revival of closed fertilizer plants: The government is reviving 5 closed fertilizer plants - 4 of Fertilizer Corporation of India
Limited (FCIL) in Talcher, Ramagundam, Gorakhpur and Sindri and 1 of Hindustan Fertilizer Corporation Ltd. (HFCL) in
Barauni. This is being done by setting up new ammonia-urea plants with a capacity of 12.7 LMT (Lakh Metric Tonne) per
annum. The Government expects that with the commissioning/ start of the above plants, can increase significantly the
indigenous urea production leading to substantial reduction in imports.
So far the Ramagundam plant is scheduled to be commissioned in the third quarter of FY20 and work has already started at
Talcher, which will be the first coal gasification project in Odisha. The Talcher plant will produce urea and synthetic gas
from coal and petroleum coke. All other fertilizers units are going to be gas based.
Table 7: Revival plan and expected date of operation of the 5 sick urea units
Units Location Expected period to be operational
Ramagundam Telangana Dec-19
Gorakhpur Uttar Pradesh Feb-21
Barauni Bihar May-21
Sindri Jharkhand May-21
Talcher Odisha Sep-23 Source: CARE Ratings
Post the commissioning of all the above plants the domestic indigenous urea production is slated to rise by 63.5 LMT/year.

Industry Research I FERTILIZER INDUSTRY
13
Joint Ventures Agreements in the Fertilizer Sector
The Government of India is encouraging fertilizers companies to establish joint ventures abroad in countries which are rich
in fertilizer resources for production facilities with buy back arrangements and to enter into long term agreements for
supply of fertilizers and fertilizer inputs to India. Fertilizers companies need natural gas, ammonia, phosphoric acid, rock
phosphates, and sulphuric acid as raw materials for production of fertilizers.
Table 8: Existing Joint Venture Projects
Sr. No.
JV Project-Country JV participants with equity % Product and the Project status
1 Oman India Fertilizer Co.(OMIFCO), Oman
Oman Oil Co. (OOC-50%), IFFCO (25%) & KRIBHCO (25%)
16.52 lakh MT Urea & 2.48 lakh MT Ammonia.
Production started in the year 2006.
2 ICS Senegal, Senegal ICS Senegal and IFFCO consortium 5.5 lakh MT phosphoric acid. Production already started.
3 JPMC-IFFCO JV, Jordan JPMC & IFFCO 4.8 lakh MT Phosphoric acid. Commercial production started in December 2014.
4 IMACID, Morocco OCP-Morocco, Chambal & TCL – 33% each
4.25 lakh MT phosphoric acid. Production started in year 1997-98.
5 Tunisia-India Fertilizer Company (TIFERT), Tunisia
GCT (Tunisia), CFL (Now CIL) & GSFC (India)
3.60 lakh MT of Phosphoric acid. Commercial production started in April 2014.
Source: Department of Fertilizer
Among many fertilizer Joint Venture Projects being considered in the department, following 03 are in advanced stages
Table 9: Joint Venture agreements under consideration/implementation
Sr. No
Country Entities Product Offtake Agreement
1 Iran RCF, GNFC and GSFC from Indian side and one prospective partner from Iran
Urea and Ammonia 8.25 LMT per annum Ammonia and 12.7 LMT per annum Urea
2 Russia NMDC, RCF, FACT, KRIBHCO, NFL and ACRON (Russia)
Potash 30 % stake in the fertilizer project
3 Canada RCF, FACT and ENCANTO (Canada)
Potash 1.8 Million tonnes per annum for 17 years
Source: Department of Fertilizer

Industry Research I FERTILIZER INDUSTRY
14
Financials of 20 Fertilizer Companies
Financial health of fertilizer manufactures largely depends on the sowing season (kharif or rabi), vagaries of rainfall, status
of subsidy outgo and the existing channel inventory level.
Chart 10: Total Revenue and y-o-y change Chart 11: Operating and Net Profit Margins (in %) and Interest coverage ratio
Source: Ace Equity, CARE Ratings
Revenue
Implementation of DBT (which was launched officially Pan-India March 2018 onwards) has led to an increase in the revenue
by 12% during FY18 as all the sales were officially recorded and streamlined via the POS machines, curbing any pilferages
and misuse. Stabilisation of the system during FY19 has led to an increase in revenue by 22%. Till date (June 2019), 671
Lakh Metric tonnes (LMT) of Fertilizers has been sold through the PoS devices.
Profitability
Increase in key input costs especially of natural gas and phosphoric acid during FY19 led to a decline in the profitability of
fertilizer manufacturers.
DBT has also led to faster subsidy clearance which has also led to an improvement in the profitability of the companies.
There has also been an improvement in the Interest Coverage Ratio FY18 onwards indicating a possible reduction the
working capital pressures of these companies.
Challenges
Zero Budget Natural Farming: Zero Budget Natural Farming (ZBNF) is a set of farming methods where the cost of growing
and harvesting plants is zero. This means that farmers need not purchase fertilizers and pesticides in order to ensure the
healthy growth of crops. Several States, including Andhra Pradesh and Himachal Pradesh, have been aggressively driving a
shift towards this model. This could pose a threat to the chemical fertilizer industry as during the FY20 budget
announcement the finance minister propagated to resort to Zero Budget farming. As per the most recent economic survey, 1.6 lakh farmers follow zero-budget natural farming.
61,908 61,150
54,704 61,091
74,682
7
-1
-11
12
22
-15
-10
-5
0
5
10
15
20
25
-
10,000
20,000
30,000
40,000
50,000
60,000
70,000
80,000
2014-15 2015-16 2016-17 2017-18 2018-19
Total Revenue y-o-y (%)
8.2 8.5
10.0 10.6
9.4
1.8 2.1
4.3 4.9
3.8
3.1 2.9 3.4
4.9
4.1
0.0
1.0
2.0
3.0
4.0
5.0
6.0
0.0
2.0
4.0
6.0
8.0
10.0
12.0
2014-15 2015-16 2016-17 2017-18 2018-19
OPM (%) NPM (%) ICR (RHS)
Industry Research I FERTILIZER INDUSTRY
15
Increase in borrowings: The fertilizer industry faces a common issue of not getting the entire subsidy amount on time due
to budget constraints. This is leading to an increase the borrowings which have translated in the deficiency of the working
capital. Subsidies of almost Rs 30,000 crore are yet pending to be disbursed by the government (we also need to keep in
mind the budgeted subsidy amount to be disbursed during FY20 is Rs 79,996 crores only).
Inverted Duty Structure: Raw materials such as naphtha and ammonia are being charged at 18% which is creating an
inverted duty structure especially for urea manufacturers. An increase in credit accumulation is putting pressure on the
working capital requirements.
Conclusion/ Outlook for FY20
FY20 commenced on a subdued note with a delay in the monsoons which has considerably affected/delayed the kharif
season sowing.
Nevertheless going forward, we expect the overall fertilizer production is to grow by 1-2% by the end of FY20. Production
grew by 0.3% during FY19.
- We expect production to pick up August 2019 onwards, post the announcement of the nutrient based subsidy rates
and once the monsoon deficit reduces (the cumulative monsoon deficit has been reducing and it has come down
from it being 19% to 9%).
o Decontrolled fertilizer usage is also to increase on the back of the introduction of the second phase of DBT.
o Implementation of DBT 2.0 can help in overcoming the issue of skewed fertilizer application on an inter-
regional, inter-state and inter-district level.
- Softening of raw material prices and a stable rupee is also to augment production going forward.
- With the commissioning of the Gandepan-III urea plant and with the Ramagundam urea plant coming on board
during Q3-FY20, production of urea is also poised to increase.
Appendix
What is Zero Budget Natural Farming?
Zero budget natural farming (ZBNF) was propagated by Maharashtrian agriculturist Subhash Palekar, who developed it in
the mid-1990s as an alternative to the Green Revolution’s methods driven by chemical fertilizers and pesticides and
intensive irrigation.
According to Mr Palekar, the rising cost of these external inputs (fertilizers and pesticides) was a leading cause of
indebtedness and suicide among farmers, while the impact of chemicals on the environment was irreversible. ZBNF
promotes the application of jeevamrutha — a mixture of fresh desi cow dung and aged desi cow urine, jaggery, pulse flour,
water and soil — on farmland. This is a fermented microbial culture that adds nutrients to the soil, and acts as a catalytic
agent to promote the activity of microorganisms and earthworms in the soil. A similar mixture, called bijamrita, is used to
treat seeds, while concoctions using neem leaves and pulp, tobacco and green chillis are prepared for insect and pest
management.
The ZBNF method also promotes soil aeration, minimal watering, intercropping, bunds and topsoil mulching and
discourages intensive irrigation and deep ploughing instead of commercially produced chemical inputs and the need to
spend money on chemical fertilizers and pesticides — or take loans to buy them.

Industry Research I FERTILIZER INDUSTRY
16
CORPORATE OFFICE: CARE Ratings Limited (Formerly known as Credit Analysis & Research Ltd) Corporate Office: 4th Floor, Godrej Coliseum, Somaiya Hospital Road, Off Eastern Express Highway, Sion (East), Mumbai - 400 022; CIN: L67190MH1993PLC071691 Tel: +91-22-6754 3456 I Fax: +91-22-6754 3457 E-mail: [email protected] I Website: www.careratings.com
Follow us on /company/CARE Ratings
/company/CARE Ratings