August 2017 - weather.gov · The Dalles 103° La Grande 97° Redmond 98° Heppner 99°...
26
August 2017 National Weather Service Pendleton, Oregon
Transcript of August 2017 - weather.gov · The Dalles 103° La Grande 97° Redmond 98° Heppner 99°...

August 2017
National Weather Service
Pendleton, Oregon


Select August Averages and Departures

August 2017 Weather Pattern
The mean synoptic pattern for the month of August 2017 was characterized by an upper level low pressure system over the west-central gulf of Alaska, with a large upper level ridge of high pressure over the western US. The highest heights compared to average were found just off the Pacific Northwest coast. This caused abnormally dry and hot conditions to persist through the month.
L
H
H
L
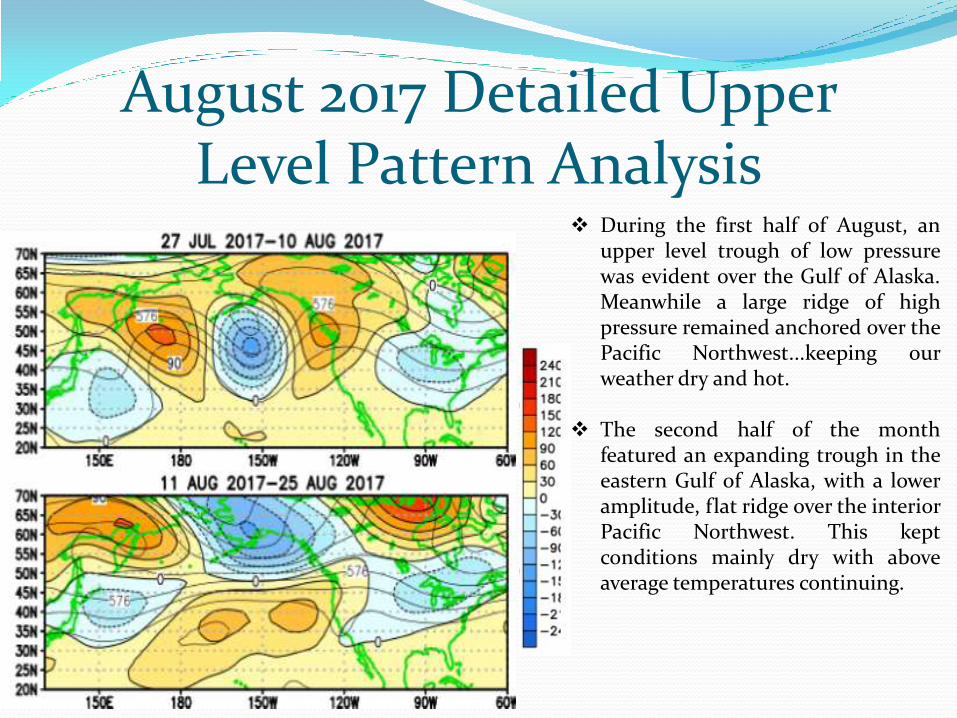
August 2017 Detailed Upper Level Pattern Analysis
During the first half of August, an upper level trough of low pressure was evident over the Gulf of Alaska. Meanwhile a large ridge of high pressure remained anchored over the Pacific Northwest...keeping our weather dry and hot.
The second half of the month featured an expanding trough in the eastern Gulf of Alaska, with a lower amplitude, flat ridge over the interior Pacific Northwest. This kept conditions mainly dry with above average temperatures continuing.
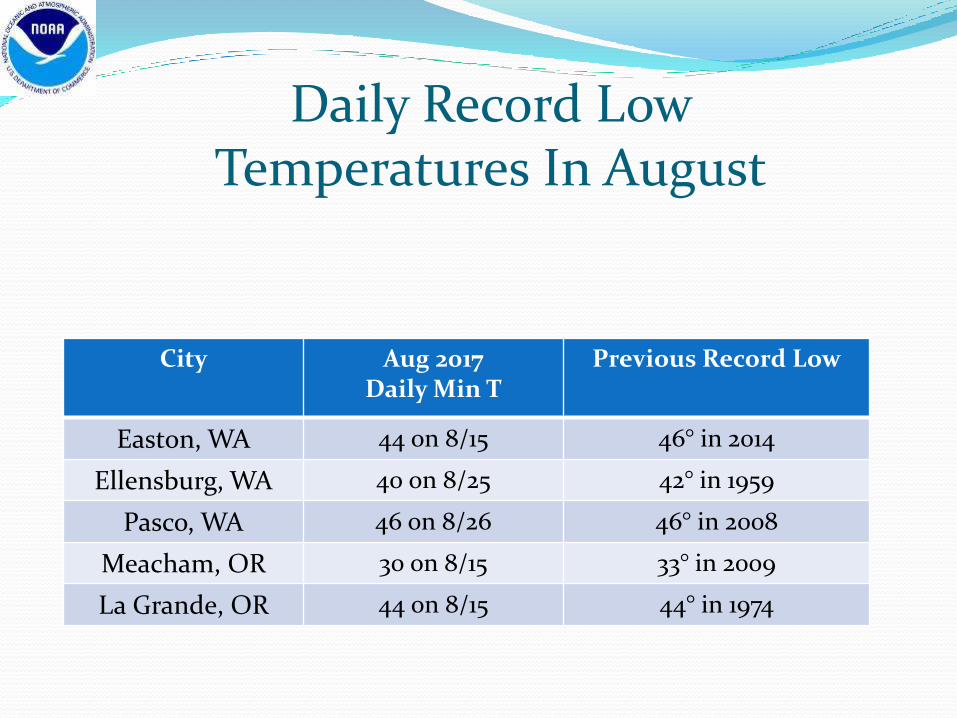
Daily Record Low Temperatures In August
City Aug 2017 Daily Min T
Previous Record Low
Easton, WA 44 on 8/15 46° in 2014
Ellensburg, WA 40 on 8/25 42° in 1959
Pasco, WA 46 on 8/26 46° in 2008
Meacham, OR 30 on 8/15 33° in 2009
La Grande, OR 44 on 8/15 44° in 1974

Daily Record High Temperatures In August
City Aug 2017 Daily Max T
Previous Daily Record High
Antelope, OR 102 on 8/29 97 in 2006
Condon, OR 97 on 8/30 97 in 2009
Easton, WA 96 on 8/05 91 in 2005
The Dalles, OR 108 on 8/03 106 in 1998
Pendleton Arpt 100 on 8/02 100 in 2015
Redmond, OR 100 on 8/02 98 in 1998
Ellensburg, WA 105 on 8/10 98 in 2014
Meacham, OR 96 on 8/28 95 in 1998
Yakima, WA 103 on 8/03 103 in 1961
Bend, OR 95 on 8/29 95 in 2006
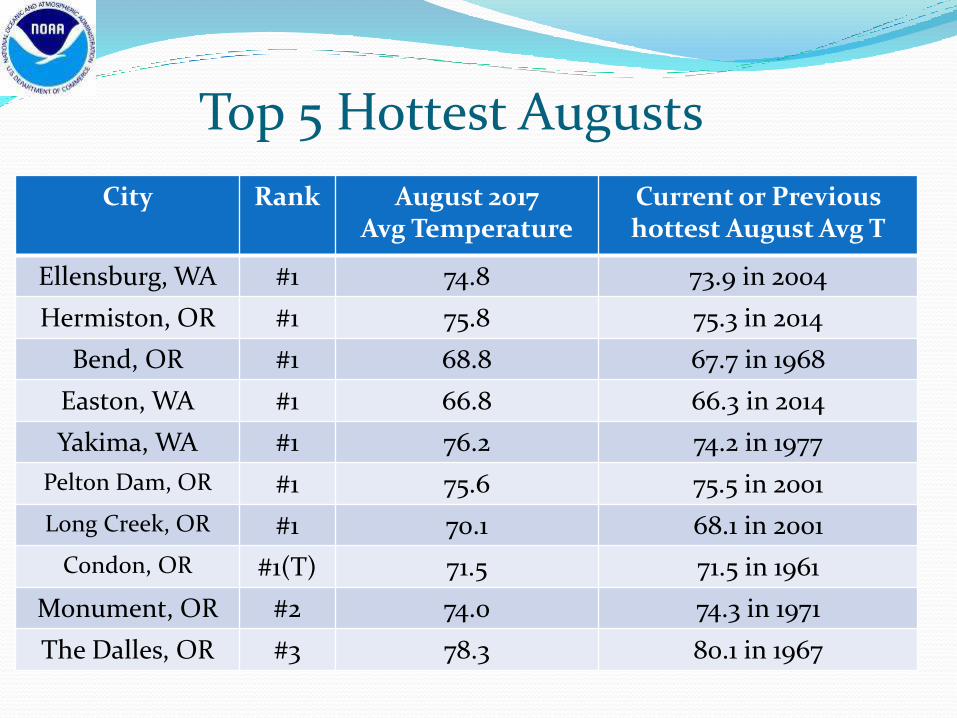
Top 5 Hottest Augusts
City Rank August 2017 Avg Temperature
Current or Previous hottest August Avg T
Ellensburg, WA #1 74.8 73.9 in 2004
Hermiston, OR #1 75.8 75.3 in 2014
Bend, OR #1 68.8 67.7 in 1968
Easton, WA #1 66.8 66.3 in 2014
Yakima, WA #1 76.2 74.2 in 1977
Pelton Dam, OR #1 75.6 75.5 in 2001
Long Creek, OR #1 70.1 68.1 in 2001
Condon, OR #1(T) 71.5 71.5 in 1961
Monument, OR #2 74.0 74.3 in 1971
The Dalles, OR #3 78.3 80.1 in 1967

Top 5 Hottest Augusts (Cont’d)
City Rank August 2017 Avg Temperature
Current or Previous hottest August Avg T
Heppner, OR #3 73.5 74.6 in 1897
Moro, OR #3 73.0 73.2 in 1967
Mt Adams RS #3(T) 69.6 70.5 in 1981
Pendleton (City) #3 75.0 76.2 in 1901
Goldendale, WA #4 71.6 72.1 in 1915
Seneca, OR #4 61.7 63.3 in 1935
Walla Walla, WA #5 78.5 80.1 in 1967
Redmond, OR #5 69.3 72.6 in 1967

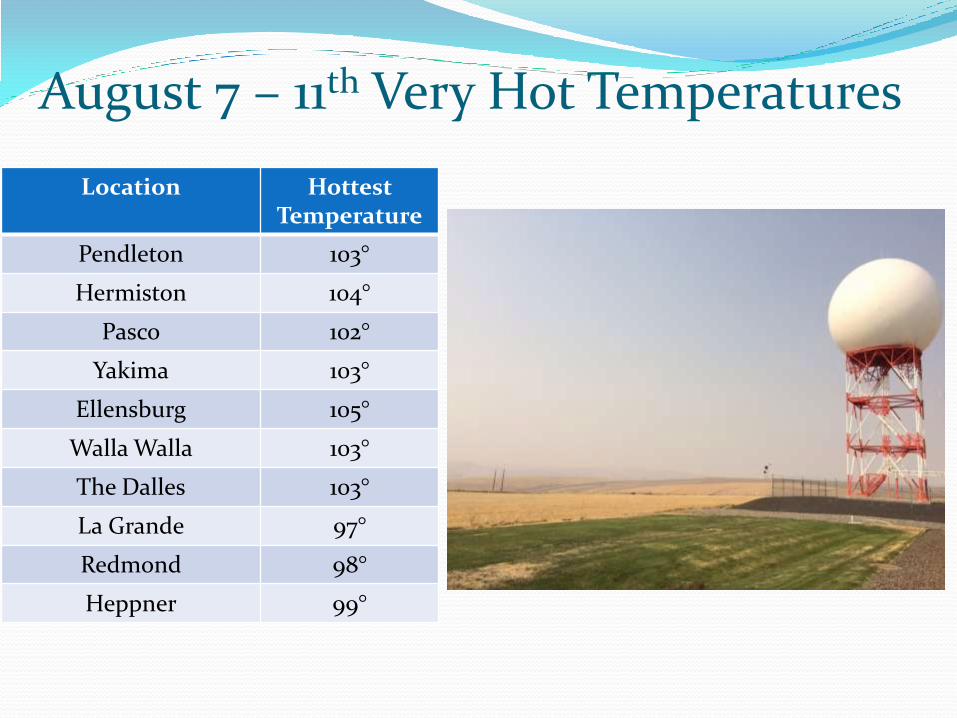
August 7 – 11th Very Hot Temperatures
Snow in Pendleton! March 5th 2017 0.3” fell
Location Hottest Temperature
Pendleton 103°
Hermiston 104°
Pasco 102°
Yakima 103°
Ellensburg 105°
Walla Walla 103°
The Dalles 103°
La Grande 97°
Redmond 98°
Heppner 99°
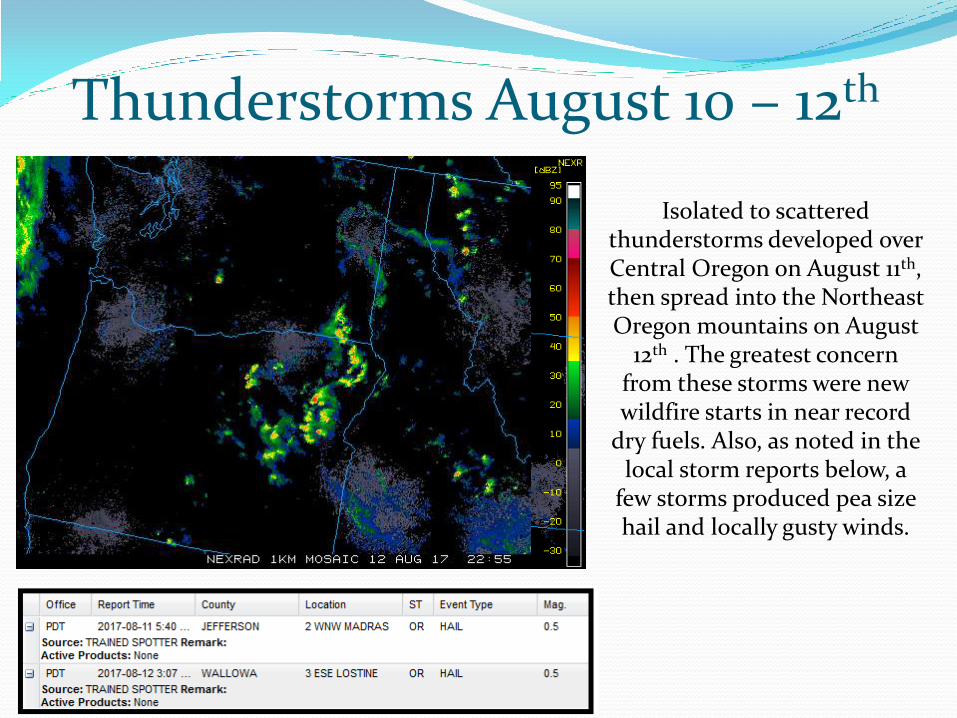
Thunderstorms August 10 – 12th
Isolated to scattered thunderstorms developed over Central Oregon on August 11th, then spread into the Northeast Oregon mountains on August
12th . The greatest concern from these storms were new wildfire starts in near record
dry fuels. Also, as noted in the local storm reports below, a
few storms produced pea size hail and locally gusty winds.
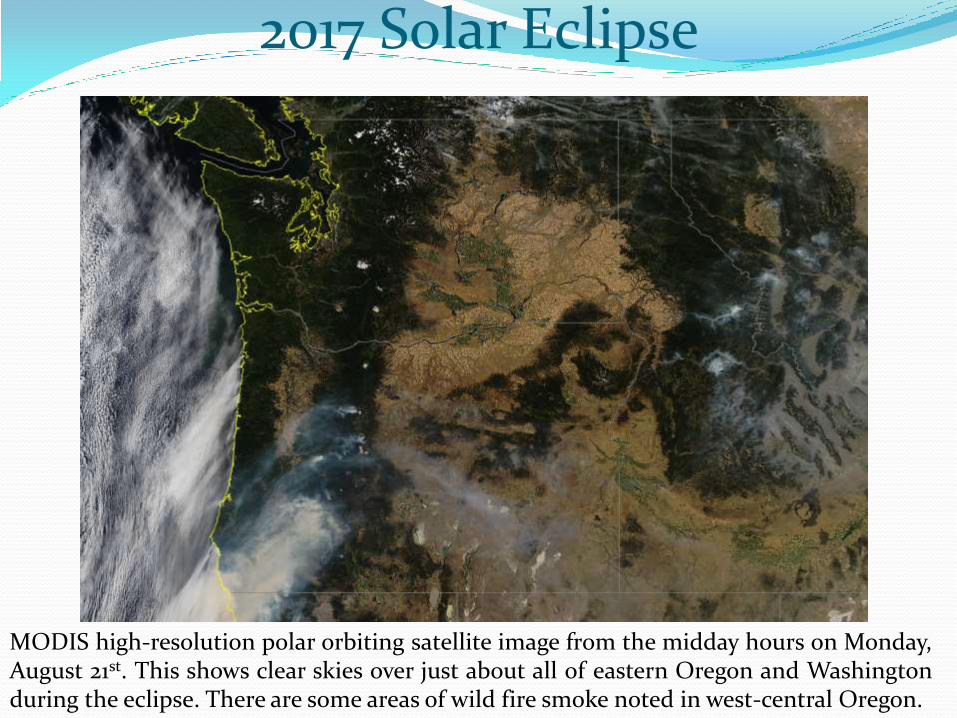
2017 Solar Eclipse
MODIS high-resolution polar orbiting satellite image from the midday hours on Monday, August 21st. This shows clear skies over just about all of eastern Oregon and Washington during the eclipse. There are some areas of wild fire smoke noted in west-central Oregon.

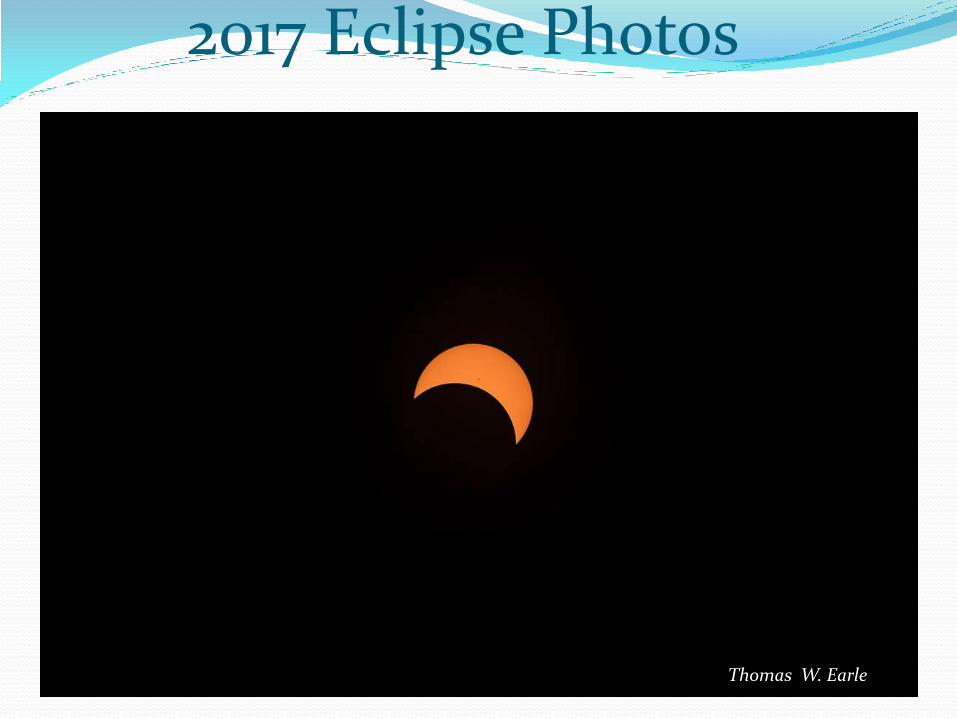
2017 Eclipse Photos
2017 Eclipse Photos
Thomas W. Earle
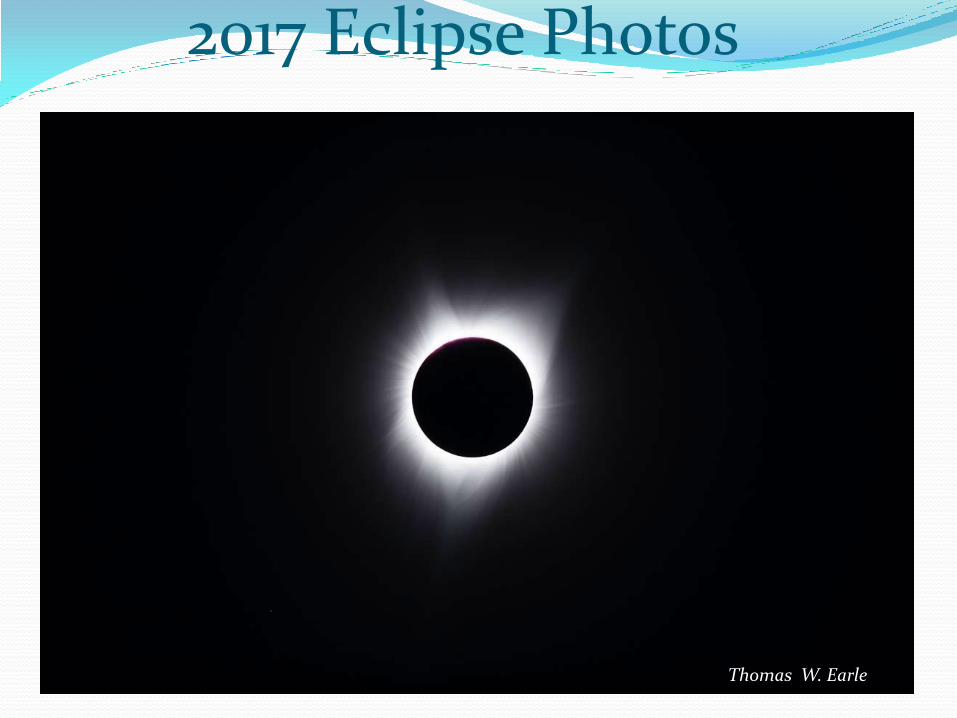
2017 Eclipse Photos
Thomas W. Earle

Numerous Wild Fires Many wildfire starts were reported in the month of August, as area fuels reached near record dry levels. Some of the fires were human cause, while some can be attributed to lightning. Many of the large wildfires reported at the end of August were located in the Cascades of both Oregon and Washington, as well as numerous fires burning in southwestern Oregon. A few of the most well know and largest fires include: the Millie fire, Nash Fire, Whitewater Fire, Norse Peak, Jolly Mountain, and the Chetco Bar Fire in the Siskiyou National Forest near Brookings, OR. Additional, destructive fires have developed in early September, including the Eagle Creek Fire in the Columbia Gorge.

Record Wildfire Smoke and Poor Air Quality
Location Number of Days with smoke or haze
reported in August
Pendleton, OR 14 days (12 consecutive)
Redmond, OR 25 days ( 14 consecutive)
Pasco, WA 23 days ( 13 consecutive)
Yakima, WA 19 days ( 11 consecutive)
Walla Walla, WA 15 days (12 consecutive)
With an upper level ridge dominating the weather pattern during the first half, and toward the end of the month, ample amounts of wildfire smoke spread across our area. The smoke lingered for 2 consecutive weeks in some locations...then returned after a short reprieve. Dense smoke and poor air quality remain a concern heading into September.
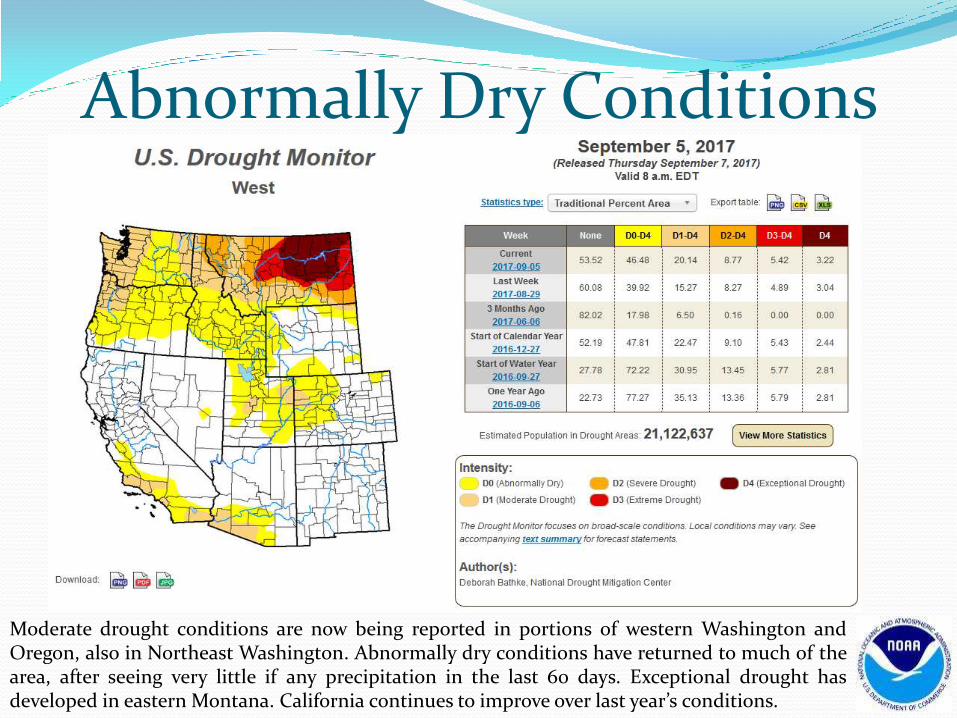
Abnormally Dry Conditions
Moderate drought conditions are now being reported in portions of western Washington and Oregon, also in Northeast Washington. Abnormally dry conditions have returned to much of the area, after seeing very little if any precipitation in the last 60 days. Exceptional drought has developed in eastern Montana. California continues to improve over last year’s conditions.
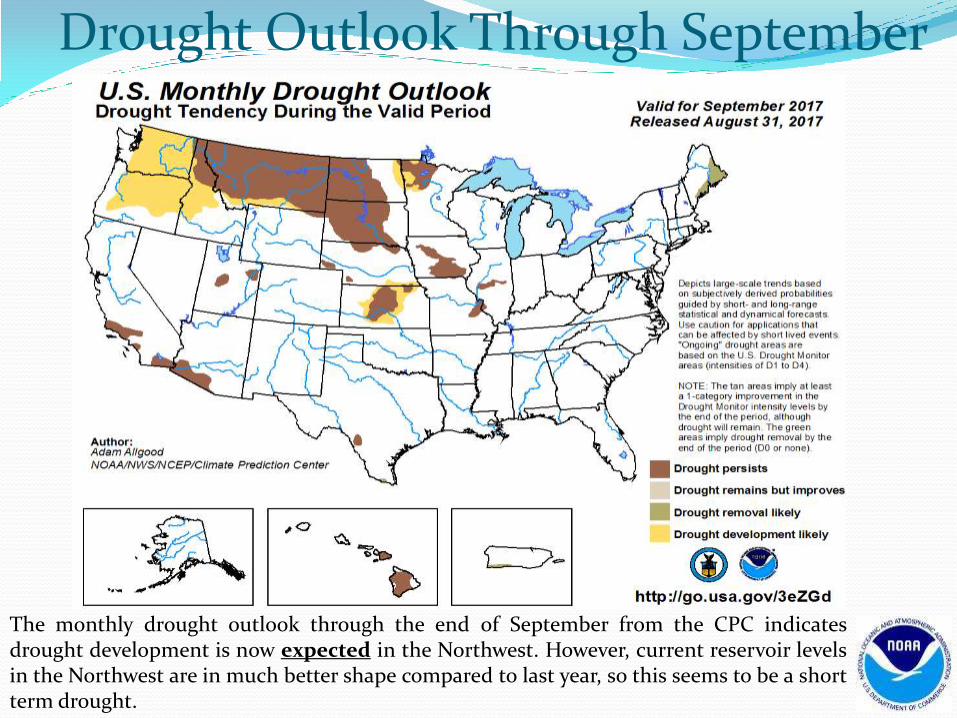
Drought Outlook Through September
The monthly drought outlook through the end of September from the CPC indicates drought development is now expected in the Northwest. However, current reservoir levels in the Northwest are in much better shape compared to last year, so this seems to be a short term drought.
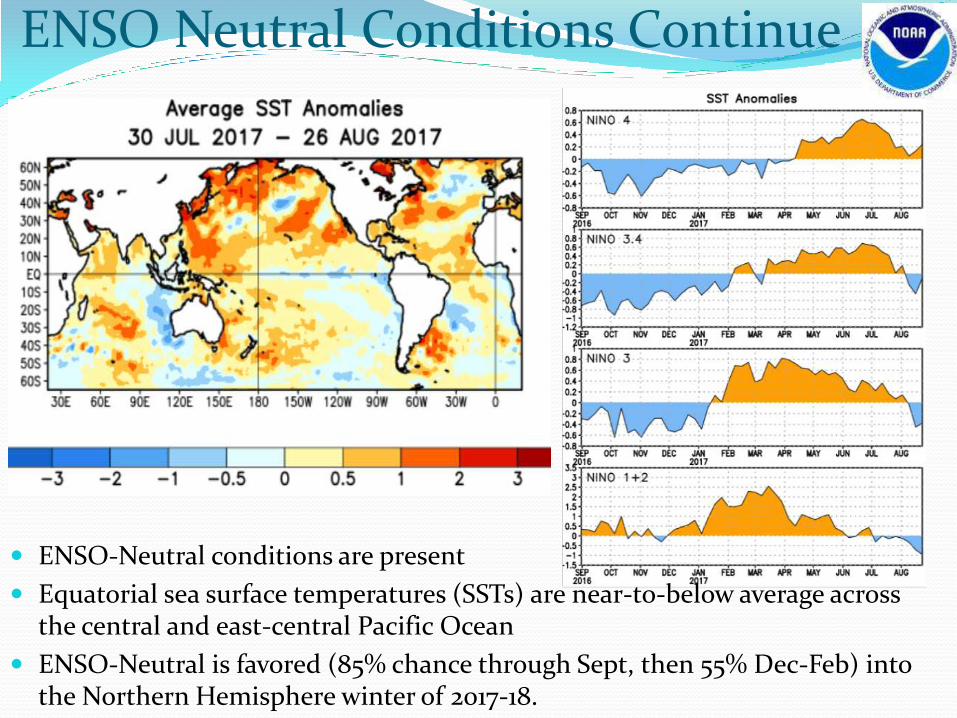
ENSO Neutral Conditions Continue
ENSO-Neutral conditions are present
Equatorial sea surface temperatures (SSTs) are near-to-below average across the central and east-central Pacific Ocean
ENSO-Neutral is favored (85% chance through Sept, then 55% Dec-Feb) into the Northern Hemisphere winter of 2017-18.

September Temperature Outlook This graphic is issued by the
Climate Prediction Center or CPC and is the Temperature Outlook for the month of September. The cool colors indicate a greater chance of below normal temperatures and
the warm colors represent a greater chance of above normal
temperatures. The time period for the normals runs from 1981-2010.
Odds are tilted toward higher than
average temperatures for the remainder of September across the
interior Pacific Northwest. The highest probability of above average
temperatures will be over north-Eastern Oregon and Washington through September. The highest
chance for below normal temperatures will be in the lower
Mississippi Valley
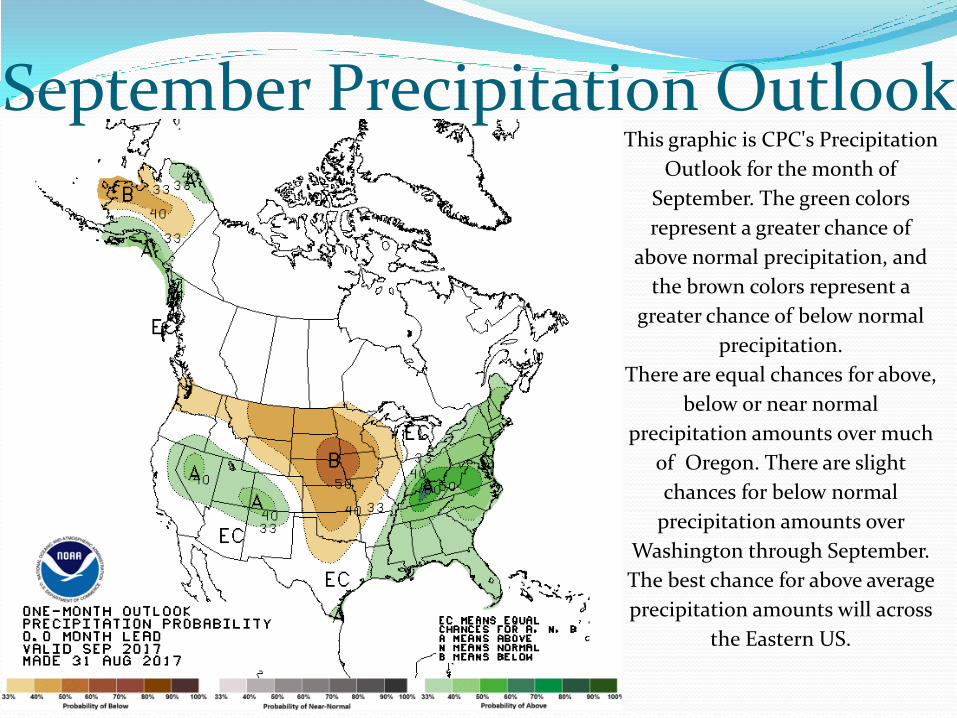
September Precipitation Outlook This graphic is CPC's Precipitation
Outlook for the month of
September. The green colors
represent a greater chance of
above normal precipitation, and
the brown colors represent a
greater chance of below normal
precipitation.
There are equal chances for above,
below or near normal
precipitation amounts over much
of Oregon. There are slight
chances for below normal
precipitation amounts over
Washington through September.
The best chance for above average
precipitation amounts will across
the Eastern US.