August 2013 - China Marine 2013.pdf• China Marine Food Group Limited is ... is mainly from the...
23
1 August 2013 August 2013 August 2013 August 2013 Investor Presentation Investor Presentation Investor Presentation Investor Presentation
Transcript of August 2013 - China Marine 2013.pdf• China Marine Food Group Limited is ... is mainly from the...

1
August 2013August 2013August 2013August 2013Investor PresentationInvestor PresentationInvestor PresentationInvestor Presentation

Safe Harbor Statement
The Private Securities Litigation Reform Act of 1995 provides a "safe harbor" for forward-looking statements.
This presentation or another written or oral statements made by or on behalf of the Company may
include forward-looking statements that reflect the Company's current views with respect to future
events and financial performance. All statements other than statements of historical fact included in this
presentation are forward-looking statements. Forward-looking statements can generally be identified by
the use of forward-looking terminology such as "may," "will," "plan," "expect," "project", "intend,"
"estimate," "anticipate," "believe" or "continue" or their negative or variations or similar terminology. All
forward-looking statements address matters that involve risks and uncertainties. Accordingly, there are
or will be important factors that could cause our actual results to differ materially from those indicated in
these statements. For an explanation of some of the risks and uncertainties facing the Company and its
investors, please see our most recent annual report on Form 10K on file with the Securities Exchange
Commission. The risk factors contained therein should be considered by prospective investors for their
2222
Commission. The risk factors contained therein should be considered by prospective investors for their
potential impact on forward-looking statements included in this release. These important factors, among
others that might not be listed, may cause actual results to differ materially and adversely from the
results expressed or implied by the forward-looking statements. Forward-looking statements speak only
as of the date on which they are made, and the Company undertakes no obligation to update publicly or
revise any forward-looking statement, whether as a result of new information, future developments or
otherwise.
This presentation shall not constitute an offer to sell or the solicitation of an offer to sell or the solicitation of
an offer to buy any securities, nor shall there be any sale of securities in any jurisdiction in which such
offer, solicitation or sale would be unlawful prior to registration or qualification under the securities laws
of such jurisdiction. No offering of securities shall be made except by means of a joint proxy
statement/prospectus meeting the requirements of Section 10 of the Securities Act of 1933, as amended.

Company Overview
• China Marine Food Group Limited is a seafood processor of
seafood-based snack foods, algae-based beverages and fresh
and frozen marine catch based in Shi Shi, China.
• Established in 1994 and headquartered near Xiangzhi Port, the
largest fishing port in Fujian. China Marine has 395 employees
at its dedicated facilities in Shi Shi and at third party blending
facility in Fujian.
3333
• China Marine has been public since 2007 and is listed on NYSE
MKT (NYSE: CMFO). BDO China audited since FY2010. SOX
compliant since 2009. Management team including Chairman,
CEO and CFO in tact since 2007. Independent Board of Directors
established in 2008.
• FY2012 non-GAAP revenue and net income are $157.3 million
and $3.4 million, respectively.

Company Milestones
Business experienced
steady growth.
Registered the
“Mingxiang” brand in
the PRC as a
trademark.
Obtained an import-
export license from
the Fujian Province
International Trade
Cooperation Bureau.
Added Shanghai and
Guangdong
distribution and
launched 3 new
seafood snack
products.
Formed collaboration
with the Ocean
University of China to
further enhance R&D
capabilities.
Completed
acquisition of an
algae-based soft
drink producer to
expand into healthy
beverage market.
Commenced
operation of the new
20,000 tons cold
storage facilities in
July 2012.
1997 1999 2001 2002 2006 2007 2008 2009 2010 2011 2012
Completed the
construction of cold
storage facilities;
Enabled prolonged
raw material storage.
“Mingxiang” brand
was recognised as
the “Fujian Province
Famous Brand”.
Completed Reverse
Merger and initial
raise with accredited
investors. CMFO:
OTCBB
Completed Phase 1 & 2
expansion increasing
capacity to 20,000
ton/year. Upgraded to
Amex Exchange. Land
acquisition for
development of cold
storage facilities to be
completed by 2011.
4444
Expanded Hi-Power®distribution into
Zhejiang province.
Partnership with
National Sports Training
Center which provides a
tremendous platform to
increase brand
awareness.

Select Financials
NYSE Amex CMFO
Fiscal Year December 31st
Last-Traded Price (08/14/13) $0.80
Fully Diluted Shares Outstanding 29.7 million
Market Capitalization $23.8 million
Management Ownership 41.8%
2012 Revenue $157.3 million ▲9%
2012 Adjusted* Net Income $3.4 million ▼73%
5555
2012 Adjusted* Net Income $3.4 million ▼73%
2012 Adjusted* Diluted EPS $0.12
2013 HY Revenue $48.8 million ▼36%
2013 HY Adjusted* Net Income -$0.3 million ▲84%
2013 HY Adjusted* Diluted EPS -$0.01
Auditor BDO China
Legal McLaughlin & Stern
* Adjusted (Non-GAAP )Net income and EPS exclude non-cash amortization charge of intangible assets , after-tax non-cash stock-based compensation expenses, and non-cash goodwill and intangible assets impairment.

China Marine is Strategically Located
• Based in Fujian province, one of the largest
coastal provinces in the PRC and is a vital
navigation hub between the East China Sea
and the South China Sea.
• Operation and production facilities are
located near Xiangzhi Port, the largest port in
Fujian province and is one of the five largest
fishing ports in the PRC.
6
fishing ports in the PRC.
• Access to abundant supply of fresh raw
material which allows China Marine to
effectively manage costs.
• Fresh catch supply is mainly from the marine-
rich Taiwan Strait and East China Sea.

Seafood-Based Food and Beverage
Market Opportunities
• Company estimates overall market size for seafood
jerky in China at $1.5 billion in sales.
• The relatively new and healthy snack-type variety of
processed seafood products have gained strong
acceptance from the current generation of consumers.
• Snack foods are increasingly popular as consumers
shift to a faster pace lifestyle and seek convenient
7
shift to a faster pace lifestyle and seek convenient
food alternatives that are nutritious and tasty.
• Food safety remains a top concern in the processed
food industry. China Marine has an established track
record of providing high quality products with high
customer satisfaction.
• Health conscious consumers in China seek marine-
based foods and beverages. The beverage segment in
China is a multi-billion dollar market.

Diversified Product Offering
• Harvested from deep sea, not from aquaculture. No reported issues with
Processed Seafood - 25-30% gross margin
• 23 preservative-free, dried processed seafood products predominantly sold
under the Mingxiang® brand, a registered trademark.
• Exclusive master distributors sell to 3,500 retail points throughout China,
including major supermarkets and retailers such as Walmart® and Carrefour®.
• Raw materials obtained from fresh marine catch, not seafood breeding farms.
Marine Catch - 3-10% gross margin
• Harvested from deep sea, not from aquaculture. No reported issues with
radiation from Japan quake of 2011.
• Relationships with local fishermen and seafood suppliers to purchase in bulk
quantities from reliable sources only.
• Sold through a strong network of seafood traders in various provinces and
delivered in temperature controlled environment.
Algae-based Soft Drink - 38-40% gross margin
• Began to sell Hi-Power® branded algae-based soft drink in 2010 through acquisition.
Provides many health benefits.
• China Marine’s fastest growing product segment.
• More than 14,000 retail sales points in Fujian and Zhejiang as of June 30, 2013.
8888

Products
Dried Processed Seafood Products
around one third of Revenues
Fresh Marine Catch
around one third of Revenues
Roasted file fish Cuttlefish
Jingdu roasted squid Hairtail fish
Barbecued squid Japanese butter fish
Roasted prawn Squid
9999
Roasted prawn Squid
Barbecued baby squidAlgae-Based Beverages
around one third of Revenues
Sliced shredded squid Hi-Power®
Sliced octopusHi-Power® Lite – Sugar Free Version
(development stage)
Sliced squid

Expanded Production Facilities for 2010
• Currently have four production lines for dried processed seafood
products and one production line for frozen processed seafood
products. Lines operating almost at full designed production
capacity as of the end of 2008.
• In January of 2009, completed Phase One Expansion which
increased capacity to 10,000 tons per year.
• By the end of Q3 2009, completed Phase Two Expansion and
doubled capacity to 20,000 tons per year.
Phase One Expansion Phase Two Expansion
Production Lines
2008
Maximum Annual
Production Capacity
(in Tons)
Completed as of Q1 2009
Maximum Annual
Production Capacity
(in Tons)
Completed as of Q3 2009
Maximum Annual
Production Capacity
(in Tons)
Roasted file fish 2,500 3,000 5,000
Roasted squid 1,100 2,500 9,000
Roasted shrimp 600 1,000 1,500
Shredded roasted squid 1,000 2,000 3,500
Smoked eel 1,000 500 -
Frozen processed seafood 450 1,000 1,000
TOTAL 6,650 10,000 20,000
Phase One Expansion Phase Two Expansion
10101010

Fast Growing Distribution Network
• Established network of exclusive master
distributors in major provinces such as
Fujian, Zhejiang, Shandong and
Guangdong in the PRC.
• 3,500 retail points for snack foods
including supermarket chains,
convenience store chains and retailers
such as Wal-Mart and Carrefour
throughout the PRC.
11
throughout the PRC.
• More than 14,000 retail points for Hi-
Power® beverages including restaurants
and hotels.
• Relationships with overseas distributors
such as JCR Corporation of Japan and a
distributor in the Philippines.
• Worked with our major distributors in the
domestic and overseas markets for more
than 10 years on average.
Retail points include Walmart and Carrefour China. Retail displays above include picture of China Marine investor taken during Investor Day, 2010.
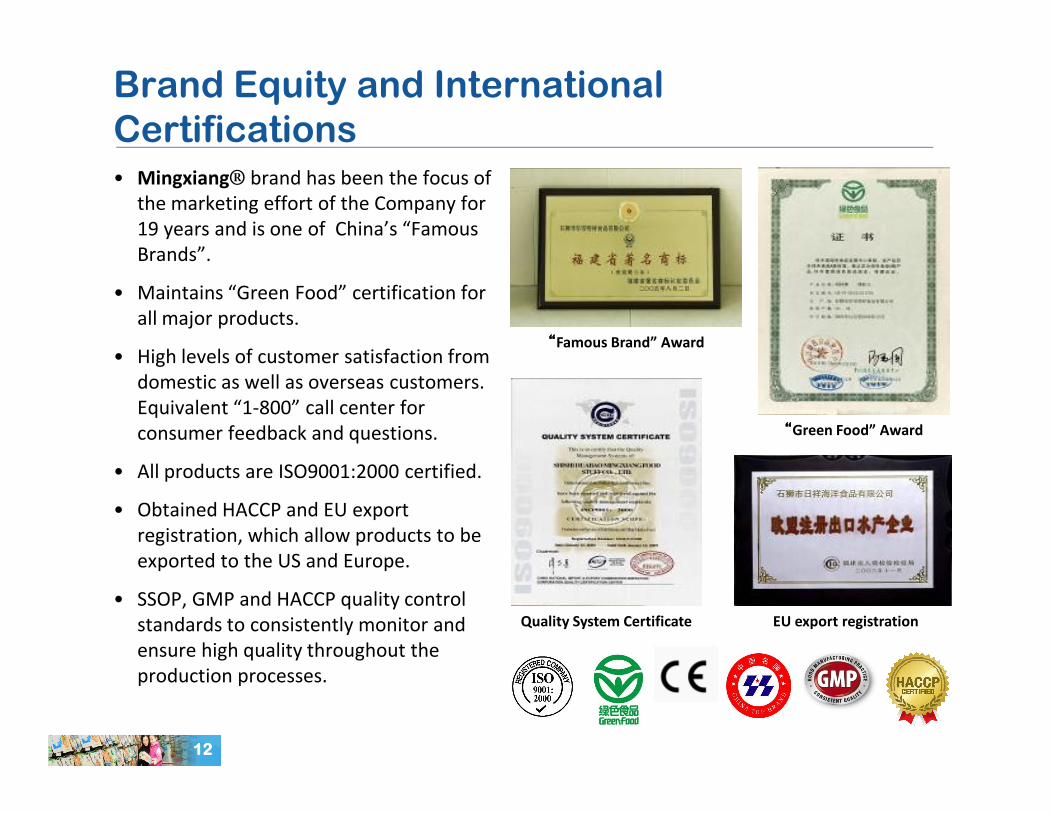
Brand Equity and International
Certifications• Mingxiang® brand has been the focus of
the marketing effort of the Company for
19 years and is one of China’s “Famous
Brands”.
• Maintains “Green Food” certification for
all major products.
• High levels of customer satisfaction from
domestic as well as overseas customers.
Equivalent “1-800” call center for
““““Famous Brand” Award
12121212
Equivalent “1-800” call center for
consumer feedback and questions.
• All products are ISO9001:2000 certified.
• Obtained HACCP and EU export
registration, which allow products to be
exported to the US and Europe.
• SSOP, GMP and HACCP quality control
standards to consistently monitor and
ensure high quality throughout the
production processes.
““““Green Food” Award
Quality System Certificate EU export registration

Leading R&D Capabilities
• Established strategic collaboration with Ocean University of China’s Food Sciences and Engineer
Institute allows the Company to further strengthen its R&D capabilities and continuously introduce high
quality products to the market.
• Collaboration focuses on developing new products and by-products from raw marine catch used in the
processing of seafood, particularly in:
– Products under development include low-salt fish sauce and minced fish products. The project is
expected to complete with various lines of healthy food products to be commercialized. Each
participating entity will apply for patents for products developed under their respective names.
– Development of high-value products from remains of processed seafood (accredited to be one of the
projects in China’s Spark Program for encouragement of technological advancements).
13131313
projects in China’s Spark Program for encouragement of technological advancements).
– Leading role granted on a government subsidized project by Ministry of Science and Technology to
develop new products from the fishing grounds off the Fujian province.
China’s Spark Program Certification

Immediate Term Expansion –
Cold Storage Facilities
• The Company has secured a 40-year land use right and completed construction of cold storage
facilities with 20,000 tons capacity.
• Covering an area of 8,691 square meters, the land is located next to the fishing port and the
Company's processing facilities in Shi Shi City.
Cold Storage Project Overview
• Cost ~$27.3 million; has been up and
running during the third quarter of 2012.
• For internal and 3rd party use.
Rendition and plan for development at port.
• For internal and 3rd party use.
• Provides high standard, modernized cold
storage, blast freezing, and ice making
service.
• The exclusive cold storage to service the
port.
Cold Storage Project Benefits
• Reduce storage cost – improve margins.
• Capacity for trading activities.
14
Progress as of March 2012.

Experienced Management Team
Pengfei LIU – CEO and Executive Chairman
• Mr. Liu, founder of the Company, possesses over 30 years of experience in the seafood industry.
• Successfully led the Company in the transition from a small and domestic market-oriented seafood
enterprise to a nationwide seafood enterprise with advanced seafood processing facilities.
Marco Hon Wai KU – Chief Financial Officer
• Before joining Company in 2007, Mr. Ku worked with Hongkong.com Company Limited (a Hong Kong
listed company within the China.com Group), Hutchison Port Holdings Ltd. (an operating arm of
Hutchison Whampoa Group) and KPMG for 9 years in total.
• Mr. Ku holds a bachelor degree in Finance from the Hong Kong University of Science and Technology and
is currently a Fellow Member of the Hong Kong Institute of Certified Public Accountants.
15151515
is currently a Fellow Member of the Hong Kong Institute of Certified Public Accountants.
Weipeng LIU – Executive Director
• Mr. Liu joined the Company in 1997 as the facilities manager. He is responsible for overseeing the
construction, operation and maintenance of our equipment and production facilities.
• Mr. Liu graduated with a diploma in mechanical design and manufacturing and automation from Fuzhou
University in 1997.
Xiaochuan Li – Independent Director
• Mr. Li is vice-head of the National Marine Foods Quality Supervision Testing Centre since 1987 and the
head of the Quality Assurance Testing Research Department of the Huanghai Aquatic Products Research
Institute since 1994.
• In 2000, Mr. Li was appointed the vice-head of the Food Products Industry Committee of the China
Quality Testing Association.

Financial Highlights
Net Revenues ($’000) Adjusted Net Income ($’000)
16
• Consistent revenue growth yearly from 2008 through 2012.
• 2012 achieved 9% revenue growth and adjusted net income decreased by 73%, mainly
due to the public concerns over the safety of seafood and beverage products in relation to
the radiation leaks in Japan and the tainted clouding agent incident found in Taiwan and
China in 2011, respectively.
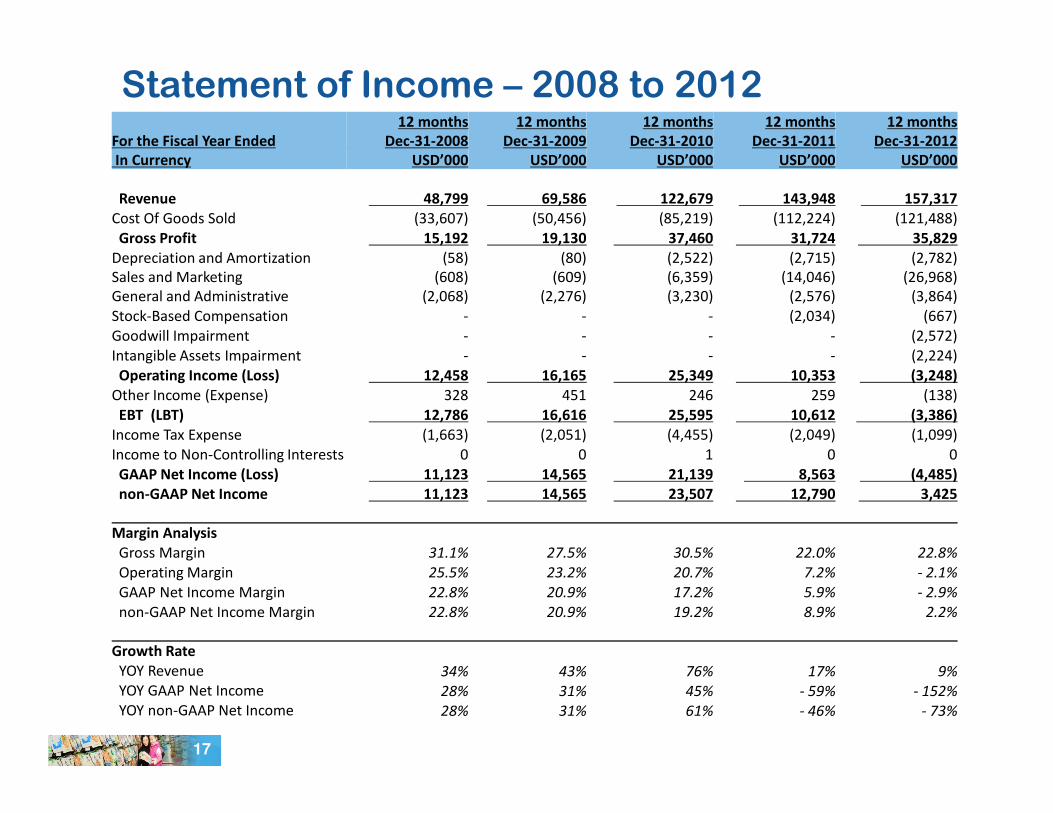
Statement of Income – 2008 to 2012
For the Fiscal Year Ended
In Currency
12 months
Dec-31-2008
USD’000
12 months
Dec-31-2009
USD’000
12 months
Dec-31-2010
USD’000
12 months
Dec-31-2011
USD’000
12 months
Dec-31-2012
USD’000
Revenue 48,799 69,586 122,679 143,948 157,317
Cost Of Goods Sold (33,607) (50,456) (85,219) (112,224) (121,488)
Gross Profit 15,192 19,130 37,460 31,724 35,829
Depreciation and Amortization
Sales and Marketing
(58)
(608)
(80)
(609)
(2,522)
(6,359)
(2,715)
(14,046)
(2,782)
(26,968)
General and Administrative (2,068) (2,276) (3,230) (2,576) (3,864)
Stock-Based Compensation - - - (2,034) (667)
Goodwill Impairment - - - - (2,572)
Intangible Assets Impairment - - - - (2,224)
Operating Income (Loss) 12,458 16,165 25,349 10,353 (3,248)
Other Income (Expense) 328 451 246 259 (138)
EBT (LBT) 12,786 16,616 25,595 10,612 (3,386)
17
EBT (LBT) 12,786 16,616 25,595 10,612 (3,386)
Income Tax Expense (1,663) (2,051) (4,455) (2,049) (1,099)
Income to Non-Controlling Interests 0 0 1 0 0
GAAP Net Income (Loss) 11,123 14,565 21,139 8,563 (4,485)
non-GAAP Net Income 11,123 14,565 23,507 12,790 3,425
Margin Analysis
Gross Margin 31.1% 27.5% 30.5% 22.0% 22.8%
Operating Margin 25.5% 23.2% 20.7% 7.2% - 2.1%
GAAP Net Income Margin 22.8% 20.9% 17.2% 5.9% - 2.9%
non-GAAP Net Income Margin 22.8% 20.9% 19.2% 8.9% 2.2%
Growth Rate
YOY Revenue 34% 43% 76% 17% 9%
YOY GAAP Net Income 28% 31% 45% - 59% - 152%
YOY non-GAAP Net Income 28% 31% 61% - 46% - 73%

HY 2013 Operating Results
For the Fiscal Period Ended
In Currency
3 months
Jun-30-2013
USD’000
3 months
Jun-30-2012
USD’000
Change
in %
6 months
Jun-30-2013
USD’000
6 months
Jun-30-2012
USD’000
Change
in %
Revenue _ 27,288 _ 61,284 - 55.5% _ 48,773 _ 76,368 - 36.1%
Cost Of Goods Sold (20,602) (52,309) (34,842) (62,794)
Gross Profit 6,686 8,975 - 25.5% 13,931 13,574 + 2.6%
Depreciation and Amortization (626) (695) (1,245) (1,391)
Sales and Marketing (6,982) (8,698) (11,763) (13,279)
General and Administrative (844) (1,209) (1,586) (1,747)
Stock-Based Compensation - - - (667)
Intangible assets impairment (1,085) - (1,085) -
Operating Loss (2,851) (1,627) (1,748) (3,510)
18
Operating Loss (2,851) (1,627) (1,748) (3,510)
Other Income 60 94 120 176
Interest Expense (299) (106) (510) (141)
Loss Before Income Tax Expense (3,090) (1,639) (2,138) (3,475)
Income Tax Expense - - (363) (208)
Income to Non-Controlling Interests 0 0 0 0
GAAP Net Loss (3,090) (1,639) - 88.6% (2,501) (3,683) + 32.1%
non-GAAP Net Loss (1,439) (1,003) - 43.5% (290) (1,843) + 84.3%
Margin Analysis
Gross Margin 24.5% 14.6% 28.6% 17.8%
Operating Margin -10.4% -2.7% -3.6% -4.6%
GAAP Net Income Margin -11.3% -2.7% -5.1% -4.8%
non-GAAP Net Income Margin -5.3% -1.6% -0.6% -2.4%

Balance Sheet
June-30-2013
USD’000
Unaudited
December-31-2012
USD’000
Audited
ASSETS
Current Assets
Cash and Cash Equivalents 1,630 880
Accounts Receivable, net 30,885 54,046
Inventories 65,775 36,415
Prepaid Expenses and Other Current Assets 2,612 401
TOTAL CURRENT ASSETS 100,902 91,742
Property, Plant and Equipment, net 37,131 35,737
Land Use Rights, net 2,987 2,967
19
Land Use Rights, net
Construction In Progress
2,987
-
2,967
159
Intangible Assets, net 13,704 15,616
TOTAL ASSETS 154,724 146,221
LIABILITIES AND SHAREHOLDERS EQUITY
Current Liabilities
Short-term Borrowings 19,291 8,761
Accounts Payable, trade 3,458 4,227
Income Tax Payable - 321
Accrued Liabilities and Other Payables 5,181 6,217
TOTAL CMFO SHAREHOLDERS EQUITY 126,438 126,339
Non-Controlling Interests 356 356
TOTAL LIABILITIES AND SHAREHOLDERS EQUITY 154,724 146,221

Summary Cash Flow Statement
June-30-2013
USD’000
Unaudited
June-30-2012
USD’000
Unaudited
CASH FLOW FROM OPERATING ACTIVITIES
Net loss (2,501) (3,683)
Depreciation and amortization 1,697 1,540
Reversal of doubtful accounts (117) (57)
Intangible assets impairment 1,085 -
Change in Operating Assets and Liabilities
Accounts Receivable 23,278 11,381
Inventories (29,360) (19)
Prepaid Expenses and Other Current Assets (2,212) (202)
Accounts Payable, trade (770) 2,980
Income Tax Payable (321) (175)
Accrued Liabilities and Other Payables (1,036) 1,116
20
Accrued Liabilities and Other Payables (1,036) 1,116
Net Cash (Used In) Provided By Operating Activities (10,257) 12,881
CASH FLOW FROM INVESTING ACTIVITIES
Purchase of Property, Plant and Equipment (1,024) (68)
Cash paid to Construction in Progress - (1,125)
Net Cash Used In Investing Activities (1,024) (1,193)
Net Cash Provided By Financing Activities 10,179 4,598
NET CHANGE IN CASH AND CASH EQUIVALENT (1,102) 16,286
Effect of Exchange Rate Changes on Cash and Cash Equivalents 1,852 495
CASH and CASH EQUIVALENTS AT BEGINNING OF PERIOD 880 587
CASH and CASH EQUIVALENTS AT END OF PERIOD 1,630 17,368
Growth Strategies 2013-2014
1. Secure new distribution in both existing and
untapped markets and provinces in China
2. Introduce new products to the market
3. Develop and grow convenience store chains and
21
3. Develop and grow convenience store chains and
hospitality sales in selected provinces
4. Leverage the advantageous of the new cold storage
facility
5. Pursue acquisition opportunities when available

Why Invest In China Marine Food?
1. Diversified product offering of foods and beverages marketed under a
well-known brand
2. Adequate supply of low cost, high quality raw materials from multiple
sources
3. Well positioned to capitalize on China’s raising personal consumption
and heightened appetite for nutritious, convenient snack foods and
beverages
22222222
beverages
4. Extensive distribution network covers over 3,500 retail points for
processed seafood products and more than 14,000 beverage retail
points including Wal-Mart and Carrefour
5. Strategic location allows easy access to raw material and
transportation
6. Strong execution of acquisition strategy and organic growth strategy
7. Solid profit margins and no receivable issues

Contact Us
Company Contact
Marco Hon Wai KU, CFO
Suite 815, Ocean Centre
Harbour City, Kowloon
HONG KONG
Investor Relations Contact
John Mattio
MZHCI LLC
New York and Connecticut
Main: US (212) 301-7130HONG KONG
+ (852) 2111-8768
www.china-marine.cn
Main: US (212) 301-7130
Direct: US (212) 301-7131
www.mz-ir.com