
August 2012 Beyond the boom: Australia s productivity ... · McKinsey Global Institute ......
56
Beyond the boom: Australia’s productivity imperative McKinsey Global Institute Beyond the boom: Australia’s productivity imperative McKinsey Global Institute August 2012
Transcript of August 2012 Beyond the boom: Australia s productivity ... · McKinsey Global Institute ......
Beyond the boom: Australia’s productivity imperative
McKinsey Global Institute
Beyond the b
oom: A
ustralia’s prod
uctivity imp
erativeM
cKinsey G
lobal Institute
August 2012
Copyright © McKinsey & Company 2012
The McKinsey Global Institute
The McKinsey Global Institute (MGI), the business and economics research arm of McKinsey & Company, was established in 1990 to develop a deeper understanding of the evolving global economy. Our goal is to provide leaders in the commercial, public, and social sectors with the facts and insights on which to base management and policy decisions.
MGI research combines the disciplines of economics and management, employing the analytical tools of economics with the insights of business leaders. Our “micro-to-macro” methodology examines microeconomic industry trends to better understand the broad macroeconomic forces affecting business strategy and public policy. MGI’s in-depth reports have covered more than 20 countries and 30 industries. Current research focuses on six themes: productivity and growth; global financial markets; technology and innovation; urbanization; the future of work; and natural resources. Recent reports have assessed job creation, resource productivity, cities of the future, and the economic impact of social technology.
MGI is led by three McKinsey & Company directors: Richard Dobbs, James Manyika, and Charles Roxburgh. Susan Lund serves as director of research. Project teams are led by a group of senior fellows and include consultants from McKinsey’s offices around the world. These teams draw on McKinsey’s global network of partners and industry and management experts. In addition, leading economists, including Nobel laureates, act as research advisers.
The partners of McKinsey & Company fund MGI’s research; it is not commissioned by any business, government, or other institution. For further information about MGI and to download reports, please visit www.mckinsey.com/mgi.
McKinsey Global Institute
Beyond the boom: Australia’s productivity imperative
Charlie TaylorChris BradleyRichard DobbsFraser ThompsonDaniel Clifton
August 2012
Preface
With a strong banking sector and an enviable unemployment rate hovering just above 5 percent, Australia stands among the fortunate few advanced economies that are currently generating significant income growth. An outsized boom in the resources sector, driven by demand from developing nations in Asia, has led to a surge in income from record export prices and historic levels of investment. But the boom belies a clear decline in Australia’s productivity.
The sheer scale of the expansion in mining and energy makes it more difficult to assess the long-run performance and prospects of the economy as a whole. Typically labour productivity is a useful measure of performance and is rightly a focus of national policy. But Australia’s recent investment boom has changed the growth equation, placing greater emphasis on the role of capital productivity. Drawing on expertise from 20 years of productivity studies, including a 1995 report on the Australian economy, the McKinsey Global Institute aims to create an analytical framework that acknowledges the complex structural shifts currently under way. This report develops a new method of “growth accounting” that emphasises the distinct roles of capital and labour while also separating the terms of trade (especially rising commodity prices) from output.
How to maximise the benefits of the current resource windfall to Australia’s public finances is already a heated topic. While we completely agree that this is an important issue, attention must also focus on ensuring that the nation’s underlying prosperity continues. If it doesn’t, discussion of how to spend the windfall will be moot. By shoring up productivity now, while the benefits of the boom are still accruing, business and policy leaders can position Australia to better withstand external risks beyond its control.
Charlie Taylor, head of McKinsey’s Public Sector Practice in Australia, and Richard Dobbs, a director of MGI, oversaw the project. This project was led by Chris Bradley, a partner in McKinsey’s Sydney office, and Fraser Thompson, an MGI senior fellow, supported by a project team in McKinsey’s Australia office of Ben Austin, Daniel Clifton, Alice Hudson, and Jonathan Humphrey.
We are grateful for the advice and input of many McKinsey colleagues, including Nigel Andrade, Angus Dawson, Parag Desai, Emiliano Di Vincenzo, Ryan Geraghty, Brett Grehan, Jasper van Halder, Duncan Kauffman, Olivier Legrand, John Lydon, Tim McEvoy, Gary Pinshaw, David Pralong, Michael Rennie, and Joseph Tesvic.
Beyond the boom: Australia’s productivity imperativeMcKinsey Global Institute
Many experts in academia, government, and industry have offered invaluable guidance and suggestions. Our particular thanks go to Martin Baily, Gordon Cairns, Andrew Charlton, Richard Cooper, Diane Grady, Warwick McKibbin, Robert McLean, Mick Reid, and John Stuckey.
The team benefited from the contributions of Josh Dowse; Janet Bush and Lisa Renaud, MGI senior editors, who provided editorial support; Robert Skeffington and Rebeca Robboy for their help in external relations; Julie Philpot, MGI’s editorial production manager; and designers Marisa Carder and Therese Khoury.
This report contributes to MGI’s mission to help leaders understand the forces transforming the global economy, improve company performance, and work for better national and international policies. As with all MGI research, we would like to emphasise that this work is independent and has not been commissioned or sponsored in any way by any business, government, or other institution.
Richard Dobbs Director, McKinsey Global Institute Seoul
James Manyika Director, McKinsey Global Institute San Francisco
Charles Roxburgh Director, McKinsey Global Institute London
Susan Lund Director of Research, McKinsey Global Institute Washington, DC
August 2012
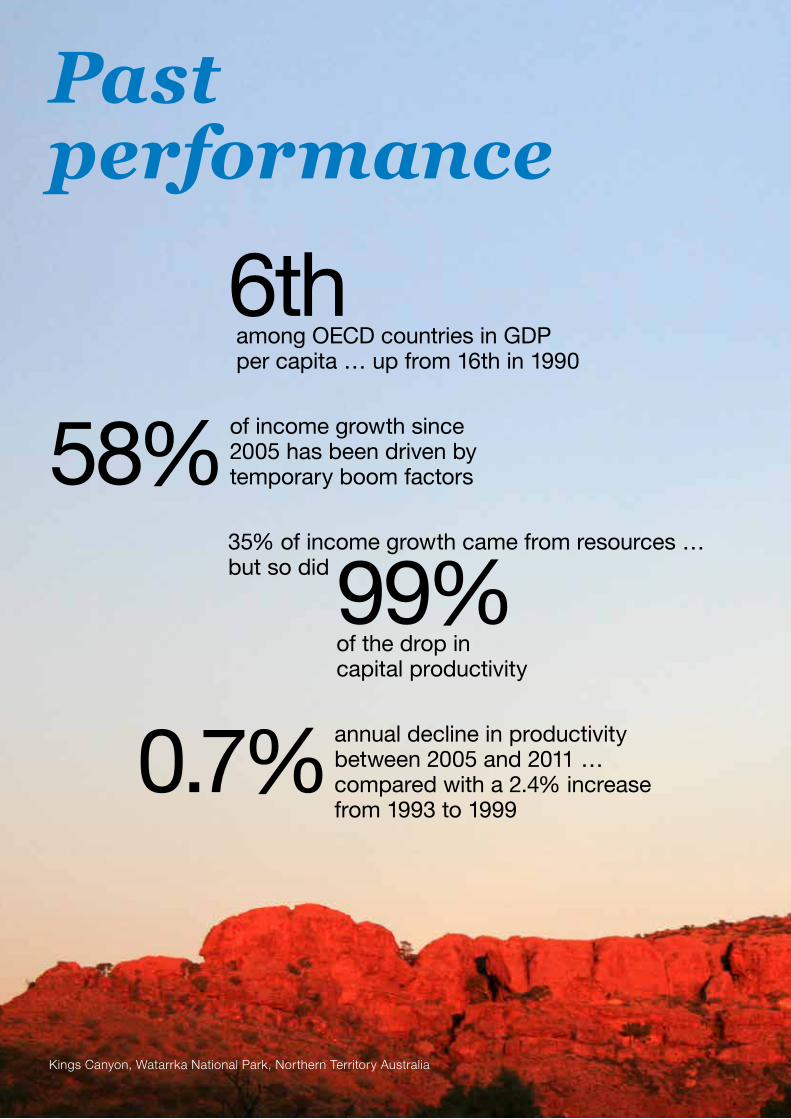
Past performance
58%of income growth since 2005 has been driven by temporary boom factors
Kings Canyon, Watarrka National Park, Northern Territory Australia
among OECD countries in GDP per capita … up from 16th in 1990
6th
35% of income growth came from resources … but so did
of the drop in capital productivity
99%
0.7%annual decline in productivity between 2005 and 2011 … compared with a 2.4% increase from 1993 to 1999
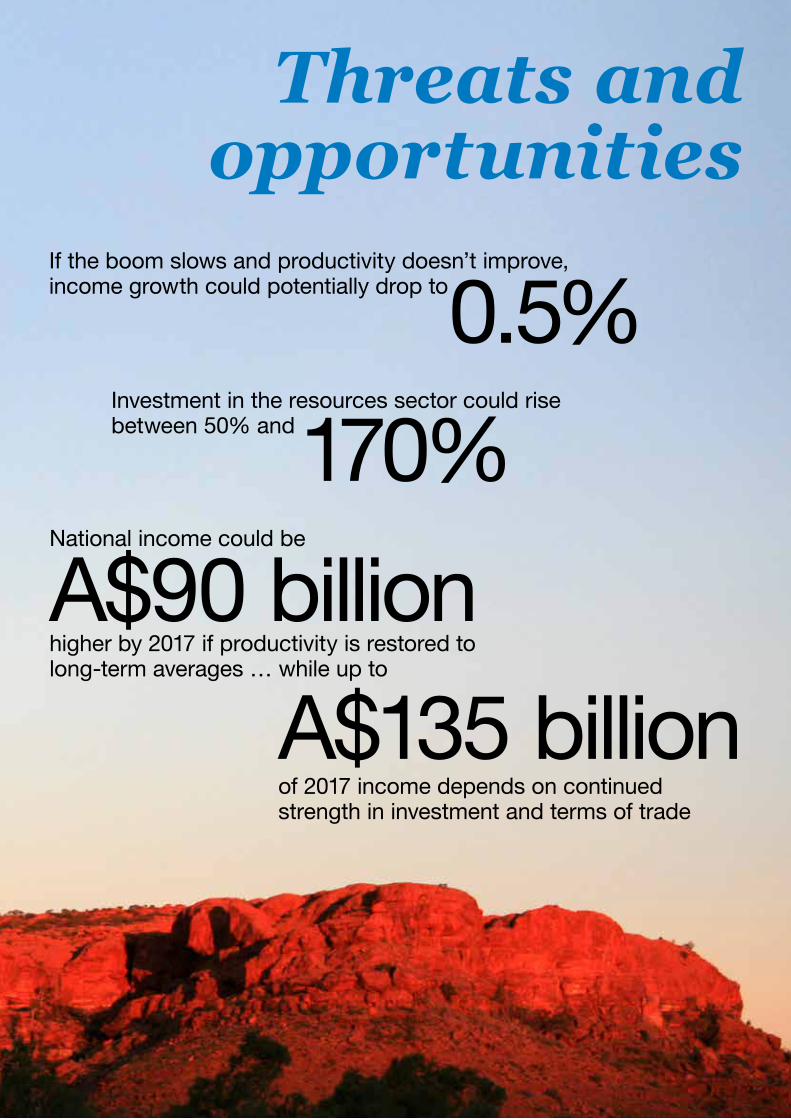
Threats and opportunities
Investment in the resources sector could rise between 50% and170%
A$90 billionNational income could be
higher by 2017 if productivity is restored to long-term averages … while up to
A$135 billionof 2017 income depends on continued strength in investment and terms of trade
If the boom slows and productivity doesn’t improve, income growth could potentially drop to0.5%

Beyond the boom: Australia’s productivity imperativeMcKinsey Global Institute
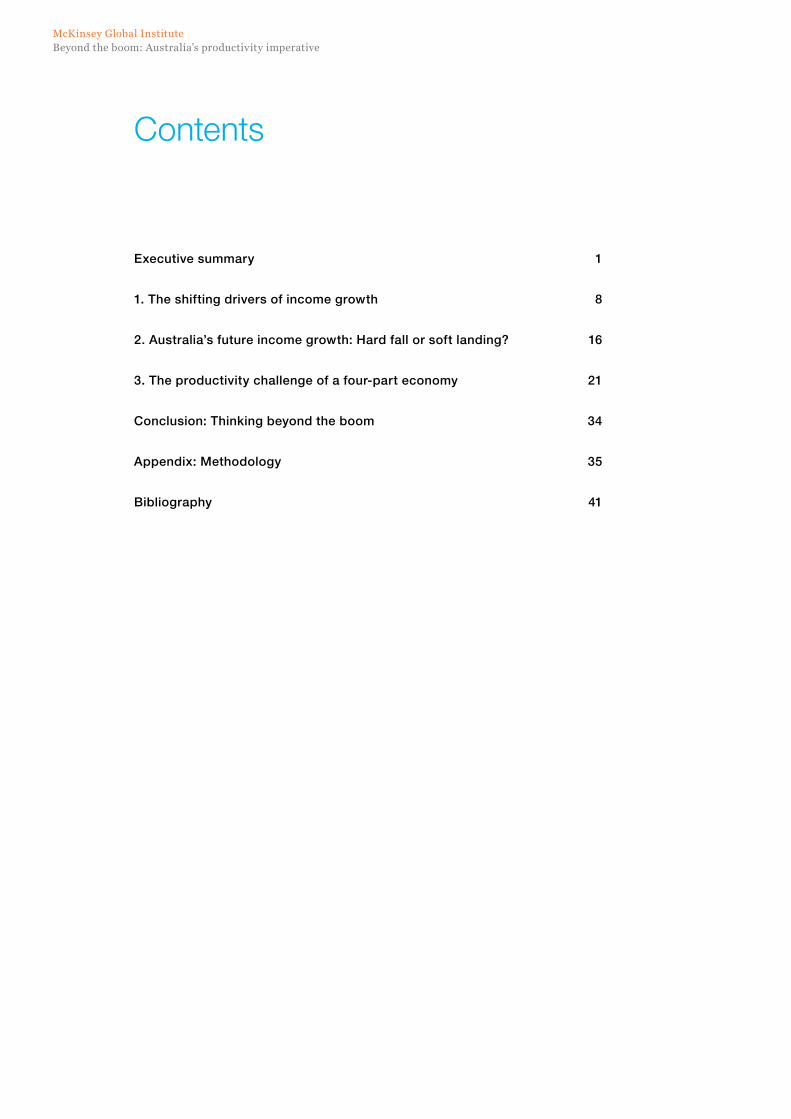
Executive summary 1
1. The shifting drivers of income growth 8
2. Australia’s future income growth: Hard fall or soft landing? 16
3. The productivity challenge of a four-part economy 21
Conclusion: Thinking beyond the boom 34
Appendix: Methodology 35
Bibliography 41
Contents

Beyond the boom: Australia’s productivity imperativeMcKinsey Global Institute
1
Although they may not always feel it, Australians are more prosperous than ever. As recently as 1990, the nation ranked 16th among OECD countries in terms of per capita GDP; just two decades later, in 2010, it stood in sixth place.1 Australia overtook the United States in terms of income per head back in 2005.
Capitalising on its geography and geology, Australia has been riding the wave of Asia’s rapid growth, providing many of the raw materials used to power new industry and build the vast infrastructure needed in China and other emerging markets. As commodity prices have spiked in recent years, Australia has attracted a flood of investment into its mines, processing plants, pipelines, and ports—in fact, there has been greater investment in resource projects over just the past five years than in the previous 20.
Asia’s economic and demographic trends point to sustained demand in the decades ahead, but growth fuelled by natural resources carries risk. Australia’s reliance on its resource sectors could leave the economy vulnerable to any growth slowdown in China, volatility in commodities markets, and the eventual normalisation of resource prices when supply catches up with demand (or potentially a precipitous drop in resource prices if supply gets ahead of demand).
The boom also belies some weaker fundamental trends in the economy that could put Australia’s future prosperity at risk unless they are addressed. Notably, growth in labour productivity has fallen to 0.3 percent per annum in the last six years, down from an average of 3.1 percent from 1993 to 1999. This slowdown has taken place at a time of significant wage inflation, with average private-sector weekly earnings growing at 4.4 percent per annum over the same period. Lacklustre labour productivity growth is all the more striking in light of the substantial capital deepening that has taken place in the Australian economy. The amount of capital per hour worked is 25 percent higher today than it was six years ago—yet workers on average are producing only 7 percent more output per hour. Moreover, capital productivity is now a drag on income growth. Improving productivity performance is imperative if Australia hopes to prepare for a future that may not offer the tonic of record investment and export prices.
In this report, we first use a new MGI model for income growth accounting to explore the current dynamics of the Australian economy. We then discuss potential scenarios for future growth through 2017, and home in on individual sectors of the economy to analyse their key growth drivers and better understand what businesses and policy makers might do to maximise productivity and income growth.
We now summarise our main findings.
1 Among nations in the Organisation for Economic Co-operation and Development. Based on per capita GDP, adjusted for purchasing power parity (PPP), using OECD national accounts.
Executive summary
2
AUSTRALIA’S CURRENT INCOME GROWTH IS BEING DRIVEN BY A NUMBER OF ONE-OFF FACTORS
The magnitude of the resources boom has distorted perceptions of the economy’s overall health. Since 2005, Australia’s income has risen 4.1 percent per year, a pace consistent with recent history.2 But a closer look reveals some troubling trends: Australia has enjoyed this prosperity despite a decline in multifactor productivity of 0.7 percent per year. Indeed, without the one-off factors of an investment surge and high commodity prices, Australia’s brisk income growth would have been cut in half—well below what has historically been achieved.
Among the dynamics now at work:
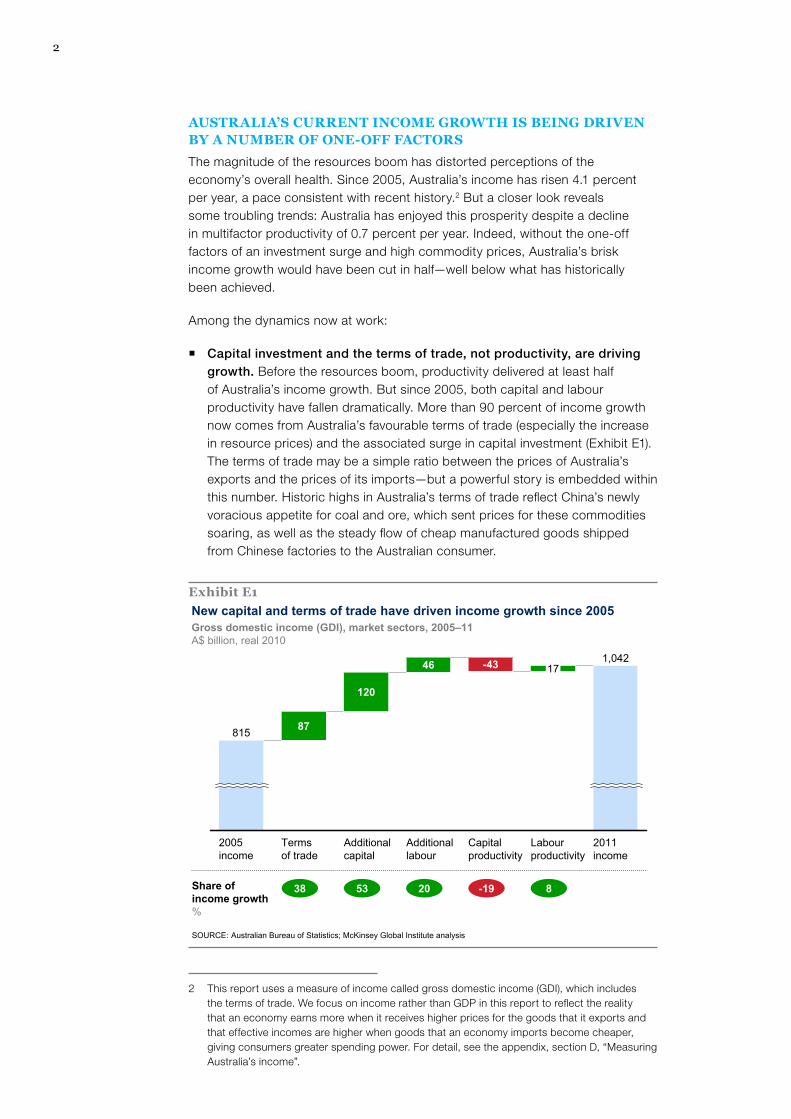
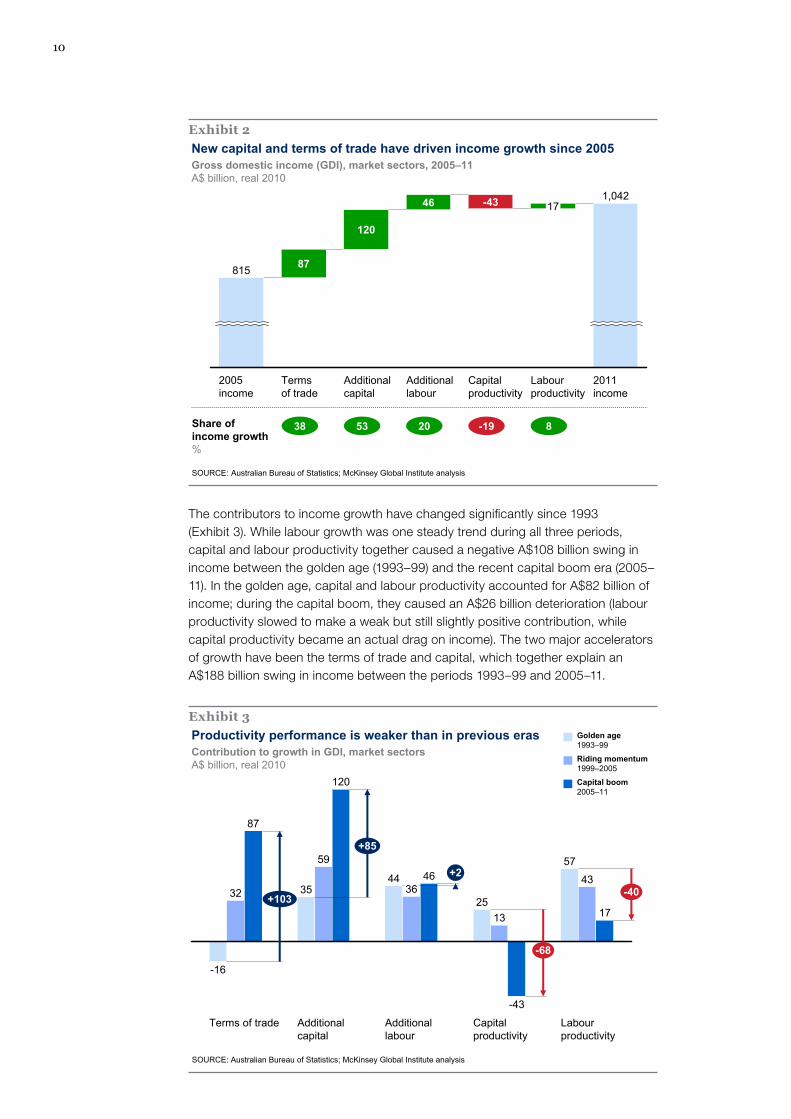
� Capital investment and the terms of trade, not productivity, are driving growth. Before the resources boom, productivity delivered at least half of Australia’s income growth. But since 2005, both capital and labour productivity have fallen dramatically. More than 90 percent of income growth now comes from Australia’s favourable terms of trade (especially the increase in resource prices) and the associated surge in capital investment (Exhibit E1). The terms of trade may be a simple ratio between the prices of Australia’s exports and the prices of its imports—but a powerful story is embedded within this number. Historic highs in Australia’s terms of trade reflect China’s newly voracious appetite for coal and ore, which sent prices for these commodities soaring, as well as the steady flow of cheap manufactured goods shipped from Chinese factories to the Australian consumer.
2 This report uses a measure of income called gross domestic income (GDI), which includes the terms of trade. We focus on income rather than GDP in this report to reflect the reality that an economy earns more when it receives higher prices for the goods that it exports and that effective incomes are higher when goods that an economy imports become cheaper, giving consumers greater spending power. For detail, see the appendix, section D, “Measuring Australia’s income”.
Exhibit E1New capital and terms of trade have driven income growth since 2005Gross domestic income (GDI), market sectors, 2005–11 A$ billion, real 2010
SOURCE: Australian Bureau of Statistics; McKinsey Global Institute analysis
2011 income
1,042
Labour productivity
17
Capital productivity
-43
Additional labour
46
Additional capital
120
Terms of trade
87
2005 income
815
38 53 20 -19 8Share of income growth%
3Beyond the boom: Australia’s productivity imperativeMcKinsey Global Institute
� 10 percent of the economy has driven a third of recent income growth. Since 2005, a third of Australia’s income growth has been generated by a resources sector that accounts for 10 percent of the nation’s output and just 3 percent of its direct labour. Resources have absorbed 64 percent of the terms of trade improvement and half of the investment increase. This shift in emphasis has caused huge disparities among both sectors and regions.
� More than half of recent income growth is due to temporary boom-time effects. Underlying growth in income is not as significant as the headline number suggests. The biggest one-off impact has been an A$87 billion boost from the terms of trade, but capital deepening (an increase in capital per hour worked above historical rates) also gave an A$39 billion boost.
� Capital productivity is the biggest drag on growth. Capital productivity actually lowered income by A$43 billion from 2005 to 2011, or A$53 billion when including the impact of a shift in capital to more productive industries. While A$24 billion of the deterioration can be explained by large investments sunk in projects that have yet to be completed and A$13 billion represents declining yields (a factor that cannot be controlled), A$16 billion in income has been lost economy-wide since 2005 to higher costs and inefficiencies (which can be at least partially addressed).
IF PRODUCTIVITY GROWTH DOESN’T RECOVER, AUSTRALIA MAY HAVE LITTLE OR NO INCOME GROWTH IN THE FUTURE
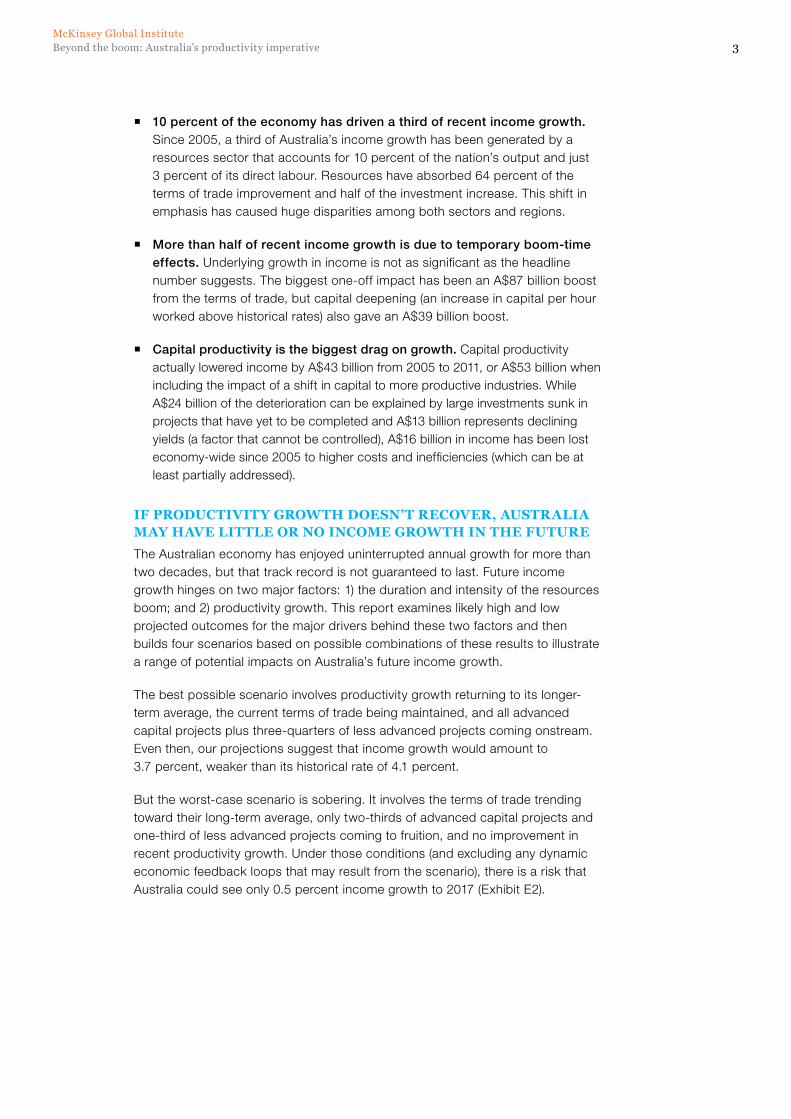
The Australian economy has enjoyed uninterrupted annual growth for more than two decades, but that track record is not guaranteed to last. Future income growth hinges on two major factors: 1) the duration and intensity of the resources boom; and 2) productivity growth. This report examines likely high and low projected outcomes for the major drivers behind these two factors and then builds four scenarios based on possible combinations of these results to illustrate a range of potential impacts on Australia’s future income growth.
The best possible scenario involves productivity growth returning to its longer-term average, the current terms of trade being maintained, and all advanced capital projects plus three-quarters of less advanced projects coming onstream. Even then, our projections suggest that income growth would amount to 3.7 percent, weaker than its historical rate of 4.1 percent.
But the worst-case scenario is sobering. It involves the terms of trade trending toward their long-term average, only two-thirds of advanced capital projects and one-third of less advanced projects coming to fruition, and no improvement in recent productivity growth. Under those conditions (and excluding any dynamic economic feedback loops that may result from the scenario), there is a risk that Australia could see only 0.5 percent income growth to 2017 (Exhibit E2).
4
Looking ahead to 2017, national income could vary by up to A$135 billion depending on the direction of the terms of trade and the strength of associated investment trends—but unfortunately, Australia cannot control the intensity and duration of the resources boom. It can, however, take steps to boost productivity. Although slower income growth is probably unavoidable, improved productivity can ensure a much softer landing if and when the resources boom abates. Returning to good productivity performance can add A$90 billion to national income by 2017.
Exhibit E2Four scenarios illustrate a range of potential outcomes
SOURCE: Australian Bureau of Statistics; McKinsey Global Institute analysis
Scenarios for annual growth in GDI, 2011–171
1 Adjusted for lagged returns from capital recently added.2 Difference in income between 2011 and 2017, rounded to the nearest A$5 billion.
Stays lowProductivity stays at 2006–11 levels
Gets betterProductivity returns
to long-term averages
Capital and labour productivity to 2017
Holds firm▪ Current terms of trade
maintained to 2017▪ All advanced and most
less advanced projects occur
Adjusts downward▪ Terms of trade returns
to long-term average▪ Only two-thirds of
advanced and one-third of less advanced projects occur
Terms of trade and investment to 2017
Lucky escape Paradise
Hangover Earned rewards
Income growth rate%Income growth2
A$ billion
2.4% 3.7%
$160 $250
0.5% 1.8%
$35 $115
5Beyond the boom: Australia’s productivity imperativeMcKinsey Global Institute
CAPTURING THE A$90 BILLION PRODUCTIVITY PRIzE REqUIRES ACTION IN FOUR SECTOR CLUSTERS
Before a serious productivity push can begin, it is crucial to understand the particular nature of the challenges facing individual sectors.
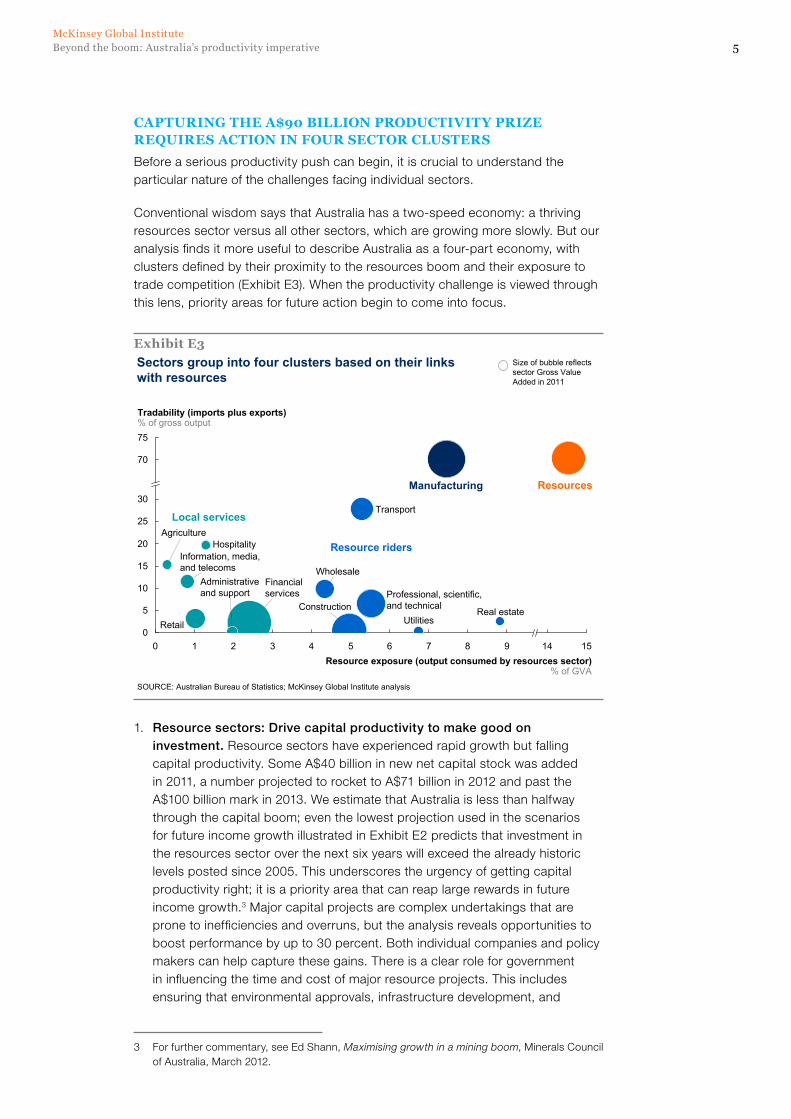
Conventional wisdom says that Australia has a two-speed economy: a thriving resources sector versus all other sectors, which are growing more slowly. But our analysis finds it more useful to describe Australia as a four-part economy, with clusters defined by their proximity to the resources boom and their exposure to trade competition (Exhibit E3). When the productivity challenge is viewed through this lens, priority areas for future action begin to come into focus.
1. Resource sectors: Drive capital productivity to make good on investment. Resource sectors have experienced rapid growth but falling capital productivity. Some A$40 billion in new net capital stock was added in 2011, a number projected to rocket to A$71 billion in 2012 and past the A$100 billion mark in 2013. We estimate that Australia is less than halfway through the capital boom; even the lowest projection used in the scenarios for future income growth illustrated in Exhibit E2 predicts that investment in the resources sector over the next six years will exceed the already historic levels posted since 2005. This underscores the urgency of getting capital productivity right; it is a priority area that can reap large rewards in future income growth.3 Major capital projects are complex undertakings that are prone to inefficiencies and overruns, but the analysis reveals opportunities to boost performance by up to 30 percent. Both individual companies and policy makers can help capture these gains. There is a clear role for government in influencing the time and cost of major resource projects. This includes ensuring that environmental approvals, infrastructure development, and
3 For further commentary, see Ed Shann, Maximising growth in a mining boom, Minerals Council of Australia, March 2012.
Exhibit E3
65
Tradability (imports plus exports)% of gross output75
70
30
25
20
15
10
5
0432
Real estate
Financialservices
Information, media,and telecoms
Transport
10Resource exposure (output consumed by resources sector)
% of GVA
1514
Hospitality
Retail
Professional, scientific,and technical
WholesaleAdministrativeand support
Utilities
Agriculture
987
Construction
Sectors group into four clusters based on their links with resources
SOURCE: Australian Bureau of Statistics; McKinsey Global Institute analysis
Local services
Resource riders
Manufacturing Resources
Size of bubble reflects sector Gross Value Added in 2011
6
industrial relations deliver the right balance between development and other social good, and that regulators provide maximum clarity, certainty, and speed to companies while fulfilling their mandates.
2. Resource rider sectors: Improve efficiency, especially in utilities. Resource riders, such as transport and professional services, have grown rapidly because of their links with the mining and energy boom, but at the same time, they have experienced a decline in productivity. These sectors attracted the vast majority of the overall economy’s increase in labour from 2005 to 2011, but the contribution of labour productivity to sector output fell to virtually zero during this period. This stagnation is especially notable because it occurred in spite of 37 percent growth in net capital stock between 2005 and 2011. Finding new ways to make infrastructure development more cost-efficient and adopting a more integrated cross-sector approach to resource productivity that can reduce the need for expensive new infrastructure will be crucial.
3. Local services: Recommit to microeconomic reform. Sectors such as retail trade and telecommunications have been largely unaffected by the resources boom and have posted solid productivity growth (albeit with gaps to international benchmarks). This cluster contributed A$49 billion to income growth in 2005 to 2011. But there is room for further gains, given the average productivity gap of A$32 per hour with the equivalent US sectors from 2005 to 2010. MGI research shows that new operating models within individual companies and sectors (automating supply chains, for example) can boost productivity, as can actions by governments to streamline regulation, encourage innovation, and promote competitive markets. To close the gap, Australia needs to re-embrace the cause of microeconomic reform that drove growth in the 1990s.
4. Manufacturing: Build the foundation for long-term competitiveness. Like other developed economies, Australia has experienced a long-term erosion in manufacturing output and employment. Capital productivity has fallen significantly over the past six years and has been only partly offset by gains in labour productivity. But the decline has not been uniform across all subsectors. Unsurprisingly, the subsectors facing the greatest threat from low-cost overseas producers have posted the greatest job losses and the greatest productivity increases. At the same time, productivity growth in more innovative manufacturing sectors has lagged below international benchmarks. Improvement will depend on three factors: further cost efficiencies in those subsectors that compete primarily on price (with a particular focus on the neglected area of management quality); higher labour mobility within the manufacturing sector; and a more supportive ecosystem for innovative manufacturing (the area in which Australia has the best long-term potential to be competitive).
Successful action along these lines could deliver additional national income of up to A$90 billion a year over and above a business-as-usual scenario by 2017.

7Beyond the boom: Australia’s productivity imperativeMcKinsey Global Institute
* * *
Thanks to the resources boom, Australia has had strong growth but has also been able to avoid confronting some deteriorating fundamental trends, a luxury that it cannot afford indefinitely. This report describes both the challenge now facing the economy and the size of the prize if productivity is improved. We hope it will also contribute to a constructive debate on the best way to capture that prize and build a more balanced, resilient Australian economy.
8
Australia has been largely immune from the high unemployment, sluggish growth, and banking woes that plague other developed economies. It now ranks sixth among OECD nations in GDP per capita, a huge gain from its 16th-place standing in 1990. In terms of income per head, Australia overtook the United States in 2005.
The world’s leading exporter of coal and iron ore, Australia is also a major source of minerals such as bauxite, alumina, lead, uranium, and zinc. In addition, the presence of huge reserves and the development of coal seam gas have raised hopes that Australia will soon become a leading global supplier of natural gas. Investment has flooded into the booming resource sectors.
Below the headline figures, however, lurk some worrying trends. Since 2005, income has risen 4.1 percent per year, a pace consistent with recent history.4 But that growth has been due to Australia’s ability to capitalise on its natural endowments of resources at a time of soaring demand from Asia’s emerging economies. If not for extremely positive terms of trade and high capital investment, both of which are temporary factors, income growth would have been only half as strong—coming in well below its historical rate. Productivity, the traditional driver of growth, has been weakening to the tune of 0.7 percent a year.
OVER THE LAST TWO DECADES, PRODUCTIVITY HAS BEEN ECLIPSED AS THE DRIVER OF GROWTH
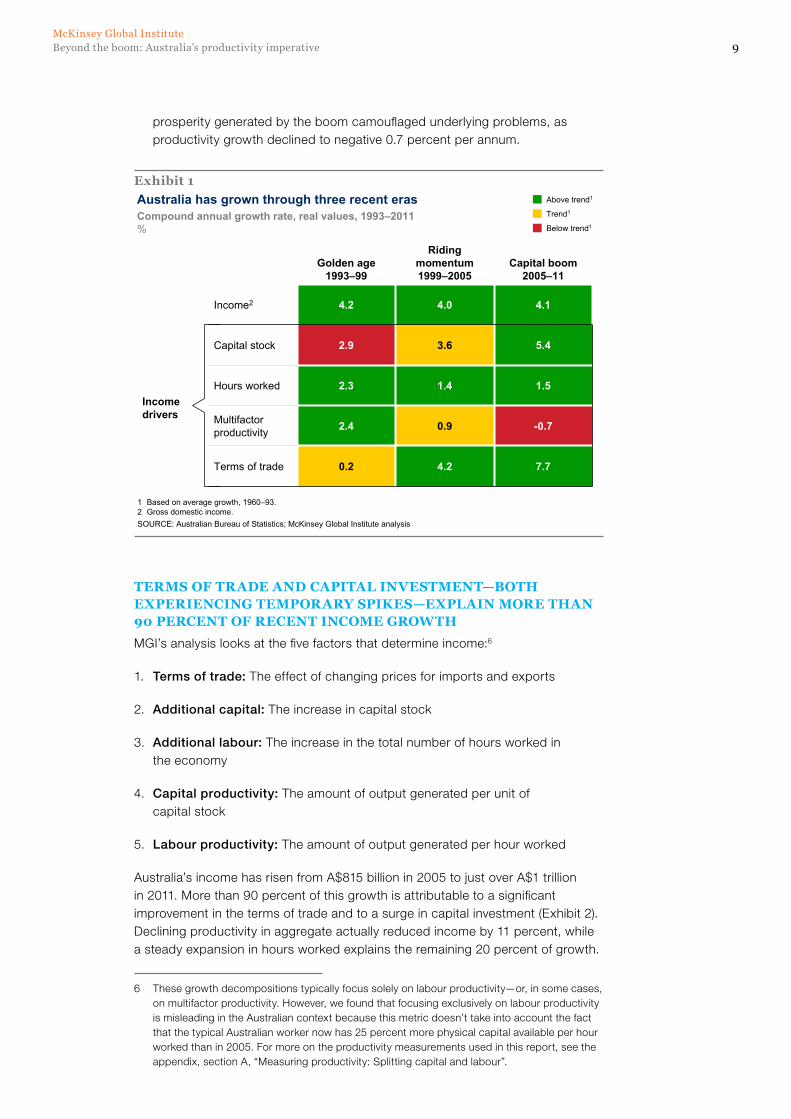
Australia has enjoyed two decades of brisk income growth. This time frame spans three distinct periods marked by shifts in the dominant contributors that produced a 4 percent annual growth rate (Exhibit 1).5
� “Golden age.” Between 1993 and 1999, Australia reaped the dividends from major economic reforms begun in the 1980s, including floating the dollar, liberalising banks, dismantling wage fixing, reducing tariffs, and granting independence to the central bank. Supported by these reforms, multifactor productivity growth increased at an impressive annual rate of 2.4 percent.
� “Riding momentum.” The years from 1999 to 2005 saw a slower pace of economic reform and productivity growth decelerating to 0.9 percent. But the terms of trade began to improve, helping to bridge the resulting income gap. This era was characterised by all income factors reverting to roughly their trend levels.
� “Capital boom.” A remarkable surge in investment and the terms of trade became the engines of Australia’s growth from 2005 to 2011. But the
4 This paper uses a measure of income called gross domestic income (GDI). GDI includes the terms of trade and is thus a more complete measure of the economy’s well-being than more frequently used measures of production (e.g., GDP, GVA).
5 For detail, see the appendix, section D, “Measuring Australia’s income”.
1. The shifting drivers of income growth
9Beyond the boom: Australia’s productivity imperativeMcKinsey Global Institute
prosperity generated by the boom camouflaged underlying problems, as productivity growth declined to negative 0.7 percent per annum.
TERMS OF TRADE AND CAPITAL INVESTMENT—BOTH EXPERIENCING TEMPORARY SPIKES—EXPLAIN MORE THAN 90 PERCENT OF RECENT INCOME GROWTH
MGI’s analysis looks at the five factors that determine income:6
1. Terms of trade: The effect of changing prices for imports and exports
2. Additional capital: The increase in capital stock
3. Additional labour: The increase in the total number of hours worked in the economy
4. Capital productivity: The amount of output generated per unit of capital stock
5. Labour productivity: The amount of output generated per hour worked
Australia’s income has risen from A$815 billion in 2005 to just over A$1 trillion in 2011. More than 90 percent of this growth is attributable to a significant improvement in the terms of trade and to a surge in capital investment (Exhibit 2). Declining productivity in aggregate actually reduced income by 11 percent, while a steady expansion in hours worked explains the remaining 20 percent of growth.
6 These growth decompositions typically focus solely on labour productivity—or, in some cases, on multifactor productivity. However, we found that focusing exclusively on labour productivity is misleading in the Australian context because this metric doesn’t take into account the fact that the typical Australian worker now has 25 percent more physical capital available per hour worked than in 2005. For more on the productivity measurements used in this report, see the appendix, section A, “Measuring productivity: Splitting capital and labour”.
Exhibit 1Australia has grown through three recent eras
SOURCE: Australian Bureau of Statistics; McKinsey Global Institute analysis
Compound annual growth rate, real values, 1993–2011%
1 Based on average growth, 1960–93. 2 Gross domestic income.
Above trend1
Trend1
Below trend1
Golden age 1993–99
Riding momentum 1999–2005
Capital boom 2005–11
Income2 4.2 4.0 4.1
Capital stock 2.9 3.6 5.4
Hours worked 2.3 1.4 1.5
Multifactor productivity 2.4 0.9 -0.7
Terms of trade 0.2 4.2 7.7
Income drivers
10
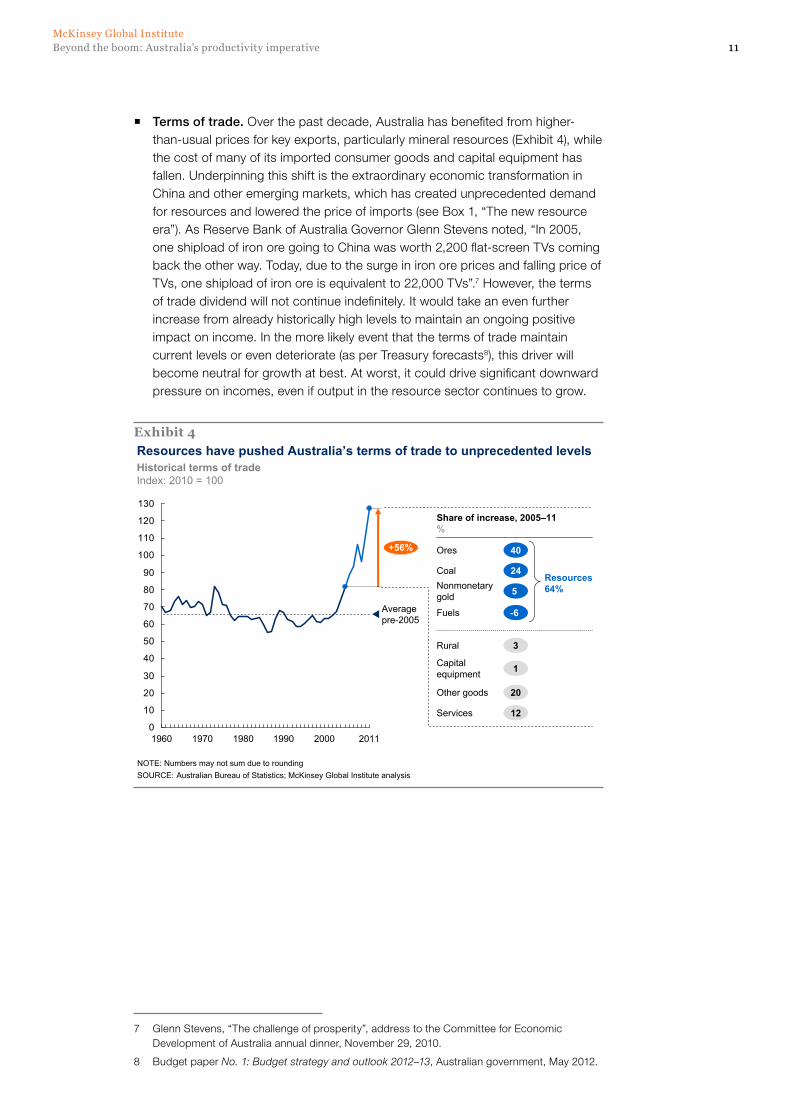
The contributors to income growth have changed significantly since 1993 (Exhibit 3). While labour growth was one steady trend during all three periods, capital and labour productivity together caused a negative A$108 billion swing in income between the golden age (1993–99) and the recent capital boom era (2005–11). In the golden age, capital and labour productivity accounted for A$82 billion of income; during the capital boom, they caused an A$26 billion deterioration (labour productivity slowed to make a weak but still slightly positive contribution, while capital productivity became an actual drag on income). The two major accelerators of growth have been the terms of trade and capital, which together explain an A$188 billion swing in income between the periods 1993–99 and 2005–11.
Exhibit 2New capital and terms of trade have driven income growth since 2005Gross domestic income (GDI), market sectors, 2005–11 A$ billion, real 2010
SOURCE: Australian Bureau of Statistics; McKinsey Global Institute analysis
2011 income
1,042
Labour productivity
17
Capital productivity
-43
Additional labour
46
Additional capital
120
Terms of trade
87
2005 income
815
38 53 20 -19 8Share of income growth%
Exhibit 3Productivity performance is weaker than in previous eras
17
-40
-68
+2
+85
Labour productivity
43
57
Capital productivity
-43
1325
Additional labour
4636
44
Additional capital
120
59
35
Terms of trade
87
+10332
-16
Contribution to growth in GDI, market sectorsA$ billion, real 2010
SOURCE: Australian Bureau of Statistics; McKinsey Global Institute analysis
Golden age1993–99
Riding momentum1999–2005
Capital boom2005–11
11Beyond the boom: Australia’s productivity imperativeMcKinsey Global Institute
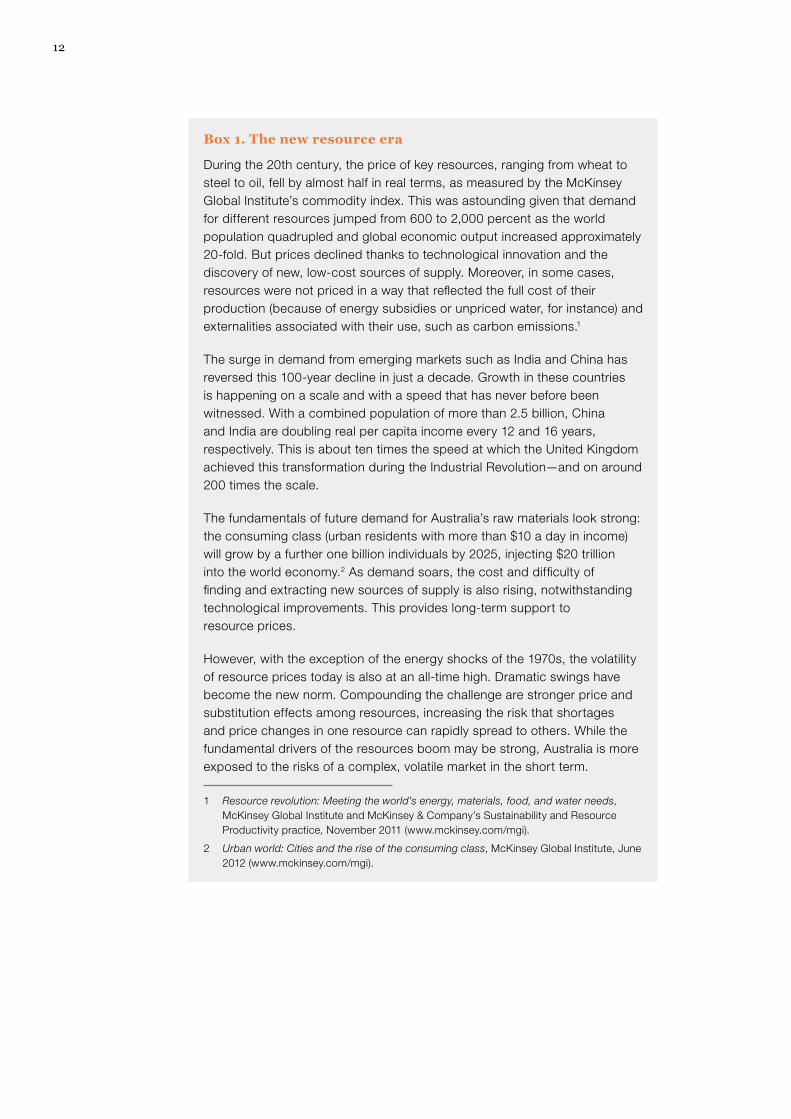
� Terms of trade. Over the past decade, Australia has benefited from higher-than-usual prices for key exports, particularly mineral resources (Exhibit 4), while the cost of many of its imported consumer goods and capital equipment has fallen. Underpinning this shift is the extraordinary economic transformation in China and other emerging markets, which has created unprecedented demand for resources and lowered the price of imports (see Box 1, “The new resource era”). As Reserve Bank of Australia Governor Glenn Stevens noted, “In 2005, one shipload of iron ore going to China was worth 2,200 flat-screen TVs coming back the other way. Today, due to the surge in iron ore prices and falling price of TVs, one shipload of iron ore is equivalent to 22,000 TVs”.7 However, the terms of trade dividend will not continue indefinitely. It would take an even further increase from already historically high levels to maintain an ongoing positive impact on income. In the more likely event that the terms of trade maintain current levels or even deteriorate (as per Treasury forecasts8), this driver will become neutral for growth at best. At worst, it could drive significant downward pressure on incomes, even if output in the resource sector continues to grow.
7 Glenn Stevens, “The challenge of prosperity”, address to the Committee for Economic Development of Australia annual dinner, November 29, 2010.
8 Budget paper No. 1: Budget strategy and outlook 2012–13, Australian government, May 2012.
Exhibit 4Resources have pushed Australia’s terms of trade to unprecedented levels Historical terms of tradeIndex: 2010 = 100
SOURCE: Australian Bureau of Statistics; McKinsey Global Institute analysis
Share of increase, 2005–11%
40 Ores
24 Coal
5 Nonmonetary gold
-6Fuels
3 Rural
1 Capital equipment
20 Other goods
Services 12
Resources64%
0
10
20
30
40
50
60
70
80
90
100
110
120
130
Averagepre-2005
+56%
201120001990198019701960
NOTE: Numbers may not sum due to rounding
12
Box 1. The new resource era
During the 20th century, the price of key resources, ranging from wheat to steel to oil, fell by almost half in real terms, as measured by the McKinsey Global Institute’s commodity index. This was astounding given that demand for different resources jumped from 600 to 2,000 percent as the world population quadrupled and global economic output increased approximately 20-fold. But prices declined thanks to technological innovation and the discovery of new, low-cost sources of supply. Moreover, in some cases, resources were not priced in a way that reflected the full cost of their production (because of energy subsidies or unpriced water, for instance) and externalities associated with their use, such as carbon emissions.1
The surge in demand from emerging markets such as India and China has reversed this 100-year decline in just a decade. Growth in these countries is happening on a scale and with a speed that has never before been witnessed. With a combined population of more than 2.5 billion, China and India are doubling real per capita income every 12 and 16 years, respectively. This is about ten times the speed at which the United Kingdom achieved this transformation during the Industrial Revolution—and on around 200 times the scale.
The fundamentals of future demand for Australia’s raw materials look strong: the consuming class (urban residents with more than $10 a day in income) will grow by a further one billion individuals by 2025, injecting $20 trillion into the world economy.2 As demand soars, the cost and difficulty of finding and extracting new sources of supply is also rising, notwithstanding technological improvements. This provides long-term support to resource prices.
However, with the exception of the energy shocks of the 1970s, the volatility of resource prices today is also at an all-time high. Dramatic swings have become the new norm. Compounding the challenge are stronger price and substitution effects among resources, increasing the risk that shortages and price changes in one resource can rapidly spread to others. While the fundamental drivers of the resources boom may be strong, Australia is more exposed to the risks of a complex, volatile market in the short term.
1 Resource revolution: Meeting the world’s energy, materials, food, and water needs, McKinsey Global Institute and McKinsey & Company’s Sustainability and Resource Productivity practice, November 2011 (www.mckinsey.com/mgi).
2 Urban world: Cities and the rise of the consuming class, McKinsey Global Institute, June 2012 (www.mckinsey.com/mgi).
13Beyond the boom: Australia’s productivity imperativeMcKinsey Global Institute
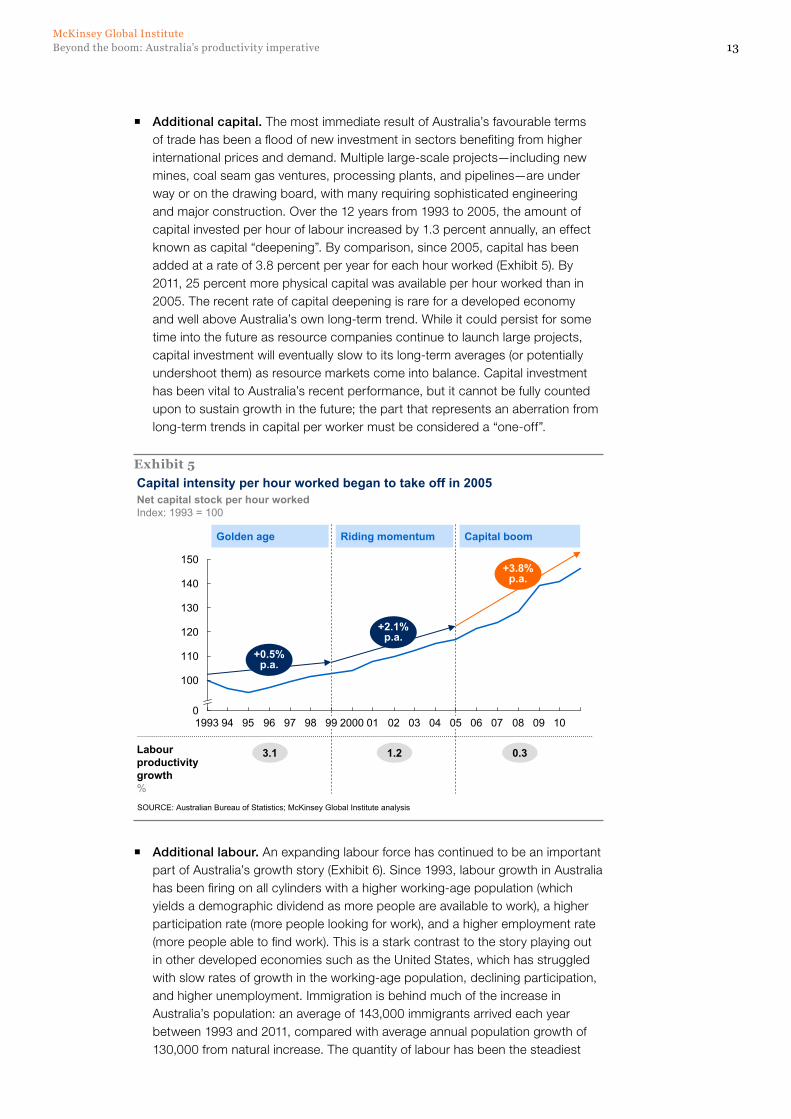
� Additional capital. The most immediate result of Australia’s favourable terms of trade has been a flood of new investment in sectors benefiting from higher international prices and demand. Multiple large-scale projects—including new mines, coal seam gas ventures, processing plants, and pipelines—are under way or on the drawing board, with many requiring sophisticated engineering and major construction. Over the 12 years from 1993 to 2005, the amount of capital invested per hour of labour increased by 1.3 percent annually, an effect known as capital “deepening”. By comparison, since 2005, capital has been added at a rate of 3.8 percent per year for each hour worked (Exhibit 5). By 2011, 25 percent more physical capital was available per hour worked than in 2005. The recent rate of capital deepening is rare for a developed economy and well above Australia’s own long-term trend. While it could persist for some time into the future as resource companies continue to launch large projects, capital investment will eventually slow to its long-term averages (or potentially undershoot them) as resource markets come into balance. Capital investment has been vital to Australia’s recent performance, but it cannot be fully counted upon to sustain growth in the future; the part that represents an aberration from long-term trends in capital per worker must be considered a “one-off”.
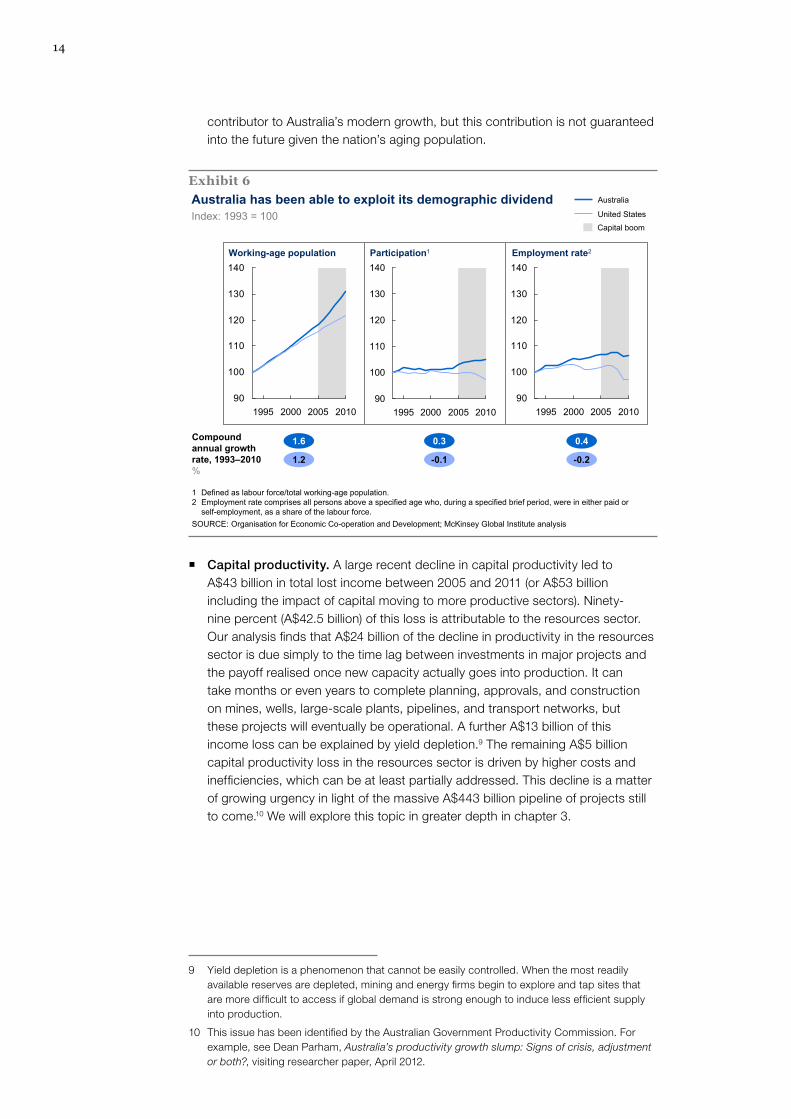
� Additional labour. An expanding labour force has continued to be an important part of Australia’s growth story (Exhibit 6). Since 1993, labour growth in Australia has been firing on all cylinders with a higher working-age population (which yields a demographic dividend as more people are available to work), a higher participation rate (more people looking for work), and a higher employment rate (more people able to find work). This is a stark contrast to the story playing out in other developed economies such as the United States, which has struggled with slow rates of growth in the working-age population, declining participation, and higher unemployment. Immigration is behind much of the increase in Australia’s population: an average of 143,000 immigrants arrived each year between 1993 and 2011, compared with average annual population growth of 130,000 from natural increase. The quantity of labour has been the steadiest
Exhibit 5Capital intensity per hour worked began to take off in 2005Net capital stock per hour workedIndex: 1993 = 100
SOURCE: Australian Bureau of Statistics; McKinsey Global Institute analysis
3.1 1.2 0.3
Golden age Riding momentum Capital boom
Labour productivity growth%
+3.8% p.a.
+2.1% p.a.
+0.5% p.a.
150
140
130
120
110
100
009080706050403020120009998979695941993 10
14
contributor to Australia’s modern growth, but this contribution is not guaranteed into the future given the nation’s aging population.
� Capital productivity. A large recent decline in capital productivity led to A$43 billion in total lost income between 2005 and 2011 (or A$53 billion including the impact of capital moving to more productive sectors). Ninety-nine percent (A$42.5 billion) of this loss is attributable to the resources sector. Our analysis finds that A$24 billion of the decline in productivity in the resources sector is due simply to the time lag between investments in major projects and the payoff realised once new capacity actually goes into production. It can take months or even years to complete planning, approvals, and construction on mines, wells, large-scale plants, pipelines, and transport networks, but these projects will eventually be operational. A further A$13 billion of this income loss can be explained by yield depletion.9 The remaining A$5 billion capital productivity loss in the resources sector is driven by higher costs and inefficiencies, which can be at least partially addressed. This decline is a matter of growing urgency in light of the massive A$443 billion pipeline of projects still to come.10 We will explore this topic in greater depth in chapter 3.
9 Yield depletion is a phenomenon that cannot be easily controlled. When the most readily available reserves are depleted, mining and energy firms begin to explore and tap sites that are more difficult to access if global demand is strong enough to induce less efficient supply into production.
10 This issue has been identified by the Australian Government Productivity Commission. For example, see Dean Parham, Australia’s productivity growth slump: Signs of crisis, adjustment or both?, visiting researcher paper, April 2012.
Exhibit 6
Working-age population Participation1 Employment rate2
Australia has been able to exploit its demographic dividend
SOURCE: Organisation for Economic Co-operation and Development; McKinsey Global Institute analysis
Index: 1993 = 100
1 Defined as labour force/total working-age population.2 Employment rate comprises all persons above a specified age who, during a specified brief period, were in either paid or
self-employment, as a share of the labour force.
1.6
1.2
0.3
-0.1
0.4
-0.2
Compound annual growth rate, 1993–2010%
Capital boom
Australia
United States
90
100
110
120
130
140
201020052000199590
2010200520001995
130
120
110
100
140
90
100
110
120
130
140
200520001995 2010
15Beyond the boom: Australia’s productivity imperativeMcKinsey Global Institute
� Labour productivity. Labour productivity improvements added A$17 billion to income over the past six years. Although this is a positive contribution, it is weak when compared with the A$57 billion it generated in 1993–99 and the A$43 billion it contributed in 1999–2005. It is especially surprising considering that each worker finished 2011 backed by 25 percent more capital than in 2005 but producing only 7 percent more output. Restoring labour productivity to its role as the primary driver of income growth is critical to ongoing prosperity.
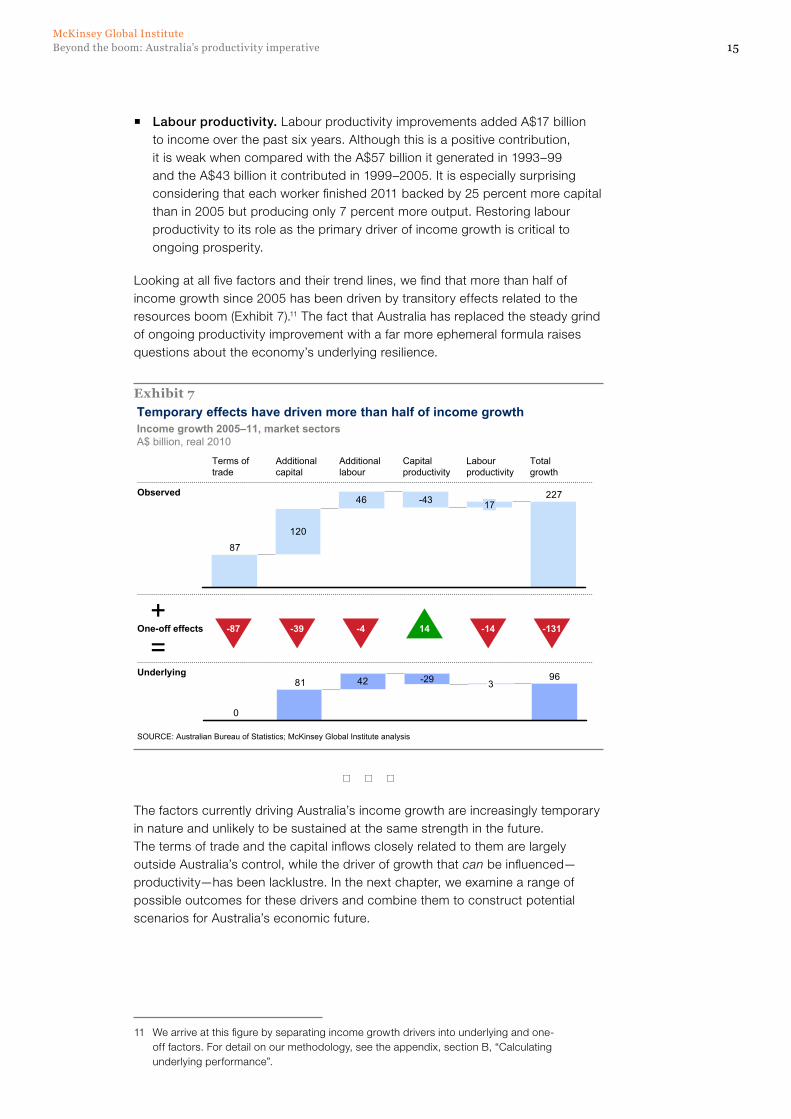
Looking at all five factors and their trend lines, we find that more than half of income growth since 2005 has been driven by transitory effects related to the resources boom (Exhibit 7).11 The fact that Australia has replaced the steady grind of ongoing productivity improvement with a far more ephemeral formula raises questions about the economy’s underlying resilience.
* * *
The factors currently driving Australia’s income growth are increasingly temporary in nature and unlikely to be sustained at the same strength in the future. The terms of trade and the capital inflows closely related to them are largely outside Australia’s control, while the driver of growth that can be influenced—productivity—has been lacklustre. In the next chapter, we examine a range of possible outcomes for these drivers and combine them to construct potential scenarios for Australia’s economic future.
11 We arrive at this figure by separating income growth drivers into underlying and one-off factors. For detail on our methodology, see the appendix, section B, “Calculating underlying performance”.
Exhibit 7Temporary effects have driven more than half of income growth
Observed
Underlying
120
46 227
87
17-43
42 9681
0
3-29
Income growth 2005–11, market sectorsA$ billion, real 2010
SOURCE: Australian Bureau of Statistics; McKinsey Global Institute analysis
One-off effects+=
Terms of trade
Additional capital
Additional labour
Capital productivity
Labour productivity
Total growth
-87 -39 -4 14 -14 -131
16
There is no guarantee that Australia’s recent pace of income growth will continue. Indeed, our analysis finds that slower growth is likely unavoidable. The key questions that will determine the severity of a potential slowdown are how long the resources boom is likely to last and whether the nation can reverse recent declines in productivity.
In this chapter, we will discuss likely high and low outcomes for both of these factors and combine them into four “what-if” scenarios to estimate a range of potential impacts on growth in Australia’s gross domestic income (GDI). Our findings indicate that as the effects of the resources boom moderate, Australia can create a much softer landing by boosting productivity.
AUSTRALIA’S FUTURE HINGES ON TWO MAjOR UNCERTAINTIES
Australia’s growth prospects depend on four of the five key drivers discussed in chapter 1: two related to the resources boom (terms of trade and capital investment) and two related to productivity (capital productivity and labour productivity). The fifth driver, growth in labour, has stayed within a relatively narrow band in comparison with the other more variable drivers and therefore does not have such a large effect on shaping our scenarios.
We can consolidate our perspective on the future around two critical questions:
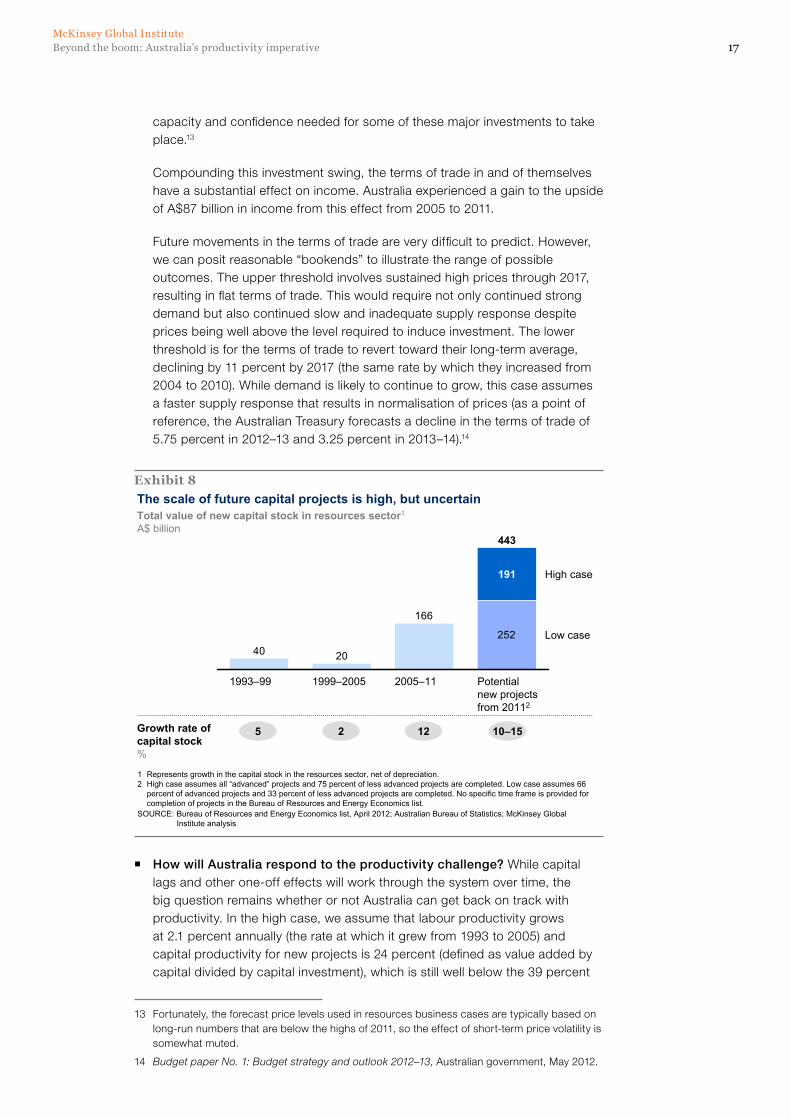
� How long will the boom last? Terms of trade and capital investment are inextricably linked to the duration of booming demand conditions. MGI’s analysis of the investment pipeline tracked by the Bureau of Resources and Energy Economics (BREE) suggests that even in the low case, Australia will still experience continued record investment in the short term.12 In fact, Australia is less than halfway through the investment boom: A$166 billion has been added so far, and at least A$252 billion more is yet to come. These numbers are even more striking given the fact that they include only projects currently identified by BREE. But a huge variation exists between the low case and the high case, which sees capital investment boosted by an additional A$191 billion (Exhibit 8)—and the difference has a major impact on future income growth. Investors’ decisions on whether to deploy that additional A$191 billion will be determined by the terms of trade (a sharp decline in resource prices would render some capital projects still in the planning stages unprofitable, leading to delays or cancellations) as well as the cost competitiveness of Australian projects compared with alternative investments overseas. Moreover, lower terms of trade reduce cash flow and therefore the
12 Mining industry major projects, Australian Government Bureau of Resources and Energy Economics, April 2012. Projects in the pipeline are characterised as either advanced or less advanced. Oil and gas projects are the major focus of investment for advanced projects, accounting for 69 percent of total project value, while iron ore is 10 percent, infrastructure 9 percent, coal 7 percent, and other commodities 5 percent.
2. Australia’s future income growth: Hard fall or soft landing?
17Beyond the boom: Australia’s productivity imperativeMcKinsey Global Institute
capacity and confidence needed for some of these major investments to take place.13
Compounding this investment swing, the terms of trade in and of themselves have a substantial effect on income. Australia experienced a gain to the upside of A$87 billion in income from this effect from 2005 to 2011.
Future movements in the terms of trade are very difficult to predict. However, we can posit reasonable “bookends” to illustrate the range of possible outcomes. The upper threshold involves sustained high prices through 2017, resulting in flat terms of trade. This would require not only continued strong demand but also continued slow and inadequate supply response despite prices being well above the level required to induce investment. The lower threshold is for the terms of trade to revert toward their long-term average, declining by 11 percent by 2017 (the same rate by which they increased from 2004 to 2010). While demand is likely to continue to grow, this case assumes a faster supply response that results in normalisation of prices (as a point of reference, the Australian Treasury forecasts a decline in the terms of trade of 5.75 percent in 2012–13 and 3.25 percent in 2013–14).14
� How will Australia respond to the productivity challenge? While capital lags and other one-off effects will work through the system over time, the big question remains whether or not Australia can get back on track with productivity. In the high case, we assume that labour productivity grows at 2.1 percent annually (the rate at which it grew from 1993 to 2005) and capital productivity for new projects is 24 percent (defined as value added by capital divided by capital investment), which is still well below the 39 percent
13 Fortunately, the forecast price levels used in resources business cases are typically based on long-run numbers that are below the highs of 2011, so the effect of short-term price volatility is somewhat muted.
14 Budget paper No. 1: Budget strategy and outlook 2012–13, Australian government, May 2012.
Exhibit 8The scale of future capital projects is high, but uncertain
252
166
2040Low case
High case
Potential new projects from 20112
443
191
2005–111999–20051993–99
Total value of new capital stock in resources sector1
A$ billion
SOURCE: Bureau of Resources and Energy Economics list, April 2012; Australian Bureau of Statistics; McKinsey Global Institute analysis
1 Represents growth in the capital stock in the resources sector, net of depreciation.2 High case assumes all “advanced” projects and 75 percent of less advanced projects are completed. Low case assumes 66
percent of advanced projects and 33 percent of less advanced projects are completed. No specific time frame is provided for completion of projects in the Bureau of Resources and Energy Economics list.
5Growth rate of capital stock%
2 12 10–15
18
productivity achieved during 1993–99 because of yield decline. In the low case, we assume 0.3 percent annual growth in labour productivity (the rate from 2005 to 2011) and capital productivity for new projects is 16 percent (the current level of capital return). Australia’s ability to boost productivity will directly affect its future income: The analysis shows that restoring both labour and capital productivity to their historic long-run performance trajectory under a high terms of trade scenario could result in A$90 billion in additional income per year by 2017.
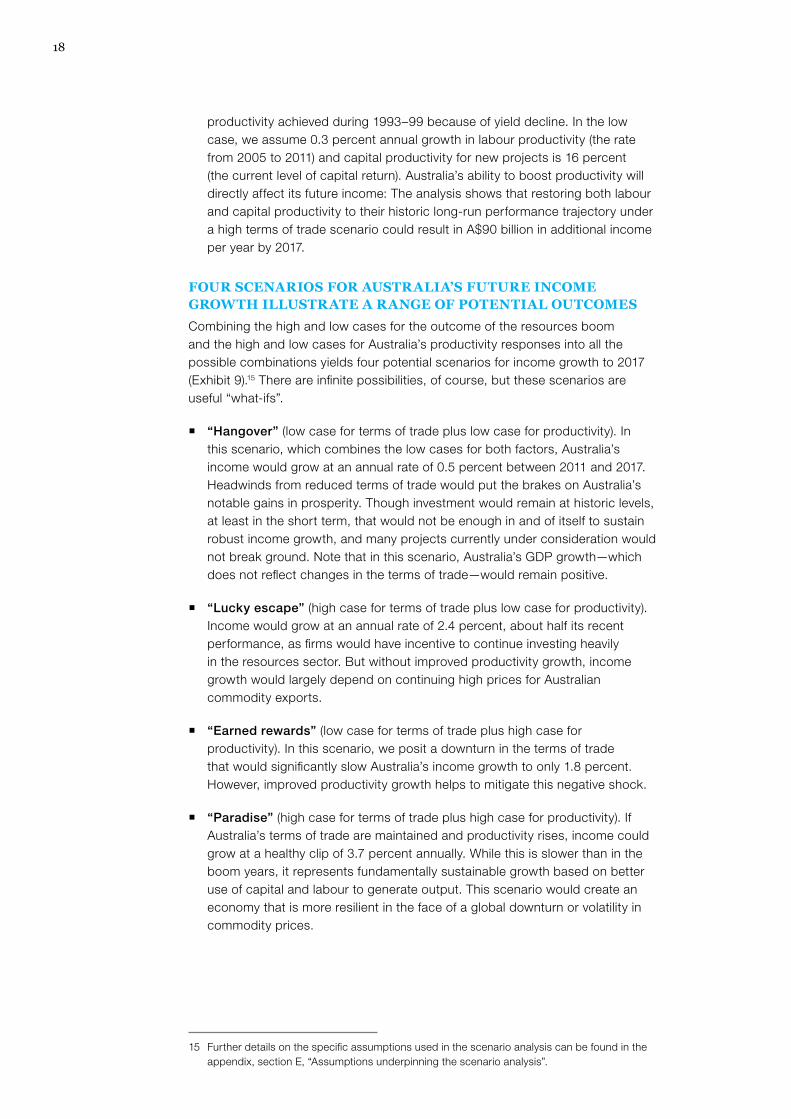
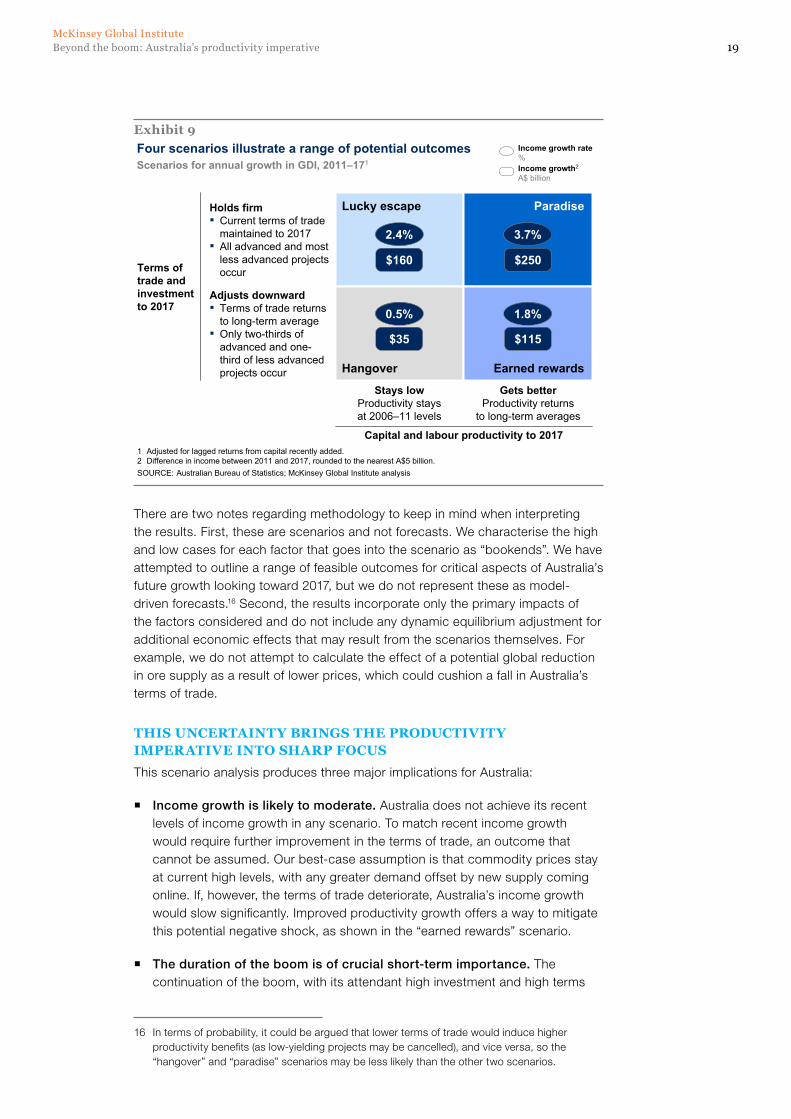
FOUR SCENARIOS FOR AUSTRALIA’S FUTURE INCOME GROWTH ILLUSTRATE A RANGE OF POTENTIAL OUTCOMES
Combining the high and low cases for the outcome of the resources boom and the high and low cases for Australia’s productivity responses into all the possible combinations yields four potential scenarios for income growth to 2017 (Exhibit 9).15 There are infinite possibilities, of course, but these scenarios are useful “what-ifs”.
� “Hangover” (low case for terms of trade plus low case for productivity). In this scenario, which combines the low cases for both factors, Australia’s income would grow at an annual rate of 0.5 percent between 2011 and 2017. Headwinds from reduced terms of trade would put the brakes on Australia’s notable gains in prosperity. Though investment would remain at historic levels, at least in the short term, that would not be enough in and of itself to sustain robust income growth, and many projects currently under consideration would not break ground. Note that in this scenario, Australia’s GDP growth—which does not reflect changes in the terms of trade—would remain positive.
� “Lucky escape” (high case for terms of trade plus low case for productivity). Income would grow at an annual rate of 2.4 percent, about half its recent performance, as firms would have incentive to continue investing heavily in the resources sector. But without improved productivity growth, income growth would largely depend on continuing high prices for Australian commodity exports.
� “Earned rewards” (low case for terms of trade plus high case for productivity). In this scenario, we posit a downturn in the terms of trade that would significantly slow Australia’s income growth to only 1.8 percent. However, improved productivity growth helps to mitigate this negative shock.
� “Paradise” (high case for terms of trade plus high case for productivity). If Australia’s terms of trade are maintained and productivity rises, income could grow at a healthy clip of 3.7 percent annually. While this is slower than in the boom years, it represents fundamentally sustainable growth based on better use of capital and labour to generate output. This scenario would create an economy that is more resilient in the face of a global downturn or volatility in commodity prices.
15 Further details on the specific assumptions used in the scenario analysis can be found in the appendix, section E, “Assumptions underpinning the scenario analysis”.
19Beyond the boom: Australia’s productivity imperativeMcKinsey Global Institute
There are two notes regarding methodology to keep in mind when interpreting the results. First, these are scenarios and not forecasts. We characterise the high and low cases for each factor that goes into the scenario as “bookends”. We have attempted to outline a range of feasible outcomes for critical aspects of Australia’s future growth looking toward 2017, but we do not represent these as model-driven forecasts.16 Second, the results incorporate only the primary impacts of the factors considered and do not include any dynamic equilibrium adjustment for additional economic effects that may result from the scenarios themselves. For example, we do not attempt to calculate the effect of a potential global reduction in ore supply as a result of lower prices, which could cushion a fall in Australia’s terms of trade.
THIS UNCERTAINTY BRINGS THE PRODUCTIVITY IMPERATIVE INTO SHARP FOCUS
This scenario analysis produces three major implications for Australia:
� Income growth is likely to moderate. Australia does not achieve its recent levels of income growth in any scenario. To match recent income growth would require further improvement in the terms of trade, an outcome that cannot be assumed. Our best-case assumption is that commodity prices stay at current high levels, with any greater demand offset by new supply coming online. If, however, the terms of trade deteriorate, Australia’s income growth would slow significantly. Improved productivity growth offers a way to mitigate this potential negative shock, as shown in the “earned rewards” scenario.
� The duration of the boom is of crucial short-term importance. The continuation of the boom, with its attendant high investment and high terms
16 In terms of probability, it could be argued that lower terms of trade would induce higher productivity benefits (as low-yielding projects may be cancelled), and vice versa, so the “hangover” and “paradise” scenarios may be less likely than the other two scenarios.
Exhibit 9Four scenarios illustrate a range of potential outcomes
SOURCE: Australian Bureau of Statistics; McKinsey Global Institute analysis
Scenarios for annual growth in GDI, 2011–171
1 Adjusted for lagged returns from capital recently added.2 Difference in income between 2011 and 2017, rounded to the nearest A$5 billion.
Stays lowProductivity stays at 2006–11 levels
Gets betterProductivity returns
to long-term averages
Capital and labour productivity to 2017
Holds firm▪ Current terms of trade
maintained to 2017▪ All advanced and most
less advanced projects occur
Adjusts downward▪ Terms of trade returns
to long-term average▪ Only two-thirds of
advanced and one-third of less advanced projects occur
Terms of trade and investment to 2017
Lucky escape Paradise
Hangover Earned rewards
Income growth rate%Income growth2
A$ billion
2.4% 3.7%
$160 $250
0.5% 1.8%
$35 $115
20
of trade, makes a bigger difference to income growth than does productivity between now and 2017. The difference between the high and low cases for terms of trade and investment is a 1.9 percent swing in annual income growth, or up to A$135 billion of income per year at risk by 2017. Restoring productivity growth to its longer-term average makes a 1.3 percent difference, delivering up to A$90 billion in 2017 income.
� But productivity is critical for longer-term prosperity. Because the intensity and duration of the resources boom cannot be controlled, boosting productivity is Australia’s central challenge. Improving productivity growth is by no means easy, but this change could be set in motion by any number of forces, including international competition in sectors that are able to respond, a return to normal terms of trade that shifts capital and labour to more productive sectors, or a renewed focus by firms and government on innovation and improvement.
* * *
The degree to which Australia can boost productivity will have a major impact on future income growth. Capturing the full growth potential will require a forensic understanding of the dynamics and challenges in different sectors of the economy. In the next chapter, we take a sector-by-sector look at the issues affecting productivity performance.
Beyond the boom: Australia’s productivity imperativeMcKinsey Global Institute
21
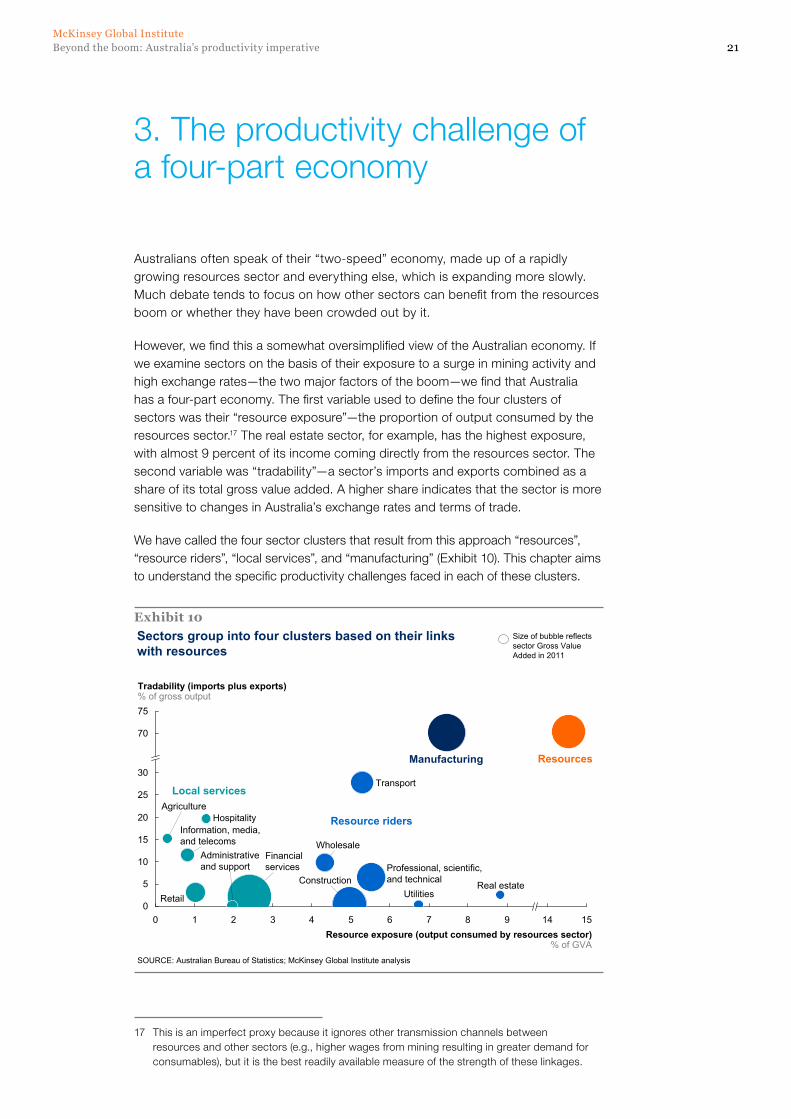
Australians often speak of their “two-speed” economy, made up of a rapidly growing resources sector and everything else, which is expanding more slowly. Much debate tends to focus on how other sectors can benefit from the resources boom or whether they have been crowded out by it.
However, we find this a somewhat oversimplified view of the Australian economy. If we examine sectors on the basis of their exposure to a surge in mining activity and high exchange rates—the two major factors of the boom—we find that Australia has a four-part economy. The first variable used to define the four clusters of sectors was their “resource exposure”—the proportion of output consumed by the resources sector.17 The real estate sector, for example, has the highest exposure, with almost 9 percent of its income coming directly from the resources sector. The second variable was “tradability”—a sector’s imports and exports combined as a share of its total gross value added. A higher share indicates that the sector is more sensitive to changes in Australia’s exchange rates and terms of trade.
We have called the four sector clusters that result from this approach “resources”, “resource riders”, “local services”, and “manufacturing” (Exhibit 10). This chapter aims to understand the specific productivity challenges faced in each of these clusters.
17 This is an imperfect proxy because it ignores other transmission channels between resources and other sectors (e.g., higher wages from mining resulting in greater demand for consumables), but it is the best readily available measure of the strength of these linkages.
Exhibit 10
65
Tradability (imports plus exports)% of gross output75
70
30
25
20
15
10
5
0432
Real estate
Financialservices
Information, media,and telecoms
Transport
10Resource exposure (output consumed by resources sector)
% of GVA
1514
Hospitality
Retail
Professional, scientific,and technical
WholesaleAdministrativeand support
Utilities
Agriculture
987
Construction
Sectors group into four clusters based on their links with resources
SOURCE: Australian Bureau of Statistics; McKinsey Global Institute analysis
Local services
Resource riders
Manufacturing Resources
Size of bubble reflects sector Gross Value Added in 2011
3. The productivity challenge of a four-part economy
22
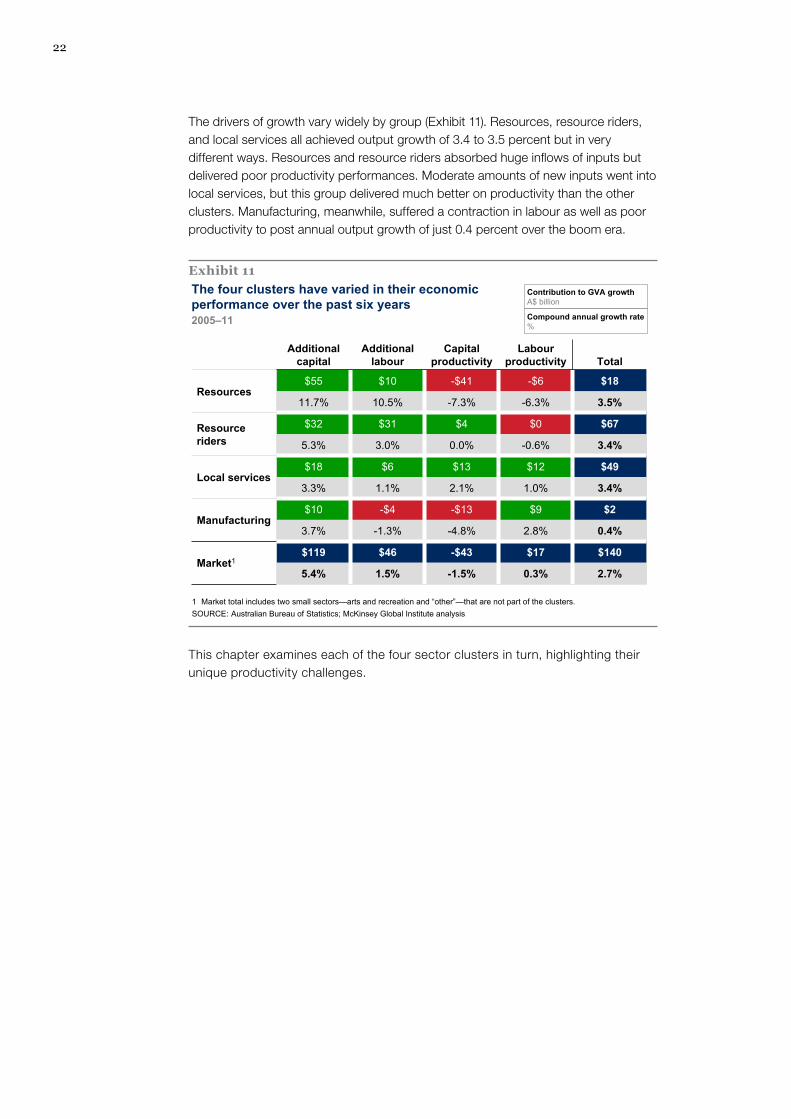
The drivers of growth vary widely by group (Exhibit 11). Resources, resource riders, and local services all achieved output growth of 3.4 to 3.5 percent but in very different ways. Resources and resource riders absorbed huge inflows of inputs but delivered poor productivity performances. Moderate amounts of new inputs went into local services, but this group delivered much better on productivity than the other clusters. Manufacturing, meanwhile, suffered a contraction in labour as well as poor productivity to post annual output growth of just 0.4 percent over the boom era.
This chapter examines each of the four sector clusters in turn, highlighting their unique productivity challenges.
Exhibit 11The four clusters have varied in their economicperformance over the past six years
SOURCE: Australian Bureau of Statistics; McKinsey Global Institute analysis
2005–11
1 Market total includes two small sectors—arts and recreation and “other”—that are not part of the clusters.
Contribution to GVA growthA$ billion
Compound annual growth rate%
Additional capital
Additional labour
Capital productivity
Labourproductivity Total
Resources$55 $10 -$41 -$6 $18
11.7% 10.5% -7.3% -6.3% 3.5%
Resource riders
$32 $31 $4 $0 $67
5.3% 3.0% 0.0% -0.6% 3.4%
Local services$18 $6 $13 $12 $49
3.3% 1.1% 2.1% 1.0% 3.4%
Manufacturing$10 -$4 -$13 $9 $2
3.7% -1.3% -4.8% 2.8% 0.4%
Market1$119 $46 -$43 $17 $140
5.4% 1.5% -1.5% 0.3% 2.7%
23Beyond the boom: Australia’s productivity imperativeMcKinsey Global Institute
RESOURCES: CAPITAL PRODUCTIVITY IS THE KEY CHALLENGE
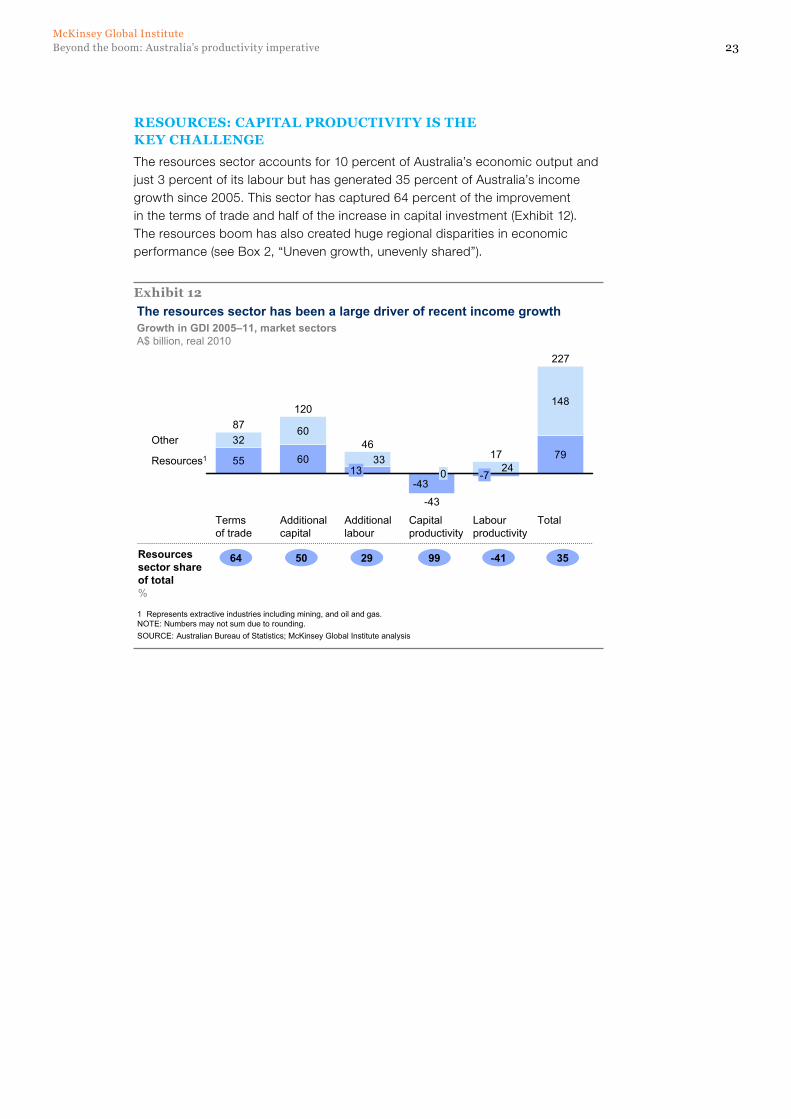
The resources sector accounts for 10 percent of Australia’s economic output and just 3 percent of its labour but has generated 35 percent of Australia’s income growth since 2005. This sector has captured 64 percent of the improvement in the terms of trade and half of the increase in capital investment (Exhibit 12). The resources boom has also created huge regional disparities in economic performance (see Box 2, “Uneven growth, unevenly shared”).
Exhibit 12The resources sector has been a large driver of recent income growth Growth in GDI 2005–11, market sectorsA$ billion, real 2010
SOURCE: Australian Bureau of Statistics; McKinsey Global Institute analysis
55 60 7932
60
148
-43
3324Resources1
Other
Total
227
Capital productivity
-43
0
Labour productivity
17
Additional labour
46
-713
Additional capital
120
Terms of trade
87
64 50 29 99 -41 35
1 Represents extractive industries including mining, and oil and gas.NOTE: Numbers may not sum due to rounding.
Resources sector share of total%
24
Box 2. Uneven growth, unevenly shared
One implication of the predominant role played by the resources industry in Australia’s growth has been the uneven distribution of economic activity across states. Whether viewed in terms of hours worked, capital invested, or final demand, Western Australia and Queensland have grown more quickly than their eastern seaboard counterparts.
Private capital investment in Western Australia grew at a remarkable 12.1 percent annually between 2005 and 2011, compared with just 2.4 percent in Victoria and 1.4 percent in New South Wales. Growth in labour was also higher in resource-rich states, though the differences were less marked: 2.8 percent in Western Australia and 2.3 percent in Queensland compared with 2.2 percent in Victoria and 1.4 percent in New South Wales.
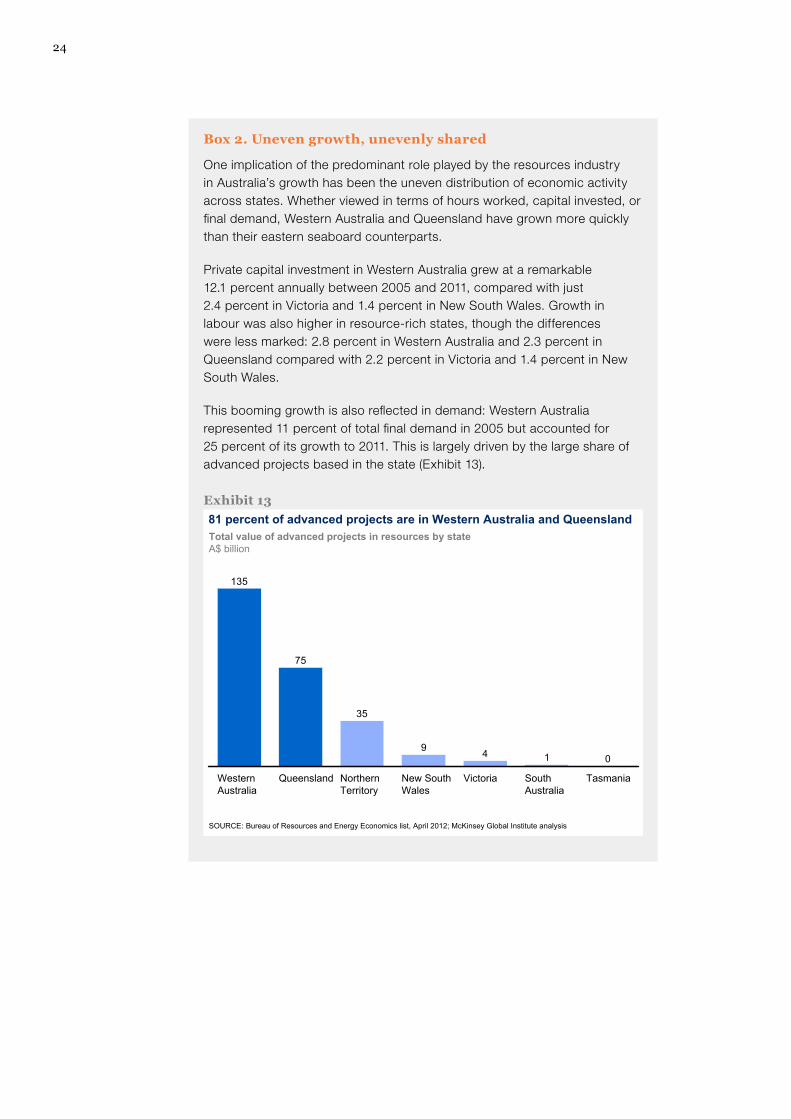
This booming growth is also reflected in demand: Western Australia represented 11 percent of total final demand in 2005 but accounted for 25 percent of its growth to 2011. This is largely driven by the large share of advanced projects based in the state (Exhibit 13).
Exhibit 1381 percent of advanced projects are in Western Australia and QueenslandTotal value of advanced projects in resources by stateA$ billion
SOURCE: Bureau of Resources and Energy Economics list, April 2012; McKinsey Global Institute analysis
0149
35
75
135
Northern Territory
TasmaniaNew South Wales
South Australia
VictoriaWestern Australia
Queensland
25Beyond the boom: Australia’s productivity imperativeMcKinsey Global Institute
However, while favourable terms of trade have provided strong momentum, they have also obscured a brewing problem: the sector accounts for around 99 percent of the national decline in capital productivity. This means that while resources have added significantly to Australia’s income since 2005, the number could have been much higher. More than 70 percent of the higher income generated by increased capital and labour has been swallowed up by lower productivity. Because the resources sector has become such an outsized driver of Australia’s economy, shoring up its flagging capital productivity is crucial to achieving sustained national income growth.
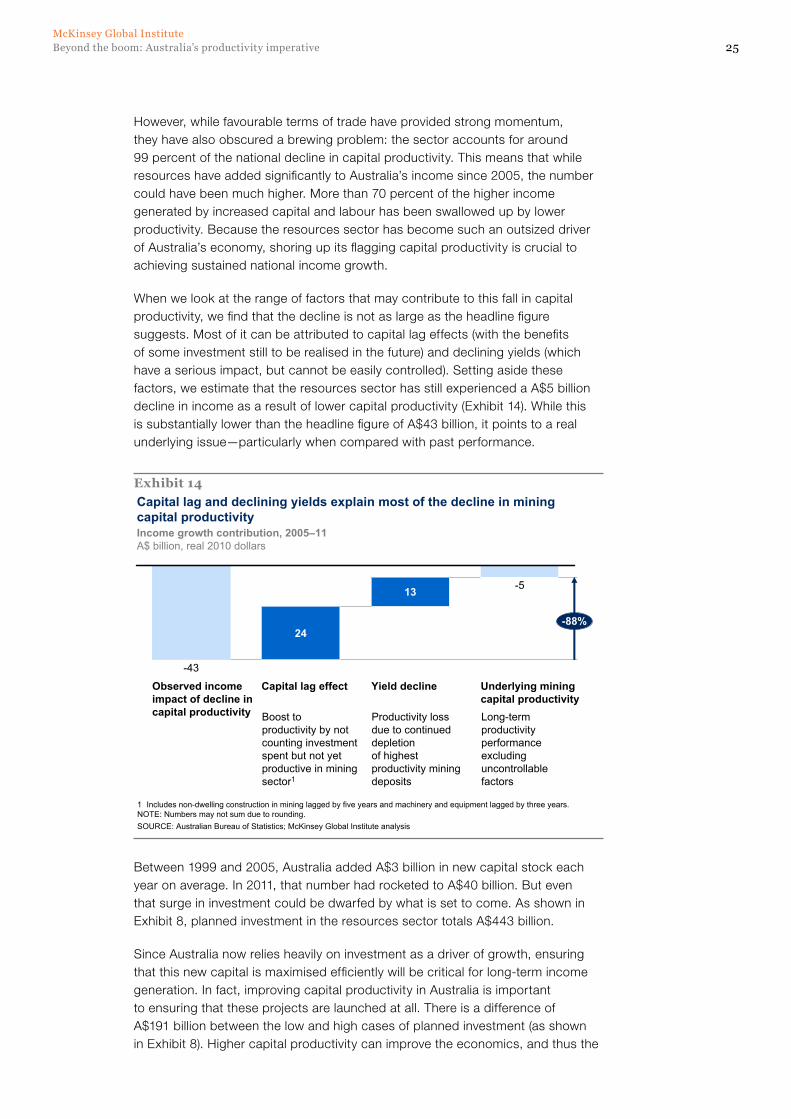
When we look at the range of factors that may contribute to this fall in capital productivity, we find that the decline is not as large as the headline figure suggests. Most of it can be attributed to capital lag effects (with the benefits of some investment still to be realised in the future) and declining yields (which have a serious impact, but cannot be easily controlled). Setting aside these factors, we estimate that the resources sector has still experienced a A$5 billion decline in income as a result of lower capital productivity (Exhibit 14). While this is substantially lower than the headline figure of A$43 billion, it points to a real underlying issue—particularly when compared with past performance.
Between 1999 and 2005, Australia added A$3 billion in new capital stock each year on average. In 2011, that number had rocketed to A$40 billion. But even that surge in investment could be dwarfed by what is set to come. As shown in Exhibit 8, planned investment in the resources sector totals A$443 billion.
Since Australia now relies heavily on investment as a driver of growth, ensuring that this new capital is maximised efficiently will be critical for long-term income generation. In fact, improving capital productivity in Australia is important to ensuring that these projects are launched at all. There is a difference of A$191 billion between the low and high cases of planned investment (as shown in Exhibit 8). Higher capital productivity can improve the economics, and thus the
Exhibit 14Capital lag and declining yields explain most of the decline in mining capital productivity
-5
-88%
Underlying mining capital productivity
Yield decline
13
Capital lag effect
24
Observed income impact of decline in capital productivity
-43
Income growth contribution, 2005–11A$ billion, real 2010 dollars
SOURCE: Australian Bureau of Statistics; McKinsey Global Institute analysis
Boost to productivity by not counting investment spent but not yet productive in mining sector1
Productivity loss due to continued depletion of highest productivity mining deposits
Long-term productivity performance excluding uncontrollable factors
1 Includes non-dwelling construction in mining lagged by five years and machinery and equipment lagged by three years.NOTE: Numbers may not sum due to rounding.
26
competitiveness, of Australian resource projects. This is particularly important if global demand growth slows. The investment pipeline has been amassed during an era of low interest rates and global liquidity. But in the long term, access to capital may prove more challenging. Past MGI research has found that while a three-decade decline in global investment helped drive real interest rates down to their pre-crisis lows, an impending worldwide investment boom may drive rates higher over the next two decades.18
The potential for tighter financing terms in the future underscores the need to make sure that all investment that is currently committed is as productive as possible. Major capital projects in the resources sector are exceptionally complex undertakings, prone to cost overruns and delays caused by inadequate value optimisation, inefficient regulatory approval processes, agency failures (contractual arrangements and incentive schemes that fail to sufficiently align the interests of owners with those of advisers), and a shortage of talent. When commodity prices are high, an operational project may yield such lucrative returns on investment that there is solid business justification for rushing to completion. But without historically high prices, the focus must turn back to maximising the efficiency of operations for the long haul.
The huge size of the current project pipeline means that improving capital productivity in the resources sector could offer large rewards. Based on 23 recent projects completed by McKinsey in Australia and overseas, we estimate that opportunities exist in the resources sector to boost capital productivity by around 30 percent by addressing these barriers (see Box 3, “Improving capital productivity in major projects”). Widespread adoption of proven best practice techniques in the resources sector could free up between A$50 billion and A$133 billion for potential reinvestment in additional projects within Australia. This additional capital stock, at historical rates of capital productivity in the resources sector, would generate between A$8 billion and A$34 billion for the Australian economy each year, which translates to 0.6 to 2.3 percent of additional GDP.
Realising this potential will require resource firms to rethink their approach to capital management, focusing on value improvement at every project stage. There is also a clear role for government in influencing the time and cost of major resource projects. This includes ensuring that environmental approvals, infrastructure development, and industrial relations deliver the right balance between development and other social good, and that regulators provide maximum clarity, certainty, and speed to companies while fulfilling their mandates.
18 Farewell to cheap capital? The implications of long-term shifts in global investment and saving, McKinsey Global Institute, December 2010 (www.mckinsey.com/mgi).
27Beyond the boom: Australia’s productivity imperativeMcKinsey Global Institute
Box 3. Improving capital productivity in major projects
Past McKinsey work has identified three critical underlying drivers of capital productivity:
� Top-level focus on value: The global champions in capital productivity display a continuous improvement mindset that focuses on capturing all value-creation opportunities during the life of a project. Those mindsets are often reinforced by the introduction of top-down targets on final production cost to balance the engineering objectives against cost considerations, and strong performance management to ensure minimum leakage and deviation from these plans.
� Adoption of a best-practice “tool kit”: High-performing companies generally employ a well-structured optimisation tool kit. Far from being a mere checklist, the tool kit is more of a “how-to guide” to extracting value from an asset. It provides the process for reviewing an investment end-to-end as well as the analytical tools to identify value opportunities. Key tools include: (a) concept and design optimisation, using techniques like system balance, design-to-cost, and minimum technical solutions; (b) flawless construction and approvals involving idea-generation processes, tight performance management, and visual management; (c) ramp-up acceleration deploying preventive problem-solving techniques before issues arise; (d) procurement optimisation that draws on lowest-cost-country sourcing, clean sheet costing,
and best-of-best benchmarking; and (e) a contracting strategy that defines the role of the owner’s team for optimal risk allocation and establishes the contractual foundations to drive continuous improvement.
� Project team with superior execution skills: All companies aspire to have the best talent on their projects. Unfortunately, Australian firms are finding that talent with experience in major projects is in short supply. High-performing companies have focused on investing in internal capability development, as well as on partnering with companies with complementary needs to address internal capability gaps while maintaining aligned incentives with the asset owner.
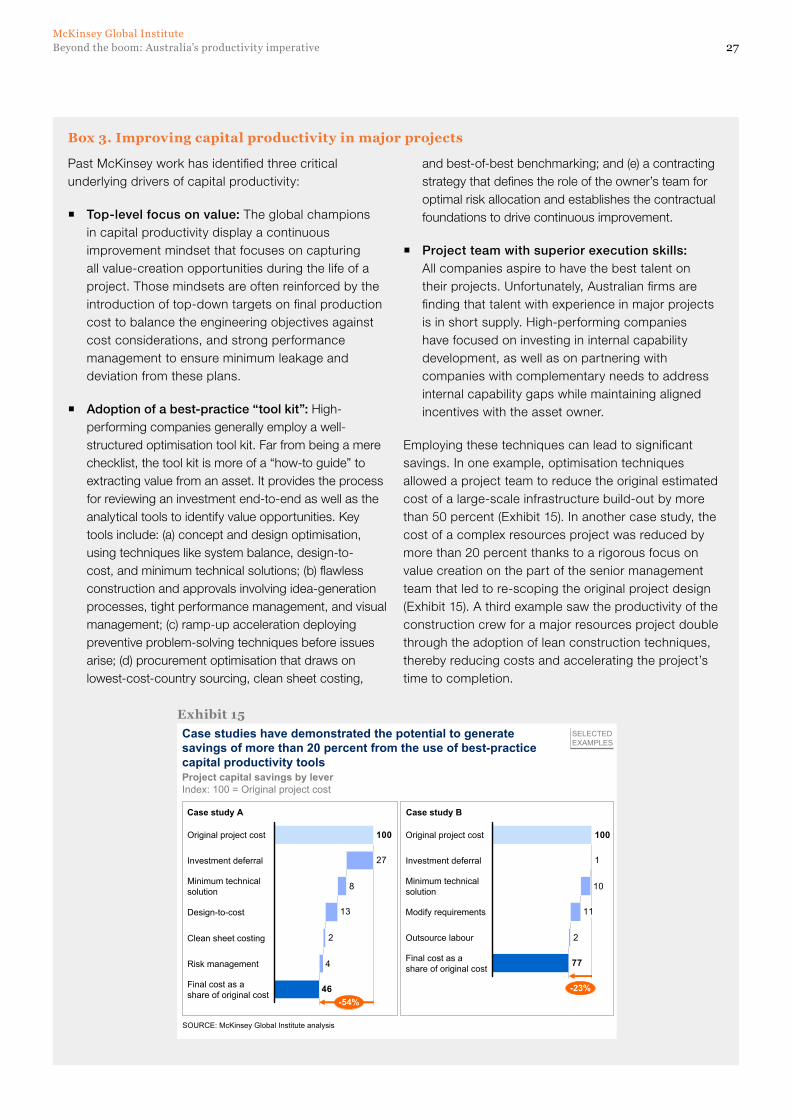
Employing these techniques can lead to significant savings. In one example, optimisation techniques allowed a project team to reduce the original estimated cost of a large-scale infrastructure build-out by more than 50 percent (Exhibit 15). In another case study, the cost of a complex resources project was reduced by more than 20 percent thanks to a rigorous focus on value creation on the part of the senior management team that led to re-scoping the original project design (Exhibit 15). A third example saw the productivity of the construction crew for a major resources project double through the adoption of lean construction techniques, thereby reducing costs and accelerating the project’s time to completion.
Exhibit 15
4
2
13
8
27
46
100
-54%
Final cost as ashare of original cost
Risk management
Clean sheet costing
Design-to-cost
Minimum technicalsolution
Investment deferral
Original project cost
Case studies have demonstrated the potential to generate savings of more than 20 percent from the use of best-practice capital productivity tools
SOURCE: McKinsey Global Institute analysis
Project capital savings by leverIndex: 100 = Original project cost
SELECTEDEXAMPLES
Case study A
2
11
10
1
77
100
-23%
Final cost as ashare of original cost
Outsource labour
Modify requirements
Minimum technicalsolution
Investment deferral
Original project cost
Case study B
28
RESOURCE RIDERS: UTILITIES, IN PARTICULAR, NEED TO REFOCUS ON PRODUCTIVITY
Resource riders include transport, construction (conducted outside resource firms but often for the benefit of the resources sector), professional and technical services, real estate, wholesale goods, and utilities. This varied group shares high exposure to the resources sector and moderate to low import competition. This cluster has built on strong momentum from the mining and energy boom, but its rapid growth has been accompanied by a worrisome decline in productivity. The performance of individual sectors has been mixed. However, looking at the group as a whole, combined income growth from productivity of labour and capital declined from A$25 billion added from 1993 to 1999 to only A$4 billion added from 2005 to 2011.
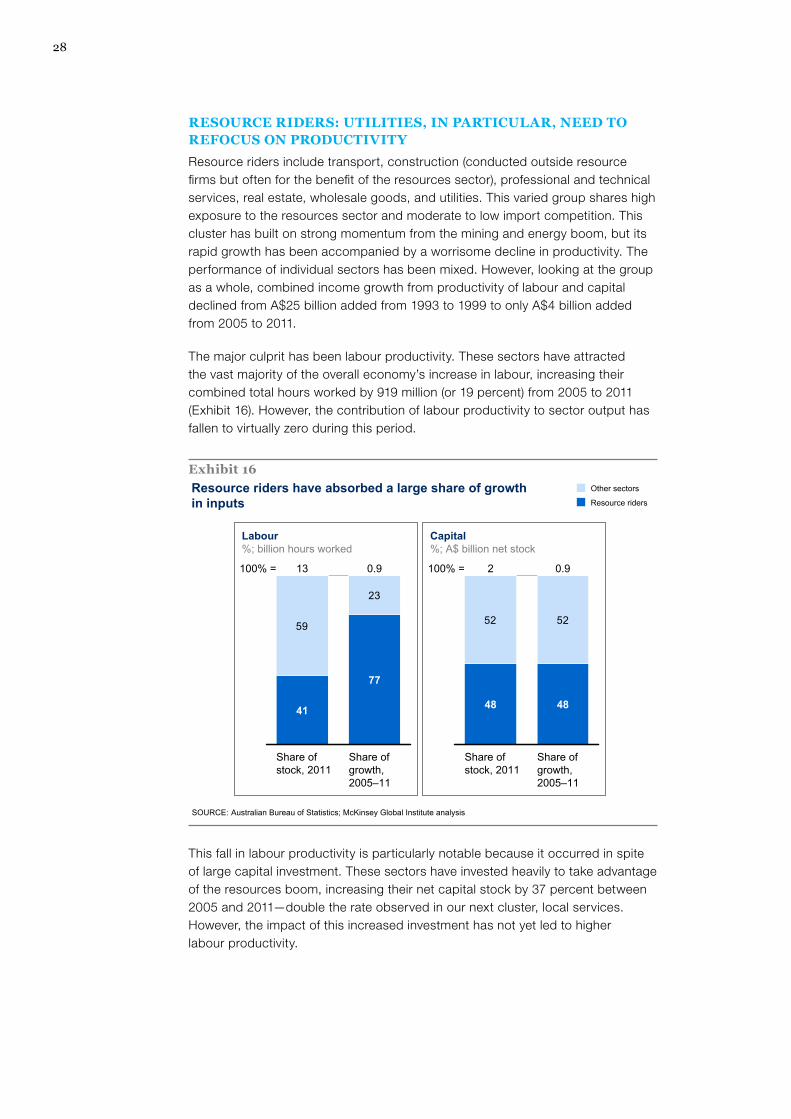
The major culprit has been labour productivity. These sectors have attracted the vast majority of the overall economy’s increase in labour, increasing their combined total hours worked by 919 million (or 19 percent) from 2005 to 2011 (Exhibit 16). However, the contribution of labour productivity to sector output has fallen to virtually zero during this period.
This fall in labour productivity is particularly notable because it occurred in spite of large capital investment. These sectors have invested heavily to take advantage of the resources boom, increasing their net capital stock by 37 percent between 2005 and 2011—double the rate observed in our next cluster, local services. However, the impact of this increased investment has not yet led to higher labour productivity.
Exhibit 16Resource riders have absorbed a large share of growth in inputs
59
23
100% =
Share of growth, 2005–11
0.9
77
Share of stock, 2011
13
41
Labour%; billion hours worked
SOURCE: Australian Bureau of Statistics; McKinsey Global Institute analysis
52 52
100% =
Share of growth, 2005–11
0.9
48
Share of stock, 2011
2
48
Capital%; A$ billion net stock
Resource riders
Other sectors
29Beyond the boom: Australia’s productivity imperativeMcKinsey Global Institute
Within the resource riders group, the utilities sector (including energy and water) stands out for its sluggish productivity performance. Recent analysis by the Australian Productivity Commission has found that multifactor productivity growth in the utilities sector was strongly negative between 1997–98 and 2009–10 (falling, on average, by 3.2 percent per year).19 But the analysis shows that the story is more complex. One factor driving down performance is the effect of cyclical investment; the cost base has been increased by expenditures that have yet to yield their benefits. Utilities have also invested in unrecorded quality improvements (such as the shift to underground cabling) and reducing their environmental impact by moving away from coal power. For electricity suppliers, the largest subsector, customers’ need to beat the heat has been a vexing issue: spikes in power usage during midday hours, when consumers turn on their air conditioners en masse, have dramatically increased the ratio between peak use and average use, driving up costs for capacity that sits idle at cooler times of the day.
When new capital investment in mining and energy projects eventually slows, the resource riders will once again have to look to productivity gains as a source of future growth. Among the priorities, finding new ways to make infrastructure development more cost-efficient and adopting a more integrated cross-sector approach to resource productivity that can reduce the need for some expensive new infrastructure (for example, addressing food waste to save water and energy) will be crucial.
LOCAL SERVICES: MATCHING INTERNATIONAL PRODUCTIVITY BENCHMARKS WILL REqUIRE FURTHER MICROECONOMIC REFORM
The local services group, which includes sectors such as retail trade and telecommunications, has neither high exposure to resources nor significant import competition. It accounts for a major share of the Australian economy: 42 percent of hours worked, 40 percent of value added, and 25 percent of capital stock. This cluster has not benefited as much from the boom as the resource riders category, but neither has it faced the full impact of higher exchange rates and low-cost import competition that have affected manufacturing.
The productivity of these sectors has been reasonably healthy, with solid gains that predate the resources boom. Capital productivity has been growing at 2.1 percent per year while labour productivity has been growing at 1.0 percent per year, making an A$25 billion contribution to income growth from 2005 to 2011. Indeed, this is the only cluster that has improved both capital and labour productivity.
Nevertheless, sectors within this group lag behind international best practice, and a comparison with their US counterparts reveals an average gap of A$32 per hour in labour productivity (Exhibit 17).20 Past MGI research shows that changes
19 Productivity in electricity, gas and water: Measurement and implementation, Australian Government Productivity Commission staff working paper, April 2012.
20 There are methodological issues with cross-country sector productivity comparisons, and MGI has traditionally preferred to use operational-level metrics (e.g., number of cars produced per worker when estimating automotive productivity). However, in the absence of operational-level metrics, these estimates can be used as rough indicators of relative productivity levels. The results were found to be broadly consistent when compared to estimates deived from EU KLEMS data (www.euklems.net), which user sector-level price data to convert sector value-added measures into common currencies.
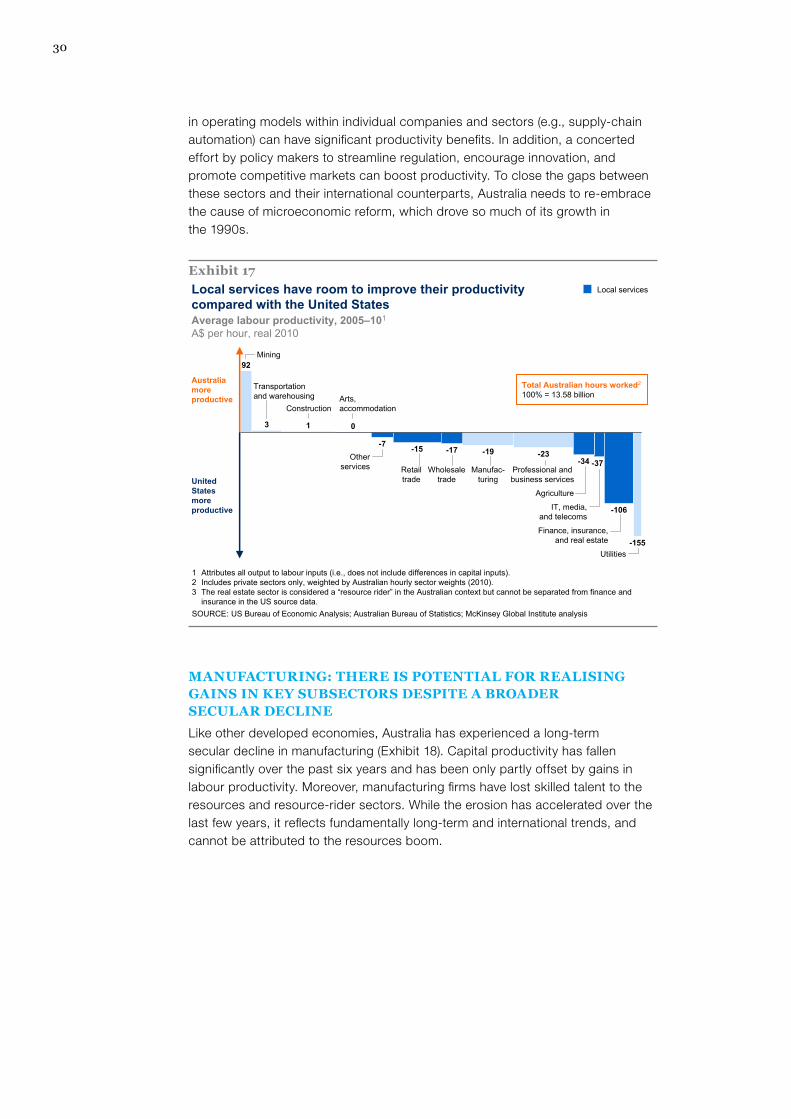
30
in operating models within individual companies and sectors (e.g., supply-chain automation) can have significant productivity benefits. In addition, a concerted effort by policy makers to streamline regulation, encourage innovation, and promote competitive markets can boost productivity. To close the gaps between these sectors and their international counterparts, Australia needs to re-embrace the cause of microeconomic reform, which drove so much of its growth in the 1990s.
MANUFACTURING: THERE IS POTENTIAL FOR REALISING GAINS IN KEY SUBSECTORS DESPITE A BROADER SECULAR DECLINE
Like other developed economies, Australia has experienced a long-term secular decline in manufacturing (Exhibit 18). Capital productivity has fallen significantly over the past six years and has been only partly offset by gains in labour productivity. Moreover, manufacturing firms have lost skilled talent to the resources and resource-rider sectors. While the erosion has accelerated over the last few years, it reflects fundamentally long-term and international trends, and cannot be attributed to the resources boom.
Exhibit 17
SOURCE: US Bureau of Economic Analysis; Australian Bureau of Statistics; McKinsey Global Institute analysis
-15 -17 -19-34
-23-37
-106
-155
-7
013
92
Local services have room to improve their productivity compared with the United States
1 Attributes all output to labour inputs (i.e., does not include differences in capital inputs).2 Includes private sectors only, weighted by Australian hourly sector weights (2010).3 The real estate sector is considered a “resource rider” in the Australian context but cannot be separated from finance and
insurance in the US source data.
Average labour productivity, 2005–101
A$ per hour, real 2010
United States more productive
Local services
Mining
Transportation and warehousing
ConstructionArts,accommodation
Other services Retail
tradeWholesale
tradeManufac-
turingProfessional and business services
Agriculture
IT, media, and telecoms
Finance, insurance, and real estate
Utilities
Australia more productive
Total Australian hours worked2
100% = 13.58 billion
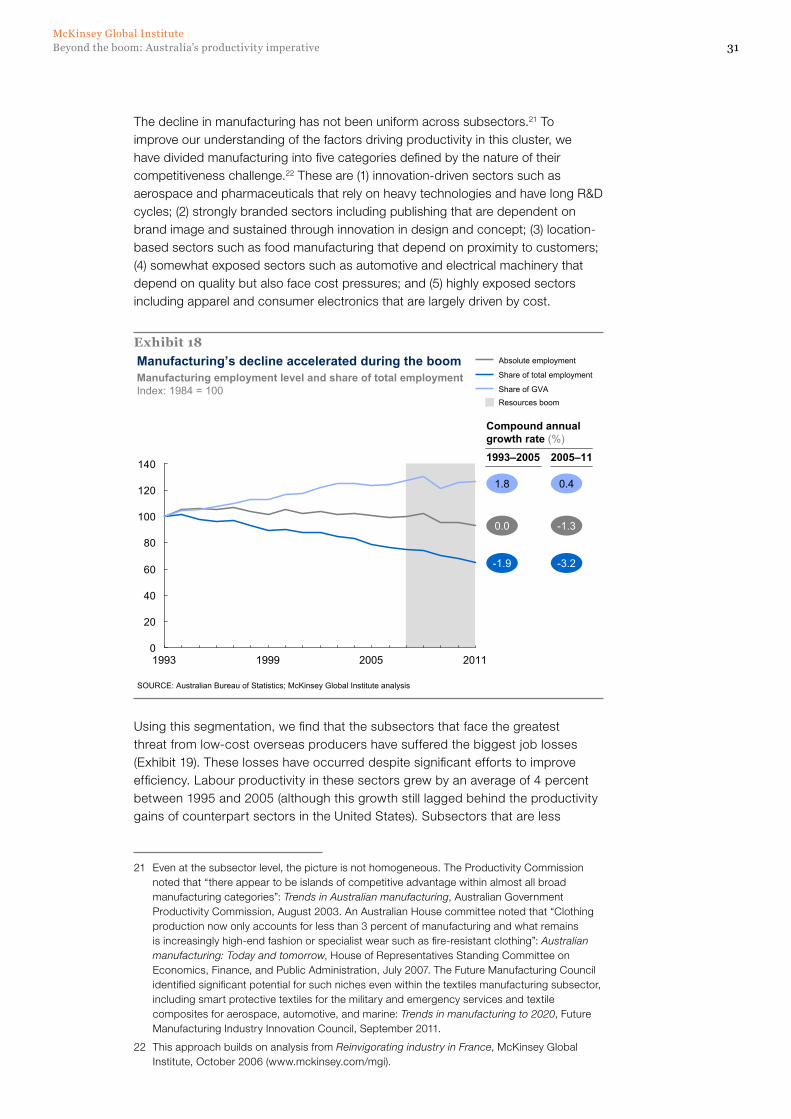
31Beyond the boom: Australia’s productivity imperativeMcKinsey Global Institute
The decline in manufacturing has not been uniform across subsectors.21 To improve our understanding of the factors driving productivity in this cluster, we have divided manufacturing into five categories defined by the nature of their competitiveness challenge.22 These are (1) innovation-driven sectors such as aerospace and pharmaceuticals that rely on heavy technologies and have long R&D cycles; (2) strongly branded sectors including publishing that are dependent on brand image and sustained through innovation in design and concept; (3) location-based sectors such as food manufacturing that depend on proximity to customers; (4) somewhat exposed sectors such as automotive and electrical machinery that depend on quality but also face cost pressures; and (5) highly exposed sectors including apparel and consumer electronics that are largely driven by cost.
Using this segmentation, we find that the subsectors that face the greatest threat from low-cost overseas producers have suffered the biggest job losses (Exhibit 19). These losses have occurred despite significant efforts to improve efficiency. Labour productivity in these sectors grew by an average of 4 percent between 1995 and 2005 (although this growth still lagged behind the productivity gains of counterpart sectors in the United States). Subsectors that are less
21 Even at the subsector level, the picture is not homogeneous. The Productivity Commission noted that “there appear to be islands of competitive advantage within almost all broad manufacturing categories”: Trends in Australian manufacturing, Australian Government Productivity Commission, August 2003. An Australian House committee noted that “Clothing production now only accounts for less than 3 percent of manufacturing and what remains is increasingly high-end fashion or specialist wear such as fire-resistant clothing”: Australian manufacturing: Today and tomorrow, House of Representatives Standing Committee on Economics, Finance, and Public Administration, July 2007. The Future Manufacturing Council identified significant potential for such niches even within the textiles manufacturing subsector, including smart protective textiles for the military and emergency services and textile composites for aerospace, automotive, and marine: Trends in manufacturing to 2020, Future Manufacturing Industry Innovation Council, September 2011.
22 This approach builds on analysis from Reinvigorating industry in France, McKinsey Global Institute, October 2006 (www.mckinsey.com/mgi).
Exhibit 18Manufacturing’s decline accelerated during the boom
SOURCE: Australian Bureau of Statistics; McKinsey Global Institute analysis
Manufacturing employment level and share of total employmentIndex: 1984 = 100
0
20
40
60
80
100
120
140
200519991993 2011
Share of GVA
Share of total employment
Absolute employment
Resources boom
Compound annual growth rate (%)
1993–2005 2005–11
0.0 -1.3
1.8 0.4
-1.9 -3.2
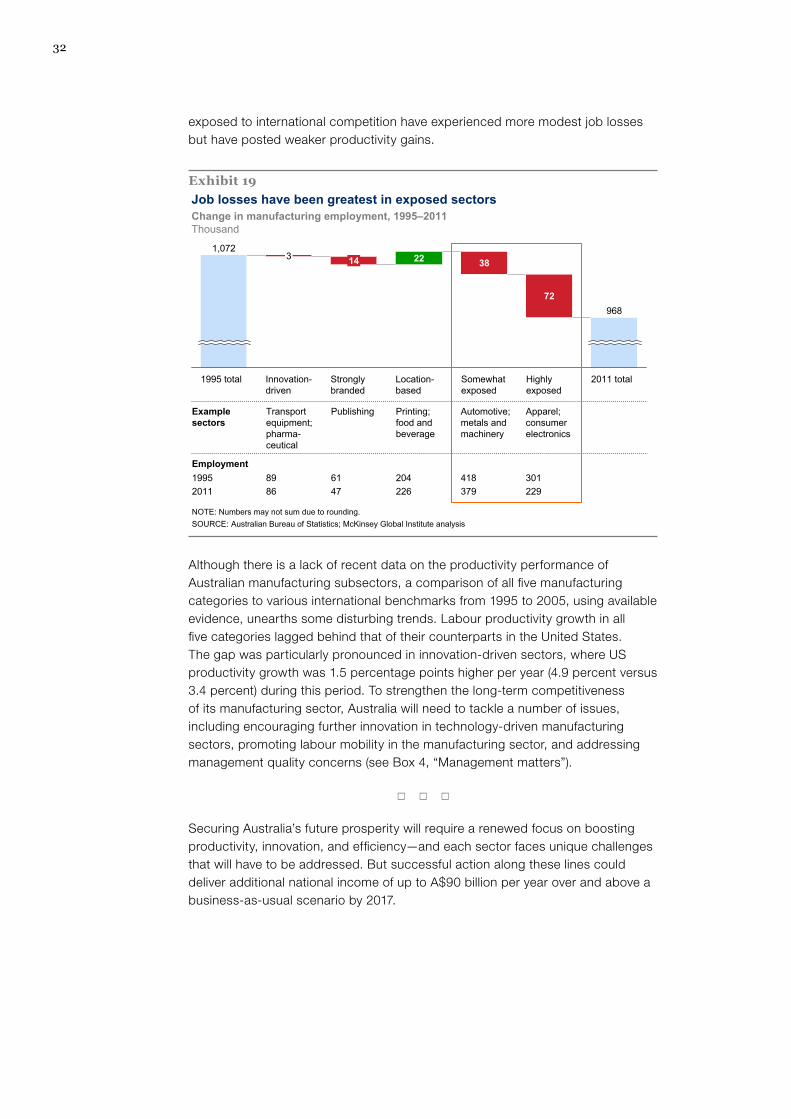
32
exposed to international competition have experienced more modest job losses but have posted weaker productivity gains.
Although there is a lack of recent data on the productivity performance of Australian manufacturing subsectors, a comparison of all five manufacturing categories to various international benchmarks from 1995 to 2005, using available evidence, unearths some disturbing trends. Labour productivity growth in all five categories lagged behind that of their counterparts in the United States. The gap was particularly pronounced in innovation-driven sectors, where US productivity growth was 1.5 percentage points higher per year (4.9 percent versus 3.4 percent) during this period. To strengthen the long-term competitiveness of its manufacturing sector, Australia will need to tackle a number of issues, including encouraging further innovation in technology-driven manufacturing sectors, promoting labour mobility in the manufacturing sector, and addressing management quality concerns (see Box 4, “Management matters”).
* * *
Securing Australia’s future prosperity will require a renewed focus on boosting productivity, innovation, and efficiency—and each sector faces unique challenges that will have to be addressed. But successful action along these lines could deliver additional national income of up to A$90 billion per year over and above a business-as-usual scenario by 2017.
Exhibit 19Job losses have been greatest in exposed sectors
SOURCE: Australian Bureau of Statistics; McKinsey Global Institute analysis
Example sectors
8986
6147
204226
418379
301229
22
Strongly branded
14
Innovation-driven
3
1995 total
1,072
2011 total
968
Highly exposed
72
Somewhat exposed
38
Location-based
Change in manufacturing employment, 1995–2011Thousand
Transport equipment; pharma-ceutical
Publishing Printing; food and beverage
Automotive;metals and machinery
Apparel; consumer electronics
Employment19952011
NOTE: Numbers may not sum due to rounding.
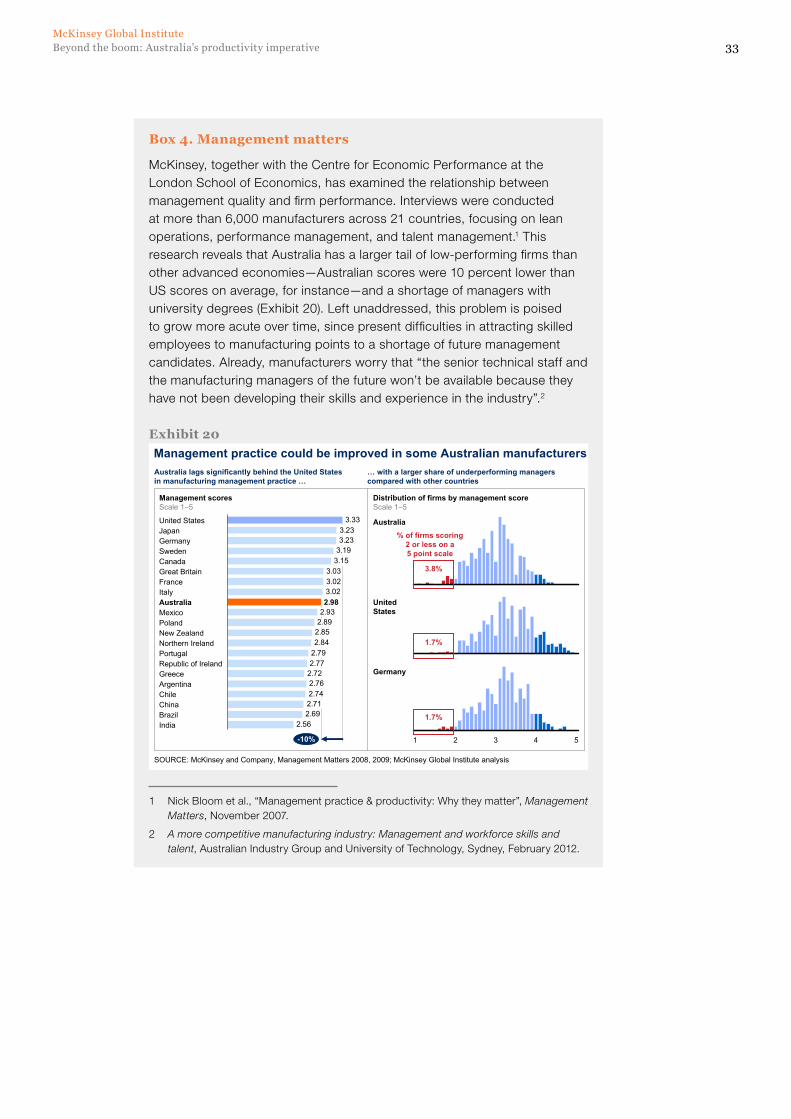
33Beyond the boom: Australia’s productivity imperativeMcKinsey Global Institute
Box 4. Management matters
McKinsey, together with the Centre for Economic Performance at the London School of Economics, has examined the relationship between management quality and firm performance. Interviews were conducted at more than 6,000 manufacturers across 21 countries, focusing on lean operations, performance management, and talent management.1 This research reveals that Australia has a larger tail of low-performing firms than other advanced economies—Australian scores were 10 percent lower than US scores on average, for instance—and a shortage of managers with university degrees (Exhibit 20). Left unaddressed, this problem is poised to grow more acute over time, since present difficulties in attracting skilled employees to manufacturing points to a shortage of future management candidates. Already, manufacturers worry that “the senior technical staff and the manufacturing managers of the future won’t be available because they have not been developing their skills and experience in the industry”.2
1 Nick Bloom et al., “Management practice & productivity: Why they matter”, Management Matters, November 2007.
2 A more competitive manufacturing industry: Management and workforce skills and talent, Australian Industry Group and University of Technology, Sydney, February 2012.
Exhibit 20
2.562.692.712.742.762.722.772.792.842.852.892.932.983.023.023.03
3.153.193.233.23
3.33
PortugalNorthern IrelandNew Zealand
Italy
PolandMexicoAustralia
-10%
IndiaBrazil
ArgentinaGreeceRepublic of Ireland
ChinaChile
United States
FranceGreat BritainCanadaSwedenGermanyJapan
Management practice could be improved in some Australian manufacturers
SOURCE: McKinsey and Company, Management Matters 2008, 2009; McKinsey Global Institute analysis
Management scoresScale 1–5
Australia lags significantly behind the United States in manufacturing management practice …
… with a larger share of underperforming managers compared with other countries
Distribution of firms by management scoreScale 1–5
54321
% of firms scoring 2 or less on a 5 point scale
Australia
Germany
United States
3.8%
1.7%
1.7%
34
Australia has a complex relationship with the coal, ore, and minerals beneath its soil. While this wealth of natural resources has fuelled enviable income growth, it has also caused distortions across the economy—and to a certain extent, it has allowed Australia to avoid confronting its deteriorating fundamentals.
Thanks to the prosperity generated by the resources boom, Australia’s productivity problem has not been acutely felt—yet. But the good luck might not last forever. Yes, economic and demographic trends in the developing world point to sustained global demand for resources in the decades ahead, but there is risk in relying heavily on a single sector (especially one marked by extreme short-term price volatility) to deliver growth.
The determinants of past income growth are not assured into the future. The continuation of the incredible growth story in China and other emerging markets can only sustain the terms of trade at current levels, not increase them further. In a worst case, growth in the developed world slows and Australia’s terms of trade and investment slow with it.
Australia has a window of opportunity to insure against a potential slowdown by addressing the productivity of both capital and labour. A major focus on capital productivity is crucial to maximise the unprecedented investment that has flooded into mining and energy, ensuring that it pays dividends in the years ahead. And across the broader economy, business and government leaders can tackle key priority areas to encourage innovation and build a more competitive workforce.
We estimate that a concerted effort to shore up productivity could deliver a major prize, adding up to A$90 billion in national income per year by 2017. Beyond that potential gain, the rewards could be even more lasting: meeting the productivity challenge could build a more balanced and resilient economy that is better prepared to meet changing conditions and market opportunities in the years ahead.
Conclusion: Thinking beyond the boom
Beyond the boom: Australia’s productivity imperativeMcKinsey Global Institute
35
A. Measuring productivity: Splitting capital and labour
B. Calculating underlying performance
C. Volume versus price-based capital productivity measures
D. Measuring Australia’s income
E. Assumptions underpinning the scenario analysis
A. MEASURING PRODUCTIVITY: SPLITTING CAPITAL AND LABOUR
Productivity is the growth in outputs generated through efficiency, rather than through adding more inputs. It arises through improvements in technology as well as social capital.
Multifactor productivity, calculated and reported by the Australian Bureau of Statistics (ABS), is the most sophisticated approach to measuring this. It takes into account the fact that in a modern (nonagricultural) economy, output is the result of the two primary factors of production: labour and capital, which are combined and in many situations are substitutable. It is calculated by attributing a share of output to capital and a share to labour, and then combining the weighted productivity of each share according to the amount of capital and labour used to produce each respectively.
This report uses multifactor productivity as the basis of all its analysis. Income weights to labour and capital used in this report have been derived by the ABS using a Cobb–Douglas production function methodology.
But throughout this report, values for labour productivity and capital productivity are presented separately, as are their respective contributions to growth in output and income. This separation relies on the same income attribution produced and used by the ABS, with the distinction that rather than being combined to a single measure (multifactor productivity), they are reported as separate series.
This separation ensures that effects such as capital deepening (which would improve labour productivity) are stripped out of the results. It gives a clearer view of the underlying or intrinsic performance of productivity for each of the two fundamental factors of production.
Appendix: Methodology
36
When we talk about inputs in this report, we use volume-based measures: hours for labour and volume measures of capital. This approach excludes the fact that the real dollar cost of labour (wages) and capital (priced fixed capital formation) may diverge from volume-based measures over time. Divergences between volume-based measures and price-based measures of performance are dealt with in section C below.
The issue of declining productivity in the Australian economy has received wide comment, with the Reserve Bank of Australia, the Productivity Commission, and the Australian Treasury weighing in with analysis.23
Recently, debate has emerged on the issue of whether the decline in productivity primarily afflicts the resources sector or is more widespread across sectors. In its 2010–11 annual report, the Productivity Commission estimated that approximately 80 percent of the decline in multifactor productivity was attributable to just three sectors: mining, agriculture, and utilities. This number compares productivity growth between 1999 and 2004, and then between 2004 and 2009.
Since then, Saul Eslake calculated that removal of the mining and utilities sectors from an overall assessment of labour productivity resulted in only a 10 percent reduction in the decline in growth, hinting at a labour productivity issue that was much more widespread.24
These two assessments need not be contradictory. The labour productivity lens used by Eslake in his research indeed demonstrated a productivity issue across sectors that we discuss in this report. However, this perspective isolates labour without considering the impact of capital deepening and productivity on the multifactor result.
Multifactor productivity growth, as calculated by the Productivity Commission (drawing on ABS data) represents the growth in output attributable to both capital and labour. Our results support the importance of capital as part of the overall productivity story. Splitting output into its labour and capital components shows a greater reduction in capital performance than in labour, and a prominent role for mining in driving the reduction in capital productivity over the last six years.
23 Ellis Connolly and David Orsmond, The mining industry: From bust to boom, Reserve Bank of Australia research discussion paper number 2011–08, December 2011; Annual report 2010–11, Australian Government Productivity Commission, October 2011; and David Gruen, “The macroeconomic and structural implications of a once-in-a-lifetime boom in the terms of trade”, speech delivered to the Australian Business Economists Annual Conference in Sydney, November 24, 2011.
24 Saul Eslake, “Productivity: The lost decade”, paper presented to the annual policy conference of the Reserve Bank of Australia in Kirribilli, August 2011.
37Beyond the boom: Australia’s productivity imperativeMcKinsey Global Institute
B. CALCULATING UNDERLYING PERFORMANCE
In Exhibit 7 and throughout this report, we distinguish between observed and underlying performance. The purpose of this distinction is to understand how much of the recent contribution to income from various factors has been based on temporary or cyclical factors. With that knowledge in hand, we can try to assess how much of that growth may continue into the future. For each of the five major components of income growth, we define temporary effects as follows:
� Additional capital: Capital has been added to the economy at a rate well above the long-term trend.
� Additional labour: A$4 billion of the growth in income from additional labour is attributable to increases in the participation rate—a factor that cannot be repeated in the long term to provide additional labour force growth.
� Capital productivity: Of the observed downturn in capital productivity, A$24 billion is attributable to the temporary effect of capital lag (the time lag between the investment of new capital and when it begins to actually produce output).
� Labour productivity: Of the observed income boost from labour productivity improvement, A$6 billion was attributable to changes in the sector mix rather than intrinsic within-sector improvement.
C. VOLUME VERSUS PRICE-BASED CAPITAL PRODUCTIVITY MEASURES
We base our analysis of productivity on volume measures of input and output: hours worked for labour, gross fixed capital formation, and net capital stock. This allows us to isolate the impact of the terms of trade. While the volume-based view is suitable for macroeconomic analysis, a price-based view that values inputs and outputs drives business investment decisions.
The difference between these two metrics is most marked in sectors such as agriculture, manufacturing, and resources that heavily export or import goods. Changes in the terms of trade may mean that realised income differs significantly from volume-based, gross value added measures. In other sectors, realised income is very close to sector value added as recorded by the ABS.
Resources experienced the largest divergence between headline productivity and income of any sector. The price-related income boost from ore and coal alone generated A$80 billion of additional income between 2005 and 2011. Despite declining headline productivity, rising prices triggered an investment boom. However, the prices of capital inputs have also risen. In the Australian economy overall, real prices for capital goods have been relatively flat since the early 1990s, but the resources sector has had capital price inflation of about 3 percent per year since 1990. From 2005 to 2009, the rate nudged toward 5 percent, although it has since started to wane once again. In a sector where more than 70 percent of multifactor inputs are capital, these developments have significant implications for the sector’s future income prospects. See chapter 3 for a more detailed discussion.
38
D. MEASURING AUSTRALIA’S INCOME
Throughout this report, we draw a distinction between “output” and “income”. Output is a measure of the actual production or consumption of the economy. GDP and gross value added (GVA) are both measures of output. These metrics are adjusted for changes in the prices of goods produced to reflect “real” changes in how much is being produced in the entire economy (in the case of GDP) or in a particular industry (in the case of GVA). Measuring output is useful because it provides us with a view of the efficiency or productivity of production, which is a key topic for this report. A company may become more profitable if the prices of what it produces rise. But if that company requires more inputs for a certain amount of production, it has still become less productive.
By comparison, income measures reflect the reality that an economy earns more income when it receives higher prices for the goods that it exports and that effective incomes are higher when goods that an economy imports become cheaper. In Australia, the ABS measures income as GDI (GDP adjusted for changes in the relative prices of imports and exports).25
There are limitations to the way income is measured. GDP and GDI are assumed to be equal for the previous year, so only one year’s worth of deviation is shown in any given year. In the long run, assuming that relative import and export prices remain constant, this is not problematic. However, Australia is in the middle of a historically long deviation between income and output because of sustained higher prices for commodities, and a long-term decrease in the prices of its imports. To account for this, we assume (as the ABS does) that GDP and GDI are equal in the base year of 1993 used in this report (the beginning of the first “era” of our analysis). From this point, we have used annual growth rates of each series to show the deviation between output and income. We treat any growth in GDI that is in excess of GDP growth as purely a result of changing terms of trade.
In our review of GDI, we do not distinguish between locally and foreign-owned capital and income. These distinctions would be available in a review of GNI, but this metric includes income from Australian investment in foreign economies, which have their own productivity stories and are outside the scope of this study.
Growth in the terms of trade has meant the first significant divergence between GDI and GDP (which does not take into account changes in international purchasing power) in more than 50 years (Exhibit A1). In the past, policy makers and the media have been comfortable using GDP as the main measure of the country’s prosperity. However, in an era when the terms and volume of trade have become more volatile, we believe that a sole focus on GDP may no longer be appropriate. Looking at GDP and GDI in parallel shows a gap that may be explained by productivity performance.
25 For a detailed discussion of the methodology used to calculate income, see the ABS documentation or an excellent discussion in Robert Gregory’s recent paper, Living standards, terms of trade and foreign ownership: Reflections on the Australian mining boom, Australian National University, Centre for Economic Policy Research discussion paper number 656, December 2011.
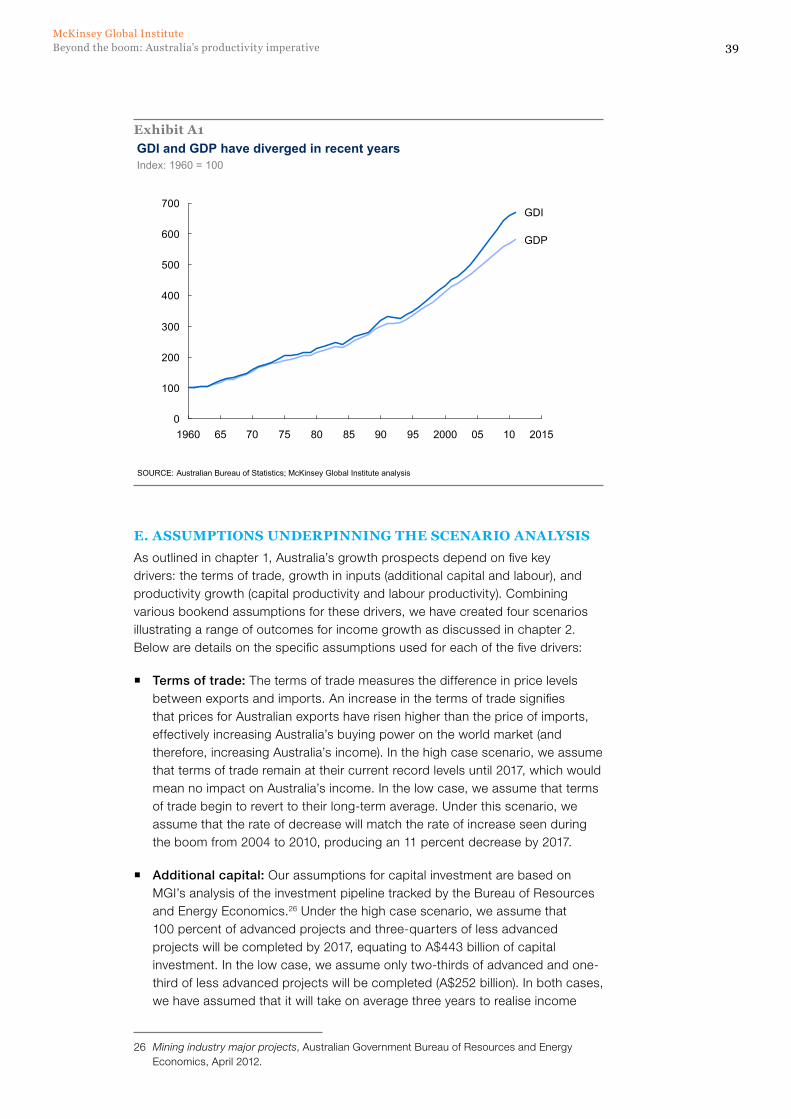
39Beyond the boom: Australia’s productivity imperativeMcKinsey Global Institute
E. ASSUMPTIONS UNDERPINNING THE SCENARIO ANALYSIS
As outlined in chapter 1, Australia’s growth prospects depend on five key drivers: the terms of trade, growth in inputs (additional capital and labour), and productivity growth (capital productivity and labour productivity). Combining various bookend assumptions for these drivers, we have created four scenarios illustrating a range of outcomes for income growth as discussed in chapter 2. Below are details on the specific assumptions used for each of the five drivers:
� Terms of trade: The terms of trade measures the difference in price levels between exports and imports. An increase in the terms of trade signifies that prices for Australian exports have risen higher than the price of imports, effectively increasing Australia’s buying power on the world market (and therefore, increasing Australia’s income). In the high case scenario, we assume that terms of trade remain at their current record levels until 2017, which would mean no impact on Australia’s income. In the low case, we assume that terms of trade begin to revert to their long-term average. Under this scenario, we assume that the rate of decrease will match the rate of increase seen during the boom from 2004 to 2010, producing an 11 percent decrease by 2017.
� Additional capital: Our assumptions for capital investment are based on MGI’s analysis of the investment pipeline tracked by the Bureau of Resources and Energy Economics.26 Under the high case scenario, we assume that 100 percent of advanced projects and three-quarters of less advanced projects will be completed by 2017, equating to A$443 billion of capital investment. In the low case, we assume only two-thirds of advanced and one-third of less advanced projects will be completed (A$252 billion). In both cases, we have assumed that it will take on average three years to realise income
26 Mining industry major projects, Australian Government Bureau of Resources and Energy Economics, April 2012.
Exhibit A1GDI and GDP have diverged in recent years
0
100
200
300
400
500
600
700
1960 1065
GDP
GDI
0570 2000 2015858075 9590
Index: 1960 = 100
SOURCE: Australian Bureau of Statistics; McKinsey Global Institute analysis
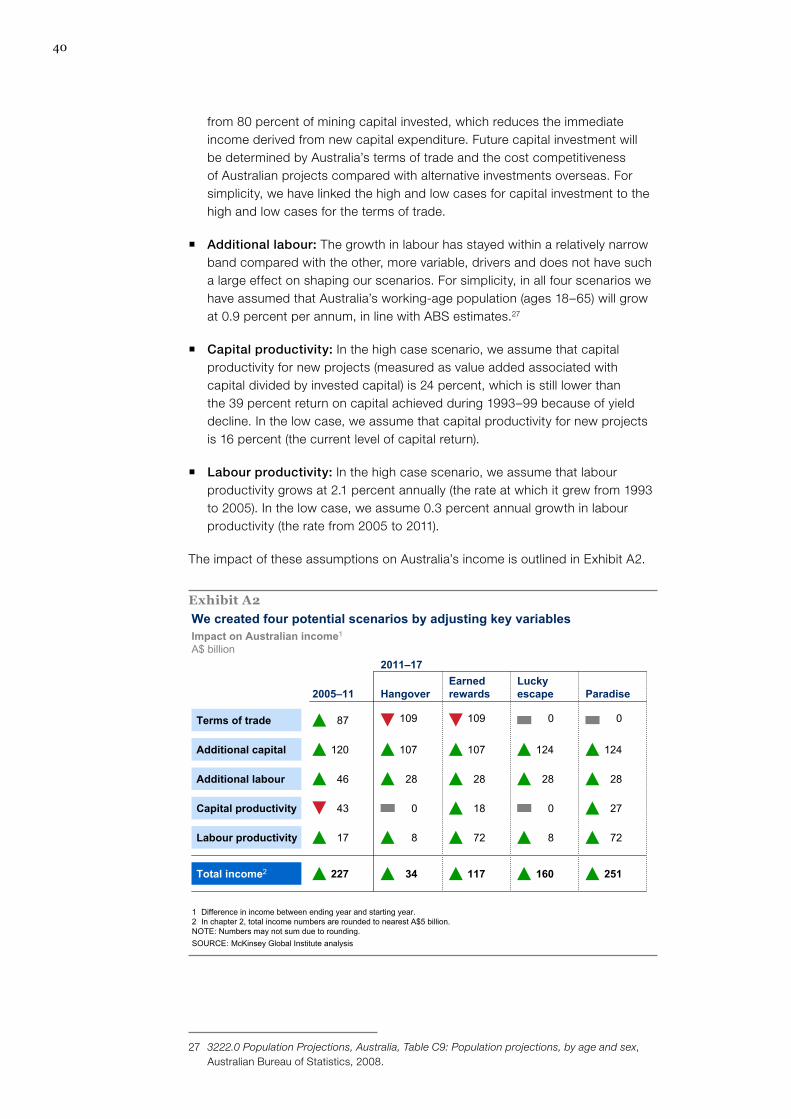
40
from 80 percent of mining capital invested, which reduces the immediate income derived from new capital expenditure. Future capital investment will be determined by Australia’s terms of trade and the cost competitiveness of Australian projects compared with alternative investments overseas. For simplicity, we have linked the high and low cases for capital investment to the high and low cases for the terms of trade.
� Additional labour: The growth in labour has stayed within a relatively narrow band compared with the other, more variable, drivers and does not have such a large effect on shaping our scenarios. For simplicity, in all four scenarios we have assumed that Australia’s working-age population (ages 18–65) will grow at 0.9 percent per annum, in line with ABS estimates.27
� Capital productivity: In the high case scenario, we assume that capital productivity for new projects (measured as value added associated with capital divided by invested capital) is 24 percent, which is still lower than the 39 percent return on capital achieved during 1993–99 because of yield decline. In the low case, we assume that capital productivity for new projects is 16 percent (the current level of capital return).
� Labour productivity: In the high case scenario, we assume that labour productivity grows at 2.1 percent annually (the rate at which it grew from 1993 to 2005). In the low case, we assume 0.3 percent annual growth in labour productivity (the rate from 2005 to 2011).
The impact of these assumptions on Australia’s income is outlined in Exhibit A2.
27 3222.0 Population Projections, Australia, Table C9: Population projections, by age and sex, Australian Bureau of Statistics, 2008.
Exhibit A2
87 109 109 0 0Terms of trade
Additional capital 120 107 107 124 124
Additional labour 46 28 28 28 28
Total income2 227 34 117 160 251
Capital productivity 43 0 18 0 27
Labour productivity 17 8 72 8 72
We created four potential scenarios by adjusting key variables
SOURCE: McKinsey Global Institute analysis
Impact on Australian income1
A$ billion
1 Difference in income between ending year and starting year. 2 In chapter 2, total income numbers are rounded to nearest A$5 billion.NOTE: Numbers may not sum due to rounding.
HangoverEarned rewards
Lucky escape Paradise2005–11
2011–17
Beyond the boom: Australia’s productivity imperativeMcKinsey Global Institute
41
Australian Bureau of Statistics, Adult literacy and life skills survey, 2006.
Australian Government Bureau of Resources and Energy Economics, Mining industry major projects, April 2012.
Australian Government Export Finance and Insurance Corporation, EFIC response to the Productivity Commission draft report: Supplementary submission, March 2012.
Australian Government Productivity Commission, Annual report 2007–08, October 2008.
Australian Government Productivity Commission, Annual report 2010–11, October 2011.
Australian Government Productivity Commission, Australia’s export credit arrangements: Productivity Commission draft report, February 2012.
Australian Government Productivity Commission, Productivity in electricity, gas and water: Measurement and implementation, Productivity Commission staff working paper, April 2012.
Australian Government Productivity Commission, Productivity in the mining industry: Measurement and interpretation, Productivity Commission staff working paper, 2008.
Australian Government Productivity Commission, Trends in Australian manufacturing, August 2003.
Australian House of Representatives Standing Committee on Economics, Finance, and Public Administration, Australian manufacturing: Today and tomorrow, July 2007.
Australian Industry Group and University of Technology, Sydney, A more competitive manufacturing industry: Management and workforce skills and talent, February 2012.
Banks, Gary, “Australia’s mining boom: What’s the problem?”, address to the Melbourne Institute and the Australian Economic and Social Outlook Conference in Melbourne, June 30, 2011.
Bloom, Nick et al., “Management practice and productivity: Why they matter”, Management Matters, November 2007.
Connolly, Ellis, and David Orsmond, The mining industry: From bust to boom, Reserve Bank of Australia research discussion paper number 2011–08, December 2011.
Bibliography
42
Eslake, Saul, “Productivity: The lost decade”, paper presented to the annual policy conference of the Reserve Bank of Australia in Kirribilli, August 15, 2011.
Eslake, Saul, and Marcus Walsh, Australia’s productivity challenge, Grattan Institute report number 2011–1, February 2011.
Future Manufacturing Industry Innovation Council, Trends in manufacturing to 2020, September 2011.
Garicano, Luis, Claire Lelarge, and John Van Reenen, Firm size distortions and the productivity distribution: Evidence from France, London School of Economics, Centre for Economic Performance discussion paper number dp1128, March 2012.
Gregory, Robert, Living standards, terms of trade and foreign ownership: Reflections on the Australian mining boom, Australian National University, Centre for Economic Policy Research discussion paper number 656, December 2011.
Gruen, David, “The macroeconomic and structural implications of a once-in-a-lifetime boom in the terms of trade”, speech delivered to the Australian Business Economists Annual Conference in Sydney, November 24, 2011.
Lewis, William, The power of productivity: Wealth, poverty, and the threat to global stability (Chicago: University of Chicago Press, 2004).
Manufacturing Skills Australia, Foundation skills in the manufacturing industry, November 2011.
McKinsey Global Institute, Urban world: Cities and the rise of the consuming class, June 2012.
McKinsey Global Institute and McKinsey Sustainability and Resource Productivity Practice, Resource Revolution: Meeting the world’s energy, materials, food, and water needs, November 2011.
McKinsey Global Institute, Farewell to cheap capital? The implications of long-term shifts in global investment and saving, December 2010.
McKinsey Global Institute, How to compete and grow: A sector guide to policy, March 2010.
McKinsey Global Institute, Reinvigorating industry in France, October 2006.
McKinsey Global Institute, Australia’s economic performance, November 1995.
Organisation for Economic Co-operation and Development, OECD economic surveys: Australia, November 2010.
Organisation for Economic Co-operation and Development, OECD reviews of regulatory reform: Australia: Towards a seamless national economy, February 2010.
Parham, Dean, Australia’s productivity growth slump: Signs of crisis, adjustment or both?, Australian Government Productivity Commission visiting researcher paper, April 2012.

43Beyond the boom: Australia’s productivity imperativeMcKinsey Global Institute
Shann, Ed, Maximising growth in a mining boom, Minerals Council of Australia, March 2012.
Skills Australia, Australian workforce futures: A national workforce development strategy, March 2010.
Stevens, Glenn, “The challenge of prosperity”, address to the Committee for Economic Development of Australia annual dinner in Melbourne, November 29, 2010.
World Bank and International Finance Corporation, Doing business 2012: Doing business in a more transparent world—Australia profile, May 2012.

Related McKinsey Global Institute publications
www.mckinsey.com/mgi
eBook versions of selected MGI reports are available at MGI’s Web site, Amazon’s Kindle bookstore, and Apple’s iBookstore.
Download and listen to MGI podcasts on iTunes or at www.mckinsey.com/mgi/publications/multimedia/
Farewell to cheap capital? The implications of long-term shifts in global investment and saving (December 2010)
MGI analysis suggests that the low interest rate environment that many have come to take for granted is likely to end in the coming years. By 2020, half of the world’s saving and investment will take place in emerging markets, and there will be a substantial gap between global investment demand and the world’s likely savings.
McKinsey Global Institute
December 2010
Farewell to cheap capital? The implications of long‑term shifts in global investment and saving
How to compete and grow: A sector guide to policy (March 2010)
Drawing on industry case studies from around the world, MGI analyses policies and regulations that have succeeded and those that have failed in fostering economic growth and competitiveness at the sector level. What emerges are some surprising findings that run counter to the way that many policy makers are thinking about the task at hand.
McKinsey Global Institute
How to compete and grow: A sector guide to policy
March 2010
Resource Revolution: Meeting the world’s energy, materials, food, and water needs (November 2011)
We might be entering a new era of high and volatile resource prices over the next two decades as up to three billion people join the middle class. In addition, environmental deterioration, driven by higher consumption, is making the supply of resources—particularly food—more vulnerable. But the challenge can be met through a combination of expanding supply and a step change in the way resources are extracted, converted, and used.
McK
insey Global Institute
Resource R
evolution: Meeting the w
orld’s energy, materials, food, and w
ater needs
McKinsey Global InstituteMcKinsey Sustainability & Resource Productivity Practice
Resource Revolution: Meeting the world’s energy, materials, food, and water needs
November 2011
Reinvigorating industry in France (October 2006)
This MGI report looks at the myths and realities behind industrial decline in France and analyses the competitiveness issues at work. It proposes a new framework for public and private action to bolster the country’s industrial base.
Reinvigorating industry in France
October 2006
McKinsey Global Institute

McKinsey Global Institute August 2012Copyright © McKinsey & Companywww.mckinsey.com/mgi
@McKinsey_MGI
McKinseyGlobalInstitute