
August 19, 2016 Joshua Salander, MBA, PMP Consultant · 4Q15 reports were emailed on August 13,...
42
August 19, 2016 Joshua Salander, MBA, PMP Consultant
Transcript of August 19, 2016 Joshua Salander, MBA, PMP Consultant · 4Q15 reports were emailed on August 13,...

August 19, 2016
Joshua Salander, MBA, PMP
Consultant

4Q15 reports were emailed on August 13, 2016
Quarterly Reports
Quarterly Trend Charts
2
Reports delivery

MICAHQN Reports Schedule Qtr CMS Data Deadline* Data Extracts Provided By*
1st Qtr August 15 August 31
2nd Qtr November 15 November 30
3rd Qtr February 15 February 28
4th Qtr May 15 May 31
*In event there is an extension to data deadline, vendor provides data extract within 15 days of extension date which in turn will delay Reports Delivered By.
3

4
92.7% 91.5%
100.0%
0.0%
10.0%
20.0%
30.0%
40.0%
50.0%
60.0%
70.0%
80.0%
90.0%
100.0%
Evaluation of LVS Function
Rate
Heart Failure - 4Q15
MICAHQN Rate CAH Only Rate Rural Only Rate

5
80.0%
82.0%
84.0%
86.0%
88.0%
90.0%
92.0%
94.0%
96.0%
98.0%
100.0%
1Q13 2Q13 3Q13 4Q13 1Q14 2Q14 3Q14 4Q14 1Q15 2Q15 3Q15 4Q15
Ra
te
HF2 - Evaluation of LVS Function
MICAHQN Overall UCL LCL

6
88.8% 87.3%
100.0%
0.0%
10.0%
20.0%
30.0%
40.0%
50.0%
60.0%
70.0%
80.0%
90.0%
100.0%
Initial Antibiotic Selection for PN in Immunocompetent Patient
Ra
te Pneumonia - 4Q15
MICAHQN Rate CAH Only Rate Rural Only Rate

7
75.0%
80.0%
85.0%
90.0%
95.0%
100.0%
Ra
te
PN6 - Initial Antibiotic Selection for PN in Immunocompetent Patient
MICAHQN Overall UCL LCL

8
90.4% 89.7%
98.4%
0.0%
10.0%
20.0%
30.0%
40.0%
50.0%
60.0%
70.0%
80.0%
90.0%
100.0%
Influenza Immunization – Overall Rate
Ra
te
Immunization - 4Q15
MICAHQN Rate CAH Only Rate Rural Only Rate

9
75.0%
80.0%
85.0%
90.0%
95.0%
100.0%
Ra
te
IMM2 - Influenza Immunization – Overall Rate
MICAHQN Overall UCL LCL

10
88.9%
98.4% 99.0% 98.1%
88.9%
98.1% 98.8% 97.8% 100.0% 100.0% 100.0%
0.0%
10.0%
20.0%
30.0%
40.0%
50.0%
60.0%
70.0%
80.0%
90.0%
100.0%
Fibrinolytic Therapy ReceivedWithin 30 Minutes
Aspirin at Arrival - Overall Rate Aspirin at Arrival - AMI Aspirin at Arrival - Chest Pain
Ra
te
OP AMI/CP Rate Based Measures - 4Q15
MICAHQN Rate CAH Only Rate Rural Only Rate

11
0.0%
10.0%
20.0%
30.0%
40.0%
50.0%
60.0%
70.0%
80.0%
90.0%
100.0%
Ra
te
OP2 - Fibrinolytic Therapy Received Within 30 Minutes
MICAHQN Overall UCL LCL

12
93.0%
94.0%
95.0%
96.0%
97.0%
98.0%
99.0%
100.0%
Ra
te
OP4a - Aspirin at Arrival - Overall Rate
MICAHQN Overall UCL LCL
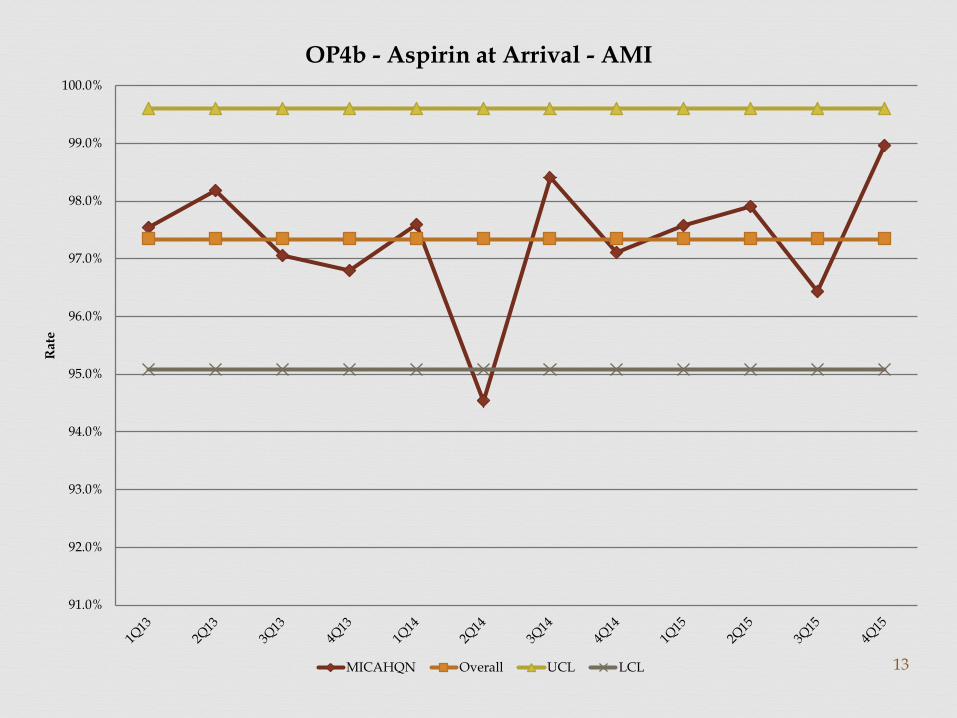
13
91.0%
92.0%
93.0%
94.0%
95.0%
96.0%
97.0%
98.0%
99.0%
100.0%
Ra
te
OP4b - Aspirin at Arrival - AMI
MICAHQN Overall UCL LCL

14
94.0%
95.0%
96.0%
97.0%
98.0%
99.0%
100.0%
Ra
te
OP4c - Aspirin at Arrival - Chest Pain
MICAHQN Overall UCL LCL

15
26
59
54.5
76
7
7
7
26
59.5
56
76
7
8
7
38
38
6
6
6
0 10 20 30 40 50 60 70 80
Median Time to Fibrinolysis
Median Time to Transfer to Another Facility for Acute CoronaryIntervention - Overall
Median Time to Transfer to Another Facility for Acute CoronaryIntervention - Reporting Measure
Median Time to Transfer to Another Facility for Acute CoronaryIntervention - QI Measure
Median Time to ECG - Overall Rate
Median Time to ECG - AMI
Median Time to ECG - Chest Pain
Median Time
OP AMI/CP Continuous Measures - 4Q15
Rural Only Values CAH Only Values MICAHQN Values

16
0
5
10
15
20
25
30
35
40
45
Me
dia
n T
ime
OP1 - Median Time to Fibrinolysis
MICAHQN Overall UCL LCL

17
0
10
20
30
40
50
60
70
80
Me
dia
n T
ime
OP3a - Median Time to Transfer to Another Facility for Acute Coronary
Intervention - Overall
MICAHQN Overall UCL LCL

18
0
10
20
30
40
50
60
70
Me
dia
n T
ime
OP3b - Median Time to Transfer to Another Facility for Acute Coronary Intervention - Reporting
Measure
MICAHQN Overall UCL LCL

19
0
10
20
30
40
50
60
70
80
90
100
Me
dia
n T
ime
OP3c - Median Time to Transfer to Another Facility for Acute Coronary Intervention - QI Measure
MICAHQN Overall UCL LCL

20
0
1
2
3
4
5
6
7
8
9
Me
dia
n T
ime
OP5a - Median Time to ECG - Overall Rate
MICAHQN Overall UCL LCL

21
0
1
2
3
4
5
6
7
8
9
Me
dia
n T
ime
OP5b - Median Time to ECG - AMI
MICAHQN Overall UCL LCL

22
0
1
2
3
4
5
6
7
8
9
Me
dia
n T
ime
OP5c - Median Time to ECG - Chest Pain
MICAHQN Overall UCL LCL

23
112
105
155
189
16
112
105
151
190
16
109.5
102
272
182.5
14
0 50 100 150 200 250 300
Median Time from ED Arrival to ED Departure for Discharged EDPatients - Overall
Median Time from ED Arrival to ED Departure for Discharged EDPatients - Reporting Measure
Median Time from ED Arrival to ED Departure for Discharged EDPatients - Psychiatric/Mental Health Patients
Median Time from ED Arrival to ED Departure for Discharged EDPatients - Transfer Patients
Door to Diagnostic Evaluation by a Qualified Medical Professional
Median Time
OP Emergency Department Throughput - 4Q15
Rural Only Values CAH Only Values MICAHQN Values

24
106
108
110
112
114
116
118
120
122
124
Me
dia
n T
ime
OP18a - Median Time from ED Arrival to ED Departure for Discharged ED Patients
- Overall
MICAHQN Overall UCL LCL

25
98
100
102
104
106
108
110
112
114
116
118
Me
dia
n T
ime
OP18b - Median Time from ED Arrival to ED Departure for Discharged ED Patients - Reporting
Measure
MICAHQN Overall UCL LCL

26
0
20
40
60
80
100
120
140
160
180
200
Me
dia
n T
ime
OP18c - Median Time from ED Arrival to ED Departure for
Discharged ED Patients - Psychiatric/Mental Health Patients
MICAHQN Overall UCL LCL

27
160
165
170
175
180
185
190
195
200
205
210
215
Me
dia
n T
ime
OP18d - Median Time from ED Arrival to ED Departure for Discharged ED Patients - Transfer
Patients
MICAHQN Overall UCL LCL

28
0
5
10
15
20
25
30
Me
dia
n T
ime
OP20 - Door to Diagnostic Evaluation by a Qualified Medical
Professional
MICAHQN Overall UCL LCL

29
62%
67
% 80
%
84%
88
%
90%
91
%
92%
93
%
93%
93
%
95%
95
%
96%
96
%
96%
96
%
96%
98
%
98%
98
%
98%
98
%
98%
10
0%
100%
10
0%
100%
10
0%
100%
10
0%
100%
10
0%
100%
10
0%
100%
10
0%
100%
10
0%
100%
10
0%
100%
0%
10%
20%
30%
40%
50%
60%
70%
80%
90%
100%23 28 37
1Q15
4Q15
-Nat
ion
al 22
3Q15
4Q15 9 10 12
2Q16 25 16 18 31 40
1Q16 15 5 20 27 30 34 6 7 8 11 39 13 14 17 19 21 24 26 29 32 33 35 36 38
EDTC-1 Administrative Communication - 2Q16
Hospital Q2 2016 MICAHQN (95%)

30
53%
80
%
84%
90
%
93%
94
%
96%
96
%
96%
96
%
96%
97
%
97%
98
%
98%
98
%
98%
98
%
98%
10
0%
100%
10
0%
100%
10
0%
100%
10
0%
100%
10
0%
100%
10
0%
100%
10
0%
100%
10
0%
100%
10
0%
100%
10
0%
100%
10
0%
100%
10
0%
0%
10%
20%
30%
40%
50%
60%
70%
80%
90%
100%24 31
1Q15
4Q15
-Nat
ion
al 10 21 13
3Q15 14
4Q15
1Q16
2Q16 22 20 33 34 35 37 40 5 6 7 8 9 11 39 12 15 16 17 18 19 23 25 26 27 28 29 30 32 36 38
EDTC - 2 Patient Information - 2Q16
Hospital Q2 2016 MICAHQN (97%)

31
76%
78
%
83%
90
%
91%
93
%
94%
95
%
95%
95
%
96%
96
%
96%
97
%
97%
97
%
98%
98
%
98%
98
%
98%
98
%
98%
98
%
98%
98
%
100%
10
0%
100%
10
0%
100%
10
0%
100%
10
0%
100%
10
0%
100%
10
0%
100%
10
0%
100%
10
0%
0%
10%
20%
30%
40%
50%
60%
70%
80%
90%
100%24 31
1Q15
4Q15
-Nat
ion
al 10 13 21
3Q15
4Q15 25 8 30
1Q16 12
2Q16 22 6 39 18 27 28 33 34 35 37 14 5 7 9 11 15 16 17 19 20 23 26 29 32 36 38 40
EDTC - 3 Vital Signs - 2Q16
Hospital Q2 2016 MICAHQN (97%)

32
28%
56
% 71
%
76%
80
%
81%
87
%
87%
88
%
89%
92
%
93%
93
%
93%
93
%
93%
93
%
93%
95
%
97%
98
%
98%
98
%
98%
98
%
98%
10
0%
100%
10
0%
100%
10
0%
100%
10
0%
100%
10
0%
100%
10
0%
100%
10
0%
100%
10
0%
100%
0%
10%
20%
30%
40%
50%
60%
70%
80%
90%
100%11 24 31 35 18
1Q15 20 29
4Q15
-Nat
ion
al 7 21
2Q16
4Q15
1Q16 10 13 17 33
3Q15 22 39 30 34 37 40 14 5 6 8 9 12 15 16 19 23 25 26 27 28 32 36 38
EDTC - 4 Medication Information - 2Q16
Hospital Q2 2016 MICAHQN (93%)

33
0%
6%
8%
77%
78
%
84%
84
%
87%
87
%
88%
89
%
89%
89
%
90%
90
%
93%
93
%
94%
95
%
95%
96
%
96%
98
%
98%
98
%
98%
98
%
100%
10
0%
100%
10
0%
100%
10
0%
100%
10
0%
100%
10
0%
100%
10
0%
100%
10
0%
100%
0%
5%
10%
15%
20%
25%
30%
35%
40%
45%
50%
55%
60%
65%
70%
75%
80%
85%
90%
95%
100%
7 11 23
1Q15 31 10 27
4Q15
-Nat
ion
al
2Q16
3Q15 13
1Q16 14 12
4Q15 18 34 21 22 5 17 20 9 30 33 37 40 6 8 39 15 16 19 24 25 26 28 29 32 35 36 38
EDTC - 5 Physician or Practitioner Generated Information - 2Q16
Hospital Q2 2016 MICAHQN (87%)

34
11%
31
% 42
% 56
%
62%
67
%
76%
82
%
82%
87
%
87%
88
%
88%
89
%
90%
90
%
91%
92
%
93%
93
%
93%
93
%
95%
96
%
96%
96
%
96%
98
%
98%
98
%
98%
98
%
98%
10
0%
100%
10
0%
100%
10
0%
100%
10
0%
100%
10
0%
0%
5%
10%
15%
20%
25%
30%
35%
40%
45%
50%
55%
60%
65%
70%
75%
80%
85%
90%
95%
100%11 22 23 24 28 31
1Q15
4Q15
-Nat
ion
al 39
2Q16 14
3Q15
1Q16 13
4Q15 15 36 21 6 9 10 17 25 18 30 33 26 5 20 27 34 35 37 7 8 12 16 19 29 32 38 40
EDTC - 6 Nurse Generated Information - 2Q16
Hospital Q2 2016 MICAHQN (87%)

35
78%
80
%
85%
89
%
89%
92
%
93%
93
%
93%
95
%
95%
96
%
97%
97
%
97%
98
%
98%
98
%
98%
98
%
99%
10
0%
100%
10
0%
100%
10
0%
100%
10
0%
100%
10
0%
100%
10
0%
100%
10
0%
100%
10
0%
100%
10
0%
100%
10
0%
100%
10
0%
50%52%54%56%58%60%62%64%66%68%70%72%74%76%78%80%82%84%86%88%90%92%94%96%98%
100%31 24
1Q15 11 18
4Q15
-Nat
ion
al 10 13 14 22
4Q15 21
1Q16
3Q15
2Q16 17 33 34 35 37 23 5 6 7 8 9 39 12 15 16 19 20 25 26 27 28 29 30 32 36 38 40
EDTC - 7 Procedures and Tests - 2Q16
Hospital Q2 2016 MICAHQN (97%)
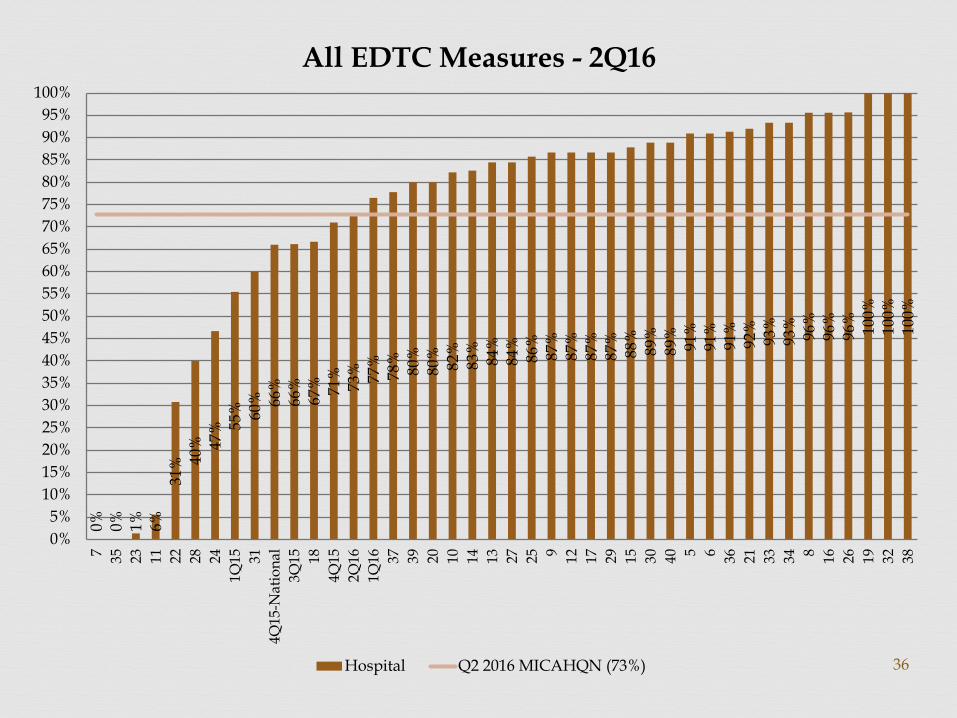
36
0%
0%
1%
6%
31%
40
%
47%
55
%
60%
66
%
66%
67
%
71%
73
%
77%
78
%
80%
80
%
82%
83
%
84%
84
%
86%
87
%
87%
87
%
87%
88
%
89%
89
%
91%
91
%
91%
92
%
93%
93
%
96%
96
%
96%
10
0%
100%
10
0%
0%
5%
10%
15%
20%
25%
30%
35%
40%
45%
50%
55%
60%
65%
70%
75%
80%
85%
90%
95%
100%7 35 23 11 22 28 24
1Q15 31
4Q15
-Nat
ion
al
3Q15 18
4Q15
2Q16
1Q16 37 39 20 10 14 13 27 25 9 12 17 29 15 30 40 5 6 36 21 33 34 8 16 26 19 32 38
All EDTC Measures - 2Q16
Hospital Q2 2016 MICAHQN (73%)

Key Findings:
Hospital Compare Reporting (45 states reporting)
Inpatient
Michigan = 94.4% (#15)
National = 84.7%
Outpatient
Michigan = 100% (#1)
National = 50.7%
Source: https://gallery.mailchimp.com/cb09edc20d550e3cb621eaf9b/files/Michigan_HC16.pdf
37
Flex Monitoring Team State Data Report

Key Findings:
Hospital Compare Reporting (45 states reporting)
Significantly better scores = 9 measures
Significantly worse scores = 3 measures
No significant difference = 22 measures
Insufficient data = 4 measures
Source: https://gallery.mailchimp.com/cb09edc20d550e3cb621eaf9b/files/Michigan_HC16.pdf
38
Flex Monitoring Team State Data Report

Key Findings:
Hospital Compare Reporting (45 states reporting)
Significantly better scores = 9 measures
Significantly worse scores = 3 measures
No significant difference = 22 measures
Insufficient data = 4 measures
Source: https://gallery.mailchimp.com/cb09edc20d550e3cb621eaf9b/files/Michigan_HC16.pdf
39
Flex Monitoring Team State Data Report

Key Findings:
Significantly better scores = 9 measures HF-2 (Evaluation of LVS function) IMM-2 (Immunization for influenza) OP-27/IMM-3 (Healthcare workers given influenza
vaccination) PN-6 (Initial antibiotic selection for pneumonia patient) SCIP-Inf-1 (Preventative antibiotic(s) 1 hour before incision) STK-1 (VTE prophylaxis) STK-6 (Discharged on statin medications) OP-4 (Aspirin at arrival) OP-22 (Patient left without being seen)
Source: https://gallery.mailchimp.com/cb09edc20d550e3cb621eaf9b/files/Michigan_HC16.pdf
40
Flex Monitoring Team State Data Report

Key Findings:
Significantly worse scores = 3 measures VTE-1 (Venous thromboembolism prophylaxis) Michigan = 87.5% (11 CAHs)
National = 89.4% (353 CAHs)
VTE-2 (ICU venous thromboembolism prophylaxis) Michigan = 89.6% (7 CAHs)
National = 93.3% (158 CAHs)
ED-1b (Median time from ED admission to ED departure for admitted patients) Michigan = 238 minutes (11 CAHs)
National = 216 (500 CAHs)
Source: https://gallery.mailchimp.com/cb09edc20d550e3cb621eaf9b/files/Michigan_HC16.pdf
41
Flex Monitoring Team State Data Report