Augmented reality head-up displays: HMI impacts of ... · PDF fileAugmented reality head-up...
13
White Paper Augmented reality head-up displays: HMI impacts of different field-of-views on user experience
-
Upload
phungxuyen -
Category
Documents
-
view
220 -
download
0
Transcript of Augmented reality head-up displays: HMI impacts of ... · PDF fileAugmented reality head-up...
White Paper
Augmented reality head-up displays: HMI impacts of different
field-of-views on user experience
White Paper
Augmented reality head-up display HMI impacts of
different field-of-views on user experience
Gert-Dieter Tuzar¹ and Dr. Alexander Van Laack²
Design Experience Europe, Visteon Electronics Germany GmbH¹
Design Experience Europe, Visteon Innovation & Technology GmbH²
1 Retrospective
Head-up display (HUD) technology in aviation has been known about since the
1940s. It keeps the pilot’s
attention focused outside of the cockpit and supports aircraft control by information
visualization within the pilot’s main sight line on a transparent combiner. What has
been worked out for pilots, also worked for drivers. “The Oldsmobile 1988 Cutlass
Supreme Indianapolis Pace Car and limited edition replica cars were the world’s
first production automobiles equipped with a HUD” (Source: GM). In 2001, GM
featured the first color windshield HUD (W-HUD) with the Corvette.
With the introduction of less expensive combiner HUDs (C-HUD), as an alternative
to W-HUD technology in 2005 by PSA, one can observe a rising market demand
and penetration of both HUD technologies up to this date. Whereas a W-HUD uses
the windshield for picture reflection, the C-HUD utilizes a transparent screen that
works as a reflection plane in front of the windshield. The value of both
technologies are subjectively and objectively measurable – high subjective
acceptance, reduction of driver distraction due to less eye accommodation, eye
adaption, information pick up time, and sight deviations, amongst others (Milicic,
2009).
Depending on optics, technology, and available package, simple C-HUDs can
present information up to 2m in front of the driver’s line of sight. W-HUDs are also
able to present information in a typical distance of 2.5m. In future, automakers will
offer augmented reality HUDs (AR-HUD), pushing the limit for their virtual image
position above 7m. Following these technology trends and our customers’
demands, Visteon’s advanced technology group is additionally developing this
innovative technology.
This paper will focus on the properties that influence drivers’ HUD experience.
From the end-user’s perspective a general question is: What is the benefit of AR-
HUD technology compared with conventional HUD solutions? From designers’
perspective, what could be the requirements in designing HMI for cars with AR-
HUD technology?
Next to the virtual image position, there are a number of additional aspects to
consider such as differences in location of the image within the size of the field-of-
view (FoV), human factor requirements, and the design of the HMI, which means to
define what information is shown where, when and how.
The C-HUD image position can be perceived within the combiner and positioned on
the top of the instrument panel. Since the combiner is transparent, the picture
White Paper
seems to float above the instrument cluster in front of the lower windshield area.
Look-down angles can vary between -2° to -5°. The C-HUD FoV of 3°x1° up to
6°x2.5° is relatively small.
Free of the physical and visible combiner restrictions, the W-HUD image position
can be located higher - which means a smaller viewing angle. The position of the
W-HUD picture is floating above the bonnet, in front of the street. With a FoV from
4°x2° up to 10°x2.5° drivers subjectively perceive almost double the width of the
virtual image. This picture can cover critical traffic environments outside of the
windshield.
AR-HUD images can feature FoVs of up to 17°x6.5°. Their look-down angle can
achieve 0° - which means the image center can be perceived in front of the horizon.
Based on the most frequent use cases this represents a theoretical value, since the
most useful assistance depictions while driving is needed in between the horizon
and the hood. This can be achieved with a look-down angle of 1°. Even the fact that
the virtual image is optically perceived only at 7m does not hinder the driver to bring
this information in context with objects that are much further away. The human
eye’s accommodation (near-far-adjustment) is adjusted to infinite above 4m meters
and the human brain is the greatest “tool” to make sense out of presented visual
information.
Both conventional HUD solutions - C-HUD and W-HUD - can feature driver
information and ADAS representations within the primary sight line. Nevertheless,
C-HUD and W-HUD depictions are not fully augmenting reality one is driving
through. In other words, these two technologies are showing concise information in
a different location. Navigation routing symbols for instance need to be cognitively
processed by the driver and applied into the actual situation. This procedure affords
milliseconds of time and attention resources (Morita, National Traffic Safety and
Environment Laboratory).
In order to reduce cognitive workload while driving, AR-HUD systems could make a
difference to reduce distraction and make driving safer. Driver information,
assistance and attention management can be shown not only in drivers’ line of
sight, but also matching the real traffic environment – a true augmented experience.
Navigation routing for instance can directly point into streets, obstacles can be
directly highlighted, and adaptive cruise control can be directly brought into context
within the FoV. The ideation of possible functional use cases and their benefits is a
huge topic within HMI design experience but might be too much to be listed within
this publication. Also the ongoing technical efforts to increase the FoV up to the
size where the whole windshield might become an AR-HUD display in future.
2 Prospective Challenges
To achieve a believable AR-HUD experience, additional technology to the optical
and mechanical setup is necessary.
1. Eye tracking in order to calculate the right perspective in 3D of the AR HUD
picture.
White Paper
2. An outside oriented camera that constantly analysis and interprets the traffic
situation
3. Background system data available from activated functions e.g. routing.
4. Merging data and picture rendering. It is obvious, that the whole system chain
consisting of data acquisition, and data conversion will lead to latency times
resulting in perceived picture deviations from the optimum. To keep error ratio low
and provide an outstanding HMI experience represents a challenge for us
designers.
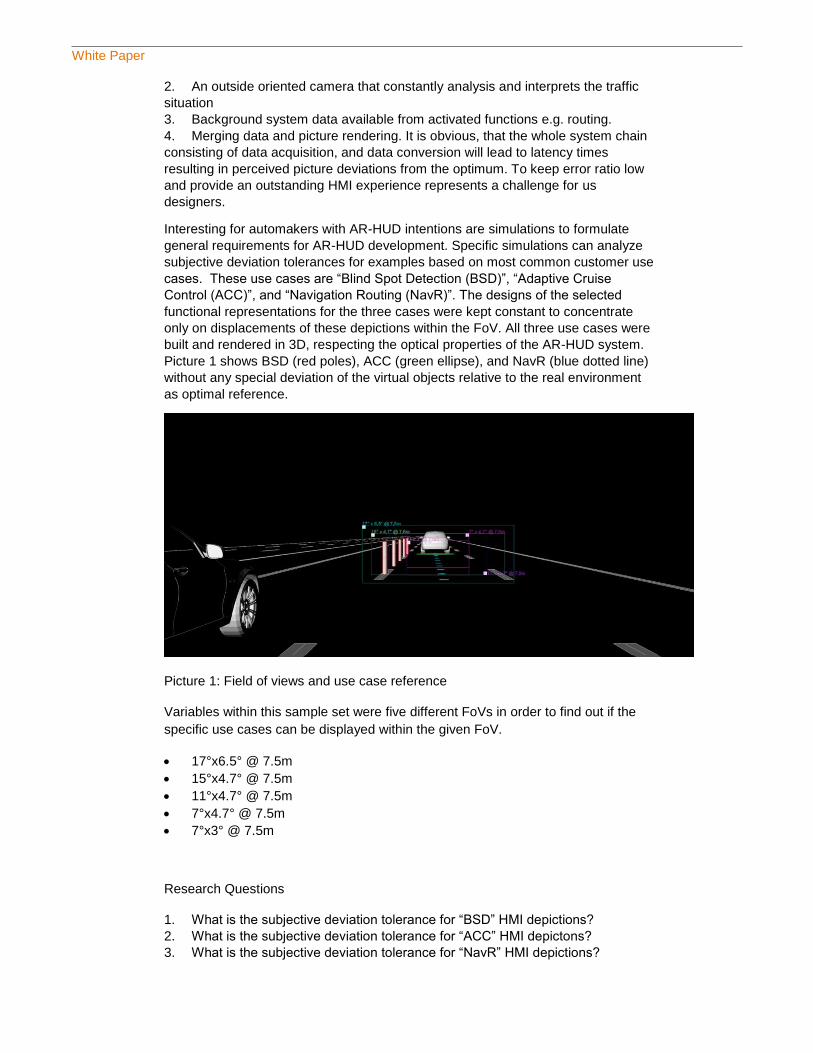
Interesting for automakers with AR-HUD intentions are simulations to formulate
general requirements for AR-HUD development. Specific simulations can analyze
subjective deviation tolerances for examples based on most common customer use
cases. These use cases are “Blind Spot Detection (BSD)”, “Adaptive Cruise
Control (ACC)”, and “Navigation Routing (NavR)”. The designs of the selected
functional representations for the three cases were kept constant to concentrate
only on displacements of these depictions within the FoV. All three use cases were
built and rendered in 3D, respecting the optical properties of the AR-HUD system.
Picture 1 shows BSD (red poles), ACC (green ellipse), and NavR (blue dotted line)
without any special deviation of the virtual objects relative to the real environment
as optimal reference.
Picture 1: Field of views and use case reference
Variables within this sample set were five different FoVs in order to find out if the
specific use cases can be displayed within the given FoV.
17°x6.5° @ 7.5m
15°x4.7° @ 7.5m
11°x4.7° @ 7.5m
7°x4.7° @ 7.5m
7°x3° @ 7.5m
Research Questions
1. What is the subjective deviation tolerance for “BSD” HMI depictions?
2. What is the subjective deviation tolerance for “ACC” HMI depictons?
3. What is the subjective deviation tolerance for “NavR” HMI depictions?
White Paper
Our simulation setup should also help to answer the following research questions
which represent quantitative data for ADAS system requirements and AR-HUD
customer recommendations.
4. What is the objective minimal distance for ACC depictions per FoV?
5. What is the objective minimal distance for depictions pointing in intersections
per FoV?
3 Findings
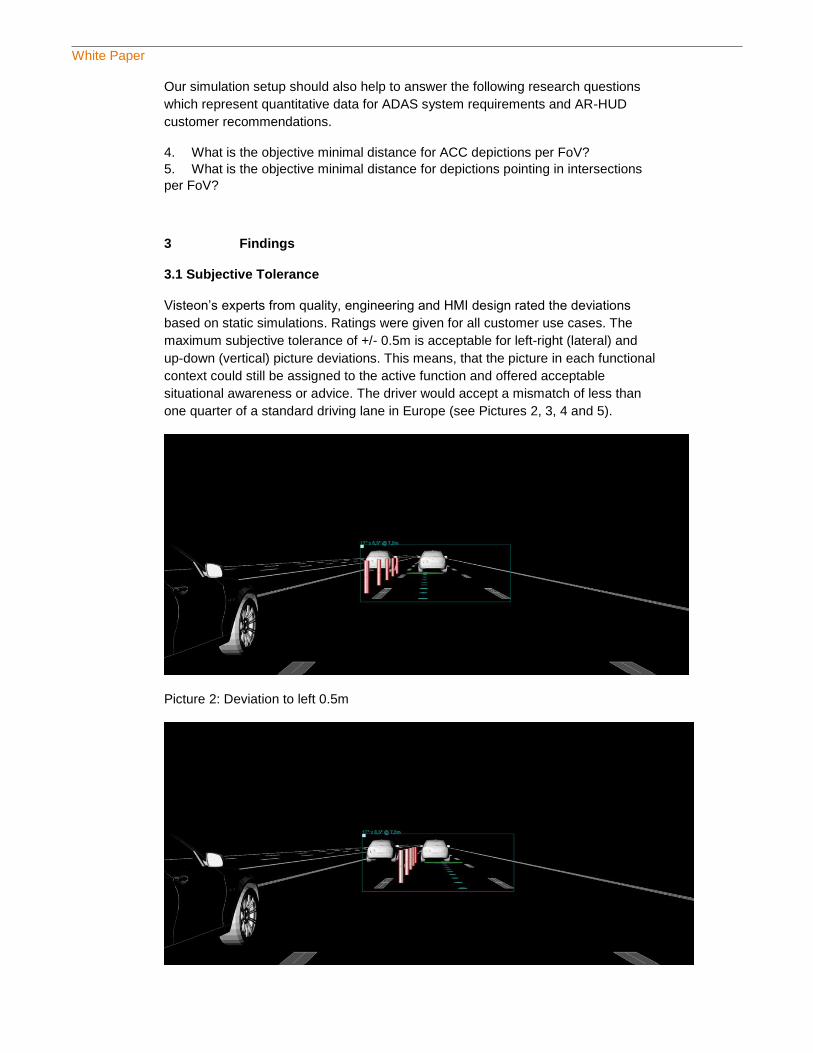
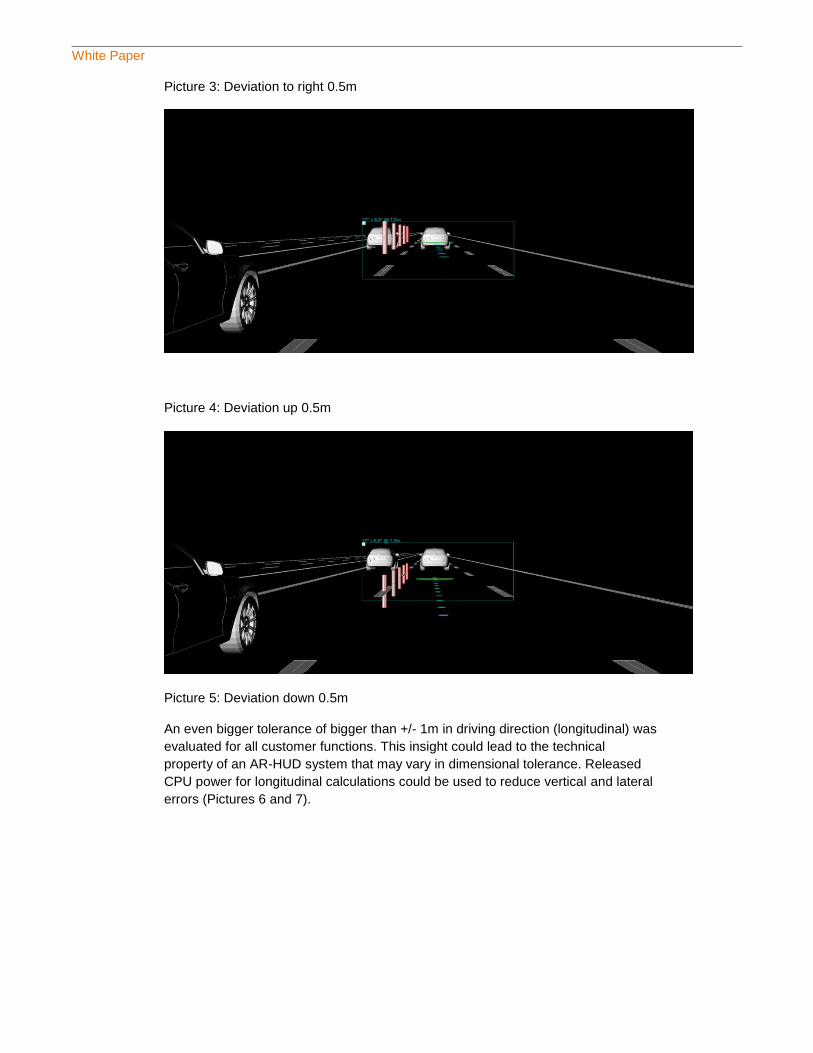
3.1 Subjective Tolerance
Visteon’s experts from quality, engineering and HMI design rated the deviations
based on static simulations. Ratings were given for all customer use cases. The
maximum subjective tolerance of +/- 0.5m is acceptable for left-right (lateral) and
up-down (vertical) picture deviations. This means, that the picture in each functional
context could still be assigned to the active function and offered acceptable
situational awareness or advice. The driver would accept a mismatch of less than
one quarter of a standard driving lane in Europe (see Pictures 2, 3, 4 and 5).
Picture 2: Deviation to left 0.5m
White Paper
Picture 3: Deviation to right 0.5m
Picture 4: Deviation up 0.5m
Picture 5: Deviation down 0.5m
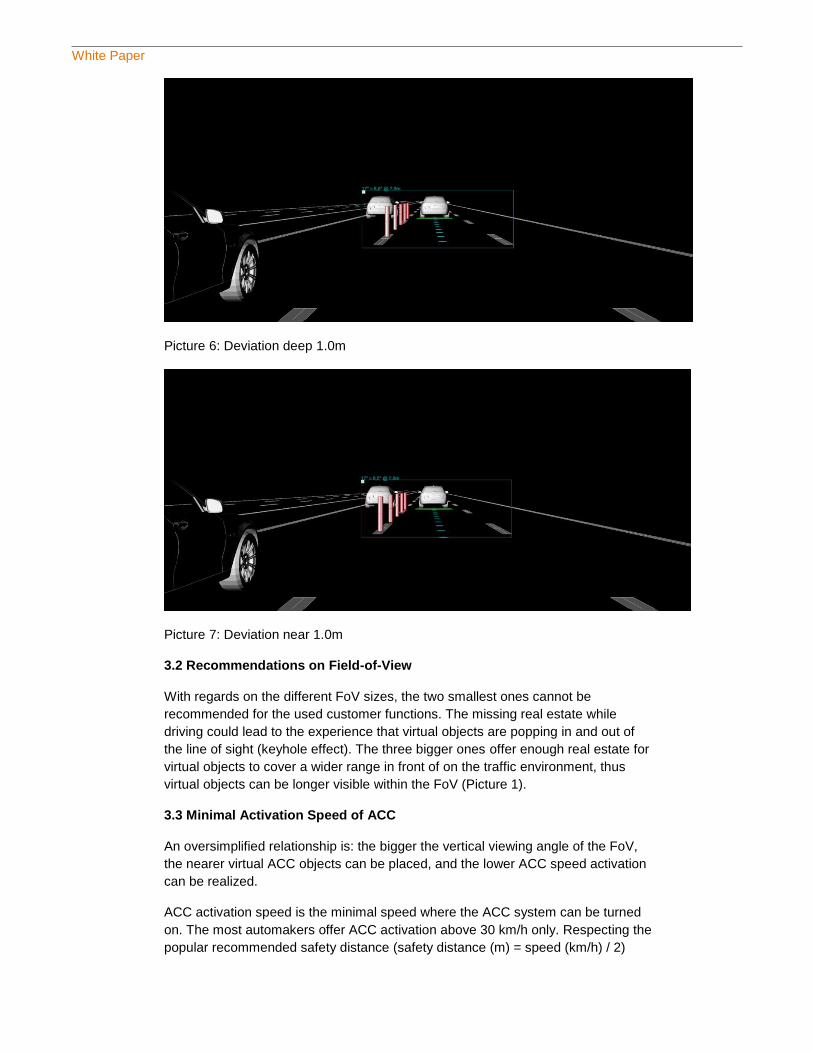
An even bigger tolerance of bigger than +/- 1m in driving direction (longitudinal) was
evaluated for all customer functions. This insight could lead to the technical
property of an AR-HUD system that may vary in dimensional tolerance. Released
CPU power for longitudinal calculations could be used to reduce vertical and lateral
errors (Pictures 6 and 7).
White Paper
Picture 6: Deviation deep 1.0m
Picture 7: Deviation near 1.0m
3.2 Recommendations on Field-of-View
With regards on the different FoV sizes, the two smallest ones cannot be
recommended for the used customer functions. The missing real estate while
driving could lead to the experience that virtual objects are popping in and out of
the line of sight (keyhole effect). The three bigger ones offer enough real estate for
virtual objects to cover a wider range in front of on the traffic environment, thus
virtual objects can be longer visible within the FoV (Picture 1).
3.3 Minimal Activation Speed of ACC
An oversimplified relationship is: the bigger the vertical viewing angle of the FoV,
the nearer virtual ACC objects can be placed, and the lower ACC speed activation
can be realized.
ACC activation speed is the minimal speed where the ACC system can be turned
on. The most automakers offer ACC activation above 30 km/h only. Respecting the
popular recommended safety distance (safety distance (m) = speed (km/h) / 2)
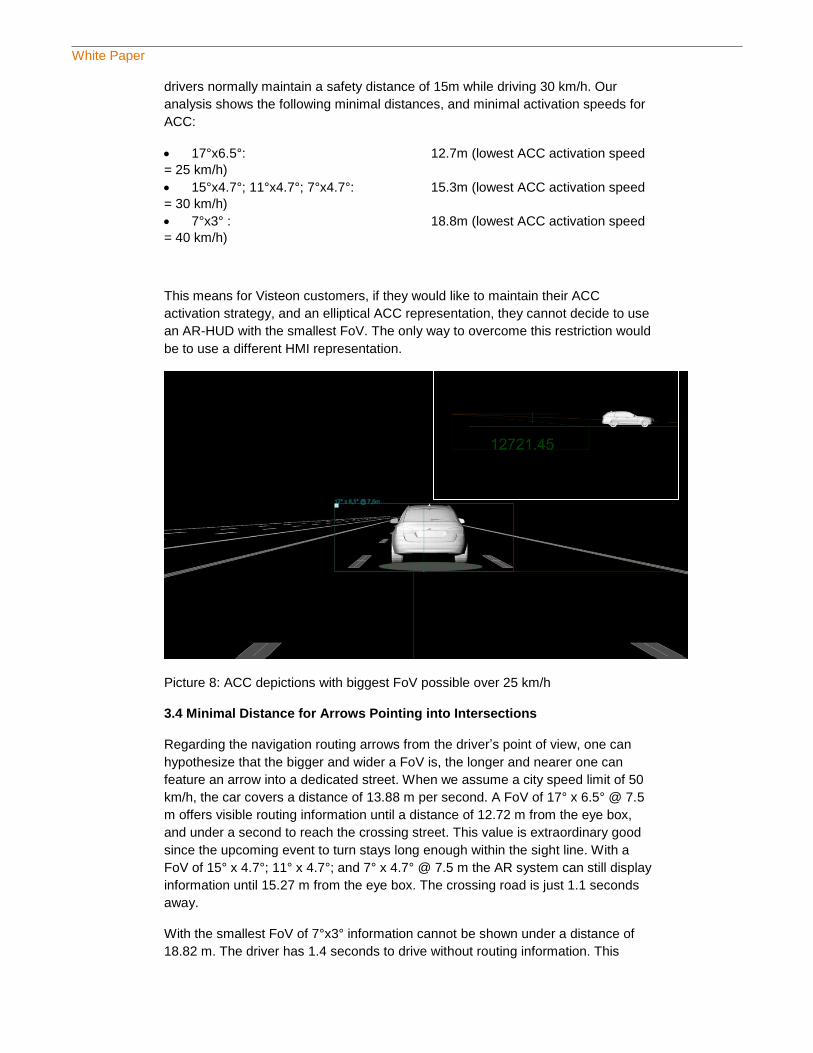
White Paper
drivers normally maintain a safety distance of 15m while driving 30 km/h. Our
analysis shows the following minimal distances, and minimal activation speeds for
ACC:
17°x6.5°: 12.7m (lowest ACC activation speed
= 25 km/h)
15°x4.7°; 11°x4.7°; 7°x4.7°: 15.3m (lowest ACC activation speed
= 30 km/h)
7°x3° : 18.8m (lowest ACC activation speed
= 40 km/h)
This means for Visteon customers, if they would like to maintain their ACC
activation strategy, and an elliptical ACC representation, they cannot decide to use
an AR-HUD with the smallest FoV. The only way to overcome this restriction would
be to use a different HMI representation.
Picture 8: ACC depictions with biggest FoV possible over 25 km/h
3.4 Minimal Distance for Arrows Pointing into Intersections
Regarding the navigation routing arrows from the driver’s point of view, one can
hypothesize that the bigger and wider a FoV is, the longer and nearer one can
feature an arrow into a dedicated street. When we assume a city speed limit of 50
km/h, the car covers a distance of 13.88 m per second. A FoV of 17° x 6.5° @ 7.5
m offers visible routing information until a distance of 12.72 m from the eye box,
and under a second to reach the crossing street. This value is extraordinary good
since the upcoming event to turn stays long enough within the sight line. With a
FoV of 15° x 4.7°; 11° x 4.7°; and 7° x 4.7° @ 7.5 m the AR system can still display
information until 15.27 m from the eye box. The crossing road is just 1.1 seconds
away.
With the smallest FoV of 7°x3° information cannot be shown under a distance of
18.82 m. The driver has 1.4 seconds to drive without routing information. This
White Paper
experience might lead to not acceptable HMI in high density traffic environments
such as city driving. We would not prefer the smallest FoV against the bigger
solutions.
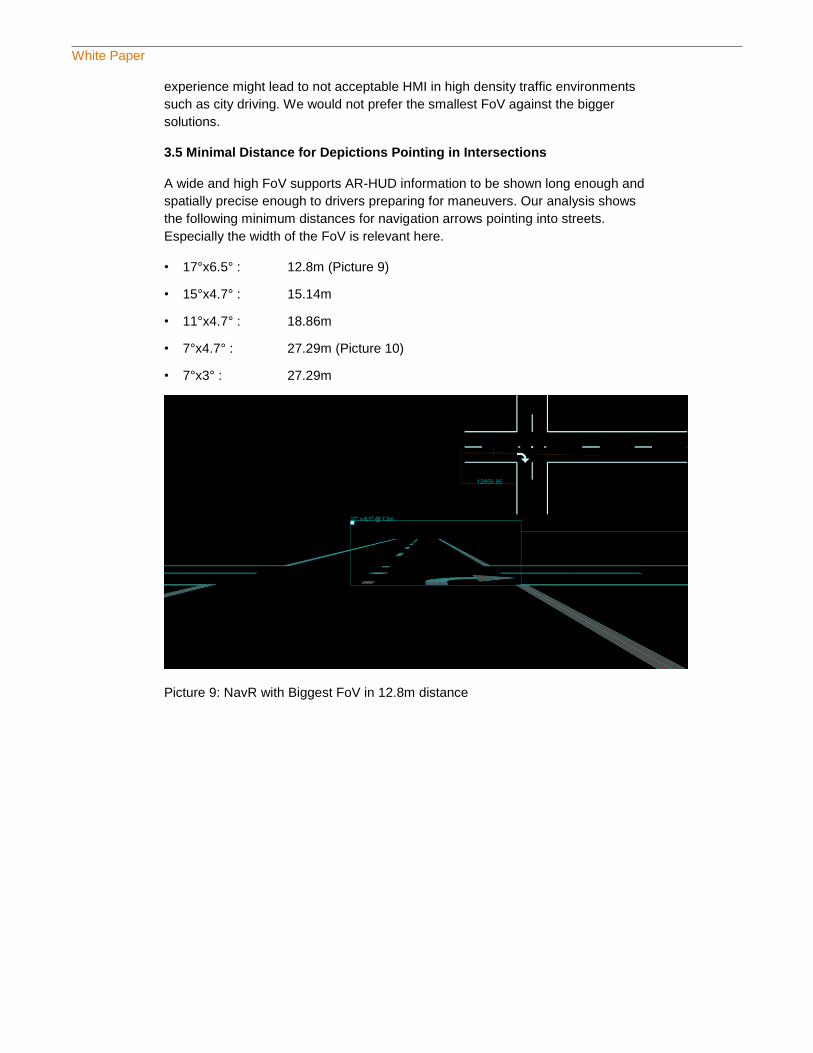
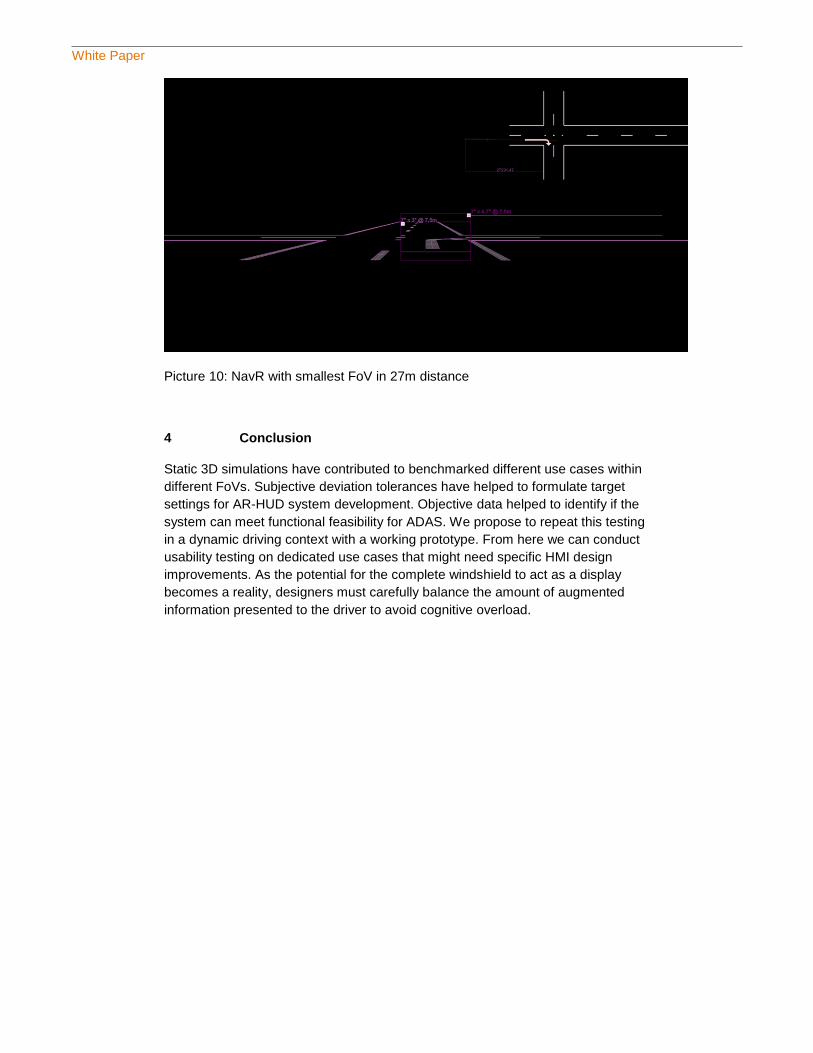
3.5 Minimal Distance for Depictions Pointing in Intersections
A wide and high FoV supports AR-HUD information to be shown long enough and
spatially precise enough to drivers preparing for maneuvers. Our analysis shows
the following minimum distances for navigation arrows pointing into streets.
Especially the width of the FoV is relevant here.
• 17°x6.5° : 12.8m (Picture 9)
• 15°x4.7° : 15.14m
• 11°x4.7° : 18.86m
• 7°x4.7° : 27.29m (Picture 10)
• 7°x3° : 27.29m
Picture 9: NavR with Biggest FoV in 12.8m distance
White Paper
Picture 10: NavR with smallest FoV in 27m distance
4 Conclusion
Static 3D simulations have contributed to benchmarked different use cases within
different FoVs. Subjective deviation tolerances have helped to formulate target
settings for AR-HUD system development. Objective data helped to identify if the
system can meet functional feasibility for ADAS. We propose to repeat this testing
in a dynamic driving context with a working prototype. From here we can conduct
usability testing on dedicated use cases that might need specific HMI design
improvements. As the potential for the complete windshield to act as a display
becomes a reality, designers must carefully balance the amount of augmented
information presented to the driver to avoid cognitive overload.
White Paper
5 References
Gish, K.; Staplin, L. (1995): Human Factors Aspects of Using Head UP Displays in
Automobiles: A Review of the Literature. Report No. 145402-LR. The Scientex
Corporation, Human Factors Division.
Hooey, B.; Gore, B. (1998): Advanced Traveler Information Systems and
Commercial Vehicle Operations Components of the Intelligent Transportation
Systems: Head-Up Displays and Driver Attention for Navigation Information.
Battelle Human Factors Transportation Center (FHWA-RD-96-153).
Israel, B. (2012): Potenziale eines kontaktanalogen Head-up Displays für den
Serieneinsatz. Dissertation. TU München, München. Lehrstuhl für Ergonomie.
Kiefer, R. J. (1998): Defining The "HUD Benefit Time Window". In: A. G. Gale, I. D.
Brown, Haslegrave C. M. und S. P. Taylor (Hg.): Vision in Vehicles, VI. Amsterdam:
Elsevier, S. 133–142.
Lange, C. (2008): Wirkung von Fahrerassistenz auf der Führungsebene in
Abhängigkeit der Modalität und des Automatisierungsgrades. Dissertation. TU
München, München. Lehrstuhl für Ergonomie.
Milicic, N. (2009): Sichere und ergonomische Nutzung von Head-Up Displays im
Fahrzeug. Dissertation. TU München, München. Lehrstuhl für Mensch-Maschine-
Kommunikation.
Schneid, M. (2009): Entwicklung und Erprobung eines kontaktanalogen Head-up-
Displays im Fahrzeug. Dissertation. TU München, München. Lehrstuhl für
Ergonomie.
Stevens, A.; Quimby, A.; Board, A.; Kersloot, T.; Burns, P. (2002): Design
Guidelines for Safety of In-Vehicle Information Systems. Transport Research
Laboratory. TRL Limited.
Milicic, N. (2009): Sichere und ergonomische Nutzung von Head-Up Displays im
Fahrzeug. Dissertation. TU München, München. Lehrstuhl für Mensch-Maschine-
Kommunikation.
Tönnis, M.; Lange, C.; Klinker, G. (2007): Visual Longitudinal and Lateral Driving
Assistance in the Head-Up Display of Cars. In: Mixed and Augmented Reality. IEEE
and ACM International Symposium.
Tretten, P.; Gärling, A.; Nilsson, R.; Larsson, T. (2011): An on-road study of Head-
up Display: preferred location and acceptance levels. In: Human Factors and
Ergonomics Society Conference 2011 (Hg.).
Watanabe, H.; Yoo, H.; Tsimhoni, O.; Green, P. (1999): The Effect of HUD Warning
Location on Driver Responses. University of Michigan Transportation Research
Institute.
Weintraub, D.; Ensing, M. (1992): Human Factors Issues in Head-up Display
Design: The Book of HUD: Crew System Ergonomics Information Analysis Center
(CSERIAC).
White Paper
6 Authors
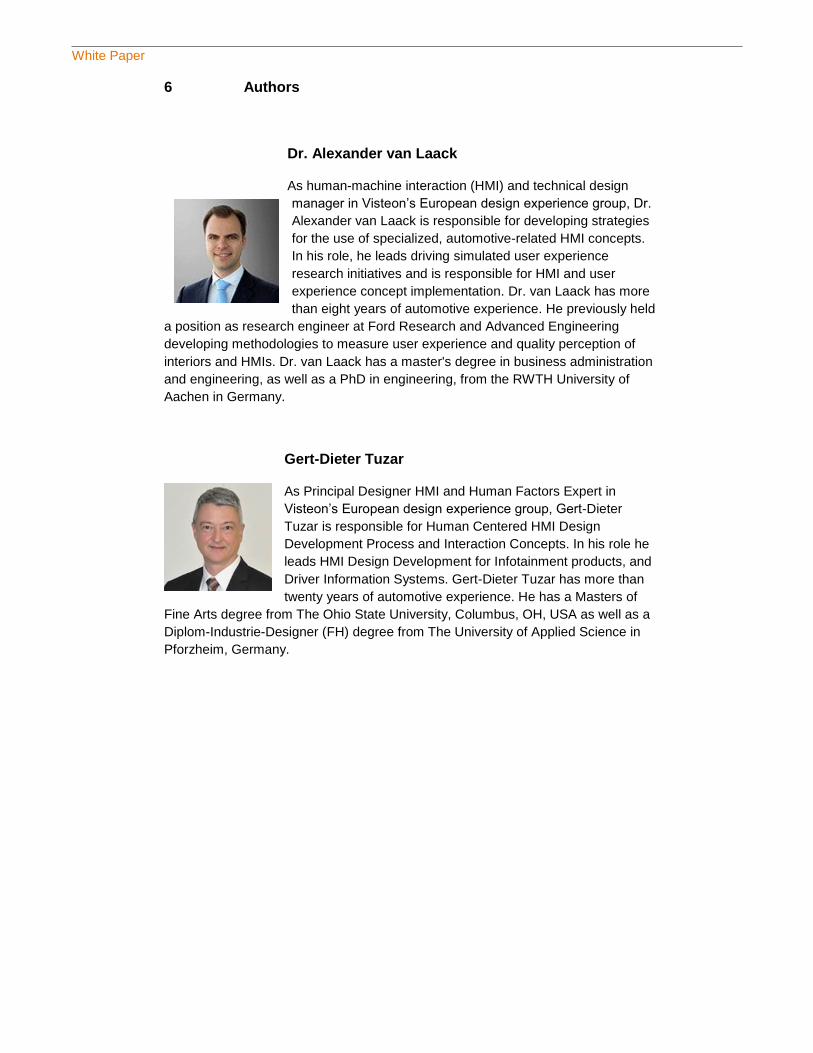
Dr. Alexander van Laack
As human-machine interaction (HMI) and technical design
manager in Visteon’s European design experience group, Dr.
Alexander van Laack is responsible for developing strategies
for the use of specialized, automotive-related HMI concepts.
In his role, he leads driving simulated user experience
research initiatives and is responsible for HMI and user
experience concept implementation. Dr. van Laack has more
than eight years of automotive experience. He previously held
a position as research engineer at Ford Research and Advanced Engineering
developing methodologies to measure user experience and quality perception of
interiors and HMIs. Dr. van Laack has a master's degree in business administration
and engineering, as well as a PhD in engineering, from the RWTH University of
Aachen in Germany.
Gert-Dieter Tuzar
As Principal Designer HMI and Human Factors Expert in
Visteon’s European design experience group, Gert-Dieter
Tuzar is responsible for Human Centered HMI Design
Development Process and Interaction Concepts. In his role he
leads HMI Design Development for Infotainment products, and
Driver Information Systems. Gert-Dieter Tuzar has more than
twenty years of automotive experience. He has a Masters of
Fine Arts degree from The Ohio State University, Columbus, OH, USA as well as a
Diplom-Industrie-Designer (FH) degree from The University of Applied Science in
Pforzheim, Germany.
White Paper
About Visteon
Visteon is a global company that designs, engineers and manufactures innovative cockpit electronics products and
connected car solutions for most of the world’s major vehicle manufacturers. Visteon is a leading provider of
instrument clusters, head-up displays, information displays, infotainment, audio systems, telematics and
SmartCore™ cockpit domain controllers. Visteon also supplies embedded multimedia and smartphone connectivity
software solutions to the global automotive industry. Headquartered in Van Buren Township, Michigan, Visteon has
approximately 10,000 employees at more than 40 facilities in 18 countries. Visteon had sales of $3.25 billion in
2015. Learn more at www.visteon.com.
Visteon Corporation
One Village Center Dr.
Van Buren Township, MI 48188
1-800-VISTEON
www.visteon.com Copyright © 2016 Visteon Corporation