Augmented biosynthesis of cadmium sulfide nanoparticles by genetically engineered Escherichia coli
7
Augmented Biosynthesis of Cadmium Sulfide Nanoparticles by Genetically Engineered Escherichia Coli Yen-Lin Chen Food Industry Research and Development Institute, Hsinchu, Taiwan 300 Hsing-Yu Tuan, Chun-Wen Tien, and Wen-Hsin Lo Dept. of Chemical Engineering, National Tsing Hua University, Hsinchu, Taiwan 300 Huang-Chien Liang Biomedical Engineering Research Laboratories, Industrial Technology Research Institute, Hsinchu, Taiwan 310 Yu-Chen Hu Dept. of Chemical Engineering, National Tsing Hua University, Hsinchu, Taiwan 300 DOI 10.1002/btpr.199 Published online July 23, 2009 in Wiley InterScience (www.interscience.wiley.com). Microorganisms can complex and sequester heavy metals, rendering them promising living factories for nanoparticle production. Glutathione (GSH) is pivotal in cadmium sulfide (CdS) nanoparticle formation in yeasts and its synthesis necessitates two enzymes: c-glutamylcys- teine synthetase (c-GCS) and glutathione synthetase (GS). Hereby, we constructed two recombinant E. coli ABLE C strains to over-express either c-GCS or GS and found that c- GCS over-expression resulted in inclusion body formation and impaired cell physiology, whereas GS over-expression yielded abundant soluble proteins and barely impeded cell growth. Upon exposure of the recombinant cells to cadmium chloride and sodium sulfide, GS over-expression augmented GSH synthesis and ameliorated CdS nanoparticles formation. The resultant CdS nanoparticles resembled those from the wild-type cells in size (2–5 nm) and wurtzite structures, yet differed in dispersibility and elemental composition. The maxi- mum particle yield attained in the recombinant E. coli was 2.5 times that attained in the wild-type cells and considerably exceeded that achieved in yeasts. These data implicated the potential of genetic engineering approach to enhancing CdS nanoparticle biosynthesis in bacteria. Additionally, E. coli-based biosynthesis offers a more energy-efficient and eco- friendly method as opposed to chemical processes requiring high temperature and toxic sol- vents. V V C 2009 American Institute of Chemical Engineers Biotechnol. Prog., 25: 1260–1266, 2009 Keywords: cadmium sulfide (CdS), genetic engineering, glutathione, glutathione synthetase, Escherichia coli, nanoparticles Introduction There is an enormous interest in the synthesis of nanoma- terials, thanks to their unique optical, chemical, photoelectro- chemical, and electronic properties, 1,2 but the development of environmental-friendly and cost-effective synthetic meth- ods still faces challenges. The widely-used synthetic strat- egies generally involve molecular and particulate processing in vacuum or in liquid medium, which however, are capital intensive and are inefficient in materials and energy use. 1,2 Furthermore, many methods for semiconductor nanoparticles preparation require highly toxic solvents, explosive precur- sors, high temperature, and thus are not eco-friendly. To develop clean, nontoxic, and environmentally benign manu- facturing procedures, biosynthesis provides a promising alter- native because a number of microorganisms are capable of producing metal-containing nanoparticles in nature. 1,2 For example, a yeast Torulopsis sp is capable of producing PbS nanocrystals intracellularly when challenged with Pb 2þ . Crystallites extracted from the biomass exhibit a sharp ab- sorbance at 330 nm and are 2–5 nm in size. 3 Among the wide variety of nanoparticles, we were inter- ested in cadmium sulfide (CdS) nanoparticles as they have captured enormous attention as a semiconductor material in diverse applications such as fluorescent labels 4 and optoelec- tronic transistor components. 5 It has been reported that two yeast species, Candida glabrata and Schizosaccharomyces pombe (S. pombe), produce CdS nanoparticles when cultured in the presence of cadmium salts. 6–8 Such biosynthesis is attributed to the function of metal-chelating peptides gluta- thione (GSH) and phytochelatins (PCs). In the presence of heavy metal (e.g., Cd) stress, yeast cells increase the cellular pools of GSH (c-Glu-Cys-Gly) and PCs ((c-Glu-Cys) n -Gly, n ¼ 2–6) which are synthesized from GSH in a heavy metal- dependent reaction. 9 GSH chelates the free metal ions and Correspondence concerning this article should be addressed to Y.-C. Hu at [email protected] or H.-C. Liang at [email protected] 1260 V V C 2009 American Institute of Chemical Engineers
-
Upload
yen-lin-chen -
Category
Documents
-
view
219 -
download
1
Transcript of Augmented biosynthesis of cadmium sulfide nanoparticles by genetically engineered Escherichia coli

Augmented Biosynthesis of Cadmium Sulfide Nanoparticles
by Genetically Engineered Escherichia Coli
Yen-Lin ChenFood Industry Research and Development Institute, Hsinchu, Taiwan 300
Hsing-Yu Tuan, Chun-Wen Tien, and Wen-Hsin LoDept. of Chemical Engineering, National Tsing Hua University, Hsinchu, Taiwan 300
Huang-Chien LiangBiomedical Engineering Research Laboratories, Industrial Technology Research Institute, Hsinchu, Taiwan 310
Yu-Chen HuDept. of Chemical Engineering, National Tsing Hua University, Hsinchu, Taiwan 300
DOI 10.1002/btpr.199Published online July 23, 2009 in Wiley InterScience (www.interscience.wiley.com).
Microorganisms can complex and sequester heavy metals, rendering them promising livingfactories for nanoparticle production. Glutathione (GSH) is pivotal in cadmium sulfide (CdS)nanoparticle formation in yeasts and its synthesis necessitates two enzymes: c-glutamylcys-teine synthetase (c-GCS) and glutathione synthetase (GS). Hereby, we constructed tworecombinant E. coli ABLE C strains to over-express either c-GCS or GS and found that c-GCS over-expression resulted in inclusion body formation and impaired cell physiology,whereas GS over-expression yielded abundant soluble proteins and barely impeded cellgrowth. Upon exposure of the recombinant cells to cadmium chloride and sodium sulfide,GS over-expression augmented GSH synthesis and ameliorated CdS nanoparticles formation.The resultant CdS nanoparticles resembled those from the wild-type cells in size (2–5 nm)and wurtzite structures, yet differed in dispersibility and elemental composition. The maxi-mum particle yield attained in the recombinant E. coli was �2.5 times that attained in thewild-type cells and considerably exceeded that achieved in yeasts. These data implicated thepotential of genetic engineering approach to enhancing CdS nanoparticle biosynthesis inbacteria. Additionally, E. coli-based biosynthesis offers a more energy-efficient and eco-friendly method as opposed to chemical processes requiring high temperature and toxic sol-vents. VVC 2009 American Institute of Chemical Engineers Biotechnol. Prog., 25: 1260–1266,2009Keywords: cadmium sulfide (CdS), genetic engineering, glutathione, glutathione synthetase,Escherichia coli, nanoparticles
Introduction
There is an enormous interest in the synthesis of nanoma-terials, thanks to their unique optical, chemical, photoelectro-chemical, and electronic properties,1,2 but the developmentof environmental-friendly and cost-effective synthetic meth-ods still faces challenges. The widely-used synthetic strat-egies generally involve molecular and particulate processingin vacuum or in liquid medium, which however, are capitalintensive and are inefficient in materials and energy use.1,2
Furthermore, many methods for semiconductor nanoparticlespreparation require highly toxic solvents, explosive precur-sors, high temperature, and thus are not eco-friendly. Todevelop clean, nontoxic, and environmentally benign manu-facturing procedures, biosynthesis provides a promising alter-native because a number of microorganisms are capable of
producing metal-containing nanoparticles in nature.1,2 Forexample, a yeast Torulopsis sp is capable of producing PbSnanocrystals intracellularly when challenged with Pb2þ.Crystallites extracted from the biomass exhibit a sharp ab-sorbance at 330 nm and are 2–5 nm in size.3
Among the wide variety of nanoparticles, we were inter-ested in cadmium sulfide (CdS) nanoparticles as they havecaptured enormous attention as a semiconductor material indiverse applications such as fluorescent labels4 and optoelec-tronic transistor components.5 It has been reported that twoyeast species, Candida glabrata and Schizosaccharomycespombe (S. pombe), produce CdS nanoparticles when culturedin the presence of cadmium salts.6–8 Such biosynthesis isattributed to the function of metal-chelating peptides gluta-thione (GSH) and phytochelatins (PCs). In the presence ofheavy metal (e.g., Cd) stress, yeast cells increase the cellularpools of GSH (c-Glu-Cys-Gly) and PCs ((c-Glu-Cys)n-Gly, n¼ 2–6) which are synthesized from GSH in a heavy metal-dependent reaction.9 GSH chelates the free metal ions and
Correspondence concerning this article should be addressed to Y.-C. Huat [email protected] or H.-C. Liang at [email protected]
1260 VVC 2009 American Institute of Chemical Engineers
subsequently donates them to metal-sequestering PCs.9 Theformation of metal thiolate complex neutralizes the toxicityof Cd2þ ions and traps them inside the cells. Sulfide anionsare readily incorporated into these complexes, resulting inthe formation of CdS nanocrystals. CdS nanoparticles pro-duced from S. pombe have a diameter of �2 nm and exhibitoptical and electric properties that can be harnessed for thefabrication of diodes.10
Besides yeasts, procaryotic bacterium Clostridium ther-moaceticum precipitates CdS on the cell surface and in themedium from cadmium chloride (CdCl2) if cysteine hydro-chloride is present in the growth medium.11 Recently, intra-cellular biosynthesis of CdS nanoparticles is alsodemonstrated in Escherichia coli (E. coli) ABLE C and Tg1strains when the cells are incubated with CdCl2 and sodiumsulfide (Na2S).
12 CdS nanoparticle formation hinges dramati-cally on the growth phase of E. coli and is at least 20-foldhigher in the cells in stationary phase than those in late-ex-ponential phase, and nanoparticles are not detected in mid-exponential phase cells. However, the genetic and molecularbasis of CdS formation in E. coli remains to be elucidated.
GSH is a ubiquitous tripeptide consisting of glutamate,cysteine, and glycine, and is the most abundant intracellularnonprotein thiol compound.13 GSH is consumed in thedetoxification of heavy metal and xenobiotics14 and is a veryefficient free radical scavenger. Intracellular GSH content isregulated by its continued turnover and its de novo synthesisdepends on enzyme activities and cysteine availability.15
Intracellular synthesis of GSH requires ATP and involves atwo-step reaction whereby c-glutamycysteine synthetase (c-GCS) first catalyzes the reaction of cysteine and glutamateto form c-glutamylcysteine. Following this step, glycine isligated to c-glutamycysteine to form GSH in a reaction cata-lyzed by gluthathione synthetase (GS). In E. coli, c-GCS andGS are encoded by the genes gshA and gshB, respectively,and c-GCS over-expression increases the GSH production inE. coli16 and Saccharmyces cerevisiae.17 Additionally, over-expression of GS in Indian mustard enhances its cadmiumaccumulation and tolerance.15
Owing to the pivotal role of GSH in heavy metal toleranceand CdS formation in yeasts, as well as the requirement ofc-GCS and GS for GSH synthesis, we surmised that over-expression of gshA or gshB in E. coli may increase the cor-responding enzyme activities and enhance GSH synthesis,which in turn, may elevate the CdS nanoparticle formation.To test this hypothesis, two recombinant plasmids encodinggshA or gshB were constructed and transformed into E. coliABLE C separately. Our data indicated that GS over-expres-sion in E. coli augmented the intracellular content of GSHand hence improved the production of CdS nanoparticles,thus implicating the potential of genetic engineeringapproach for microbial biosynthesis of nanoparticles.
Materials and Methods
Construction of recombinant plasmids and cells
The gshA and gshB genes flanked by NdeI sites wereamplified by polymerase chain reaction (PCR) from E. coliTg1 (Strategene) using primers P1, P2, P3, and P4 (Table 1).The PCR products were subcloned into a TA-based cloningvector using the T&A cloning vector kit (Real Biotech Corp,Taiwan) to generate plasmids pTA-gshA and pTA-gshB. Forprotein expression, the expression vector pSE380 (Invitro-gen) was chosen. Because the original NcoI site (ccatgg) inpSE380 possessed the start codon that could result in theexpression of recombinant proteins with point mutation, theNcoI site in pSE380 was modified to the NdeI (catatg) sitein two stages. First, the NdeI site located outside the multiplecloning site of pSE380 (nucleotides 2999–3004) was deletedvia PCR-based site-directed mutagenesis. The PCR was per-formed using synthetic primers P5 and P6 (Table 1) andpSE380 as the template, followed by ligation of the ampli-con (4.4 kb). Second, the NcoI site downstream of the trcpromoter was changed to NdeI site by PCR using syntheticprimers P7 and P8 (Table 1) and the ligated plasmid as thetemplate. The amplicon (4.4 kb) was then ligated to form themodified pSE380 plasmid. The final recombinant expressionplasmids, pSE380GshA and pSE380GshB (Figure 1), wereconstructed by individually subcloning the genes in pTA-gshA and pTA-gshB into the NdeI site in the modifiedpSE380, so that c-GCS and GS expression was transcription-ally controlled by the trc promoter and inducible by IPTG(isopropyl-b-D-thiogalactopyranoside). The size, orientation,and sequence of gshA or gshB in the recombinant plasmidswere confirmed by PCR, restriction enzyme digestion andsequencing (data not shown), respectively. These plasmidswere transformed into E. coli ABLE C (Strategene) bystandard calcium chloride transformation method for expres-sion and CdS nanoparticle production.
Cell growth and induction
E. coli ABLE C harboring either pSE380GshA orpSE380GshB was selected following standard molecular
Table 1. Primer Sequences for PCR
Primer Gene Sequence
P1 gshA-F (NdeI) 50-gaggtccatatgatcccggacgtatcacaP2 gshA-R (NdeI) 50-ttctcatatgtcaggcgtgtttttccagccacacgP3 gshB-F (NdeI) 50-ggagaagacatatgatcaagctcggcatcgP4 gshB-R (NdeI) 50-aaggcatatgttactgctgctgtaaacgtgcttcP5 pSE380-1F 50-gtgcactctcagtacaatctP6 pSE380-1R 50-cggtgtgaaataccgcacagP7 pSE380-2F 50-ggtcgtatacagacaaaggacacactttaacP8 pSE380-2R 50-actggtgcagcaccttacgga
Figure 1. Schematic illustration of plasmids pSE380GshA andpSE380GshB.
The genes were flanked by NdeI sites and under the transcrip-tional control of trc promoter so that gene expression wasinduced by IPTG. Term denotes the transcription terminationsequence and Lac O denotes the lac operator.
Biotechnol. Prog., 2009, Vol. 25, No. 5 1261

cloning techniques, resuspended in Luria-Bertani (LB) me-dium (Difco), plated onto agar plates containing LB mediumand 100 lg/mL ampicillin, and cultivated at 37�C overnight.Colonies were picked, inoculated into 15 mL round-bot-tomed culture tubes containing 3-mL LB medium, and culti-vated with rotation (50 rpm) at 37�C for 12 h. After theenrichment step, 0.5-mL broth was inoculated into 250 mLshake flasks containing 50-mL LB medium and cultivatedwith shaking (200 rpm) at 37�C. The cell growth was moni-tored by measuring the optical density at 600 nm (OD600)throughout the culture. The expression of recombinant c-GCS or GS was induced by adding IPTG at different finalconcentrations (1, 5, or 10 mM) when OD600 reached �0.5at 3 h postinoculation.
Analysis of c-GCS and GS expression by SDS-PAGE
After IPTG induction, the cells continued to be cultivatedfor another 13 h and were harvested. The cells were soni-cated and centrifuged (13,000g, 10 min) to separate the celllysate (supernatant) and cellular debris (pellet). Total proteinconcentrations in the lysate and the debris were measured bya protein assay kit (Bio-Rad Laboratories). Same amounts ofproteins were loaded to 12% slab gels for sodium dodecylsulfate-polyacrylamide gel electrophoresis (SDS-PAGE). Thebands on the SDS-PAGE gels were scanned and quantifiedby scanning densitometry using Scion Image Shareware(Scion Corporation).
Quantification of GSH concentration
The GSH concentration was assayed in triplicate spectro-photometrically based on the reaction between GSH and5,50-dithiobis-2-nitrobenzoate (DTNB) as described.18 Inbrief, the cells were cultivated as described earlier andinduced by IPTG (1, 5, or 10 mM) at 3 h postseeding. Cyste-ine was added together with IPTG to the culture (final con-centration ¼ 1 mM) because cycteine is a limiting substratefor GSH synthesis and cysteine addition to the culture me-dium increases the GSH level in Lactococcus lactis.19 Theculture continued for another 13 h when stationary phasewas reached. Wild-type cells were cultivated in an identicalmanner to serve as the control. A portion of the cells (24mL) was washed by phosphate-buffered saline (PBS, pH7.2), centrifuged, and then resuspended in 7.2-mL PBS. Thecells were challenged with 0.8-mL CdCl2 (final concentration¼ 1 mM) for 0, 20, 40, or 60 min to stimulate the GSH syn-thesis. Then the cells were centrifuged (12,000g, 20 min),resuspended in 8 mL ddH2O, sonicated, and pelleted again.The lysate (200 lL) was mixed with 800-lL Tris buffer (0.1M Tris-HCl, 1 mM EDTA, pH 8.0) and 25-lL dithioerythri-tol solution (2 mM) and incubated at room temperature. Onehour later, 50-lL DTNB (10 mM, in 0.1 mM phosphatebuffer, pH 7.5) was added to the mixture and the reactioncontinued for another 15 min. The absorbance of the reactionproduct 5 mercapto-2-nitrobenzoic acid was measured at 412nm. The standard curve was generated using known amountsof GSH (Sigma) for the quantification.
Biosynthesis and analysis of CdS nanoparticles
Biosynthesis of CdS nanoparticles was performed asdescribed earlier12 with minor modifications. The cells werecultivated and induced as described earlier. Likewise, cyste-ine was supplemented to the medium at 3 h postinoculation
to enhance GSH synthesis. The cells were cultivated foranother 13 h and entered stationary phase. A portion of thecells (24 mL) was harvested, washed by PBS, resuspendedin PBS, and challenged with CdCl2 as described earlier.Twenty minutes later, 10 mM Na2S was slowly added to themixture to a final concentration of 1 mM, and the tube (pro-tected from light) was rotated (20 rpm) at room temperaturefor CdS nanoparticles formation.
CdS nanoparticles were quantified indirectly by measuringthe intracellular Cd concentration with an InductivelyCoupled Plasma Optima Optical Emission Spectrometer(ICP, Kontron). At different time points following Na2Saddition, the cells were centrifuged and washed three timeswith PBS. The final wash buffer was analyzed by ICP toensure that no residual Cd was present on the cell surface.The cells were then resuspended in 1-mL ddH2O, lysed bysonication, and centrifuged again (12,000g, 20 min) to sepa-rate the pellet and the lysate. The concentrations of Cd inthe lysate (ppm) were quantified by ICP and converted tomilligram CdS per gram dry cell weight (mg/g DCW).
Transmission electron microscopy (TEM) and highresolution TEM (HRTEM)
CdS nanoparticles were produced as described earlier andcharacterized by transmission electron microscopy (TEM)and energy dispersive X-ray spectroscopy (EDS). The cellswere harvested 90 min after Na2S addition, washed withPBS three times, resuspended in ddH2O, sonicated, and cen-trifuged (12,000g, 10 min) to separate the cellular debris andsupernatant containing the CdS nanoparticles. TEM sampleswere prepared by floating ultra carbon film-coated coppergrids (TED Pella) onto 5-lL CdS nanoparticle solution for 5min. The excess solution on TEM grids was removed by fil-ter paper, and the grids were dried in an oven at 60�C over-night. The samples were visualized with a low-resolutionTEM (H-7500, Hitachi) operating at 120 KeV, or with ahigh-resolution TEM (HRTEM, JEM-2010, JEOL) operatingat 200 KeV. The images were captured digitally with aGatan DigitalMicrograph system. EDS was performed on theHRTEM (JEM-2010) equipped with a spectrometer (LinkISIS 300).
Statistical analysis
All quantitative data were analyzed using independentsamples t-tests and are expressed as means � standard devia-tions (SD) of three independent experiments. P \ 0.05 wasconsidered significant.
Results
Growth curves of recombinant cells andconfirmation of protein expression
The recombinant plasmids (pSE380GshA and pSE380GshB)harboring gshA and gshB were constructed (Figure 1), andE. coli ABLE C was selected as the host cell as it wasshown to be capable of CdS nanoparticle production.12 Toexamine whether plasmid transformation and IPTG induc-tion affected the cell growth, the cells harboring eitherpSE380GshA or pSE380GshB were induced with IPTG (1,5, or 10 mM) at 3 h postinoculation and continued to becultivated for another 13 h. The wild-type E. coli ABLE Ccells were cultivated in parallel without IPTG induction
1262 Biotechnol. Prog., 2009, Vol. 25, No. 5

and served as the control. When compared with the wild-type cells, Figure 2a unravels hampered cell growth uponIPTG induction of the cells carrying pSE380GshA even atan IPTG concentration as low as 1 mM. In contrast, IPTGinduction of the cells harboring pSE380GshB did not nega-tively influence the cell growth (Figure 2b).
To confirm the expression of c-GCS and GS, the cellswere harvested at 16 h postinoculation and the cell lysateand debris containing inclusion bodies were analyzed bySDS-PAGE. As illustrated in Figure 3a, thick bands whosemolecular mass corresponded to that of c-GCS (�55 kD)were detected in the debris of the pSE380GshA-transformedcells, but not in that of the wild-type cells; also the band in-tensity increased with the IPTG concentration, thereby con-firming the c-GCS expression. c-GCS was barely detectablein the cell lysate, suggesting that c-GCS over-expression pri-marily led to the formation of inclusion bodies. For thepSE380GshB-transformed cells (Figure 3b), raising the IPTGconcentration overly elevated the expression of GS (�35kD) in the cell lysate but only minor bands indicative of GSwere detectable in the debris, implying that IPTG inducedthe expression of GS that was mainly present in solubleform.
The percentages of soluble GS in the cell lysate wereestimated by scanning densitometry of the SDS-PAGE gels.Figure 3c delineates that GS accounted for �5% of totalsoluble proteins in the wild-type cells, but induction of thepSE380GshB-transformed cells with 1 mM IPTG signifi-cantly increased the percentage to �21%, which further roseto �33% upon 5 mM IPTG induction. Increasing the IPTGconcentration to 10 mM marginally elevated the percentageto �35%.
Enhanced synthesis of GSH and CdS nanoparticlesin the cells over-expressing GS
Because c-GCS over-expression gave rise to inclusionbody formation and hindered cell growth, which were indica-tive of impaired cell physiology, all subsequent experimentswere performed using the cells over-expressing GS. Toexplore whether GS over-expression augmented the GSHsynthesis, the recombinant cells were cultivated and inducedwith IPTG as in Figure 3 and the cells were harvested at 16h postinoculation when the cells entered stationary phase.This timing was chosen because the CdS nanoparticles for-mation in E. coli ABLE C occurred predominantly in thestationary phase.12 GSH synthesis was stimulated by cellexposure to CdCl2 which imparted the metal stress, and in-tracellular GSH concentrations were measured at differenttime points.
Immediately after CdCl2 addition (0 min), the GSH con-centrations in all groups were similar (Figure 4a) becauseGS is not rate limiting for GSH synthesis in the absence ofheavy metals.15 Without GS over-expression, the GSH con-centration remained stable at �4 lmol/g DCW in the wild-type cells from 0–60 min presumably due to the continued
Figure 2. Effects of transformation and IPTG induction oncell growth.
The recombinant E. coli ABLE C harboring either pSE380G-shA (a) or pSE380GshB (b) were inoculated into the shakeflasks and induced with IPTG at 3 h postinoculation. The cellswere sampled for OD600 measurements at different time points.Wild-type cells were cultivated in parallel as the control.Arrows indicate the induction timing.
Figure 3. Analysis of c-GCS and GS expression.
(a) SDS-PAGE analysis of the proteins from the pSE380GshA-transformed cells. (b) SDS-PAGE analysis of the proteins fromthe pSE380GshB-transformed cells. (c) The percentage of GSin the lysate of pSE380GshB-transformed cells as estimated byscanning densitometry. The cells were cultivated and inducedwith IPTG as in Fig. 2 and were harvested at 16 h postinocula-tion. Wild-type cells were cultivated in parallel as the control.The cell lysate and debris were separated by centrifugation andanalyzed by SDS-PAGE. The data are representative of threeindependent culture experiments. M, molecular weight marker.W, wild-type cells. *P\ 0.05.
Biotechnol. Prog., 2009, Vol. 25, No. 5 1263

synthesis and consumption of GSH. In marked contrast, withGS over-expression the GSH concentration in the recombi-nant cells induced with 1 mM IPTG increased significantly(P \ 0.05, when compared with the wild-type cells) to �5.5lmol/g DCW in 20 min, and steadily increased to �7.0lmol/g DCW in 60 min, confirming that GS over-expressionelevated GSH synthesis upon exposure to CdCl2. Increasingthe IPTG concentration to 5 and 10 mM further increasedthe GSH concentrations to �8.7 and �8.6 lmol/g DCW,respectively, at 60 min postchallenge.
To correlate the GSH production and CdS formation, thecells were cultivated, induced with IPTG and challengedwith CdCl2 as in Figure 4a, but 20 min after CdCl2 additionNa2S was supplemented to stimulate the formation of CdSnanoparticles. Because no reliable methods for nanoparticlequantification are currently available, the amounts of intra-cellular CdS were indirectly quantified by ICP at differenttime postaddition as described.12,20 Figure 4b confirms thatthe amount of intracellular CdS in all groups increasedsteadily with time. Strikingly, the recombinant cells pro-duced significantly more (P \ 0.05) CdS than the wild-typecells at as early as 20 min, at which time 10 mM IPTGresulted in the highest CdS production. Nevertheless, at theend point (60 min) the 1 mM IPTG group led to the mostabundant CdS accumulation (�14.4 mg/g DCW), which was
�2.5 times that of the control (�5.9 mg/DCW) at 60 min.Figures 4a,b collectively demonstrate that GS over-expres-sion concurred with the elevated GSH synthesis and intracel-lular CdS accumulation, but exceedingly high GSH synthesis(e.g., induction with 5 or 10 mM IPTG) did not proportion-ally improve the CdS accumulation.
Characterization of CdS nanoparticles producedfrom the recombinant E. coli
The CdS nanoparticles were synthesized and extracted asdescribed in Materials and Methods and characterized byTEM. It should be noted that the samples were not nega-tively stained, thus only electron-dense particles (e.g., CdS)were observable. The TEM images revealed particles of sim-ilar size derived from all groups, regardless of IPTG concen-trations. Intriguingly, nanoparticles from the wild-type cellshad a higher propensity to aggregate as huge nanoparticleclusters (Figure 5a), whereas the particles from the recombi-nant cells appeared to exhibit better dispersion as feweraggregates were observed (Figures 5b–d). However, no dif-ference in dispersibility was observed between the CdSnanoparticles produced from different IPTG groups.
CdS nanoparticles from the wild-type (Figure 6a) andrecombinant cells induced with 1 mM IPTG (Figure 6b)were further characterized by HRTEM, which confirmed thatthe CdS nanoparticles exhibited single crystal structures. The2.9 nm CdS nanoparticle (indicated by the arrow in Figure6b) had a d spacing of 0.332 nm, corresponding to the (002)plane in wurtize CdS. The fast fourier transforms (FFTs)obtained from the fields of particles (the insets of Figures6a,b) revealed rings corresponding to the d spacing of 0.357nm and 0.333 nm which can be indexed to the (100) and(002) lattice planes in wurtize CdS, respectively. These dataaltogether confirmed the wurtize nature of the particles.
Figure 4. Effects of GS over-expression on the intracellularsynthesis of GSH (a) and CdS nanoparticles (b).
The recombinant cells harboring pSE380GshA were cultivatedand induced with IPTG. Note that at 3 h postinoculation cyste-ine was added to a final concentration of 1 mM. The cells wereharvested at 16 h postinoculation and GSH synthesis wasboosted by exposing the cells to CdCl2 (final concentration ¼ 1mM). Intracellular GSH concentrations were measured at dif-ferent time points after CdCl2 challenge. The CdS productionwas triggered by sequential addition of CdCl2 and Na2S (finalconcentration ¼ 1 mM) and was indirectly quantified by ICP atdifferent time points after Na2S addition. The original Cd con-centrations in the sample (ppm) were converted to mg/g DCW.All data represent the averages �SD of three independent cul-ture experiments. *P\ 0.05.
Figure 5. TEM images of CdS nanoparticles synthesized fromE coli ABLE C.
(a) Wild-type; (b) recombinant cells induced with 1 mM IPTG;(c) recombinant cells induced with 5 mM IPTG; (d) recombi-nant cells induced with 10 mM IPTG. Images are representa-tive of the particles produced from three independent cultureexperiments. Bar, 100 nm.
1264 Biotechnol. Prog., 2009, Vol. 25, No. 5
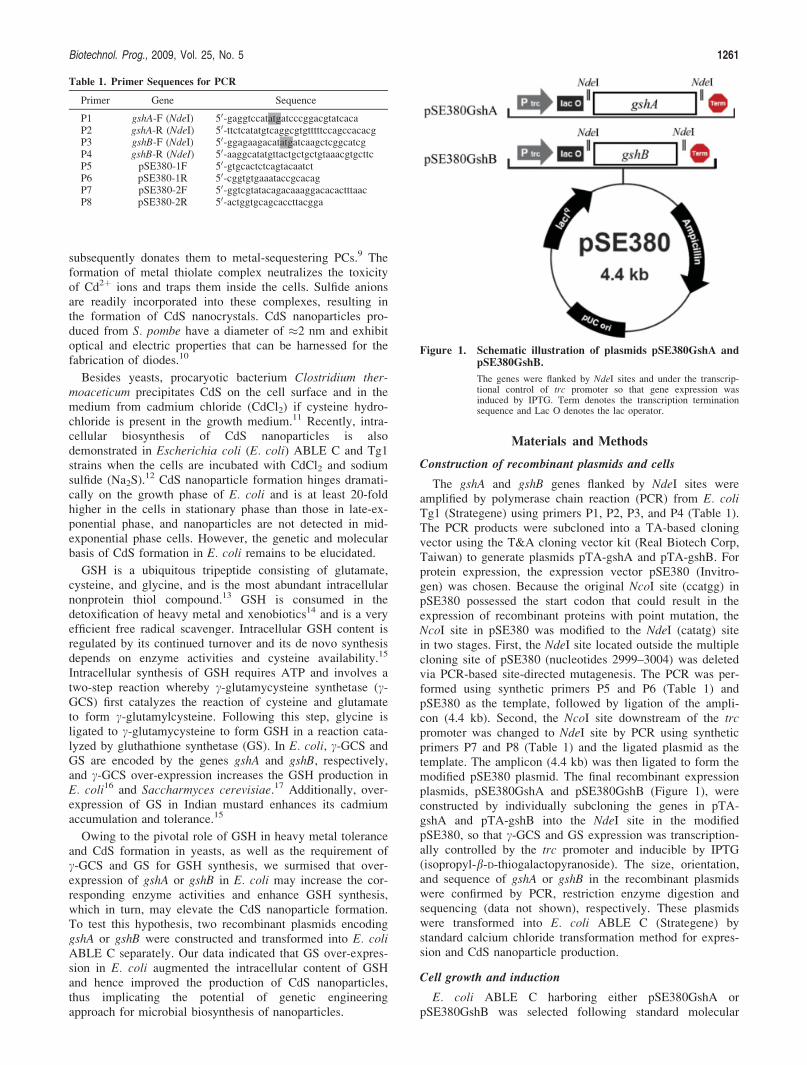
The energy dispersive X-ray spectrum (EDS) obtainedfrom the fields of nanoparticles (Figure 6) also attested thepresence of Cd and S in the particles extracted from thewild-type (Figure 7a) and recombinant cells (Figure 7b).Because the samples were not purified, other noise signals inthe EDS presumably stemmed from the cellular components(e.g., C and O) or from the TEM grids (e.g., C, Cu, and Si).The atomic ratio of Cd/S in the particles from the wild-typecells was 1.07 (Table 2), which accurately corresponded tothe elemental composition of Cd and S in the CdS particles.Conversely, the Cd/S ratio in the particles from the recombi-nant cells was 0.74.
Discussion
Glutathione (GSH) is an important antioxidant tripeptidein living cells against oxidative stress and also plays a keyrole in CdS nanocrystals synthesis in yeasts.21 As such, theoverriding objective of this study was to genetically engineerE. coli ABLE C, a bacterium recently shown to allow forCdS nanoparticle formation,12 hoping that the over-expres-sion of c-GCS or GS leads to CdS nanoparticles over-pro-duction. Although no Western blot analyses were performeddue to the lack of cognate antibodies, Figures 2 and 3 collec-tively indicated that IPTG induction of E. coli ABLE C har-boring pSE380GshA led to the expression of c-GCS in theform of inclusion body and impaired the cell growth,whereas IPTG induction of the recombinant cells harboring
pSE380GshB gave rise to abundant expression of GS insoluble form and barely impeded the cell growth.
Furthermore, GS over-expression in the recombinant cellsparalleled the elevated GSH synthesis (Figure 4a) and hencethe increased production of CdS nanoparticles (Figure 4b) af-ter addition of CdCl2 and Na2S. It should be emphasizedthat although ICP indirectly measured the intracellular Cdcontent rather than directly quantified the CdS particles, Cdis not normally present inside the cells hence the intracellu-lar accumulation of Cd was indicative of CdS particle forma-tion. The maximum yield of CdS nanoparticles attained by 1mM IPTG induction reached 14.4 mg/g DCW, which notonly was �2.5 times that of the wild-type E. coli ABLE C(5.9 mg/g DCW) but also considerably exceeded the yieldachieved by S. pombe (�1.4 mg/g DCW).10 Nevertheless,induction with higher IPTG concentrations (e.g., 5 and 10mM) and the ensuing elevated GS over-expression and GSHsynthesis did not further improve the production levels ofCdS nanoparticles (Figures 3 and 4), suggesting that over athreshold GSH concentration other factors (e.g., the avail-ability and feeding strategy of CdCl2 and Na2S precursors,etc.) restricted the CdS production.
Importantly, the resultant particles resembled the CdSnanoparticles produced from the wild-type cells in size (2–5nm, Figures 5 and 6) and the hexagonal wurtzite latticestructures (Figure 6), which concurred with the size andcrystal structure of CdS nanoparticles synthesized from thewild-type E. coli ABLE C as reported earlier.12 Yet it was
Figure 6. HRTEM images of CdS nanoparticles synthesizedfrom E. coli ABLE C.
(a) Wild-type cells; (b) recombinant cells induced with 1 mMIPTG. The FFTs (insets of (a) and (b)) were obtained from thecorresponding TEM images, and the d spacings of the tworings in the FFTs (0.357 and 0.333 nm) agreed with the refer-ence values (0.359 and 0.336 nm) for wurtize CdS (100) and(002), respectively. The lattice spacing of 0.332 nm of a nano-particle indicated by the arrow corresponded to the (002) planeof wurtize CdS.
Figure 7. EDS spectrums obtained from CdS nanoparticlesimaged by TEM as shown in Figure 6a (a) and Fig-ure 6b (b), respectively.
The C and O peaks resulted from the cell lysates while C, Cu,and Si signals possibly originated from the carbon film-coatedcopper TEM grid.
Table 2. The Ratio of Cd/S in the Particles Produced from the
Wild-Type and Recombinant Cells
Element
Wild-Type 1 mM IPTG Group
Weight% Atomic% Weight% Atomic%
S 21.00 48.23 27.75 57.38Cd 79.00 51.77 72.25 42.62Cd/S 1.07 0.74
Biotechnol. Prog., 2009, Vol. 25, No. 5 1265

intriguing that the CdS nanoparticles from the recombinantcells exhibited better dispersibility and contained a higherfraction of S than Cd, when compared with those from thewild-type cells (Figure 7 and Table 2). Because CdS nano-particles synthesized in microorganisms are capped withshort peptides such as GSH or PC21,24 and the amount ofGSH capped to CdS nanoparticles influences the particleproperties,21 the discrepancy in dispersibility and elementalcomposition presumably originated from the enhanced GSHproduction and surface coating of GSH and/or PC on thenanoparticle in the recombinant cells. Further characteriza-tion of the particle properties and investigations of this hy-pothesis are underway.
Conclusions
In summary, we have shown that GS over-expression inE. coli ABLE C in conjunction with metal stress simultane-ously enhance the biosynthesis of intracellular GSH and CdSnanoparticles, and induction with 1 mM IPTG is sufficient toelevate the yield of CdS nanoparticles considerably whencompared with the wild-type cells. These data implicate thepotential of genetic engineering approach to enhancing theCdS nanoparticle biosynthesis in bacteria and unravel theimportance of GS and GSH in this process. Although biosyn-thesis of CdS nanoparticles has been demonstrated in othermicroorganisms, our approach is advantageous not only inthe improved yield but also in that industrial-scale biopro-cess of E. coli fermentation has been well established, hencefuture mass production is simple. As opposed to chemicalsynthesis processes which require high temperature and toxicorganic solvents, E. coli-based biosynthesis is conducted at37�C and obviates the need of toxic solvents, thus represent-ing a more energy-efficient and eco-friendly method alterna-tive to chemical synthesis. At present, this study aims toexplore the feasibility of using genetic engineering techni-ques for CdS nanoparticle over-production and subsequentprocess optimization to improve the yield is needed. Becausethe yield and properties are critically dependent on cell phys-iology and availability of precursors (e.g., cysteine, CdCl2and Na2S), process optimization may be performed byadjusting the cultivation method (e.g., altering medium for-mulation and induction timing), changing precursor concen-tration and feeding strategy, or further engineering theintracellular CdS processing pathway. As GSH also formscomplexes with Zn2þ and Pb2þ,21 this genetic engineeringapproach may also be extended to the over-production ofother semiconductor nanoparticles including PbS and ZnS.
Acknowledgments
The authors gratefully acknowledge the financial supportfrom the National Tsing Hua University Booster Program(96N2511E1), CGMH-NTHU Joint Research Program(CGTH96-T8 and CMRPG361041), and National ScienceCouncil (NSC 96-2627-B-007-018), Taiwan.
Literature Cited
1. Klaus-Joerger T, Joerger R, Olsson E, Granqvist C-G. Bacteriaas workers in the living factory: metal accumulating bacteriaand their potential for materials science. Trends Biotechnol.2001;19:15–20.
2. Mandal D, Bolander ME, Mukhopadhyay D, Sarkar G, Mukher-jee P. The use of microorganisms for the formation of metalnanoparticles and their application. Appl Microbiol Biotechnol.2006;69:485–492.
3. Kowshik M, Vogel W, Urban J, Kulkarni SK, Paknikar KM.Microbial synthesis of semiconductor Pbs nanocrystallites. AdvMater. 2002;14:815–818.
4. Jaiswal JK, Mattoussi H, Mauro JM, Simon SM. Long-termmultiple color imaging of live cells using quantum dot biocon-jugates. Nat Biotechnol. 2003;27:47–51.
5. Brown KR, Lidar DA, Whaley KB. Quantum computing withquantum dots on quantum linear supports. Phys Rev A. 2002;65:012307-1-19.
6. Krumov N, Oder S, Perner-Nochta I, Angelov A, Posten C.Accumulation of Cds nanoparticles by yeasts in a fed-batch bio-process. J Biotechnol. 2007;132:481–486.
7. Dameron CT, Smith BR, Winge DR. Glutathione-coated cad-mium-sulfide crystallites in Candida Glabrata. J Biol Chem.1989;264:17355–17360.
8. Dameron CT, Reese RN, Mehra RK, Kortan AR, Carroll PJ,Steigerwald ML, Brus LE, Winge DR. Biosynthesis of cad-mium-sulfide quantum semiconductor crystallites. Nature. 1989;338:596–597.
9. Mendoza-Cozatl D, Loza-Tavera H, Hernandez-Navarro A,Moreno-Sanchez R. Sulfur assimilation and glutathione metabo-lism under cadmium stress in yeast, protists and plants. FEMSMicrobiol Rev. 2005;29:653–671.
10. Kowshik M, Deshmukh N, Vogel W, Urban J, Kulkarni SK,Paknikar KM. Microbial synthesis of semiconductor Cds nano-particles, their characterization, and their use in the fabricationof an ideal diode. Biotechnol Bioeng. 2002;78:583–588.
11. Cunningham DP, Lundie LL Jr. Precipitation of Cadmium byClostridium Thermoaceticum. Appl Environ Microbiol. 1993;59:7–14.
12. Sweeney RY, Mao C, Gao X, Burt JL, Belcher AM, GeorgiouG, Iverson BL. Bacterial biosynthesis of cadmium sulfide nano-crystals. Chem Biol. 2004;11:1553–1559.
13. Li Y, Wei G, Chen J. Glutathione: a review on biotechno-logical production. Appl Microbiol Biotechnol. 2004;66:233–242.
14. Coblenz A, Wolf K. The role of glutathione biosynthesis inheavy metal resistance in the fission yeast SchizosaccharomycesPombe. FEMS Microbiol Rev. 1994;14:303–308.
15. Zhu YL, Pilon-Smits EA, Tarun AS, Weber SU, Jouanin L,Terry N. Cadmium tolerance and accumulation in indian mus-tard is enhanced by overexpressing gamma-glutamylcysteinesynthetase. Plant Physiol. 1999;121:1169–1178.
16. Murata K, Kimura A. Cloning of a gene responsible for the bio-synthesis of glutathione in Escherichia Coli B. Appl EnvironMicrobiol. 1982;44:1444–1448.
17. Fan X, He X, Guo X, Qu N, Wang C, Zhang B. Increasing glu-tathione formation by functional expression of the gamma-gluta-mylcysteine synthetase gene in Saccharomyces Cerevisiae.Biotechnol Lett. 2004;26:415–417.
18. Anderson ME. Determination of glutathione and glutathione sul-fide in biological samples. Methods Enzymol. 1985;113:548–555.
19. Li Y, Hugenholtz J, Sybesma W, Abee T, Molenaar D. UsingLactococcus Lactis for glutathione overproduction. Appl Micro-biol Biotechnol. 2005;67:83–90.
20. Lima AIG, Corticeiro SC, Figueira E. Glutathione-mediatedcadmium sequestration in Rhizobium Leguminosarum. EnzymeMicrob. Technol. 2006;39:763–769.
21. Bae W, Mehra RK. Properties of glutathione- and phytochelatin-capped Cds bionanocrystallites. J Inorg Biochem. 1998;69:33–43.
22. Hatcher EL, Chen Y, Kang YJ. Cadmium resistance in A549cells correlates with elevated glutathione content but not antiox-idant enzymatic activities. Free Radic Biol Med. 1995;19:805–812.
Manuscript received July 24, 2008, and revision received Nov. 17, 2008.
1266 Biotechnol. Prog., 2009, Vol. 25, No. 5