AUDITORY ACUITY FOR PURE TONES IN THE WAKING …
65
AUDITORY ACUITY FOR PURE TONES IN THE WAKING AND HYPNOTIC STATES AS MEASURED BY SEMANTIC AND ACCURACY INDICATORS by JAMES TRAVIS YATES, B.A. A THESIS IN SPEECH Submitted to the Graduate Faculty of Texas Technological College in Partial Fulfillment of the Requirements for the Degree of MASTER OF ARTS Approved Accepted August, 0^
Transcript of AUDITORY ACUITY FOR PURE TONES IN THE WAKING …

AUDITORY ACUITY FOR PURE TONES IN THE WAKING
AND HYPNOTIC STATES AS MEASURED BY
SEMANTIC AND ACCURACY INDICATORS
by
JAMES TRAVIS YATES, B.A.
A THESIS
IN
SPEECH
Submitted to the Graduate Faculty of Texas Technological College in Partial Fulfillment of the Requirements for
the Degree of
MASTER OF ARTS
Approved
Accepted
August, 0^

r\ fc-V7 " -~\ ^ " I
k(L
rs /\j I f - ^ ACKNOWLEDGEJ'ENTS
^cyp. <S The author is indebted to many who have given
encouragement to him throughout the preparation of this
thesis, especially the following:
William Keith Ickes, Ph.D., Professor of Speech
and director of this thesis, for his continued encourage
ment throughout this study, his expressions of confidence
in the author, and his unselfish contributions of time
and knowledge which made this work possible.
Paul Merville Larson, Ph.D., Hea:* oT the Depart
ment of Speech, ZOT expressions of confidens., in the
author as he hac pursued his course of studies c<t Texas
Technological College.
Undergraduate students in tne speech and hearing
therapy program v;ho served as subjects in Lhis study and,
in many instances, contributed valuable suggestions and
help in the study.
Mrs. Pamela Best Moore, an undergraduate in the
speech therapy program, who was especially helpful during
the conditioning of subjects and in testing the subjects.
Mrs. Nita Gayle Kirkpatrick Yates, the author*s
wife, for her encouragement, and for editing, proofreading,
and typing this work.
11

TABLE OF CONTENTS
ACKNOWLEDGEMENTS ii
LIST OF TABLES v
LIST OF ILLUSTRATIONS vi
I. INTRODUCTION . 1
II. METHODS AND PROCEDURES l6
Instrumentation 17
Audiometer 17
Earphones 17
Attenuator • . 17
Test CharTiber IS
^ , Calibration IS
Audio Stimulus 20
Selection and Training of Subjects . . . 20
Subjects 20
Hypnosis Training 21
Criterion for Hypnosis 21
Testing 24
Condition I 28
Condition II 31
Condition III 33
Condition IV 34
111

iv
III. EXPERIMENTAL RESULTS 36
Experimental Conditions 36
Frequencies 40
IV. SUMMARY AxND CONCLUSIONS 44
Instrumentation 45
Selection and Training of Subjects . . . 46
Experimental Procedures 47
Results 4S
Discussion 49
Conclusions 54
BIBLIOGRAPHY 56
APPENDIX 59
A. Subject Thresholds for Each Frequency Under Each Exoerimental Condition 59

• 'V
LIST OF TABLES
Table
1. Audiometer Calibration Readings Before, During, and After Testing 19
2. The Four Experimental Conditions 24
3. The Experimental Design 26
4. Probability of Responding Correctly to the Stimulus by Guessing 31
5. Analysis of Variance 37
6. Significant Variance of Scores for the Experimental Conditions 3^
7. Significant Variance of Scores for Frequencies 41

LIST OF ILLUSTRATIONS
Figure
1. Mean Thresholds for Subjects by Conditions 39
2. Mean Thresholds of All Subjects by Frequencies 42
VI

CHAPTER I
Introduction
Historically the field of psychophysics has attempted
to produce more accurate and efficient threshold determi
nants. The achievement of superior measures has resulted
from improving existing procedures and developing new ones.
In practical work, the audiologist is constantly striving
to produce lower thresholds of hearing and, at the same time,
to improve accuracy and reliability. Toward this goal many
new ideas have been advanced, some radical and some common
place. This is as it should be for any procedure, piece of
apparatus, or idea which might improve our knowledge of the
function of hearing is certainly within the province of
investigation. It was interest in intrtving audiological
technique that prompted this investigator to evaluate hypnosis
as a possible tool in diagnostic and research audiometry.
It was felt that hypnosis offered definite possibilities as
a useful technique in audiometries and that the scarcity of
research dealing specifically with hypnosis as an adjunct
to hearing testing and research represented a serious deficit.
The formal use of hypnosis in medicine and therapy
has had a short but active career. Hypnotism's basic origins
are shrouded in antiquity. Some students of the phenomena
1
•""^v-:

of hypnosis compare modern hypnosis to the "temple sleep"
and incubation (the practice of artificially induced sleep)
used by the early Egyptian priests in the temples of Isis
and Serapis in the treatment of nervous disorders.^
Generally, however, the beginning of the practice
as we know it is credited to Freidrich Anton (Franz) Mesmer,
a Viennese physician who first used hypnosis as such in
1796.^
Mesmer, who claimed to be able to cure many diseases
by means of "animal magnetism," was a controversial figure
working with a controversial subject and although his
"magnetism" theories were later disproved, he at least
opened the way for speculation and investigation.-^
Experiments by one of Dr. Mesmer*s pupils, the
Marquis Maxime de Puysegur, resulted in the popular con
ception of the day that a mesmerized person was similar to
a somnambulist and that a person in such a condition of
trance might be especially amenable to suggestions which
could have theraputic value.^ De Puysegur was actually
George Barton Cutter, Ph.D., Three Thousand Years of Mental Healing (New York: Charles Scribner^s Sons, 1911), pp. 26, 27.
^Daniel Cohen, "Franz Mesmer: Humbug or First Hypnotist?" Science Digest, (July, 1961), pp. 73, 74.
^"Hypnotism," Encyclopedia Britannica, 13th ed., Vol. XII, pp. 23, 24.
^Cohen, p. 76.

able to effect "vague temporary results" with certain
patients through the use of artificially induced sleep.^
Hypnosis as we know it today is largely the pro
duct of work by Dr. James Braid of Manchester, England,
who endorsed part but not all of Mesmer*s ideas. It was
Braid who coined the word "neuro-hypnotism." This phrase,
derived from the Greek, words for nerve and sleep, means
"nervous sleep." Dr. Braid then suggested that the pre
fix be dropped for convenience and therefore produced the
currently popular term "hypnotism."^ Braid believed that
the sleep produced by naturalistic means, or mesmerism
(i.e., without drugs) was natural and due to fatigue.^
In 1^62, Jean Martin Charcot, the foremost neurologist
and physiologist of his day, disagreed with the then pre
valent Nancy theory that both hypnosis and hysteria were
due to suggestion. Charcot insisted that hypnosis was
dependent upon physiological processes as well as upon
suggestion: that is, he rejected the idea that persons
capable of being hypnotized were hysterical.^
• Ibid., 76.
^James Braid, M.D., Braid on Hypnotism (New York: The Julian Press, Inc., I960), p. 94.
^Cohen, p. 60.
S^alter J. Coville e_t al,., Abnormal Psychology (New York: Barnes and Noble, Inc., I960), p. 21.
akiJ.;.i'? --•11 k- •.

America was slower than Europe to accept hypnosis
as a possible scientific fact or as a tool to use in the
study and treatment of behavior. G. H. Estabrooks compares
the American and European attitudes as follows:
In America we have been a little unfortunate in our introduction to hypnotism. Most of us have made its acquaintance via the stage and the "professional" whereas in Europe these public exhibitions of hypnotism are generally not allowed. As a result we find in almost every town of any size some doctor who is an authority on the subject and uses it as needed in his practice.
Fortunately, this very neglect by the medical pro
fession put the study of hypnosis back into the psychological
laboratory. Reported applications of hypnosis were infre
quent until World War II. Both professional and lay interest
in hypnosis began to increase in the early 1940^s.
Hypnotism for all its effect and usefulness is
still not fully understood. Boring speaks of this mystery
thusly:
...at the height of Mesmer*s tremendous popularity, the French government offered a reward to him for the disclosure of his secret. Mesmer "refused" to disclose it. He had no secret to disclose...the methods resembled the hocus pocus of charlantry; Mesmer would not divulge the "secret"; he was denounced as an im-poster...Ever since this time "mesmerism," as it soon came to be called, has been held in poor repute among most educated persons, and yet Mesmer discovered certain fundamentals about the method of inducing hypnosis. ...Everybody, the committees and his disciples, knew all that he did, but could not realize that a man could know how to use a power without understanding its nature... the scientists who repudiated him shut their
G. H. Estabrooks, Hypnotism (New York: E. P. Dutton and Company, Inc., 1957), pp. 33-34.
k-.-

eyes to an important scientific discovery because they could not,stomach the conditions of its demonstration.
The author first became interested in hypnosis as
a possible tool for use in stuttering therapy. In this
framework, the study of hypnosis was undertaken with Wm. K.
Ickes, Ph.D. The author learned the hypnotic procedures,
studied hypnosis and its ramifications, and began a program
of experimental hypno-therapy among a select group of
stutterers.
In the course of research in the general area of
hypnosis, it was found that very little research had been
done relative to the effects of hypnosis on psychophysical
measures, particularly in the area of audiometries. The
scarcity of information available in the area of hypnosis
as applied to diagnostic and research audiometry led to
more specific research and eventually culminated in the
research being reported here.
Probably the most thoroughly researched problem
in this area is that of hysterical deafness. The relative
wealth of information on this topic may be a direct result
of earlier use of hypnosis in the treatment of hysterical
disorders.^ The use of hypnosis in the treatment of
- Edwin G. Boring, History of Psychology and Science (New York: John Wiley and Sons, Inc., 19o3), pp. 63-73.
^Coville, p. 79.

hysterical deafness was generally abandoned in favor of
other theraputic means. This retreat was a result of the
findings of Freud, Charcot, and Breuer that in many cases
where hypnotherapy had initially been successful and the
patient*s symptoms relieved, the illness subsequently
reappeared in another form with a different set of symptoms.
Evidently, the "cure" had been superficial—nothing more
than a temporary alleviation of the symptoms.-
Another widely researched area using hypnosis has
been that of hypnotically induced deafness. Studies of
hypnotically induced deafness often employ a "startle
reaction" to sudden, proximate, loud sound as a behavioral
criterion. Elimination or retardation of general motoric
startle responses in hypnotically induced deafness has been
reported by Dynes, Erickson, Kline et al., una Malmo et al.
The results of the studies by Dynes, Erickson, Kline et al.,
and Malmo et al., were taken as indicative of proof of
hypnotically induced deafness. However, other evidence is
conflicting. Dynes, for example, found that three of his
subjects admitted afterward that they heard the sound, 2
despite giving no startle reaction. Kline et al., tested
^J. P. Chaplin and T. S. Krawiec, Systems and Theories of Psychology (New York: Holt, Rinehart, and Winston, 1963), p. 57.
2j. B. Dynes, "An Experimental Study in Hypnotic Anesthesia," Journal of Abnormal and Social Psychology^ XXVII, No. 1 (April, 1932), p. 79.

subjects for startle response under hypnosis. One subject
who did not exhibit the startle response was the object of
further investigation. A delayed feedback apparatus was
employed to further investigate the effects of hypnotically
induced deafness. The delayed feedback test allows the
subject*s speech to be played back to him after a.quarter-
second delay. This delay is achieved through use of elec
trical or mechanical equipment such as especially designed
tape recording equipment. When the subject's speech is
played back to him with this delay, speech impairment
generally results. Kline found that subjects given the
delayed feedback test under hypnosis exhibited the disruption
of speech commonly found in subjects in the waking state.
The disruption in the speech of hypnotized subjects was
markedly reduced as compared to their waking state performance,
however.
In another investigation of hypnotically induced
deafness, Malmo et al., utilized eyeblink startle response
to test the effects of hypnotic suggestion that the subjects
would not hear pure tones. In this study, a pure tone was
used as the signal that a puff of air was forth coming.
This puff of air, directed at the eye, produced an eyeblink.
After a few trials, the tone itself elicited this eyeblink
Milton V. Kline £t a^., "An Experimental Study of the Nature of Hypnotic Deafness: Effects of Delayed Speech Feedback," Journal of Clinical and Experimental Hypnosis, II (April, 1954), pp. 145-156.
i.Vi ' : ...

3
through conditioning. The conditioned eyeblink was found
to persist under hypnosis as determined by electromyographic
recordings.
Pattie utilized a widely known phenomena of audition
known as "beats" to test hypnotically induced deafness.
In 1929, E. G. Wever reported research in which he stimu
lated the ear with two sinusoids of equal intensity and
gradually increased their separation along the frequency
scale. Wever found that as the frequency separation was
increased, the tone took on an intermittent, throbbing
quality (beats). The essential condition for "beats" is
that the two frequency components of the stimulus affect
overlapping segments of the basilar membrane. The basilar
membrane, a part of the anatomical structure of the cochlea,
is the location of the nerve endings which are instrumental
in analyzing sound. When sound impinges upon the ear, it
is transmitted mechanically and hydraulically to the
basilar membrane. When the basilar membrane is displaced,
nerves are innervated and the sensations produced are trans
mitted to the cortex. Pattie suggested to his hypnotized
subjects that one ear was deaf and then presented
Robert Malmo ejt aJ. , ''Electromyographic Study of Hypnotic Deafness," Journal ©£ Clinical and Experimental Hypnosis, II (October, 1954), pp. 305-317.
^S. G. Wever, "Beats and Related Phenomena Resulting from the Simultaneous Sounding of Two Tones," Psychological Review, XXVI, No. 1 (January, 1929), pp. 402-418, 512-523.

simultaneously two tones of slightly different frequency,
one to each ear. The subject reported hearing a beating
sound, which is the expected effect when both ears are
functioning normally. Erickson, on the other hand, con
ditioned hand withdrawal to a buzzer, and reported that
hypnotically induced deafness abolished the conditioned
response.
The purpose of this paper is to investigate the
effects of hypnosis on the human threshold for pure tones.
The feasibility of obtaining pure tone thresholds from
hypnotized subjects has been demonstrated by Schneck and
Bergman. In a study published in 1949, Drs. Schneck and
Bergman investigated auditory acuity for pure tones in sub
jects under hypnosis. This study was undertaken as a part
of a much larger study of the phenomena of hypnosis. While
this study failed to show a consistent improvement in hearing
acuity under hypnosis as compared to thresholds obtained
from the same subject in the waking state, some of Schneck
and Bergman's subjects did show significantly lower thres
holds under hypnosis as compared to their waking thresholds.-^
• Frank A. Pattie, "The Genuineness of Unilateral Deafness Produced by Hypnosis," American Journal of Psychology, LXIII, No. 1 (January, 1950), p. So.
Eugene E. Levitt and John Paul Brady, "Psychophysiology of Hypnosis," Hypnosis in Modern Medicine, ed. J. M. Schneck (Springfield, Illinois: Charles C. Thomas, 1963), pp. 337-33S.
^J. M. Schneck and Moe Bergman, "Auditory Acuity for Pure Tones in the Waking and Hypnotic States," Journal of Speech and Hearing Disorders, XIV, No. 1 (March, 1949), p. 35.
M ^ :

10
The work of Schneck and Bergman was based on earlier
observations by J. M. Bramwell and L. W. Wolberg. Bramwell
and Wolberg's work, according to Schneck and Bergman,
...seemed to indicate occasionally enhanced auditory perceptive abilities of patients under hypnosis. Such observations have been made in work with theraputic hypnosis, and references to the abilities of some persons to hear better under hypnosis may be found in the literature.-'-
In the study being reported, pure tone thresholds
were obtained using two methods of threshold determination,
the yes-no or semantic indicator and a forced choice or
accuracy indicator.
The terms semantic indicator and accuracy indicator
are used by Israil Goldiamond to differentiate between
two response classes. The so called semantic indicator
is based on the procedure used in psychophysics when the
subject makes a yes or no type answer and this answer is
assumed to have stimulus related experimental referents.
Because of the historical application of such semantic
referents to yes-no and similar responses, this class of
indicators will be called semantic indicators."^
The use of the term semantic indicators is not
related to "common sense semantics," but is based on their
• Schneck and Bergman, p. 33.
^Israil Goldiamond, "Indicators of Perception I, Subliminal Perception, Subception, Unconscious Perception: An Analysis in Terms of Psychophysical Indicator Methodology," Perception Laboratory Research Publication, I (January, 1958), p. 6.

11
methodological or continued lawful relationships with other
variables. Goldiamond states:
It has accordingly been argued that the semantic referents of the symbolic responses v;hich constitute this indicator are irrelevant to it, and that the responses can be considered simply as responses such as frequency, rate, amplitude, latency, and duration.i
The semantic indicator is then a measure of the
stimulus magnitude made by the subject in terms of a yes-
no response. The response itself is the indicator of the
presence or absence of the stimulus.
Accuracy responses generally designate or identify
the stimulus spatially (e.g., up, down, arrov; faces east),
identify it (e.g., the sti.uulus is a circle), locate the
stimulus temporally (e.g., the stimulus v;as presented in the
first interval), or co-.nt it (e.g., there viere four tones).
Semantic responses do not generally have this feature of
stimulus designation.^ VJith the accuracy indicator it is
the accuracy of the response as evidenced by agreement v/ith
the examiner s score sheet v/hich is ultimately the m.easure
of perception. The accuracy indicator forces the subject
to respond in a set manner, thereby assuring that there \^rlll
be an opportunity for correct response. This is the basis
for the term "forced choice measure." Once the response
has been made, the investigator can cor.pare the number of
^Goldiamond, p. 6.
2lbid., 7.
ft

12
correct responses against pre-set criteria to judge whether
the stimulus was actually perceived. For example, if at a
given intensity level the subject is presented four trials
of from one to four tones each, his probability of guessing
all four sets of tones would be 1 in 256 or a p of .0039.
Thus if a subject reports all four numbers correctly, his
chances of having done so by guessing are extremely low.
The chance of his guessing even two of the four series of
tones is 54 in 256 or a probability of .210.
The literature shows consistently lower thresholds
with the accuracy indicator method when compared with the
semantic indicator. It was reported by Blackwell that
"forced choice thresholds were significantly smaller than
corresponding thresholds obtained with phenomenal report."
The yes-no indicator had significantly less "apparent
validity" than forced choice.
Ickes compared an accuracy indicator with a semantic
indicator and found the accuracy indicator to be a better
measure of auditory threshold and obtained mean thresholds
as much as 6.5 db lower with the accuracy indicator than the
semantic indicator. Ickes suggests, ' that the explanation
for this finding would lie in response bias associated with
the use of a semantic indicator."'^
• H. R. Blackwell, "Psychophysical Thresholds: Experimental Studies of their Measurement," En°:ineering Research Bulletin (Ann Arbor: University of Michigan, 1953), p. 199.
%m. K. Ickes, "An Accuracy Indicator for Testing Hearing," Journal of Speech and Hearing Disorders, XXVII (May, 1962):;' pp. 1 4 ^ 1 ^

13
Bias is used here in terms of sampling, that is,
not all responses will have an equal probability of appearing
in a given response sample. Sampling in a psychophysical
experiment is concerned with response biases of an observer
which are related to the stimulus. In comparing semantic
and accuracy indicators, Blackwell found the yes-no indicator
to be succeptible to influence from variables extraneous
to sensory discrimination.^ If this variation constitutes
perceptual error variance, this indicator should exhibit
less session to session reliability and less intra-session
reliability than the forced choice indicator. Blackwell
found this to be the case and the "data suggest that forced
choice rather than phenomenal report should be used in
routing psychological measurement."^
Ickes* observation that the superiority of the accuracy
indicator may be attributed to a diminuation of response
bias and preparatory set is supported by the literature.
Goldiamond compared semantic and accuracy indicators for
serial effect and found that subjects were more likely to
say yes if the preceeding stimulus had been high than if it
had been low. The preceeding response rather than the stimulus
^Blackwell, p. 199.
2lbid., lia.

14
was involved in the effect as accuracy did not covary with
the magnitude of the preceding stimuli.^
Smith and Wilson reported variation of the dis
creteness of NO (reported as [a] didn^t hear but guess,
and [b] no) as well as YES (reported as [a] uncertain
heard and [b] think). Such liberal subjects were con
trasted to "conservatives" (yes-no). Liberals gave more
positive responses than conservatives.*-
Blackwell found that when the data itself contains
more yes answers the subjects tended to give more yes
answers—a positive increase of the response bias.- Gol
diamond noted that subjects responding no to the absence
of a stimulus and yes to its presence will generally respond
no to a weak but discriminable stimulus. This phenomena
is widely found in clinical audiometry with children. The
child tends to respond only to strong, readily observable
^Israil Goldiamond, "Serial Effect as a Function of Type of Indicator Used," (unpublished Ph.D. dissertation. Department of Psychology, University of Chicago, 1955), p. 31.
^M. Smith and Edna A. Wilson, "A Model of the Auditory Threshold and its Application to the Problem of the Multiple Observer," (Psychological Monograph, Vol. LXVII, No. 359, 1953), pp. 34-35.
^H. R. Blackwell, "The Influence of Data Collection Procedures Upon Psychophysical Measurement of Two Sensory Functions," Journal of Experimental Psychology, XLIV (November, 1952), pp. 306-315.
^Goldiamond, "Serial Effect...," 32.

15
stimuli in the test situation.
The author found the literature to be interesting
and highly provocative. Since the inception of this study
of the effects of hypnosis on pure tone thresholds many
hypotheses have been considered. Many were rejected, for
various reasons, and it was decided to test three hypotheses
which seemed basic to this investigation. These hypotheses
were:
1. Lower audiometric thresholds for pure tones for subjects in the waking state will be obtained with the accuracy indicator than with the semantic indicator.
2. The thresholds obtained with the accuracy indicator in the waking state wi^l not differ significantly from the accuracy indicator measure obtained under hypnosis.
3. The thresholds obtained with the accuracy indicator under hypnosis will not differ significantly from those of the semantic indicator obtained under the same conditions.
These hypotheses were based on the assumption that
response bias will be counteracted by hypnosis.
It was hoped that this study would contribute to the
information available for clinicians and researchers who do
now or will some day use accuracy indicators in testing or
research. It is felt that the accuracy indicator offers
great promise as a practical and accurate means of deter
mination of thresholds. The use of hypnosis may well benefit
the clinician with difficult cases and the researcher who
seeks new methods of obtaining basic information in the area
of audiology*

CHAPTER II
Methods and Procedures
Modern man has grown accustomed to such communica
tion miracles as the telephone, phonograph, television, and
radio. The secret of electronic reproduction of the com
plexities of speech, music, and even pictures is a matter
of record. It is truly amazing that m.an, who can transmit
photographs from the moon, does not knov; how his own ear
functions. The inner ear, a pea sized structure, can pick
up sounds from the air, analyze their complexities, and
enable us to respond to the subtleties of pitch, loudness,
and timbre. The question of just how the inner ear functions
is a scientific problem that has plagued man for several
centuries. As man has attempted to discover how the ear
functions, he has tried to determine hov/ well it functions.
As was pointed out in the previous chapter, it was the
purpose of this paper to investigate the use of hypnosis
in threshold determination, using two measures of auditory
acuity, the accuracy and semantic indicators.
In order that the probability of obtaining valid
and reliable results from this study be maximized, the
procedures and equipment to be used were thoroughly evalu
ated prior to the actual testing of subjects. It is the purpose
16

17
of this chapter to describe the instrumentation and pro
cedures used in this investigation.
Instrumentation
Audiometer.-The audiometer used in this study was
an Allison Laboratories Model 22. The audiometer frequency
accuracy is i 1% throughout the frequency range tested.
The audiometer, which was calibrated to International
Standards Organization standards, is a dual channel machine
offering push button frequency selection and two indepen
dent, continuously variable attenuators calibrated in 1 db
increments. Calibration accuracy is - 0,5 db over any 5 db
interval and - 1*5 db over total range. Channel 1- of the
audiometer was used to provide the test signal for all
subjects. In calibrating the audiometer, all measures
were taken from channel 1 with the red earphone.
Earphones.-A matched set of TDH-39 10 ohm headphones
with MX41AR cushions was used throughout the testing period.
Only the red or right phone was used during testing and this
phone was calibrated with the audiometer.
Attenuator.-The Allison Audiometer has a minimum
signal output of -10 db relative to audiometric zero.
Previous research, such as that of Schneck and Bergman-'- and
others, suggests that this is not sufficient to determine
the true threshold for pure tones in many individuals. For
this reason, an attenuator unit was used throughout testing
^Schneck and Bergman, pp. 33-36.

which provided additional range for the pure tone signal.
This attenuator was used in series with the audiometer and
earphones to provide an independently variable decrement to
the signal strength. This equipment consisted of two Daven
type Spec. 75^4, lO/lO, 5 db stop variable scale attenuators
mounted back to back. A calibrated dial allowed variation of
the resistance of the attenuator over a range of 100 db.
This attenuator was arbitrarily set at a constant 20 db and
this setting maintained throughout the experiment. Analysis
of the signal output taken at the earphones showed that the
attenuator provided a constant 20 db attenuation of signal
strength throughout the frequency range. This will be dis
cussed in greater detail later in this chapter.
Test Chamber.-All testing was perforr.ed in an I.A.C.
Mfg. Company sound treated chamber model A.035?. The chamber
is of double wall construction with insulation niaterial
between these walls. Acoustic tile lines the walls, ceiling,
and the door. The experimenter maintained direct visual
contact with the subject by use of an observation window and
two way speech communication was provided through the talk
back feature incorporated in the audiometer.
Calibration.-The audiometer was calibrated before,
during, and after the experiment using an Allison Audiometer
Calibration Unit, model 300. As only channel 1 of the
audiometer was used, this channel was calibrated with the
right or red phone both with and without the attenuator
unit in the series. Table 1 shows the results of the three

19
OQ
EH
O 2: M &H CO EH
<
Q
M « Q
ft: o fe,
w PQ CO O M Q <
o M EH <
OQ M
<
o Pi W EH
O M Q ED
I
u O ^
^ c 'O o
•H O -P CNJ O
(U Xi f-t •p J-l •H O ^ O
U O ^ u M
o c to o c
J 3 - H Ds XJ
OS T5 0) (DCtj
«
% CO 0)
^CCl <D 4-> -a 0 ^
s O XJ CO
bD rH C a> 'H > 43 <D -P
H^ 0) CO
. CO
• Q4 a*o a> JH C;
fr* -H
t o t o <^-d-. . . .
rH r H O rH + + 1 +
O - t t O ON . . . .
«H O - ^ r H ON t o t o t o
- ^ C ^ -4-u^ . . . .
O O r H O + + 1 +
- 4 - 0 ON t o . . . .
CN2 C\i i/NCNi ON-COtOtO
t o CNi l / ^ ^ ^ . . . .
CM C\i - d - r ^ o t o t o t o
O t r \ u M / N i r N o r ^ r -
l A O o o c v o o o r ^ o o o
rH Csi -:*•
bfl <D C U 'H O -P
C H CO <i> a>
O Q H
tOvO r^vO . . . .
rH r H O P H
+ + 1 -h
O v O t O C^ . . . .
rH O -cJ-rH C j N t O t O t O
VO O rH CV . . . .
a <D r-i(D + 1 +
CV CVvO rH . . . .
CVi Cvi i ^ r ^ ONtOtOtO
1
t o CV «r \ r^ . . . .
c\i cv -d-r^ o t o t o t o
O » ^ U M / \ i/Nr»-t>.c^
ir\0 O O cvo o o i H O O O
rH CNi -4-
hO bOC C - H
•H -P ^ CO ;3 0)
Q H
t o t o r^- ; f . . . .
r-{ r-iO iH + + 1 +
O -<f t o O . . . .
r H O ~ t r H o t o t o t o
VO rH O l/N . . . .
O O r H O H- + 1 H-
C\i i-t u\to . . . .
CVi CV2 i /NCV O t o t o t o
t o CV u^ r^ . . . .
(\2 C\J -:J-r^ ONtOtOtO
O > ^ U M A kTvC^C^C^
I / N O O O cv o o o r l O O O
rH C V - t
bO C
;-. -H <D P P CO ( H <1> < ; H
ion
CO P . TJ Cd 0) ^ c ^ CO ' H CO
T3 X ) :3 c e cr CO O CO •P o CO {H
o o
CO o <u G X S O <X'H
•r^ U 4^ • P CO C CO 0) 0)
<D C t^ P CO CD
c a* M fn
<D CO C P 0) O 0) c
s >> Ti O 'O (D ' H CO XJ CVi CO ; 3 0
^ COO o
CO CO . TJ -m rH ^ CH O P O
^ CO JnrH CD O O tH<H >
4J C rH O
CJ -H O O 4-> o
•H CO C 4J 73 0) O C J-. 3 0 Q)
13 S CH C E O ) O O J-t
(u a> U UrC
•H P < c CO O O
•H +i +3 CO <D N >
•H -H G 43 CO CO bOrH U Q)
o u

20
calibrations and it will be seen that with the attenuator
in series, the signal output at the phones is 20 db less
than that indicated by the console selector dials. An
indicated -10 db at any of the four frequencies tested is
then -30 db at the phones relative to audiometric zero.
Audio stimulus.-The accuracy indicator measures of
threshold used in conditions I and III necessitated a con
ditioned stimulus to preclude the response. Due to the
special problems associated with using subjects under hyp
nosis, a verbal signal was chosen. It was felt that a buzzer
or bell used as the conditioned stimulus might alarm the
subject during hypnosis, possibly to the point of awakening
him, or be confused with the testing tone.
Selection and Training of Subjects
Subjects.-The subjects for this study were sixteen
female college students between the ages 19 and 25 years
of age inclusive. All subjects were enrolled in Texas
Technological College and none had had more than one previous
hearing test. As relative threshold differences rather than
absolute threshold were the prime interest of this study, no
attempt was made to screen the subjects for pathological or
physiological abnormalities of the auditory structures. It
should be noted here that the analysis of variance which was
employed to analyze this data allowed the subtraction of sub
ject variance from the total variance inherent in the data.
This procedure allowed the evaluation of each factor indepen
dent frbm the others• The statistical measures will be discussed

21
later in this chapter and in chapter III.
Hypnosis training;.-Each subject was conditioned in
hypnosis prior to the actual testing. The procedure was
for the state of hypnosis to be demonstrated to each subject.
The prospective subject was allowed to observe the demon
stration subject and given the opportunity to question the
subject while the subject was under hypnosis. The area of
questioning was confined to inquiries as to general dispo
sition, etc., such as, "How do you feel?" After the
demonstration subject had been awakened, the investigator,
the prospective subject, and the demonstration subject
discussed hypnosis. The prospective subject was encouraged
to ask questions and these questions were answered as can
didly and honestly as possible. The investigator deferred
to the demonstration subject where possible.
Each subject was conditioned individually and an
eye fixation technique was used in the actual hypnosis.
A 2000 cycles per second tone presented through a speaker
at 50 db, and with frequency modulated 5 per cent was used
with each subject as an added stimulus for fixation. All
conditioning and testing under hypnosis was carried out
with a third person, an observer, in the room.
Criterion for hypnosis.-Prior to actual testing, it
was determined that the criterion for the hypnotic state
would be the achievement of a deep state of hypnosis by
each subject. The deep state as described by Heron is
characterised by:
^ ^

22
1. The ability to open eyes without affecting the hypnotic state,
2. Positive hallucinations, and
3. Negative hallucinations.-^
While condition 1 is self explanatory, conditions
2 and 3 require elaboration. The term "positive halluci
nation" refers to misinterpretation by the subject, eg.,
a rumpled handkerchief is perceived as a kitten. The term
"negative hallucination" describes the inability on the part
of the subject to sense something that is present, eg., the
subject fails to "see" an object placed in front of his open
eyes as a result of suggestion by the hypnotist.
Each subject was determined to have achieved the
deep state at least one time prior to the actual threshold
testing period. The depth of hypnosis was determined by
having each subject perform pre-determined tasks while under
hypnosis. The subject was told that the process of opening
his eyes under hypnosis would be found to be very pleasant
and satisfying. He was reminded where he was, who was in
the room, and any other information deemed necessary to
assure that the subject would not awake to any noxious or
anxiety producing stimuli. The subject was told that he could
open his eyes without awakening and once he opened his eyes,
the experimenter reassured him as to his state of relaxation
and he was asked to close his eyes again. Next the subject
^W. T. Heron, Clinical Applications of Suggestion and Hypnosis, (Springfield, Illinois: Chas. C. Thomas, 1959/iTji* 46-47.
i v

23
was told he would open his eyes and see only a red book.
The experimenter held a sheet of standard lined note paper
in front of the subject and asked him to open his eyes.
Once the subject had opened his eyes and observed the paper,
he was told to close his eyes, relax again, and report
what he saw. If the subject was able to open his eyes with
out awakening and reported the paper to be a red book,
this was assumed to validate the acquisition of the deep
state of hypnosis previously referenced. This procedure
was followed with all subjects and their reactions and
state of hypnosis noted.
Each subject was further conditioned to achieve a
deep state of hypnosis when the experimenter counteu slowly
from one to twenty. This step, necessary due to the test
procedure, was accomplished via post hypnotic suggestion.
Each subject was told while under hypnosis, that, for purposes
of research he would be able to achieve a deep state of
hypnosis when the experimenter counted. The further suggestion
was given that this would occur only when the subject was
in the test room and then only when applicable to the im
mediate research problem or activities associated therewith.
It should be noted at this point that certain other
instructions were given as a normal part of the conditioning
procedure. Each subject was told, while under hypnosis,
that he would allow himself to be hypnotized only by Medical
Doctors, Psychiatric, or Psychological personnel, or other
qualified hypnotists. These additional instructions were
fcJV*.. . V..' If^'.'

24
provided for the benefit of the subject. Once each subject
had been conditioned to the previously mentioned criteria,
he was assumed to be ready for testing.
Testing
After hypnotic conditioning had been achieved, the
threshold for 125, 1000, 2000, and 4000 cps was determined
for each subject under four experimental conditions. These
frequencies were chosen for two reasons. First, they are
the frequencies covering the human speech range and
secondly, they are a representative sample of practical
human hearing. The experimental conditions can be seen in
Table 2.
TABLE 2
THE FOUR EXPERIMENTAL CONDITIONS
Condition Subject State Indicator Used
Condition 1
Condition 2
Condition 3
Condition 4
Waking State
Waking State
Hypnotic State
Hypnotic State
Accuracy Indicator
Semantic Indicator
Accuracy Indicator
Semantic Indicator
Basically, the design tests the accuracy and semantic
indicators under normal (or waking) and hypnotic conditions.
The accuracy indicator or forced choice method of threshold
determination is explained in detail in chapter one.
Briefly a forced choice method entails presentation of a
k. M\

25
number of tones (in this case from one to four) to which
the subject must respond with a number. The experimenter
or tester presents one, two, three, or four short tones
and the subject tells the experimenter how many tones he
heard. This procedure is continued until threshold is
reached. Threshold is determined statistically, with the
experimenter making the judgement as to whether or not the
tone was heard. Knowing that the subject has 108 chances
in 256 to guess correctly one time in four series of tone
presentations, 54 chances in 256 of guessing twice correctly
in four presentations, 12 chances in 256 of guessing three
of four presentations and one chance in 256 of guessing all
four correctly, the experimenter can pre-determine a cri
terion of correct responses based on the probability of
occurrence. The final decision as to whether or not the
subject heard the stimulus is determined by agreement with
the examiner*s score sheet. With the accuracy indicator
then, the decision as to whether the subject did or did
not hear the stimulus is based upon objective, pre-determined
criterion. The semantic indicator, to the contrary, does
not allow a completely objective decision to be made.
With the semantic indicator, the tone is presented and the
subject says, "Yes, I hear it," or "No, I don^t." With the
semantic indicator the experimenter must rely on the report
of the subject, whether by vocal response or physical sig
nal, to determine whether or not the signal was heard.

26
The subjects were randomly assigned numbers from
one to sixteen inclusive. The sixteen subjects were then
divided into four groups of four subjects each. Subjects
number 1, 5, 9, and 13 became group I; subjects 2, 6, 10,
and 14 were group II; subjects 3, 7, 11, and 15 became
group III; and subjects 4, B, 12, and 16 became group IV.
This division was used as a part of the counter balancing
technique employed for purposes of analysis and balancing
of variance between conditions.
Table 3 shows the design used in presenting the
four test conditions.
TnBLE 3
EXPERIMENTAL DESIGN
Experimental
I
II
III
IV
Group Subject No.
1, 5, 9, 13
2, 6, 10, 14
3, 7, 11, 15
4, a, 12, 16
Condition
II
III
IV
II
III
IV
I
Order
III IV
IV I
I II
II III
Experimental group I was tested first under condition I,
followed by condition II, condition III, and condition IV.
Experimental group II was tested in the order condition II,
condition III, condition IV, and condition I. Experimental
group III was tested in the order condition III, condition IV,
condition I, and condition II. Experimental group IV was

27
tested first under condition IV and then on conditions I,
II, and III.
Each subject was tested in the order of his
originally assigned number. In this way, the first four
subjects tested and each succeeding series of four were
from successive experimental groups and had different
orders of test conditions. This procedure produced a
Latin Square design.
A standardized test procedure was used for all
subjects. The subject was seated in a padded office
chair within the test chamber. The earphones were placed
on his ears with the red phone on the right ear. The left
or blue phone was inopperative for all subjects. Once the
head phones were in place, they were not reinoved until the
completion of the entire test period. The door of the
sound isolated chamber was closed and the experimenter
then sat at his console. All communication with the
subject from this point was through the audiometer patient
communication system.
Prior to testing, a level above threshold was
determined for each frequency. The subject was instructed
to raise his hand when he first heard a tone. When these
preliminary instructions had been given, the frequency
selector was set at 1000 cycles per second and the aud
iometer attenuator was set at -10 db with the interrupter
switch in the normally off position. The method of
ascending limits was then used to determine the starting

28
point for the measurement of threshold. With the method
of ascending limits, the experimenter starts presenting
the stimulus at a point below threshold and gradually
increases the stimulus intensity until threshold is
reached. The interrupter switch was depressed and the
attenuator rotated, increasing the intensity of the tone
until the subject responded. The point at which the
subject responded was recorded and 5 db was added to this
value. The resulting relative sound pressure level in db
was used as the starting point for the ensuing threshold
measurements in all conditions. This measure was repeated
for all the test frequencies. When this measurement had
been completed, the actual testing procedure was begun.
Condition .-In condition I, all subjects were
tested with the accuracy indicator while in the waking
state. In this condition, thresholds for pure tones of
125, 1000, 2000, and 4000 cycles per second were measured
by use of the accuracy indicator method. The subjects
were in the normal waking state. Each subject was instruc
ted as to the nature of the test in the same manner. The
instructions, in all conditions, were an attempt to
establish a preparatory set conducive to the establishment
of the lowest possible thresholds. The text of these
instructions was as follows:
This is one of four tests that you will be given. In this test, you will be given pure tones in the right ear. Before the presentation of the tone, I will say, "ready". This will signal the onset of the tones. There will be

29
from one to four short tones each time. When I say, "how many", you will report verbally the number of tones you have heard. You must report a number after each presentation. If you are not sure as to the number of tones you have heard, guess. Some of the tones will be of very low intensity. Please listen closely and remember to report a number after each presentation. Do you understand?
These instructions were read through once. If the subject
did not understand, the entire content of the instructions
was repeated.
When the subject fully understood the instructions,
the experimenter began testing. The automatic pulser
feature of the Allison Audiometer was used to present the
tone. This system automatically pulsed the pure tone on
for 0.27 seconds and off for 0.27 seconds. The experimenter
controlled the number of pulses presented by using the
interrupter switch. The order of presentation of the
pulses was determined by a prepared table modified after
the table of random numbers compiled by Peatman, J. G.,
and Shafer, R.
The examiner presented the verbal signal to alert
the subject that the testing tone was forth coming. After
three seconds, the examiner presented the stimulus in one,
two, three, or four pulses depending upon the first number
in the table. The intensity of the first stimulus had been
determined by the procedure previously outlined. The
• J. G. Peatman and R. Schafer, "A Table of Random Numbers from Selective Service Numbers," Journal of Psychology, Vol. 14, Jan. 1942, pp. 296-297.

30
subject responded with the number of tones he heard and this
procedure was repeated three times at the original inten
sity. If the subject responded correctly to two or more
of the stimulus sets, the intensity was decreased by 5 db
and the procedure repeated. This procedure was repeated
at 5 db increments until the subject failed to respond
correctly to two of four presentations. The lowest
intensity at which the subject correctly identified two
of four presentations was assumed to be the threshold for
that frequency.
The threshold measures produced for each frequency
were corrected to allow for the 20 db added attenuation
provided by the external attenuator. The resulting score
in decibels was then recorded.
The criterion of two correct responses in four
presentations is based upon the probability of chance
occurrence. In their book, Basic Statistical Methods,
Downie and Heath state, "The probability of the simultaneous
or successive occurrence of two or more independent events
is equal to the product of their separate probabilities."^
Table 4 shows that the probability of a subject
correctly guessing two trials in four is 54 in 256 or
p- .210.
• N. M. Downie and R. W. Heath, Basic Statistical Methods, (New York: Harper and Bros., 1959), p. 104.

31
TABLE 4
PROBABILITY OF RESPONDING CORRECTLY TO THE STIMULUS BY GUESSING
Number of Correct Responses
0 in 4 1 in 4 2 in 4 3 in 4 4 in 4
P
81/256 loa/256 54/256 12/256 1/256
P
0.316 0.421 0.210 0.047 0.004
When thresholds had been obtained for all of the
four test frequencies, condition I was considered to be
completed and the next condition was begun.
Condition XI.-In this condition the subjects were
tested with the semantic indicator. In this experimental
condition the subjects were in the normal waking state
but were tested by use of the conventional semantic
(yes-no) indicator. The previously determined starting
point was utilized in this condition.
The subject remained seated in the test chamber
with the headphones appropriately placed. As in condition
I, all instructions were given via the patient communication
system incorporated in the audiometer. The instructions,
as previously stated, were an attempt to establish a set
conducive to eliciting the lowest possible thresholds.
The text of these instructions was as follows:
This is one of four tests that you will be ffiven. In this test, you will be given pure tones in the right ear. Just before the tones begin, ? will sly, "ready". This will signal you that the tones are about to begin. Each

32
time you hear a tone, please signify so by saying yes". Some of the tones will be of very low intensity. Please listen closely. Do you understand?
Great care was taken throughout the testing to
assure that all the subjects received the same instructions
in comparable situations.
When the experimenter was satisfied that the sub
ject fully understood the instructions, testing was begun.
A non-modulated pure tone was used as the stimulus for
this condition. Starting at the pre-determined point,
the stimulus was presented to the subject. If the subject
responded by the appropriate signal, saying that he had heard
the tone, it was interrupted and the intensity decreased
by 5 db. Acceptance of a yes response depended upon
agreement with the tone, that is, a yes response was
accepted if it occurred coincidentally with the presentation
of the tone. This procedure was followed until the
subject no longer responded by saying "yes". In this
condition, the method of descending limits was used.
The lowest intensity to which the subject answered "yes"
was taken as threshold.
This procedure was repeated for each of the four
frequencies measured and the threshold value recorded
in db. Twenty decibels was subtracted from each score to
compensate for the 20 db added attenuation provided by
the external attenuator. This score was then recorded as
threshold.

33
It should be noted at this point that the pro
cedure for presenting the tones for condition II and IV,
the semantic indicators, is not parallel with that of
conditions I and III, the accuracy indicators. With the
accuracy indicator technique, four sets of tones are
presented at each intensity level. To balance the four
experimental conditions, it would have been necessary to
present four tones at each intensity for each frequency
under conditions II and IV. This procedure was not
followed because common usage of the semantic indicator
technique as applied to audiological threshold determina
tion does not include this extensive duplication of
intensities. It was decided that using one stimulus tone
at each intensity level would be more in keeping with
normal test procedure followed when using a semantic
indicator.
Condition III.-For condition III, the subjects
were hypnotized and tested with the accuracy indicator.
In condition III, the accuracy indicator was used to
determine thresholds and all measures were taken while
the subjects were in the hypnotic state. Each subject
had been previously conditioned to the acquisition of
the hypnotic state. The subject was given the instruct
ions necessary to achieve the hypnotic state through the
communication system. This procedure varied with each
subject as a function of susceptibility, set, etc., but
generally followed the procedure recorded under condition

34
I in this chapter.
When the hypnotic state had been achieved, the
depth of state was tested against the criteria outlined
by Heron and previously referenced. If sufficient depth
had not been achieved, additional instruction was given
in an attempt to produce the desired state. The greatest
depth of hypnotic state achieved was recorded for each
subject for both condition III and condition IV.
When the greatest possible depth had been achieved,
the instructions for the test were given. The text of
these instructions can be found under condition II in this
chapter. When the experimenter was satisfied that the
subject understood the instructions, testing was begun.
The procedure for determining threshold is the same as
that outlined in condition I. The threshold value for
each of the four frequencies was determined, the correction
constant was subtracted, and the resulting value recorded
in db.
Condition rv.-ln this condition, the subjects
were tested with the semantic indicator while under
hypnosis. In condition IV, the yes-no (semantic indicator)
method of threshold determination was employed and all
subjects were in the hypnotic state for this condition.
Each subject was hypnotized as in condition III and the
level of hypnosis determined and recorded. The instructions
"^Heron, pp. 46-47.

35
for this condition were given through the communication
system to the hypnotized subject. The text of these
instructions can be found in condition II.
As in conditions I, II, and III, the instructions
were the same for all subjects. The determination of
threshold was the same as followed in condition II except
that the subjects in condition IV were under hypnotic
suggestion.
The threshold measures for all four frequencies
were determined, the correction factor applied, and the
results recorded.
The data was analyzed using an analysis of variance
of the type VI mixed design suggested by Lindquist.
This design is a four factor, treatment by treatment by
level by level design, which assumes a random sample of
subjects for the population concerning which the inferences
are to be drawn. It was decided prior to analyzing the
data that the one per cent confidence level would be the
level of significance that the data would have to meet
or exceed in order to be accepted.
1E. F. Lindquist, Desi. n and Analysis of Experiments in Psychology and Education, ('soston, I^ssachusetts: Houghton Mifflin, 1953), P- 285.

CHAPTER III
Experimental Results
This chapter presents the results of this study
and discusses the statistical analysis of the data supplied
by the investigation. The data obtained in this study was
analyzed using a four factor mixed analysis of variance.
In Table 5 it can be seen that the main effects
conditions (A), and frequencies (B), are significant at
the .01 confidence level. The other main effects, order
and replications, and all first, second, and third order
interactions are not significant. As only the conditions
and frequencies effects are significant, the analysis of
variance will be discussed in terms of these variables.
Experimental Conditions.-Table 5 shows the main
effect experimental condition (A), to be significant at
the .01 per cent level. As there were four conditions,
it was necessary to determine which of the four means
were significantly different from each other. The sig
nificance of the scores for the four experimental
conditions as suggested by Table 5 imply six possible
comparisons.. By using the formula'CD"t,Qi x Cfmi'm2
where CTmi-ma - ^ ^ 1 1 ^ ( 1 1 ^ , it was possible to
36

37
ki' '•>•
W o
M
>
O
CO M CO >^
o • H P CO
«
CO 0)
CO
cr CO
c CO Q)
CO
a> CO :3 cr
CO
C M
o CO
CO
OvO
. . O r H
to ^ O <hCV\0 . . . . . .
C V - 4 - i H r H ( N i O
• • • to c^vO
CNifH
- ^ ^ v O CV r ^ (V ITS C V t O v O O rH t o r^
. . . . . . . l/^cv -4-cvoc\jr^ v/\ ON -4-vO 0 0 - 4 -
rH U^C\2 - ; t rH - ^ O v O
• • . . C V - 4 - r H v O
i-i r H v O -4-CV r-i
cv c\2 irsCD r - t o rH O » ^ 0 ( V irsO ON
• • • . . . . v O t O rH t o CM u-N r'> vo c^o u>a\o o vO 1/N-4-WMiO t o t o
vO
. to vO to -4-
i A f * > r ^ O CNitO
<D O U :s O
CO
_,_ Q
^ a '
(0 P CO c; G (DO - ^
• r - ) . H - ^ Q X> P O O ;3 CO-^'-^
CO o 'H U U
hDr-A <D O c a - a SH O <D %^ SH S C C J O C£l
<aj
c o . - ^ • P < J J ^ O^—CQ Q) w
•»-> CO J3 C >» ;3 O O
CO -H C P 0)
G -H 3 •H TJ CT* J3 C 0) O — +> O S- iOQOOPQ ^ • H o C * i < a ; - 3 ; c Q < < ' - » ^
>
CO P O
0) J C + i
P CO
P C CO
o •H «M •H bO
• H CO
CO o
• H
CO • H P CO
+J CO

3^
determine which of the means were significantly different
from each other. It was found that a critical difference
between the means of 2.IS db would be needed for signifi
cance at the .01 per cent confidence level. The results
of this test of the variance of main treatments can be
seen in Table 6.
TABLE 6
SIGNIFICANT VARIANCE OF SCORES FOR THE EXPERIMENTAL CONDITIONS (A)
Condition II Condition III Condition IV Wak. Sem. Hyp. Ace. Hyp. Sem.
Condition I Wak. Ace. 2.50* 3.20* . 3.^2*
Condition II Wak. Sem. 5.70* 6.32*
Condition III Hyp. Ace. .62
* A difference of 2.IS is significant at the 1 per cent level.
Inspection of figure 1 shows that the mean thres
holds for all subjects under condition III was only .62
decibels higher than for condition IV. This small mean
threshold difference between the two conditions is not
significant and appears to confirm the writer»s third
hypothesis that was, "The thresholds obtained with the
accuracy indicator under hypnosis will not differ sig
nificantly from those of the semantic indicator obtained
Tlr • T/.f
39
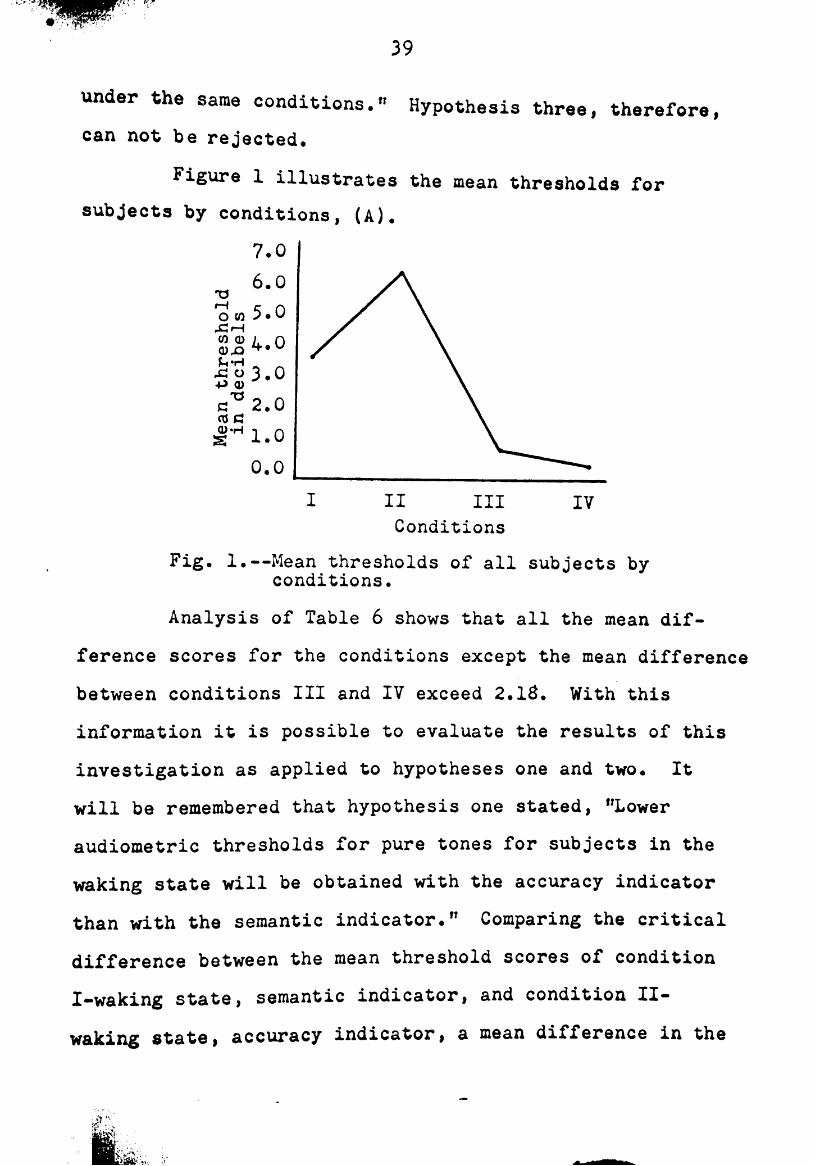
under the same conditions." Hypothesis three, therefore,
can not be rejected.
Figure 1 illustrates the mean thresholds for
subjects by conditions, (A).
7.0
II III Conditions
IV
Fig. 1.—Mean thresholds of all subjects by conditions.
Analysis of Table 6 shows that all the mean dif
ference scores for the conditions except the mean difference
between conditions III and IV exceed 2.IS. With this
information it is possible to evaluate the results of this
investigation as applied to hypotheses one and two. It
will be remembered that hypothesis one stated, "Lower
audiometric thresholds for pure tones for subjects in the
waking state will be obtained with the accuracy indicator
than with the semantic indicator." Comparing the critical
difference between the mean threshold scores of condition
I-waking state, semantic indicator, and condition II-
waking state, accuracy indicator, a mean difference in the
^-

40
thresholds of 2.50 decibels was found. This exceeds the
critical difference necessary for significance at the .01
per cent confidence level. Based upon this significant
difference in mean thresholds obtained using these two
measures, hypothesis one is accepted with a high degree
of confidence.
In hypothesis two, it was stated that the thres
holds obtained with the accuracy indicator in the waking
state will not differ significantly from the accuracy
indicator measure obtained under hypnosis. Examination
of Table 6 reveals that the mean thresholds obtained
under condition Ill-hypnotic state, accuracy indicator
are 3.20 decibels lower than the mean thresholds obtained
using the accuracy indicator with the subjects in the
hypnotic state, (condition I). As this mean threshold
difference exceeds the critical difference factor, 2.1S,
necessary for significance at the .01 per cent confidence
level, the audiometric thresholds obtained under condition
I are significantly higher than those obtained under
condition III. On the basis of these findings, hypothesis
two is summarily rejected.
Frequencies.-As can be seen in Table 5, frequency
effect is significant at the .01 per cent confidence level.
The significant scores for the four levels of the frequency
variable present six possible combinations of mean dif
ferences. In order to determine which of the mean scores

41
differ significantly from the other possible combinations,
the critical difference was calculated using the formula
previously referenced. It was found that a difference
between the means of 2.18 decibels or greater would be
significant at the .01 per cent confidence level. The
significant differences are shown in Table 7.
TABLE 7
SIGNIFICANT VARIANCE OF SCORES FOR FREQUENCIES (B)
Freq.o Freq.o Freq.A 1000 cps 2000 cps 4000 cps
Freq.i 125 cps 3.67* 3.44* 1.4S
Freq.2 1000 cps .23 2.19*
2000 cps - ' o
* A difference of 2.IS decibels is significant at the 1 per cent level.
Examination of Table 7 shows that the mean thres
holds in decibels of frequencies 2 (1000 cps) and 3 (2000 cps)
differ significantly from the mean thresholds of frequencies
1 (125 cps) and 4 (4000 cps).^ While the mean thresholds
for frequencies 2 and 3 differ from those of frequencies 1
and 4, the mean differences between frequencies 2 and 3
do not exceed the critical difference value for this
^cDS abbreviation denotes cycles per second cps a

'wmm 42
variable. The thresholds for all subjects for the four
frequencies tested can be seen in figure 2.
5.0
Z - -0 .S 3.5 -a 3.0 rH 2.5 i 2.0
S 1.0 0 0.5
0.0
125 1000 2000 Fi F2 F3
Frequencies (B)
4000 F,
Fig. 2.—Mean thresholds of all subjects by frequencies.
The difference in auditory acuity for 1000 and 2000
cycles per second tones, the so called "middle frequencies"
can not be explained in a simple statement of fact. The
information obtained from the statistical measures is not
sufficient to offer an explanation of the variance. A
number of explanations might be offered for this difference,
one of which is that the subjects might coincidentally
have had better hearing for these frequencies. The
explanation for this would lie in the assumption that this
threshold difference represents a sampling error in that
a faulty assumption of normalcy of the subject population
was made. It should be noted that although a sampling
error might have occurred, producing differences in the
thresholds for the frequencies tested, this would not
effect the threshold differences obtained between

43
conditions as the differences in this case were relative
threshold measures rather than absolute.
The results of this study indicate that pure tone
thresholds obtained from subjects under hypnosis will be
significantly lower than those obtained by the accuracy
and semantic indicator methods of threshold determination,
as used in this study, with subjects in the waking state.
It is further indicated that pure tone thresholds obtained
with the accuracy indicator method will be lower than
those obtained with the semantic indicator, but only in
the waking state.
.-. '-ikc^ ^ ^ ^ ^

CHAPTER IV
Summary and Conclusions
This study was designed to test the effects of
hypnosis on pure tone thresholds. A review of the
literature revealed that hypnosis had not been widely
investigated as a possible tool in diagnostic, clinical,
and research audiometry. Even more important was the
finding that in the research that had been done using
hypnosis, the use of hypnosis was shown to offer promise
as an adjunct to other diagnostic and research procedures.
It was primarily interest in improving audiological
technique that prompted this investigator to evaluate
hypnosis as a possible tool in diagnostic and research
audiometry.
In order that the use of hypnosis and waking
thresholds could be effectively compared, it was decided
that two measures of auditory acuity would be compared
both under waking and hypnotic conditions. In this
manner, the study measured not only the effects of
hypnosis but allowed comparison of a semantic indicator
with a forced choice or accuracy indicator.
The investigation was designed to test the
following hypotheses:
44

45
1. Lower audiometric thresholds for pure tones for subjects in the waking state will be obtained with the accuracy indicator than with the semantic indicator.
2. The thresholds obtained with the accuracy indicator in the waking state will not differ significantly from the accuracy indicator measure obtained under hypnosis.
3« The thresholds obtained with the accuracy indicator under hypnosis will not differ significantly from those of.the semantic indicator obtained under the same conditions.
This chapter reviews the procedures used in
investigating these hypotheses and the results obtained.
Discussion is offered relative to the findings and
implications for further research are presented.
Instrumentation
An Allison, Model 22, Audiometer was used as the
pure tone source for this investigation. A matched set
of TDH-39 earphones were available to present the signal
to the subjects. Only the right phone (red phone) was
used during testing. In order that the signal would
be of sufficiently low intensity to assure the determi
nation of true audiometric threshold of the subjects, an
external attenuator was used. This attenuator allowed
the investigator to introduce a pre-determined amount
of attenuation to the signal strength. Attenuation of
a constant 20 db was selected.
All testing was performed in an Industrial
Acoustics Company sound treated chamber. This chamber
fc4 -:-9.,:-

46
assured a sufficiently low ambient noise level for the
testing.
Before, during, and after the experiment, the
audiometer and all related equipment was calibrated
using an Allison Audiometer Calibration Unit, Model 300.
This procedure allowed the investigator to evaluate the
audiometer signal output in comparison with known values
and determine that the intensities reported were accurate.
Selection and Training of Subjects
Sixteen female college students between the ages
of 19 and 25 years inclusive served as subjects for this
study. The assumption was made that all subjects were
naive in regard to hearing testing as no subject had had
more than one previous hearing test.
Each subject was individually conditioned in
hypnosis prior to the actual testing. A visual fixation
technique was used in the hypnotic procedure to facilitate
the subject»s acquisition of the hypnotic state. All
conditioning and hypnosis was carried out with a third
person, an observer, in the room. Prior to actual testing
it was determined that the criterion for the hypnotic
state would be the achievement of a deep state of hypnosis.
Each subject achieved the deep state of hypnosis on at
least one occasion prior to the actual test period. The
depth of state was tested by the criterion established
i.- J
;• . ^'4

47
prior to testing.-^
All subjects were conditioned to achieve the
deep state of hypnosis through instructions given by
the investigator through a two-way communication system.
This allowed the investigator to conduct all testing
without ever having to enter the test chamber.
Experimental Procedures
The threshold for pure tones of 125, 1000, 2000
and 4000 cycles per second was determined under four
experimental conditions.
Basically, the design tested the accuracy and
semantic indicators under normal (or waking), and hypnotic
conditions. The subjects were randomly assigned numbers
from one to sixteen inclusive and divided into four
groups of four subjects each. This division was employed
for purposes of analysis and balancing of variance
between conditions.
A standard test procedure was used for all sub
jects and this pre-determined procedure was rigidly
adhered to. Once the thresholds for all subjects under
all conditions had been determined, the data was analyzed
using a four factor mixed analysis of variance design.
A .01 per cent level of confidence was preselected to
indicate significant variance.
(a) the tate, nations.

4S
Results
This study was analyzed using a four factor mixed
analysis of variance design which was essentially a treat
ment by treatment by level by level design. The main
effects of experimental conditions and frequency were
significant at the .01 per cent level and beyond, and no
other first order effects or higher order interactions
were significant. As only the conditions and frequency
effects were significant, the analysis of the data was
discussed in terms of these variables.
The difference between the mean thresholds of
the subjects under condition I, waking state, accuracy
indicator, was significantly different than under condition
II, waking state, semantic indicator. The mean thresholds
for condition I were also significantly different from
those of conditions III, hypnotic state, accuracy indicator,
and IV, hypnotic state, semantic indicator. The mean
thresholds for conditions II and IV were significantly
different from each other but the means for condition III
and IV, the accuracy and semantic indicator under hypnosis,
were not significantly different.
The frequencies variable, which was significant
beyond the .01 per cent level, produced six possible
combinations of mean interactions. Three of these inter
actions proved to be significant. Significantly lower
mean thresholds were obtained for frequencies 2 and 3,
:-"' :K>

49
1000 and 2000 cycles per second respectively, than for
frequency 1 which was 125 cycles per second. The mean
difference between thresholds 2 and 3 was only .23 decibels.
Frequency 2, 1000 cycles per second, was significantly
lower than frequency 4, 4000 cycles per second.
Discussion
Relative to the sample tested, it was found that
hypnosis does act to produce lower thresholds. It will
be recalled that the accuracy indicator produced sig
nificantly lower thresholds than the semantic indicator
when both were tested with subjects who were in the
waking state. Furthermore, the mean thresholds for both
the accuracy and semantic indicators under hypnosis were
significantly lower than the mean scores for both the
accuracy and semantic indicators under waking state con
ditions. The thresholds obtained under the two hypnotic
conditions were not significantly different from each other.
The reason for the finding that hypnosis acts to
produce lower thresholds is not clear, but numerous
possibilities might be considered. The first explanation
which might logically be offered is that hypnosis reduces
response bias. When it is considered that thresholds
produced under hypnosis are even lower than those obtained
with the accuracy indicator in the "waking condition, it
becomes obvious that this explanation fails to account
s;.

50
for all the threshold differences. If hypnosis only
served to reduce response bias, there would be no dif-
ference between thresholds obtained with hypnosis as
compared with those obtained from subjects in the waking
condition who were tested with the accuracy indicator.
The differences between the waking and hypnotic
conditions could well be the result of added attenuation
on the part of the subjects. The hypnotic state produces
a tendency for the subject to attenuate or "tune out"
stimuli other than those directly related to the immedi
ately important sample. If, for example, a subject under
hypnosis is occupied with a simple mathematical problem,
he will tend to exclude all stimuli other than those
directly related to the solution of that problem.
These findings conflict with those of Schneck
and Bergman in that they found no difference between sub
jects tested under waking conditions as compared to those
tested with the same measure under hypnosis. There are
two explanations to be offered. The first is that the
Schneck and Bergman study included many subjects with
pathological conditions of the auditory apparatus, such
as tinnitus and structurally defective hearing apparati.
In addition, two of the subjects were judged to have
neurotic conflicts based on results of psychological
tests. This raises questions relative to motivation for
-^Schneck and Bergman, pp. 35-36.

51
the subjects. The background of the subjects allows
speculation as to whether the subjects were motivated to
perform at optimum levels. It is also important to note
that the Schneck and Bergman study incorporated no cri
terion for depth of hypnotic state. This fact allows
speculation that some or all of the subjects in their
study may not have been in a deep state of hypnosis and
a lesser state of hypnosis might allow response bias to
influence their reactions. Further, a subject who was in
a light state of hypnosis and was not motivated to perform
to maximum capabilities would not demonstrate absolute
threshold.
In the study being reported, all subjects were in
a deep state of hypnosis. The subjects were, as a result,
highly amenable to suggestion and were more likely to
concentrate on the test stimuli and attenuate extraneous
stimuli than were those of Schneck and Bergman. There is,
of course, no way of ascertaining whether absolute thres
hold was reached with the subjects in this study but it
is felt that the procedures used allowed more accurate
measure of hearing acuity than did those of Schneck and
Bergman.
The finding that the accuracy indicator produced
lower thresholds for pure tones than semantic indicator
in the waking state is consistent with the literature and
is explained in terms of the elimination of response bias.

' 'W- , ,•> ip;
52
The semantic indicator is subject to influence from
variables extraneous to sensory discrimination. When
this variance constitutes perceptual error variance, the
semantic indicator will exhibit less session to session
reliability and less intra-session reliability than the
accuracy indicator.
Goldiamond»s findings that subjects tested with
the semantic indicator were more likely to say yes if the
preceeding stimulus had been high than if it had been low
demonstrate the effects of response bias. This set to
ward responding which is a result of conditions antecedent
to the test tone is eliminated by the use of a forced
choice method. The subject must respond with a positive
statement which identifies the stimulus in some way.
As he must respond, the response possibilities include
all possible combinations. This assures that all responses
will have an opportunity to appear in the sample. If the
number of correct choices exceeds the critical mobility,
this is accepted as a valid measure.
Although in both accuracy and semantic indicators
a response may be required, that is, forced, experimental
conditions often allow the negative semantic response to
be used as a means of decision avoidance. The negative
response is preferred to a positive response in equivocal
situations and this produces a negative response bias.
This negative bias is often found in audiometry in children.

53
who frequently will not respond until they are absolutely
sure they hear the tone. This problem can be eliminated
with the accuracy indicator in that a response which
would not be given to a signal in a semantic indicator
test will be made under the accuracy indicator conditions
on the basis of a weak but perceptible stimulus. Similarly,
some subjects for various reasons tend to be biased toward
yes responses. If these subjects are confronted with an
accuracy indicator, their response is reduced to a statis
tical probability and the positive semantic bias is
eliminated.
Generally, the accuracy indicator offers the
advantage of at least partial attenuation of psychological
and environmental stimuli while placing the determination
of response accuracy in statistical analysis.
The use of hypnosis achieves reduction of response
bias and is felt to be particularly advantageous in its
elimination of extraneous signals received by the subject.
It is possible to instruct the subject under hypnosis to
perceive only the test signal and information from the
examiner to the exclusion of all other information. If
this assumption is correct, and hypnosis does act to provide
additional attenuation from the subjects, this would quite
adequately explain the lower thresholds obtained under
hypnosis. If extraneous stimuli are considered as "noise,"

54
then by el iminating a l l or part of th i s extraneous d is
t rac t ion , the signal to noise r a t io would be improved and
lower thresholds would r e s u l t .
Conclusions
1. The finding that the accuracy indicator pro
duces s ign i f ican t ly lower thresholds in the waking state
than does the semantic indicator confirms the value of
the accuracy indicator as a superior measure of auditory
acuity. This i s consistent with the l i t e r a tu re .
2. While there has not, as yet , been wide spread
application of the accuracy indicator techniques, i t is
fe l t that the accuracy indicator holds great promise as
a tool in c l i n i c a l and research audiometry.
3 . One par t i cu la r ly advantageous application of
the accuracy indicator technique might be in the testing
of children who are suff ic ient ly developmentally advanced
to count s t imul i .
4. The accuracy indicator technique is fe l t to
be suf f ic ien t ly f lex ib le and adaptable to meet a wide
variety of s i tua t ions and needs.
5. The use of hypnosis produces lower thresholds
than the two measures used in tes t ing subjects in the
waking s t a t e and the use of hypnosis in audiological tes t ing
warrants fur ther inves t iga t ion .
6. Spec i f ica l ly , research in the use of hypnosis
in hearing t e s t i n g might be applied to speech audiometry

55
and as a d i agnos t i c and the rapu t i c too l for use with
psychosomatic hear ing problems and malingering.
7. Genera l i za t ions made as a r e s u l t of t h i s
study should be subjec t to va l ida t ion of these r e s u l t s
with a l a r g e r popula t ion sample.
I t i s the w r i t e r *s i n t en t ion to duplicate the
hypnosis study with a l a rge r sample of subjects , addi t ional
t e s t v a r i a b l e s , and more r i g i d controls at a l a t e r da te .
I t i s hoped t h a t the study being reported wi l l make a
s i g n i f i c a n t c o n t r i b u t i o n to basic knowledge of auditory
t e s t procedures and s t imula te research in the use of
hypnosis a s appl ied audiometr ies .

BIBLIOGRAPHY
Blackwel l , H. R. "The I n f l u e n c e of Data Co l l ec t ion Proc e d u r e s Upon Psychophys ica l Measurement of Two Sensory F u n c t i o n s , " J o u r n a l of Experimental Psycho logy , XLIV (November, 1952) , pp. 306-315.
. " P s y c h o p h y s i c a l Thresho lds : Experimental S t u d i e s of t h e i r Measurement," Engineering; Research B u l l e t i n . Ann Arbor: Un ive r s i t y of MichiganT! (March, 1 9 5 3 ) , p . 199.
Boring, Edwin G. H i s t o r y of Psychology and Science . New York: John Wiley and Sons, I n c . , 1963.
Braid, James . Bra id on Hypnotism. New York: The J u l i a n P r e s s , I n c . , I 9 6 0 .
Chapl in , J . P . , and Krawiec , T. S. Systems and Theories of Psycho logy . New York: H o l t , R ineha r t , and Wins ton , 19o3 .
Cohen, D a n i e l . "Franz Mesmer: Humbug or F i r s t Hypnot i s t?" Sc i ence Diges t ( j u l y , 1961) , p . 73 .
C o v i l l e , W a l t e r J . , £ t a^. Abnormal Psychology. New York: Barnes and Noble , I n c . , I 960 .
C u t t e r , George B a r t o n . Three Thousand Years of; Mental H e a l i n g . New York: Char le s S c r i b n e r ^ Sons, 1911.
Downie, N.M. , and Hea th , R. W. Basic S t a t i s t i c a l Methods. New York: Harper and B r o t h e r s , 1959.
Dynes, J . B. "An Expe r imen ta l Study in Hypnotic A n e s t h e s i a , " J o u r n a l of Abnormal and S o c i a l Psychology, XXVIl, No. 1 ( A p r i l , " 1932) , p . 79.
"Hypnotism," Encyc loped i a B r i t a n n i c a (13th e d . ) , XI I , 1962.
Estabrooks, G. H. Hypnotism. New York: E. P. Dutton and Company, I n c . , 1957*
56

-fHf' 57
Goldiamond, I s r a i l . " S e r i a l E f f e c t s as a Funct ion of Type of I n d i c a t o r Used." Unpublished Ph.D. d i s s e r t a t i o n . Department of Psychology, University of Chicago, 1955.
" I n d i c a t o r s of P e r c e p t i o n I , Subliminal Per-"*" c e p t i o n , S u b c e p t i o n , Unconscious Percep t ion : An
A n a l y s i s i n Terms of Psychophysical I n d i c a t o r Methodology ," P e r c e p t i o n Laboratory Research P u b l i c a t i o n , I ( J a n u a r y , 1958) , p . 6.
Heron, W. T. C l i n i c a l A p p l i c a t i o n s of Suggestion and H y p n o s i s . S p r i n g f i e l d , I l l i n o i s : Chas. C. Thomas, 1959.
I c k e s , Wm. K. "An Accuracy I n d i c a t o r fo r Test ing Hear ing ," J o u r n a l of Speech and Hearing Di so rde r s , XXVII (May, 1 9 ^ ) , pp . 144-149.
K l ine , M i l t o n V. , et, a l . "An Experimental Study of the Nature of Hypnotic Deafness: E f f ec t s of Delayed Speech Feedback , " J o u r n a l of C l i n i c a l and E x p e r i m e n t a l Hypnos is , I I , No. 2 ( A p r i l , 1954)> p p . 145-13b .
L e v i t t , Eugene E . , and Brady, John Pau l . "Psychology of H y p n o s i s , " Hypnosis in Modern I'ledicine, ed . J . M. Schneck. S p r i n g f i e l d , I l l i n o i s : Chas . C. Thomas, 1963, PP. 337-338.
L i n d q u i s t , E . F . Design and Ana lys i s ££^?2S2e i i | en^ in Psychology and E d u c a t i o n B o s t o n . Houghton M i f f l i n Company, 1953.
M l n u - -h oi ' 'Electromyographic Study of Hypnotic Malmo, R o b e r t , e t a l . ^-^?^!^5 p ^ ^ ^ i c a l and Experimental
Deafness , " J o u r n a l of V n c M ^ ' L ^ n l r T i ? H y p n o s i s , I I (Oc tober , 1954i , PP- 3 0 5 - 3 1 / .
Pat t i e Frank A. "The Genuineness of U n i l a t e r a l Deafness P a t t i e , Frank^A. ^^^^^ , ^^^^^^^.'-^f^^.-
Psycho logy , LXIII ( J a n u a r y , 1950), p . ^ 5 .
J o u -f ^ p "A Table of Random Peatman, J . G. , and S c h a f e r , ^ ' ^ ' ^ l umber s , " Journa l
Numbers from S e l e c t i v e ^ ^ ^ ^ ^ ^ f g S PP 29"6-297. of Psycho logy , XIV ( J anua ry , 1942; , PP.
M^^ "Auditory Acuity for Schneck. J . M., and Bergman Moe. Audit J ^ S t a t e s , "
(March, 1949)> P- 3 5 .

55
Smith, M., and Wilson, Edna. "A Model of the Auditory Threshold and its Application to the Problem of the Multiple Observer," Psychological Monograph, LXVII, No. 359, 1953, PP. 1-35.
Wever, S. G. "Beats and Related Phenomena Resulting from the Simultaneous Sounding of Two Tones," Psychological Review, XXVI, No. 1 (January, 1929), pp. 402-418, 512-523.
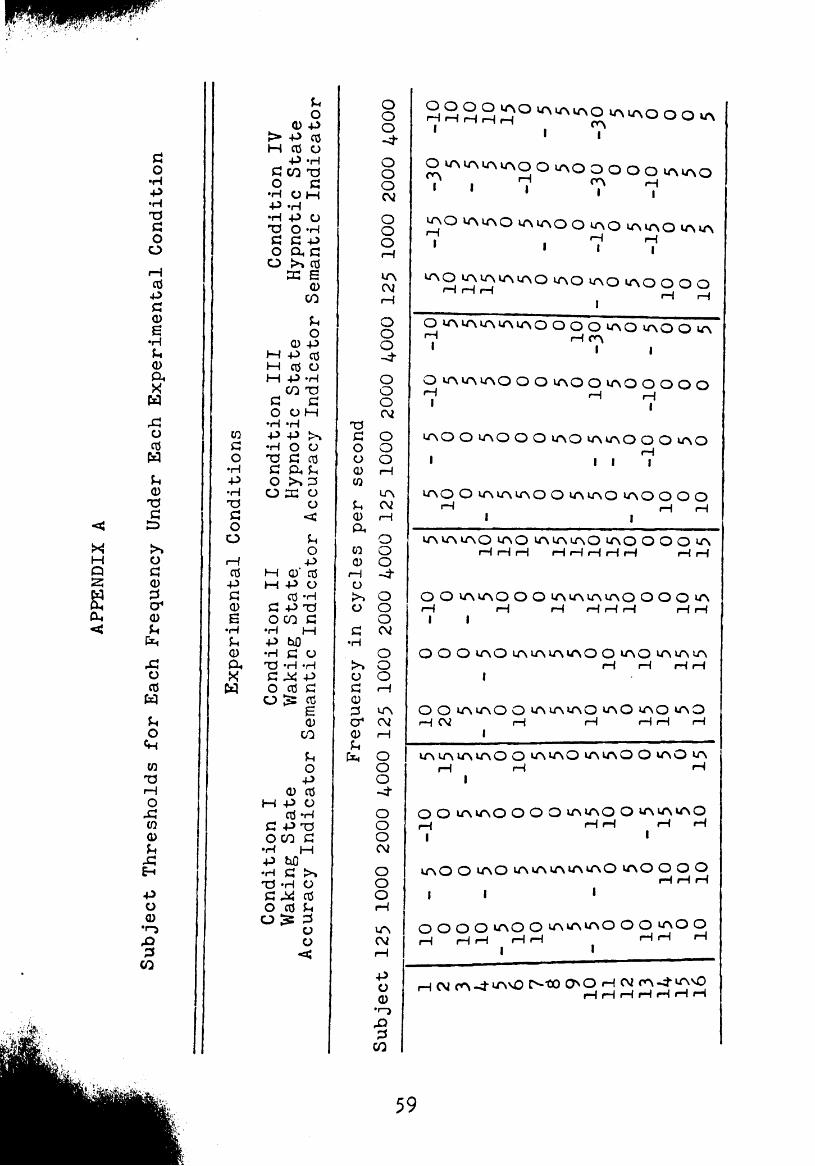
J>.~»?/'<
<JJ
X H Q S
e cu <
^ o
•H +> •H 73 C O
O
rH CO 4->
<D 6
•H (H
(1) a. X w Xi o a w ^ Q)
TJ c t 3
J>. o a <D ^ O* <D U
Cm
Xi o CTJ
W SH
o CH
w TJ rH o
j : : (0 a> H
-C ^
+5 O 0)
• o ^ ;3
CO
CO
c O •H + •H TJ
j : : O
C3
rH CO
• P j=; 0 s
•H fM Q) a, X w
JH O
Q) +J > -P CO M CO O
4-> -H G e o TJ O G
•H O M •P -H •H 4-> O TJ O -H G C P O Q. G
O >-. CO ffi s
<D CO
?-i O
0 -P M 4 ) CO M CO O M +> -H
CO TJ G G O O M
•H -H •P 4J >» •H O O TJ G CO G OH ^ O >,^
O 2C O o
<«:
SH O P
M O" CO M 4^ O
CO - H G +^TJ OCQ G
•H M +> hO •H G (J TJ -H -H G ^ P O CO C
O 15 CO e Q)
CO
^ O P
0 CO M -P c;
CO - H G - P T f OCO G
•H M 4J hO 'H a >, TJ -H O G ^ CO o a ^
CJ ^ ;:s CJ o
<«;
TJ G O o 0 (0
;-. 0 o. CO 0
r-i O > . o
G •H
>> O G 0 ;3 cr 0 j : ^
ClH
o o o -4-
o o o CNi
o o o r-H
•TN C\2 r-i
O o o ^
o o o C\2
o o o rH
i ^ CV r-{
O O o -4-
o o o cv
o o o rH
ITS cv r-{
o o o -4-
O O o C\2
o o o t-i
\r\ C4 r-\
Su
bje
ct
O l A l A U ^ u ^ O O U N O O O O O l A V A O r^
I I I
•^SO V A U N O l A i A O O l A O U M A O I A » A
' I I I
l A O l A i A U M A O V A O l A O t A O O O O '~^'~^'~' rH rH
O U M A l A U M A O O O O t A O l A O O »A • 7 r H r ^
• I I
O « A U M A O O O V A O O » A O O O O O
I I
k / \ O O i A O O O u ^ O u M A O O O i A O
. . 1 l A O O U M A I A O O U M A O « A 0 0 0 0
'-< rH rH i I
• A V A l A O t A O U M A l A O l A O O O O * ^ r-i r~i r-i rH r-^ rH i-i H r-i rH
O O v A l A O O O W M A l A i A O O O O i A rH r-H rH rH rH i-H rH rH
I i
OOOu-^O lA lA>Aw^oou^Ou^^A lA rH rH rH rH
I
O O t A V A O O W M A « A O l A O t A O W > 0 rH CNi rH rH rH rH rH
I
l A l A U M A O O l A l A O I A » A O O U > 0 l A rH rH rH
I
O O l A l A O O O O u M A O O W M A l A O rH r H r H rH H
I •
I A O O I / N O l A i A l A U > l A O i A O O O O rH rH rH
i I I
O O O O l A O O u ^ v A V ^ O O O l A O O r H r H r H r H r H r H H r H
I I
rHCNi rA-d-»AvO r^'«» O N O rH CV r^-;fiAvO
59