Auditor Networks and Audit Quality - isarhq.org · Auditor Networks and Audit Quality Pietro A....
55
Auditor Networks and Audit Quality Pietro A. Bianchi IE Business School Department of Accounting Calle Pinar 15, 28006 Madrid (Spain) Tel. 0034915689724 Fax 0034917451376 [email protected] April 26, 2014 Acknowledgments This paper is based on the first chapter of my dissertation at IE Business School, Madrid. I gratefully acknowledge the invaluable help and advice of the chair, Marco Trombetta, and the other members of my dissertation committee, Nieves Carrera, Julio de Castro, Beatriz Garcia-Osma, and Miles Gietzmann. I thank John Barrios, Salvador Carmona, Miguel Minutti-Meza, Tashfeen Sohail, Taylor Wiesen, Peter Wysocki, and participants of the IAS midyear section 2014 (discussant Haiyan Zhou), the Conference “Recent Developments in Accounting” at the University of Miami December 2013, the brownbag at the IE Business School November 2013, the 2012 AAA Auditing Section Conference, the 2012 doctoral colloquium of the EAA conference, the 2012 EIASM workshop on Audit Quality, the IX workshop on Empirical Research in Financial Accounting, and the XVII Workshop Raymond Konopka for helpful comments and suggestions. I also thank the president and the staff of the Chamber of Commerce of Verona for their support. Errors in this paper are my own.
Transcript of Auditor Networks and Audit Quality - isarhq.org · Auditor Networks and Audit Quality Pietro A....

Auditor Networks and Audit Quality
Pietro A. Bianchi
IE Business School
Department of Accounting
Calle Pinar 15, 28006 Madrid (Spain)
Tel. 0034915689724 Fax 0034917451376
April 26, 2014
Acknowledgments This paper is based on the first chapter of my dissertation at IE Business
School, Madrid. I gratefully acknowledge the invaluable help and advice of the chair, Marco
Trombetta, and the other members of my dissertation committee, Nieves Carrera, Julio de
Castro, Beatriz Garcia-Osma, and Miles Gietzmann. I thank John Barrios, Salvador Carmona,
Miguel Minutti-Meza, Tashfeen Sohail, Taylor Wiesen, Peter Wysocki, and participants of the
IAS midyear section 2014 (discussant Haiyan Zhou), the Conference “Recent Developments in
Accounting” at the University of Miami December 2013, the brownbag at the IE Business
School November 2013, the 2012 AAA Auditing Section Conference, the 2012 doctoral
colloquium of the EAA conference, the 2012 EIASM workshop on Audit Quality, the IX
workshop on Empirical Research in Financial Accounting, and the XVII Workshop Raymond
Konopka for helpful comments and suggestions. I also thank the president and the staff of the
Chamber of Commerce of Verona for their support. Errors in this paper are my own.

! 1
Auditor Networks and Audit Quality
ABSTRACT: This study investigates whether interactions among individual auditors in multiple
engagements across clients (i.e. auditor connectedness) explain variation in audit quality and
audit fees. These interactions arguably generate knowledge spillovers and expertise leading to
higher audit quality and audit fees. This study employs measures from the social networks
literature to examine a unique setting of Italian private firms engaging multiple individual
auditors. Findings provide empirical evidence of a positive association of auditor connectedness
with audit quality and audit fees. Results are robust to a series of additional analyses, including
propensity-score matching. Overall, this study suggests that auditor networks play a key role in
the diffusion of knowledge and expertise among individual auditors.
Keywords: audit quality; audit fees; social networks analysis; auditor networks.

! 2
I. INTRODUCTION
This paper investigates whether interactions among individual auditors involved in
multiple engagements across clients (i.e. auditor connectedness) are associated with audit quality
and audit fees. Arguably, these interactions generate knowledge spillovers and expertise that, in
turn, should improve the quality of audits and result in fee premiums. Knowledge is one of the
determinants of audit quality (DeAngelo 1981) and is typically defined as the ability to detect
errors in financial statements. The prior literature proxies such knowledge by means of
accounting firm attributes, such as firm size (Becker, DeFond, Jiambalvo, and Subramanyam
1998; Francis, Maydew, and Sparks 1999), industry specialization (Ferguson, Francis, and
Stokes 2003; Francis, Reichelt, and Wang 2005; Reichelt and Wang 2010; Zerni 2012) and
engagement office size (Francis and Yu 2009) and generally finds a positive association between
knowledge and both audit quality and audit fees.
This study extends the previous literature by focusing on individual auditors rather than
firm-level proxies and examines one mechanism through which knowledge is transferred: auditor
networks. In a recent study, Larcker, So, and Wang (2013) conceptualize board interlocks as
information-exchange channels and operationalize firms’ connectedness with measures derived
from social network analysis. Building on the network literature, it can be argued that auditors
interact with other auditors that are assigned to the same audit engagements and integrate
themselves into professional networks that act as important channels for knowledge spillovers.
This paper investigates whether better-connected auditors are associated with audit quality and
audit fees. Prior studies generally examine the relationship between either audit quality and
auditor knowledge or audit fees and auditor knowledge. In this paper, I estimate both an audit-
quality model and an audit-fees model.

! 3
Following prior literature (Becker et al. 1998; Francis et al. 1999; and Francis and
Krishnan 1999), I measure audit quality using discretionary accruals and auditor connectedness
with Burt’s (1992) network constraint. Building on Burt (1992, 2004), it can be argued that, in
my research setting, better-connected auditors have better access to industry best practices,
market conditions and regulatory changes. Moreover, auditors can use their contacts to obtain
informal advice during audits. However, being better-connected has costs; for example, auditors
might be ineffective when they are too busy to dedicate the attention necessary for each client, or
there might be the risk that shared practices and methodologies will reduce (but not enhance) the
quality of the audit. Given the two opposite forces, it is ultimately an empirical question to
examine the association between auditor connectedness and audit quality. Findings, robust to
alternative measures of discretionary accruals and auditor connectedness, show a positive
association. The results are also robust to a series of sensitivity tests, including propensity-score
matching.
After showing that audit quality varies with auditor connectedness, I next explore whether
auditor connectedness is associated with audit fees. Lawrence, Minutti-Meza, and Zhang (2011)
posit that fees proxy for the level of effort provided by auditors and are negatively associated
with earnings management. The previous literature generally finds a positive association between
audit fees and expertise at the national (Craswell, Francis and Taylor 1995; Choi, Kim, Liu, and
Simunic 2008), office (Ferguson et al. 2003; Francis et al. 2005), and partner level (Zerni 2012)
and interprets fee premiums as evidence of differentiation through knowledge. Better-connected
auditors might differentiate themselves through their informational advantage and charge a fee
premium for such differentiation. However, given that knowledge is tied to the innate abilities of
each individual, transfer of expertise and knowledge between individuals working in the same

! 4
audit engagement can be difficult. Thus, the association between auditor connectedness and audit
fees remains an open empirical question. The results, robust to a propensity-score matching
sensitivity analysis, show a positive association between auditor connectedness and audit fees.
Because data on the identity and characteristics of individual auditors are not readily
available in the U.S., I utilize a sample of private Italian firms engaging multiple individual
auditors to form a Board of Statutory Auditors (BSA) as a “natural laboratory” to capture
interactions among individual auditors. For private companies, the BSA acts as a monitor and
operates in a similar manner as an audit committee in the US. Furthermore, the BSA can also act
as the external auditor, thus performing the statutory audit. This paper makes several contributions to the accounting literature. First, to the best of my
knowledge, this is one of the first studies to switch the focus from board interlocks to
professional networks of individual auditors. Results suggest that auditor networks play a key
role in the diffusion of knowledge and expertise among individual auditors. Second, by focusing
on multiple individual auditors working together on the same engagement, this study contributes
to the stream of literature examining auditor expertise and audit quality. This study demonstrates
that better-connected auditors acquire an informational advantage that provides economic
benefits to client firms in the form of higher audit quality. Last, this paper also contributes to the
literature of auditor expertise and audit fees. Results show that auditors with better connections
in their professional networks can differentiate themselves through higher levels of knowledge
and expertise, which, in turn, can lead to audit fees premiums.
The remainder of the paper is organized as follows. The next section explains the
institutional setting. Section III provides a summary of prior research and develops the
hypotheses. Section IV presents the sample selection, and describes the research design. Section

! 5
V provides the primary analyses. Section VI presents additional analyses. Finally, Section VII
concludes.
II. INSTITUTIONAL SETTING
This section briefly describes some features of the Italian audit market that are relevant to
the present study. In Italy, both public and private companies must file financial statements with
the National Register of Companies, which is overseen by the system of the Chambers of
Commerce. External auditing is mandatory for large companies, both publicly and privately
held1. The motivation is to protect all company stakeholders, including suppliers, employees,
financial institutions and tax authorities, who are, in turn, the main users of financial statements
issued by Italian private companies2.
When a statutory audit is mandatory, Italian companies, both public and private, must
engage multiple individual auditors to form a Board of Statutory Auditors (BSA). This board is
not a subcommittee of the board of directors. Instead, it holds an autonomous position in the
company hierarchy alongside the board of directors. Members are appointed by company’s
shareholders and must be independent from the Board of Directors. Furthermore, the BSA
reports directly to the shareholders during the annual meeting, and not to the Board of Directors.
The BSA’s functions for a public company are similar to those of an audit committee in the
US. The BSA oversees the financial reporting process, the efficacy of the internal control and
risk management system, the independence of the external auditor, legal and corporate
compliance (with internal bylaws) and the appropriateness of the company’s organizational
structure. Italian public companies cross listed in the US can elect the SEC Rule 10A-3
!!!!!!!!!!!!!!!!!!!!!!!!!!!!!!!!!!!!!!!!!!!!!!!!!!!!!!!!1 Article 2477 of the Italian Civil Code contains the dimensional criteria. 2 The regulations governing statutory audits for both private and public companies are found in Legislative Decree 39/2010, which brought European Directive 2006/46/CE into force.!

! 6
exemption for foreign private issuers and designate the BSA as the body to perform the functions
of the audit committee as stipulated by the SOX Act and SEC rules3.
For private companies, in addition to the monitoring functions described above, the BSA
can also perform the statutory audit, as if it were the external auditor. Private firms can
alternatively engage an audit firm, or an individual auditor to audit their financial statements.
When the BSA is in charge of the statutory audit there are important implications. First, all its
members must be auditors enrolled in the dedicated register maintained by the Minister of
Economics and Finance (Articles 15 and 16 of the European Directive 2006/43/CE). Second, the
Minister of Economics and Finance oversees the activity of the BSA, in the same manner that it
oversees audit firms and individual auditors.
When a BSA is not in charge of the statutory audit, it remains involved with the audit. The
BSA is in charge of the obligation of oversight of the firm’s accounting structure and is required
to express an opinion regarding the adoption and implementation of the accounting system, the
capitalization of certain relevant intangible assets (such as R&D and goodwill), the firm’s
economic results and the status of the firm as an ongoing concern. Moreover, the BSA proposes
candidates for the external auditor position to the shareholders and monitors the independence of
the external auditor.
The BSA consists of three or five members who sit for three years and who may be re-
elected thereafter. There is no rotation rule for the BSA, and members can belong to the same or
different accounting firms4. Members must be independent in accordance with the principles of
European Directive 2006/43/CE and the best practices promulgated by the Italian National
!!!!!!!!!!!!!!!!!!!!!!!!!!!!!!!!!!!!!!!!!!!!!!!!!!!!!!!!3 A few examples of the functions of the BSA in public companies are provided in Appendix A. Moreover, an introduction to the BSA for public companies can be found in Melis (2004). 4 In this respect, the Italian BSA is to some extent similar to the parallel structure in Finland, where private firms appoint more than two individual auditors who belong to different accounting firms to audit the financial statements. For an in-depth analysis of the Finnish system, please refer to Karjalainen (2011). Moreover, in Taiwan, listed companies must be jointly audited and signed by two auditors. For an in-depth analysis of the Taiwanese system, please refer to Chin and Chi (2009)

! 7
Association of Chartered Accountants (Consiglio Nazionale dei Dottori Commercialisti ed
Esperti Contabili) 5. Members jointly conduct the firm’s audit and prepare a single audit report
that must be signed by all the members6. Because BSA members co-sign the audit report, they
are held jointly liable for the potential civil liability and administrative sanctions arising from
irregularities during the execution of the audit7. BSA fees are based on client characteristics,
including total assets, and working hours (BSA, Board of Directors, and shareholders’ meetings)
and are negotiated among BSA members and the board of directors8.
Thus, the Italian regulation for statutory audit in private firms provides an interesting
setting to examine whether auditor connectedness is associated with audit quality and audit fees.
By interacting in different BSAs, auditors integrate themselves into networks based on
professional ties, in which the nodes are auditors and the edges the BSA. These professional
networks are one mechanism through which knowledge can spread and are the object of this
study.
III. LITERATURE REVIEW AND HYPOTHESES DEVELOPMENT
Audit Quality and Auditor Knowledge
Since the seminal paper of DeAngelo (1981), audit quality is typically defined through the
performance of two tasks: detecting errors in the financial statements and reporting them. The
likelihood of detecting errors in financial statements depends on auditor knowledge—a holistic
!!!!!!!!!!!!!!!!!!!!!!!!!!!!!!!!!!!!!!!!!!!!!!!!!!!!!!!!5 Article 22 of European Directive 2006/43/CE identifies direct and indirect relationships between a client company and the statutory auditor (including her/his network of colleagues). Rule 1.3 of the “Rules of Conduct of the Board of Statutory Auditors” promulgated by the Italian National Association of Chartered Accountants contains the principle “comply or explain” to drive the decisions of auditors about whether to accept a new appointment as a BSA member. 6 Similar to what occurs for the joint audit in France. Please refer to Francis, Richard and Vanstraelen (2009) for an in-depth analysis of the joint audit. 7 Article 24 of the Legislative Decree 39/2010 provides for a monetary penalty up to 150,000 euro, a suspension from the public Register up to 5 years, and, in the worst cases, the expulsion. These sanctions are applied to each member of a BSA. 8 The Ministerial Decree 160/2010 indicates the lowest and the highest audit fees that the BSA can charge.

! 8
and complex construct—that has been operationalized by means of accounting firm attributes,
including firm size, industry specialization, and engagement office size.
Beginning with Becker et al. (1998) and Francis et al. (1999), several studies show that
larger accounting firms (typically identified as Big N accounting firms) provide higher audit
quality. Although these studies suggest that larger auditors have higher reputation and litigation
incentives, it can also be argued that larger auditors have more resources. Lawrence et al. (2011)
propose that Big N firms can afford more robust training programs and standardized audit
procedures. DeFond and Zhang (2013) suggest that large accounting firms attract people with
higher human capital and expertise and that they enjoy economies of scale with respect to
monitoring audit quality.
Studies regarding accounting firm size state that size leads to industry specialization or
expertise. DeFond and Zhang (2013) argue that industry specialists provide higher audit quality
because of dedicated investment in industry-specific technologies and human capital, which
generate greater knowledge about the industry and its accounting practices. Industry
specialization, or expertise, has been studied at the national (Balsam, Krishnan, and Yang 2003),
city (Reichelt and Wang 2010), and individual levels (Chin and Chi 2009). Generally, a positive
association with measures of audit quality is found.
Office size captures knowledge at a different level of analysis. Francis and Yu (2009)
postulate that large offices, given their local clients' knowledge, have more in-house expertise in
working with public clients and that this characteristic is associated with higher audit quality.
Moreover, Francis and Yu posit that auditors working for large offices can consult with their
peers more easily, which increases the collective human capital.

! 9
Because knowledge is difficult to observe, researchers rely on indirect proxies such as
auditor size. Lawrence et al. (2011) warn that these indirect proxies might capture client and not
auditor characteristics. Moreover, because information about individual auditors signing the
audit report is not available in the US, most of these studies are conducted at the firm level. Few
papers analyze individual characteristics using non-US settings (Caramanis and Lennox 2008;
Chin and Chi 2009; Chen, Sun, and Wu 2010; Gul, Wu and Yang 2013)
Social network analysis (SNA) is well suited to capture knowledge9 spillovers generated
through interactions between individual auditors over multiple engagements. SNA has been
recently used in accounting to study the association of board connectedness with firm
performance (Larcker et al. 2013), and of director connectedness with financial reporting quality
(Omer, Shelley and Tice 2014). Similarly, Horton, Millo, and Serafeim (2012) show that
directors are rewarded for the resources their connections bring to the company and that these
resources are ultimately associated with firm performance.
I contend that auditor connectedness is not uniform and that better-connected auditors
benefit more in terms of knowledge spillovers. Burt (1992, 2004) states that individuals
occupying a better position in a network have access to a broader array of information and earlier
access to and more control over that information's diffusion. Following Larcker et al. (2013),
better-connected auditors might have better access to information on industry best practices,
market conditions and regulatory changes that give such auditors a comparative advantage in
making audit planning decisions. Moreover, building on prior studies on behavioral auditing
(Vera-Muñoz, Ho, and Chow 2006; Kadous, Leiby, and Peecher 2013) and social networks (Burt
!!!!!!!!!!!!!!!!!!!!!!!!!!!!!!!!!!!!!!!!!!!!!!!!!!!!!!!!9 Polanyi (1966) identified two types of knowledge: explicit and tacit. Explicit knowledge consists of standardized audit procedures and training programs that can be easily codified and transferred. Tacit knowledge is represented by the know-how, experience and motivation that reside in individuals. According to Chin and Chi (2009), tacit knowledge predominates in audit firms. I posit that auditor networks are channels through which tacit knowledge is transferred. !

! 10
1992, 2004), better-connected auditors can leverage their network contacts to obtain informal
advice during an audit engagement before reaching their final judgment. Finally, extending the
work of Francis and Yu (2009), auditors with better network connectedness have more
consultation opportunities with colleagues in their networks.
However, Larcker et al. (2013) warn that better board connectedness may also negatively
influence firm performance. Fich and Shivdasani (2006) contend and find that firms with busy
boards of directors are associated with weak corporate governance. Relatedly, better-connected
auditors might have too many audit engagements to dedicate the necessary attention to each
client company, rendering them ineffective monitors. Furthermore, there might be the risk that
auditors share practices and methodologies that reduce the quality of the audit. To the extent that
these costs can be detrimental to the quality of auditor activity, it is ultimately an empirical
question to test the association between auditor connectedness and audit quality. Thus, the first
hypothesis is stated in the null form as follows:
H1: Within auditor networks, auditor connectedness is not associated with audit quality.
Audit Fees and Auditor Knowledge
As with the literature on audit quality, prior studies generally examine and find a positive
association between audit fees and auditor expertise at the national (Craswell et al. 1995; Choi et
al. 2008), office (Ferguson et al. 2003; Francis et al. 2005) and partner level (Zerni 2012). Such
studies typically interpret the existence of a fee premium as evidence of differentiation through
knowledge. Lawrence et al. (2011) suggest that fees proxy for the levels of effort provided and

! 11
are negatively associated with earnings management10.
The central debate in this literature is about the degree to which there is a transfer of
knowledge among auditors within the accounting firm, and if this knowledge spillover occurs at
the firm/office (Ferguson et al. 2003; Francis et al. 2005), or partner level (Zerni 2012).
According to the firm-wide view, industry expertise is uniform across offices; thus, the national
office enables knowledge spillovers across offices by means of standardized training and audit
programs. However, the office-specific view states that expertise belongs to unique personnel of
the firm and is acquired through individual clients in specific industries; consequently, expertise
tends to be office specific and cannot be captured by the firm as a whole. More recently, Zerni
(2012) moves the debate from the firm/office level to the signing partner, and finds a premium
paid by client firms for partners’ expertise. This result suggests that expertise is not uniformly
distributed among partners in an office.
Although these studies contribute to our understanding of auditor expertise, they suffer
from a potential limitation because they consider partners and their teams as a unique unit of
analysis due to a lack of data about individuals conducting the audit. By inferring that knowledge
is uniform within a team of auditors, these studies ignore the fact that each individual brings her
knowledge to the team and that this knowledge accumulates through interactions among
individuals. Relatedly, Vera-Muñoz et al. (2006) theorize that interactions within teams and
across individuals working on different teams or divisions provide important channels of
knowledge transfer. By adopting SNA, this study captures interactions among individual auditors
and test whether such interactions are associated with audit fees. Arguably, better-connected
auditors can differentiate themselves through their informational advantage and then charge a fee
!!!!!!!!!!!!!!!!!!!!!!!!!!!!!!!!!!!!!!!!!!!!!!!!!!!!!!!!10 It can be argued that audit fees are a proxy for audit quality; however, Minutti-Meza (2013) posits that high fees alone do not necessarily imply high quality: experts may charge higher fees if they have oligopoly-type power in certain industries, without necessarily providing higher quality audits.

! 12
premium.
However, Chin and Chi (2009) warn that knowledge transfer among individuals is difficult
because knowledge is tied to the innate abilities of each individual. Moreover, Vera-Muñoz et al.
(2006) contend that individual auditors must apply their own judgment in identifying and
implementing pieces of information during an audit assignment. For these reasons, it is an open
empirical question to test the association between audit fees and auditor connectedness. Thus,
also the second hypothesis is stated in the null form as follows:
H2: Within auditor networks, auditor connectedness is not associated with audit fees.
IV. SAMPLE SELECTION AND RESEARCH DESIGN
In this paper, I adopt the full network method to identify the boundaries of auditor
networks. This method provides a picture of all the existing relationships in a population and is
used in studies of interlocking boards of directors (e.g., Hanneman and Riddle 2005). I choose
one local administrative area (province), and following Rauch (2010), I assume that all the
interactions among the auditors occur inside this area’s boundaries. In particular, I use the
administrative area of Verona because it represents an average Italian province11, with a
population in 2009 of 920,000, an unemployment rate of 4.7 percent, GDP per capita of 29,300
euros and total exports of almost 6 billion euros. Moreover, the Chamber of Commerce of
Verona, which is the repository of corporate governance data for all companies with legal head
offices in its administrative area, supported this research project by sharing its proprietary data12.
!!!!!!!!!!!!!!!!!!!!!!!!!!!!!!!!!!!!!!!!!!!!!!!!!!!!!!!!11 Verona is in the Veneto region (whose capital is Venice). In 2009, the Veneto region had a GDP of 145 billion euros, representing ten percent of the total Italian GDP, which was similar in size to some European countries, such as the Czech Republic, Portugal and Finland. Data are elaborated on statistics provided by the National Institute of Statistics (Istituto Nazionale di Statistica, ISTAT) and can be retrieved from www. istat.it. 12 These data are publicly available on demand, and the Chamber of Commerce applies fees for each firm query.

! 13
I begin with the population of all non-financial private firms in Verona that are required to
audit their accounts and that were available in the ORBIS database provided by Bureau Van
Dijk. I exclude firms with NACE code “64” (Financial Services), “65” (Insurance) and “66”
(Activity Auxiliary to Financial Services and Insurance). From the 2008-2011 period, I identify
an initial sample of 1,186 unique firms, which provide 4,217 firm-year observations. I chose
2008 as the initial year so that all years are after the outbreak of the financial and economic crisis
to ensure that the macroeconomic conditions are homogenous over the sample.
The Chamber of Commerce of Verona provides complete information about the
composition of each firm's BSA, so that I could identify 1,461 individual auditors over the 2008-
2011 period. Among these auditors, untabulated results show that those who worked for the Big
4 or second tier audit firms formed less than one percent of the sample. Data about auditors’
personal characteristics were hand-collected through publicly available information.
From the initial sample, I dropped 609 firm/year observations because of missing values
for a variable of interest. Additionally, I dropped another 193 firm/year observations because the
primary set of the company’s financial statements was consolidated13. For the discretionary
accrual sample, the data requirement to compute the dependent variable results in a final sample
of 2,894 firm-year observations. Data about BSA fees were hand-collected from the notes to the
financial statements because they were not available in ORBIS. The final sample consists of
2,787 firm-year observations. I winsorize the continuous financial variables at the top and
bottom one percent.
!!!!!!!!!!!!!!!!!!!!!!!!!!!!!!!!!!!!!!!!!!!!!!!!!!!!!!!!13 ORBIS provides either consolidated financial statements or parent-only accounts as the primary set of financial statements, depending on availability, as with AMADEUS (Burgstahler, Hail and Leuz 2006).

! 14
Audit-Quality Model
To examine the association between audit quality and auditor connectedness, the following
ordinary least squares (OLS) regression is estimated based on the prior audit literature using non-
US samples (Francis and Wang 2008; Michas 2011):
AQit = + β0 + β1CONNECTEDNESSit + β2BUSY_BSAit + β3IND_SPECit
+ β4SHORT_TENit + β5BSA_INDit + β6GENDERit + β7PERFORMit + β8SIZEit
+ β9LEVERAGEit + β10CFOit + β11GROWTHit + β12LOSSit + β13REL_PARTIESit
+ β14NO_EXT_AUDit + Year_FE + Industry_FE + εit (1)
where AQit stands for audit quality and CONNECTEDNESSit for auditor connectedness for
company i in year t. All the variables are explained hereafter.
Few studies (Bauwhede and Willekens 2004; Van Tendeloo and Vanstraelen 2008;
Caramanis and Lennox 2008) focus on demand for audit quality in private firms. Although
private firms are not subject to the pressure of the securities markets, other stakeholders, such as
bankers, suppliers, employees and tax authorities, monitor them. Van Tendeloo and Vanstraelen
(2008) argue that a statutory audit of private firms should guarantee these stakeholders accurate
financial statements, the absence of financial fraud and an accurate portrayal of going-concern
status. Private firms have fewer agency problems because the owner of a private firm is
frequently the manager. Nonetheless, agency problems might still arise, such as conflicts
between bankers and managers (Caramanis and Lennox 2008; Bauwhede and Willekens 2004),
or conflicts between controlling and minority shareholders (Hope and Langli 2010).

! 15
For private Italian firms, qualified opinions are rare. In a recent study, Cameran (2010)
finds that 97.42 percent of the opinions were clean. This high percentage of clean opinions drives
my research design toward the use of financial statements as a measure of audit quality to create
greater cross-sectional variation. Thus, following a sizeable stream of prior research (e.g., Becker
et al. 1998; Francis, Richard, and Vanstraelen 2009; Francis and Krishnan 1999; Bauwhede and
Willekens 2004; Caramanis and Lennox 2008; Ajona, Dallo, and Alegría 2008), I adopt earnings
management as the dependent variable in the audit-quality model. Moreover, earnings
management is also a common measure in studies of Italian companies (Prencipe and Bar-Yosef
2011; Bar-Yosef and Prencipe 2013; Cameran, Prencipe, and Trombetta 2014). Recently,
DeFond and Zhang (2013) argue that the continuous nature of earnings quality measures, such as
discretionary accruals, better captures variations in audit quality also in small samples, such as
the one in this study.
Although earnings management does not imply any violation of accounting principles per
se, Francis and Yu (2009) and Francis (2011) suggest that aggressive earnings management can
result in materially misleading financial reports. In this study, I use the discretionary accruals
model proposed by Dechow, Sloan, and Sweeney (1995). Following Francis and Yu (2009) and
Prawitt, Smith, and Wood (2009), I estimate the following model by industry and year with at
least ten observations:
ACCit = β0 + β1 1/TAit + β2 (ΔREVit - ΔRECit)/ TAit + β3 PPEit/ TAit + εit (2)
where ACCit is total accruals, measured as the change in non-cash current assets minus the
change in current non-interest-bearing liabilities, minus depreciation for firm i in year t, scaled

! 16
by lagged total assets; ΔREVit is the annual change in revenues scaled by lagged total assets for
firm i in year t; ΔRECit is the change in receivables scaled by lagged total assets for firm i in year
t; and PPEit is property plant and equipment, scaled by lagged total assets for firm i in year t. The
residuals from the regression are the discretionary accruals used to proxy audit quality.
Consistent with previous studies (e.g., Reynolds and Francis 2000; Johnson, Khurana, and
Reynolds 2002; Bauwhede and Willekens 2004; Francis and Yu 2009; Prawitt et al. 2009), I use
the absolute value of discretionary accruals because I am interested in the magnitude of earnings
manipulation; a priori, I have no predictions about the direction of management discretion.
Higher levels of absolute discretionary accruals are interpreted as higher intensity of earnings
manipulation and lower audit quality. In the sensitivity analysis section I use other proxies for
accruals to reduce the risk that the results are driven by a proxy-specific factor instead of
earnings management.
In this paper, I follow Horton et al. (2012) and I proxy the test variable, auditor
connectedness (CONNECTEDNESS) with Burt’s (1992) concept of network constraint, which
represents the extent to which the auditor’s network of contacts is like a “straightjacket” around
the auditor, thus limiting her vision of alternative ideas. The intuition behind this measure is that
an individual auditor can take advantage from being the link—broker—between two or more
otherwise disconnected or loosely connected groups in a network. The lower the auditor’s
network constraint within her networks of contacts, the better her brokerage position. In this
study, I contend that auditors in better brokerage positions (better-connected) accumulate higher
levels of knowledge spillover. Consequently, my measure of CONNECTEDNESS is computed as
(1 – network constraint), where high values correspond to better-connected auditors. This
measure presents two advantages. First, it permits a computation of differences in terms of level

! 17
of connectedness between two auditors by the relative extent to which their contact networks are
constrained; thus, two auditors could have the same number of contacts but a different network
structure. Second, this measure captures an important characteristic of an auditor’s network:
information redundancy. Redundancy indicates that an auditor’s contacts are previously
connected among themselves, such that there are no opportunities for the focal auditor to gather
new information. Thus, the higher the redundancy of the contacts, the lower the level of
information diversification available to the auditor. Overall, this measure captures the idea that
being better connected is not about how many contacts an auditor has in her network but more
about the quality of such connections. Because I conduct the analysis at the firm level, I first
compute the measure of CONNECTEDNESS at the individual level for each BSA member, and
then I compute the median among the BSA members. I expect the sign to be negative14.
Consistent with the prior literature, I add two categories of control variables. The first
group is intended to control for some characteristics of BSA members that can explain variation
of audit quality. Given the risk that auditors with many engagements are too busy to dedicate
sufficient time to each client firm I add a control, BUSY_BSA, which is a dummy equal to 1 if
any of the BSA members is a busy auditor, otherwise 015. Busy auditors are those falling within
the top one percent of the distribution of the ratio of total clients’ size (in assets) per auditor to
the total size (in assets) of firms in the sample. However, busy BSA members might be well-
connected because of the reputation built for the performance of previous audits; therefore, they
might have more incentive to conduct audits of higher quality. Given these two opposite forces,
it is not possible to predict, a priori, the sign of BUSY_BSA. Following prior archival studies
!!!!!!!!!!!!!!!!!!!!!!!!!!!!!!!!!!!!!!!!!!!!!!!!!!!!!!!!14 The results are unchanged when I use the mean. In the sensitivity analysis, I use other measures for capturing auditor connectedness. CONNECTEDNESS calculations are shown in Appendix B. 15 Fich and Shivdasani (2006) use an indicator variable to identify a busy board of directors when more than 50 percent of the members have more than 3 directorship. Given the specific setting of my study, an auditor with three appointments in small firms is not as busy as one auditor who has three appointments in large firms. For this reason, I weight the total number of appointments by client firm size, and I look at the distribution of this weighted average measure.

! 18
(Craswell et al. 1995; Francis et al. 2005; Carson 2009; Gul et al. 2013), I control for BSA
members’ industry specialization by adding IND_SPEC, which is 1 if any BSA member is the
industry leader and 0 otherwise. An auditor is classified as an industry leader if he/she has the
highest market share in terms of both client size and number of engagements (with a minimum of
two engagements per industry)16. I expect a positive association with audit quality. I also control
for the gender composition of a BSA by adding a dichotomous variable (GENDER), which is
equal to 1 if any of the members of a BSA is female and 0 otherwise17. I posit that a BSA with at
least one female member should be more rigorous in the audit process to detect and prevent
earnings manipulation (Francis 2011; Niskanen, Karjalainen, Niskanen, and Karjalainen 2011).
Following Francis and Yu (2009), I control for short tenure of the BSA by adding a dichotomous
variable (SHORT_TEN) equal to 1 if tenure of BSA is three years or less and 0 otherwise.18 I
expect the sign to be positive, indicating that short tenure is associated with lower client earnings
quality, which is consistent with the prior literature showing relevant start-up costs for new
clients. Given that BSA members can belong to different accounting firms, I expect BSAs with
members working for the same accounting company to behave differently from BSAs with
members working for different accounting companies. It could be that, when BSA members
work for different accounting companies, they increase their professional skepticism, that, in
turn, results in more independent judgment. I add a dichotomous variable (BSA_IND) equal to 1
if BSA members belong to different accounting firms, and 0 otherwise19, and I expect BSA_IND
to be associated with higher audit quality.
!!!!!!!!!!!!!!!!!!!!!!!!!!!!!!!!!!!!!!!!!!!!!!!!!!!!!!!!16 Industries are identified by two-digit NACE codes. 17 Given that the identity of BSA members is known, it is straightforward to identify female members. 18 The three-year period coincides with the mandate of a BSA, so this dummy identifies when a BSA has been recently appointed (a new engagement). 19 In order to identify the accounting firm, I used multiple sources: websites of the local CPA associations, websites of accounting firms, curricula and newspapers articles available online.

! 19
The second group includes firm controls. PERFORM is measured as lagged net income
over lagged total assets and is expected to be negatively associated with earnings management.
SIZE (the natural logarithm of total assets) is included because earnings management measures
are expected to be negatively associated with firm size. LEVERAGE (total liabilities/total assets)
controls for the level of leverage of the client firm and is expected to be positively associated
with earnings management. CFO (cash flow from operations over lagged total assets) is expected
to have an inverse relationship with earnings management. GROWTH (sales growth rate) is
included because I expect accruals to be positively correlated with a firm’s growth opportunities.
LOSS is a dummy variable that equals 1 when the firm experiences a loss in the current year; it is
a proxy for distress and is expected to be an incentive to increase reported earnings in the
subsequent year. In Italy, many companies have dominant shareholders, typically an individual
or a family (Faccio and Lang 2002) that might have an incentive to manipulate earnings. To
alleviate the risk that companies in the sample are controlled by the same dominant shareholder,
and consequently are exposed to the identical earnings manipulation strategies, I introduce a
control, REL_PARTIES, which is a dichotomous variable equal to 1 if in the sample there are
other firms controlled by the same ultimate owner 20 , 0 otherwise. NO_EXT_AUD is a
dichotomous variable that is equal to 1 when the firm entrusts the BSA with the statutory audit
and 0 otherwise. Cameran and Prencipe (2011) investigate the differences in audit quality
between BSAs, individual auditors and audit firms and they do not find remarkable differences
between BSAs, individual auditors and non-Big 4 audit firms. Thus, I have no prediction for
NO_EXT_AUD. I also include dummies for time effect and industry effects, and I cluster robust
standard errors by firm to correct for serial dependence (Petersen 2009).
!!!!!!!!!!!!!!!!!!!!!!!!!!!!!!!!!!!!!!!!!!!!!!!!!!!!!!!!20 This information is obtained directly from the ORBIS database.

! 20
Audit-Fees Model
To test the association between audit fees and auditor connectedness, the following
ordinary least squares (OLS) model is estimated based on the prior audit fees literature (Ferguson
et al. 2003; Francis et al. 2005; Zerni 2012):
LFEESit = + β0 + β1CONNECTEDNESSit + β2BUSY_BSAit + β3IND_SPECit
+ β4SHORT_TENit + β5BSA_INDit + β6GENDERit + β7PERFORMit
+ β8SIZEit + β9QUICKit + β10CATAit + β11TURNOVERit + β12LEVERAGEit
+ β13CFOit + β14GROWTHit +β15LOSSit + β16REL_PARTIESit
+ β17 NO_EXT_AUDit + Year_FE + Industry_FE + εit
(3)
Following prior literature, I operationalize LFEES as the natural logarithm of the fees
charged by the BSA. All the variables are defined as in Model (1), with the exception of CATA,
which is the ratio of current assets to total assets, and TURNOVER, which equals the ratio of
sales over total assets. There is one additional measure of liquidity: QUICK equals current assets
(net of inventory) over current liabilities.
I hypothesize the sign of my test variable, CONNECTEDNESS, to be positive, thus
providing evidence of a premium for better-connected auditors. Relatedly with the audit-quality
model I have no predictions for ex ante for BUSY_BSA. On one hand, busy auditors might charge
lower fees because of the limited time and effort; on the other hand, if auditors have many
appointments because of their reputation, then I would expect a positive sign for BUSY_BSA.
Moreover, I expect higher fees when BSA members belong to different accounting firms
(BSA_IND) and when at least one BSA member is female because of the higher effort and rigor

! 21
during the audit. Based on prior research (Ferguson et al. 2003; Francis et al. 2005; Zerni 2012),
I expect a positive association between audit fees and industry specialists (IND_SPEC), large
firms (SIZE), greater audit complexity (CATA, TURNOVER), greater growth (GROWTH), loss
firms (LOSS) and leverage (LEVERAGE). I also expect a negative association between audit fees
and performance (PERFORM), liquidity (QUICK) and cash flows (CFO).
V. PRIMARY ANALYSES
Descriptive Statistics and Univariate Analyses
I report the descriptive statistics of the audit quality (audit fees) sample in Table 1, Panel A
(Panel B). I compare the descriptive statistics with the study of Cameran et al. (2014) on Italian-
listed firms, and my sample shows similar results. The BSA characteristics of the sample merit
further attention. CONNECTEDNESS has an average of 0.62 (0.63) in the audit quality (audit
fees) sample, which can be interpreted as the number of brokerage opportunities that are present
in BSA members’ networks. In 9 percent (10 percent) of the observations, the BSA has at least
one industry specialist in the audit quality (audit fees) model. In 29 percent of the observations in
both samples, the BSA has at least on female member. In 5 percent of the observations in both
samples, the BSA is recently engaged (less than 3 years). In 65 percent (66 percent) of the cases
in the audit quality (audit fees) sample, the BSA consists of auditors working for different
accounting firms. Finally, in almost 91 percent (89 percent) of the firms in the audit quality
(audit fees) sample, the BSA is charged with auditing the financial statements, which is
consistent with statistics at the national level21.
!!!!!!!!!!!!!!!!!!!!!!!!!!!!!!!!!!!!!!!!!!!!!!!!!!!!!!!!21 Belcredi et al. (2009) show that, as of the end of 2007, BSAs were appointed for statutory audits by 88.27 percent of Companies Limited by Shares and by 93.79 percent of Limited Liability Companies. More recently, a study using a sample of SMEs from the Veneto Region shows similar results: 86 percent of Companies Limited by Shares and 94 percent of Limited Liability Companies appointed a BSA for the statutory audit (Cason 2011).

! 22
–Table 1 around here –
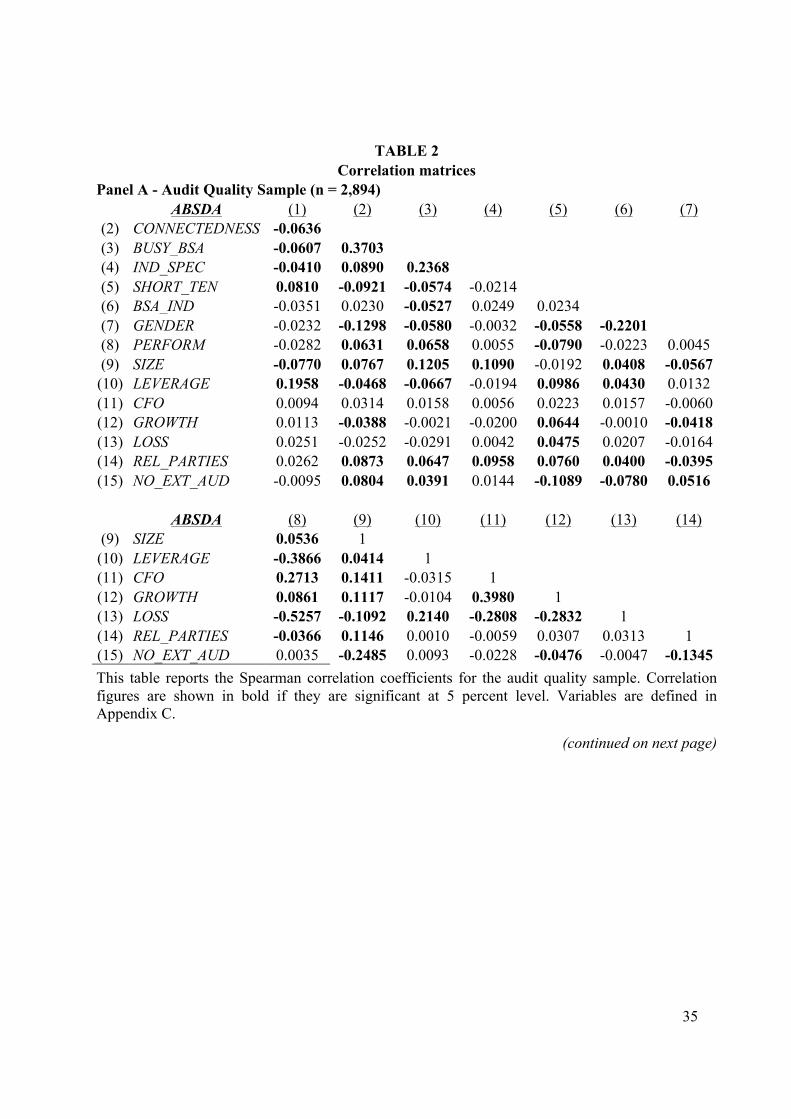
Univariate correlation coefficients are presented in Table 2. In Panel A, I report correlation
matrices for the audit quality sample. ABSDA are negatively correlated with
CONNECTEDNESS, BUSY_BSA, IND_SPEC, BSA_IND and GENDER, whereas it is positively
correlated with SHORT_TEN. In Panel B, I report correlations for the audit fees sample. Audit
fees are positively associated with CONNECTEDNESS, BUSY_BSA, IND_SPEC, and
BSA_INDEP, whereas audit fees are negatively associated with GENDER. In both samples,
CONNECTEDNESS is positively associated with BUSY_BSA, IND_SPEC, BSA_INDEP and
REL_PARTIES and NO_EXT_AUD, whereas it is negatively associated with SHORT_TEN and
GENDER. Overall, the results of this preliminary analysis suggest that CONNECTEDNESS is
positively correlated with both audit quality and audit fees.
– Table 2 around here –
Audit-Quality Model
Table 3, Panel A, reports the results of the audit quality test. The coefficient of
CONNECTEDNESS is negative and significant, which suggests that the benefits of being well-
connected overcome the costs. Better-connected auditors can obtain a comparative advantage for
three reasons. First, they can access information on industry best practices, market conditions
and regulatory changes in making audit-planning decisions. Second, they can use their contacts
in the network to obtain informal advice during audit assignments before making final
judgments. Third, they can exploit more consultation opportunities with colleagues in their
networks. SHORT_TEN, BSA_IND, and GENDER have the predicted sign and are significant.
Given that IND_SPEC is not significant, it can be inferred that the ability to access an extensive
network of professionals may compensate for possibly not having industry expertise. BUSY_BSA

! 23
is also not significant, most likely because the limited attention that busy auditors can dedicate to
each client is compensated by the effort required to protect their reputation. Among the control
variables at the firm level, SIZE, LEVERAGE and CFO are significant.
–Table 3 around here –
Following Francis and Yu (2009), Carey and Simnett (2006) and Menon and Williams
(2004), I also conduct a sensitivity analysis on the subsample of observations with negative
abnormal accruals in Table 3, Panel B (I use the absolute value of negative abnormal accruals to
ease the interpretation) and on the subsample of observations with positive abnormal accruals in
Table 3, Panel C. For both subsamples, the coefficient of CONNECTEDNESS is negative and
significant, consistent with the full sample results.
Audit-Fees Model
Table 4 reports the audit fees test. The association between CONNECTEDNESS and audit
fees is positive and significant, thus suggesting that auditors exchange information and expertise
when they are assigned to the same audit engagement. Moreover, better-connected auditors can
exploit their brokerage opportunities within their networks to obtain an informational advantage
and charge a fee premium. BUSY_BSA is positive and significant, indicating that auditors with
more engagements have higher reputation and can also charge a fee premium. In addition,
BSA_IND is significantly positive, which suggests that when the BSA members belong to
different accounting firms they can charge higher fees because of their high quality monitoring.
Among the control variables, SIZE, CATA, and LOSS are positive and significant, whereas
PERFORM and LEVERAGE are negative and significant.
–Table 4 around here –

! 24
Overall, the tests indicate that absolute discretionary accruals and audit fees vary across
levels of auditor connectedness, which supports the intuition that auditors with better brokerage
opportunities gather higher quality information through knowledge spillovers and shared
experience and provide audits of higher quality, which result in charging a fee premium.
VI. ADDITIONAL ANALYSES
Alternative Measures of Dependent Variables
Because there is no unanimously accepted measure of earnings management, in
untabulated results I use other proxies for accruals to reduce the risk that the results are driven by
a proxy-specific factor instead of earnings management. First, I use the performance-adjusted
discretionary accruals model proposed by Kothari, Leone, and Wasley (2005), where return on
assets for firm i in year t (ROAit) is included to control for performance in Model (2). Second, I
use the model developed by Ball and Shivakumar (2006) to control for the asymmetric timeliness
of accruals in recognizing economic gains and losses. Third, I also use current accruals as an
alternative measure of audit quality (Myers, Myers, and Omer 2003; Carey and Simnett 2006).
Fourth, I follow prior studies examining earnings management (Prencipe and Bar-Yosef 2011;
Bar-Yosef and Prencipe 2013) and audit quality (Cameran et al. 2014) with Italian samples, and I
adopt AWCA (DeFond and Park 2001). In all these different specifications the coefficient of
CONNECTEDNESS is negative and significant (p-value < 0.05).
In untabulated analysis, I substitute LFEES with the non-logarithmic form of current level
of BSA fees, and the coefficient of CONNECTEDNESS is positive and significant (p-value <
0.05).

! 25
Alternative Measures of Auditor Connectedness
In untabulated results, I substitute the measure of CONNECTEDNESS with efficiency
(Burt 1992), which is another index that measures the proportion of auditors’ ties to their
contacts that are not redundant. I compute the measure of efficiency at the individual level for
each BSA member, and then I compute the median between the BSA members. The coefficient
of efficiency is negative and significant (p-value < 0.05) in the audit-quality model, and positive
and significant (p-value < 0.01) in the audit-fees model.
I also use the median degree centrality of BSA members (Freeman 1977; Larcker et al.
2013) as alternative measure for auditor connectedness, and the coefficient is negative and
significant (p-value < 0.10) in the audit-quality model, and positive and significant (p-value <
0.10) in the audit-fees model.
Other Sensitivity Analyses
I conduct some additional sensitivity analyses. First, I cluster standard errors on a second
dimension because there might be a risk of serial dependence for multiple observations per BSA
that repeat over time. I control for this effect by running the STATA command cluster2 of
Petersen (2009). Results for the audit quality model are reported in the first column of Table 5,
Panel A. The coefficient of CONNECTEDNESS is negative and significant (p-value < 0.01).
Results of the audit fees model are reported in the first column of Table 5, Panel B. The
coefficient of CONNECTEDNESS is positive and significant (p-value < 0.05).
Second, as explained in the institutional setting section, a BSA is not always in charge of
the statutory audit. For this reason, I restrict the analysis to the subsample of BSAs that are in
charge of the statutory audits (NO_EXT_AUD = 1). Results for the audit quality model are

! 26
reported in the second column of Table 5, Panel A. The coefficient of CONNECTEDNESS is
negative and significant (p-value < 0.05). Results of the audit fees model are reported in the
second column of Table 5, Panel B. The coefficient of CONNECTEDNESS is positive and
significant (p-value < 0.10).
- Table 5 around here -
Propensity-Score Matching Analysis
Given that CONNECTEDNESS and the dependent variables (ABSDA and LFEES) are
correlated with several controls both at the BSA and firm levels, there might be a risk that the
main results are a reflection of these firm characteristics and not of auditor connectedness. Prior
auditing literature (Lawrence et al. 2011; Minutti-Meza 2013) suggests that propensity-score
matching could be a useful tool to mitigate this issue. In particular, I adapt the original research
design from Minutti-Meza (2013) to analyze auditors’ industry specialization effect on audit
quality22. To match firms with better-connected auditors to firms with worse connected auditors,
I create an indicator variable, CONNECTEDNESS2, that is equal to 1 when CONNECTEDNESS
is higher than the cross-sectional median and 0 otherwise. I then match23 observations with
CONNECTEDNESS2 equal to 1 with observations with CONNECTEDNESS2 equal to 0 based
on a propensity score, including all the control variables from Model (1), both at the BSA and
firm level, and with industry and year fixed effects. I obtain a matched sample of 2,084 firm-year
observations in the audit-quality model.
!!!!!!!!!!!!!!!!!!!!!!!!!!!!!!!!!!!!!!!!!!!!!!!!!!!!!!!!22 Lawrence et al. (2011) replicate Francis and Yu’s (2009) study by substituting the continuous variable, LOGOFFICE (measured in fees), with a dichotomous MEDOFFICE that is equal to one for offices with sizes higher than the median and by propensity-score matching on observable client firms’ characteristics. Lawrence et al. show that the large office size effect sweeps away after matching. 23 Following Lawrence et al. (2011) and Minutti-Meza (2013), I match on a propensity score with common support, without replacement and using a caliper distance of 0.03.!

! 27
In Panel A of Table 6, I present the descriptive statistics for the full sample and for the
propensity-score matched sample in the audit-quality model. I report the multivariate analysis for
audit-quality model in Panel B of Table 6. I run Model (1) in the matched sample, and the results
are consistent with the main findings: the coefficient of CONNECTEDNESS2 is negative and
significant (p<0.05). In an untabulated analysis, I also create a second indicator variable,
CONNECTEDNESS3, that is equal to 1 when median degree centrality (Freeman 1977, Larcker
et al. 2013) of BSA members is higher than the cross-sectional median and 0 otherwise. I then
match observations with CONNECTEDNESS3 equal to 1 with observations with
CONNECTEDNESS3 equal to 0 based on propensity score, including all the control variables
from Model (1), both at the BSA and at the firm level, and with industry and year fixed effects. I
obtain a matched sample of 2,122 firm-year observations. In the multivariate regression, the
coefficient of CONNECTEDNESS3 is negative and significant (p-value < 0.05), which
corroborates my previous findings.
- Table 6 around here –
I also use propensity-score matching for the audit fees analysis. Table 7 shows the results.
By propensity-score matching on CONNECTEDNESS2, controlling for all the control variables
in the audit fees model, I obtain a matched sample of 1,910 firm/year observations. Descriptive
statistics of the matched sample are reported in Panel A of Table 7. I report the multivariate
analysis in Panel B of Table 7. The results are consistent with the main findings:
CONNECTEDNESS2 is positively associated with audit fees. In an untabulated analysis, I follow
what was done for the audit quality sample and I match on CONNECTEDNESS3 to obtain a
matched sample of 1,898 firm-year observations. In the multivariate regression, the coefficient of

! 28
CONNECTEDNESS3 is positive and significant (untabulated p-value < 0.05), which confirms
my previous results.
- Table 7 around here -
VII. CONCLUSIONS
This paper investigates whether interactions between individual auditors in multiple
engagements across clients (i.e. auditor connectedness) are associated with audit quality and
audit fees. These interactions arguably generate knowledge spillovers and expertise that
improves audit quality and results in higher audit fees. The results indicate that auditor
connectedness is positively associated with audit quality, which suggests that the benefits of
being well-connected outweigh the costs and ultimately promote audit quality. Moreover, this
paper provides evidence that auditors share knowledge that increases their expertise when they
work together on an assignment, which results eventually in a fee premium.
This paper makes several contributions to the accounting literature. First, to the best of my
knowledge, this is one of the first studies to switch the focus from board interlocks to
professional networks of individual auditors. Results suggest that auditor networks represent
conduits of knowledge spillover and expertise among individual auditors. Second, by focusing
on multiple individual auditors cross-appointed to the same audit engagement, this study
contributes to the stream of literature on expertise and audit quality. Results suggest that auditors
share knowledge and expertise that ultimately generate economic benefits for client firms in the
form of higher audit quality. Last, this study also contributes to literature on auditor expertise
and audit fees, by suggesting that better-connected auditors can differentiate themselves through
higher levels of knowledge and expertise, which, in turn, result in fee premiums.

! 29
This study is subject to certain caveats. One caveat pertains to the measure of audit quality
through discretionary accruals. Nevertheless, DeFond and Zhang (2013) argue that the
continuous nature of discretionary accruals offers the opportunity to capture variations in audit
quality in studies with small samples, such as this study. A second caveat is that the panel does
not allow me to address changes over time. A third caveat relates to the generalizability of the
results. However, this unique setting allows me to cleanly capture interactions between
individual auditors in multiple engagements across clients and to measure a construct, auditor
connectedness, that I believe future researchers can further exploit with respect to different
auditor outcomes.

! 30
REFERENCES
Ajona, L. A., F. L. Dallo, and S. S. Alegría. 2008. Discretionary accruals and auditor behaviour in code-law contexts: an application to failing Spanish firms. European Accounting Review 17 (4): 641–666.
Ball, R., and L. Shivakumar. 2006. The role of accruals in asymmetrically timely gain and loss recognition. Journal of Accounting Research 44 (2): 207–242.
Balsam, S., J. Krishnan, and J. Yang. 2003. Auditor industry specialization and earnings quality. Auditing: a Journal of Practice and Theory 22 (2): 71–97.
Bar-Yosef, S., and A. Prencipe. 2013. The impact of corporate governance and earnings management on stock market liquidity in a highly concentrated ownership capital market. Journal of Accounting Auditing and Finance 28 (3): 292–316.
Bauwhede, H. V., and M. Willekens. 2004. Evidence on (the lack of) audit-quality differentiation in the private client segment of the Belgian audit market. European Accounting Review 13 (3): 501–522.
Becker, C. L., M. L. DeFond, J. Jiambalvo, and K. R. Subramanyam. 1998. The effects of audit quality on earnings manipulation. Contemporary Accounting Research 15 (1): 1–24.
Belcredi, M., B. P. C, O. Cagnasso, B. Ermolli, M. Indolfi, P. Montalenti, and V. Salafia. 2009. Modalità di affidamento del controllo contabile nelle società di capitali. In La Riforma del Diritto Societario: i dati aggiornati al 2007, 30–35. Milan: Il Sole 24 Ore S.P.A.
Borgatti, S. P., M. G. Everett, and L. C. Freeman. 2002. Ucinet for Windows: Software for Social Network Analysis. Harvard, MA: Analytic Technologies.
Burgstahler, D., L. Hail, and C. Leuz. 2006. The importance of reporting incentives: Earnings management in European private and public firms. The Accounting Review 81 (5): 983–1016.
Burt, R. S. 1992. Structural Holes. The Social Structure of Competition. Harvard University Press.
Burt, R. S. 1998. The gender of social capital. Rationality and Society 10 (1): 5–46.
Burt, R. S. 2004. Structural Holes and Good Ideas. American Journal of Sociology 110 (2): 349–399.
Cameran, M. 2010. Il controllo contabile nelle aziende non quotate italiane. Scientific report SDA Bocconi - Osservatorio di Revisione
Cameran, M., and A. Prencipe. 2011. Qualità della revisione contabile e tipo di revisore. Economia & Management 1: 99–115.
Cameran M, A. Prencipe, and M. Trombetta. 2014. Mandatory audit firm rotation and audit quality. European Accounting Review (forthcoming).
Caramanis, C., and C. Lennox. 2008. Audit effort and earnings management. Journal of Accounting and Economics 45 (1): 116–138.
Carey, P., and R. Simnett. 2006. Audit partner tenure and audit quality. Accounting Review 81 (3): 653–676.

! 31
Carson, E. 2009. Industry specialization by global audit firm networks. The Accounting Review 84 (2): 355–382.
Cason, A. 2011. Controllo «fai-da-te»sui bilanci delle Pmi. Il Sole 24 Ore, June 8, NordEst - Economie e imprese edition.
Chen, S., S. Y. J. Sun, and D. Wu. 2010. Client importance, institutional improvements, and audit quality in China: an office and individual auditor level analysis. The Accounting Review 85 (1): 127–158.
Chin, C.-L., and H.-Y. Chi. 2009. Reducing restatements with increased industry expertise. Contemporary Accounting Research 26 (3): 729–765.
Choi, J., J. Kim, X. Liu, and D. Simunic. 2008. Audit pricing, legal liability regimes, and Big 4 premiums: Theory and cross-country evidence. Contemporary Accounting Research 25 (1): 55–99.
Craswell, A. T., J. R. Francis, and S. L. Taylor. 1995. Auditor brand name reputations and industry specializations. Journal of Accounting and Economics 20 (3): 297–322.
DeAngelo, L. E. 1981. Auditor size and audit quality. Journal of Accounting and Economics 3: 183–199.
Dechow, P. M., R. G. Sloan, and A.P. Sweeney. 1995. Detecting earnings management. The Accounting Review 70 (2): 193–225.
DeFond, M., and C.W. Park. 2001. The reversal of abnormal accruals and the market valuation of earnings surprises. The Accounting Review 76 (3): 375–404.
DeFond, M., and J. Zhang. 2013. A Review of Archival Auditing Research. Working Paper. University of Southern California.
Faccio, M., and L.H. Lang. 2002. The ultimate ownership of Western European corporations. Journal of Financial Economics 65 (3): 365–395.
Ferguson, A., J. R. Francis, and D. J. Stokes. 2003. The effects of firm-wide and office-level industry expertise on audit pricing. The Accounting Review 78 (2): 429–448.
Fich, E., and A. Shivdsani. 2006. Are busy boards effective monitors? Journal of Finance 61 (2): 689–724.
Francis, J. R. 2011. A framework for understanding and researching audit quality. Auditing: A Journal of Practice and Theory 30 (2): 125–152.
Francis, J. R., and J. Krishnan. 1999. Accounting accruals and auditor reporting conservatism. Contemporary Accounting Research 16 (1): 135–165.
Francis, J. R., E. Maydew, and H. Sparks. 1999. The role of Big 6 auditors in the credible reporting of accruals. Auditing: A Journal of Practice and Theory 18 (2): 17–34.
Francis, J. R., K. Reichelt, and D. Wang. 2005. The pricing of national and city-specific reputations for industry expertise in the US audit market. The Accounting Review 80 (1): 113–136.
Francis, J. R., C. Richard, and A. Vanstraelen. 2009. Assessing France's joint audit requirement: Are two heads better than one? Auditing: A Journal of Practice and Theory 28 (2): 35–

! 32
63. Francis, J. R., and D. Wang. 2008. The joint effect of investor protection and Big 4 audits on
earnings quality around the world. Contemporary Accounting Research 25 (1):157–91. Francis, J. R., and M. D. Yu. 2009. Big 4 office size and audit quality. The Accounting Review
84 (5): 1521–1552. Freeman, L.C. 1977. A set of measures of centrality based on betweenness. Sociometry 40: 35–
41. Granovetter, M. S. 1973. The strength of weak ties. American Journal of Sociology 78 (6): 1360–
1380. Gul, F. A., D. Wu, and Z. Yang. 2013. Do individual auditors affect audit quality? Evidence
from archival data. The Accounting Review 88 (6): 1993–2023. Hanneman, R. A., and Riddle, M. 2005. Social network data. In Introduction to social network
methods. Riverside, CA: University of California Riverside. http://faculty.ucr.edu/~hanneman/.
Hope, O.-K., and J. C. Langli. 2010. Auditor independence in a private firm and low litigation risk setting. The Accounting Review 85 (2): 573–605.
Horton, J., Y. Millo, and G. Serafeim. 2012. Resources or power? Implications of social networks on compensation and firm performance. Journal of Business Finance and Accounting 39 (3–4): 399–426.
Johnson, V. E., I. K. Khurana, and J. K. Reynolds. 2002. Audit-firm tenure and the quality of financial reports. Contemporary Accounting Research 19 (4): 637–660.
Kadous, K., J. Leiby, and M. E. Peecher. 2013. How do auditors weight informal contrary advice? The joint influence of advisor social bond and advice justifiability. The Accounting Review 88 (6): 2061–2087.
Karjalainen, J. 2011. Audit quality and cost of debt capital for private firms: evidence from finland. International Journal of Auditing 15 (1): 88–108.
Kothari, S., A. Leone, and C. Wasley. 2005. Performance matched discretionary accrual measures. Journal of Accounting and Economics 39 (1): 163–197.
Larcker, D. F., E. C. So, and C. Y. Wang. 2013. Boardroom centrality and firm performance. Journal of Accounting and Economics 55 (2–3): 225–250.
Lawrence, A., Minutti-Meza, M., and Zhang, P. 2011. Can Big 4 versus non-Big 4 differences in audit-quality proxies be attributed to client characteristics? The Accounting Review 86 (1): 259–286.
Melis, A. 2004. On the role of the board of statutory auditors in Italian listed companies. Corporate Governance: An International Review 12 (1): 74–84.
Menon, K., and D. D. Williams. 2004. Former audit partners and abnormal accruals. The Accounting Review 79 (4): 1095–1118.
Michas, P. N. 2011. The Importance of Audit Profession Development in Emerging Market Countries. The Accounting Review 86 (5): 1731–1764.

! 33
Minutti-Meza, M. 2013. Does Auditor Industry Specialization Improve Audit Quality? Journal of Accounting Research 51 (4): 779–817
Myers, J. N., L. A. Myers, and T. C. Omer. 2003. Exploring the Term of the Auditor-Client Relationship and the Quality of Earnings: A Case for Mandatory Auditor Rotation?. The Accounting Review 78 (3): 779–799.
Niskanen, J., J. Karjalainen, M. Niskanen, and J. Karjalainen. 2011. Auditor gender and corporate earnings management behavior in private Finnish firms. Managerial Auditing Journal 26 (9): 778–793.
Omer, T. C., M. K. Shelley, and F.M. Tice. 2014. Do Director Networks Matter for Financial Reporting Quality? Evidence from Restatements. Working Paper University of Nebraska - Lincoln.
Petersen, M. A. 2009. Estimating standard errors in finance panel data sets: Comparing approaches. Review of Financial Studies 22 (1): 435–480.
Polanyi, M. 1966. The Tacit Dimension. London, U.K.: Routledge and Kegan Paul.
Prawitt, D. F., J. L. Smith, and D. A. Wood. 2009. Internal audit quality and earnings management. The Accounting Review 84 (4): 1255–1280.
Prencipe, A., and S. Bar-Yosef. 2011. Corporate governance and earnings management in family-controlled companies. Journal of Accounting Auditing and Finance 26 (2): 199–227.
Rauch, J. E. 2010. Does network theory connect to the rest of us? A review of Matthew O. Jackson's social and economic networks. Journal of Economic Literature 48 (4): 980–986.
Reichelt, K. J., and D. Wang. 2010. National and office-specific measures of auditor industry expertise and effects on audit quality. Journal of Accounting Research 48 (3): 647–686.
Reynolds, J. K., and J. R. Francis. 2000. Does size matter? The influence of large clients on office-level auditor reporting decisions. Journal of Accounting and Economics 30 (3): 375–400.
Van Tendeloo, B., and A. Vanstraelen. 2008. Earnings management and audit quality in europe: evidence from the private client segment market. European Accounting Review 17 (3): 447–469.
Vera-Muñoz, S. C., J. L. Ho, and C. W. Chow. 2006. Enhancing knowledge sharing in public accounting firms. Accounting Horizons 20 (2): 133–155.
Zerni, M. 2012. Audit partner specialization and audit fees: Some evidence from Sweden. Contemporary Accounting Research 29 (1): 312–340.

! 34
TABLE 1 Descriptive Statistics
Panel A - Audit Quality sample (n = 2,894) Variables Mean Median Std. Dev. p5 p25 p75 p95 ABSDA! 0.0923 0.0631 0.0960 0.0057 0.0283 0.1214 0.2882 CONNECTEDNESS 0.6242 0.7335 0.2936 0.0470 0.5300 0.8440 0.9110 BUSY_BSA 0.2249 0.0000 0.4176 0.0000 0.0000 0.0000 1.0000 IND_SPEC 0.0867 0.0000 0.2815 0.0000 0.0000 0.0000 1.0000 SHORT_TEN 0.0511 0.0000 0.2203 0.0000 0.0000 0.0000 1.0000 BSA_IND 0.6548 1.0000 0.4755 0.0000 0.0000 1.0000 1.0000 GENDER 0.2916 0.0000 0.4546 0.0000 0.0000 1.0000 1.0000 PERFORM 0.0109 0.0072 0.0665 -0.0812 -0.0016 0.0348 0.1084 SIZE 9.3236 9.2798 1.1110 7.6138 8.6706 9.9386 11.2363 LEVERAGE 0.6876 0.7213 0.2385 0.2464 0.5306 0.8599 0.9763 CFO 0.0562 0.0464 0.2067 -0.2670 -0.0444 0.1500 0.4072 GROWTH 0.0539 0.0075 0.5196 -0.5012 -0.1292 0.1234 0.5804 LOSS 0.3044 0.0000 0.4602 0.0000 0.0000 1.0000 1.0000 REL_PARTIES 0.1424 0.0000 0.3495 0.0000 0.0000 0.0000 1.0000 NO_EXT_AUD 0.9067 1.0000 0.2909 0.0000 1.0000 1.0000 1.0000 Panel B - Audit Fees sample (n = 2,787) Variables Mean Median Std. Dev. p5 p25 p75 p95 LFEES 2.8615 2.8622 0.5331 1.9851 2.5257 3.2015 3.7377 CONNECTEDNESS 0.6283 0.7420 0.2969 0.0470 0.5360 0.8490 0.9140 BUSY_BSA 0.2379 0.0000 0.4259 0.0000 0.0000 0.0000 1.0000 IND_SPEC 0.0951 0.0000 0.2934 0.0000 0.0000 0.0000 1.0000 SHORT_TEN 0.0484 0.0000 0.2147 0.0000 0.0000 0.0000 0.0000 BSA_IND 0.6606 1.0000 0.4736 0.0000 0.0000 1.0000 1.0000 GENDER 0.2892 0.0000 0.4535 0.0000 0.0000 1.0000 1.0000 PERFORM 0.0110 0.0074 0.0668 -0.0887 -0.0022 0.0358 0.1081 SIZE 9.4607 9.3900 1.0633 7.8356 8.8238 10.0391 11.3126 QUICK 1.2280 0.9173 1.2986 0.2776 0.6470 1.3086 3.1371 CATA 0.6949 0.7444 0.2436 0.1862 0.5592 0.9000 0.9834 TURNOVER 1.2654 1.0923 0.9286 0.1233 0.6877 1.5866 3.0860 LEVERAGE 0.6901 0.7224 0.2314 0.2595 0.5366 0.8654 0.9725 CFO 0.0589 0.0488 0.2064 -0.2550 -0.0402 0.1500 0.4042 GROWTH 0.0479 0.0098 0.4672 -0.4758 -0.1225 0.1248 0.5689 LOSS 0.2960 0.0000 0.4566 0.0000 0.0000 1.0000 1.0000 REL_PARTIES 0.1371 0.0000 0.3440 0.0000 0.0000 0.0000 1.0000 NO_EXT_AUD 0.8898 1.0000 0.3131 0.0000 1.0000 1.0000 1.0000 This table presents the descriptive statistics for the audit quality and audit fees samples. Variables are defined in Appendix C. All continuous financial variables are winsorized at the 1st and 99th percentiles
! 35
TABLE 2 Correlation matrices
Panel A - Audit Quality Sample (n = 2,894)
ABSDA (1) (2) (3) (4) (5) (6) (7)
(2) CONNECTEDNESS -0.0636 (3) BUSY_BSA -0.0607 0.3703
(4) IND_SPEC -0.0410 0.0890 0.2368 (5) SHORT_TEN 0.0810 -0.0921 -0.0574 -0.0214
(6) BSA_IND -0.0351 0.0230 -0.0527 0.0249 0.0234 (7) GENDER -0.0232 -0.1298 -0.0580 -0.0032 -0.0558 -0.2201
(8) PERFORM -0.0282 0.0631 0.0658 0.0055 -0.0790 -0.0223 0.0045 (9) SIZE -0.0770 0.0767 0.1205 0.1090 -0.0192 0.0408 -0.0567 (10) LEVERAGE 0.1958 -0.0468 -0.0667 -0.0194 0.0986 0.0430 0.0132 (11) CFO 0.0094 0.0314 0.0158 0.0056 0.0223 0.0157 -0.0060 (12) GROWTH 0.0113 -0.0388 -0.0021 -0.0200 0.0644 -0.0010 -0.0418 (13) LOSS 0.0251 -0.0252 -0.0291 0.0042 0.0475 0.0207 -0.0164 (14) REL_PARTIES 0.0262 0.0873 0.0647 0.0958 0.0760 0.0400 -0.0395 (15) NO_EXT_AUD -0.0095 0.0804 0.0391 0.0144 -0.1089 -0.0780 0.0516
ABSDA (8) (9) (10) (11) (12) (13) (14) (9) SIZE 0.0536 1
(10) LEVERAGE -0.3866 0.0414 1 (11) CFO 0.2713 0.1411 -0.0315 1
(12) GROWTH 0.0861 0.1117 -0.0104 0.3980 1 (13) LOSS -0.5257 -0.1092 0.2140 -0.2808 -0.2832 1
(14) REL_PARTIES -0.0366 0.1146 0.0010 -0.0059 0.0307 0.0313 1 (15) NO_EXT_AUD 0.0035 -0.2485 0.0093 -0.0228 -0.0476 -0.0047 -0.1345 This table reports the Spearman correlation coefficients for the audit quality sample. Correlation figures are shown in bold if they are significant at 5 percent level. Variables are defined in Appendix C.
(continued on next page)

! 36
TABLE 2 (continued) Panel B - Audit Fees Sample (n = 2,787)
LFEES (1) (2) (3) (4) (5) (6) (7)
(2) CONNECTEDNESS 0.0749 (3) BUSY_BSA 0.1371 0.3869
(4) IND_SPEC 0.1004 0.1084 0.2527 (5) SHORT_TEN 0.009 -0.0845 -0.0358 0.0294
(6) BSA_IND 0.1066 0.0105 -0.0693 0.0102 0.0311 (7) GENDER -0.0691 -0.1225 -0.0478 -0.0233 -0.0481 -0.1896
(8) PERFORM -0.0033 0.0502 0.0494 -0.0037 -0.0813 -0.0586 -0.0193 (9) SIZE 0.4851 0.0749 0.1239 0.1373 0.0057 0.053 -0.0644 (10) QUICK -0.0341 -0.0013 -0.0145 -0.0289 -0.0106 -0.0133 0.0287 (11) CATA 0.0022 -0.0353 -0.0699 -0.0821 0.0321 0.0025 0.0228 (12) TURNOVER 0.0071 -0.0668 0.022 -0.0303 0.0043 -0.09 0.0103 (13) LEVERAGE 0.0398 -0.0557 -0.0677 -0.0161 0.0769 0.048 0.0209 (14) CFO 0.0512 0.0082 0.0034 0.0165 -0.0023 -0.0014 -0.0074 (15) GROWTH 0.0725 -0.0517 -0.0053 -0.0166 0.0308 0.0015 -0.0411 (16) LOSS 0.0179 -0.0152 -0.0208 -0.0173 0.0551 0.0515 -0.008 (17) REL_PARTIES 0.1284 0.0876 0.0763 0.0949 0.0996 0.0279 -0.0172 (18) NO_EXT_AUD -0.1626 0.087 0.0243 -0.0149 -0.1128 -0.0779 0.0374
LFEES (8) (9) (10) (11) (12) (13) (14) (9) SIZE 0.0501
(10) QUICK 0.409 -0.1824 (11) CATA 0.119 -0.1077 0.1734
(12) TURNOVER 0.2706 -0.1103 0.0867 0.3982 (13) LEVERAGE -0.3838 0.0329 -0.5376 0.3367 0.1954
(14) CFO 0.2794 0.1153 0.0121 0.0153 0.2636 -0.0343 (15) GROWTH 0.0824 0.1061 0.0477 0.0289 0.3323 -0.0072 0.3988
(16) LOSS -0.5201 -0.0805 -0.2802 -0.1021 -0.2712 0.2031 -0.2936 (17) REL_PARTIES -0.0393 0.1559 -0.0239 0.0002 -0.1007 -0.0089 0.0216 (18) NO_EXT_AUD 0.0084 -0.2599 -0.0199 -0.0354 0.0074 -0.0033 -0.012
LFEES (15) (16) (17) (16) LOSS -0.2761
(17) REL_PARTIES 0.0253 0.0318 (18) NO_EXT_AUD -0.038 -0.0279 -0.143
This table reports the Spearman correlation coefficients for the audit fees sample. Correlation figures are shown in bold if they are significant at 5 percent level. Variables are defined in Appendix C.

! 37
TABLE 3 OLS Regression of Audit Quality (ABSDA) on Auditor Connectedness
(CONNECTEDNESS)
ABSDAit= + β0 + β1CONNECTEDNESS it + β2BUSY_BSAit + β3IND_SPECit + β4SHORT_TENit + β5BSA_INDit
+ β6GENDERit + β7PERFORMit + β8SIZEit + β9LEVERAGEit+ β10CFOit+ β11GROWTHit
+ β12LOSSit + β13REL_PARTIESit+ β14NO_EXT_AUDit
+ Year_FE + Industry_FE + eit
(1)
Panel A: Absolute Abnormal Accruals Independent Variables Predicted sign Coefficient t-statistics
CONNECTEDNESS ? -0.0233 - 2.92*** BUSY_BSA ? 0.0004
0.08
IND_SPEC - 0.0012
0.18 SHORT_TEN + 0.0367
2.94***
BSA_IND - -0.0074 - 1.66* GENDER - -0.0123 - 2.50** PERFORM - -0.0005 - 0.01 SIZE - -0.0073 - 3.39*** LEVERAGE + 0.0812
8.22***
CFO - 0.0492
3.34*** GROWTH + 0.0069
1.18
LOSS + 0.0023
0.48 REL_PARTIES ? 0.0078
1.29
NO_EXT_AUD ? -0.0057 - 0.67 Constant
0.1791
6.38***
Year_FE
Included Industry_FE
Included
Observations
2,894 R-squared
0.138
N Clusters
879
Panel B: Absolute Negative Abnormal Accruals Independent Variables Predicted sign Coefficient t-statistics
CONNECTEDNESS ? -0.0200 - 2.03** BUSY_BSA ? -0.0060 - 0.98 IND_SPEC - -0.0015 - 0.19 SHORT_TEN + 0.0185
1.28
BSA_IND - -0.0050 - 0.90 (continued on next page)

! 38
TABLE 3 (continued) Independent Variables Predicted sign Coefficient t-statistics GENDER - -0.0196 - 3.24*** PERFORM - -0.0659 - 1.47 SIZE - -0.0035 - 1.37 LEVERAGE + 0.1155
7.68***
CFO - 0.2340
10.75*** GROWTH + -0.0063 - 0.91 LOSS + 0.0156
2.31**
REL_PARTIES ? 0.0065
0.93 NO_EXT_AUD ? 0.0026
0.31
Constant
0.1037
2.39** Year_FE
Included
Industry_FE
Included Observations
1,366
R-squared
0.317 N Clusters
754
Panel C: Positive Abnormal Accruals Independent Variables Predicted sign Coefficient
t-statistics
CONNECTEDNESS ? -0.0165 - 1.94* BUSY_BSA ? 0.0042
0.86
IND_SPEC - -0.0044 - -0.6 SHORT_TEN + 0.0310
2.4**
BSA_IND - -0.0072 - 1.71* GENDER - -0.0025 - 0.54 PERFORM - 0.1418
3.02***
SIZE - -0.0108 - 4.82*** LEVERAGE + 0.0350
3.82***
CFO - -0.2086 - 10.35*** GROWTH + 0.0193
2.63***
LOSS + -0.0043 - 0.80 REL_PARTIES ? 0.0079
1.24
NO_EXT_AUD ? -0.0095 - 1.04 Constant
0.2067
7.39***
Year_FE
Included Industry_FE
Included
Observations
1,528 R-squared
0.282
N Clusters
778 *, **, *** indicate statistical significance at 0.10, 0.05, and 0.01 levels respectively.
Standard errors are clustered by firm. Variables are defined in Appendix C.

! 39
TABLE 4 OLS Regression of Audit Fees (LFEES) on Auditor Connectedness
(CONNECTEDNESS)
LFEESit= + β0 + β1CONNECTEDNESS it + β2BUSY_BSAit + β3IND_SPECit + β4SHORT_TENit + β5BSA_INDit + β6GENDERit + β7PERFORMit + β8SIZEit + β9QUICKit
+ β10CATAit + β11TURNOVERit + β12LEVERAGEit
+ β13CFOit + β14GROWTHit +β15LOSSit
+ β16REL_PARTIESit + β17NO_EXT_AUDit + Year_FE + Industry_FE + eit
(3)
Independent Variables Predicted sign Coefficient Estimate t-statistics CONNECTEDNESS ? 0.1186
2.25**
BUSY_BSA ? 0.0808 2.48**
IND_SPEC + 0.0284 0.67
SHORT_TEN ? 0.0166 0.29
BSA_IND + 0.0883 2.91***
GENDER + -0.0233 - 0.75 PERFORM - -0.6834 - 3.47*** SIZE + 0.2687
15.13***
QUICK - -0.0026 - 0.16 CATA + 0.2630
3.38***
TURNOVER + 0.0048 0.20
LEVERAGE + -0.1636 - 1.88* CFO - -0.0718 - 1.50 GROWTH + 0.0048
0.20
LOSS + 0.0725 2.76***
REL_PARTIES ? 0.0259 0.61
NO_EXT_AUD ? 0.0344 0.79
Constant
0.0604 0.25
Year_FE
Included Industry_FE
Included
Observations
2,787 R-squared
0.338
N Clusters
868 *, **, *** indicate statistical significance at 0.10, 0.05, and 0.01 levels respectively.
Standard errors are clustered by firm. Variables are defined in Appendix C.

! 40
TABLE 5 Sensitivity Analyses
Panel A: Audit Quality Model
ABSDAit= + β0 + β1CONNECTEDNESS it + β2BUSY_BSAit + β3IND_SPECit + β4SHORT_TENit + β5BSA_INDit
+ β6GENDERit + β7PERFORMit + β8SIZEit + β9LEVERAGEit+ β10CFOit+ β11GROWTHit
+ β12LOSSit + β13REL_PARTIESit+ β14NO_EXT_AUDit
+ Year_FE + Industry_FE + eit
(1)
Cluster on two dimensions NO_EXT_AUD=1
Independent Variables Pred. sign Coeff. t-stat Coeff. t-stat
CONNECTEDNESS ? -0.0233 - 2.90*** -0.0185 - 2.16** BUSY_BSA ? 0.0004
0.08 -0.0018 - 0.35
IND_SPEC - 0.0012
0.18 0.0033
0.48 SHORT_TEN + 0.0367
2.95*** 0.0398
2.96***
BSA_IND - -0.0074 - 1.60 -0.0069 - 1.54 GENDER - -0.0123 - 2.45** -0.0130 - 2.59*** PERFORM - -0.0005 - 0.01 0.0032
0.08
SIZE - -0.0073 - 3.46*** -0.0065 - 2.93*** LEVERAGE + 0.0812
8.29*** 0.0814
7.85***
CFO - 0.0492
3.21*** 0.0470
3.00*** GROWTH + 0.0069
1.18 0.0017
0.30
LOSS + 0.0023
0.48 -0.0016 - 0.31 REL_PARTIES ? 0.0078
1.21 0.0043
0.68
NO_EXT_AUD ? -0.0057 - 0.68 Constant
0.1791
6.25*** 0.1666
6.39***
Year_FE
Included
Included Industry_FE
Included
Included
Observations
2,894
2,624 R-squared
0.138
0.132
*, **, *** indicate statistical significance at 0.10, 0.05, and 0.01 levels respectively. Variables are defined in Appendix C. Standard errors are clustered by firm (Petersen 2009).
(continued on next page)

! 41
TABLE 5 (continued) Panel B: Audit Fees Model
LFEESit= + β0 + β1CONNECTEDNESS it + β2BUSY_BSAit + β3IND_SPECit + β4SHORT_TENit + β5BSA_INDit + β6GENDERit + β7PERFORMit + β8SIZEit + β9QUICKit
+ β10CATAit + β11TURNOVERit + β12LEVERAGEit
+ β13CFOit + β14GROWTHit +β15LOSSit
+ β16REL_PARTIESit + β17NO_EXT_AUDit + Year_FE + Industry_FE + eit
(3)
Cluster on two dimensions NO_EXT_AUD=1
Independent Variables Pred. sign Coeff. t-stat Coeff. t-stat
CONNECTEDNESS ? 0.1186
2.25** 0.1009
1.77* BUSY_BSA ? 0.0808
2.46** 0.0904
2.63***
IND_SPEC + 0.0284
0.68 0.0179
0.40 SHORT_TEN - 0.0166
0.30 0.0435
0.67
BSA_IND + 0.0883
2.81*** 0.0943
2.97*** GENDER ? -0.0233 - 0.72 -0.0204 - 0.62 PERFORM - -0.6834 - 3.55*** -0.6775 - 3.24*** SIZE + 0.2687
15.41*** 0.2631
14.07***
QUICK - -0.0026 - 0.17 -0.0007 - 0.04 CATA + 0.2630
3.37*** 0.2750
3.23***
TURNOVER + 0.0048
0.22 0.0136
0.54 LEVERAGE + -0.1636 - 1.88* -0.1455 - 1.58 CFO - -0.0718 - 1.51 -0.0513 - 1.00 GROWTH + 0.0048
0.20 0.0027
0.11
LOSS + 0.0725
2.82*** 0.0581
2.01** REL_PARTIES + 0.0259
0.60 0.0386
0.81
NO_EXT_AUD + 0.0344
0.81 Constant
0.0604
0.25 0.1371
0.54
Year_FE
Included
Included Industry_FE
Included
Included
Observations
2,787
2,480 R-squared
0.338
0.314
*, **, *** indicate statistical significance at 0.10, 0.05, and 0.01 levels respectively. Variables are defined in Appendix C. Standard errors are clustered by firm (Petersen 2009).

! 42
TABLE 6
Audit Quality and Auditor Connectedness. Propensity-score matching analysis
Panel A: Propensity-Score Matched Sample. Descriptive Statistics
Full sample Propensity-score matched
sample
above p50
below p50 difference
above p50
below p50 difference
Variables mean mean in means
mean mean in means ABSDA 0.0853 0.0994 -0.0141 *** 0.0881 0.0999 -0.0118 ***
BUSY_BSA 0.3304 0.1196 0.2108 *** 0.1824 0.1622 0.0202 IND_SPEC 0.1016 0.0719 0.0297 *** 0.0922 0.0797 0.0125 SHORT_TEN 0.0394 0.0629 -0.0235 *** 0.048 0.0528 -0.0048 BSA_IND 0.6841 0.6254 0.0587 *** 0.6746 0.6679 0.0067 GENDER 0.2218 0.3614 -0.1396 *** 0.262 0.261 0.001 PERFORM 0.0143 0.0074 0.0069 *** 0.0138 0.0119 0.0019 SIZE 9.3964 9.251 0.1454 *** 9.3348 9.3224 0.0124 LEVERAGE 0.6783 0.6969 -0.0186 ** 0.6809 0.6948 -0.0139 CFO 0.0606 0.0519 0.0087
0.0598 0.0554 0.0044
GROWTH 0.0485 0.0593 -0.0108
0.0552 0.0755 -0.0203 LOSS 0.2965 0.3124 -0.0159
0.2966 0.3033 -0.0067
REL_PARTIES 0.1673 0.1175 0.0498 *** 0.1248 0.1344 -0.0096 NO_EXT_AUD 0.9205 0.8929 0.0276 ** 0.9222 0.9155 0.0067 Observations 1447 1447
1042 1042
*, **, *** indicate statistical significance at 0.10, 0.05, and 0.01 levels respectively. (continued on next page)

! 43
TABLE 6 (continued) Panel B: Propensity-Score Matched Sample. Multivariate Analysis
ABSDAit= + β0 + β1CONNECTEDNESS2 it + β2BUSY_BSAit + β3IND_SPECit + β4SHORT_TENit + β5BSA_INDit
+ β6GENDERit + β7PERFORMit + β8SIZEit + β9LEVERAGEit+ β10CFOit+ β11GROWTHit
+ β12LOSSit + β13REL_PARTIESit+ β14NO_EXT_AUDit
+ Year_FE + Industry_FE + eit
(1)
Independent Variables Predicted sign Coefficient Estimate t-statistics
CONNECTEDNESS2 ? -0.0092 - 2.01** BUSY_BSA ? 0.0030
0.46
IND_SPEC - 0.0037 0.51
SHORT_TEN + 0.0460 3.21***
BSA_IND - -0.0080 - 1.50 GENDER - -0.0102 - 1.72* PERFORM - 0.0296
0.68
SIZE - -0.0069 - 2.62*** LEVERAGE + 0.0893
7.38***
CFO - 0.0276 1.68*
GROWTH + 0.0092 1.29
LOSS + -0.0024 - 0.43 REL_PARTIES ? 0.0091
1.21
NO_EXT_AUD ? 0.0002 0.02
Constant
0.1786 4.71***
Year_FE
Included Industry_FE
Included
Observations
2,084 R-squared
0.153
N Clusters
810
*, **, *** indicate statistical significance at 0.10, 0.05, and 0.01 levels respectively. Variables are defined in Appendix C, except CONNECTEDNESS2 which is a dummy equal to 1 when CONNECTEDNESS is above the median, 0 otherwise. Standard errors are clustered by firm.

! 44
TABLE 7
Audit Fees and Auditor Connectedness. Propensity-score matching analysis
PANEL A - Propensity-Score Matched Sample. Descriptive Statistics
Full sample Propensity-score matched
sample
above p50
below p50 difference
above p50
below p50 difference
VARIABLES mean mean in means
mean mean in means LFEES 2.9030 2.8199 0.0831 *** 2.8936 2.8370 0.0566 **
BUSY_BSA 0.3496 0.1258 0.2238 *** 0.2094 0.1717 0.0377 ** IND_SPEC 0.1154 0.0748 0.0406 *** 0.0932 0.0848 0.0084
SHORT_TEN 0.0365 0.0604 -0.0239 *** 0.0450 0.0450 0.0000 BSA_IND 0.6755 0.6456 0.0299 * 0.6806 0.6607 0.0199 GENDER 0.2199 0.3587 -0.1388 *** 0.2670 0.2649 0.0021 PERFORM 0.0128 0.0092 0.0036
0.0123 0.0115 0.0008
SIZE 9.5238 9.3975 0.1263 *** 9.4770 9.4773 -0.0003 QUICK 1.2322 1.2237 0.0085
1.2641 1.2336 0.0305
CATA 0.6849 0.7049 -0.0200 ** 0.6882 0.6937 -0.0055 TURNOVER 1.1751 1.3560 -0.1809 *** 1.2140 1.2376 -0.0236 LEVERAGE 0.6790 0.7011 -0.0221 ** 0.6839 0.6927 -0.0088 CFO 0.0588 0.0590 -0.0002
0.0570 0.0602 -0.0032
GROWTH 0.0448 0.0510 -0.0062
0.0454 0.0489 -0.0035 LOSS 0.2944 0.2976 -0.0032
0.3005 0.3110 -0.0105
REL_PARTIES 0.1612 0.1129 0.0483 *** 0.1414 0.1351 0.0063 NO_EXT_AUD 0.9062 0.8735 0.0327 *** 0.9005 0.9005 0.0000 Observations 1396 1391
955 955
*, **, *** indicate statistical significance at 0.10, 0.05, and 0.01 levels respectively, using two-tailed t-tests of differences in means. This table presents the descriptive statistics for the full and propensity-score matched audit fees samples.
(continued on next page)

! 45
TABLE 7 (continued) Panel B: Propensity-Score Matched Sample. Multivariate analysis
LFEESit= + β0 + β1CONNECTEDNESS2 it + β2BUSY_BSAit + β3IND_SPECit + β4SHORT_TENit + β5BSA_INDit + β6GENDERit + β7PERFORMit
+ β8SIZEit + β9QUICKit + β10CATAit + β11TURNOVERit
+ β12LEVERAGEit + β13CFOit + β14GROWTHit +β15LOSSit
+ β16REL_PARTIESit + β17NO_EXT_AUDit + Year_FE + Industry_FE + eit
(3)
Independent Variables Predicted sign Coefficient Estimate t-statistics
CONNECTEDNESS2 ? 0.0531
1.80* BUSY_BSA ? 0.0825
2.03**
IND_SPEC + 0.0349
0.68 SHORT_TEN ? -0.0261 - 0.38 BSA_IND + 0.0789
2.24**
GENDER + -0.0147 - 0.39 PERFORM - -0.7102 - 3.05*** SIZE + 0.2777
13.73***
QUICK - -0.0027 - 0.14 CATA + 0.2496
2.74***
TURNOVER + 0.0072
0.28 LEVERAGE + -0.2084 - 2.02** CFO - -0.0755 - 1.33 GROWTH + 0.0013
0.05
LOSS + 0.0595
1.87* REL_PARTIES ? 0.0295
0.59
NO_EXT_AUD ? 0.0567
1.03 Constant
0.0619
0.21
Year_FE
Included Industry_FE
Included
Observations
1,910 R-squared
0.317
N Clusters
761
*, **, *** indicate statistical significance at 0.10, 0.05, and 0.01 levels respectively. Variables are defined in Appendix C, except CONNECTEDNESS2 which is a dummy equal to 1 when the CONNECTEDNESS is above the median, 0 otherwise. Standard errors are clustered by firm.

! 46
APPENDIX A
Description of the functions of the Board of Statutory Auditors of ENI SPA
“In its meeting of 22 March 2005, Eni’s Board of Directors, electing the exemption provided for
under SEC Rule 10A-3 for foreign private issuers of securities listed in the United States,
designated the Board of Statutory Auditors as the body that, as from 1 June 2005, performs, to
the extent permitted under Italian regulations, the functions attributed by the Sarbanes-Oxley Act
and SEC rules to the audit committees of US registrants.
At least one member of the Board of Statutory Auditors shall be a financial expert and have an
adequate understanding of the functions of the audit committee and experience in the analysis
and application of accounting standards, the preparation and auditing of financial statements and
internal control processes.
The following functions complement those already established under Italian regulations:
• evaluating the offers submitted by external auditors for their engagement and providing a
reasoned recommendation to the Shareholders’ Meeting concerning the engagement or
removal of the external auditor;
• overseeing the work of the external auditor engaged to audit the accounts or perform other
audit, review or certification services;
• making recommendations to the Board of Directors on the resolution of disagreements
between management and the audit firm regarding financial reporting;
• approving the procedures for: (a) the receipt, retention, and treatment of complaints received
by the Company regarding accounting, internal accounting controls, or auditing matters; (b)
the confidential, anonymous submission by employees of the Company of concerns
regarding questionable accounting or auditing matters;

! 47
• approving the procedures for the pre-approval of specifically identified admissible non-audit
services and examining the disclosures on the execution of the authorized services;
• examining the periodic reports from the external auditor relating to: (a) all critical
accounting policies and practices to be used; (b) all alternative treatments of financial
information within generally accepted accounting principles that have been discussed with
management officials of the Company, ramifications of the use of such alternative
disclosures and treatments, and the treatment preferred by the external auditor; (c) other
material written communication between the external auditor and management;
• examining reports from the Chief Executive Officer and the Chief Financial Officer
concerning any significant deficiency in the design or operation of internal controls which
are reasonably likely to adversely affect the Company’s ability to record, process,
summarize and report financial information and any material weakness in internal controls;
• examining reports from the Chief Executive Officer and the Chief Financial Officer
concerning any fraud that involves management or other employees who have a significant
role in the issuer's internal controls.”
SOURCE: http://www.eni.com/en_IT/attachments/azienda/corporate-governance/organi-
controllo/rules-board-of-statutory-auditors.pdf
Description of the functions of the Board of Statutory Auditors of FIAT SPA
“The Board of Statutory Auditors is responsible for supervising compliance with law and the by-
laws, application of the principles of proper management, the adequacy of the internal control
and risk management system and the adequacy and effective functioning of the Company’s
organizational, administrative, and accounting structure.

! 48
In addition, the Statutory Auditors supervise the effective implementation of the rules of
corporate governance to which the Company adheres. The Statutory Auditors are also
responsible for expressing an opinion to shareholders in relation to the appointment, removal and
compensation of the independent auditors.
In addition, Legislative Decree 39/2010 attributes the Board of Statutory Auditors the role of
committee for internal control and audit with specific responsibility for overseeing: the financial
reporting process; the effectiveness of the internal control, internal audit and risk management
systems; the audit of the annual separate and consolidated financial statements; and the
independence of the audit firm. The Statutory Auditors are also responsible for evaluating the
proposals and work plans of the independent auditors, in addition to the content of their reports
and any letters of recommendation.
Each member of the Board of Statutory Auditors must satisfy the requirements of integrity and
independence established by law. Article 17 of the by-laws requires that all statutory auditors be
entered in the Register of Auditors and possess at least three years of experience as a statutory
account auditor.”
SOURCE: http://www.fiatspa.com/en-US/governance/statutory/Pages/statutory_auditors.aspx

! 49
APPENDIX B
Social network measures
To measure auditor connectedness, I first map the interactions between individual auditors
in multiple engagements across clients. Thus, I create a matrix of auditors and firms with the data
obtained from the Chamber of Commerce of Verona. Auditors and firms are uniquely identified
by means of two codes: the personal tax identification number for auditors (“codice fiscale”) and
the VAT number for firms. These two codes allow for perfect matches for auditors and firms. I
obtain a two-mode matrix (auditors per firm) in which the rows have the ith auditor and the
columns have the jth company. A 1 in a i,jth cell indicates whether auditor i is engaged in the BSA
of company j. Following Borgatti et al. (2002), I use Ucinet 6 to convert the two-mode matrix
into an affiliation matrix for the auditors, which is a symmetric one-mode matrix (auditors per
auditors). Given a binary incidence matrix A in which the rows represent auditors and the
columns represent firms, the matrix AA' gives the number of firms in which two auditors belong
to the same BSA. More precisely, the i,jth cell of matrix AA’ indicates the number of times
auditor i and auditor j coincide in the same BSA. Then, I dichotomize the one-mode matrix such
that the i,jth cell is coded 1 if auditor i and auditor j coincide at least once in any BSA. I use
Ucinet 6 (Borgatti et al. 2002) to calculate my social network measures.
1 – CONNECTEDNESSx = 1 – CONSTRAINTx= (1 – Σy Cxy) = (1 - Σy (pxy + Σz pxz pzy)2
where Cxy represents the constraint of auditor y on auditor x. Following Burt (1998), the
measure can be separated into two parts: the first part represents direct investment in terms of
resources into a single contact, y, where pxy is the proportion of auditor x’s relations invested in

! 50
contact y (0< pxy<1). The second part, pxzpzy, is the indirect investment in contact y, and it
represents the proportion of auditor x’s connections invested in contact z (pxz) (who are in turn
invested in contact y (pzy) (x, z ≠ x, y).
The easiest way to calculate constraint is to isolate every auditor in the network one-by-one
and then to examine triadic relationships (sets of three nodes). In Figure A.B.1, I draw the ego-
network of PCC. Triangles are firm BSAs, and the vertices of these triangles are individual
auditors. PCC, BLD and BRC are the members of the BSA of firm ETA, whereas PCC, TRV,
and BLL are the members of the BSA of firm ALFA. In the ego-network of PCC, I include all
the auditors who are within a geodesic distance (number of linkages) of 2 from PCC because I
want to take into consideration all the potential indirect connections (friends of PCC’s friends)
(Granovetter 1973).
PCC is directly connected to auditors BLD, BRC, TRV, and BLL. PCC is also indirectly
connected (through BLL) to auditors LND, NTA, PLV, and PSN, and (through TRV) to GHL,
BRT, FRT, and ZND. PCC occupies a brokerage position between BLD-BRC on one side and
BLL-TRV on the other side.
To calculate PCC’s network constraint, I compute the proportion of PCC’s relations
invested in each connection as the reciprocal of the number of its connections, ¼. I repeat the
identical procedure for all the four direct contacts of PCC: ½ for both BLD and BRC, and 1/6 for
TRV and BLL. Then, using the values of these proportions, I calculate the constraint that each
contact imposes on PCC. I start from BLD, which belongs to the triad PCC-BLD-BRC. The
connection BLD-BRC limits the value that PCC could have had from having separate
connections with BLD and BRC. For this reason, the constraint that each of these auditors
imposes on PCC includes not only the direct connections with PCC but also the connection

! 51
between BLD and BRC. The constraint on PCC exercised by BLD is equal to the square of the
following sum: 0.25 (PPCC) + 0.25*0.5 (PPCC*PBLD), which is 0.14. Similarly the constraint on
PCC by BRC is 0.14 [(0.25+0.25*0.4)]2. The constraint with TRV and BLL is 0.09
[(0.25+0.25*0.17)]2. Summing the four constraint measures I obtain the aggregate: 0.45.
CONNECTEDNESS for PCC is 0.55 (1 – 0.45).
2- CONNECTEDNESSx = EFFICIENCYx = Σy [ 1 –Σy pxz myz ]/N
where myz is the marginal strength of auditor y’s relation with contact z, and N is the
number of contacts in the auditor’s network. The marginal effect is y’s interaction with z, divided
by the y’s strongest interaction with anyone. The sum of the product pxzmyz measures the portion
of x’s connection with y, which is redundant to x’ s relation with other direct contacts. Returning
to the PCC example, I first report the matrix of the proportion (P), then the matrix of the products
pxzmyz.
Matrix P
PCC BLD BRC TRV BLL
PCC 0 0.25 0.25 0.25 0.25
BLD 0.5 0 0.5 0 0
BRC 0.5 0.5 0 0 0
TRV 0.17 0 0 0 0.17
BLL 0.17 0 0 0.17 0

! 52
Matrix P*MPCCyz
PCC BLD BRC TRV BLL
PCC - - - - -
BLD - 0 0.25 0 0
BRC - 0.25 0 0 0
TRV - 0 0 0 0.25
BLL - 0 0 0.25 0
The sum of all the P*M products is 1, which is the size of redundant contacts. The effective
size of PCC network is 3, given by the difference between the size of the network, 4, and the size
of redundant contacts, 1. Efficiency is effective size divided by network size, 0.75 (3/4), which
represents the proportion of non-redundant connections in PCC’s network.
3 – CONNECTEDNESSx = CENTRALITYx
Degree centrality (Freeman 1977) is the most intuitive measure of connectedness and
corresponds to the number of contacts one auditor has in the networks. For example, PCC has a
degree centrality of four, whereas BLL and TRV have both degree centrality of six. Degree
centrality represents a rough measure of the total amount of information and resources available
to each auditor in the network and captures the intensity of the communication activity of each
auditor. Although degree centrality is easy to calculate, it ignores the strength of indirect ties
(Granovetter 1973), i.e. those ties between the focal auditor’s contacts and contacts in their
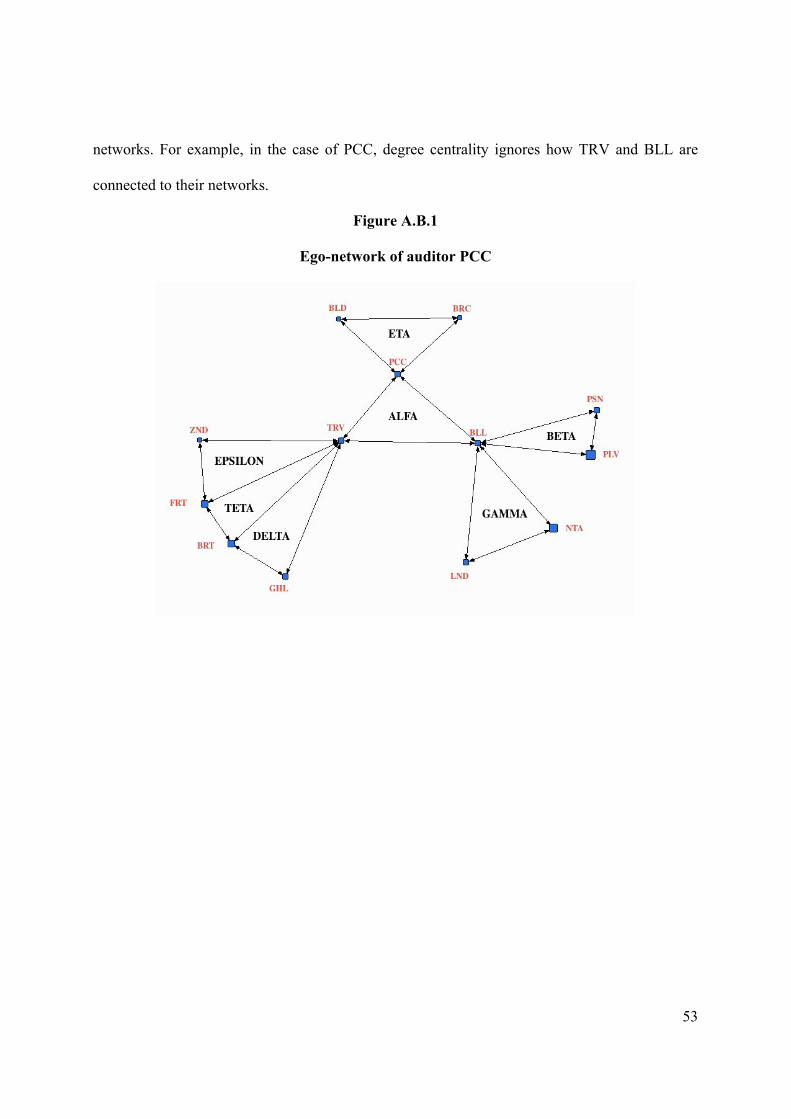
! 53
networks. For example, in the case of PCC, degree centrality ignores how TRV and BLL are
connected to their networks.
Figure A.B.1
Ego-network of auditor PCC

! 54
APPENDIX C
Variable Definitions
Variable Name Definition Regression Variables: Measured at fiscal year-end; time and firm subscripts suppressed for convenience.
ABSDA absolute discretionary accruals (Dechow et al. 1995); LFEES natural logarithm of BSA fees; CONNECTEDNESS (1 - median network constraint) of BSA members (Burt 1992); BUSY_BSA equal to 1 if any of the BSA members is in the top percentile
of the distribution of the ratio of total clients size (in assets) per auditor to the total size (in assets) of firms in the sample, 0 otherwise;
IND_SPEC equal to 1 if any of BSA member is the industry leader in terms of both client firms' size and number of engagements, 0 otherwise;
GENDER equal to 1 if any of BSA members is female, 0 otherwise; SHORT_TEN equal to 1 if BSA tenure is lower than 3 years, 0 otherwise; BSA_IND equal to 1 if all BSA members belong to different accounting
firms, 0 otherwise; PERFORM lagged net income/lagged total assets; SIZE natural logarithm of total assets; LEVERAGE (total assets-total equity)/total assets; CFO (earnings + depreciation + change current liabilities-change
current assets)/lagged total assets GROWTH growth in sales revenues; LOSS equal to 1 if year earnings equal to zero, 0 otherwise; REL_PARTIES equal to 1 if in the sample there are other firms controlled by
the same ultimate owner, 0 otherwise; NO_EXT_AUD equal to 1 when the BSA audits the financial statement, 0
otherwise; QUICK (current assets – inventory)/current liabilities; CATA current assets/total assets; and TURNOVER sales/total assets. Year_FE year fixed effects Industry_FE industry fixed effects