Combined financial statements of the Uniper Group for fiscal years ...
Upload
vuongkhuongCategory
view
218download
1
OFFICE OF INSPECTOR GENERAL
Audit of USAID’s Financial Statements for Fiscal Years 2005 and 2004
AUDIT REPORT NO. 0-000-06-001-C November 14, 2005
WASHINGTON, DC

Office of Inspector General
November 14, 2005
MEMORANDUM
TO: USAID CFO, Lisa D. Fiely
FROM: Acting AIG/A, Joseph Farinella
SUBJECT: Audit of USAID’s Financial Statements for Fiscal Years 2005 and 2004
With this memorandum, the Office of Inspector General (OIG) is transmitting its report on the Audit of USAID’s Financial Statements for Fiscal Years 2005 and 2004. Under the Government Management Reform Act of 1994, USAID is required to prepare consolidated fiscal year-end financial statements. For FY 2005, USAID is required to submit audited financial statements to the Office of Management and Budget (OMB) and the U.S. Department of the Treasury (Treasury) by November 15, 2005, in accordance with OMB Circular A-136.
The OIG has issued unqualified opinions on all five of USAID’s principal financial statements for fiscal years 2005 and 2004. An error in the application of a programming procedure affected the comparability of the financial statements with those of the preceding period, requiring a restatement of the prior year financial statements. The effects of this error are documented in Note 22 of the financial statements.
With respect to internal control, our report discusses one material internal control weakness and three reportable conditions identified during the audit. The material internal control weakness is related to USAID’s Accruals Reporting System and its effect on accounting and reporting for accrued expenditures and accounts payable. The reportable conditions address USAID’s need to: (1) perform reconciliations of its Fund Balance with the U.S. Treasury; (2) perform regular reconciliations of its intragovernmental transactions; and (3) improve recognition and reporting over its accounts receivable.
This report contains three recommendations to improve USAID’s internal control over financial reporting and the preparation of its annual financial statements.
We have received and considered your response to our findings and recommendations in the draft audit report. Based on your response, we have accepted your comments as management decisions. Please forward information related to the resolution of these findings to the Audit, Performance & Compliance Division for acceptance and final action (see Appendix II for USAID’s Management Comments).
We appreciate the cooperation and courtesies that your staff extended to the OIG during the audit and look forward to working with you on our audit of the fiscal year 2006 financial statements.
U.S. Agency for International Development
1300 Pennsylvania Avenue, NW
Washington, DC 20523
www.usaid.gov

CONTENTSSummary of Results ....................................................................................................... 1
USAID’s Accruals Reporting System
USAID’s Process for Reconciling Its Fund Balance with the U.S. Treasury
USAID’s Intragovernmental
USAID’s Process for Recognizing and Reporting Its Overseas Accounts
Background ..................................................................................................................... 2
Audit Objective................................................................................................................ 2
Independent Auditor’s Report on USAID’s Financial Statements .............................. 3
Independent Auditor’s Report on Internal Control ...................................................... 4
Needs Improvement.................................................................................................... 5
Needs Improvement ................................................................................................... 7
Transactions Remain Unreconciled ........................................................................... 9
Receivable Needs Improvement ............................................................................... 10
Independent Auditor’s Report on USAID’s Compliance with Laws and Regulations .......................................................................................... 12
Appendix V – Financial Statements, Notes, Required Supplementary Information and Other Accompanying Information (From USAID’s Fiscal Year 2005 Performance and
Reportable FFMIA Noncompliance .......................................................................... 13
Evaluation of Management Comments ....................................................................... 17
Appendix I – Scope and Methodology ........................................................................ 18
Appendix II – Management Comments ....................................................................... 20
Appendix III – Status of Prior Year Findings and Recommendations...................... 23
Appendix IV – Financial Highlights ............................................................................. 25
Accountability Report).................................................................................................. 30

SUMMARY OF RESULTSIn our opinion, USAID’s consolidated balance sheets, consolidated statements of changes in net position, consolidated statements of net cost, combined statements of budgetary resources, and consolidated statements of financing present fairly, in all material respects, the financial position of USAID as of September 30, 2005 and 2004; and its net cost, net position, and budgetary resources for the years then ended are in conformity with generally accepted accounting principles.
As described in Note 22, USAID corrected an error it had made in calculating accruals during fiscal year 2004, and made related adjustments and disclosures to restate its 2004 financial statements.
Our audit identified one material internal control weakness and three reportable internal control conditions. The material internal control weakness relate to USAID’s need to improve its Accruals Reporting System.
The reportable conditions relate to USAID’s need to improve its:
� Process for reconciling its Fund Balance with the U.S. Treasury, � Intragovernmental transaction reconciliation process, � Process for recognizing and reporting its overseas accounts receivable.
In addition, our audit identified reportable noncompliance related to requirements of the Federal Financial Management Improvement Act, as follows:
� Phoenix was not fully deployed, but progress has been made, � Legacy financial systems at overseas missions did not comply with the U.S.
Government Standard General Ledger at the transaction level, and � Financial reporting capabilities need improvement.
1

BACKGROUNDThe United States Agency for International Development (USAID) was created in 1961 to advance the United States’ foreign policy interests by promoting broad-based sustainable development and providing humanitarian assistance. USAID has an overseas presence in over 80 countries, 38 of which have operational accounting stations. In fiscal year 2005, USAID had total budgetary resources of $13.1 billion.
Under the Government Management Reform Act of 1994, USAID is required to annually submit audited financial statements to the Office of Management and Budget (OMB) and the U.S. Treasury. Pursuant to this Act, for fiscal year 2005, USAID has prepared the following:
� Consolidated Balance Sheet, � Consolidated Statement of Changes in Net Position, � Consolidated Statement of Net Cost, � Combined Statement of Budgetary Resources, � Consolidated Statement of Financing, � Notes to the principal financial statements, � Other Required Supplementary Information, and � Management’s Discussion and Analysis.
AUDIT OBJECTIVE
Did USAID’s principal financial statements present fairly the assets, liabilities, net position, net costs, changes in net position, budgetary resources, and reconciliation of net costs to budgetary resources for fiscal years 2005 and 2004?
In our opinion, the financial statements referred to above present fairly, in all material respects and in conformity with generally accepted accounting principles, USAID’s assets, liabilities, and net position; net costs; changes in net position; budgetary resources; and reconciliation of net costs to budgetary resources as of September 30, 2005 and 2004 and for the years then ended.
In accordance with Government Auditing Standards, we have also issued reports (dated November 14, 2005) on our consideration of USAID’s internal control over financial reporting and on our tests of USAID’s compliance with certain provisions of laws and regulations. These reports are an integral part of an overall audit conducted in accordance with Government Auditing Standards and should be read in conjunction with this report.
2

Independent Auditor’s Report on USAID’s Financial Statements We have audited the accompanying consolidated balance sheets of USAID as of September 30, 2005 and 2004, and the consolidated statements of changes in net position, consolidated statements of net cost, combined statements of budgetary resources, and consolidated statements of financing of USAID for the years ended September 30, 2005 and 2004.
We conducted our audits in accordance with auditing standards generally accepted in the United States; Government Auditing Standards issued by the Comptroller General of the United States; and the Office of Management and Budget (OMB) Bulletin No. 01-02. Audit Requirements for Federal Financial Statements. Those standards require that we plan and perform the audit to obtain reasonable assurance that the financial statements are free of material misstatement. An audit includes examining, on a test basis, evidence supporting the amounts and disclosures in the financial statements. An audit also includes assessing the accounting principles used and the significant estimates made by management, as well as evaluating the overall financial statement presentation. We believe that our audits provide a reasonable basis for our opinion.
In our opinion, the financial statements referred to above present fairly, in all material respects, in conformity with U.S. generally accepted accounting principles, USAID’s assets, liabilities, and net position; net costs; changes in net position; budgetary resources; and reconciliation of net costs to budgetary resources as of September 30, 2005 and 2004 and for the years then ended.
Management’s Discussion and Analysis, Required Supplementary Information, and other accompanying information contain a wide range of data, some of which are not directly related to the financial statements. We do not express an opinion on this information. However, we compared this information for consistency with the financial statements and discussed the methods of measurement and presentation with USAID officials. Based on this limited work, we found no material inconsistencies with the financial statements or nonconformance with OMB guidance.
In accordance with Government Auditing Standards, we have also issued our reports, dated November 14, 2005 on our consideration of USAID’s internal control over financial reporting and on our tests of USAID’s compliance with certain provisions of laws and regulations. These reports are an integral part of an overall audit conducted in accordance with Government Auditing Standards and should be read in conjunction with this report.
USAID, Office of Inspector General November 14, 2005
3

Independent Auditor’s Report on Internal Control We have audited the consolidated balance sheets of USAID as of September 30, 2005 and 2004. We have also audited the consolidated statements of changes in net position, consolidated statements of net cost, combined statements of budgetary resources, and consolidated statements of financing for the fiscal years ended September 30, 2005 and 2004, and have issued our report thereon dated November 14, 2005. We conducted the audits in accordance with generally accepted auditing standards; Government Auditing Standards issued by the Comptroller General of the United States; and Office of Management and Budget (OMB) Bulletin No. 01-02, Audit Requirements for Federal Financial Statements.
In planning and performing our audits of USAID’s financial statements for the fiscal years ended September 30, 2005 and 2004, we considered its internal control over financial reporting by obtaining an understanding of the agency’s internal control, determined whether internal controls had been placed in operation, assessed control risk, and performed tests of controls in order to determine our auditing procedures for the purpose of expressing our opinion on the financial statements. We limited our system of internal control testing to those controls necessary to achieve the objectives described in OMB Bulletin 01-02. We did not test all internal controls relevant to operating objectives as broadly defined by the Federal Managers’ Financial Integrity Act of 1982, such as those controls relevant to ensuring efficient operations. The objective of our audit was not to provide assurance on internal control. Consequently, we do not provide an opinion on internal control.
Our consideration of internal control over financial reporting would not necessarily disclose all matters in internal control over financial reporting that might be reportable conditions. Under standards established by the American Institute of Certified Public Accountants, reportable conditions are matters coming to our attention relating to significant deficiencies in the design or operation of internal control that, in our judgment, could adversely affect the Agency’s ability to record, process, summarize, and report financial data consistent with the assertions by management in the financial statements. Material weaknesses are reportable conditions in which the design or operation of one or more of the internal control components does not reduce to a relatively low level the risk that misstatements in amounts that would be material in relation to the financial statements being audited may occur and not be detected within a timely period by employees in the normal course of performing their assigned functions. Because of inherent limitations in internal control, misstatements, losses, or noncompliance may occur and not be detected. Our consideration of internal control over financial reporting would not necessarily disclose all reportable conditions that are also considered to be material weaknesses as defined above. We noted certain matters (discussed in the following paragraphs) involving internal control and its operation that we consider to be reportable conditions and one matter that we consider to be a material weakness.
4

The material internal control weakness relates to USAID’s need to improve its Accruals Reporting System.
The reportable conditions relate to USAID’s need to improve its:
� Process for reconciling its Fund Balance with the U.S. Treasury
� Process for reconciling intragovernmental transactions
� Process for recognizing and reporting its overseas accounts receivable.
With respect to internal control related to performance measures reported in USAID’s Performance and Accountability Report, we obtained an understanding of the design of significant internal controls relating to the existence and completeness assertions, as required by OMB Bulletin 01-02. Our procedures were not designed to provide assurance on internal control over reported performance measures and, accordingly, we do not provide an opinion on such controls.
We also noted other matters involving the internal control over financial and performance reporting which we reported to USAID management in a separate letter dated November 14, 2005.
USAID’s Accruals Reporting System Needs Improvement
Summary: USAID’s Accruals Reporting System produced erroneous information that limited the ability of Cognizant Technical Officers (CTOs) to accurately reflect their estimates of accrued expenditures and accounts payable in USAID’s accounting records. In our testing of the Accruals Reporting System in Washington, DC, the OIG determined that it did not correctly compute unliquidated obligation information, and used this incorrect information as an upper limit for accrual estimates. This occurred because USAID’s Accruals Reporting System was not correctly programmed to calculate unliquidated obligations based on the amounts obligated and amounts vouchered. As a result, USAID’s accrued expenditures and accounts payable were recorded inaccurately and USAID was required to record $440 million in upward adjustments. The OIG recommended an additional $131 million in downward adjustments based on the projected errors in accrual calculations by CTOs in Washington. The OIG did note improvements in the accrual methodologies used by CTOs in USAID’s overseas missions during FY 2005.
OMB’s Core Financial System Requirements stipulate that an agency’s core financial system must be able to provide timely and useful financial information to support: management’s fiduciary role; budget formulation and execution functions; fiscal management of program delivery and program decision making and; internal and external reporting requirements. External reporting requirements include the requirements for financial statements prepared in accordance with the form and content prescribed by OMB, reporting requirements prescribed by Treasury, and legal, regulatory and other special management requirements of the agency. The core financial system must provide complete, reliable, consistent, timely and useful financial management information on operations.
5

According to USAID’s Automated Directives System (ADS) 631, financial documentation represents any documentation that impacts on or results in financial activity. It is not limited to documentation within the financial management operations but includes any source material resulting in a financial transaction. CTOs, Loan Officers, Grants Officers, Strategic Objective teams, and others are responsible for retaining financial documentation and ensuring its availability for audit. ADS 631 states that these individuals must gather cost data—such as supporting project documentation, activity reports, delivery reports, or fixed reoccurring expenses—for the accruals exercise and then compare the data to payment histories and advances to estimate quarterly accruals.
At USAID, accrued expenditures are accounting estimates of services or goods rendered which have not yet been paid. In conducting quarterly accrual estimates, USAID relied on a combination of its automated Accruals Reporting System and the efforts of its CTOs at overseas missions and in Washington, DC. The OIG found that amounts accrued via accrual worksheets prepared by CTOs sometimes lacked sufficient documentation to support accrual estimates and that such documentation could often not be produced subsequent to the recording of the estimates.
The larger problem, however, was that USAID’s Accruals Reporting System did not always correctly compute unliquidated obligation information resulting in many instances of under-estimation of accrual information. The system is designed to generate a logical estimate of quarterly contract and grant expenditures that can be modified by CTOs who have more direct information on the quarterly activity of contractors and grantees. However, both the system estimate and the modified CTOs calculations were ignored by the system when the unliquidated amount contained in the system was lower. This lower unliquidated amount was ultimately posted to USAID’s accounting records. The OIG noted various instances where this occurred and determined that the default to a lower unliquidated amount reduced accounts payable and accrued expenditures by as much as $440 million. Once presented with this information, USAID identified a programming error that it corrected within hours of its discovery. Based on the OIG discovery, USAID made a $440 million adjustment to more accurately present accrued expenditures and accounts payable for year-end financial reporting.
With respect to CTO estimates, we found accrual documentation errors, including incorrect calculations, misinterpretation of grantee information, and incorrect comparisons of estimated expenditure reports. Based on the projected errors of accruals estimated by CTOs in Washington, the OIG recommended an additional $131 million in adjustments to more accurately reflect accounts payable and accrued expenditures. These errors occurred more frequently within USAID’s three pillar which are responsible for 90 percent of all accrual estimates in Washington, DC, as the table below illustrates:
6
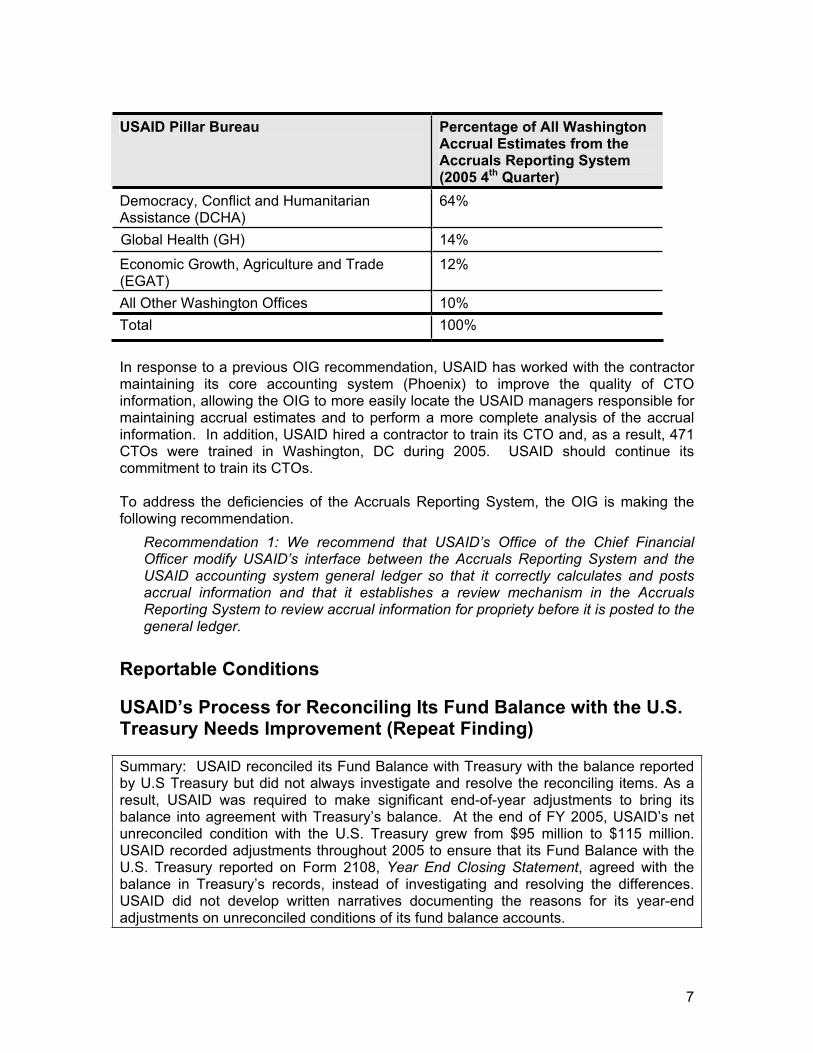
USAID Pillar Bureau Percentage of All Washington Accrual Estimates from the Accruals Reporting System (2005 4th Quarter)
Democracy, Conflict and Humanitarian Assistance (DCHA)
Global Health (GH)
Economic Growth, Agriculture and Trade (EGAT)
All Other Washington Offices
64%
14%
12%
10%
Total 100%
In response to a previous OIG recommendation, USAID has worked with the contractor maintaining its core accounting system (Phoenix) to improve the quality of CTO information, allowing the OIG to more easily locate the USAID managers responsible for maintaining accrual estimates and to perform a more complete analysis of the accrual information. In addition, USAID hired a contractor to train its CTO and, as a result, 471 CTOs were trained in Washington, DC during 2005. USAID should continue its commitment to train its CTOs.
To address the deficiencies of the Accruals Reporting System, the OIG is making the following recommendation.
Recommendation 1: We recommend that USAID’s Office of the Chief Financial Officer modify USAID’s interface between the Accruals Reporting System and the USAID accounting system general ledger so that it correctly calculates and posts accrual information and that it establishes a review mechanism in the Accruals Reporting System to review accrual information for propriety before it is posted to the general ledger.
Reportable Conditions
USAID’s Process for Reconciling Its Fund Balance with the U.S. Treasury Needs Improvement (Repeat Finding)
Summary: USAID reconciled its Fund Balance with Treasury with the balance reported by U.S Treasury but did not always investigate and resolve the reconciling items. As a result, USAID was required to make significant end-of-year adjustments to bring its balance into agreement with Treasury’s balance. At the end of FY 2005, USAID’s net unreconciled condition with the U.S. Treasury grew from $95 million to $115 million. USAID recorded adjustments throughout 2005 to ensure that its Fund Balance with the U.S. Treasury reported on Form 2108, Year End Closing Statement, agreed with the balance in Treasury’s records, instead of investigating and resolving the differences. USAID did not develop written narratives documenting the reasons for its year-end adjustments on unreconciled conditions of its fund balance accounts.
7

U.S. Treasury reconciliation procedures state that an agency (1) may not arbitrarily adjust its fund balance with the U.S. Treasury account, and (2) can adjust its fund balance with the U.S. Treasury account balance only after clearly establishing the causes for any errors and properly correcting those errors. USAID’s written narratives should have been developed for the unreconciled conditions of its Fund Balance with Treasury accounts.
The U.S. Department of Treasury’s guidance for reconciling fund balances requires that Federal agencies research and resolve differences reported by the U.S. Treasury on a monthly basis. Agencies must also resolve all differences between the balances reported in their general ledger fund with Treasury accounts and the balances reported by the U.S. Treasury. This guidance stipulates three months as a reasonable period for clearing the differences. In addition, the procedures state that an agency should document “month cleared” (the accounting month that the discrepancy was adjusted), accounting periods, required explanations, and brief narratives that disclose the cause of the discrepancy.
The OIG identified several problems that continue to limit USAID’s ability to investigate and correct differences between its reported fund balances and the balances reported by Treasury’s Financial Management Service (FMS). Specifically, USAID did not document the issues that resulted in unreconciled conditions and did not implement procedures to quickly research and resolve unreconciled items. USAID’s responsible personnel did not review, certify, or sign monthly reconciliation documents, in accordance with Treasury Financial Manual (TFM) 5100 requirements. The OIG determined that because of these problems, it was not clear whether USAID clearly established and reported the conditions to the USAID managers for the function and whether USAID properly corrected reconciling items and unreconciled conditions of the fund balance accounts. Moreover, USAID’s overseas missions continue to have large unreconciled balances because they have not been able to implement procedures to resolve reconciling items in a timely manner and because accounting stations responsible for several client missions do not consistently receive documentation to support unreconciled transactions. As a result, USAID had to make a significant adjustment to reconcile its Fund Balance with the U.S. Treasury.
In October 2005, USAID issued Chief Financial Officer Bulletin No. 06-1001, (the Bulletin) Reconciliation With U.S. Treasury, describing policy procedures directed at USAID and the Mission Controller Offices. This document requires that USAID and Mission Controllers perform timely and complete monthly reconciliations with the U.S. Treasury Disbursing Offices, including certifying and documenting the results to the Deputy Chief Financial Officer in Washington. Specifically, this document calls on USAID and Mission Controllers to document and justify in writing (narrative form) the rationale for carrying forward any unpaid and unsupported transactions over 90 days old. Furthermore, the Bulletin stipulates that documentation and narratives must be maintained by the appropriate accounting office and made available to the Agency’s management, auditors, and the U.S. Treasury as requested. The Bulletin also calls on USAID and Mission Controllers to follow USAID’s specific written guidance for write-offs of unreconciled transactions, and to certify that the reconciliation process with the U.S. Treasury has been performed according to TFM Volume 1. Part 2-5100.
To ensure that USAID conducts its prescribed reconciliation procedures, we are making the following recommendation:
8

Recommendation No. 2: We recommend that the Office of the Chief Financial Officer ensure that USAID financial managers and mission controllers implement the reconciliation guidelines specified by Chief Financial Officer Bulletin No. 06-1001, Reconciliation with U. S. Treasury, dated October 2005 to ensure Fund Balance with Treasury accounts are reconciled in a timely manner, reconciling items are investigated and resolved, and that adequate documentation is retained to support the reconciliation procedures performed.
USAID’s Intragovernmental Transactions Remain Unreconciled (Repeat Finding)
Summary: USAID did not resolve all significant differences in intragovernmental transactions between USAID and its trading partners throughout fiscal year 2005. FMS reported a $5.9 billion net difference in intragovernmental transactions for the 4th quarter in the Intragovernmental Summary Activity Report, with an absolute value of $6.9 billion. Section 11.3 of OMB Bulletin 01-09 requires Federal agencies to perform quarterly reconciliations of intragovernmental transactions and these reconciliations are to be conducted in accordance with the FMS Federal Intragovernmental Transactions Accounting Policies Guide. Although USAID reconciled material differences identified by FMS in its quarterly Material Differences/Status of Disposition Certification (MD/SD) Report and other differences equal to or greater than $100 million, it did not consistently reconcile other significant differences by reciprocal category with its Federal trading partners throughout FY 2005. Until intragovernmental transactions are reconciled, USAID’s financial statements are subject to error.
Beginning in the quarter ending March 31, 2004, FMS implemented its Intragovernmental Management Control Plan to address a material weakness cited by the Government Accountability Office in the Financial Report of the United States Government. FMS monitors the intragovernmental payment and collection (IPAC) process for the entire Federal government and accumulates daily IPAC transactions among all Federal agencies. To facilitate quarterly reporting, FMS developed a reconciliation process based on a reciprocal category concept. As of September 30, 2005, FMS identified $6.9 billion of unreconciled differences between USAID and 36 separate Federal government agencies.
In its response to a finding reported by the OIG in FY 2004, USAID agreed to reconcile all differences equal to or greater than $100 million. USAID also reconciled all differences that FMS reported on the MD/SD Report. For the 4th quarter of FY 2005 these differences amounted to $742 million out of $6.9 billion the total differences reported.
We noted that $5.2 billion of unreconciled transactions under Trading Partner 99 are not required to be reconciled by USAID because these transactions indicate general fund activities between USAID and the U.S. Treasury. FMS does suggest that Federal agencies confirm that these differences represent general fund activities, however, and this was not always documented.
For other trading partners, USAID investigated the differences, identified reasons for the differences, reported the reasons to FMS, contacted the responsible personnel at the
9

trading partners, and took appropriate action to resolve them. Nevertheless, USAID’s reconciliations are not always documented, and differences persist because Federal trading partners did not always perform the same investigations. While some timing differences may ultimately be resolving differences due to accounting errors or different accounting methodologies require a special effort by USAID and its trading partners for timely resolution. The Federal Intragovernmental Transactions Accounting Policy Guide suggests that agencies should work together to estimate accruals and to record corresponding entries in each set of records so that they are in agreement or that long term accounting policy differences can be easily identified. As a result of the reportable condition, until these reconciliations are complete, USAID’s year-end balances related to intragovernmental line items reported on the financial statements are subject to misstatement.
Through its participation in the Chief Financial Officers’ Council, USAID expects to continue to work with other federal agency financial management leaders to support intragovernmental reconciliation activities, including but not limited to; the facilitation of requests for data; agreement on accounting presentation and; investigation and resolution of differences.
Because significant differences in intragovernmental transactions remain between USAID and its trading partners in fiscal year 2005, we are making the following recommendation:
Recommendation No 3: We recommend that USAID’s Office of the Chief Financial Officer develop a system for reviewing transactions reported under Trading Partner 99 to ensure that they are properly classified and appropriately reported, as recommended by section 4706.30 of TFM 2-4700, “Agency Reporting Requirements for the Financial Report of the United States Government.”
USAID’s Process for Recognizing and Reporting Its Overseas Accounts Receivable Needs Improvement (Repeat Finding)
Summary: USAID's process for recording and reporting receivables still needs improvement. Although many missions are currently using Phoenix for overall financial management, these same missions are still reporting only their quarterly accounts receivable balances to USAID’s Washington headquarters separately, and outside of Phoenix. This occurred because USAID has not strengthened its procedures for accounting and reporting for accounts receivable at its overseas missions. As a result, USAID still cannot routinely provide current accounts receivable information for its overseas missions.
Statement of Federal Financial Accounting Standards No. 1, paragraphs 40-52, Accounts Receivable requires the recognition (recording) of accounts receivable when a claim to cash or other assets has been established. The establishment of accounts receivable cannot occur on a timely basis unless there are adequate procedures in place for recognizing, recording and reporting them at the end of each accounting period.
A memorandum from the USAID/Chief Financial Officer on the Mission Year-end Financial Data Certification Process cited that it was "assumed" that migrated missions (those with access to Phoenix) would report accounts receivable transactions directly.
10
Missions that have migrated their accounting system to Phoenix are still using the same data-call process being used by those missions without access to Phoenix. The data-call process requires missions to separately report their accounts receivable balances every quarter to allow for the preparation of USAID’s quarterly financial statements. As a result, USAID does not have current detailed information on accounts receivable balances for its overseas missions despite the integration of an accounting system overseas that allows for this.
Since Phoenix does not contain current information on mission accounts receivable, the reports it generates are incomplete. USAID, for example, generates an aged accounts receivable report from Phoenix that provides details of past due receivables. But information contained in this report that relate to USAID’s overseas missions cannot be relied on for decision-making as long as overseas missions do not consistently use the system for accounting for receivables.
In our FY 2004 audit report, the OIG previously considered the lack of a worldwide integrated financial management system that correctly recognizes and records accounts receivable, to be a reportable internal control condition; therefore we are not including an additional recommendation to address this condition. Instead, we will continue to monitor USAID's progress in implementing the OIG's previously recommended corrective actions.
This report is intended solely for the information and use of the management of USAID, OMB and Congress, and is not intended to be and should not be used by anyone other than those specified parties.
USAID, Office of Inspector General November 14, 2005
11
Independent Auditor’s Report on USAID’s Compliance with Laws and Regulations We have audited the consolidated balance sheets of USAID as of September 30, 2005 and 2004. We have also audited the consolidated statements of changes in net position, consolidated statements of net cost, combined statements of budgetary resources, and consolidated statements of financing for the fiscal years ended September 30, 2005 and 2004, and have issued our report thereon. We conducted the audit in accordance with generally accepted auditing standards. Government Auditing Standards, (issued by the Comptroller General of the United States) and Office of Management and Budget (OMB) Bulletin No. 01-02, Audit Requirements for Federal Financial Statements.
The management of USAID is responsible for complying with laws and regulations applicable to USAID. As part of obtaining reasonable assurance about whether USAID’s financial statements are free of material misstatement, we performed tests of its compliance with certain provisions of laws and regulations- noncompliance with which could have a direct and material effect on the determination of financial statement amounts and with certain other laws and regulations specified in OMB Bulletin 01-02, including the requirements referred to in the Federal Financial Management Improvement Act (FFMIA) of 1996. We limited our tests of compliance to these provisions and did not test compliance with all laws and regulations applicable to USAID.
Under FFMIA, we are required to report whether USAID’s financial management systems substantially comply with Federal financial management systems requirements, applicable Federal accounting standards, and the United States Government Standard General Ledger at the transaction level. To meet this requirement, we performed tests of compliance with FFMIA section 803(a) requirements. The results of our tests disclosed four instances in which USAID's financial management systems did not substantially comply with FFMIA requirements.
Our tests of compliance with selected provisions of laws and regulations disclosed instances of noncompliance considered to be reportable under Government Auditing Standards. However, our objective was not to provide an opinion on overall compliance with laws and regulations. Accordingly, we do not express such an opinion.
Federal Financial Management Improvement Act of 1996
Under FFMIA, we are required to report whether the Agency’s financial management systems substantially comply with Federal financial management systems requirements, applicable Federal accounting standards, and the United States Government Standard General Ledger at the transaction level. To meet this requirement, we performed tests of compliance with FFMIA section 803(a).
The results of our tests disclosed three continuing instances, described below, where the
12

Agency’s financial management systems did not substantially comply with Federal financial management systems requirements and the U.S. Government Standard General Ledger at the transaction level.
Reportable FFMIA Noncompliance (Repeat Finding)
Since 1997, the OIG has reported that USAID’s financial management systems do not substantially comply with system requirements under FFMIA. Since then, USAID initiated the Financial Systems Integration project to acquire and incrementally implement through successive phases and product releases, a single, Agency-wide integrated core financial system known as Phoenix.1
In fiscal year 2005, USAID made significant strides to overcome the longstanding FFMIA noncompliance conditions and modernize its financial management systems. As a result, USAID is now closer to having an integrated core financial system, but the Agency still must rely on a combination of its partially deployed Phoenix system, legacy systems, and informal and unofficial records. Therefore, the following three reportable noncompliance conditions still remain:
USAID’S FFMIA REPORTABLE NONCOMPLIANCE CONDITIONS
Deficiencies FFMIA Requirements
Phoenix is Not Fully Deployed, But Progress is Being Financial management Made systems requirements
Legacy Financial Systems at Overseas Missions Did Not U.S. Government Standard Comply With the U.S. Government Standard General General Ledger at the Ledger at the Transaction Level transaction level
Financial Reporting Capabilities Need Improvement Financial management systems requirements
According to FFMIA, Federal agencies must implement and maintain financial management systems that substantially comply with Federal financial management system requirements. The Act states that users should have on-line access to, or receive daily reports on, the status of funds to perform analysis or make decisions. OMB Circular A-11 states that an agency that is not in compliance with FFMIA must prepare a remediation plan. The purpose of a remediation plan is to identify activities planned and underway that will allow the agency to achieve substantial compliance with FFMIA. Remediation plans must include the resources, remedies, interim target dates, and responsible officials. The remediation target dates must be within three years of the date the system was determined not to be substantially compliant.
USAID prepared a remediation plan for fiscal years 2005 and 2006 that sets forth a strategy for modernizing its financial management systems and details specific plans and targets for achieving substantial compliance with Federal financial management requirements and standards. USAID met remediation plan target dates in fiscal year 2005 and officials expect to achieve substantial compliance with FFMIA when the
The Phoenix system is based on CGI-AMS Momentum Financials®, a Commercial Off-the-Shelf financial management system designed for Federal agencies. In May 2005, USAID upgraded the system from version 3.7.4 to version 6.0.3.
13
1
Phoenix system is fully deployed to the field in June 2006.
Phoenix is Not Fully Deployed, but Progress is Being Made
During fiscal year 2005, USAID made measurable progress with its Phoenix Overseas Deployment project. OMB Circular A-127, Financial Management Systems, prescribes policies and standards for agencies to follow in developing, operating, evaluating, and reporting on financial management systems. USAID’s ability to meet such requirements rests with its successful overseas deployment of Phoenix.
At the beginning of the fiscal year, Phoenix was only operating in USAID/Washington and at five overseas missions but by the end of September 2005, it was operating at 22 of 53 missions. Additionally, USAID upgraded the Phoenix software from Momentum Financials version 3.7.4 to version 6.0.3 for both USAID/Washington and the overseas missions. The upgrade provides several improvements, such as increased functionality and features, and enables the Agency to meet key strategic objectives, including standardizing Momentum versions with the Department of State, complying with new Federal requirements, and complying with security best practices, such as standards-based encryption.
While this progress is impressive, USAID still needs to deploy Phoenix to the 31 other overseas missions that are still using the Agency’s legacy Mission Accounting and Control System (MACS). In the meantime, USAID continues to rely on a combination of its partially deployed Phoenix system, legacy systems, and informal and unofficial records.
While it is closer to having an integrated core financial system, the Agency still must use MACS to process obligations at overseas missions not yet converted to Phoenix. As a result, USAID may not have provided users at those locations with the complete, accurate, and timely financial information needed for decision-making purposes.
According to OMB Circular A-11, Preparation, Submission, and Execution of the Budget, each Federal agency is responsible for establishing a funds control system that will ensure that the agency does not obligate or expend funds in excess of those appropriated or apportioned. The Circular also states that multi-year unobligated funds remaining available at year-end must be reapportioned in the upcoming fiscal year.
In January 2003,2 the OIG reported that, because USAID did not have an integrated financial management system, it used a separate system (MACS) to process obligations for its overseas missions. As such, the appropriation amount displayed as available after the roll-up of mission obligations was overstated by the amount of these same mission obligations. To compensate for this weakness, USAID allowed only a few users to apportion funds. Further, those users had access to records held outside of Phoenix to track mission obligations and determine the correct amount available for apportionment. Because this issue should be corrected with the successful deployment of Phoenix to the overseas missions, we do not make any recommendations to correct it.
Report on USAID’s Consolidated Financial Statements, Internal Controls And Compliance for Fiscal Year 2002 (Audit Report No. 0-000-03-001-C, January 24, 2003).
14
2
Legacy Financial Systems at Overseas Missions Did Not Comply With U.S. Government Standard General Ledger at the Transaction Level
For overseas missions that had not yet converted to Phoenix, USAID continued to use the legacy MACS system as its financial system. However, MACS does not record mission activities using the U.S. Government Standard General Ledger (SGL) at the transaction level to support financial reporting and to meet FFMIA requirements. Consequently, USAID cannot ensure that transactions are posted properly and consistently from mission to mission.
FFMIA requires agencies to implement and maintain systems that comply substantially with, among other things, the SGL at the transaction level. According to OMB Circular A-127, Financial Management Systems, application of the SGL at the transaction level means that a financial management system will process transactions following the definitions and defined uses of the general ledger accounts as described in the SGL. Compliance with this standard requires:
x Data in Financial Reports Consistent with the SGL. Reports produced by the systems that provide financial information, whether used internally or externally, shall provide financial data that can be traced directly to the SGL accounts.
x Transactions Recorded Consistent with SGL Rules. The criteria (e.g., timing, processing rules/conditions) for recording financial events in all financial management systems shall be consistent with accounting transaction definitions and processing rules defined in the SGL.
x Supporting Transaction Details for SGL Accounts Readily Available. Transaction details supporting SGL accounts shall be available in the financial management systems and directly traceable to specific SGL account codes.
In sum, to support financial reporting and to meet FFMIA requirements, USAID needs to record mission activities using SGL at the transaction level USAID officials expect that substantial compliance with FFMIA will be achieved when Phoenix is fully deployed in June 2006. Because this issue should be corrected with the successful deployment of Phoenix to the overseas missions, we did not make any recommendations to correct it.
Financial Reporting Capabilities Need Improvement
USAID financial management professionals are relying on separate reporting mechanisms outside of Phoenix for day-to-day management of their programs because many of USAID’s standard financial reports available in Phoenix and through Crystal Enterprise (USAID’s additional reporting package software) are not always useful for the routine management and monitoring of USAID’s financial activities. Under FFMIA, Federal agencies must incorporate established accounting standards and reporting objectives into their financial management systems so that assets, liabilities, revenues, expenditures, and the full costs of programs and activities of the Federal Government can be consistently and accurately recorded, monitored, and reported. As a result of USAID’s use of these separate reporting mechanisms, information needed for routine financial management is generated with less efficiency and at an increased risk of error.
15
Because many of USAID’s reporting capabilities could be improved, Phoenix users rely on outside programs and use their own manual schedules to develop the information they need. This may involve consolidating information from various reports available in Phoenix or Crystal Enterprise. Although preparing separate financial reports can be inefficient and result in an increased risk of error, some Phoenix users find it more practical and reliable to use their own reporting mechanisms because the standard Phoenix reporting options currently do not provide the ability to filter data in a useful way. Alternatively, Crystal Enterprise, which can filter data, provides only a few standard options for users.
This report is intended solely for the information and use of the management of USAID, OMB and Congress, and is not intended to be and should not be used by anyone other than those specified parties.
USAID, Office of Inspector General November 14, 2005
16

EVALUATION OF MANAGEMENT COMMENTS We have received USAID’s management comments to the findings and recommendations included in our draft report. We have evaluated USAID management comments on the recommendations and have reached management decisions on all three recommendations. The following is a brief summary of USAID’s management comments on each of the three recommendations included in this report and our evaluation of those comments.
Recommendation No. 1
USAID management agreed with Recommendation No. 1, commenting that corrective action has been taken and will be evaluated further during the first quarter of fiscal year 2006. We agree with the management decision on this recommendation and will review USAID’s implementation during our fiscal year 2006 financial statement audit.
Recommendation No. 2
USAID agreed with Recommendation No. 2 and expects to update the software that will improve its reconciliations, by September 30, 2006. We agree with the management decision on this recommendation and will review USAID’s implementation of this recommendation during our fiscal year 2006 financial statement audit.
Recommendation No. 3
USAID agreed with Recommendation No. 3 and plans to conduct quarterly evaluations of Trading Partner 99 transactions by February 15, 2006. We agree with the management decision on this recommendation and will review USAID’s implementation during our fiscal year 2006 financial statement audit.
17

APPENDIX I
SCOPE AND METHODOLOGY USAID management is responsible for (1) preparing the financial statements in accordance with generally accepted accounting principles, (2) establishing, maintaining and assessing internal control to provide reasonable assurance that the broad control objectives of the Federal Managers’ Financial Integrity Act are met, (3) ensuring that USAID’s financial management systems substantially comply with FFMIA requirements, and (4) complying with applicable laws and regulations.
The Office of Inspector General is responsible for obtaining reasonable assurance about whether the financial statements are presented fairly, in all material respects, in conformity with generally accepted accounting principles. The Office of Inspector General is also responsible for (1) obtaining a sufficient understanding of internal control over financial reporting and compliance to plan the audit (2) testing whether USAID’s financial management systems substantially comply with the three FFMIA requirements, (3) testing compliance with selected provisions of laws and regulations that have a direct and material effect on the financial statements and laws for which OMB audit guidance requires testing, and (4) performing limited procedures with respect to certain other information appearing in the Accountability Report.
In order to fulfill these responsibilities, we (1) examined, on a test basis, evidence supporting the amounts and disclosures in the financial statements (2) assessed the accounting principles used and significant estimates made by management, (3) evaluated the overall presentation of the financial statements, (4) obtained an understanding of internal control related to financial reporting (including safeguarding assets), compliance with laws and regulations (including execution of transactions in accordance with budget authority), and performance measures reported in Management’s Discussion and Analysis of the Accountability Report, (5) tested relevant internal controls over financial reporting and compliance, and evaluated the design and operating effectiveness of internal controls, (6) considered the process for evaluating and reporting on internal control and financial management systems under the Federal Managers’ Financial Integrity Act, (7) tested whether USAID’s financial management systems substantially complied with the three FFMIA requirements, and (8) tested USAID’s compliance with selected provisions of the following laws and regulations:
� Anti-Deficiency Act � Improper Payments Information Act � Prompt Payment Act � Debt Collection and Improvement Act � Federal Credit Reform Act � OMB Bulletin 01-09 � Foreign Assistance Act of 1961
We did not evaluate all internal controls relevant to operating objectives as broadly defined by the Federal Managers’ Financial Integrity Act, such as those controls relevant to preparing statistical reports and ensuring efficient operations. We limited our internal control testing to controls over financial reporting and compliance. Because of inherent limitations in internal control, misstatements due to error or fraud, losses, or noncompliance may occur and not be detected. We also caution that projecting our
18

evaluation to future periods is subject to the risk that controls may become inadequate because of changes in conditions or that the degree of compliance with controls may deteriorate. In addition, we caution that our internal control testing may not be sufficient for other purposes.
We did not test compliance with all laws and regulations applicable to USAID. We limited our tests of compliance to those laws and regulations required by OMB audit guidance that we deemed applicable to the financial statements for the fiscal years ended September 30, 2005 and 2004. We caution that noncompliance may occur and not be detected by these tests and that such testing may not be sufficient for other purposes.
With respect to the Management’s Discussion and Analysis (MD&A), we did not perform an audit. However, we gained an understanding of USAID’s system of collecting and reporting performance information. We did not assess the quality of the performance indicators and performed only limited tests to assess the controls established by USAID. We conducted a limited review of the internal controls related to the existence and completeness assertions relevant to the performance measures included in the MD&A.
In forming our opinion, the OIG considered potential aggregate errors exceeding $352 million for any individual statement to be material to the presentation of the overall financial statements.
19
APPENDIX II
MANAGEMENT COMMENTS
November 9, 2005
MEMORANDUM
TO: Acting AIG/A, Joseph Farinella
FROM: CFO, Lisa D. Fiely /s/
SUBJECT: Management Response to Draft Independent Auditor's Report on USAID's Financial Statements for Fiscal Years 2005 and 2004 (Report No. 0-000-06-001-C)
Thank you for your partnership in this Fiscal Year (FY) 2005 presentation of USAID’s Performance and Accountability Report (PAR), and particularly with respect to the audit of the financial statements, against which the Agency has earned its third consecutive unqualified opinion. The professionalism of your staff has been outstanding and I would like to note that the recently retired Acting Inspector General, Bruce Crandlemire, has left a legacy of collaboration between our organizations.
FY 2005 has been marked with significant improvements in our financial operating environment. With the Office of the Inspector General’s (OIG) support, we have implemented Phoenix in a total of 22 overseas missions and have only two bureaus remaining to complete worldwide implementation. As we continue to identify areas for improvement in our systems, we also continue to improve the quality of information and the availability of information for our clients. In the upcoming years we will also work to strengthen our financial systems by integrating procurement and assistance systems that will improve our operations and information gathering processes and improve our overall reporting capabilities.
Following are our comments and management decisions regarding the findings and proposed audit recommendations:
Material Weakness: USAID’s Accruals Reporting System Needs Improvement
Recommendation 1: We recommend that USAID’s Office of the Chief Financial Officer modify USAID’s interface between the Accruals Reporting System (ARS) and the USAID accounting system general ledger so that it correctly calculates and posts accrual information and that it establishes a review mechanism in ARS to review accrual information for propriety before it is posted to the general ledger.
20

Management Decision: We have already taken the appropriate actions to correct the interface that created the problem. As part of our 1st quarter FY 2006 accruals cycle and financial statement preparation process, the Bureau for Management, Office of the Chief Financial Officer (M/CFO) will evaluate accurate production performance of the interface to deliver accurate information to the Phoenix general ledgers. Target completion date is February 15, 2006.
Reportable Condition: USAID’s Process for Reconciling its Fund Balance with the U.S. Treasury Needs Improvement (Repeat Finding)
Recommendation No. 2: We recommend that the Office of the Chief Financial Officer ensure that USAID financial managers and mission controllers implement the reconciliation guidelines specified by CFO Bulletin No. 06-1001, Reconciliation with the U. S. Treasury, dated October 2005, to ensure that Fund Balance with Treasury accounts are reconciled in a timely manner, reconciling items are investigated and resolved, and that adequate documentation is retained to support the reconciliation procedures performed.
Management Decision: We agree to implement Recommendation No. 2. Target completion date is September 30, 2006. As noted in the recommendation, M/CFO has issued guidance on reconciliation processing and will work to enhance guidance on Phoenix reconciliations. However, improved Phoenix reconciliations will require enhancements to the Phoenix software as related to reconciliations. The Phoenix team is aware of needed improvements on reconciliation processes and will be working the issues in FY 2006.
Reportable Condition: USAID’s Intragovernmental Transactions Remain Unreconciled (Repeat Finding)
Recommendation 3: We recommend that USAID’s Office of the Chief Financial Officer develop a system for reviewing transactions reported under Trading Partner 99 to ensure that they are properly classified and appropriately reported, as recommended by section 4706.30 of TFM 2-4700, Agency Reporting Requirements for the Financial Report of the United States Government.
Management Decision: While past practice has been focused on conducting transaction reviews at year-end, we agree with the recommendation and will accelerate our processes to conduct quarterly evaluations of Trading Partner 99 transactions. Target completion date is February 15, 2006.
21

Reportable Condition: USAID’s Process for Recognizing and Reporting its Overseas Accounts Receivable Needs Improvement (Repeat Finding)
No Recommendation.
Reportable FFMIA Noncompliance (Repeat Finding)
Management Response: As noted earlier, the Agency is making tremendous progress in our goal of replacing our legacy accounting system with Phoenix. It is my expectation that by June 2006 USAID will report that Phoenix has been fully implemented for the accounting of USAID’s worldwide resources. This accomplishment is intended to fully address all of your concerns related to FFMIA compliance.
In closing, I would like to confirm USAID’s commitment to continual improvement in financial management and financial reporting. Thank you.
22
APPENDIX III
STATUS OF PRIOR YEAR FINDINGS AND RECOMMENDATIONS OMB Circular A-50 states that a management decision on audit recommendations shall be made within a maximum of six months after a final report is issued. Corrective action should proceed as rapidly as possible. Several audit recommendations directed to USAID from prior audits either have not been corrected or final action has not been completed as of September 30, 2005. We have also noted where final action was taken subsequent to fiscal year-end but prior to the date of this report.
Report on USAID’s Financial Statements, Internal Controls, and Compliance for Fiscal Year 1998, Audit Report No. 0-000-99-001-F, March 1, 1999
Recommendation No. 1: Because the Chief Financial Officer lacks the authority called for in the CFO Act, we recommend that the Chief Financial Officer collaborate with the Assistant Administrator for Management, Chief Information Officer, and Bureau for Policy and Program Coordination to:
1.1 Determine the specific responsibility, authority, and resources needed to meet the requirements of the Chief Financial Officers Act of 1990, which assigns the Chief Financial Officer responsibility to: (1) develop and maintain an integrated accounting and financial management system that meets federal financial system requirements, federal accounting standards, and the U.S. Standard General Ledger at the transaction level; (2) approve and manage financial management system design and enhancement projects; and (3) develop a financial management system that provides for systematic measurement of performance.
USAID has completed actions on this recommendation.
Independent Auditor’s Report on USAID’s Financial Statements for Fiscal Years 2004 and 2003, Audit Report No. 0-000-05-001-C, November 15, 2004
Recommendation No.2: We recommend that the USAID Chief Financial Officer, in coordination with the Assistant Administrator of the Policy and Program Coordination Division:
2.1 Ensure that annual certifications of strategic objectives to agency goals, which are made when information from the Annual Reports Database are finalized, are conducted consistently by all USAID operating units.
2.2 Include all active strategic objectives expending funds in the Annual Reports Database.
23
(1) conditions of reconciling items and (2) unreconciled conditions of fund balance accounts for the reconciliation of the Fund Balance with Treasury, that incorporate and enhance existing USAID and federal guidance.
Recommendation No. 5: We recommend that USAID’s Chief Financial Officer update written procedures related to the preparation of the 620(q)/Brooke Amendment Violation Report; the monitoring of non-rescheduled loans for countries under rescheduling; and the receipt of loan delinquency reports from its loan servicing agent.
USAID has completed actions on these recommendations.
Unresolved Prior Year Findings and Recommendations
Report on USAID’s Consolidated Financial Statements, Internal Controls and Compliance for Fiscal-Year 2002, Audit Report No. 0-000-03-001-C, January 24, 2003
Recommendation No. 2: We recommend that the Chief Financial Officer:
2.2 Reconcile the mission adjustment account in the general ledger to the cumulative amounts in the mission ledgers and resolve differences between the general ledger and the mission ledgers.
Independent Auditor’s Report on USAID’s Financial Statements for Fiscal Years 2004 and 2003, Audit Report No. 0-000-05-001-C, November 15, 2004
Recommendation No. 1: We recommend that the Chief Financial Officer, in coordination with USAID’s Office of Human Resources, update USAID’s Cognizant Technical Officer training course and Financial Management Overview training course to include sessions on developing and supporting quarterly accrual estimates. The training should include information on supporting documentation and on developing estimates in the absence of timely disbursement data necessary to develop accurate accruals.
Recommendation No.2: We recommend that the USAID Chief Financial Officer, in coordination with the Assistant Administrator of the Policy and Program Coordination Division:
2.2 Include all active strategic objectives expending funds in the Annual Reports Database.
Recommendation No. 4: We recommend that USAID’s Chief Financial Officer direct its Financial Management Office to conduct quarterly intragovernmental reconciliations of activity and balances with its trading partners in accordance with the requirements of the Federal Intragovernmental Transactions Accounting Policies Guide, issued by the Department of Treasury’s Financial Management Service.
These recommendations are pending final action by USAID.
24
Unaudited APPENDIX IV
USAID Financial HighlightsFinancial Highlights
USAID’s financial statements, which appear in the Financial Section of this Report, received for the third consecutive year an unqualified audit opinion issued by the USAID Office of the Inspector General. Preparing these statements is part of the Agency’s goal to improve financial management and provide accurate and reliable information useful for assessing performance and allocating resources. Agency management is responsible for the integrity and objectivity of the financial information presented in these financial statements.
USAID prepares consolidated financial statements that include a Balance Sheet, a Statement of Net Cost, a Statement of Changes in Net Position, a Statement of Budgetary Resources and a Statement of Financing. These statements summarize the financial activity and position of the agency. Highlights of the financial information presented on the principal statements are provided below.
Overview of Financial Position
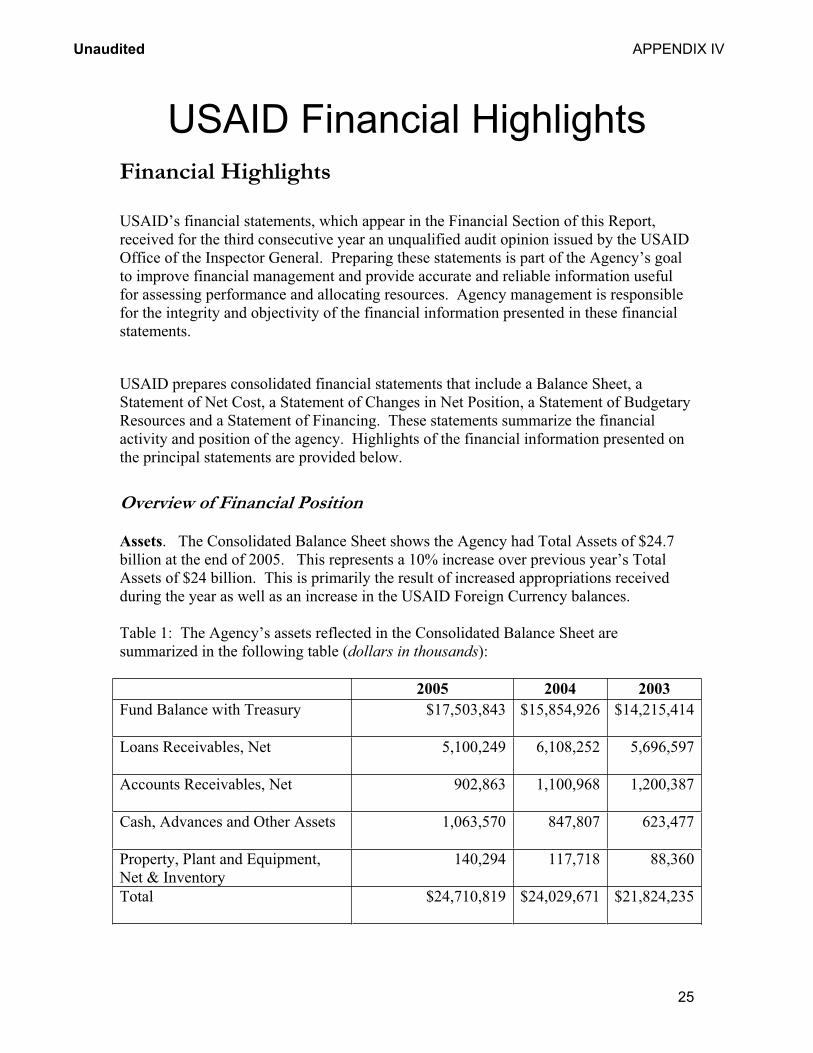
Assets. The Consolidated Balance Sheet shows the Agency had Total Assets of $24.7 billion at the end of 2005. This represents a 10% increase over previous year’s Total Assets of $24 billion. This is primarily the result of increased appropriations received during the year as well as an increase in the USAID Foreign Currency balances.
Table 1: The Agency’s assets reflected in the Consolidated Balance Sheet are summarized in the following table (dollars in thousands):
2005 2004 2003
Fund Balance with Treasury $17,503,843 $15,854,926 $14,215,414
Loans Receivables, Net 5,100,249 6,108,252 5,696,597
Accounts Receivables, Net 902,863 1,100,968 1,200,387
Cash, Advances and Other Assets 1,063,570 847,807 623,477
Property, Plant and Equipment, Net & Inventory
140,294 117,718 88,360
Total $24,710,819 $24,029,671 $21,824,235
25

Unaudited APPENDIX IV
Fund Balances with Treasury and Loans Receivable, Net comprise the majority of USAID’s assets. Together they account for over 90% of total assets for 2005, 2004 and 2003. USAID maintains funds with Treasury to pay its operating and program expenses. These funds increased by $1.6 billion (10%)
Loans receivables, net of estimated write-offs due to loan defaults, result from the disbursement of funds under the Direct Loan Programs. Loan receivable experienced a 17% decrease from FY 2004.
The largest percentage change in assets line items on the Balance Sheet occurred in Advances and Prepayments, an increase of 34% (from $559 million in FY 2004 to $750 million in FY 2005). Nearly all of USAID advances consist of funds disbursed under letters of credit to contractors or grantees, administered by U.S. Department of Agriculture.
The table below presents USAID’s asset type by percentage for fiscal year 2005.
Table 2: Percentage of Assets by Type, FY 2005
Assets by Type Percentage
Fund Balance with Treasury 71%
Loans Receivables, Net 20%
Accounts Receivables, Net 4%
Cash, Advances and Other Assets 4%
Property, Plant and Equipment, Net & Inventory
1%
Total 100%
Liabilities. As presented on the Consolidated Balance Sheet, the Agency had almost $11 billion in Total Liabilities at the end of 2005. This amount represents a $589 million, or 6 % increase in Total Liabilities from the prior year. Liabilities are summarized in the following table (dollars in thousands):
Table 3:
2005 2004 2003
Debt & Due to U.S. Treasury $ 5,734,263 $6,145,006 $5,748,890
Accounts Payable 3,204,824 2,373,001 1,870,077
Loan Guaranty Liability 1,562,485 1,039,937 1,159,415
Other Liabilities & Employee Benefits
444,571 798,847 553,500
Total Liabilities 10,946,143 $9,973,791 $9,331,882
26

Unaudited APPENDIX IV
As reflected in Table 3, Liabilities consisting mainly of Credit Program Debt and amounts payable to U.S. Treasury and Loan Guaranty Liability account for most of USAID’s Total Liabilities for 2005, 2004 and 2003. Debt and Due to Treasury combined represented 52 % of Total Liabilities for FY 2005. The Loan Guaranty Liability comprised 14 % of Total Liabilities for FY 2005.
Debt and Due to Treasury combined decreases by 7 %, or $ 411 million, from FY 2004. Loan Guaranty Liability, which is associated with USAID’s guarantees of loans made by private lending institutions, increased by 50 % or by $ 522 million from FY 2004.
The largest percentage change in Liabilities occurred in the non-Federal line items. Combined Federal and non-Federal Other Liabilities increased by 6 %, or $589 million, from FY2004. This change is primarily the result of an increase of accounts payable accruals at year end.
The table below presents USAID’s percentage of liabilities by type for fiscal year 2005 (dollars in thousands):
Table 4: Percentage of Liabilities by Type, FY 2005
Liabilities by Type, FY 2005 Percentage
Debt & Due to U.S. Treasury 52%
Accounts Payable 30%
Loan Guaranty Liability 14%
Other Liabilities 4%
Total Liabilities 100%
Ending Net Position. Net Position is the sum of the Unexpended Appropriations and Cumulative Results of Operations. USAID’s Net Position at the end of 2005 on the Consolidated Balance Sheet and the Consolidated Statement of Changes in Net Position was $13.7 billion, a $91.9 million increase from the previous fiscal year. Unexpended Appropriations of $13 billion or 97% represent funds appropriated by the Congress for use over multiple years that were not expended by the end of FY 2004.
Results of Operations
The results of operations are reported in the Consolidated Statement of Net Cost and the Consolidated Statement of Changes in Net Position.
The Consolidated Statement of Net Cost presents the Agency’s gross and net cost for its strategic goals. The net cost of operations is the gross (i.e., total) cost incurred by the Agency, less any exchange (i.e., earned) revenue. The accompanying notes to the Statement of Net Cost disclose costs by strategic goals and responsibility segments, and by intragovernmental costs and exchange revenues separately from those with the public for each strategic goal and responsibility segment. A responsibility segment is the
27
Unaudited APPENDIX IV
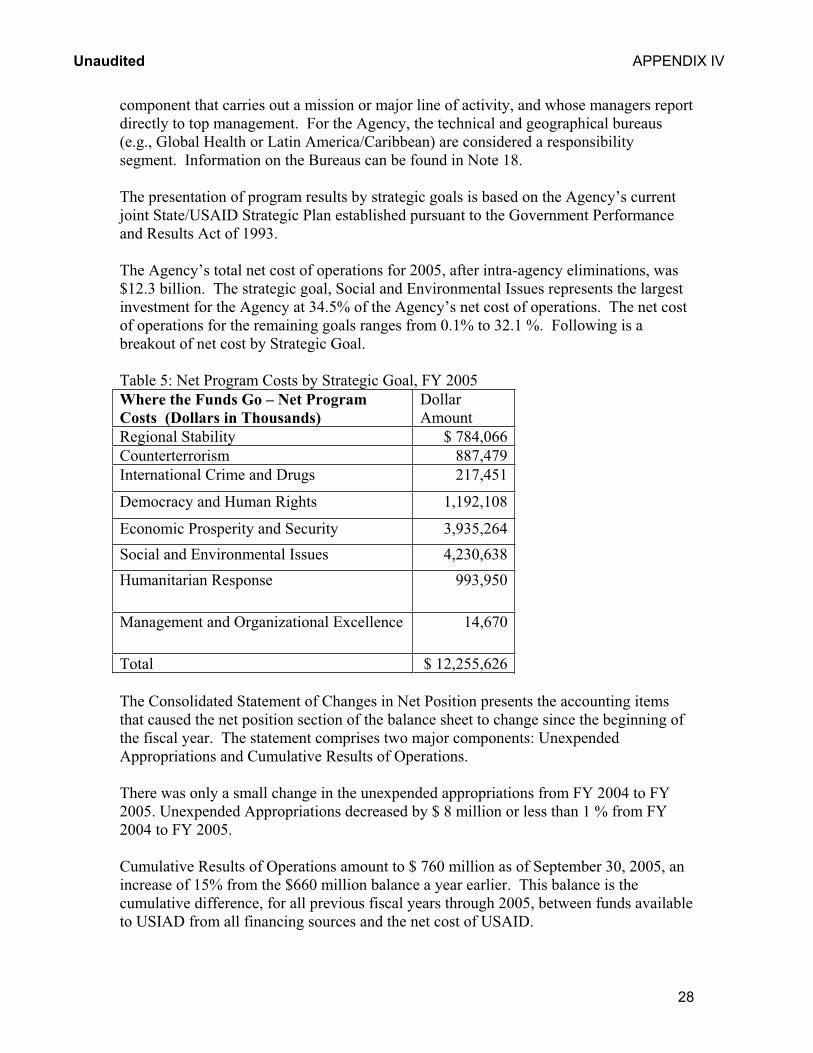
component that carries out a mission or major line of activity, and whose managers report directly to top management. For the Agency, the technical and geographical bureaus (e.g., Global Health or Latin America/Caribbean) are considered a responsibility segment. Information on the Bureaus can be found in Note 18.
The presentation of program results by strategic goals is based on the Agency’s current joint State/USAID Strategic Plan established pursuant to the Government Performance and Results Act of 1993.
The Agency’s total net cost of operations for 2005, after intra-agency eliminations, was $12.3 billion. The strategic goal, Social and Environmental Issues represents the largest investment for the Agency at 34.5% of the Agency’s net cost of operations. The net cost of operations for the remaining goals ranges from 0.1% to 32.1 %. Following is a breakout of net cost by Strategic Goal.
Table 5: Net Program Costs by Strategic Goal, FY 2005
Where the Funds Go – Net Program
Costs (Dollars in Thousands)
Dollar Amount
Regional Stability $ 784,066
Counterterrorism 887,479
International Crime and Drugs 217,451
Democracy and Human Rights 1,192,108
Economic Prosperity and Security 3,935,264
Social and Environmental Issues 4,230,638
Humanitarian Response 993,950
Management and Organizational Excellence 14,670
Total $ 12,255,626
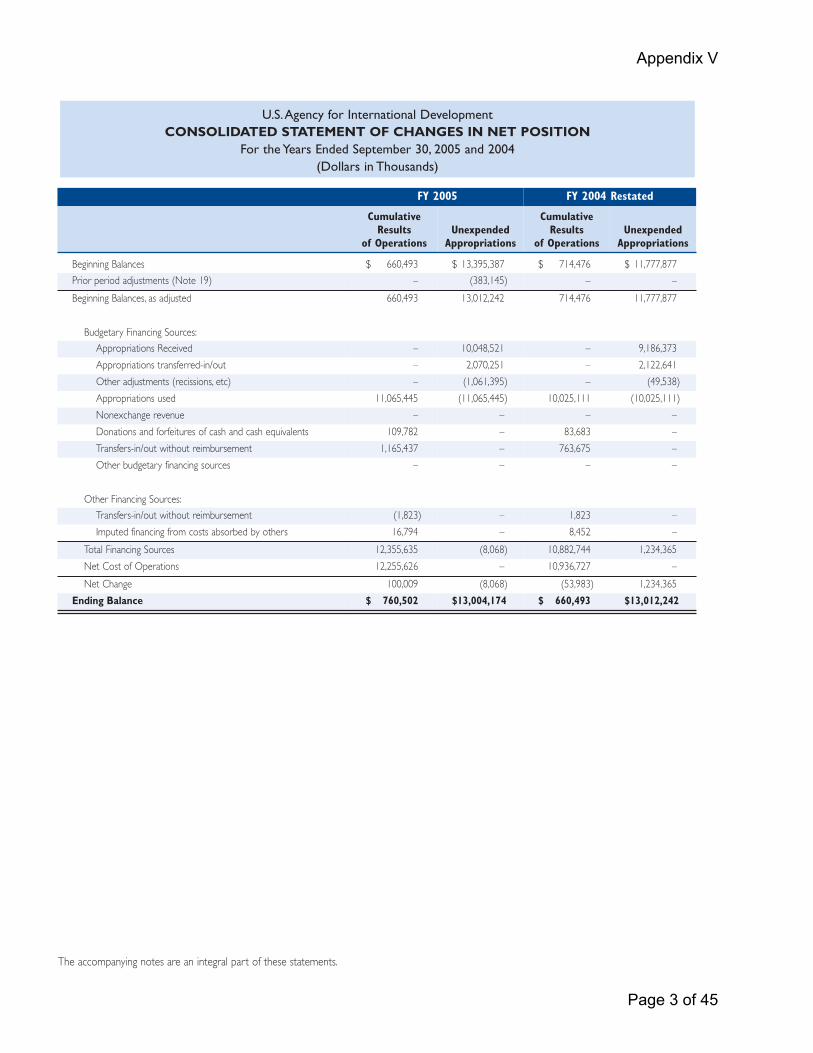
The Consolidated Statement of Changes in Net Position presents the accounting items that caused the net position section of the balance sheet to change since the beginning of the fiscal year. The statement comprises two major components: Unexpended Appropriations and Cumulative Results of Operations.
There was only a small change in the unexpended appropriations from FY 2004 to FY 2005. Unexpended Appropriations decreased by $ 8 million or less than 1 % from FY 2004 to FY 2005.
Cumulative Results of Operations amount to $ 760 million as of September 30, 2005, an increase of 15% from the $660 million balance a year earlier. This balance is the cumulative difference, for all previous fiscal years through 2005, between funds available to USIAD from all financing sources and the net cost of USAID.
28

Unaudited APPENDIX IV
The Combined Statement of Budgetary Resources provides information on how budgetary resources were made available to the Agency for the year and their status at fiscal year-end. For the year, USAID had total budgetary resources of $14.8 billion, an increase of 21 % from the 2004 level. Budget authority of $11 billion, consisted of $10.1 billion for appropriations and $590 million in net appropriation transfers. USAID incurred obligations of $10.5 billion for the year, a 14% decrease from the $9.2 billion of obligations incurred during 2004.
Table 6 below, reflects the funds that the Agency received during 2005.
Where the Funds Come From (Dollars in
Thousands)
Dollar Amount
Appropriations, Transfers and Borrowing Authority
$11,020,051
Unobligated Carry Over Balances (Net) 2,574,785
Other 1,227,450
Total $14,822,286
The Combined Statement of Financing reconciles the resources available to the Agency to finance operations with the net costs of operating the Agency’s programs. Some operating costs, such as depreciation, do not require direct financing sources.
Limitations to the Financial Statements
The financial statements have been prepared to report the financial position and results of operations of USAID, pursuant to the requirements of 31 U.S.C. 3515(b). While the statements have been prepared from the books and records of USAID, in accordance with generally accepted accounting principles (GAAP) for Federal entities and the formats prescribed by the Office of Management and Budget (OMB), the statements are in addition to the financial reports used to monitor and control budgetary resources which are prepared from the same books and records. The statements should be read with the realization that USAID is a component of the U.S. Government, a sovereign entity.
29

Appendix V
FINANCIAL STATEMENTS U.S.Agency for International Development CONSOLIDATED BALANCE SHEET
As of September 30, 2005 and 2004 (Dollars in Thousands)
FY 2005 FY 2004 Restated
ASSETS
Intragovernmental
Fund Balance with Treasury (Note 2) $ 17,503,843 $ 15,854,926
Accounts Receivable, Net (Note 3) 823,246 1,031,168
Other Assets (Note 4) 30,575 30,920
Total Intragovernmental 18,357,664 16,917,014
Cash and Other Monetary Assets (Note 5) 283,002 257,201
Accounts Receivable, Net (Note 3) 79,617 69,800
Loans Receivable, Net (Note 6) 5,100,249 6,108,252
Inventory and Related Property (Note 7) 44,122 35,764
General Property, Plant, and Equipment, Net (Notes 8 and 9) 96,172 81,954
Advances and Prepayments (Note 4) 749,993 559,686
Total Assets 24,710,819 24,029,671
LIABILITIES (Note 16)
Intragovernmental
Accounts Payable (Note 10) 24,232 29,523
Debt (Note 11) 422,602 111,081
Due to U.S.Treasury (Note 11) 5,311,661 6,033,925
Other Liabilities (Notes 12, 13, and 14) 30,510 420,574
Total Intragovernmental 5,789,005 6,595,103
Accounts Payable (Note 10) 3,180,592 2,343,623
Loan Guarantee Liability (Note 6) 1,562,485 1,039,937
Federal Employees and Veteran's Benefits (Note 14) 23,726 24,523
Other Liabilities (Notes 12 and 13) 390,335 353,750
Total Liabilities 10,946,143 10,356,936
Commitments and Contingencies (Note 15)
NET POSITION
Unexpended Appropriations 13,004,174 13,012,242
Cumulative Results of Operations 760,502 660,493
Total Net Position 13,764,676 13,672,735
Total Liabilities and Net Position $ 24,710,819 $ 24,029,671
The accompanying notes are an integral part of these statements.
Page 1 of 45

Appendix V
U.S.Agency for International Development CONSOLIDATED STATEMENT OF NET COST
For the Years Ended September 30, 2005 and 2004 (Dollars in Thousands)
Goal FY 2005 FY 2004 Restated
Regional Stability
Total Costs
Less Earned Revenues
$ 784,590
(624)
$ 677,683
(1,271)
Net Program Costs 783,966 676,412
Counterterrorism
Total Costs 887,866 134,154
Less Earned Revenues (413) ( 54)
Net Program Costs 887,452 134,100
International Crime and Drugs
Total Costs 217,697 79,842
Less Earned Revenues (385) (295)
Net Program Costs 217,311 79,547
Democracy and Human Rights
Total Costs 1,196,972 1,326,682
Less Earned Revenues (5,015) (3,789)
Net Program Costs 1,191,958 1,322,893
Economic Prosperity and Security
Total Costs 3,942,326 3,510,131
Less Earned Revenues (7,522) (14,339)
Net Program Costs 3,934,804 3,495,792
Social and Environmental Issues
Total Costs 4,297,366 4,535,321
Less Earned Revenues (66,525) (66,842)
Net Program Costs 4,230,840 4,468,479
Humanitarian Response
Total Costs 1,188,454 742,443
Less Earned Revenues (193,809) (66,133)
Net Program Costs 994,645 676,310
Management and Organizational Excellence
Total Costs 14,686 48,071
Less Earned Revenues (37) (424)
Net Program Costs 14,649 47,647
Public Diplomacy and Public Affairs
Total Costs - 35,724
Less Earned Revenues - (177)
Net Program Costs - 35,547
Net Costs of Operations (Notes 17 and 18) $ 12,255,626 $ 10,936,727
The accompanying notes are an integral part of these statements.
Page 2 of 45
Appendix V
U.S.Agency for International DevelopmentCONSOLIDATED STATEMENT OF CHANGES IN NET POSITION
For the Years Ended September 30, 2005 and 2004(Dollars in Thousands)
FY 2005 FY 2004 Restated
Cumulative Results
of Operations Unexpended
Appropriations
Cumulative Results
of Operations Unexpended
Appropriations
Beginning Balances $ 660,493 $ 13,395,387 $ 714,476 $ 11,777,877
Prior period adjustments (Note 19) – (383,145) – –
Beginning Balances, as adjusted 660,493 13,012,242 714,476 11,777,877
Budgetary Financing Sources:
Appropriations Received – 10,048,521 – 9,186,373
Appropriations transferred-in/out – 2,070,251 – 2,122,641
Other adjustments (recissions, etc) – (1,061,395) – (49,538)
Appropriations used 11,065,445 (11,065,445) 10,025,111 (10,025,111)
Nonexchange revenue – – – –
Donations and forfeitures of cash and cash equivalents 109,782 – 83,683 –
Transfers-in/out without reimbursement 1,165,437 – 763,675 –
Other budgetary financing sources – – – –
Other Financing Sources:
Transfers-in/out without reimbursement (1,823) – 1,823 –
Imputed financing from costs absorbed by others 16,794 – 8,452 –
Total Financing Sources 12,355,635 (8,068) 10,882,744 1,234,365
Net Cost of Operations 12,255,626 – 10,936,727 –
Net Change 100,009 (8,068) (53,983) 1,234,365
Ending Balance $ 760,502 $13,004,174 $ 660,493 $13,012,242
The accompanying notes are an integral part of these statements.
Page 3 of 45

Appendix VU.S.Agency for International Development
COMBINED STATEMENT OF BUDGETARY RESOURCESFor the Years Ended September 30, 2005 and 2004
(Dollars in Thousands)
FY 2005 FY 2004 Restated
Budgetary Credit Program
Financing Budgetary Credit Program
Financing
Budgetary Resources
Budget Authority
Appropriations Received $ 10,116,585 $ – $ 9,260,278 $ –
Borrowing Authority (Note 20) 2,000 310,947 – –
Net Transfers 590,519 – (524,133) –
Other – – – –
Total Budget Authority 10,709,104 310,947 8,736,145 –
Unobligated Balance:
Beginning of Period 2,437,323 1,001,713 2,288,520 981,619
Net Transfers, Actual (864,251) – 96,959 –
Total Unobligated Balance 1,573,072 1,001,713 2,385,479 981,619
Spending Authority from Offsetting Collections:
Earned
Collected 1,443,194 421,647 906,735 218,325
Receivable from Federal Sources 351 – ( 237) –
Change in Unfilled Customer Orders
Advance Received – – 4,594 –
Anticipated for Rest of Year,Without Advances 3,021 – – –
Subtotal 1,446,566 421,647 911,092 218,325
Recoveries of Prior Year Obligations 1,138,496 – 140,910 3,955
Permanently Not Available (1,779,259) – ( 1,079,492) (1,184)
Total Budgetary Resources 13,087,979 1,734,307 11,094,134 1,202,715
Status of Budgetary Resources:
Obligations Incurred (Note 20)
Direct 9,756,791 709,518 8,971,305 234,102 Reimbursible 59,212 – – –
Subtotal 9,816,003 709,518 8,971,305 234,102
Unobligated Balance, Available 3,262,407 1,024,789 2,090,924 968,613
Unobligated Balance, Unavailable 9,569 – 31,905 –
Total Status of Budgetary Resources 13,087,979 1,734,307 11,094,134 1,202,715
Relationship of Obligations to Outlays:
Obligated Balance, Net, Beginning of Period (Note 20) 10,824,552 11,031 10,574,841 1,597
Obligated Balance Transferred, Net – – – –
Obligated Balance, Net, End of Period:
Accounts Receivable (3,692) – ( 3,691) –
Unfilled Customer Orders From Federal Sources (7,614) – (4,593) –
Undelivered Orders 7,884,272 2,768 9,559,497 10,604
Accounts Payable 2,402,758 520 1,273,339 427
Outlays:
Disbursements 8,275,519 717,260 8,482,569 220,712
Collections (1,441,693) (421,647) ( 1,122,466) ( 2,595)
Subtotal 6,833,826 295,613 7,360,103 218,117
Less: Offsetting Receipts (195,568) – – –
Net Outlays $ 6,638,258 $ 295,613 $ 7,360,103 $ 218,117
The accompanying notes are an integral part of these statements.
Page 4 of 45
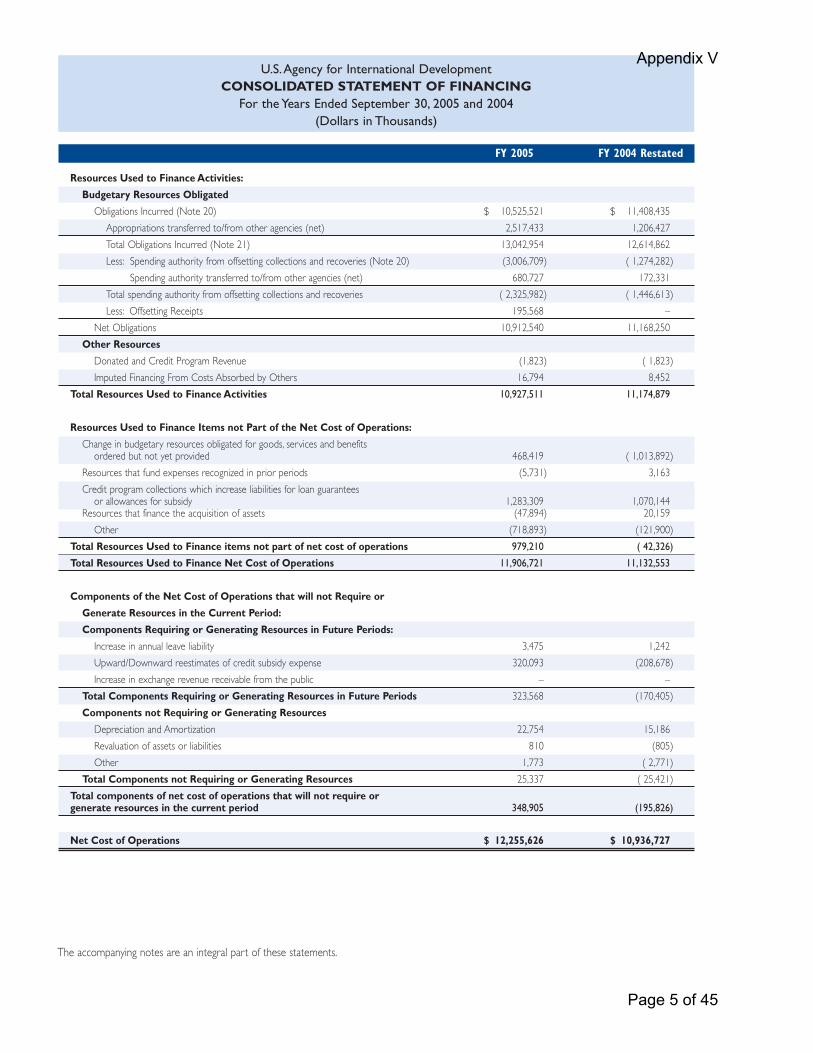
Appendix VU.S.Agency for International Development
CONSOLIDATED STATEMENT OF FINANCING For the Years Ended September 30, 2005 and 2004
(Dollars in Thousands)
FY 2005 FY 2004 Restated
Resources Used to Finance Activities:
Budgetary Resources Obligated
Obligations Incurred (Note 20) $ 10,525,521 $ 11,408,435
Appropriations transferred to/from other agencies (net) 2,517,433 1,206,427
Total Obligations Incurred (Note 21) 13,042,954 12,614,862
Less: Spending authority from offsetting collections and recoveries (Note 20) (3,006,709) ( 1,274,282)
Spending authority transferred to/from other agencies (net) 680,727 172,331
Total spending authority from offsetting collections and recoveries ( 2,325,982) ( 1,446,613)
Less: Offsetting Receipts 195,568 –
Net Obligations 10,912,540 11,168,250
Other Resources
Donated and Credit Program Revenue (1,823) ( 1,823)
Imputed Financing From Costs Absorbed by Others 16,794 8,452
Total Resources Used to Finance Activities 10,927,511 11,174,879
Resources Used to Finance Items not Part of the Net Cost of Operations:
Change in budgetary resources obligated for goods, services and benefits ordered but not yet provided 468,419 ( 1,013,892)
Resources that fund expenses recognized in prior periods (5,731) 3,163
Credit program collections which increase liabilities for loan guarantees or allowances for subsidy 1,283,309 1,070,144
Resources that finance the acquisition of assets (47,894) 20,159
Other (718,893) (121,900)
Total Resources Used to Finance items not part of net cost of operations 979,210 ( 42,326)
Total Resources Used to Finance Net Cost of Operations 11,906,721 11,132,553
Components of the Net Cost of Operations that will not Require or
Generate Resources in the Current Period:
Components Requiring or Generating Resources in Future Periods:
Increase in annual leave liability 3,475 1,242
Upward/Downward reestimates of credit subsidy expense 320,093 (208,678)
Increase in exchange revenue receivable from the public – –
Total Components Requiring or Generating Resources in Future Periods 323,568 (170,405)
Components not Requiring or Generating Resources
Depreciation and Amortization 22,754 15,186
Revaluation of assets or liabilities 810 (805)
Other 1,773 ( 2,771)
Total Components not Requiring or Generating Resources 25,337 ( 25,421)
Total components of net cost of operations that will not require or generate resources in the current period 348,905 (195,826)
Net Cost of Operations $ 12,255,626 $ 10,936,727
The accompanying notes are an integral part of these statements.
Page 5 of 45
Appendix V
USAID FY 2005 FOOTNOTES TO THE FINANCIAL STATEMENTS NOTE 1. SUMMARY OF SIGNIFICANT ACCOUNTING POLICIES
A. BASIS OF PRESENTATION
These financial statements report USAID’s financial position and results of operations. They have been prepared using USAID’s books and records in accordance with Agency accounting policies, the most significant of which are summarized in this note. The statements are presented in accordance with the guidance and requirements of the recently issued Office of Management and Budget (OMB) Circular A-136, Financial Reporting Requirements, which incorporates and updates Bulletin 01-09, Form and Content of Agency Financial Statements, and the Government Management Reform Act of 1994.
USAID accounting policies follow generally accepted accounting principles for the Federal government, as recommended by the Federal Accounting Standards Advisory Board (FASAB). The FASAB has been recognized by the American Institute of Certified Public Accountants (AICPA) as the official accounting standard set for the Federal government. These standards have been agreed to, and published by the Director of the Office of Management and Budget, the Secretary of the Treasury, and the Comptroller General.
B. REPORTING ENTITY
Established in 1961 by President John F. Kennedy, USAID is the independent U.S. Government agency that provides economic development and humanitarian assistance to advance United States economic and political interests overseas.
PROGRAMS
The statements present the financial activity of various programs and accounts managed by USAID. The programs include the Iraq Relief and Reconstruction Fund, Economic Support Fund, Development Assistance, Assistance for the New Independent States of the Former Soviet Union, Special Assistance Initiatives, International Disaster Assistance, Child Survival and Disease, Transition Initiatives, and Direct and Guaranteed Loan Programs. This classification is consistent with the Budget of the United States.
Iraq Relief and Reconstruction Fund
This fund supports necessary expenses related to providing humanitarian assistance in and around Iraq and to carrying out the purposes of the Foreign Assistance Act of 1961 for rehabilitation and reconstruction in Iraq. These include costs of: (1) water/sanitation infrastructure; (2) feeding and food distribution; (3) supporting relief efforts related to refugees, internally displaced persons, and vulnerable individuals, including assistance for families of innocent Iraqi civilians who suffer losses as a result of military operations; (4) electricity; (5) healthcare; (6) telecommunications; (7) economic and financial policy; (8) education; (9) transportation; (10) rule of law and governance; (11) humanitarian de-mining; and (12) agriculture.
Economic Support Fund
Programs funded through this account provide economic assistance to select countries in support of efforts to promote stability and U.S. security interests in strategic regions of the world.
Development Assistance
This program provides economic resources to developing countries with the aim of bringing the benefits of development to the poor. The program promotes broad-based, self-sustaining economic growth and supports initiatives intended to stabilize population growth, protect the environment and foster increased democratic participation in developing countries. The program is concentrated in those areas in which the United States has special expertise and which promise the greatest opportunity for the poor to better their lives.
Assistance for the New Independent States of the Former Soviet Union
This account provides funds for a program of assistance to the independent states that emerged from the former Soviet Union. These funds support U.S. foreign policy goals of consolidating improved U.S. security; building a lasting partnership with the New Independent States; and providing access to each other’s markets, resources, and expertise.
Page 6 of 45
Appendix V
Special Assistance Initiatives
This program provides funds to support special assistance activities. The majority of funding for this program was for democratic and economic restructuring in Central and Eastern European countries consistent with the objectives of the Support for East European Democracy (SEED) Act. All SEED Act programs support one or more of the following strategic objectives: promoting broad-based economic growth with an emphasis on privatization, legal and regulatory reform and support for the emerging private sector; encouraging democratic reforms; and improving the quality of life including protecting the environment and providing humanitarian assistance.
International Disaster Assistance
Funds for the International Disaster Assistance Program provide relief, rehabilitation, and reconstruction assistance to foreign countries struck by disasters such as famines, floods, hurricanes and earthquakes. The program also provides assistance in disaster preparedness, and prevention and mitigation.
Child Survival and Disease
This program provides economic resources to developing countries to support programs to improve infant and child nutrition, with the aim of reducing infant and child mortality rates; to reduce HIV transmission and the impact of the HIV/AIDS pandemic in developing countries; to reduce the threat of infectious diseases of major public health importance such as polio, and malaria; and to expand access to quality basic education for girls and women.
Transition Initiatives
This account funds humanitarian programs that provide post-conflict assistance to victims of natural and man-made disasters. Until FY 2001, this type of assistance was funded under the International Disaster Assistance account.
Direct and Guaranteed Loans:
Direct Loan Program
These loans are authorized under Foreign Assistance Acts, various predecessor agency programs, and other foreign assistance legislation. Direct Loans are issued in both U.S. dollars and the currency of the borrower. Foreign currency loans made “with maintenance of value” place the risk of currency devaluation on the borrower, and are recorded in equivalent U.S. dollars. Loans made “without maintenance of
value” place the risk of devaluation on the U.S. Government, and are recorded in the foreign currency of the borrower
Urban and Environmental Program
The Urban and Environmental (UE) program, formerly the Housing Guarantee Program, extends guaranties to U.S. private investors who make loans to developing countries to assist them in formulating and executing sound housing and community development policies that meet the needs of lower income groups.
Micro and Small Enterprise Development Program
The Micro and Small Enterprise Development (MSED) Program supports private sector activities in developing countries by providing direct loans and loan guarantees to support local micro and small enterprises. The MSED program had one new loan guarantee for FY 2004. Although the MSED program is still active, the bulk of USAID’s new loan guarantee activity is handled through the Development Credit Authority (DCA) program.
Israeli Loan Guarantee Program
Congress enacted the Israeli Loan Guarantee Program in Section 226 of the Foreign Assistance Act to support the costs for immigrants resettling to Israel from the former Soviet Union, Ethiopia, and other countries. Under this program, the U.S. Government guaranteed the repayment of up to $10 billion in loans from commercial sources, to be borrowed in $2 billion annual increments. Borrowing was completed under the program during Fiscal Year 1999, with approximately $9.2 billion being guaranteed. Guarantees are made by USAID on behalf of the U.S. Government, with funding responsibility and basic administrative functions guarantees for Israel, not to exceed $9 billion and $1.3 billion in guarantees were resting with USAID. In FY 2003, Congress authorized a second portfolio of loan issued under this portfolio during FY 2003.
Ukraine Guarantee Program
The Ukraine Export Credit Insurance Program was established with the support of the Export-Import Bank of the U.S. to assist Ukrainian importers of American goods. The program commenced operations in Fiscal Year 1996 and expired in Fiscal Year 1999. The Ukraine Financing Account was closed out in FY 2002.
Page 7 of 45

Appendix V
Development Credit Authority
The first obligations for USAID’s new Development Credit Authority (DCA) were made in FY 1999. DCA allows missions and other offices to use loans and loan guarantees to achieve their development objectives when it can be shown that: 1) the project generates enough revenue to cover the debt service including USAID fees, 2) there is at least 50% risk-sharing with a private-sector institution, and 3) the DCA guarantee addresses a financial market failure in-country and does not “crowd-out” private sector lending. DCA can be used in any sector and by any USAID operating unit whose project meets the DCA criteria. DCA projects are approved by the Agency Credit Review Board and the Chief Financial Officer.
Loan Guarantees to Egypt Program
The Loan Guarantees to Egypt Program was established under the Emergency Wartime Supplemental Appropriations Act, 2003. Under this program, the U.S. Government was authorized to issue an amount not to exceed $2 billion in loan guarantees to Egypt during the period beginning March 1, 2003 and ending September 30, 2005. $1.25 billion in new loan guarantees were issued in fiscal year 2005 before the expiration of the program.
FUND TYPES
The statements include the accounts of all funds under USAID’s control. Most of the fund accounts relate to general fund appropriations. USAID also has special fund, revolving fund, trust fund, deposit funds, capital investment fund, receipt account, and budget clearing accounts.
General fund appropriations and the Special fund are used to record financial transactions under Congressional appropriations or other authorization to spend general revenue.
Revolving funds are established by law to finance a continuing cycle of operations, with receipts derived from such operations usually available in their entirety for use by the fund without further action by Congress.
Trust funds are credited with receipts generated by the terms of the trust agreement or statute. At the point of collection, these receipts are unavailable, depending upon statutory requirements, or available immediately.
The capital investment fund contains no year funds to provide the Agency with greater flexibility to manage investments in technology systems and facility construction that the annual appropriation for Operating Expenses does not allow.
Deposit funds are established for (1) amount received for which USAID is acting as a fiscal agent or custodian, (2) unidentified remittances, (3) monies withheld from payments for goods or services received, and (4) monies held waiting distribution on the basis of legal determination.
C. BASIS OF ACCOUNTING
Transactions are recorded on both an accrual and budgetary basis. Under the accrual basis, revenues are recognized when earned and expenses are recognized when a liability is incurred, without regard to receipt or payment of cash. Budgetary accounting facilitates compliance with legal constraints on, and controls of, the use of federal funds.
The accompanying Balance Sheet, Statement of Net Cost, and Statement of Changes in Net Position have been prepared on an accrual basis. The Statement of Budgetary Resources has been prepared in accordance with budgetary accounting rules. Finally, the Statement of Financing has been prepared to reconcile budgetary to financial (proprietary) accounting information.
D. BUDGETS AND BUDGETARY ACCOUNTING
The components of USAID’s budgetary resources include current budgetary authority (that is, appropriations and borrowing authority) and unobligated balances remaining from multi-year and no-year budget authority received in prior years. Budget authority is the authorization provided by law to enter into financial obligations that result in immediate or future outlays of federal funds. Budgetary resources also include reimbursement and other income (that is, spending authority from offsetting collections credited to an appropriation of fund account) and adjustments (that is, recoveries of prior year obligations).
Unobligated balances associated with appropriations that expire at the end of the fiscal year remain available for obligation adjustments, but not new obligations, until that account is canceled. When accounts are canceled five years after they expire, amounts are not available for obligations or expenditure for any purpose and are returned to Treasury.
Page 8 of 45
Appendix V
Pursuant to Section 511 of USAID’s Appropriations Act for certain purposes under the Foreign Assistance Act of 1961, as amended, shall remain available for obligation for an extended period if such funds are initially obligated within their initial period of availability.
E. REVENUES AND OTHER FINANCING SOURCES
USAID receives the majority of its funding through congressional appropriations --annual, multi-year, and no-year appropriations -that may be used within statutory limits. Appropriations are recognized as revenues at the time the related program or administrative expenses are incurred. Appropriations expended for capitalized property and equipment are not recognized as expenses. In addition to funds warranted directly to USAID, the agency also receives allocation transfers from the U.S. Department of Agriculture (USDA) Commodity Credit Corporation, the Executive Office of the President, and the Department of State.
Additional financing sources for USAID’s various credit programs and trust funds include amounts obtained through collection of guaranty fees, interest income on rescheduled loans, penalty interest on delinquent balances, permanent indefinite borrowing authority from U.S.Treasury, proceeds from the sale of overseas real property acquired by USAID, and advances from foreign governments and international organizations.
Revenues are recognized as financing sources to the extent that they were payable to USAID from other agencies, other governments and the public in exchange for goods and services rendered to others. Imputed revenues are reported in the financial statements to offset the imputed costs.
F. FUND BALANCES WITH THE U.S. TREASURY
Cash receipts and disbursements are processed by the U.S. Treasury. The fund balances with Treasury are primarily appropriated funds that are available to pay current liabilities and finance authorized purchase commitments, but they also include revolving, deposit, and trust funds.
G. FOREIGN CURRENCY
The Direct Loan Program has foreign currency funds, which are used to disburse loans in certain countries. Those balances are reported at the U.S. dollar equivalents using the exchange rates prescribed by the U.S.Treasury. A gain or loss on translation is recognized for the change in valuation of foreign currencies at year-end. Additionally, some USAID host countries contribute funds for the overhead operation of the host mission and the execution of USAID programs. These funds are held in trust and reported in U.S. dollar equivalents on the balance sheet and statement of net costs.
H. ACCOUNTS RECEIVABLE
Accounts receivable consist of amounts due mainly from foreign governments but also from other Federal agencies and private organizations. USAID regards amounts due from other Federal agencies as 100 percent collectible. The Agency establishes an allowance for uncollectible accounts receivable for non-loan or revenue generating sources that have not been collected for a period of over one year.
I. LOANS RECEIVABLE
Loans are accounted for as receivables after funds have been disbursed. For loans obligated before October 1, 1991 (the pre-credit reform period), loan principal, interest, and penalties receivable are reduced by an allowance for estimated uncollectible amounts. The allowance is estimated based on a net present value method prescribed by OMB that takes into account country risk and projected cash flows.
For loans obligated on or after October 1, 1991, the loans receivable are reduced by an allowance equal to the net present value of the cost to the USG of making the loan. This cost, known as “subsidy”, takes into account all cash inflows and outflows associated with the loan, including the interest rate differential between the loans and Treasury borrowing, the estimated delinquencies and defaults net of recoveries, and offsets from fees and other estimated cash flows. This allowance is re-estimated when necessary and changes reflected in the operating statement.
Loans have been made in both U.S. dollars and foreign currencies. Loans extended in foreign currencies can be with or
Page 9 of 45

Appendix V
without “Maintenance of Value” (MOV). Those with MOV place the currency exchange risk upon the borrowing government; those without MOV place the risk on USAID. Foreign currency exchange gain or loss is recognized on those loans extended without MOV, and reflected in the net credit programs receivable balance.
Credit program receivables also include origination and annual fees on outstanding guarantees, interest on rescheduled loans and late charges. Claims receivables (subrogated and rescheduled) are due from foreign governments as a result of defaults for pre-1992 guaranteed loans. Receivables are stated net of an allowance for uncollectible accounts, determined using an OMB approved net present value default methodology.
While estimates of uncollectible loans and interest are made using methods prescribed by OMB, the final determination as to whether a loan is collectible is also affected by actions of other U.S. Government agencies.
J.ADVANCES AND PREPAYMENTS
Funds disbursed in advance of incurred expenditures are recorded as advances. Most advances consist of funds disbursed under letters of credit to contractors and grantees. The advances are liquidated and recorded as expenses upon receipt of expenditure reports from the recipients.
K. INVENTORY AND RELATED PROPERTY
USAID’s inventory and related property is comprised of operating materials and supplies. Some operating materials and supplies are held for use and consist mainly of computer paper and other expendable office supplies not in the hands of the user. USAID also has materials and supplies in reserve for foreign disaster assistance stored at strategic sites around the world. These consist of tents, vehicles, and water purification units. The Agency also has birth control supplies stored at several sites.
USAID’s office supplies are deemed items held for use because they are tangible personal property to be consumed in normal operations. Agency supplies held in reserve for future use are not readily available in the market, or there is more than a remote chance that the supplies will be needed, but not in the normal course of operations.Their valuation is based on cost and they are not considered “held for sale”. USAID has no supplies categorizable as excess, obsolete, or unserviceable operating materials and supplies
L. PROPERTY, PLANT AND EQUIPMENT
USAID capitalizes all property, plant and equipment that has an acquisition cost of $25,000 or greater and a useful life of two years or more. Acquisitions that do not meet these criteria are recorded as operating expenses. Assets are capitalized at historical cost and depreciated using the straight-line method. Real property is depreciated over 20 years, nonexpendable personal property is depreciated over 3 to 5 years, and capital leases are depreciated according to the terms of the lease. The Agency operates land, buildings, and equipment that are provided by the General Services Administration. Rent for this property is expensed. Internal use software that has development costs of $300,000 or greater is capitalized. Deferred maintenance amounts are immaterial with respect to the financial statements.
M. LIABILITIES
Liabilities represent the amount of monies or other resources that are likely to be paid by USAID as the result of transactions or events that have already occurred. However, no liability can be paid by the Agency without an appropriation or borrowing authority. Liabilities for which an appropriation has not been enacted are therefore classified as liabilities not covered by budgetary resources (unfunded liabilities), and there is no certainty that the appropriations will be enacted. Also, these liabilities can be abrogated by the U.S. Government, acting in its sovereign capacity.
N. LIABILITIES FOR LOAN GUARANTEES
The Credit Reform Act (CRA) of 1990, which became effective on October 1, 1991, has significantly changed the manner in which USAID’s loan programs finance their activities. The main purpose of CRA was to more accurately measure the cost of Federal credit programs and to place the cost of such programs on a budgetary basis equivalent to other Federal spending. Consequently, commencing in fiscal 1992, USAID cannot make new loans or guarantees without an appropriation available to fund the cost of making the loan or guarantee.This cost is known as “subsidy”.
For USAID’s loan guarantee programs, when guarantee commitments are made, an obligation for subsidy cost is recorded in the program account. This cost is based on the net present value of the estimated net cash outflows to be paid by the Program as a result of the loan guarantees, except for administrative costs, less the net present value of all cash inflows
Page 10 of 45

Appendix V
to be generated from those guarantees. When the loans are disbursed, the subsidy cost is disbursed from the program account to a financing account.
For loan guarantees made before the CRA (pre-1992), the liability for loan guarantees represents an unfunded liability. Footnote 6 presents the unfunded amounts separate from the post-1991 liabilities. The amount of unfunded liabilities also represents a future funding requirement for USAID. The liability is calculated using a reserve methodology that is similar to OMB prescribed method for post-1991 loan guarantees.
O. ANNUAL, SICK,AND OTHER LEAVE
Annual leave is accrued as it is earned and the accrual is reduced as leave is taken. Each year, the balance in the accrued annual leave account is adjusted to reflect current pay rates. To the extent that current or prior year appropriations are not available to fund annual leave earned but not taken, funding will be obtained from future financing sources. Sick leave and other types of leave are expensed as taken.
P. RETIREMENT PLANS AND POST EMPLOYMENT BENEFITS
USAID recognizes its share of the cost of providing future pension benefits to eligible employees over the period of time the employees provide the related services. The pension expense recognized in the financial statements equals the current service cost for USAID employees for the accounting period less the amount contributed by the employees. The measurement of the service cost requires the use of an actuarial cost method and assumptions. OPM administers these benefits and provides the factors that USAID applies to report the cost. The excess of the pension expense over the amount contributed by USAID and employees represents the amount being financed directly through the Civil Service Retirement and Disability Fund administered by OPM. This cost is considered imputed cost to USAID.
USAID recognizes a current-period expense for the future cost of post retirement health benefits and life insurance for its employees while they are still working. USAID accounts for and reports this expense in its financial statements in a manner similar to that used for pensions, with the exception that employees and USAID do not make contributions to fund these future benefits.
Federal employee benefit costs paid by OPM and imputed by USAID are reported on the Statement of Financing and the Statement of Net Cost.
Q. NET POSITION
Net position is the residual difference between assets and liabilities. It is composed of unexpended appropriations and cumulative results of operationss.
Unexpended appropriations are the portion of the appropriations represented by undelivered orders and unobligated balancess.
Cumulative results of operations are also part of net position. This account reflects the net difference between (1) expenses and losses and (2) financing sources, including appropriations, revenues and gains, since the inception of the activity.
R. NON-ENTITY ASSETS
Non-entity fund balances are amounts in Deposit Fund accounts. These include such items as: funds received from outside sources where the government acts as fiscal agent, monies the government has withheld awaiting distribution based on legal determination, and unidentified remittances credited as suspense items outside the budget. For USAID, non-entity assets are minimal in amount and as reflected in Note 3, composed solely of accounts receivables, net of allowances.
S.AGENCY COSTS
USAID costs of operations are comprised of program and operating expenses. USAID/Washington program expenses by goal are obtained directly from Phoenix, the Agency general ledger. Mission related program expenses by goal area are obtained from the Mission Accounting and Control system (MACS). A cost allocation model is used to distribute operating expenses, including Management Bureau, Global Development Alliance,Trust Funds and Support Offices costs to specific goals. Expenses related to Credit Reform and Revolving Funds are directly applied to specific agency goals based on their objectives.
Page 11 of 45

Appendix V
T. RECLASSIFICATIONS
During FY 2005, financial statements were reviewed to ensure proper form and content. As a result, the following reclassifications and or changes were made to the Statements of Budgetary Resources and Financing to improve the presentation of information:
A fund shown as Program on the Statement of Budgetary Resources in FY 2004 was reclassified as Allocations in FY 2005. To ensure comparability of the statements, the FY 2004 Total Budgetary Resources and Status of Budgetary Resources was decreased by $2,204 million, Net Outlays increased by $240 million, and Ending Obligations by $1,925 million. No other statements are affected by this reclassification.
On the Statement of Financing, the line item Other Resources, Donated and Credit Program Revenue was renamed to Transfers In without Reimbursement. Because of this change, Credit Program Revenue is now shown in Resources Used to Finance Items not Part of the Net Cost of Operations-Other. For comparative purposes, the FY 2004 amount of $121 million for Credit Program Revenue was also reclassified. Similarly, the line item Components Requiring or Generating Resources for Future Periods-Increase in Exchange Revenue Receivable from the Public was reclassified as Components not Requiring or Generating Resources-Other. The corresponding amounts in FY 2004, of $37 million were also reclassified to ensure comparability.
NOTE 2. FUND BALANCES WITH TREASURY
Fund Balances with Treasury as of September 30, 2005 and 2004 The Fund Balances with Treasury are available to pay accrued consisted of the following: liabilities and finance authorized commitments relative to goods,
services, and benefits.
Fund Balances with Treasury(Dollars in Thousands)
Fund Balances FY 2005 FY 2004
Trust Funds $ 36,747 $ 33,255
Revolving Funds 2,760,473 1,435,616
Appropriated Funds 14,509,038 14,324,552
Other Funds 197,585 61,503
Total $ 17,503,843 $ 15,854,926
Status of Fund Balance: FY 2005 FY 2004
Unobligated Balance
Available $ 11,064 $ 1,193,906
Unavailable 911,884 18,142
Obligated Balance Not Yet Disbursed 16,580,894 14,647,878
Total $ 17,503,843 $ 15,854,926
Page 12 of 45
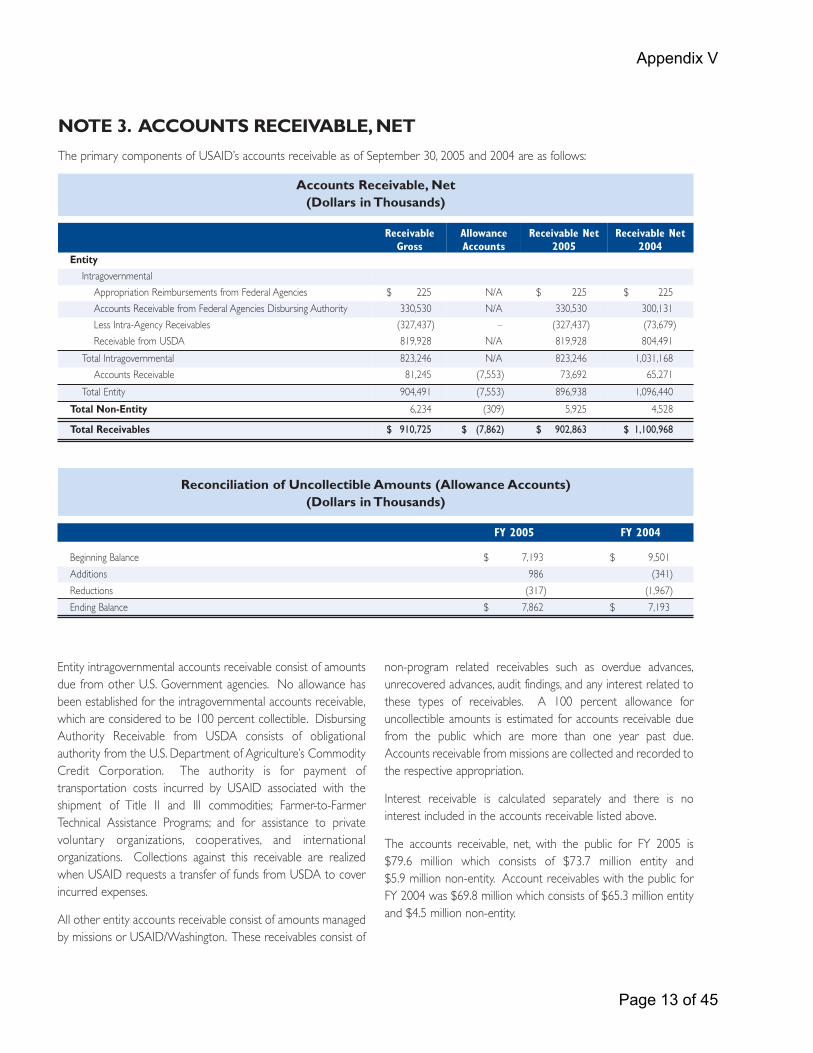
Appendix V
NOTE 3. ACCOUNTS RECEIVABLE, NET
The primary components of USAID’s accounts receivable as of September 30, 2005 and 2004 are as follows:
Accounts Receivable, Net (Dollars in Thousands)
Receivable Gross
Allowance Accounts
Receivable Net 2005
Receivable Net 2004
Entity
Intragovernmental
Appropriation Reimbursements from Federal Agencies
Accounts Receivable from Federal Agencies Disbursing Authority
Less Intra-Agency Receivables
Receivable from USDA
Total Intragovernmental
Accounts Receivable
Total Entity
Total Non-Entity
$ 225
330,530
(327,437)
819,928
823,246
81,245
904,491
6,234
N/A
N/A
–
N/A
N/A
(7,553)
(7,553)
(309)
$ 225
330,530
(327,437)
819,928
823,246
73,692
896,938
5,925
$ 225
300,131
(73,679)
804,491
1,031,168
65,271
1,096,440
4,528
Total Receivables $ 910,725 $ (7,862) $ 902,863 $ 1,100,968
Reconciliation of Uncollectible Amounts (Allowance Accounts)(Dollars in Thousands)
FY 2005 FY 2004
Beginning Balance $ 7,193 $ 9,501
Additions 986 (341)
Reductions (317) (1,967)
Ending Balance $ 7,862 $ 7,193
Entity intragovernmental accounts receivable consist of amounts due from other U.S. Government agencies. No allowance has been established for the intragovernmental accounts receivable, which are considered to be 100 percent collectible. Disbursing Authority Receivable from USDA consists of obligational authority from the U.S. Department of Agriculture’s Commodity Credit Corporation. The authority is for payment of transportation costs incurred by USAID associated with the shipment of Title II and III commodities; Farmer-to-Farmer Technical Assistance Programs; and for assistance to private voluntary organizations, cooperatives, and international organizations. Collections against this receivable are realized when USAID requests a transfer of funds from USDA to cover incurred expenses.
All other entity accounts receivable consist of amounts managed by missions or USAID/Washington. These receivables consist of
non-program related receivables such as overdue advances, unrecovered advances, audit findings, and any interest related to these types of receivables. A 100 percent allowance for uncollectible amounts is estimated for accounts receivable due from the public which are more than one year past due. Accounts receivable from missions are collected and recorded to the respective appropriation.
Interest receivable is calculated separately and there is no interest included in the accounts receivable listed above.
The accounts receivable, net, with the public for FY 2005 is $79.6 million which consists of $73.7 million entity and $5.9 million non-entity. Account receivables with the public for FY 2004 was $69.8 million which consists of $65.3 million entity and $4.5 million non-entity.
Page 13 of 45

Appendix V
NOTE 4. OTHER ASSETS
Advances and Prepayments as of September 30, 2005 and 2004 consisted of the following:
Advances and Prepayments (Dollars in Thousands)
FY 2005 FY 2004 Intragovernmental
Advances to Federal Agencies $ 30,575 $ 30,920
Total Intragovernmental 30,575 30,920
Advances to Contractors/Grantees 678,230 487,441
Travel Advances 1,431 2,480
Advances to Host Country Governments and Institutions 46,732 46,620
Prepayments 11,669 11,108
Advances, Other 11,932 12,037
Total with the Public 749,993 559,686
Total Advances and Prepayments $ 780,568 $ 590,606
Advances to Host Country Governments and Institutions educational institutions and voluntary organizations. Other represent amounts advanced by USAID missions to host country Advances consist primarily of amounts advanced for living governments and other in-country organizations, such as quarters and home service.
NOTE 5. CASH AND OTHER MONETARY ASSETS
Cash and Other Monetary Assets as of September 30, 2005 and 2004 are as follows:
Cash and Other Monetary Assets (Dollars in Thousands)
Cash and Other Monetary Assets FY 2005 FY 2004
Imprest Fund- Headquarters $ 407 $ 280
UE and Micro and Small Enterprise Fund Cash w/Fiscal Agent 50 50
Foreign Currencies 282,545 256,871
Total Cash and Other Monetary Assets $ 283,002 $ 257,201
USAID has imprest funds in various overseas locations. These funds are provided by the Department of State overseas U.S. Disbursing Officers to which USAID is liable for any shortages. USAID’s cumulative balance of the Department of State provided imprest funds was $1.5 million in FY 2005 and $4.6 million in FY 2004. These imprest funds are not included in USAID’s Balance Sheet.
Foreign Currencies are related to Foreign Currency Trust Funds and this totaled to $282.5 million in FY 2005 and $256.9 million in FY 2004. USAID does not have any non-entity cash or other monetary assets.
Page 14 of 45

Appendix V
NOTE 6. LOANS RECEIVABLE AND LIABILITIES FOR LOAN GUARANTEES
USAID operates the following loan and/or loan guarantee programs:
Direct Loan Program (Direct Loan)
Urban and Environmental Program (UE)
Micro and Small Enterprise Development Program (MSED)
Israel Loan Guarantee Program (Israel Loan)
Development Credit Authority Program (DCA)
Egypt Loan Guarantee Program
Direct loans resulting from obligations made prior to FY 1992 are reported net of allowance for estimated uncollectible loans. Estimated losses from defaults on loan guarantees resulting from obligations made prior to FY 1992 are reported as a liability.
The Credit Reform Act of 1990 prescribes an alternative method of accounting for direct loans and guarantees resulting from obligations made after FY 1991. Subsidy cost, which is the net present value of the cash flows (i.e. interest rates, interest supplements, estimated defaults, fees, and other cash flows)
associated with direct loans and guarantees, is required by the Act to be recognized as an expense in the year in which the direct loan or guarantee is disbursed. Subsidy cost is calculated by agency program offices prior to obligation using a model prescribed by the Office of Management and Budget (OMB). Subsidy relating to existing loans and guarantees is generally required to be reestimated on an annual basis to adjust for changes in risk and interest rate assumptions. Direct loans are reported net of an allowance for this subsidy cost (allowance for subsidy). The subsidy costs associated with loan guarantees are reported as loan guarantee liability.
An analysis of loans receivable, loan guarantees, liability for loan guarantees, and the nature and amounts of the subsidy costs associated with the loans and loan guarantees are provided in the following sections.
The following net loan receivable amounts are not the same as the proceeds that USAID would expect to receive from selling its loans. Actual proceeds may be higher or lower depending on the borrower and the status of the loan.
Summary of Loans Receivables, Net (Dollars in Thousands) FY 2005 FY 2004
Net Direct Loans Obligated Prior to FY 1992 (Allowance for Loss Method) $ 4,494,975 $ 5,780,367
Net Direct Loans Obligated After FY 1991 (Present Value Method) 335,572 32,248
Defaulted Guaranteed Loans from Pre-1992 Guarantees (Allowance for Loss Method) 269,702 295,637
Total Loans Receivable, Net as reported on the Balance Sheet $ 5,100,249 $ 6,108,252
DIRECT LOANS
Direct Loans (Dollars in Thousands)
Loan Programs
Loans Receivables
Gross Interest
Receivable Allowance for Loan Losses
Value of Assets Related to Direct
Loans Direct Loans Obligated Prior to FY 1992 (Allowance for Loss Method) as of September 30, 2005: Direct Loans $ 5,867,779 $ 316,253 $ 1,688,991 $ 4,495,041
MSED 643 96 805 (66)
Total $ 5,868,422 $ 316,349 $ 1,689,796 $ 4,494,975
Direct Loans Obligated Prior to FY 1992 (Allowance for Loss Method) as of September 30, 2004: Direct Loans $ 7,748,796 $ 296,481 $ 2,264,834 $ 5,780,443
MSED 677 89 842 (76)
Total $ 7,749,473 $ 296,570 $ 2,265,676 $ 5,780,367
Page 15 of 45
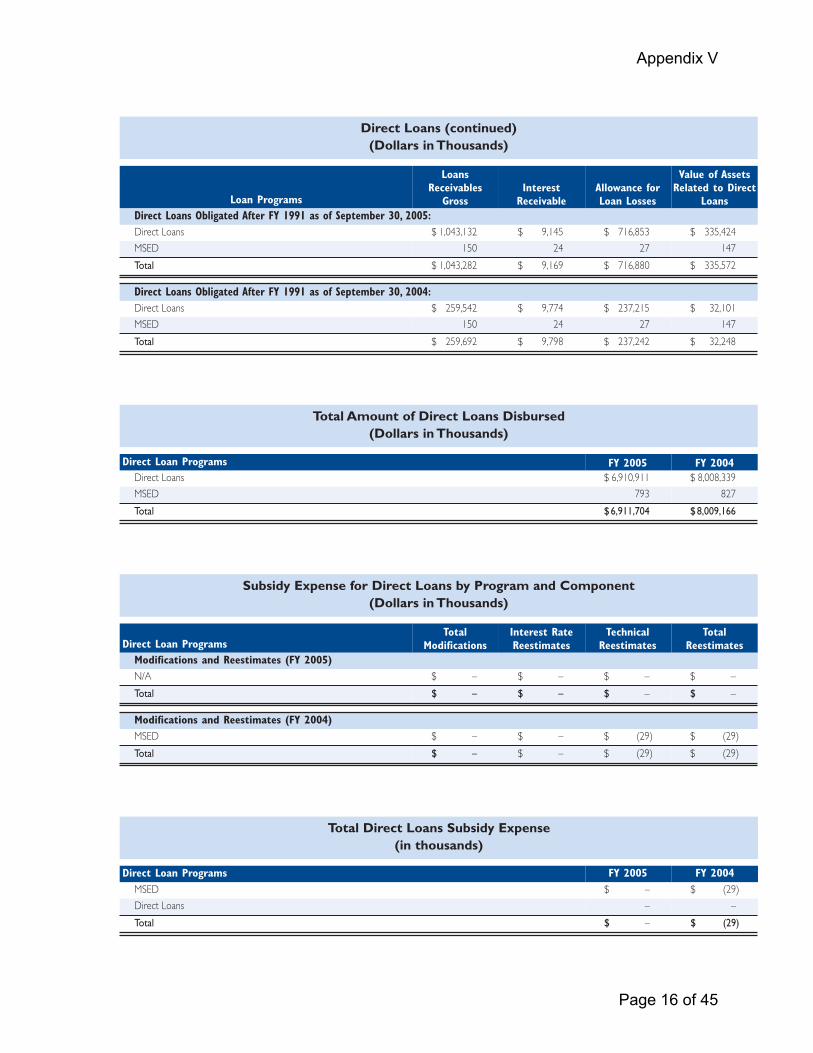
Appendix V
Direct Loans (continued) (Dollars in Thousands)
Loan Programs
Loans Receivables
Gross Interest
Receivable Allowance for Loan Losses
Value of Assets Related to Direct
Loans Direct Loans Obligated After FY 1991 as of September 30, 2005: Direct Loans $ 1,043,132 $ 9,145 $ 716,853 $ 335,424
MSED 150 24 27 147
Total $ 1,043,282 $ 9,169 $ 716,880 $ 335,572
Direct Loans Obligated After FY 1991 as of September 30, 2004: Direct Loans $ 259,542 $ 9,774 $ 237,215 $ 32,101
MSED 150 24 27 147
Total $ 259,692 $ 9,798 $ 237,242 $ 32,248
Total Amount of Direct Loans Disbursed (Dollars in Thousands)
Direct Loan Programs FY 2005 FY 2004 Direct Loans $ 6,910,911 $ 8,008,339
MSED 793 827
Total $ 6,911,704 $ 8,009,166
Subsidy Expense for Direct Loans by Program and Component (Dollars in Thousands)
Direct Loan Programs Total
Modifications Interest Rate Reestimates
Technical Reestimates
Total Reestimates
Modifications and Reestimates (FY 2005) N/A $ – $ – $ – $ –
Total $ – $ – $ – $ –
Modifications and Reestimates (FY 2004) MSED $ – $ – $ (29) $ (29)
Total $ – $ – $ (29) $ (29)
Total Direct Loans Subsidy Expense (in thousands)
Direct Loan Programs FY 2005 FY 2004 MSED $ – $ (29)
Direct Loans – –
Total $ – $ (29)
Page 16 of 45

Appendix V
Schedule for Reconciling Subsidy Cost Allowance Balances (Post-1991 Direct Loans) (Dollars in Thousandss)
FY 2005 FY 2004
Direct Loan MSED Total Direct Loan MSED Total
Beginning Balance, Changes, and Ending Balance
Beginning balance of the subsidy cost allowance $ 237,215 $ 27 $ 237,242 $ 213,993 $ 879 $ 214,872
Add: subsidy expense for direct loans disbursed during the reporting years by component:
(a) Interest rate differential costs – – – – – –
(b) Default costs (net of recoveries) – – – – – –
(c) Fees and other collections – – – – – –
(d) Other subsidy costs – – – – – –
Total of the above subsidy expense components – – – – – –
Adjustments:
(a) Loan modifications $ 480,625 $ – $ 480,625 $ – $ – $ –
(b) Fees received – – – – –
(c) Foreclosed property acquired – – – – –
(d) Loans written off – – – – – –
(e) Subsidy allowance amortization (2,874) – (2,874) 10,585 (716) 9,869
(f) Other 1,887 – 1,887 12,637 (107) 12,530
Ending balance of the subsidy cost allowance before reestimates $ 716,853 $ 27 $ 716,880 $ 237,215 $ 56 $ 237,271
Add or subtract subsidy reestimates by component:
(a) Interest rate reestimate – – – – – –
(b) Technical/default reestimate – – – – (29) (29)
Total of the above reestimate components – – – – ( 29) ( 29)
Ending balance of the subsidy cost allowance $ 716,853 $ 27 $ 716,880 $ 237,215 $ 27 $ 237,242
Defaulted Guaranteed Loans (Dollars in Thousands)
Loan Guarantee Programs
Defaulted Guaranteed
Loans Receivable, Gross
Interest Receivable
Allowance For Loan Losses
Value of Assets Related to Defaulted
Guaranteed Loans Receivable, Net
Defaulted Guaranteed Loans from Pre-1992 Guarantees (Allowance for Loss Method): FY 2005 UE $ 382,264 $ 46,915 $ 159,477 $ 269,702
Total $ 382,264 $ 46,915 $ 159,477 $ 269,702
Defaulted Guaranteed Loans from Pre-1992 Guarantees (Allowance for Loss Method): FY 2004 UE $ 452,432 $ 22,517 $ 179,312 $ 295,637
Total $ 452,432 $ 22,517 $ 179,312 $ 295,637
Page 17 of 45
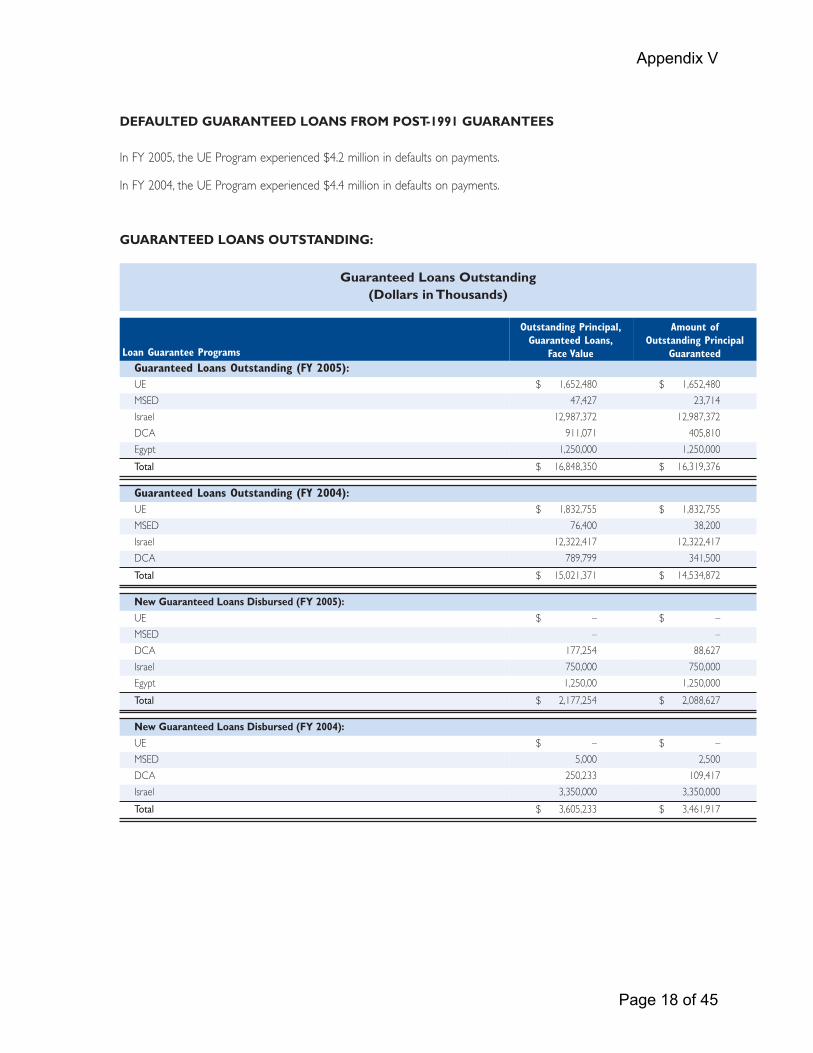
Appendix V
DEFAULTED GUARANTEED LOANS FROM POST-1991 GUARANTEES
In FY 2005, the UE Program experienced $4.2 million in defaults on payments.
In FY 2004, the UE Program experienced $4.4 million in defaults on payments.
GUARANTEED LOANS OUTSTANDING:
Guaranteed Loans Outstanding (Dollars in Thousands)
Loan Guarantee Programs
Outstanding Principal, Guaranteed Loans,
Face Value
Amount of Outstanding Principal
Guaranteed Guaranteed Loans Outstanding (FY 2005): UE $ 1,652,480 $ 1,652,480
MSED 47,427 23,714
Israel 12,987,372 12,987,372
DCA 911,071 405,810
Egypt 1,250,000 1,250,000
Total $ 16,848,350 $ 16,319,376
Guaranteed Loans Outstanding (FY 2004): UE $ 1,832,755 $ 1,832,755
MSED 76,400 38,200
Israel 12,322,417 12,322,417
DCA 789,799 341,500
Total $ 15,021,371 $ 14,534,872
New Guaranteed Loans Disbursed (FY 2005):
UE $ – $ –
MSED – –
DCA 177,254 88,627
Israel 750,000 750,000
Egypt 1,250,00 1,250,000
Total $ 2,177,254 $ 2,088,627
New Guaranteed Loans Disbursed (FY 2004):
UE $ – $ –
MSED 5,000 2,500
DCA 250,233 109,417
Israel 3,350,000 3,350,000
Total $ 3,605,233 $ 3,461,917
Page 18 of 45

Appendix V
Liability for Loan Guarantees (Dollars in Thousands)
Loan Guarantee Programs
Liabilities for Losses on Pre-1992 Guarantees,
Estimated Future Default Claims
Liabilities for Loan Guarantees for Post-1991 Guarantees,
Present Value
Total Liabilities for Loan
Guarantees Liability for Loan Guarantees (Estimated Future Default Claims for pre-1992 guarantees) as of September 30, 2005: UE $ 195,344 $ 149,557 $ 344,901
MSED – (1,811) (1,811)
Israel – 1,066,734 1,066,734
DCA –– 4,610 4,610
Egypt – 148,051 148,051
Total $ 195,344 $ 1,367,141 $ 1,562,485
Liability for Loan Guarantees (Estimated Future Default Claims for pre-1992 guarantees) as of September 30, 2004: UE $ 242,171 $ 103,788 $ 345,959
MSED – (3,902) (3,902)
Israel – 700,855 700,855
DCA – (2,975) (2,975)
Total $ 242,171 $ 797,766 $ 1,039,937
SUBSIDY EXPENSE FOR LOAN GUARANTEES BY PROGRAM AND COMPONENT:
Subsidy Expense for Loan Guarantees by Program and Component (Dollars in Thousands)
Loan Guarantee Programs Interest
Supplements Defaults
Fees and Other
Collections Other Total Subsidy Expense for New Loan Guarantees (FY 2005): DCA $ – $ 4,297 $ – $ – $ 4,297
MSED – 1,110 – – 1,110
Total $ – $ 5,407 $ – $ – $ 5,407
Subsidy Expense for New Loan Guarantees (FY 2004): DCA $ – $ 993 $ – $ – $ 993
MSED – 1,466 – – 1,466
Total $ – $ 2,459 $ – $ – $ 2,459
Page 19 of 45

Appendix V
Subsidy Expense for Loan Guarantees by Program and Component (continued) (Dollars in Thousands)
Loan Guarantee Programs Total
Modifications Interest Rate Reestimates
Technical Reestimates
Total Reestimates
Modifications and Reestimates (FY 2005): UE $ – $ – $ 532 $ 532
MSED – – – –
DCA – – 211 211
Israel – – 187,892 187,892
Egypt – – 7,335 7,335
Total $ – $ – $195,970 $195,970
Modifications and Reestimates (FY 2004): UE $ – $ – $ 2,194 $ 2,194
MSED – – 610 610
DCA – – 64 64
Total $ – $ – $ 2,868 $ 2,868
Total Loan Guarantee Subsidy Expense (Dollars in Thousands)
Loan Guarantee Programs FY 2005 FY 2004 DCA $ 4,508 $ 1,057
UE
MSED
Israel
Egypt
Total
532
1,110
187,892
7,335
$ 201,377 $
2,194
2,076
–
–
5,327
SUBSIDY RATES FOR LOAN GUARANTEES BY PROGRAM AND COMPONENT:
Budget Subsidy Rates for Loan Guarantees for the Current Year’s Cohorts (Percent)
Loan Guarantee Programs Interest
Supplements (%) Defaults (%) Fees and Other Collections (%) Other (%) Total (%)
DCA – 5,14% – – 5.14%
Page 20 of 45
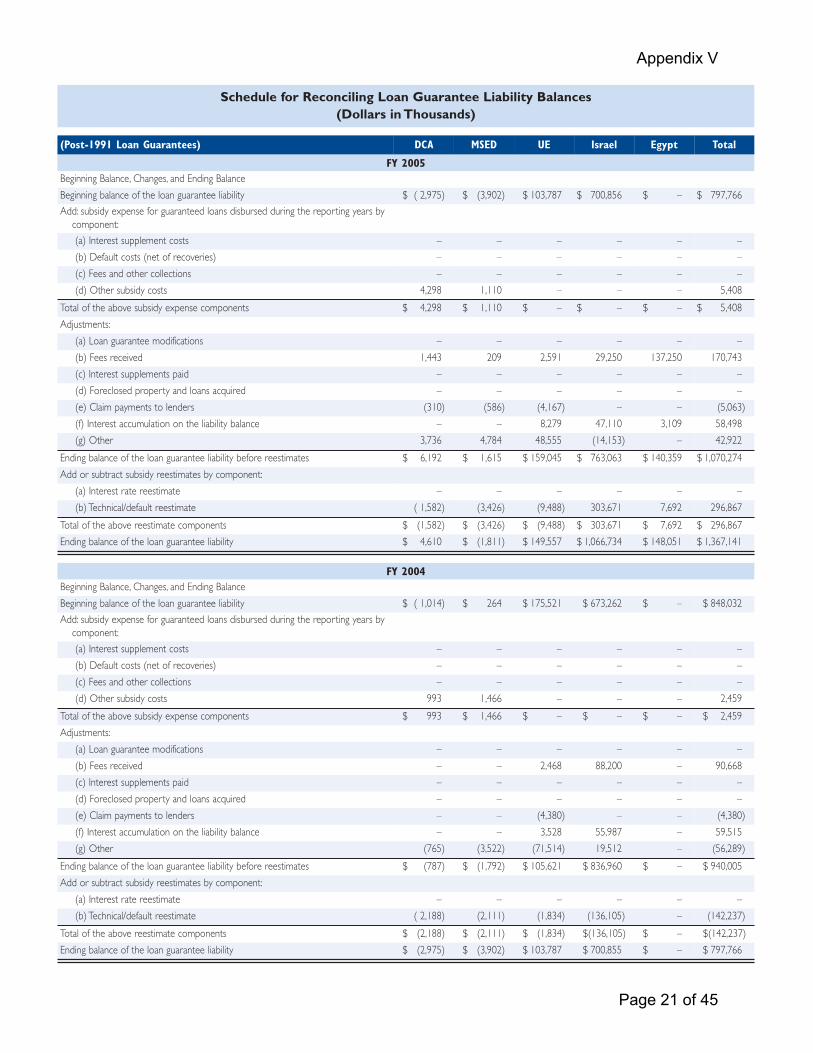
Appendix V
Schedule for Reconciling Loan Guarantee Liability Balances (Dollars in Thousands)
(Post-1991 Loan Guarantees) DCA MSED UE Israel Egypt Total
FY 2005 Beginning Balance, Changes, and Ending Balance
Beginning balance of the loan guarantee liability $ ( 2,975) $ (3,902) $ 103,787 $ 700,856 $ – $ 797,766
Add: subsidy expense for guaranteed loans disbursed during the reporting years by component:
(a) Interest supplement costs – – – – – –
(b) Default costs (net of recoveries) – – – – – –
(c) Fees and other collections – – – – – –
(d) Other subsidy costs 4,298 1,110 – – – 5,408
Total of the above subsidy expense components $ 4,298 $ 1,110 $ – $ – $ – $ 5,408
Adjustments:
(a) Loan guarantee modifications – – – – – –
(b) Fees received 1,443 209 2,591 29,250 137,250 170,743
(c) Interest supplements paid – – – – – –
(d) Foreclosed property and loans acquired – – – – – –
(e) Claim payments to lenders (310) (586) (4,167) – – (5,063)
(f) Interest accumulation on the liability balance – – 8,279 47,110 3,109 58,498
(g) Other 3,736 4,784 48,555 (14,153) – 42,922
Ending balance of the loan guarantee liability before reestimates $ 6,192 $ 1,615 $ 159,045 $ 763,063 $ 140,359 $ 1,070,274
Add or subtract subsidy reestimates by component:
(a) Interest rate reestimate – – – – – –
(b) Technical/default reestimate ( 1,582) (3,426) (9,488) 303,671 7,692 296,867
Total of the above reestimate components $ (1,582) $ (3,426) $ (9,488) $ 303,671 $ 7,692 $ 296,867
Ending balance of the loan guarantee liability $ 4,610 $ (1,811) $ 149,557 $ 1,066,734 $ 148,051 $ 1,367,141
FY 2004 Beginning Balance, Changes, and Ending Balance
Beginning balance of the loan guarantee liability $ ( 1,014) $ 264 $ 175,521 $ 673,262 $ – $ 848,032
Add: subsidy expense for guaranteed loans disbursed during the reporting years by component:
(a) Interest supplement costs – – – – – –
(b) Default costs (net of recoveries) – – – – – –
(c) Fees and other collections – – – – – –
(d) Other subsidy costs 993 1,466 – – – 2,459
Total of the above subsidy expense components $ 993 $ 1,466 $ – $ – $ – $ 2,459
Adjustments:
(a) Loan guarantee modifications – – – – – –
(b) Fees received – – 2,468 88,200 – 90,668
(c) Interest supplements paid – – – – – –
(d) Foreclosed property and loans acquired – – – – – –
(e) Claim payments to lenders – – (4,380) – – (4,380)
(f) Interest accumulation on the liability balance – – 3,528 55,987 – 59,515
(g) Other (765) (3,522) (71,514) 19,512 – (56,289)
Ending balance of the loan guarantee liability before reestimates $ (787) $ (1,792) $ 105,621 $ 836,960 $ – $ 940,005
Add or subtract subsidy reestimates by component:
(a) Interest rate reestimate – – – – – –
(b) Technical/default reestimate ( 2,188) (2,111) (1,834) (136,105) – (142,237)
Total of the above reestimate components $ (2,188) $ (2,111) $ (1,834) $(136,105) $ – $(142,237)
Ending balance of the loan guarantee liability $ (2,975) $ (3,902) $ 103,787 $ 700,855 $ – $ 797,766
Page 21 of 45

Appendix V
Administrative Expense (Dollars in Thousands)
Loan Programs FY 2005 FY 2004 DCA $ 9,615 $ 8,862
UE 217 594
MSED 2 161
Total $ 9,834 $ 9,617
OTHER INFORMATION
1. Allowance for Loss for Liquidating account (pre-Credit 2. The MSED Liquidating Account general ledger has a loan Reform Act) receivables have been calculated in accordance receivable balance of $643 thousand.This includes two loans with OMB guidance using a present value method which pending closure.These loans are being carried at 100% bad assigns risk ratings to receivables based upon the country of debt allowance. debtor. Fourteen countries are in violation of Section 620q of the Foreign Assistance Act (FAA), owing $43.6 million that is more than six months delinquent. Eleven countries are in violation of the Brooke-Alexander Amendment to the Foreign Operations Export Financing and Related Programs Appropriations Act, owing $439.9 million that is more than one year delinquent. Outstanding direct loans receivable for countries in violation of Section 620q totaled $37.2 million. Outstanding direct loans receivable for countries in violation of the Brooke Amendment totaled $421 million.
NOTE 7. INVENTORY AND RELATED PROPERTY (Dollars in Thousands)
USAID's Inventory and Related Property is comprised of Operating Materials and Supplies. Operating Materials and Supplies as of September 30, 2005 and 2004 are as follows:
FY 2005 FY 2004
Items Held for Use
Office Supplies $ 13,319 $ 7,212
Items Held in Reserve for Future Use
Disaster assistance materials and supplies
Birth control supplies
Total
9,097
21,707
$ 44,122 $
7,986
20,566
35,764
Operating Materials and Supplies are valued at historical cost and considered not held for sale.
Page 22 of 45

Appendix V
NOTE 8. GENERAL PROPERTY, PLANT AND EQUIPMENT, NET
General Property, Plant and Equipment, Net (Dollars in Thousands)
Useful Life Cost Accumulated Depreciation
Net Book Value
The components of PP&E as of September 30, 2005 are as follows: Classes of Fixed Assets
Equipment 3 to 5 years $ 76,099 $ (38,729) $ 37,370
Buildings, Improvements, & Renovations 20 years 59,221 (26,789) 32,432
Land and Land Rights N/A 4,181 – 4,181
Assets Under Capital Lease 6,365 (1,864) 4,501
Construction in Progress N/A 570 – 570
Internal Use Software 3 to 5 years 29,961 (12,843) 17,119
Total $176,396 $ (80,225) $ 96,172
The components of PP&E as of September 30, 2004 are as follows: Classes of Fixed Assets
Equipment 3 to 5 years $ 56,471 $ (25,732) $ 30,740
Buildings, Improvements, & Renovations 20 years 53,851 (24,263) 29,588
Land and Land Rights N/A 4,181 – 4,181
Assets Under Capital Lease 6,872 (1,423) 5,449
Construction in Progress N/A 570 – 570
Internal Use Software 3 to 5 years 20,328 (8,901) 11,427
Total $142,272 $ (60,317) $ 81,954
The threshold for capitalizing or amortizing assets is $25,000. Assets purchased prior to FY 2003 are depreciated using the straight line depreciation method. Assets purchased during FY 2003 and beyond are depreciated using the mid-quarter convention depreciation method. Depreciable assets are assumed to have no remaining salvage value. There are currently no restrictions on PPE assets.
USAID PP&E includes assets located in Washington, D.C. offices and overseas field Missions.
Equipment consists primarily of electric generators, ADP hardware, vehicles and copiers located at the overseas field missions.
Structures and Facilities include USAID owned office buildings and residences at foreign missions, including the land on which these structures reside. These structures are used and maintained by the field missions. USAID does not separately report the cost of the building and the land on which the building resides.
Land consists of property owned by USAID in foreign countries. Usually the land is purchased with the intention of constructing an office building at the site.
Page 23 of 45

Appendix V
NOTE 9. LEASES
Leases as of September 30, 2005 and 2004 (Dollars in Thousands)
Entity as Lessee Capital Leases: FY 2005 FY 2004 Summary of Assets Under Capital Lease:
Buildings $ 6,365 $ 6,872
Accumulated Depreciation $ 1,864 $ 1,423
Future Payments Due:
Fiscal Year Future Costs Future Costs 2005 $ – $ 785
2006 195 471
2007 165 431
2008 45 192
2009 45 164
2010 45 –
After 5 Years 158 –
Net Capital Lease Liability 653 2,043
Lease Liabilities Covered by Budgetary Resources 653 2,043
Lease Liabilities Not Covered by Budgetary Resources – –
The capital lease liability is reported on USAID's Balance Sheet under Other Liabilities.
Operating Leases: FY 2005 FY 2004 Recast Future Payments Due:
Fiscal Year Future Costs Future Costs 2005 $ – $ 76,968
2006 77,861 75,258
2007 76,467 73,798
2008 75,332 73,207
2009 74,094 70,020
2010 72,219 75,773
After 5 Years 19,515 –
Total Future Lease Payments $ 395,489 $ 445,024
Of the $395.5 million in future lease payment, $153.5 is attributable to the Ronald Regan Building. The stepped rent schedule on the Ronald Reagan Building in Washington D.C., USAID’s headquarters expired September 30, 2005. The occupancy agreement for the Ronald Reagan Building in Washington D.C will expire September 30, 2010. This building is leased by the General Services Administration (GSA). USAID is charged rent intended to approximate commercial rental rates. Lease payments for FY 2005 and 2004 amounted to $40.5 million and $39 million respectively.
In FY 2004,Total Future Lease Payments were presented in Note 9 as $203 million. Future operating lease costs for the RRB for years 2006 and beyond were not available as of year-end reporting last year and thus not included in that amount. Total Future Lease Payments for FY 2004 should have been reflected as $445 million. The amounts presented in the FY 2004 Future Costs column have been recast to reflect the $445 million.
Page 24 of 45

Appendix V
NOTE 10. ACCOUNTS PAYABLE
The Accounts Payable covered by budgetary resources as of September 30, 2005 and 2004 consisted of the following:
Accounts Payable Covered by Budgetary Resources (Dollars in Thousands)
FY 2005 FY 2004 RESTATED
Intragovernmental
Accounts Payable $ 24,226 $ 29,523
Disbursements in Transit 6 –
Total Intragovernmental 24,232 29,523
Accounts Payable 3,164,071 2,334,613
Disbursements in Transit 16,522 9,010
3,180,592 2,343,623
Total Accounts Payable $ 3,204,824 $ 2,373,146
Intragovernmental Accounts Payable are those payable to other federal agencies and consist mainly of unliquidated obligation balances related to interagency agreements between USAID and other federal agencies.
Year end accounts payable accruals were underestimated at the end of FY 2004 by about $383.1 million. Fiscal Year 2004 data has been restated to show the increase in account payables.
All other Accounts Payable represent liabilities to other non-federal entities.
NOTE 11. DEBT
USAID Intragovernmental debt as of September 30, 2005 and 2004 consisted of the following borrowings from Treasury for post1991 loan programs, which is classified as other debt:
Intragovernmental Debt as of September 30, 2005 and 2004 (Dollars in Thousands)
FY 2004 Beginning Balance
Net Borrowing
FY 2004 Ending Balance
Net Borrowing
FY 2005 Ending Balance
Urban & Environmental $ – $ – $ – $ – $ –
Direct Loan 77,981 33,100 111,081 311,521 422,602
MSED 1,184 (1,184) – – –
Total Debt $ 79,165 $ 31,916 $ 111,081 $ 311,521 $ 422,602
Pursuant to the Credit Reform Act of 1990, agencies with credit programs have permanent indefinite authority to borrow funds from the Treasury.These funds are used to disburse new direct loans to the public and, in certain situations, to cover credit reform program costs. Liquidating (pre-1992) accounts have permanent indefinite borrowing authority to be used to cover program costs when they exceed account resources. UE Program debt includes amounts borrowed before the effective date of the Credit Reform Act of 1990.
The above disclosed debt is principal payable to Treasury, which represents financing account borrowings from the Treasury under the Credit Reform Act. In addition, there is net liquidating account equity in the amount of $5.3 billion, which under the Credit Reform Act is required to be recorded as Due to Treasury. Both of these accounts are used exclusively for credit reform activity. All debt shown is intragovernmental debt.
Page 25 of 45

Appendix V
NOTE 12. OTHER LIABILITIES
As of September 30, 2005 and 2004 Other Liabilities consisted of the following:
Other Liabilities as of September 30, 2005 and 2004 (Dollars in Thousands)
FY 2005 FY 2004
Intragovernmental
OPAC Suspense
Unfunded FECA Liability
Deposit and Clearing Accounts
Credit Program Undisbursed Loans
Other
Total Intragovernmental
Accrued Funded Payroll/Benefits
Unfunded Leave
Advances From Others
$ -
7,429
-
-
23,081
30,510
13,964
33,324
7
$ -
9,529
-
207,095
203,950
420,574
11,357
29,891
-
Deferred Credit
Liability for Deposit Funds and Suspense Accounts – Non-Entity
Foreign Currency Trust Fund
Custodial Liability
Capital Lease Liability
Trust Fund Balances
Other
11,557
18,072
282,545
50
781
30,035
-
7,405
19,148
256,871
6
2,589
26,459
24
Total $ 390,335 $ 353,750
Total Other Liabilities $ 420,845 $ 774,324
All liabilities are current. Intragovernmental Liabilities represent amounts due to other federal agencies. All remaining Other Liabilities are liabilities to non-federal entities.
NOTE 13. ACCRUED UNFUNDED ANNUAL LEAVE AND SEPARATION PAY
Accrued unfunded benefits for annual leave and separation pay as of September 30, 2005 and 2004 are as indicated below.
resources. Accrued Unfunded Benefits (Dollars in Thousands)
FY 2005 FY 2004
Liabilities Not Covered by Budgetary Resources
Accrued Annual Leave $ 32,076 $ 29,882
FSN Separation Pay Liability 1,248 9
Total Accrued Unfunded Annual Leave and Separation Pay $ 33,324 $ 29,891
Page 26 of 45

Appendix V
NOTE 14. FEDERAL EMPLOYEES AND VETERAN'S BENEFITS
The provision for workers’ compensation benefits payable, as of September 30, 2005 and 2004 are as indicated below.
Accrued Unfunded Workers’ Compensation Benefits (Dollars in Thousands)
FY 2005 FY 2004
Liabilities Not Covered by Budgetary Resources
Future Workers' Compensation Benefits $ 23,726 $ 24,523
Accrued Funded Payroll and Leave 13,964 6,985
Total Accrued Unfunded Workers’ Compensation Benefits $ 37,690 $ 31,508
The Federal Employees Compensation Act (FECA) program is administered by the U.S. Department of Labor (DOL) and provides income and medical cost protection to covered Federal civilian employees who have been injured on the job or have incurred a work-related occupational disease. Compensation is given to beneficiaries of employees whose death is attributable to a job-related injury or occupational disease. DOL initially pays valid FECA claims for all Federal government agencies and seeks reimbursement two fiscal years later from the Federal agencies employing the claimants.
Estimated future FECA costs are determined by the Department of Labor. This liability is determined using a paid losses extrapolation method calculated over a 37 year period. This method utilizes historical benefit payment patterns related to a specific incurred period to predict the ultimate payments related to that period. These annual benefit payments have been discounted to present value. The interest rate assumptions used for discounting were 4.883% in year 1 and 5.235% in Year 2 and thereafter.
NOTE 15. COMMITMENTS AND CONTINGENCIES
USAID is involved in certain claims and suits, and complaints that have been filed or are pending.These matters are in the ordinary course of the Agency’s operations and are not expected to have a material adverse effect on the Agency’s financial operations.
As of September 30, 2005 a total of nine cases were pending. One case has been designated as reasonably possible.This case is a contract claim over the payment of Peruvian taxes on a building leased by USAID/Peru as mission offices.The estimated loss is over $1million.The status of the remaining litigation cases are at a remote designation.
The group of cases disclosed at the end of FY 2004, involving Negotiated Indirect Cost Rate Agreement (NICRA) rates have been dismissed in USAID’s favor.
Page 27 of 45

Appendix V
NOTE 16. LIABILITIES NOT COVERED BY BUDGETARY RESOURCES
Liabilities not covered by budgetary resources as of September 30, 2005 and 2004 are as follows:
Liabilities Not Covered by Budgetary Resources (Dollars in Thousands)
FY 2005 FY 2004
Intragovernmental
Accounts Payable $ 351,663 $ 103,202
Debt 422,602 111,081
Other 30,510 420,574
Total Intragovernmental 804,775 634,857
With The Public
Accrued unfunded annual leave and separation pay 33,324 29,891
Accrued unfunded Workers Compensation Benefits 37,690 31,508
Debt - Contingent Liabilities for Loan Guarantees 195,344 242,171
Total Liabilities not covered by Budgetary Resources 266,359 303,571
Total Liabilities covered by Budgetary Resources 10,202,446 9,492,187
Less Intra-Agency Liabilities (327,437) (73,679)
Total Liabilities $10,946,143 $10,356,936
Fiscal Year 2005 Total Liabilities covered Budgetary Resources are $10.7 billion.
Fiscal Year 2004 data presentation has been changed to comply with OMB’s Circular A-136 format. For FY 2004,Total Liabilities covered by Budgetary Resources
were $10.1 billion.
NOTE 17. INTRAGOVERNMENTAL COSTS AND EXCHANGE REVENUE The Consolidated Statement of Net Cost reports the Agency's gross costs less earned revenues to arrive at net cost of operations by strategic goals, as of September 30, 2005. These goals are consistent with USAID's Strategic Planning Framework. These goals are consistent with USAID’s Strategic Planning Framework. In FY 2005, as part of the annual certification process for mapping strategic objectives to performance goals, strategic objectives assigned to performance goals under the Public Diplomacy and Public Affairs strategic goal were reassigned to performance goals under the Regional Stability strategic goal. Thus, the Public Diplomacy goal is not effective for FY 2005 cost reporting.
Also, the format of the Consolidated Statement of Net Cost is new for FY 2005 and is consistent with OMB Circular A-136 guidance. To the extent possible, FY 2004 comparative data has been recast consistent with this format. Comparative FY 2004 data has also been restated to include the $383.1 million in expenses that were not reported in last year’s financial statements. The restatement is discussed in Note 22.
Note 17 shows the value of exchange transactions between USAID and other Federal entities as well as non-Federal entities. These are also categorized by strategic goals and responsibility segments. Responsibility Segments are defined in Note 18.
Intragovernmental costs and exchange revenue sources relate to transactions between USAID and other Federal entities. Public costs and exchange revenues on the other hand relate to transactions between USAID and non-Federal entities. The FY 2004 data reflects the $383.1 million restatement and the format is consistent with last year's Note 17. Earned revenue could not be recast by intragovernmental and with the public.
Page 28 of 45
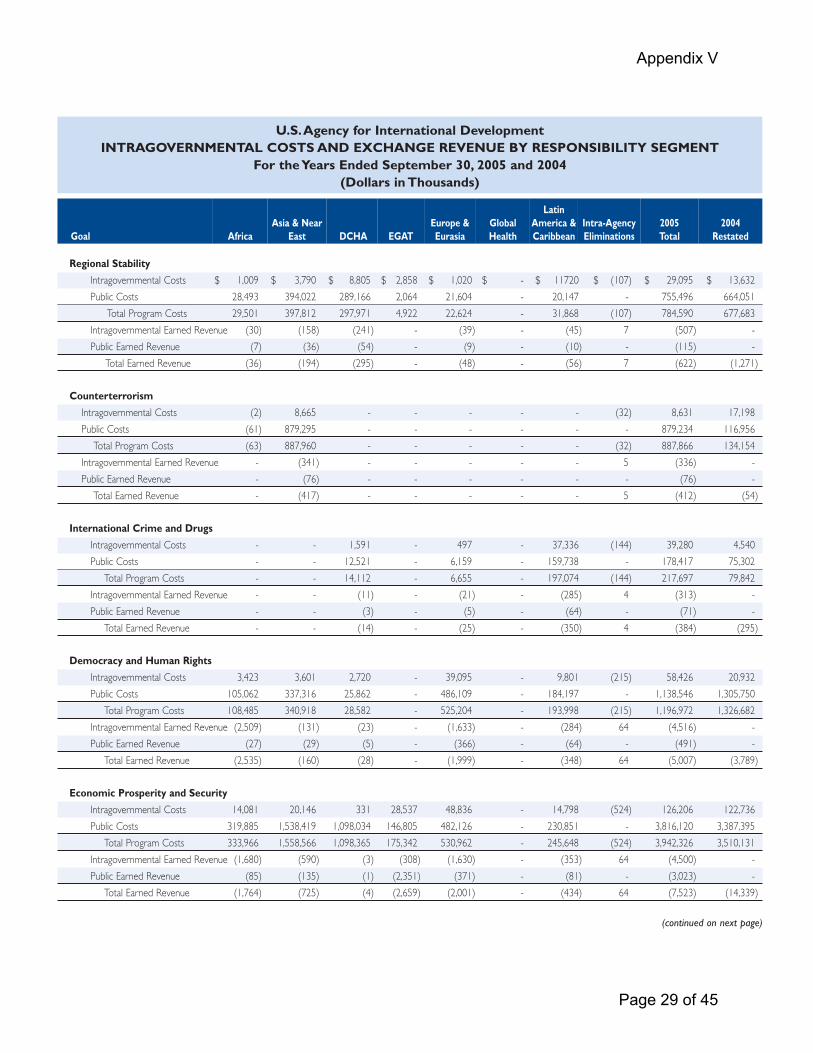
Appendix V
U.S.Agency for International DevelopmentINTRAGOVERNMENTAL COSTS AND EXCHANGE REVENUE BY RESPONSIBILITY SEGMENT
For the Years Ended September 30, 2005 and 2004(Dollars in Thousands)
Goal Africa Asia & Near
East DCHA EGAT Europe & Eurasia
Global Health
Latin America & Caribbean
Intra-Agency Eliminations
2005 Total
2004 Restated
Regional Stability
Intragovernmental Costs $ 1,009 $ 3,790 $ 8,805 $ 2,858 $ 1,020 $ - $ 11720 $ (107) $ 29,095 $ 13,632
Public Costs 28,493 394,022 289,166 2,064 21,604 - 20,147 - 755,496 664,051
Total Program Costs 29,501 397,812 297,971 4,922 22,624 - 31,868 (107) 784,590 677,683
Intragovernmental Earned Revenue (30) (158) (241) - (39) - (45) 7 (507) -
Public Earned Revenue (7) (36) (54) - (9) - (10) - (115) -
Total Earned Revenue (36) (194) (295) - (48) - (56) 7 (622) (1,271)
Counterterrorism
Intragovernmental Costs (2) 8,665 - - - - - (32) 8,631 17,198
Public Costs (61) 879,295 - - - - - - 879,234 116,956
Total Program Costs (63) 887,960 - - - - - (32) 887,866 134,154
Intragovernmental Earned Revenue - (341) - - - - - 5 (336)
Public Earned Revenue - (76) - - - - - - (76)
Total Earned Revenue - (417) - - - - - 5 (412) (54)
International Crime and Drugs
Intragovernmental Costs - - 1,591 - 497 - 37,336 (144) 39,280 4,540
Public Costs - - 12,521 - 6,159 - 159,738 - 178,417 75,302
Total Program Costs - - 14,112 - 6,655 - 197,074 (144) 217,697 79,842
Intragovernmental Earned Revenue - - (11) - (21) - (285) 4 (313)
Public Earned Revenue - - (3) - (5) - (64) - (71)
Total Earned Revenue - - (14) - (25) - (350) 4 (384) (295)
Democracy and Human Rights
Intragovernmental Costs 3,423 3,601 2,720 - 39,095 - 9,801 (215) 58,426 20,932
Public Costs 105,062 337,316 25,862 - 486,109 - 184,197 - 1,138,546 1,305,750
Total Program Costs 108,485 340,918 28,582 - 525,204 - 193,998 (215) 1,196,972 1,326,682
Intragovernmental Earned Revenue (2,509) (131) (23) - (1,633) - (284) 64 (4,516) -
Public Earned Revenue (27) (29) (5) - (366) - (64) - (491) -
Total Earned Revenue (2,535) (160) (28) - (1,999) - (348) 64 (5,007) (3,789)
Economic Prosperity and Security
Intragovernmental Costs 14,081 20,146 331 28,537 48,836 - 14,798 (524) 126,206 122,736
Public Costs 319,885 1,538,419 1,098,034 146,805 482,126 - 230,851 - 3,816,120 3,387,395
Total Program Costs 333,966 1,558,566 1,098,365 175,342 530,962 - 245,648 (524) 3,942,326 3,510,131
Intragovernmental Earned Revenue (1,680) (590) (3) (308) (1,630) - (353) 64 (4,500) -
Public Earned Revenue (85) (135) (1) (2,351) (371) - (81) - (3,023) -
Total Earned Revenue (1,764) (725) (4) (2,659) (2,001) - (434) 64 (7,523) (14,339)
(continued on next page)
Page 29 of 45

Appendix V
U.S.Agency for International DevelopmentINTRAGOVERNMENTAL COSTS AND EXCHANGE REVENUE BY RESPONSIBILITY SEGMENT (continued)
For the Years Ended September 30, 2005 and 2004(Dollars in Thousands)
Goal Africa Asia & Near
East DCHA EGAT Europe & Eurasia
Global Health
Latin America & Caribbean
Intra-Agency Eliminations
2005 Total
2004 Restated
Social and Environmental Issues
Intragovernmental Costs 51,480 19,111 - 43,230 23,521 32,111 20,262 (609) 189,105 369,840
Public Costs 886,707 1,166,285 285 129,625 229,869 1,338,976 356,512 - 4,108,261 4165,481
Total Program Costs 938,187 1,185,396 285 172,855 253,390 1,371,087 376,774 (609) 4,297,366 4,535,321
Intragovernmental Earned Revenue (1,049) (435) - (11,834) (781) (43,225) (552) 811 (57,065) -
Public Earned Revenue (239) (99) - (8,726) (178) (93) (126) - (9,461) -
Total Earned Revenue (1,288) (534) - (20,560) (959) (43,319) (678) 811 (66,526) (66,842)
Humanitarian Response
Intragovernmental Costs 2,722 1,516 46,390 - 4,013 - 5,250 (219) 59,672 180,203
Public Costs 63,964 64,311 369,250 461,354 49,769 - 120,135 - 1,128,782 562,240
Total Program Costs 66,686 65,827 415,640 461,354 53,783 - 125,384 (219) 1,188,454 742,443
Intragovernmental Earned Revenue (61) (9) (334) (64,489) (167) - (184) 914 (64,329) -
Public Earned Revenue (14) (2) (76) (129,319) (38) - (42) - (129,491) -
Total Earned Revenue (75) (11) (410) (193,807) (205) - (226) 914 (193,820) (66,133)
Management and Organizational Excellence
Intragovernmental Costs 637 - - 5,092 - - - (21) 5,709 5,581
Public Costs 646 - - 8,332 - - - - 8,978 42,490
Total Program Costs 1,283 - - 13,424 - - - (21) 14,686 48,071
Intragovernmental Earned Revenue
Public Earned Revenue
(1)
-
-
-
-
-
(29)
(7)
-
-
-
-
-
-
-
-
(30)
(7)
-
-
Total Earned Revenue (2) - - (36) - - - - (37) (424)
Public Diplomacy and Public Affairs
Intragovernmental Costs - - - - - - - - - 157
Public Costs - - - - - - - - - 35,567
Total Program Costs - - - - - - - - - 35,724
Intragovernmental Earned Revenue - - - - - - - - -
Public Earned Revenue - - - - - - - - -
Total Earned Revenue - - - - - - - - - (177)
Net Costs of Operations $1,472,345 $4,434,437 $1,854,204 $610,835 $1,387,382 $1,327,768 $1,168,655 $ - $12,255,626 $10,936,727
Note:The Total Earned Revenue by strategic goals on Notes 17 and 18 are slightly off from the Consolidated and Consolidating Statement of Net Cost. Some public earned revenue could not be mapped to a specific goal. Since the amount was immaterial, it was allocated amongst the goals with the largest amounts of public earned revenue i.e., Economic Prosperity and Security, Social and Environmental Issues and Humanitarian Response. Pre-allocatoin, these goals collectively made up approximately 99% of the Total Public Earned revenue.
Page 30 of 45
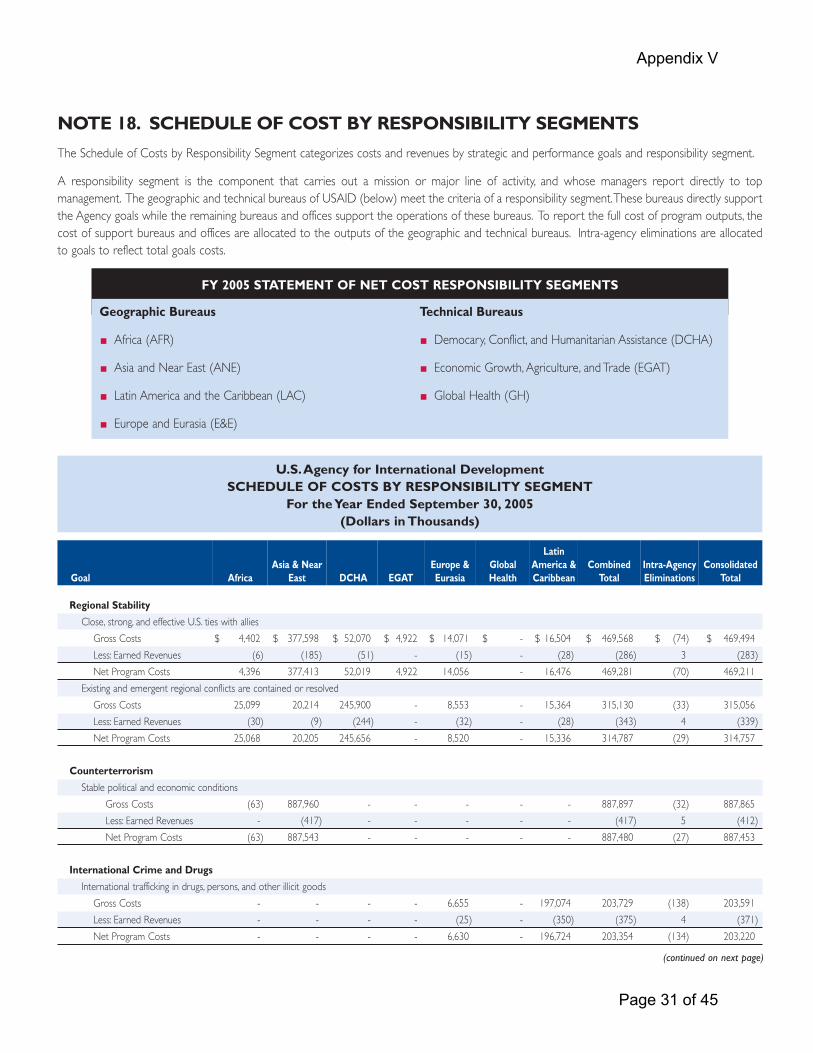
Appendix V
NOTE 18. SCHEDULE OF COST BY RESPONSIBILITY SEGMENTS
The Schedule of Costs by Responsibility Segment categorizes costs and revenues by strategic and performance goals and responsibility segment.
A responsibility segment is the component that carries out a mission or major line of activity, and whose managers report directly to top management. The geographic and technical bureaus of USAID (below) meet the criteria of a responsibility segment.These bureaus directly support the Agency goals while the remaining bureaus and offices support the operations of these bureaus. To report the full cost of program outputs, the cost of support bureaus and offices are allocated to the outputs of the geographic and technical bureaus. Intra-agency eliminations are allocated to goals to reflect total goals costs.
FY 2005 STATEMENT OF NET COST RESPONSIBILITY SEGMENTS
Geographic Bureaus
Africa (AFR)
Asia and Near East (ANE)
Latin America and the Caribbean (LAC)
Europe and Eurasia (E&E)
Technical Bureaus
Democary, Conflict, and Humanitarian Assistance (DCHA)
Economic Growth, Agriculture, and Trade (EGAT)
Global Health (GH)
U.S.Agency for International DevelopmentSCHEDULE OF COSTS BY RESPONSIBILITY SEGMENT
For the Year Ended September 30, 2005(Dollars in Thousands)
Goal Africa Asia & Near
East DCHA EGAT Europe & Eurasia
Global Health
Latin America & Caribbean
Combined Total
Intra-Agency Eliminations
Consolidated Total
Regional Stability
Close, strong, and effective U.S. ties with allies
Gross Costs $ 4,402 $ 377,598 $ 52,070 $ 4,922 $ 14,071 $ - $ 16,504 $ 469,568 $ (74) $ 469,494
Less: Earned Revenues (6) (185) (51) - (15) - (28) (286) 3 (283)
Net Program Costs 4,396 377,413 52,019 4,922 14,056 - 16,476 469,281 (70) 469,211
Existing and emergent regional conflicts are contained or resolved
Gross Costs 25,099 20,214 245,900 - 8,553 - 15,364 315,130 (33) 315,056
Less: Earned Revenues (30) (9) (244) - (32) - (28) (343) 4 (339)
Net Program Costs 25,068 20,205 245,656 - 8,520 - 15,336 314,787 (29) 314,757
Counterterrorism
Stable political and economic conditions
Gross Costs (63) 887,960 - - - - - 887,897 (32) 887,865
Less: Earned Revenues - (417) - - - - - (417) 5 (412)
Net Program Costs (63) 887,543 - - - - - 887,480 (27) 887,453
International Crime and Drugs
International trafficking in drugs, persons, and other illicit goods
Gross Costs - - - - 6,655 - 197,074 203,729 (138) 203,591
Less: Earned Revenues - - - - (25) - (350) (375) 4 (371)
Net Program Costs - - - - 6,630 - 196,724 203,354 (134) 203,220
(continued on next page)
Page 31 of 45

Appendix V
U.S.Agency for International DevelopmentSCHEDULE OF COSTS BY RESPONSIBILITY SEGMENT (continued)
For the Year Ended September 30, 2005(Dollars in Thousands)
Goal Africa Asia & Near
East DCHA EGAT Europe & Eurasia
Global Health
Latin America & Caribbean
Combined Total
Intra-Agency Eliminations
Consolidated Total
International Crime and Drugs (continued)
States cooperate internationally to set and implement anti-drug and anti-crime standards, share financial and political burdens
Gross Costs - - 14,112 - - - - 14,112 (6) 14,106
Less: Earned Revenues - - (14) - - - - (14) - (14)
Net Program Costs - - 14,098 - - - - 14,098 (6) 14,092
Democracy and Human Rights
Develop transparent and accountable democratic institutions
Gross Costs 108,485 333,991 23,521 - 525,204 - 182,908 1,174,109 (211) 1,173,898
Less: Earned Revenues (2,535) (157) (23) - (1,999) - (328) (5,043) 64 (4,979)
Net Program Costs 105,950 333,833 23,498 - 523,205 - 182,580 1,169,066 (147) 1,168,919
Universal standards protect human rights
Gross Costs - 6,927 5,061 - - - 11,090 23,078 (4) 23,074
Less: Earned Revenues - (3) (5) - - - (20) (28) - (28)
Net Program Costs - 6,924 5,056 - - - 11,070 23,050 (4) 23,046
Economic Prosperity and Security
Enhanced food security and agricultural development
Gross Costs 224,083 35,863 1,098,365 72,320 - - 71,462 1,502,093 (76) 1,502,017
Less: Earned Revenues (307) (19) (4) (202) - - (130) (661) 7 (654)
Net Program Costs 223,777 35,844 1,098,361 72,117 - - 71,332 1,501,432 (69) 1,501,363
Increased trade and investment
Gross Costs 71,507 369,911 - 14,343 - - 58,667 514,428 (49) 514,380
Less: Earned Revenues (1,405) (182) - (38) - - (105) (1,730) 23 ( 1,707)
Net Program Costs 70,102 369,729 - 14,306 - - 58,561 512,698 (25) 512,673
Institutions, laws, and policies foster private sector led growth
Gross Costs 38,375 975,242 - 77,455 457,304 - 114,675 1,663,051 (349) 1,662,702
Less: Earned Revenues (52) (460) - (2,419) (1,722) - (198) (4,850) 30 (4,820)
Net Program Costs 38,323 974,782 - 75,036 455,582 - 114,478 1,658,201 (319) 1,657,882
Secure and stable financial and energy markets
Gross Costs - 177,550 - 11,224 73,659 - 844 263,277 (50) 263,227
Less: Earned Revenues - (64) - - (279) - (1) (345) 4 ( 341)
Net Program Costs - 177,486 - 11,224 73,379 - 843 262,932 (46) 262,887
Social and Environmental Issues
Broader access to quality education with an emphasis on primary school completion
Gross Costs 145,331 320,081 - 13,939 17,163 - 50,147 546,661 (101) 546,560
Less: Earned Revenues (197) (148) - (37) (64) - (90) (536) 6 ( 530)
Net Program Costs 145,133 319,933 - 13,903 17,099 - 50,056 546,125 (95) 546,030
(continued on next page)
Page 32 of 45

Appendix V
U.S.Agency for International DevelopmentSCHEDULE OF COSTS BY RESPONSIBILITY SEGMENT (continued)
For the Year Ended September 30, 2005(Dollars in Thousands)
Goal Africa Asia & Near
East DCHA EGAT Europe & Eurasia
Global Health
Latin America & Caribbean
Combined Total
Intra-Agency Eliminations
Consolidated Total
Social and Environmental Issues (continued)
Improved global health
Gross Costs 741,509 644,726 285 - 186,977 1,371,087 252,312 3,196,895 (391) 3,196,504
Less: Earned Revenues (1,021) (307) - - (710) (43,319) (455) (45,799) 635 ( 45,164)
Net Program Costs 740,488 644,419 285 - 186,267 1,327,768 251,857 3,151,096 243 3,151,340
Partnerships, initiatives, and implemented international treaties
Gross Costs 51,348 220,589 - 158,916 49,251 - 74,316 554,419 (118) 554,301
Less: Earned Revenues (70) (79) - (20,523) (185) - (133) (20,851) 171 (20,680)
Net Program Costs 51,278 220,509 - 138,392 49,066 - 74,183 533,568 53 553,621
Humanitarian Response
Effective protection, assistance, and durable solutions for refugees
Gross Costs 58,626 46,102 398,844 - 46,321 - 45,505 595,398 (182) 595,216
Less: Earned Revenues (66) (1) (392) - (176) - (82) (718) 8 (710)
Net Program Costs 58,560 46,101 398,452 - 46,144 - 45,423 594,680 (174) 594,506
Improved capacity of host countries to reduce vulnerabilities to disasters
Gross Costs 8,060 19,725 16,796 461,354 7,462 - 79,880 593,276 (37) 593,238
Less: Earned Revenues (10) (9) (17) (193,809) (28) - (143) (191,945) 906 (191,039)
Net Program Costs 8,051 19,715 16,778 267,545 7,433 - 79,736 401,330 869 402,199
Management and Organizational Excellence
A high performing, well-trained, and diverse workforce
Gross Costs - - - 10,682 - - - 10,682 (12) 10,670
Less: Earned Revenues - - - (28) - - - (28) 1 (27)
Net Program Costs - - - 10,653 - - - 10,653 (11) 10,643
Customer-oriented, innovative delivery of administrative and information services
Gross Costs - - - 594 - - - 594 (2) 592
Less: Earned Revenues - - - (2) - - - (2) - (2)
Net Program Costs - - - 592 - - - 592 (2) 590
Integrated budgeting, planning, and performance management; effective financial management; and demonstrated financial accountability.
Gross Costs - - - 2,149 - - - 2,149 (5) 2,144
Less: Earned Revenues - - - (6) - - - (6) - (6)
Net Program Costs - - - 2,143 - - - 2,143 (5) 2,138
Modernized, secure, and high quality information technology management and infrastructure that meet critical business requirements.
Gross Costs 1,283 - - - - - - 1,283 (2) 1,281
Less: Earned Revenues (2) - - - - - - (2) - ( 2)
Net Program Costs 1,281 - - - - - - 1,281 (2) 1,279
Public Diplomacy and Public Affairs
American understanding and support for U.S. foreign policy
Gross Costs - - - - - - - - - -
Less: Earned Revenues - - - - - - - - - -
Net Program Costs
Net Costs of Operations $ 1,472,345 $ 4,434,437 $1,854,204 $610,834 $1,387,382 $1,327,768 $1,168,655 $12,255,626 $ - $12,255,626
Note:The Total Earned Revenue by strategic goals on Notes 17 and 18 are slightly off from the Consolidated and Consolidating Statement of Net Cost. Some public earned revenue could not be mapped to a specific goal. Since the amount was immaterial, it was allocated amongst the goals with the largest amounts of public earned revenue i.e., Economic Prosperity and Security, Social and Environmental Issues and Humanitarian Response. Pre-allocatoin, these goals collectively made up approximately 99% of the Total Public Earned revenue.
Page 33 of 45
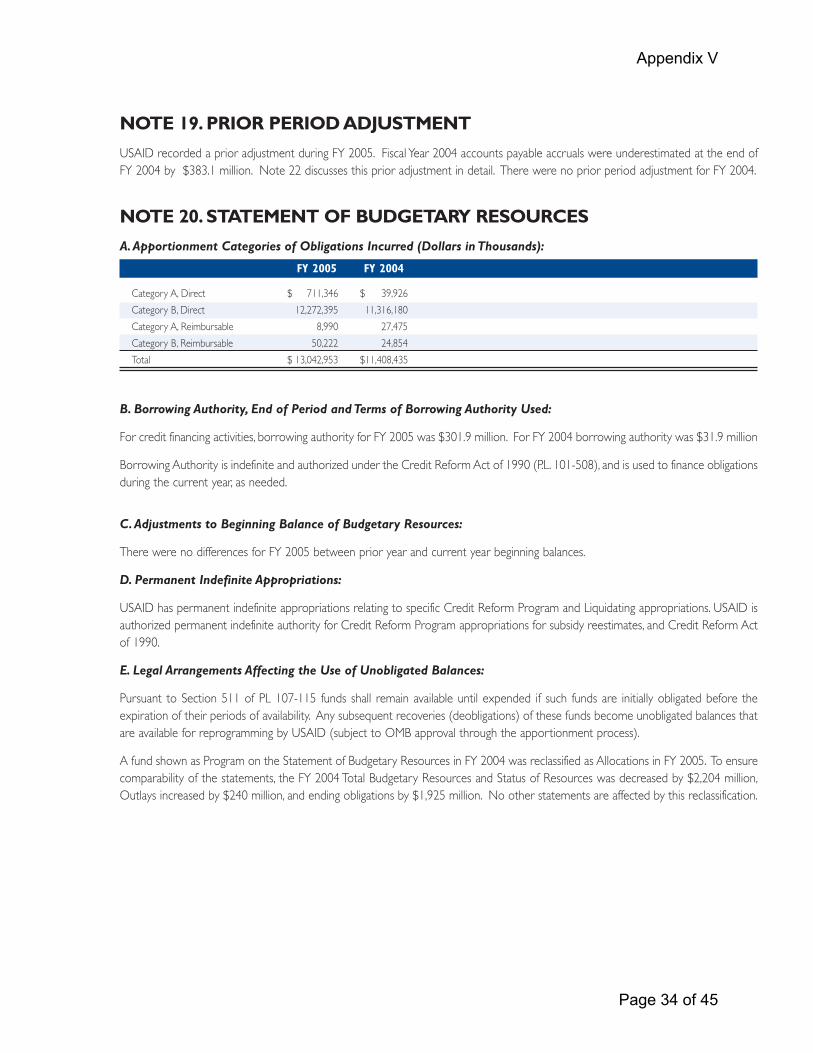
Appendix V
NOTE 19. PRIOR PERIOD ADJUSTMENT
USAID recorded a prior adjustment during FY 2005. Fiscal Year 2004 accounts payable accruals were underestimated at the end of FY 2004 by $383.1 million. Note 22 discusses this prior adjustment in detail. There were no prior period adjustment for FY 2004.
NOTE 20. STATEMENT OF BUDGETARY RESOURCES
A.Apportionment Categories of Obligations Incurred (Dollars in Thousands):
FY 2005 FY 2004
Category A, Direct $ 711,346 $ 39,926
Category B, Direct 12,272,395 11,316,180
Category A, Reimbursable 8,990 27,475
Category B, Reimbursable 50,222 24,854
Total $ 13,042,953 $11,408,435
B. Borrowing Authority, End of Period and Terms of Borrowing Authority Used:
For credit financing activities, borrowing authority for FY 2005 was $301.9 million. For FY 2004 borrowing authority was $31.9 million
Borrowing Authority is indefinite and authorized under the Credit Reform Act of 1990 (P.L. 101-508), and is used to finance obligations during the current year, as needed.
C.Adjustments to Beginning Balance of Budgetary Resources:
There were no differences for FY 2005 between prior year and current year beginning balances.
D. Permanent Indefinite Appropriations:
USAID has permanent indefinite appropriations relating to specific Credit Reform Program and Liquidating appropriations. USAID is authorized permanent indefinite authority for Credit Reform Program appropriations for subsidy reestimates, and Credit Reform Act of 1990.
E. Legal Arrangements Affecting the Use of Unobligated Balances:
Pursuant to Section 511 of PL 107-115 funds shall remain available until expended if such funds are initially obligated before the expiration of their periods of availability. Any subsequent recoveries (deobligations) of these funds become unobligated balances that are available for reprogramming by USAID (subject to OMB approval through the apportionment process).
A fund shown as Program on the Statement of Budgetary Resources in FY 2004 was reclassified as Allocations in FY 2005. To ensure comparability of the statements, the FY 2004 Total Budgetary Resources and Status of Resources was decreased by $2,204 million, Outlays increased by $240 million, and ending obligations by $1,925 million. No other statements are affected by this reclassification.
Page 34 of 45
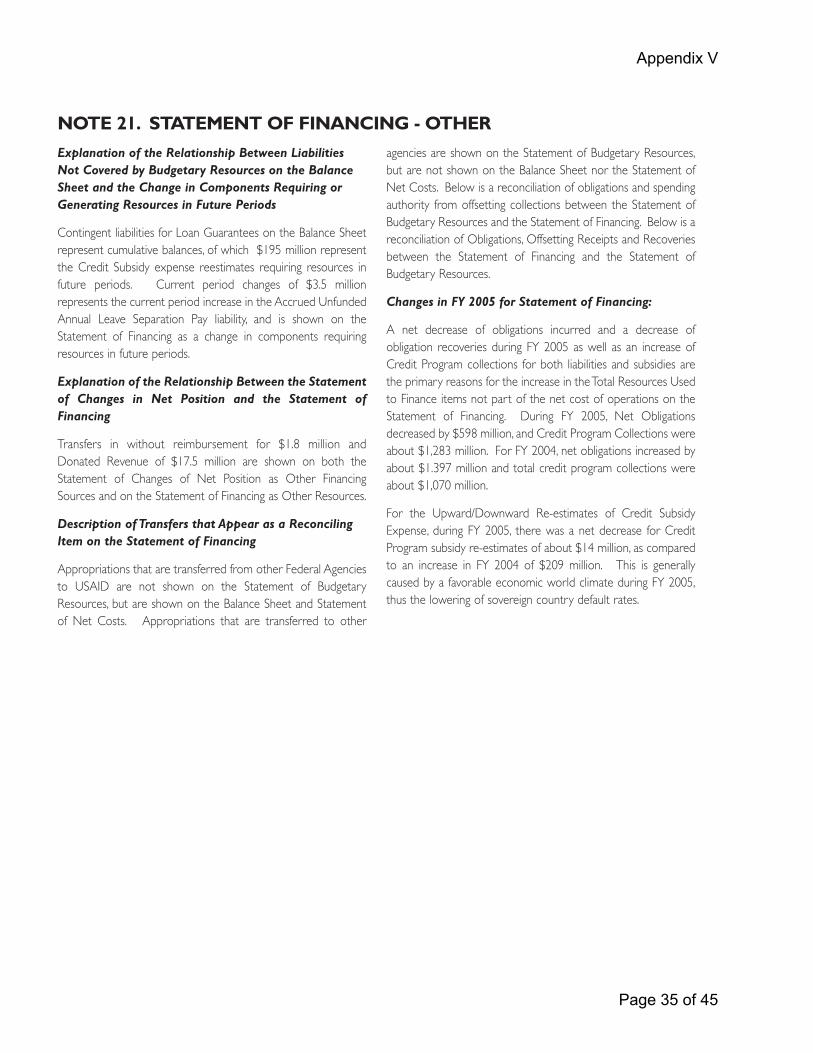
Appendix V
NOTE 21. STATEMENT OF FINANCING - OTHER
Explanation of the Relationship Between Liabilities Not Covered by Budgetary Resources on the Balance Sheet and the Change in Components Requiring or Generating Resources in Future Periods
Contingent liabilities for Loan Guarantees on the Balance Sheet represent cumulative balances, of which $195 million represent the Credit Subsidy expense reestimates requiring resources in future periods. Current period changes of $3.5 million represents the current period increase in the Accrued Unfunded Annual Leave Separation Pay liability, and is shown on the Statement of Financing as a change in components requiring resources in future periods.
Explanation of the Relationship Between the Statement of Changes in Net Position and the Statement of Financing
Transfers in without reimbursement for $1.8 million and Donated Revenue of $17.5 million are shown on both the Statement of Changes of Net Position as Other Financing Sources and on the Statement of Financing as Other Resources.
Description of Transfers that Appear as a Reconciling Item on the Statement of Financing
Appropriations that are transferred from other Federal Agencies to USAID are not shown on the Statement of Budgetary Resources, but are shown on the Balance Sheet and Statement of Net Costs. Appropriations that are transferred to other
agencies are shown on the Statement of Budgetary Resources, but are not shown on the Balance Sheet nor the Statement of Net Costs. Below is a reconciliation of obligations and spending authority from offsetting collections between the Statement of Budgetary Resources and the Statement of Financing. Below is a reconciliation of Obligations, Offsetting Receipts and Recoveries between the Statement of Financing and the Statement of Budgetary Resources.
Changes in FY 2005 for Statement of Financing:
A net decrease of obligations incurred and a decrease of obligation recoveries during FY 2005 as well as an increase of Credit Program collections for both liabilities and subsidies are the primary reasons for the increase in the Total Resources Used to Finance items not part of the net cost of operations on the Statement of Financing. During FY 2005, Net Obligations decreased by $598 million, and Credit Program Collections were about $1,283 million. For FY 2004, net obligations increased by about $1.397 million and total credit program collections were about $1,070 million.
For the Upward/Downward Re-estimates of Credit Subsidy Expense, during FY 2005, there was a net decrease for Credit Program subsidy re-estimates of about $14 million, as compared to an increase in FY 2004 of $209 million. This is generally caused by a favorable economic world climate during FY 2005, thus the lowering of sovereign country default rates.
Page 35 of 45

Appendix V
Explanation of the Relationship Between Liabilities Not Covered by Budgetary Resources on the Balance Sheet and the Change in Components Requiring or Generating Resources in Future Periods
(Dollars in Thousands)
Obligations Incurred, Statement of Budgetary Resources $10,525,521
Less: Transfers to Other Agencies
Department Of State (685,344)
Department of Agriculture (4,996)
Nuclear Regulatory Commission (2,188)
Department of Energy (1,440)
Others (1,863) (695,831)
Add: Transfers from Other Agencies
Department of Agriculture 1,247,800
Department of State 947,226
Executive Office of the President 983,491
Other 34,746 3,213,263
Obligations Incurred, Statement of Financing 13,042,953
Offsetting Collections and Recoveries, Statement of Budgetary Resources 3,006,709
Less: Transfers to Other Agencies
Department of State (7,695)
U.S.Treasury Department (999,389)
Department of Agriculture (3,063)
Other (125) (1,010,272)
Add: Allocations from Other Agencies
Executive Office of the President 232,897
Department of Agriculture 96,412
Other 236 329,545
Offsetting Collections and Recoveries, Statement of Financing $ 2,325,982
NOTE 22. RESTATEMENT Year end accounts payable accruals were underestimated at the end of FY 2004 by about $383.1 million. Because of this error, the following statements and affected line items were restated, as indicated below, by the $383.1 million:
Balance Sheet: Increase in Accounts Payable to the Public; and Decrease in Unexpended Appropriations.
Statement of Changes in Net Position: Increase in Appropriations Used, Cumulative Results of Operations; and Decrease in Appropriations Used, Unexpended Appropriations.
Statement of Net Costs: Increase in Expenses.
Statement of Financing: Increase in Change in Budgetary Resources Obligated for Goods, Services and Benefits Ordered, but not yet Provided.
This change to the FY 2004 statements also resulted in a reduction of the FY 2004 year ending balance in Unexpended Appropriations. To correctly show the FY 2005 beginning balance, a prior period correcting entry was made in FY 2005 to reduce the beginning balance of Unexpended Appropriations and corresponding expenses for $383.1 million. This adjustment was made per the Treasury USSGL guidelines.
Page 36 of 45

Appendix V
INTRAGOVERNMENTAL ASSETS:
Agency Fund Balance with Treasury
Accounts Receivable, Net
Advances and Prepayments Totals
Treasury $ 17,503,843 $ – $ - $ 17,503,843
Dept of Agriculture – 819,928 3,026 822,954
Dept of Commerce – – 532 532
Dept of State – – 18,197 18,197
Other – 3,005 8,821 11,826
Total $ 17,503,843 $ 822,934 $ 30,575 $ 18,357,352
INTRAGOVERNMENTAL LIABILITIES:
Agency Due to
Treasury Accounts Payable Debt Other Totals
Treasury $ 5,311,661 $ 3,259 $ 422,602 $ 12,546 $ 5,750,068
GSA – 9,730 – – 9,730
Dept of Agriculture – 4,285 – – 4,285
Dept of Labor – (2,814) – – (2,814)
Dept of Health and Human Services – 7,830 – – 7,830
Other – 1,941 – 17,964 19,905
Total $ 5,311,661 $ 24,232 $ 422,602 $ 30,510 $ 5,789,005
INTRAGOVERNMENTAL EARNED REVENUES AND RELATED COSTS:
USAID's intragovernmental earned revenues are not greater than $500 million. As such, intragovernmental earned revenues and related costs by trading partner are not required to be reported.
Page 37 of 45

Appendix V
U.S.Agency for International DevelopmentREQUIRED SUPPLEMENTARY INFORMATION: SCHEDULE OF BUDGETARY RESOURCES
For the period ended September 30, 2005
Operating Program Credit-
Financing Other
Alocations to Other
Agencies Consolidated
Total
1000 1010 1021 1029 1035 1037 1093 1095
Budgetary Resources
Budget Authority
Appropriations Received $642,400 $396,600 $1,460,000 $656,000 $578,000 $42,500 $630,994 $1,550,000 $ – $ 4,152,556 $ 7,535 $10,116,585
Borrowing Authority (Note 20) – – – – – – – – 310,947 – 2,000 312,947
Net Transfers 1,969 (142,482) (3,110) (183,919) 30,603 – (160,033) 30,989 – 775,202 241,300 590,519
Other – – – – – – – – – – – –
Total Budget Authority 644,369 254,118 1,456,890 472,081 608,603 42,500 470,961 1,580,989 310,947 4,927,758 250,835 11,020,051
Unobligated Balance:
Beginning of Period 71,106 95,440 55,721 – 201,168 – 145,304 238,910 1,001,713 1,205,208 423,168 3,439,036
Net Transfers, Actual – – – – – – – – – 656 (864,907) (864,251)
Total Unobligated Balance 71,106 95,440 55,721 – 201,168 – 145,304 238,910 1,001,713 1,207,162 (441,739) 2,574,785
Spending Authority from Offsetting Collections:
Earned
Collected 5,260 6 1,576 – 2,221 – 1,810 4,667 558,897 1,288,903 1,501 1,864,841
Receivable from Federal Sources – – – – – – – – – – 351 351
Change in Unfilled Customer Orders
Advance Received – – – – – – – – – – –
Anticipated for Rest of Year, Without Advances 2,064 – 279 – 489 – – – – 189 – 3,021
Subtotal 7,324 6 1,855 – 2,710 – 1,810 4,667 558,897 1,289,092 1,852 1,868,213
Recoveries of Prior-Year Obligations 14,664 9,996 17,626 – 15,754 – 47,372 2,554 – 22,110 1,008,420 1,138,496
Permanently Not Available (5,393) (3,637) (11,711) – (3,104) – (4,730) (12,400) – (1,738,284) – (1,779,259)
Total Budgetary Resources 732,070 355,923 1,520,381 472,081 825,131 42,500 660,717 1,814,720 1,871,557 5,707,838 819,368 14,822,286
Status of Budgetary Resources:
Obligations Incurred (Note 20):
Direct 672,791 284,525 1,387,550 437,767 745,707 42,500 481,988 1,616,947 709,517 3,391,186 695,831 10,466,309
Reimbursible 7,323 6 1,855 – 2,710 – 1,810 4,667 – 40,841 – 59,212
Subtotal 680,114 284,531 1,389,405 437,767 748,417 42,500 483,798 1,621,614 709,517 3,432,027 695,831 10,525,521
Unobligated Balances - Available 51,236 70,872 129,809 34,314 76,271 – 176,857 193,110 1,162,040 2,271,956 120,731 4,287,196
Unobligated Balances - Unavailable 720 520 1,167 – 443 – 62 (4) – 3,855 2,806 9,569
Total, Status of Budgetary Resources 732,070 355,923 1,520,381 472,081 825,131 42,500 660,717 1,814,720 1,871,557 5,707,838 819,368 14,822,286
Relationship of Obligations to Outlays: Obligated Balance, Net,
Beginning of Period (Note 20) 164,482 452,415 2,630,507 – 379,666 – 544,004 2,073,456 11,031 3,312,583 1,267,439 10,835,583
Obligated Balance,Transferred, Net – – – – – – – – – – – –
Obligated Balance, Net, End of Period Accounts Receivable (225) – – – – – – – – (3,467) – (3,692)
Unfilled Customer Orders From Federal Sources (3,955) – (279) – (489) – – – – (2,891) – (7,614)
Undelivered Orders (35,560) 105,350 1,910,639 432,078 355,589 – 314,452 1,603,568 2,768 3,194,628 3,528 7,887,040
Accounts Payable 226,368 148,146 575,132 1,816 275,245 – 235,947 365,919 520 574,185 – 2,403,278
Outlays:
Disbursements 641,239 473,453 1,516,515 3,873 481,496 42,500 430,031 1,723,028 717,260 2,959,856 3,528 8,992,779
Collections (5,260) (6) (1,576) – (2,221) – (1,810) (4,667) (558,897) (1,288,903) – (1,863,340)
Subtotal 635,979 473,447 1,514,939 3,873 479,275 42,500 428,221 1,718,361 158,363 1,670,953 3,528 7,129,439
Less: Offsetting Receipts – – – – – – – – – (195,568) – (195,568)
Net Outlays $635,979 $473,447 $1,514,939 $ 3,873 $479,275 $42,500 $428,221 $1,718,361 $ 158,363 $ 1,475,385 $ 3,528 $ 6,933,871
Page 38 of 45

Appendix V
MAJOR FUNDS OTHER FUNDS OTHER FUNDS (continued)
Operating Funds Operating Funds Credit Program Funds 1000 Operating Expenses of USAID 1007 Operating Expenses of USAID Inspector General 0400 MSED Program Fund Program Funds 1036 Foreign Service Retirement and Disability Fund 0401 UE Program Fund 1010 Special Assistance Initiatives Program Funds 0402 Ukraine Program Fund 1021 Development Assistance 1012 Sahel Development Program 1264 DCA Program Fund 1029 Tsunami Relief and Reconstruction Fund 1014 Africa Development Assistance 4103 Economic Assistance Loans - Liquidating Fund 1035 International Disaster Assistance 1023 Food and Nutrition Development Assistance 4340 UE Guarantee Liquidating Fund 1037 Economic Support Fund 1024 Population and Planning & Health Dev. Asst. 4341 MSED Direct Loan Liquidating Fund 1093 Assistance for the N.I.S. Of The Former Soviet Union 1025 Education and Human Resources, Dev. Asst. 5318 Israel Admin Expense Fund 1095 Child Survival and Disease Programs Funds 1027 Transition Initiatives Revolving Funds
CREDIT-FINANCING FUNDS
1028 Global Fund to Fight HIV / AIDS 4175 Property Management Fund 1038 Central American Reconciliation Assistance 4513 Working Capital Fund 1040 Sub-Saharan Africa Disaster Assistance 4590 Acquisition of Property, Revolving Fund
4119 Israel Guarantee Financing Fund 1096 Latin American/Caribbean Disaster Recovery 4137 Direct Loan Financing Fund 1500 Demobilization and Transition Fund 4266 DCA Financing Fund Trust Funds
ALLOCATIONS TO OTHER AGENCIES
1000 Operating Expenses of USAID 4342 MSED Direct Loan Financing Fund 8342 Foreign Natl. Employees Separation Liability Fund 1010 Special Assistance Initiatives 4343 MSED Guarantee Financing Fund 8502 Tech. Assist. - U.S. Dollars Advance from Foreign 1014 Africa Development Assistance 4344 UE Financing Fund 8824 Gifts and Donations 1021 Development Assistance 4345 Ukraine Financing Fund
1027 Transition Initiatives 1032 Peacekeeping Operations 1035 International Disaster Assistance 1037 Economic Support Fund 1093 Assistance for the N.I.S. Of The Former Soviet Union 1095 Child Survival and Disease Programs Funds 1096 International Organizations + Programs 1500 Demobilization and Transition Fund
Page 39 of 45

Appendix V
U.S.Agency for International DevelopmentCONSOLIDATING BALANCE SHEET
As of September 30, 2005(Dollars in Thousands)
Credit Program Funds
Program Funds
Operating Funds
Revolving Funds
Trust Funds
Other Funds
Intra-Agency
Elimination Total
ASSETS
Intragovernmental
Fund Balance with Treasury $ 1,922,622 $ 15,106,292 $ 462,203 $ 1,827 $ 36,697 $ (25,798) $ – $ 17,503,843
Accounts Receivable 330,546 – 820,137 – – – (327,437) 823,246
Other Assets – 29,138 1,437 – – – – 30,575
Total Intragovernmental 2,253,168 15,135,430 1,283,777 1,827 36,697 (25,798) (327,437) 18,357,664
Cash and Other Monetary Assets 50 – 282,952 – – – 283,002
Accounts Receivable, Net 53,226 19,358 1,107 1 – 5,925 – 79,617
Loans Receivable, Net 5,100,249 – – – – – – 5,100,249
Inventory and Related Property – 30,804 13,318 – – – – 44,122
General Property, Plant, and Equipment, Net – 461 95,711 – – – – 96,172
Advances and Prepayments 148 721,996 26,591 1,013 245 – – 749,993
Total Assets 7,406,841 15,908,049 1,703,456 2,841 36,942 (19,873) (327,437) 24,710,819
LIABILITIES
Intragovernmental
Accounts Payable 327,267 24,722 (320) – – – (327,437) 24,232
Debt 422,602 – – – – – – 422,602
Due to U.S.Treasury 5,311,661 – – – – – – 5,311,661
Other Liabilities 15,941 (26) 8,670 – – 5,925 – 30,510
Total Intragovernmental 6,077,471 24,696 8,350 – – 5,925 (327,437) 5,789,005
Accounts Payable 42,501 2,518,148 655,833 1,060 6,920 (43,870) – 3,180,592
Loan Guarantee Liability 1,562,485 – – – – – – 1,562,485
Federal Employees and Veteran's Benefits – – 23,726 – – – – 23,726
Other Liabilities 12,485 111 328,397 – 31,270 18,072 – 390,335
Total Liabilities 7,694,942 2,542,955 1,016,306 1,060 38,190 (19,873) (327,437) 10,946,143
Commitments and Contingencies – – – – – – – –
NET POSITION
Unexpended Appropriations 47,170 13,026,593 (69,737) 148 – – – 13,004,174
Cumulative Results of Operations (335,271) 338,501 756,887 1,633 (1,248) – – 760,502
Total Net Position (288,101) 13,365,094 687,150 1,781 (1,248) – – 13,764,676
Total Liabilities and Net Position $ 7,406,841 $ 15,908,049 $ 1,703,456 $ 2,841 $ 36,942 $ (19,873) $(327,437) $ 24,710,819
Page 40 of 45

Appendix V
U.S.Agency for International DevelopmentCONSOLIDATING STATEMENT OF NET COST
For the Year Ended September 30, 2005(Dollars in Thousands)
Credit Program Program Operating Revolving Trust Other Intra-Agency Total Goal Funds Funds Funds Funds Funds Funds Elimination Amount
Regional Stability
Intragovernmental Costs $ - $ 16,862 $ 12,328 $ 11 $ - $ - $ (107) $ 29,095
Public Costs - 722,208 32,562 288 438 - - 755,496
Total Costs - 739,070 44,890 300 438 - (107) 784,590
Intragovernmental Earned Revenue - - (230) (284) - - 7 (507)
Public Earned Revenue - (2) (98) (17) - - - (117)
Less Total Earned Revenues - (2) (328) (301) - - 7 (624)
Net Program Costs - 739,068 44,562 (1) 438 - (100) 783,966
Counterterrorism
Intragovernmental Costs - 486 8,170 8 - - (32) 8,631
Public Costs - 857,176 21,577 191 290 - - 879,234
Total Costs - 857,662 29,747 198 290 - (32) 887,866
Intragovernmental Earned Revenue - - (153) (188) - - 5 (336)
Public Earned Revenue - (1) (65) (12) - - - (78)
Less Total Earned Revenues - (1) (217) (200) - - 5 (413)
Net Program Costs - 857,661 29,530 (1) 290 - (27) 887,452
International Crime and Drugs
Intragovernmental Costs - 31,801 7,615 7 - - (144) 39,280
Public Costs - 157,855 20,114 178 270 - - 178,417
Total Costs - 189,657 27,729 185 270 - (144) 217,697
Intragovernmental Earned Revenue - - (142) (175) - - 4 (313)
Public Earned Revenue - (1) (60) (11) - - - (72)
Less Total Earned Revenues - (1) (203) (186) - - 4 (385)
Net Program Costs - 189,655 27,526 (1) 270 - (140) 217,311
Democracy and Human Rights
Intragovernmental Costs - 6,082 52,511 48 - - (215) 58,426
Public Costs - 996,763 138,692 1,228 1,864 - - 1,138,546
Total Costs - 1,002,845 191,203 1,276 1,864 - (215) 1,196,972
Intragovernmental Earned Revenue - (2,391) (981) (1,209) - - 64 (4,516)
Public Earned Revenue - (8) (417) (75) - - - (499)
Less Total Earned Revenues - (2,399) (1,397) (1,283) - - 64 (5,015)
Net Program Costs - 1,000,446 189,806 (7) 1,864 - (151) 1,191,958
Economic Prosperity and Security
Intragovernmental Costs 6,141 42,170 78,347 72 - - (524) 126,206
Public Costs 10,006 2,491,253 1,310,265 1,825 2,771 - - 3,816,120
Total Costs 16,147 2,533,423 1,388,612 1,897 2,771 - (524) 3,942,326
Intragovernmental Earned Revenue - (1,309) (1,458) (1,797) - - 64 (4,500)
Public Earned Revenue (2,244) (48) (619) (111) - - - (3,022)
Less Total Earned Revenues (2,244) (1,357) (2,077) (1,908) - - 64 (7,522)
Net Program Costs 13,903 2,532,066 1,386,535 (11) 2,771 - (460) 3,934,804
(continued on next page)
Page 41 of 45

Appendix V
U.S.Agency for International DevelopmentCONSOLIDATING STATEMENT OF NET COST (continued)
For the Year Ended September 30, 2005(Dollars in Thousands)
Credit Program Program Operating Revolving Trust Other Intra-Agency Total Goal Funds Funds Funds Funds Funds Funds Elimination Amount
Social and Environmental Issues
Intragovernmental Costs 23,243 83,615 82,779 76 - - (609) 189,105
Public Costs 35,318 3,849,436 218,634 1,935 2,938 - - 4,108,261
Total Costs 58,562 3,933,051 301,413 2,011 2,938 - (609) 4,297,366
Intragovernmental Earned Revenue (11,333) (43,092) (1,546) (1,905) - - 811 (57,065)
Public Earned Revenue (8,536) (151) (657) (118) - - - (9,460)
Less Total Earned Revenues (19,868) (43,243) (2,202) (2,023) - - 811 (66,525)
Net Program Costs 38,693 3,889,808 299,211 (12) 2,938 - 202 4,230,840
Humanitarian Response
Intragovernmental Costs - 41,764 18,111 17 - - (219) 59,672
Public Costs 461,354 618,528 47,834 423 643 - - 1,128,782
Total Costs 461,354 660,292 65,945 440 643 - (219) 1,188,454
Intragovernmental Earned Revenue (64,489) - (338) (417) - - 914 (64,329)
Public Earned Revenue (127,250) (2,061) (144) (26) - - - (129,480)
Less Total Earned Revenues (191,739) (2,061) (482) (443) - - 914 (193,809)
Net Program Costs 269,615 658,231 65,463 (3) 643 - 695 994,645
Management and Organizational Excellence
Intragovernmental Costs - 4,992 737 1 - - (21) 5,709
Public Costs - 6,989 1,945 17 26 - - 8,978
Total Costs - 11,981 2,682 18 26 - (21) 14,686
Intragovernmental Earned Revenue - - (14) (17) - - - (30)
Public Earned Revenue - - (6) (1) - - - (7)
Less Total Earned Revenues - - (20) (18) - - - (37)
Net Program Costs - 11,981 2,662 - 26 - (21) 14,649
Public Diplomacy and Public Affairs
Intragovernmental Costs - - - - - - - -
Public Costs - - - - - - - -
Total Costs - - - - - - - -
Intragovernmental Earned Revenue - - - - - - - -
Public Earned Revenue - - - - - - - -
Less Total Earned Revenues - - - - - - - -
Net Program Costs - - - - - - - -
Net Costs of Operations $ 322,212 $ 9,878,917 $2,045,294 $ (37) $ 9,240 $ - $ - $12,255,626
Page 42 of 45

Appendix V
U.S.Agency for International DevelopmentCONSOLIDATING STATEMENT OF CHANGES IN NET POSITION
For the Year Ended September 30, 2005(Dollars in Thousands)
Credit Program Funds
Program Funds
Operating Funds
Revolving Funds
Trust Funds
Other Funds Total
Beginning Balances $ 17,697 $ 13,243,619 $ 792,829 $ 1,744 $ (9) $ – $ 14,055,880
Prior period adjustments (36) (258,765) (124,344) – – – (383,145)
Beginning Balances, as adjusted 17,661 12,984,854 668,485 1,744 (9) – 13,672,735
Budgetary Financing Sources:
Appropriations Received 11,927 9,255,194 781,400 – – – 10,048,521
Appropriations transferred–in/out 6,460 2,059,256 4,535 – – – 2,070,251
Other adjustments (recissions, etc) (125) (1,055,293) (5,977) – – – (1,061,395)
Appropriations used – – – – – – –
Nonexchange revenue – – – – – – –
Donations and forfeitures of cash 11 – 101,770 – 8,001 – 109,782 and cash equivalents
Transfers–in/out without reimbursement – – 1,165,437 – – – 1,165,437
Other budgetary financing sources – – – – – – –
Other Financing Sources:
Donations and forfeitures of property – – – – – – –
Transfers–in/out without reimbursement (1,823) – – – – – (1,823)
Imputed financing from costs absorbed by others – – 16,794 – – – 16,794
Total Financing Sources 16,450 10,259,157 2,063,959 – 8,001 – 12,347,567
Net Cost of Operations 322,212 9,878,917 2,045,294 (37) 9,240 – 12,255,626
Net Change (305,762) 380,240 18,665 37 (1,239) – 91,941
Ending Balances $ (288,101) $ 13,365,094 $ 687,150 $ 1,781 $ (1,248) $ – $ 13,764,676
Page 43 of 45

Appendix V
U.S.Agency for International DevelopmentCONSOLIDATING STATEMENT OF BUDGETARY RESOURCES
For the Year Ended September 30, 2005(Dollars in Thousands)
Credit Program Funds
Program Funds
Operating Funds
Revolving Funds
Trust Funds
Other Funds
Credit-Financing Allocations Total
Budgetary Resources:
Budget Authority
Appropriations Received $ 61,927 $ 9,255,194 $ 781,400 $ – $10,529 $ – $ – $ 7,535 $10,116,585
Borrowing Authority – – – – – – 310,947 2,000 312,947
Net Transfers 5,804 338,880 4,535 – – – – 241,300 590,519
Other – – – – – – – – –
Total Budget Authority 67,731 9,594,074 785,935 – 10,529 – 310,947 250,835 11,020,051
Unobligated Balances
Beginning of Period 178,492 1,748,169 82,984 2,484 2,026 – 1,001,713 423,168 3,439,036
Net Transfers, Actual 656 – – – – – – (864,907) (864,251)
Total Unobligated Balance 179,148 1,748,169 82,984 2,484 2,026 – 1,001,713 (441,739) 2,574,785
Spending Authority from Offsetting Collections
Earned
Collected 1,379,341 49,064 6,926 6,362 – – 421,647 1,501 1,864,841
Receivable from Federal Sources – – – – – – – 351 351
Change in Unfilled Customer Orders
Advance Received – – – – – – – – –
Anticipated for Rest of Year, Without Advances – 1,158 2,064 (201) – – – - 3,021
Subtotal 1,379,341 50,222 8,990 6,161 – – 421,647 1,852 1,868,213
Recoveries of Prior-Year Obligations 1,675 112,894 15,856 41 (390) – – 1,008,420 1,138,496
Permanently Not Available (716,644) (1,056,435) (6,180) – – – – – (1,779,259)
Total Budgetary Resources 911,251 10,448,924 887,585 8,686 12,165 – 1,734,307 819,368 14,822,286
Status of Budgetary Resources:
Obligations Incurred:
Direct 53,289 8,184,669 808,982 5,945 8,075 – 709,518 695,831 10,466,309
Reimbursible – 50,222 8,990 – – – – – 59,212
Subtotal 53,289 8,234,891 817,972 5,945 8,075 – 709,518 695,831 10,525,521
Unobligated Balances–Available 857,744 2,208,208 68,893 2,741 4,090 – 1,024,789 120,731 4,287,196
Unobligated Balances–Unavailable 218 5,825 720 – – – – 2,806 9,569
Total Status of Budgetary Resources 911,251 10,448,924 887,585 8,686 12,165 – 1,734,307 819,368 14,822,286
Relationship of Obligations to Outlays:
Obligated Balance, Net, Beginning of Period
Obligated Balance,Transferred, Net
Obligated Balance, Net, End of Period
Accounts Receivable
Unfilled Customer Orders From Federal Sources
Undelivered Orders
Accounts Payable
Outlays:
Disbursements
Collections
Subtotal
Less: Offsetting Receipts
Net Outlays
34,791
–
(3,467)
–
32,891
6,882
50,098
(1,379,341)
(1,329,243)
–
$(1,329,243)
9,297,471
–
–
(1,158)
7,835,041
2,141,659
7,442,766
(49,064)
7,393,702
–
$ 7,393,702
195,072
–
(225)
(3,955)
(13,428)
246,261
766,471
(6,926)
759,545
–
$ 759,545 $
(1,450)
–
–
(2,501)
540
1,048
5,569
(6,362)
(793)
–
(793)
31,229
–
–
–
25,700
6,908
7,087
–
7,087
–
$ 7,087
– 11,031
– –
– –
– –
– 2,768
– 520
– 717,260
– (421,647)
– 295,613
(195,568) –
$(195,568) $ 295,613
1,267,439
–
–
–
3,528
–
3,528
–
3,528
–
$ 3,528
10,835,583
–
(3,692)
(7,614)
7,887,040
2,403,278
8,992,779
(1,863,340)
7,129,439
(195,568)
$ 6,933,871
Page 44 of 45

Appendix V
U.S.Agency for International DevelopmentCONSOLIDATING STATEMENT OF FINANCING
For the Year Ended September 30, 2005(Dollars in Thousands)
Credit Program Program Operating Revolving Trust Other Funds Funds Funds Funds Funds Funds Allocations Total
Resources Used to Finance Activities:
Budgetary Resources Obligated
Obligations Incurred $ 762,807 $ 8,234,891 $ 817,972 $ 5,945 $ 8,075 $ – $ 695,831 $ 10,525,521
Appropriations transferred to/from other agencies (net) – 1,965,464 1,247,800 – – – (695,831) 2,517,433
Total Obligations Incurred 762,807 10,200,355 2,065,772 5,945 8,075 – – 13,042,954
Less: Spending authority from offsetting collections and recoveries (1,802,663) (163,116) (24,846) (6,202) 390 – (1,010,272) (3,006,709)
Spending authority transferred to/from other agencies (net) – (233,003) (96,542) – – – 1,010,272 680,727
Total Spending authority from offsetting collections and recoveries (1,802,663) ( 396,119) ( 121,388) ( 6,202) 390 – – (2,325,982)
Less: Offsetting Receipts – – – – – 195,568 – 195,568
Net Obligations (1,039,856) 9,804,236 1,944,384 (257) 8,465 195,568 – 10,912,540
Other Resources
Transfers in without reimbursement (1,823) – – – – – – (1,823)
Imputed Financing From Costs Absorbed by Others – – 16,794 – – – – 16,794
Total resources used to finance activities (1,041,679) 9,804,236 1,961,178 (257) 8,465 195,568 – 10,927,511
Resources Used to Finance Items not Part of the Net Cost of Operations:
Change in budgetary resources obligated for goods, services and benefits ordered but not yet provided 2,617 337,245 129,847 221 (1,511) – – 468,419
Resources that fund expenses recognized in prior periods – (5,382) (348) (1) – – – (5,731)
Credit program collections which increase liabilities for loan guarantees or allowances for subsidy 1,283,309 – – – – – – 1,283,309
Resources that finance the acquisition of assets – (2,252) (45,642) – – – – (47,894)
Other (242,128) (256,255) (24,946) 4 – (195,568) – (718,893)
Total resources used to finance items not part of net cost of operations 1,043,798 73,356 58,911 (224) (1,511) (195,568) – 979,210
Total resources used to finance net cost of operations 2,119 9,877,592 2,020,089 (33) 6,954 – – 11,906,721
Components of the Net Cost of Operations that will not Require or Generate Resources in the Current Period:
Components Requiring or Generating Resources in Future Periods:
Increase in annual leave liability – – 2,236 – 1,239 – – 3,475
Upward/Downward reestimates of credit subsidy expense 320,093 – – – – – – 320,093
Increase in exchange revenue recivable from the public – – – – – – – –
Total components Requiring or Generating Resources 320,093 – 2,236 – 1,239 – – 323,568 in future periods
Components not Requiring or Generating Resources
Depreciation and Amortization – 474 22,280 – – – – 22,754
Revaluation of assets or liabilities – – 810 – – – –
Other – 851 (121) (4) 1,047 – – 1,773
Total Components not Requiring or Generating Resources – 1,325 22,969 (4) 1,047 – – 25,337
Total components of net cost of operations that will not require or generate resources in the current period 320,093 1,325 25,205 (4) 2,286 – – 348,905
Net Cost of Operations $ 322,212 $ 9,878,917 $ 2,045,294 $ (37) $ 9,240 $ – $ – $ 12,255,626
Page 45 of 45
810